Embed Size (px)
Citation preview

Revisiting Broadband Performance
Igor CanadiUniversity of
Paul BarfordUniversity of
Joel SommersColgate University
ABSTRACT
Understanding the empirical characteristics of broadband perfor-mance is of intrinsic importance to users and providers, and hasbeen a significant focus of recent efforts by the Federal Communi-cations Commission (FCC) [9]. A series of recent studies have re-ported results of empirical studies of broadband performance (e.g., [11,15, 22]). In this paper, we reappraise previous empirical findingson broadband performance. Our study is based on a unique cor-pus of crowd-sourced data consisting of over 54 million individualtests collected from 59 metropolitan markets over a 6 month pe-riod by Speedtest.net. Following analytic approaches from priorstudies, our results confirm many of the raw performance results(upload/download/latency) for ISPs in specific US markets. How-ever, the size and scope of our data enable us to examine the detailsof characteristics that were not identified in prior studies, therebyproviding a more comprehensive view of broadband performance.Furthermore, we also report results of broadband performance char-acteristics in 35 metropolitan markets outside of the US. This notonly provides an important baseline for future study in those mar-kets, but also enables relative comparison of broadband perfor-mance between markets world wide.
Categories and Subject Descriptors
C.2.3 [Network Operations]: Network management; C.4 [Performance
of Systems]: Performance attributes; C.4 [Performance of Sys-
tems]: Measurement techniques
General Terms
Experimentation, Measurement, Performance
Keywords
Access networks, Broadband access
1. INTRODUCTIONHigh speed broadband connectivity to the home is the founda-
tion for rich media applications and services. Over the past several
Permission to make digital or hard copies of all or part of this work forpersonal or classroom use is granted without fee provided that copies arenot made or distributed for profit or commercial advantage and that copiesbear this notice and the full citation on the first page. To copy otherwise, torepublish, to post on servers or to redistribute to lists, requires prior specificpermission and/or a fee.IMC’12, November 14–16, 2012, Boston, Massachusetts, USA.Copyright 2012 ACM 978-1-4503-1705-4/12/11 ...$15.00.
years, the impact of streaming media enabled by broadband to thehome has been dramatic. For example, the growing phenomenonof “cord cutting” — doing away with cable television subscriptionsin lieu of streaming — has important implications for service pro-viders, television, advertising and other industries [20].
The increasing reliance by consumers on high speed broadbandconnectivity has made its performance and reliability a matter ofpublic interest. To that end, the US Federal Communications Com-mission (FCC) has initiated efforts to develop a national broadbandstrategy that promotes competition among providers and uses data-driven standards to ensure that service providers do not abuse theirmarket power [8]. The “data driven” mandate led to the FCC’sconsumer broadband test site, which enables users to evaluate theirbroadband performance with several different tools [9].
While broadband performance test sites have been available forsome time (e.g., [3,13]) measuring, characterizing, and understand-ing broadband performance in the large presents several significantchallenges. The first is perspective: with nearly two billion Internetusers world wide, the task of gathering “representative” data andextracting meaningful information even with a metropolitan areafocus is daunting. Second, taking measurements of last mile per-formance necessitates instrumentation at an end host. While manytools (e.g., [7,15]) and systems (e.g., [4]) for end host-based perfor-mance measurement exist, deploying them broadly and then usingthem to conduct systematic study intrinsically relies on user partic-ipation, which is obviously challenging. Third, different test meth-ods and the diversity of infrastructure in the last mile complicatethe interpretation and comparison of measurements. For example,users who run tests from their laptops may be limited by wirelessinterference instead of their broadband connection. We argue thatthe collective perspective offered by multiple tests methods is thebest way to gain an understanding of broadband performance.
In this paper we present results of a study of broadband perfor-mance that seeks to reconfirm results from prior studies and to ex-pand the knowledge base in this critical area. Our study is based ona unique data set provided by speedtest.net [3]. Speedtest is apopular end host-based performance measurement application thatdirects participating users to local servers in over 700 metropolitanmarkets world wide. We evaluate a data corpus of over 54 mil-lion performance tests collected over a 6 month period in 59 metromarkets (24 US, 35 non-US).
While the goals of our work are aligned with prior broadbandperformance studies (e.g., [11, 15, 17, 22]), our approach expandson prior studies in several important ways. Most importantly, weprovide a crowd-sourced perspective on broadband performance.While Speedtest data are limited in several ways (see Section 2),the size, diversity and rich details of these data enable us to re-consider results from prior studies. Moreover, we identify new
273

characteristics of broadband performance that to the best of ourknowledge have not been previously reported. The scope of theSpeedtest data also enables us to examine broadband performancefrom a world-wide perspective. Prior studies have typically focusedon broadband performance in the US or Europe. We report resultsthat compare and contrast broadband performance for major geo-graphic areas all over the world.
The first component of our analysis considers broadband perfor-mance in 25 metropolitan areas in the United States. The metroareas represent a broad cross section of the population in termsof market size and geographic location. Our analyses focus ondownload, upload and latency measurements and consider recentresults reported by Sundaresan et al. [22] as a point of comparison.We begin by reporting results of a small case study that comparesSpeedtest measurements to SamKnows measurements [4], whichwere the basis for many of the results in [22]. Next, we considerthe question of whether or not users experience consistent perfor-mance from their providers, in many cases our findings supportobservations of prior work (e.g., in terms of lower latencies for ca-ble vs. DSL), but in others they are not (e.g., in terms of providerquality ranking). We make no argument that in cases where ourfindings differ, that ours are “more valid”. Rather, we believe thatour findings show that performance comparisons are complex anddynamic, and benefit from on-going study.
The second component of our analysis takes advantage of thecrowd-sourced nature of our data to dig into the details of localconnectivity. We focus on two characteristics that emerge in ourdata that were not evident or highlighted in prior studies. The firstcharacteristic is a tight clustering of measurements that show lowerperformance. While we can not absolutely validate the causes, thiscould be explained by older service plans that have not been up-graded, older equipment, or rate limiting. The second character-istic considers the question of latency versus distance from a testserver. While this may seem obvious, prior studies identify buffersas a potential dominant factor in latency [17]. Our geographic anal-ysis confirms that there is a strong correlation between latency anddistance.
The final component of our analysis considers broadband per-formance in 35 metropolitan areas outside of the US. Our analysismethodology is consistent with studies of US and European broad-band performance. Perhaps as expected, we find that broadbandperformance in Hong Kong is superior to the US on average. Wefind that performance in Europe is on par with the US on average.We find that performance in South American and African sites isbelow the US, while performance is relatively lower in India andIndonesia. These results highlight the relative penetration of highspeed broadband world wide and have implications for economicdevelopment and competitiveness.
The remainder of this paper is organized as follows. In Section 2,we describe the details of the Speedtest measurement methodology,our data set and its limitations. In Section 3, we describe the detailsof the evaluations that we conduct on our data. The results of ouranalyses are reported in Section 4. We discuss prior studies thatinform our work in Section 5. We summarize, conclude and discussfuture work in Section 6.
2. DATAIn this section we describe the Speedtest data set used in our
study. We provide an overview of the measurement algorithm usedby Speedtest, the deployment of Speedtest servers around the world,and the specific types of data that are collected in their infras-tructure. We list the 59 metro areas in which the data were col-lected. We also discuss limitations with the Speedtest data and how
Figure 1: The Speedtest performance measurement protocol,
which is activated when clients start a test.
they may affect our comparisons with prior broadband performancestudies.
2.1 Speedtest MeasurementsSpeedtest.net [3] is an openly available, Flash-based band-
width/performance measurement application that is managed andmaintained by Ookla, Inc. [2]. Over 3 billion performance testshave been run since 2006 when Speedtest came on line, and thereare hundreds of thousands of tests performed per day, globally.
The testing protocol that is initiated by clients running the web-based Speedtest application is shown in Figure 1. When a client ini-tiates a test, a request is automatically sent to the Speedtest serverthat is identified as being geographically nearest to the client. Al-ternatively, clients can specify a server for performing a test. Thereare Speedtest servers deployed in over 700 locations world wide.
The Speedtest wiki [1] explains the details of each test. Measure-ments of latency, download, and upload performance are conductedvia HTTP (TCP port 80). Latency tests use a minimum of 10 RTTping-style measurements and report the mean result. The first stepin a download test is the transfer of a fixed-size file from server toclient. This transfer is used to determine the size of a target file thatwill be used in the actual performance tests. The target file is fixedat a smaller size when the initial transfer indicates a lower band-width path. Larger size target files are used when the initial trans-fer indicates higher bandwidth. The second step in a test consistsof repeated transfers of the target file using up to 8 parallel HTTPconnections. Care is taken to avoid client caching. Throughputis sampled at up to 30 times per second; the top 10% and bottom30% are discarded and the mean of the remaining samples is usedas the overall throughput estimate. This approach is motivated byan attempt to obviate burst effects due to OS overhead and otherhost-system effects, and produce a maximum throughput estimatethat corresponds to the expected case for the user. Test runs aredesigned to be relatively short in order to enhance user experience.The use of HTTP (and by extension, TCP) in the Speedtest protocolis prompted by a desire to gather performance measures similar towhat many applications would experience.
Upload tests come after download tests. They are designed tofollow a protocol that is similar to the download tests.
Each test results in a log entry stored at the local Ookla serverthat includes a unique test identifier, timestamp, upload and down-load throughput estimates (in Kb/s), latency estimate (in millisec-onds), anonymized client IP address, browser user agent string,
274

client geographic coordinates (longitude / latitude), server nameand coordinates, geographic distance between client and server, andISP name. While Speedtest can be run from either wireline or mo-bile clients, log entries are easily distinguished by device type andaccess type.
2.2 Data Sets ConsideredThe data we use in this study were collected from Speedtest
servers located in 59 metro areas over a period of six months fromJune 1, 2011 through November 30, 2011. The goal in selectingmetro areas was to provide a broad perspective on broadband per-formance. The criteria that were used for selection included geo-graphic location of servers, metro market sizes and socio-economicinformation. The result were 24 metro areas in the US and 35 out-side of the US.
For US, we selected 24 geographically diverse metro areas thatcan be grouped by population size: small (e.g., Lawrence, KS;Sumter, SC; Grand Forks, ND), medium (e.g., Portland, ME; GrandRapids, MI; San Francisco, CA) and large (e.g., New York, NY; LosAngeles, CA; Chicago, IL).
For areas outside of the US, we selected ten metro areas in Eu-rope, and five in Asia, Pacific, Middle East, South America andAfrica respectively for a total of 35. Similar to the US, these se-lections were based on a geographic diversity and market size withan attempt to select areas for each category that had roughly thesame population. In order to gain a measure of consistency in ourevaluations, we only include tests (directed to that server) that areconducted within a 200 miles radius. The full set of metro areas,along with summary statistics of the associated Speedtest resultscan be found in Table 2.
Our data indicates that roughly 300,000 users per day initiatedtests to the 59 servers considered in this study. As noted above, wealso have the browser user agent string. Figure 2 shows a break-down of client operating system and browser types in our data.Further, each test entry includes the client’s geographic coordi-nates. These coordinates are determined from GPS, if available,or by using the MaxMind GeoIP geolocation database [19], whichis generally accurate at the city level. Locations of test clients inour data set are shown in Figure 3 (we only show test locations thatare within a 200 mile radius of the Speedtest servers included inour study).
Figure 2: Profile of Speedtest users’s Web browsers and Oper-
ating systems
2.3 DiscussionWe believe that the data provided by Speedtest offer a unique
and valuable perspective that enhances the general understandingof broadband performance. The broad use of Speedtest around theworld enables detailed profiles of broadband performance to be es-tablished for diverse markets. The fact that Speedtest has beenusing substantially the same measurement methodology for yearsenables longitudinal study of broadband performance and compar-
Figure 3: Locations of measurements
isons across markets. The web-based delivery of tests precludesthe need for deployment and management of dedicated systems orsoftware at client sites and encourages broad use of the tool.
While the crowd-sourced nature of the data set is compelling,there are limitations that are important to recognize since they couldhave an influence on the findings in our study. Speedtest data are as-sembled based on diverse users running the test application. Whilesome information about client hosts is available (e.g., host operat-ing system via the browser user agent string), this information can-not be verified. Furthermore, host systems are likely to vary widelyin terms of hardware and software configurations. There also is noway to dictate when or how tests are run. Indeed, Speedtest maywell be invoked when users believe their network performance ispoor or otherwise problematic. This may bias results of perfor-mance tests toward below average operating conditions. We haveno way of establishing baselines for performance or assessing test-ing bias in each metro area that we consider other than appealingto statistical characterizations and the relatively large numbers oftests conducted over the six month period from which our data iscollected. Nevertheless, many of our conclusions described beloware consistent with prior work, suggesting that any biases are fairlylimited in nature or that prior work suffered from similar or thesame biases.
An additional limitation that is specific to our objective of repro-ducing prior results is the fact that we cannot identify specific usersin the Speedtest data. While this does not preclude all analyses,it does mean that can cannot evaluate the performance observedby specific users, which was the focus of certain aspects of priorbroadband studies.
3. EVALUATION METHODOLOGYAnalyzing and drawing conclusions from a large, multidimen-
sional data set presents a number of challenges. Toward the goal ofreconfirming prior results, many of our evaluation techniques aretaken directly from past studies which enables us to draw meaning-ful comparisons.
To assess the high level characteristics of throughput and la-tency, we provide summary statistics (average and standard devi-ation) for each metro area. We also use simple summary statisticsfor country-level aggregates and present the results using bubbleplots, similar to prior work [15]. The location of each bubble is theaverage throughput performance and the area of bubbles is propor-tional to the number of measurements. When comparing differentUS operators, we also use bubble plots to present their average per-formance and popularity amongst users.
We consider characteristics of specific service providers usingscatter plots of download and upload speed for each measurement.
275

Similar graphical analyses have been used in prior work, such as [22].When plotting, we make every point a semi-transparent circle, whichmakes it easy to assess the areas of high and low density: high den-sity areas appear darker, while low density areas appear lighter. Wecan also more easily distinguish different data points. Due to thelarge number of measurements for every ISP, in some cases we hadto randomly sample the data used in the plots to create manage-able figures. Every plot contains roughly 30,000 points that were(uniform) randomly selected from the full dataset. Finally, whilescatter plots are a natural way to capture data from a single source,it is difficult to compare two scatter plots. Thus, to compare op-erators and show correlation between parameters, we use varioustypes of line plots and bar charts.
The Speedtest measurement method estimates upload/downloadperformance from a user to the closest server. If a user is geograph-ically distant from the server, the measurement may reflect widearea effects such as congestion. For this reason, we only considermeasurements within a radius of 200 miles of a given server. La-tency measurements are potentially the most sensitive to distance(although we recognize that geographic distance may not correlateperfectly with network latency). In our latency analyses, unlessotherwise noted, we discard measurements that are more than 50miles away from the server.
Finally, we note that our data analysis was facilitated throughdevelopment of a MySQL database on which we ran queries usinga series of Python scripts. Statistical analysis and plotting weredone using R.
4. BROADBAND PERFORMANCE RESULTSIn this section we report the results of our analysis. Our pri-
mary comparisons are with the dataset and findings of the recentstudy of Sundaresan et al. [22], but we also compare our resultsand data to the prior work of Kreibich et al. [15]. We expand onthese prior works by examining new geographic regions, and dis-cuss other findings specific to our dataset.
4.1 Alternative Broadband Testing ProtocolsThe study by Kreibich et al. uses data from their Netalyzr sys-
tem [15], and the recent study by Sundaresan et al. [22] reportedfindings from empirical broadband performance data based on Sam-
Knows deployments and from their own BISMark system. Below,we discuss these measurement methods and specifically comparethe SamKnows testing method with Speedtest.
4.1.1 SamKnows
SamKnows operates a FCC-sponsored broadband access networkstudy, and has developed a test methodology focused on measuringdifferent aspects of a broadband Internet connection from the gate-way’s point of view [4]. The tests are executed from a device calleda “whitebox”, which is a device situated between the access net-work modem and home router. These devices are deployed in thehomes of volunteers, and they contain software that attempts to runa connection test every two hours. The whitebox has the ability tomonitor both wired and WiFi network traffic and does not performtests when it senses any user activity, in order to obtain an accuratemeasure of access network capabilities.
To measure download and upload speeds, whiteboxes open threeconcurrent connections with a SamKnows server. First, a warm-upsequence is initiated in which each connection repeatedly down-loads small chunks of the target payload. The warm-up period isused to avoid effects of TCP slow start, and network congestion.When three consecutive chunks are downloaded at the same speed,the real testing begins. The test is run for a fixed period of time,
or a fixed-size payload. After the test ends, each connection re-ports reports the throughput it obtained, and the speeds from eachconnection are summed.
4.1.2 Comparison with SamKnows
Although there are some differences between SamKnows andSpeedtest methodologies in the number of parallel connections, andmethods of aggregating the raw results, we believe that the biggestdifference in reported values is due to where and when the test is ex-ecuted. SamKnows deploys their whiteboxes between a router anda modem, and the monitoring capabilities designed into the deviceshelp to avoid cross-traffic effects from home networks. Speedtest,on the other hand, can be run from clients connected to home net-works over wireless connections. It can also be run when there isactivity on the line created by other clients.
Figure 4: Setup of the network we used to compare Speedtest
and Samknows test methodology.
To better understand and evaluate the mentioned differences, weran both Speedtest and Samknows tests from a network connectedto Charter’s cable Internet service in Madison, WI. The operator’spromised speed was 15 Mb/s download and 3 Mb/s upload withPowerboost [6]. Figure 4 shows the network setup that was used.End hosts were connected to a router through both wired and wire-less connections. The router was connected to a SamKnows white-box, which was in turn connected to the cable modem. We rana total of 12 tests over the course of two weeks, six in the daytime (9am – 4pm) and six in the night time (8pm – 2am). Everytest consisted of three runs of each of the following: (1) executingSamknows download and upload test binaries on the whitebox; (2)running a Speedtest from a Macbook Pro connected to the routerover 100 Mb/s wired Ethernet; and (3) running a Speedtest from aMacbook Air connected to the router over wireless 802.11g Ether-net.
Figures 5 and 6 show averages of the three runs for each mea-surement. SamKnows almost always reported higher downloadspeeds than Speedtest over the wired network. However, the differ-ence between the two was very small. Executing Speedtest exper-iments over the wireless network, on the other hand, shows muchslower download performance in all tests except one. The wire-less network we were testing on supports download speeds up to54 Mb/s, so it should not be a bottleneck. The one test where weachieved the full potential of the Internet connection is intriguing;the cause for this surprisingly good performance is presently un-clear. SamKnows tests also show higher upload speeds and moreconsistent results than Speedtest in almost every case. A clear lim-itation with our Speedtest data is that we have no way of separatingthe measurements conducted over a wireless network from the onesover a wired network.
To examine the behavior of the Speedtest application in the pres-ence of cross traffic in the home network, we started a downloadof a large file over the wireless network and simultaneously ranSpeedtest from another machine over the wired network. After
276

executing the Speedtest measurement, we executed a SamKnowsperformance test from the whitebox. Note that while the whiteboxusually does not start a test if the line is not idle, it is possible todisable that check, which we did for this experiment. Our resultsshow that a single large file download affects Speedtest, which re-ports an average of 11 Mb/s, while the SamKnows whitebox reportsthe correct speed of 15 Mb/s. When we started multiple large filedownloads and ran the Speedtest application and whitebox mea-surement, the results were poor for both Speedtest and SamKnows.The whitebox reported approximately 7.5 Mb/s, and the Speedtestapplication gave an even lower estimate.
Figures 7 and 8 show the standard deviation of the three runs,presenting the consistency of the results over short time spans. Thestandard deviation of SamKnows was the lowest for both uploadand download throughput tests. In the data point where Speedtestover the wireless network matched the performance of the wirednetwork, the standard deviation of the wireless tests was low andexhibited similar variability as the wired Speedtest and SamKnowsmeasurements. In these experiments, we did not find any signifi-cant differences between tests performed during the night and dur-ing the day.
4.1.3 Netalyzr
Netalyzr is a Java-based tool that executes various types of prob-ing in order to diagnose access network behavior and performance.Of relevance to our study is the fact that it uses UDP probes to es-timate both latency and throughput. It uses a train of small UDPprobes sent 100 millisecond intervals to measure latency, then em-ploys a slow-start-like algorithm to detect maximum upload anddownload throughput. Due to a limitation of the Java environment,there are limits to the maximum throughput detected by Netalyzr(about 20 Mb/s). The client-side tool connects to a back-end serverrunning on Amazon EC2.
A notable similarity between the Speedtest method and Netalyzris that the measurements are initiated from a computer behind theaccess network gateway/router. This computer may be connected tothe local network via WiFi or wired Ethernet, and test traffic is sub-ject to interference with other traffic on the local network. Whilethese end-host based measurements are subject to errors induced byinterference (e.g., cross-traffic interference, WiFi contention, etc.),it is arguable that these types of endhost-based measurements givea more accurate perspective of performance that users experience.Moreover, end-host based measurements are significantly easier tocollect since no special measurement hardware is required. As aresult, platforms like Netalyzr and Speedtest add a rich and com-plementary perspective on broadband performance.
4.2 Revisiting previous findings from US mar-kets
One of the goals of our work is to reassess empirical findingsfrom previous studies [11, 15, 22] in light of the dataset obtainedfrom Speedtest.
Sundaresan et al. [22] analyzed SamKnows data from 8 of thebiggest ISPs in the US market: Comcast, AT&T (SBC Internet Ser-vices), TimeWarner (Road Runner), Verizon, Cox, Qwest, Char-ter and Cablevision (Optimum Online). The advantages of theirdata were two fold. First, they have speed measurements from oneuser taken periodically every hour over the course of few months.Due to privacy reasons, we were not able to connect measurementswith specific clients. This limitation prevented us from repeatingsome of their findings. Second, their tests were conducted from thegateway, thus avoiding bottlenecks and losses in home network. Astudy by Bauer et al. found that the SamKnows method was the
most accurate broadband testing method [5], but we note that theyfound that the Speedtest method also gives a reasonably accuratecharacterization of access network performance. Furthermore, theSpeedtest measurements capture real user experience, and measurethe throughput speeds that users actually obtain, as opposed to whatthey might obtain in perfect conditions.
Figure 9 shows average speeds obtained by users of differentISPs. The center of each circle represents the average downloadand upload performance obtained by users of a specific ISP. Thearea of the circle is proportional to the number of measurementsthat were performed by users of a given ISP on Speedtest’s website.
One of the questions addressed in the prior work of Sundaresanet al. was whether users achieve consistent performance. Theirconclusion was that most of the ISPs provide consistent speeds, ex-cept for some ISP-based exceptions (Cablevision, and to a lesserextent, Cox), whose large fraction of users have inconsistent down-load speeds. We cannot directly compare our results with this priorwork due to the inability to identify particular clients or users inour data. Instead, we indirectly evaluate consistent via scatterplotanalysis in Figures 10 and 11. Figure 10 shows results for Cable-vision, and Figure 11 shows results for Charter; we note that bothof these ISPs are cable providers. Every point in the graph is onemeasurement from a user in the United States. In our measure-ments, we found that Cablevision exhibited the best upload speedconsistencies (as defined by variability in the measurements), andwe see that patterns in the download vs. upload scatter plots arevery similar. These results suggest that users may indeed obtainconsistent performance from these ISPs, although we cannot di-rectly verify that. In terms of download speeds, both ISPs exhibithigh variability: in both plots, download speeds are spread acrossthe large interval, while upload speeds are largely localized in smallintervals. Our results at least confirm the notion that upload speedsare more consistent than download speeds.
To compare cable operators with DSL operators, in Figures 12and 13 we show the results of measurements for AT&T and Qwestoperators, respectively. In general it seems that DSL operatorsshow better clustering of points around their service plans. Theyalso show higher variability in upload rates than cable operators.
In addition to download and upload throughput, our data alsocontain latency measurements between the user and Speedtest’sserver. Sundaresan et al. measure and make conclusions basedon last-mile latencies, which is the latency from the gateway to thefirst hop in network. One of their results is that cable operatorsgenerally exhibit lower latencies than DSL operators. Althoughour dataset includes end-to-end latency measurements, we observethe same result. Figure 14 shows the latency distribution for cableand DSL operators. 60% of all the measurements for the cable op-erators are lower than 20 ms. The only exception is Cox, whosemajority of users are in the 20–29 ms range. DSL users see higherlatencies and more variance. Almost half of the measurements onQwest reported latencies larger than 60 ms. Verizon’s users withlatency below 20 ms are their FiOS users.
Figure 15 shows average download throughputs for measure-ments with specific latencies. It is clear that the average downloaddrops as latency increases. One explanation for this effect couldbe that measurements with bigger latencies were conducted underhigher load. This explanation may correspond to findings of thestudy by Sundaresan et al., which attribute the effect to large mo-dem buffers. Another possible explanation is the well-known biasof TCP against longer round-trip times, which may result in lowerthroughputs achieved.
Sundaresan et al. also looked into how time of day affects user’sperformance. They observed the biggest difference between peak
277

Figure 5: Download throughput as reported by Speedtest
on wired and wireless network and SamKnows.
Figure 6: Upload throughput as reported by Speedtest on
wired and wireless network and Samknows.
Figure 7: Standard deviation of download throughput of
three consecutive runs of Speedtest on wired and wireless
network and Samknows
Figure 8: Standard deviation of upload throughput of three
consecutive runs of Speedtest on wired and wireless net-
work and Samknows
278

Figure 9: Average download/upload bandwidths for most frequent ISPs from US markets. Circle areas are proportional to number
of measurements from that ISP.
Figure 10: Scatter plot of download vs. upload throughput
for Cablevision.
Figure 11: Scatter plot of download vs. upload throughput
for Charter.
and worst performance of 40%. They also showed that some op-erators have consistent performance throughout, while the othersexhibit degraded service during peak hours. To confirm their find-ing, we had to be careful due to potential time biases in our data.For example, during working hours most Speedtest experiments arelikely conducted from businesses and universities, while during theevenings and nights, users run the experiments from their home net-works. To overcome this limitation, we consider only experimentsconducted on a Sunday. We limited our analysis to the Los Angeles
metro area and we consider two operators, Cox and Time Warner.In prior work, Cox exhibited significant degradation during peakhours, while Time Warner showed consistent performance. Fig-ure 16 shows the average download speed during specific hoursof the day for Cox and Time Warner in the Los Angeles metroarea. Our dataset confirms both findings by Sundaresan et al.. First,download speeds depend on time of day. Second, some operatorshave significant differences between peak and worst performance.Cox’s peak average performance is two times better than the av-
279

Figure 12: Scatter plot of download vs. upload throughput
for AT&T.
Figure 13: Scatter plot of download vs. upload throughput
for Qwest.
Figure 14: Latency distribution for operators from US markets.
erage download speed during busy times. Time Warner showed aslowdown of only 26%.
4.3 New FindingsIn addition to analyzing prior results in light of our Speedtest
data, we observed features not previously reported. Here we reporton two of those: persistent low performance tests, and the impactof distance from the measurement server and network latency. Be-cause of its wider perspective, these characteristics are more easilymeasured and observed with a dataset such as Speedtest, as com-pared with purpose-built and more narrowly deployed system likeSamKnows.
4.3.1 Persistent low performance tests
During our analysis of download/upload scatter plots, we ob-served a number of high density dots in low performance areas,suggesting persistent low performance. For example, in Figure 11,
we observed many measurements with a download speed a 1 Mb/sand upload speed of 120 kb/s. Comcast, Cox and Verizon also hadsimilar artifacts with low performance, each with somewhat differ-ent specific upload / download measurements. We hypothesize thatthese artifacts represent “cheap and slow” service plan offerings.While operators may no longer offer these low performance plans,it is clear that some of the customers have not yet switched to newservice plans. Because the rates are much slower, the tests eas-ily saturate the rate limits, yielding little variability in the resultingmeasurements.
However, we also observed more interesting high density points,which we could not explain by cheap service offerings. Speedtest’sservers in Australia (Sydney, Melbourne, Perth) reported many mea-surements of 1.3 Mb/s download speed and 210 kb/s upload speedfor all of Australia’s biggest Internet operators (iiNet, Internode,Optus, Telstra, TPG). As an example, Figure 17 shows the scat-
280
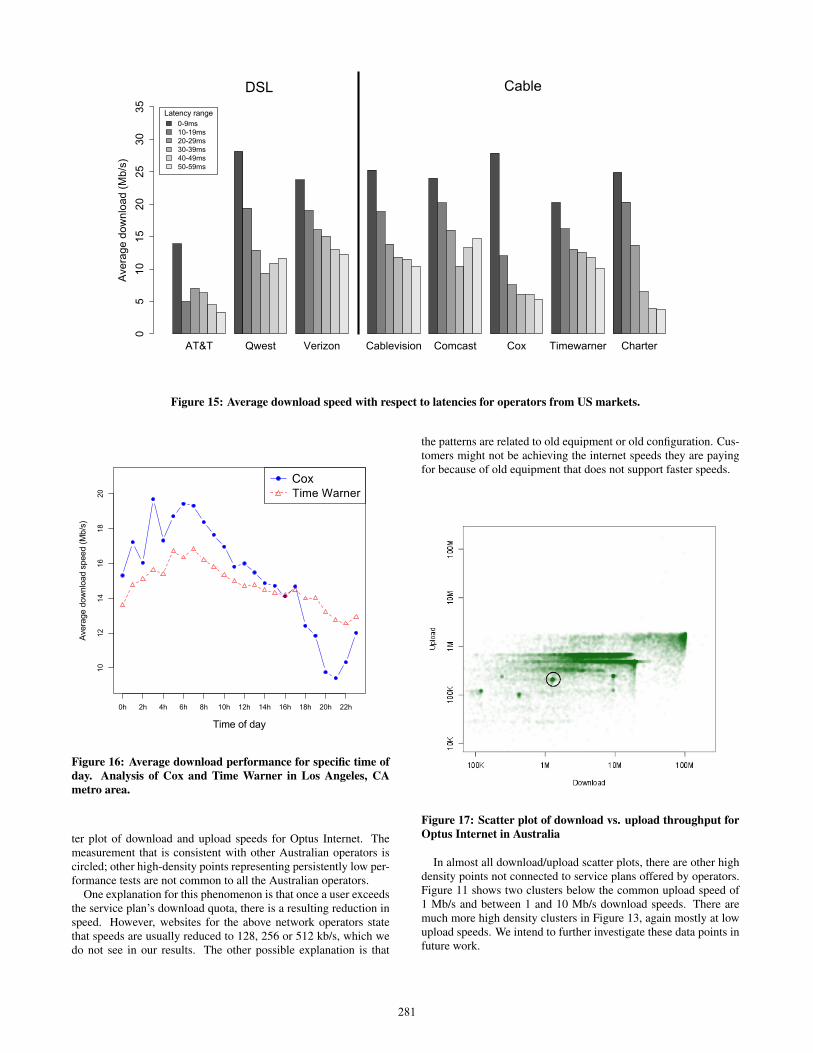
Figure 15: Average download speed with respect to latencies for operators from US markets.
Figure 16: Average download performance for specific time of
day. Analysis of Cox and Time Warner in Los Angeles, CA
metro area.
ter plot of download and upload speeds for Optus Internet. Themeasurement that is consistent with other Australian operators iscircled; other high-density points representing persistently low per-formance tests are not common to all the Australian operators.
One explanation for this phenomenon is that once a user exceedsthe service plan’s download quota, there is a resulting reduction inspeed. However, websites for the above network operators statethat speeds are usually reduced to 128, 256 or 512 kb/s, which wedo not see in our results. The other possible explanation is that
the patterns are related to old equipment or old configuration. Cus-tomers might not be achieving the internet speeds they are payingfor because of old equipment that does not support faster speeds.
Figure 17: Scatter plot of download vs. upload throughput for
Optus Internet in Australia
In almost all download/upload scatter plots, there are other highdensity points not connected to service plans offered by operators.Figure 11 shows two clusters below the common upload speed of1 Mb/s and between 1 and 10 Mb/s download speeds. There aremuch more high density clusters in Figure 13, again mostly at lowupload speeds. We intend to further investigate these data points infuture work.
281

4.3.2 Impact of distance on latency
It is commonly assumed that as you increase geographic distancebetween end-points, network latency between them increases. Withour dataset, we were able to provide empirical support for, andquantify that effect. We considered measurements in a radius of600 miles from the server. Figure 18 plots the relation of latencyand distance for AT&T, Charter and Comcast. We generally ob-serve that as distance increases, so does network latency. This ef-fect is especially true for Charter and Comcast on distances up to150 miles. After 150 miles, both Charter’s and Comcast’s averagelatencies decrease, which is a surprising effect. There is a suddenincrease in latency for measurements on AT&T’s network arounda distance of 100 miles. After that, the latency is almost constantup to 300 miles, where it starts increasing with distance again. Animplication of these results is that although latency generally doescorrelate with geographic distance, network topology and connec-tivity of a provider clearly has an important impact on broadbandperformance for end-users.
020
40
60
80
100
Distance from the server (miles)
Latency(ms)
0 150 300 450 600
AT&T
Charter
Comcast
Figure 18: Impact of distance to latency for US operators.
4.4 Markets Beyond USFigure 19 shows average download and upload speeds for all
countries represented in our dataset. Note that the countries iden-tified in the figure are from the perspective of the client host, notthe Speedtest server. In cases where a Speedtest server is close to acountry border, it is certainly possible for a client host to be within200 mi and in a different country. Since we are interested in broad-band access performance, we consider the country from which atest is initiated.
We observe that Hong Kong has the most developed Internet in-frastructure by far with cheap and easily accessible fiber connec-tions. Most European countries and the US have average downloadspeeds larger than 5 Mb/s. Countries in the speed range from 2Mb/s to 5 Mb/s are mostly South American or African. Both Indiaand Indonesia have average download speeds lower than 2 Mb/s.
It is interesting to compare our findings with the findings ofKreibich et al. [15]. For most of the countries, the average speedsare twice as high in our dataset than what was reported in theirstudy. There are also numerous relative performance differences.For example, Japan’s average download speeds were reported to bealmost two times faster than Hong Kong. In our measurements, weobserve Hong Kong connections to be faster than those from Japan.We hypothesize that the number of users connecting over fiber in
Table 1: Number of measurements with download speed
greater than 40 Mb/s and upload speed greater than 15 Mb/s
broken down by servers.
Metro area Fiber Total
Hong Kong 428003 1476203
Budapest 110186 2197648
Tokyo 73388 641759
Los Angeles 62923 4448778
New York, NY 58075 2161745
San Francisco, CA 37944 1778681
Paris 30465 798004
Manchester 21396 2793875
Stockholm 21212 177703
Hong Kong has increased, leading to average speeds that are nowmuch faster than any other country.
On a global level, we examined fiber adoption rates in variouscountries and latencies of fiber connections. We also studied broad-band connection infrastructural trends in developing countries.
4.4.1 Fiber adoption
For the purpose of the fiber connection analysis, we assume thatevery measurement with download speed greater than 40 Mb/s andupload speed greater than 15 Mb/s is over a fiber optic infrastruc-ture.
Table 1 shows the number of high speed measurements brokendown by individual metro area (which corresponds to a Speedtestserver). We report only areas in which we observe at least 20,000such measurements. In addition to Hong Kong, we also see highfiber adoption rates in Hungary, Japan, France, United Kingdomand Sweden. Note that in addition to home user fiber connections,these results also include measurements from universities and busi-nesses.
4.4.2 Fiber connection consistency and latency
We compare operators offering fiber connections in different mar-kets. In Hong Kong, the operator with the largest number of users isCity Telekom. We compare it with DIGI, which offers fiber connec-tion in Hungary, and Verizon FiOS, the most common high speedISP in our US dataset.
Figures 20, 21 and 22 show scatter plots of measurements fasterthan 40 Mb/s download and 15 Mb/s upload for the above opera-tors in their respective markets. Not only does Hong Kong have thelargest fraction of high-speed internet users as shown above, butoperators in Hong Kong market also offer higher speeds than oper-ators from European and US markets, like DIGI and Verizon FiOS.Interestingly, City Telekom offers completely symmetric speeds forboth upload and download. In prior work, Sundaresan et al. foundthat US operators provide better upload than download speed con-sistency. On Figure 20 for City Telekom in Hong Kong, we observethe opposite effect; there are more non-optimal measurements withupload rather than download degradation. DIGI, on the other hand,shows the same effect as US operators; very few measurementshave below optimal upload, while there are lots of measurementswith degraded download speeds.
We have shown in earlier sections that average download speedis lower on measurements with higher latencies for both cable andDSL operators. Is this also true for fiber connection? To studythis question, we analyzed latency and download speeds from CityTelekom and DIGI. We consider only measurements above 40 Mb/sdownload and 22 Mb/s upload speeds. We cut off measurements
282

Download bandwidth
Uploadbandwidth
1 Mb/s 2 Mb/s 4 Mb/s 8 Mb/s 16 Mb/s 32 Mb/s
256Kb/s
1Mb/s
4Mb/s
16Mb/s
AR
AU
AZBA
BE
BR
CACL
CN
DE
EC EE
EG
ESFI
FR
GB
GH
GU
HK
HU
IDIL
IN
IT
JO
JP
KE
LB
MA
MN
MO
MX
NL
NZ
PE
PS
RO
RSSA
SE
US
Figure 19: Average download/upload bandwidths for countries with most measurements. Countries identified are from the perspec-
tive of client hosts, not Speedtest servers. Circle areas are proportional to number of measurements initiated from that country.
with upload speeds between 15 and 22 Mb/s because we do notwant to include data from the DIGI’s suboptimal service plan weobserved at bottom left part of the Figure 21.
Figure 23 shows both the latency distribution and the relationof average download speed to latency for DIGI and City Telekom.Users of Fiber connection see much lower latencies than users ofcable and DSL operators. Most of the users have latencies in therange of 3 – 5 ms. The average download speed indeed decreaseswith latency. The effect is most noticeable in latency range from 1– 5 ms, but is also true for latencies beyond 5 ms.
Figure 20: Scatter plot of download vs. upload throughput for
City Telekom in Hong Kong.
5. RELATED WORKThere is a growing body of studies that examine broadband ac-
cess network performance. A number of earlier works focusedon broadband access speeds in the context of peer-to-peer applica-
Figure 21: Scatter plot of download vs. upload throughput for
DIGI in Hungary.
tions, e.g., Lakshminarayanan et al. [16], and measurement meth-ods for basic characterization of broadband access networks, suchas the asymmetry in upload and download speeds, e.g., Dischingeret al. [11] and Croce et al. [10]. For example, the authors of [11]found that download speeds exceed upload speeds by a factor of10 in some cases, but that measured bandwidths matched speedsadvertised by ISPs quite well at all times of day. They also foundthat DSL access links exhibit large latencies compared with cablemodem access links. In contrast, as can be seen in the Appendixand in Figure 9, we find that instances in which there is an order ofmagnitude difference between download vs. upload to be the rarecase and that in general, the gap has narrowed significantly.
While the aforementioned works employed active probe-basedmeasurements, other studies have analyzed passive measurementscollected from service provider networks. These measurements en-
283

Figure 23: Latency distribution and relation of latency and average download speed for Fiber operators.
Figure 22: Scatter plot of download vs. upload throughput for
Verizon FiOS users in US.
able analysis of specific application-layer behavior, which is be-yond the scope of active probe-based measurements e.g., fromSpeedtest.net. For example, the study by Cho et al. examined res-idential broadband traffic in Japan. Among other findings, theirstudy showed that 63% of traffic was peer-to-peer, with many “heavyhitters”, especially on fiber-connected access links. A more recentstudy by Maier et al. examined traffic from about 20,000 residen-tial DSL customers from a large ISP in Europe [17]. In contrastto the earlier study in Japan, they found that HTTP traffic stronglydominates peer-to-peer traffic. They also found that delays from thehome network to the ISP’s gateway often exceed delays in the widearea, and that users rarely consume the full capacity of their accesslinks (an observation also made in an earlier work by Siekkinen et
al. [21]). Maier et al. suggested that users’ achievable throughputswere often limited by suboptimal TCP settings.
More recent measurement studies to assess broadband access
speeds and performance have been fueled, in part, by a sponsoredproject by the US Federal Communications Commission to assessbroadband speeds and coverage, which is being managed by Sam-Knows [4, 9]. The recent study by Sundaresan et al. [22] used datacollected by SamKnows for the FCC study, as well as measurementdata produced by their own BISMark system, to evaluate a varietyof characteristics of broadband access networks. For their study,both data sets are collected from processes running directly on thegateway router. In the BISMark system, upload and downloadthroughputs are actively measured using a single-threaded HTTPconnection, and other techniques are used to both actively and pas-sively measure link characteristics (e.g., the ShaperProbe tool isemployed to measure capacity [14]). In contrast, the SamKnowsthroughput measurement method employs parallel TCP streams inorder to be more likely to saturate the upload and download capac-ity. Among other issues, the authors examined ISP traffic shapingpolicies, differences among local access providers, and effects dueto oversized buffers and effects of various modem models. As dis-cussed in Section 4.1.1, differences between Speedtest vs. Sam-knows measurements are primarily due to SamKnows gateway-based deployment and cross-traffic avoidance. We make no argu-ment that one is better than the other — simply that the provide dif-ferent perspectives on broadband performance. However, Speedtestdata clearly provides a broader perspective since it does not requirewhitebox deployment.
Similarly, work by Kreibich et al. on Netalyzr [15] has exposedeffects of overbuffering on edge devices (i.e., the “bufferbloat” prob-lem [12]). Similar to Speedtest, Netalyzer is an applet that runs onclient nodes and accesses dedicated servers to assess performance.Netalyzer differs from Speedtest by (i) providing measurements tousers beyond latency and bandwidth, including e.g., DNS responsetime, path MTU, and IPv6 support among others, (ii), using EC2for servers (instead of local servers), and (iii) using carefully con-structed UDP streams instead of TCP transfers to measure band-width. Among other things, the study in [15] reports upload anddownload bandwidths in markets around the world. Their resultsshow a more narrow range of bandwidths than observed in our data,most likely reflecting the nearly 3 year difference in data gathering.
284

This highlights the need for continuing analysis of broadband per-formance.
While devices deployed by SamKnows are available upon re-quest by residential broadband users, many users rely on publiclyavailable bandwidth testing services. Among these, Speedtest [3]is one of the most widely deployed. The Measurement Lab projectalso makes available the NPAD and NDT tools for network diag-nostic and throughput testing [18]. These latter tools employ a sin-gle TCP connection for assessing throughput speeds. Bauer et al.
examined the accuracy of various broadband access testing toolsand found that while in-gateway measurement systems such as theone employed by SamKnows are the most accurate, the methodsemployed by the Speedtest application are also quite accurate [5].Moreover, they found that tools that only use a single TCP connec-tion for measuring throughputs tend not to be very accurate.
6. SUMMARY AND CONCLUSIONSIn this paper we revisit the issue of broadband performance using
crowd-sourced data from speedtest.net. The objectives of ourwork are threefold: (i) to reconfirm prior results on broadband per-formance in the US, (ii) to expand on prior studies by investigatingbroadband performance details afforded by our data set, and (iii)
to compare and contrast broadband performance in markets aroundthe world. Our data set was collected over a 6 month period in 2011from 59 metro markets around the world.
Our analysis of US markets focuses on reconfirmation of priorwork by Sundaresan et al.. To begin, we report results of a casestudy that compares Speedtest measurements to SamKnows mea-surements. Our results show that there is high correlation betweenreported performance when Speedtest clients use wireline Ethernet,but Speedtest results are substantially lower when wireless Eth-ernet is used. The results of our evaluation of broadband perfor-mance in US markets are consistent with many of the prior perfor-mance studies. However, several of our results differ, for examplein terms of service provider rankings. Our data reveal several ad-ditional features of broadband performance including tight clustersof lower performance (which we attribute to older service plans,older equipment or throttling), and the correlation between latencyand distance to a server. Our analysis of non-US markets shows abroad spectrum of performance with Hong Kong at the high end,and India and Indonesia at the lower end.
In future work, we plan to use a broader set of Speedtest datato consider longitudinal characteristics of broadband deploymentsworld wide. We also plan to investigate instances of anomalousconditions such as outages or step function jumps in performancethat will provide a perspective on the robustness of broadband net-works.
Acknowledgements
We thank our shepherd and the reviewers for their helpful sugges-tions and comments.
This work was supported in part by NSF grants CNS-0716460,CNS-0831427 and CNS-0905186, and CNS-1054985. Any opin-ions, findings, conclusions or other recommendations expressed inthis material are those of the authors and do not necessarily reflectthe view of the NSF.
We thank Ookla, Inc. and Andrew Bassett for generous accessto the Speedtest.net performance data.
We thank Sam Crawford and SamKnows for the use of white-boxes in our experiments.
We also thank Anton Kapella for his fruitful suggestions and in-put on this work.
7. REFERENCES[1] Ookla Documentation Wiki. http://wiki.ookla.com, 2011.[2] Ookla, Inc. http://www.ookla.com, 2011.[3] Speedtest.net. http://www.speedtest.net, 2011.[4] SamKnows: Accurate broadband performance information
for consumers, governments, and ISPs. http://www.samknows.com/broadband/index.php, 2012.
[5] S. Bauer, D. Clark, and W. Lehr. Understanding broadbandspeed measurements. In 38th Research Conference onCommunication, Information and Internet Policy, September2010.
[6] S. Bauer, D. Clark, and W. Lehr. Powerboost. In Proceedingsof the ACM SIGCOMM workshop on Home networks, 2011.
[7] R. Carlson. Network Diagnostic Tool.http://www.internet2.edu/performance/ndt/,February 2012.
[8] US Federal Communications Commission. NationalBroadband Plan. http://www.broadband.gov/plan/,2011.
[9] US Federal Communications Commission. MeasuringBroadband America. http://www.fcc.gov/measuring-broadband-america,2012.
[10] D. Croce, T. En-Najjary, G. Urvoy-Keller, and E.W.Biersack. Capacity estimation of adsl links. In Proceedingsof ACM CoNEXT Conference, 2008.
[11] M. Dischinger, A. Haeberlen, K.P. Gummadi, and S. Saroiu.Characterizing residential broadband networks. InProceedings of ACM Internet Measurement Conference,2007.
[12] J. Gettys and K. Nichols. Bufferbloat: Dark buffers in theinternet. Queue, 9(11), November 2011.
[13] Google. Measurement Lab.http://www.measurementlab.net, 2012.
[14] P. Kanuparthy and C. Dovrolis. ShaperProbe: end-to-enddetection of ISP traffic shaping using active methods. InProceedings of ACM Internet Measurement Conference,2011.
[15] C. Kreibich, N. Weaver, B. Nechaev, and V. Paxson.Netalyzr: Illuminating the edge network. In Proceedings ofACM Internet Measurement Conference, 2010.
[16] K. Lakshminarayanan and V.N. Padmanabhan. SomeFindings on the Network Performance of Broadband Hosts.In Proceedings of ACM Internet Measurement Conference,2003.
[17] G. Maier, A. Feldmann, V. Paxson, and M. Allman. OnDominant Characteristics of Residential Broadband internetTraffic. In Proceedings of ACM Internet MeasurementConference, 2009.
[18] M. Mathis, J. Heffner, P. O’Neil, and P. Siemsen. Pathdiag:Automated TCP Diagnosis. In Proceedings of Passive andActive Measurement Conference, 2008.
[19] MaxMind. The MaxMind IP Geolocation Servicel.http://www.maxmind.com, 2012.
[20] S. Perez. Nielsen: Cord Cutting and Internet TV Viewing onthe Rise. http://techcrunch.com, February 2012.
[21] M. Siekkinen, D. Collange, G. Urvoy-Keller, andE. Biersack. Performance limitations of ADSL users: a casestudy. In Proceedings of Passive and Active MeasurementConference, 2007.
[22] S. Sundaresan, W. de Donato, N. Feamster, R. Teixeira,S. Crawford, and A. Pescapè. Broadband internetperformance: A view from the gateway. In Proceedings ofACM SIGCOMM ’11, Toronto, Canada, August 2011.
APPENDIX
The following table shows summary statistics and basic informa-tion on the Speedtest measurements included in our study.
285

Table 2: Number of measurements, average download and upload speeds and latency broken down by metro areas.Region Metro Area Country Code Tests Download Mean (Stdev) Kb/s Upload Mean (Stdev) Kb/s Latency Mean (Stdev) millisec.
Europe
Barcelona ES 323431 13384 (18471) 2704 (7264) 76 (161)Brussels BE 495738 14380 (14404) 2374 (5701) 51 (164)Budapest HU 2197648 16519 (27293) 5188 (12439) 50 (168)Frankfurt DE 242569 12053 (16779) 1834 (3904) 118 (211)Manchester UK 2793875 10718 (14322) 2328 (6176) 56 (119)Paris FR 798004 19562 (49113) 5598 (24270) 59 (149)Rome IT 1740709 5401 (9747) 1365 (6760) 74 (142)Sarajevo BA 212119 2981 (5738) 893 (4145) 96 (267)Stockholm SE 177703 26509 (40140) 10542 (23238) 50 (405)Turku FI 515003 6484 (7953) 2273 (5183) 94 (155)
Asia
Hong Kong HK 1476203 33955 (43730) 26988 (36826) 37 (137)Jakarta ID 2852275 1743 (6250) 976 (4659) 133 (327)New Delhi IN 3242544 1632 (3397) 844 (2045) 165 (278)Tokyo JP 641759 18085 (29084) 13022 (18372) 70 (267)Ulaanbaatar MN 109354 8261 (17064) 6326 (13437) 75 (200)
Africa
Accra GH 68753 8561 (19282) 7900 (20609) 114 (291)Bamako ML 19 244 (145) 143 (117) 489 (507)Cairo EG 308805 1468 (3910) 539 (2771) 132 (347)Casablanca MA 141558 2256 (3640) 451 (1933) 173 (240)Nairobi KE 164759 4237 (11049) 1955 (6469) 164 (338)
Pacific
Auckland NZ 381377 8689 (16535) 2605 (9791) 58 (167)Melbourne AU 961180 12285 (18398) 1416 (4372) 56 (138)Perth AU 353578 6254 (18409) 2028 (11248) 72 (168)Sydney AU 1184639 9464 (17653) 2019 (9378) 50 (129)Tamuning GU 12803 4137 (5869) 1384 (3899) 115 (198)
North America
Anchorage, AK US 61144 4948 (7038) 1672 (6360) 144 (504)Bellingham, WA US 433021 11978 (12793) 2436 (5181) 61 (153)Burlington, VT US 101058 16554 (36229) 3963 (8671) 115 (249)Chicago, IL US 1365027 13487 (22697) 4174 (12340) 53 (134)Dallas, TX US 815938 10824 (17556) 3717 (9973) 76 (173)Flagstaff, AZ US 55350 11822 (17760) 3260 (6548) 103 (197)Grand Forks, ND US 84126 11774 (14269) 3192 (5425) 74 (161)Grand Rapids, MI US 136568 7432 (10921) 2506 (5258) 95 (168)Honolulu, HI US 127632 8536 (9948) 1834 (4526) 94 (130)Idaho Falls, ID US 37079 6904 (12399) 2297 (4915) 131 (209)Lawrence, KS US 170725 10525 (24911) 3553 (10067) 261 (432)Lexington, KY US 368759 9800 (10433) 1887 (4865) 63 (140)Little Rock, AR US 173791 7279 (9936) 1981 (4205) 90 (161)Los Angeles, CA US 4448778 11377 (18100) 3215 (10473) 54 (139)Medford, OR US 51780 13180 (15873) 3266 (10605) 74 (159)Miami, FL US 740662 15977 (16262) 4114 (10271) 39 (112)New York, NY US 2161745 16749 (20415) 4584 (8367) 50 (139)Pensacola, FL US 143703 7916 (9085) 1961 (3617) 96 (145)Philadelphia, PA US 489278 12736 (18220) 5474 (10544) 77 (189)Portland, ME US 152908 9709 (11956) 2713 (6447) 91 (252)Provo, UT US 31563 8648 (19535) 4427 (10258) 98 (189)San Francisco, CA US 1778681 12384 (22480) 4764 (13072) 55 (147)Springfield, MO US 458499 7561 (13952) 2047 (9096) 75 (143)Sumter, SC US 78590 10560 (17325) 2460 (5852) 126 (234)
South America
Brasilia BR 286197 6983 (8207) 995 (2751) 66 (180)Buenos Aires AR 528919 4713 (9768) 1407 (5386) 72 (169)La Paz BO 44925 752 (1428) 295 (1005) 315 (341)Quito EC 213365 2800 (7660) 2123 (5885) 129 (294)Santiago CL 935391 7928 (13115) 2415 (8278) 92 (359)
Middle East
Amman JO 598767 2672 (4868) 759 (3263) 183 (292)Baku AZ 1280475 2658 (4955) 948 (3383) 87 (196)Kabul AF 1998 768 (1205) 585 (2025) 409 (689)Riyadh SA 1595746 5487 (10381) 1212 (6274) 76 (175)Tel Aviv IL 870621 6058 (6031) 943 (3133) 78 (197)
286


![[Henri Lefebvre] Critique of Everyday Life Founda(BookFi.org)](https://img.pdfslide.net/doc/110x75/577c84161a28abe054b76bcb/henri-lefebvre-critique-of-everyday-life-foundabookfiorg.jpg)

![AS Founda]]](https://img.pdfslide.net/doc/110x75/5451aa4baf7959b9648b66f1/as-founda.jpg)


![[Jaak Panksepp] Affective Neuroscience, The Founda(BookZZ.org)](https://img.pdfslide.net/doc/110x75/55cf8cea5503462b13908394/jaak-panksepp-affective-neuroscience-the-foundabookzzorg.jpg)