Embed Size (px)
Citation preview

Revisiting Fundamentals of Monitoring and Evaluation Principles in the New Normal: The CART PrinciplesNassreena Sampaco- BaddiriCountry DirectorInnovations for Poverty Action Philippines

Overview
I. Introduction II. CART principlesIII. Building an M&E system

12 We turn the knowledge
into action.
We generate knowledge.

Working with NGOs, government, foundations on scientific impact evaluations, in partnership with academics
Engaging practitioners and policy makers for actual use of the evidence
Supporting organizations with their broader M&E needs and learning strategies
1. Evidence generation 2. Evidence to practice 3. Right-Fit Evidence
About Innovations for Poverty ActionThree complementary streams of work
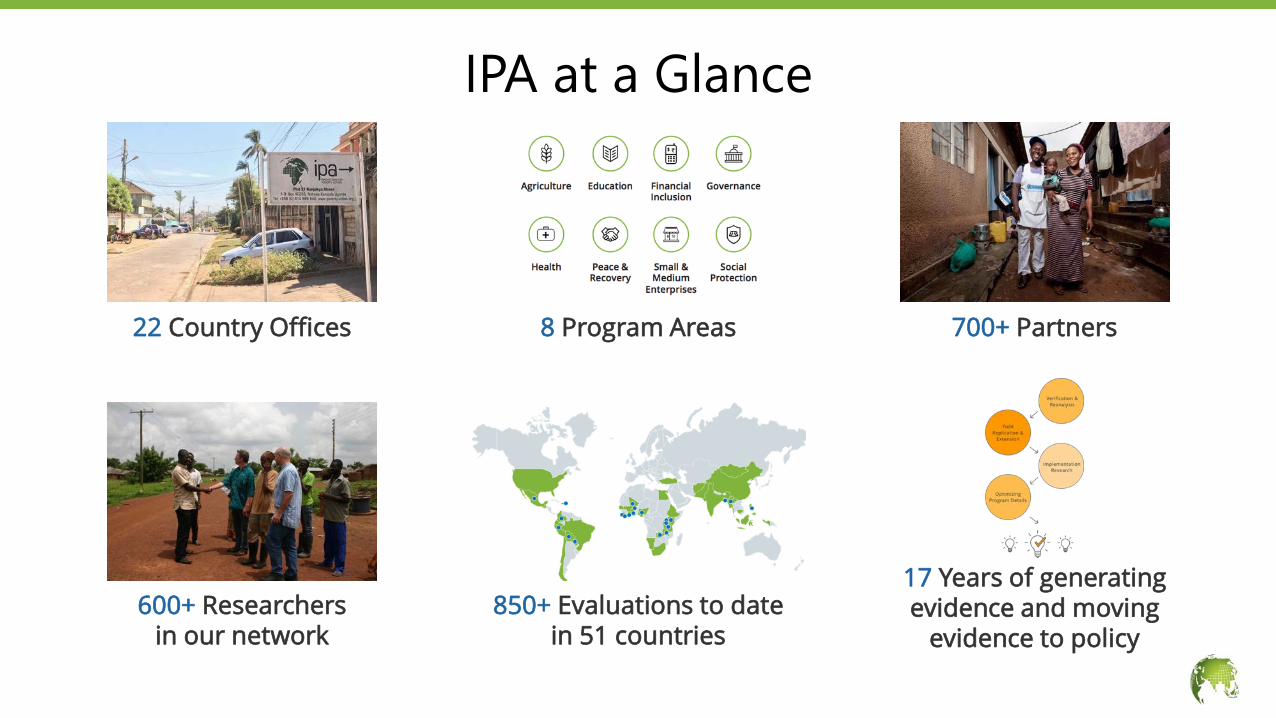
IPA at a Glance
600+ Researchers in our network
22 Country Offices 8 Program Areas 700+ Partners
850+ Evaluations to date in 51 countries
17 Years of generating evidence and moving
evidence to policy

Focusing onthe Local• 23 countries with a
long-term presence
• Widely recognized as the experts in field-based randomized evaluations

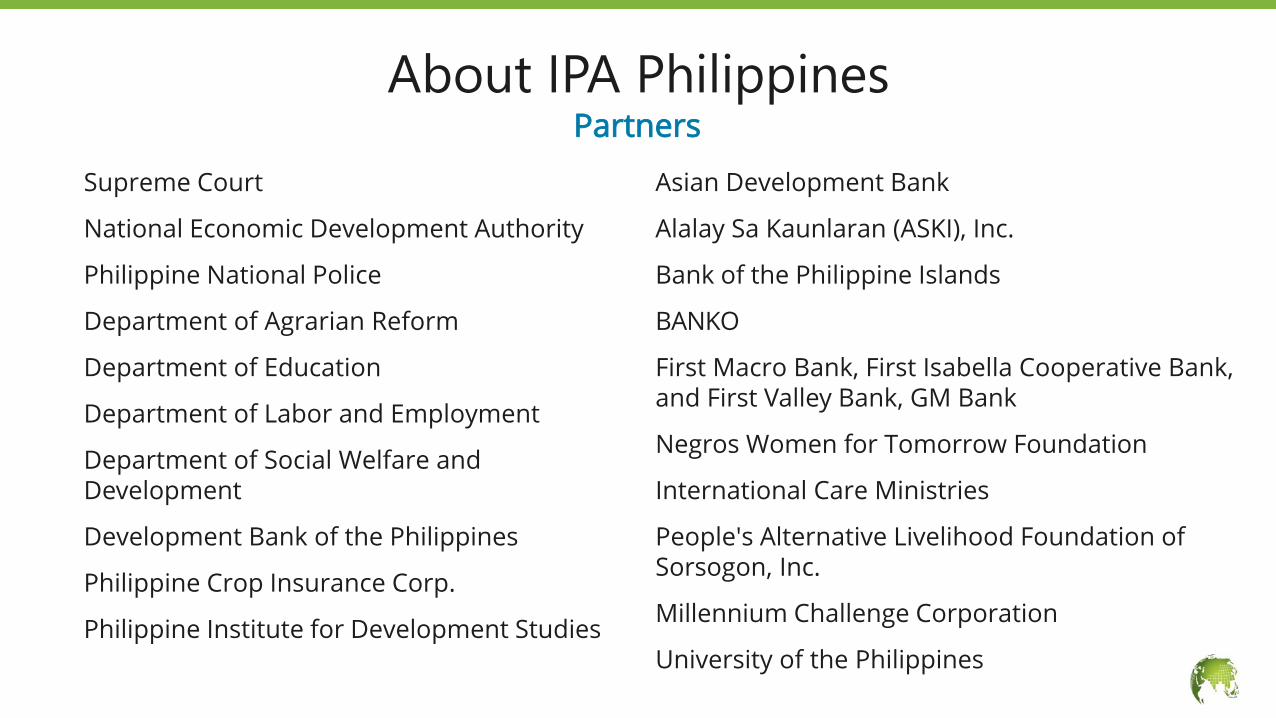
Department of Education
National Economic Development Authority
Supreme Court
Department of Agrarian Reform
Department of Labor and Employment
Department of Social Welfare and Development
Philippine National Police
Development Bank of the Philippines
Philippine Crop Insurance Corp.
Philippine Institute for Development Studies
Asian Development Bank
Alalay Sa Kaunlaran (ASKI), Inc.
Bank of the Philippine Islands
BANKO
First Macro Bank, First Isabella Cooperative Bank, and First Valley Bank, GM Bank
Negros Women for Tomorrow Foundation
International Care Ministries
People's Alternative Livelihood Foundation of Sorsogon, Inc.
Millennium Challenge Corporation
University of the Philippines
About IPA PhilippinesPartners

Where we work in the Philippines
Supreme Court
National Economic Development Authority
Philippine National Police
Department of Agrarian Reform
Department of Education
Department of Labor and Employment
Department of Social Welfare and Development
Development Bank of the Philippines
Philippine Crop Insurance Corp.
Philippine Institute for Development Studies
Asian Development Bank
Alalay Sa Kaunlaran (ASKI), Inc.
Bank of the Philippine Islands
BANKO
First Macro Bank, First Isabella Cooperative Bank, and First Valley Bank, GM Bank
Negros Women for Tomorrow Foundation
International Care Ministries
People's Alternative Livelihood Foundation of Sorsogon, Inc.
Millennium Challenge Corporation
University of the Philippines
About IPA PhilippinesPartners
“Evaluation”: Program design & planningDoes it work? Why?
“Monitoring”: Program management Data needed for day to day implementation
Why Gather Evidence?

Increasing focus on measuring impact
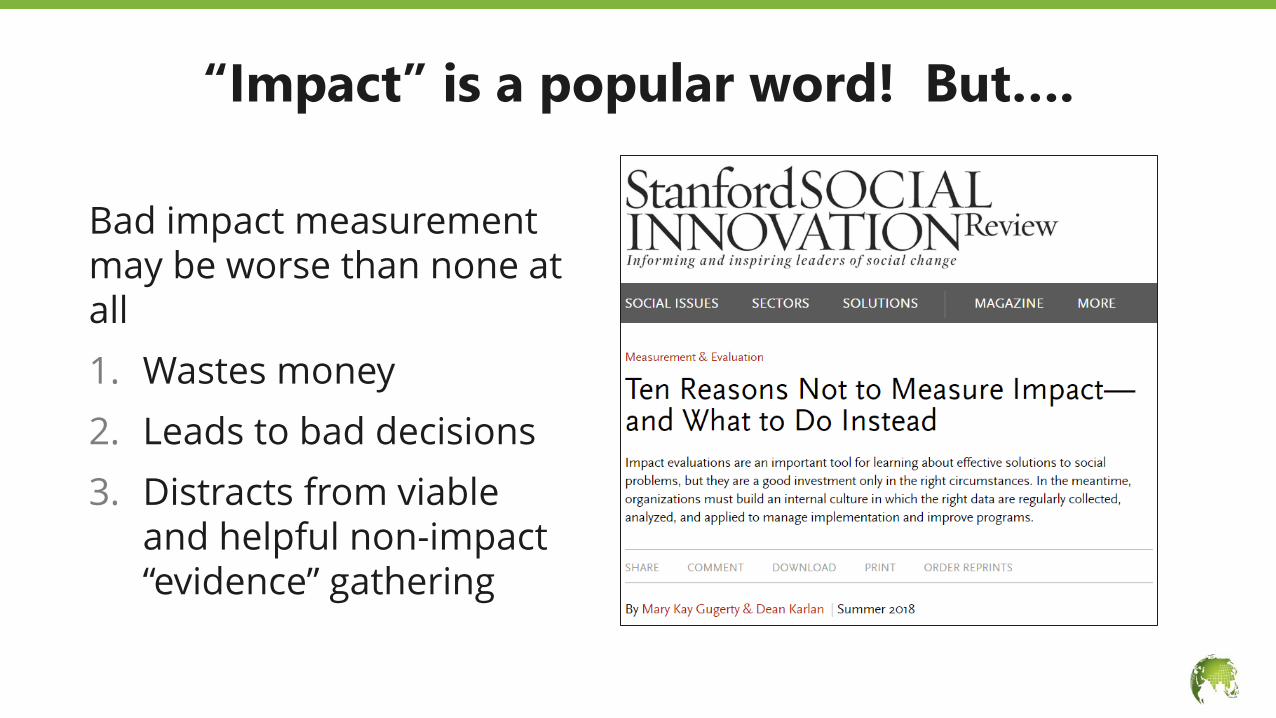
“Impact” is a popular word! But….
Bad impact measurement may be worse than none at all1. Wastes money2. Leads to bad decisions3. Distracts from viable
and helpful non-impact “evidence” gathering
1. A few success stories2. Comparing before and after3. Comparing before and after of those who get a service,
and compare to before and after for some who do not4. Randomized evaluation: Randomly assign who (or which
communities) gets a service and who does not
Determining impact of a program

“Evaluation”: Program design & planningDoes it work? Why?
“Monitoring”: Program management Data needed for day to day implementation
Why Gather Evidence?
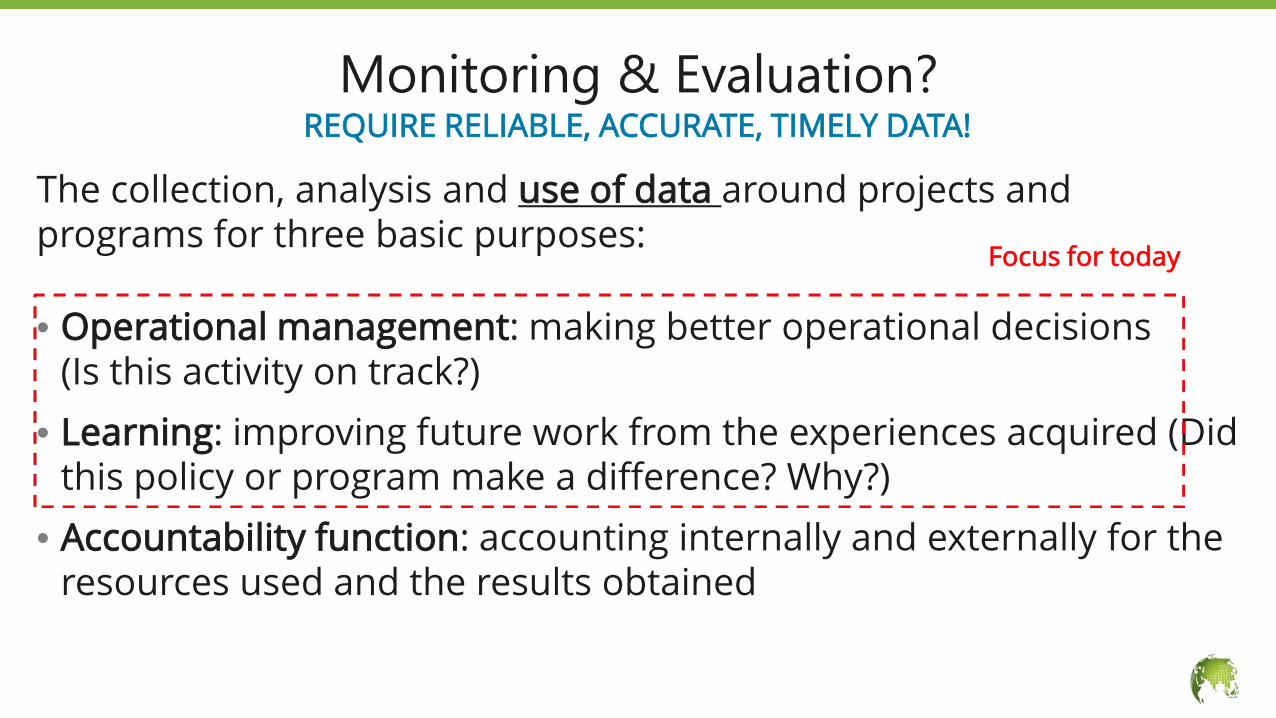
The collection, analysis and use of data around projects and programs for three basic purposes:
• Operational management: making better operational decisions (Is this activity on track?)
• Learning: improving future work from the experiences acquired (Did this policy or program make a difference? Why?)
• Accountability function: accounting internally and externally for the resources used and the results obtained
REQUIRE RELIABLE, ACCURATE, TIMELY DATA!Monitoring & Evaluation?
Focus for today

- Targeting: who should receive the program? who does?
- Feedback from constituents
- Field agent quality
- Adoption of technologies
- Eating nutritional supplements?
- Agricultural take-up
- Health product usage
- Cost
Program management/“monitoring” data
Starts with a Theory of Change

The answer depends on the type of evaluationWhy is Evaluation Important?
What is the problem?
How, in theory, does the activity fix the problem?
Does the activity occur as planned?
Were its goals achieved?The magnitude?
Given magnitude and cost, how does it compare to alternatives?
Needs Assessment
Program Theory Assessment
Process Evaluation
Impact Evaluation
Cost Effectiveness
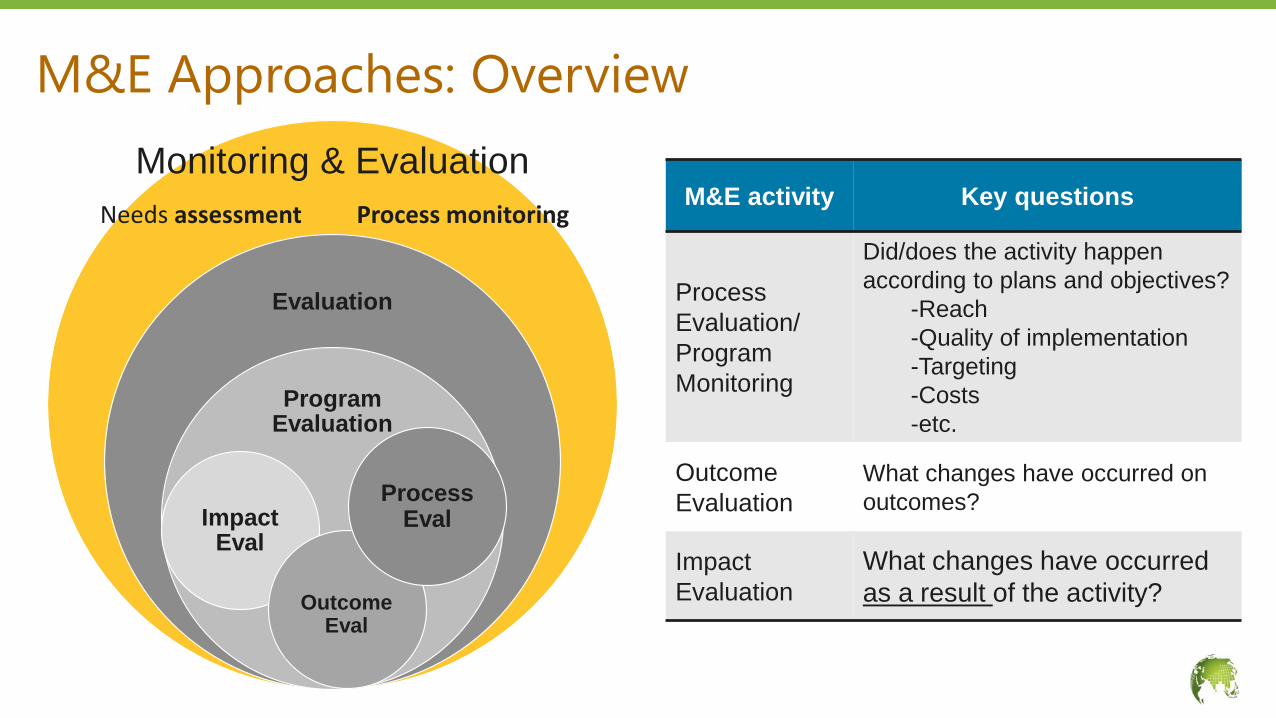
M&E Approaches: Overview
Evaluation
Program Evaluation
Impact Eval
Monitoring & EvaluationNeeds assessment Process monitoring
Outcome Eval
Process Eval
M&E activity Key questions
Process Evaluation/ Program Monitoring
Did/does the activity happen according to plans and objectives?
-Reach-Quality of implementation-Targeting-Costs-etc.
Outcome Evaluation
What changes have occurred on outcomes?
Impact Evaluation
What changes have occurred as a result of the activity?
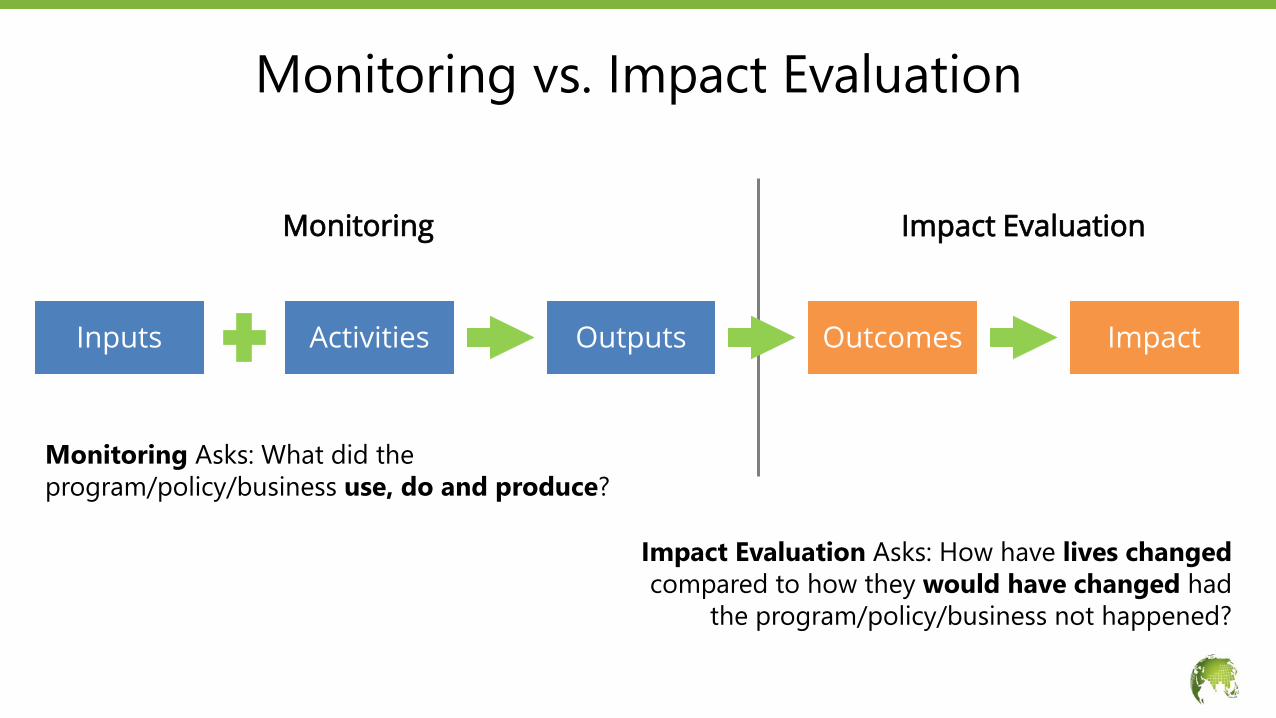
Monitoring vs. Impact Evaluation
Monitoring Impact Evaluation
Impact Evaluation Asks: How have lives changed compared to how they would have changed had
the program/policy/business not happened?
Monitoring Asks: What did the program/policy/business use, do and produce?
OutputsInputs Activities Outcomes Impact

Collect usable dataUse data to make decisionsMake data useful for learning and improvement
Prioritizing what data to collect in the new normal
The CART Principles for M&E
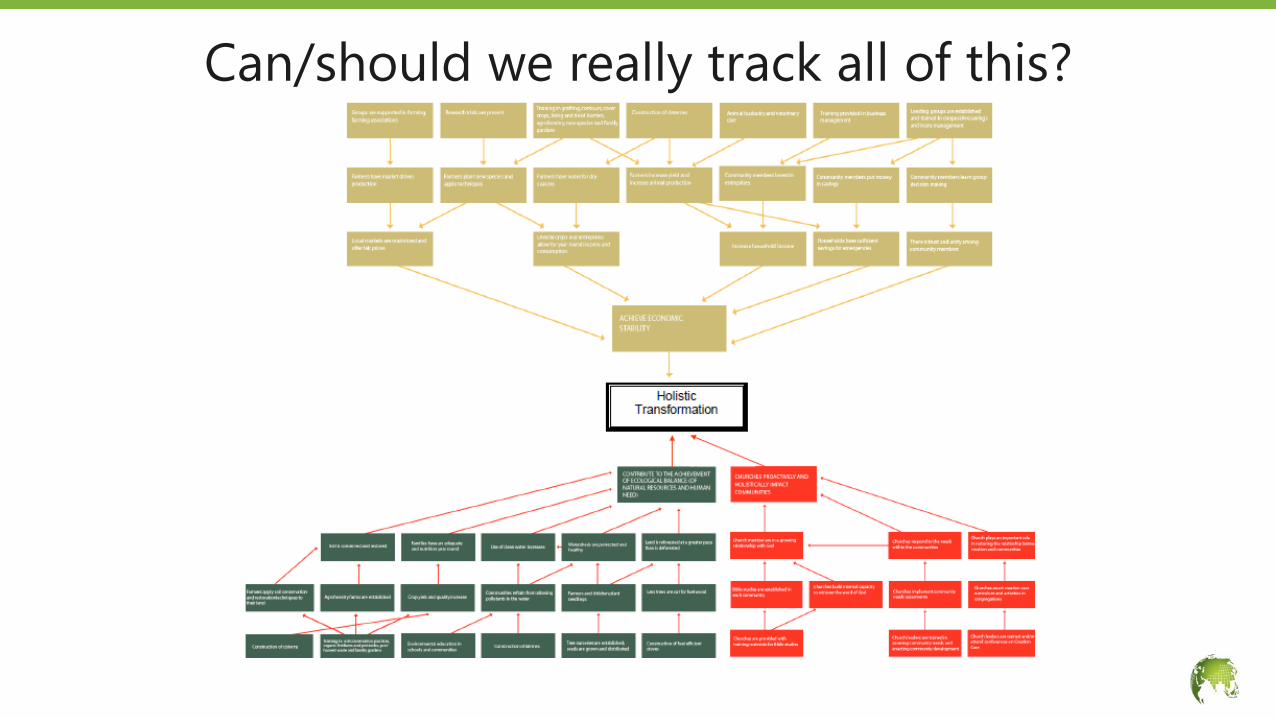
Can/should we really track all of this?
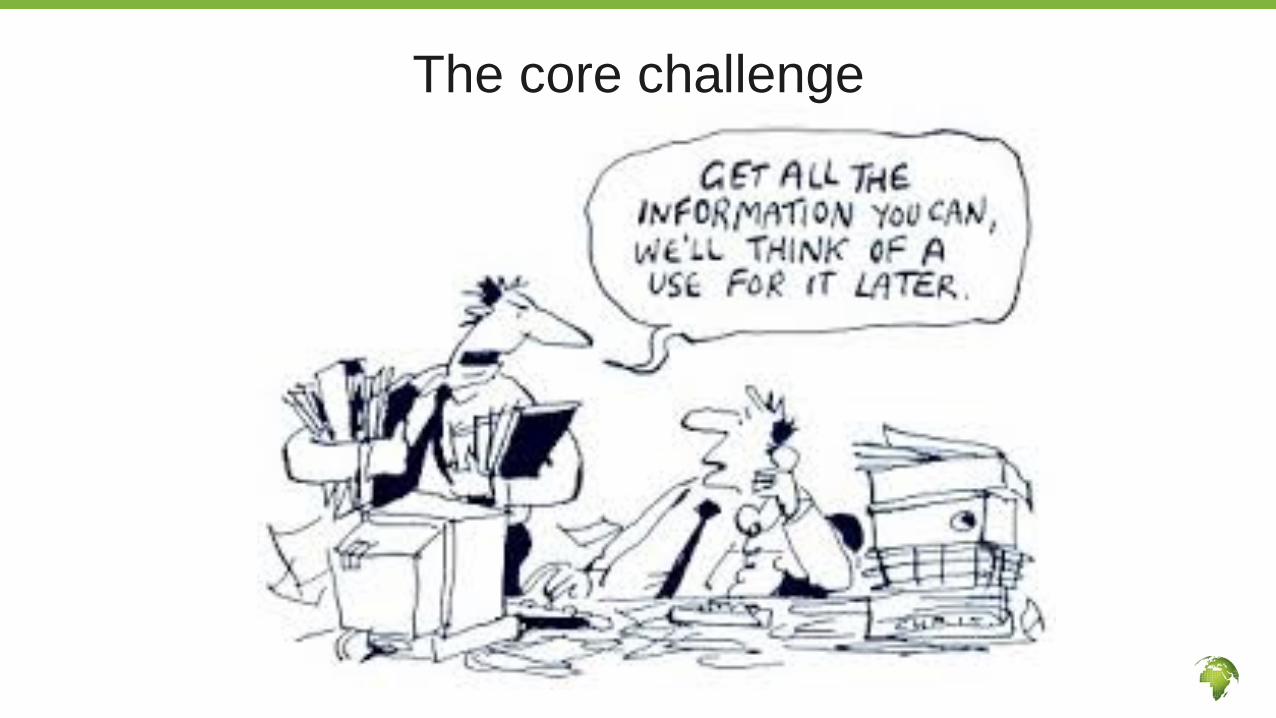
The core challenge

CredibleBad data and data analyzed badly and can be worse than no data at all
Credible = credible data + credible analysis
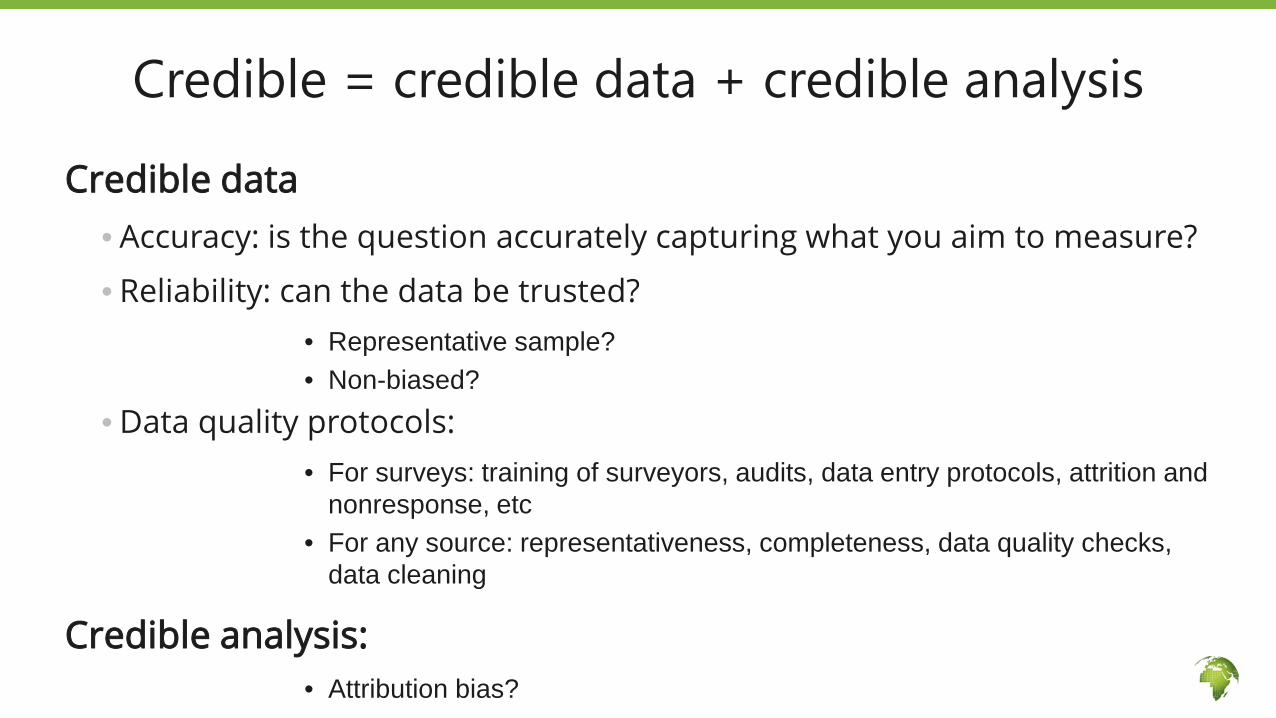
Credible data• Accuracy: is the question accurately capturing what you aim to measure?
• Reliability: can the data be trusted?• Representative sample?• Non-biased?
• Data quality protocols: • For surveys: training of surveyors, audits, data entry protocols, attrition and
nonresponse, etc• For any source: representativeness, completeness, data quality checks,
data cleaning
Credible analysis:• Attribution bias?
Credible = credible data + credible analysis
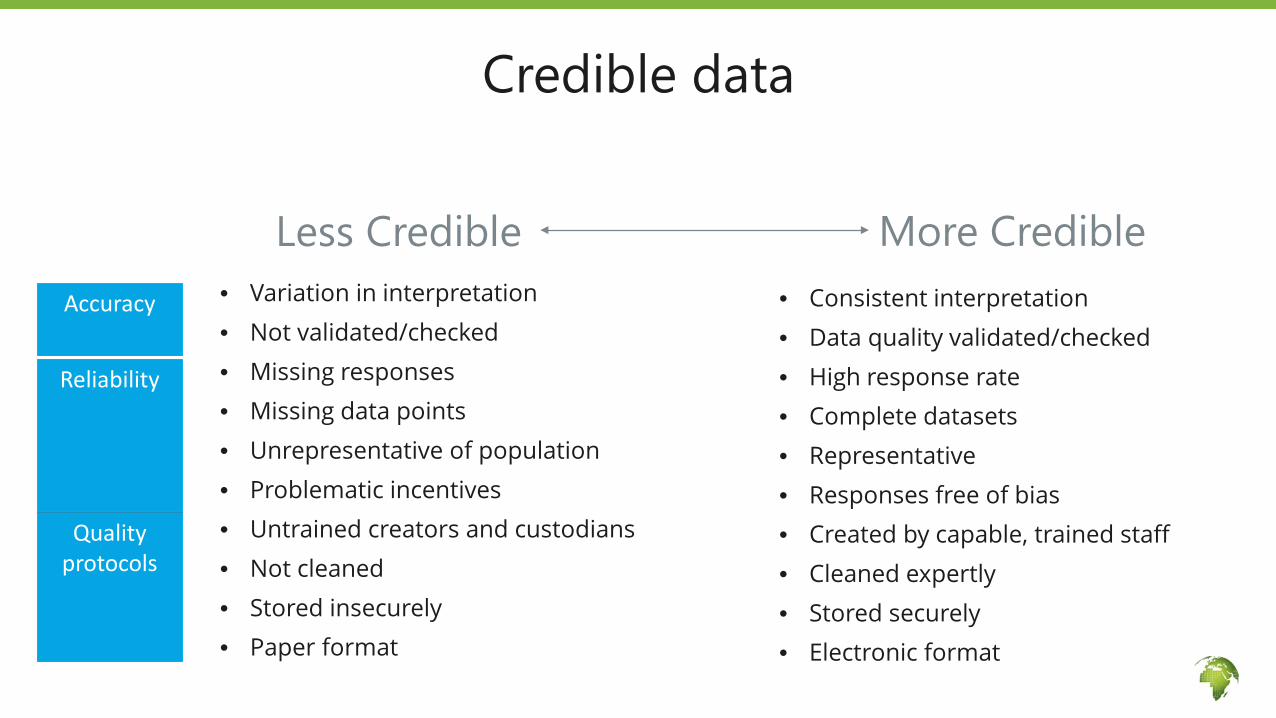
Credible data
Less Credible More Credible• Variation in interpretation• Not validated/checked• Missing responses• Missing data points• Unrepresentative of population• Problematic incentives• Untrained creators and custodians• Not cleaned• Stored insecurely • Paper format
• Consistent interpretation• Data quality validated/checked• High response rate• Complete datasets• Representative • Responses free of bias• Created by capable, trained staff • Cleaned expertly• Stored securely• Electronic format
Accuracy
Reliability
Quality protocols
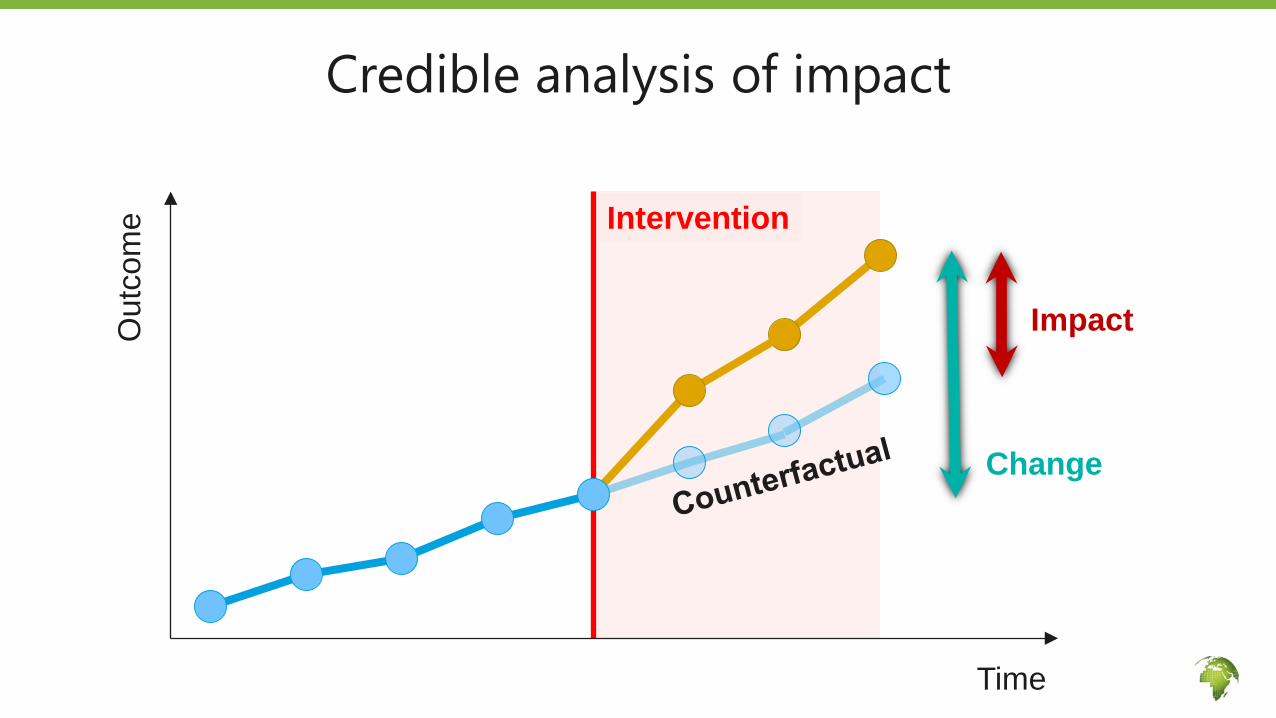
Credible analysis of impactO
utco
me
Change
Intervention
Time
Impact
Actionable
• If there is no plan for how to use the data, do not collect them

Linked to decisions
• What decisions are made with these data?
• Do we have authority to make these decisions?
Timely
• Does the data get to decision-makers regularly enough to be useful?
• Does the data arrive at the time decisions are made?
User-friendly
• Is it in a format people can use? (hint – does anyone look at it?)
Accessible
• Can the data be accessed by people who need it? Is it devolved?
What makes data actionable?
Actionable
In the new normal, it is even more important to collect data you can commit to use
Define and narrow the set of data to collect Define action based on data Develop system that delivers high quality data in a
timely fashion

ResponsibleAll data have costs • Trade off using resources for data collection vs. other strategic
investments• Invest in impact evaluation when appropriate

From which set would you choose?
or
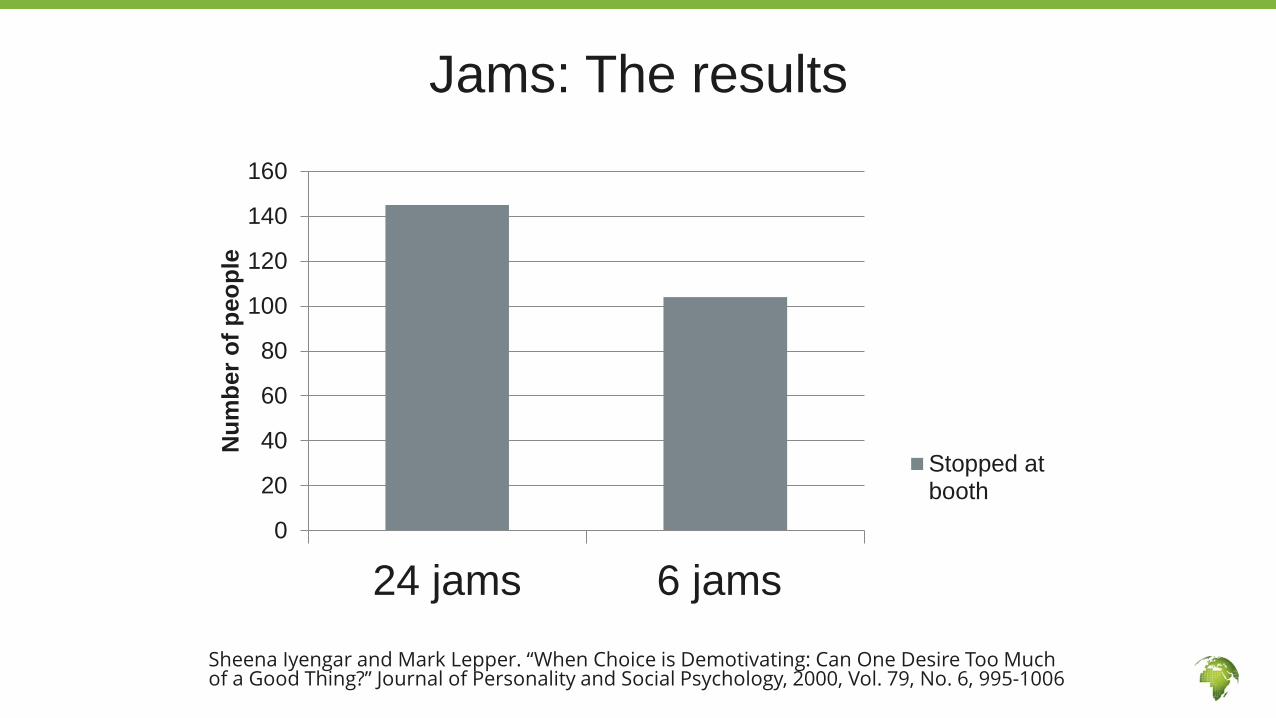
Jams: The results
Sheena Iyengar and Mark Lepper. “When Choice is Demotivating: Can One Desire Too Much of a Good Thing?” Journal of Personality and Social Psychology, 2000, Vol. 79, No. 6, 995-1006
0
20
40
60
80
100
120
140
160
24 jams 6 jams
Num
ber o
f peo
ple
Stopped atbooth

Jams: The results
Sheena Iyengar and Mark Lepper. “When Choice is Demotivating: Can One Desire Too Much of a Good Thing?” Journal of Personality and Social Psychology, 2000, Vol. 79, No. 6, 995-1006
0
20
40
60
80
100
120
140
160
24 jams 6 jams
Num
ber o
f peo
ple
Stopped atboothPurchased

ResponsibleReal costs need to be assessed against the value of information the data will provide. Direct Costs: Data collection can be expensive, designing forms and collecting data can take time. Analyzing data can also take time. Can technology help?Opportunity Costs: time spent on collecting data can be used in implementing the program or analyzing data.Grounding the design of the program in sound theory of change.

Responsible
Learning
Cost
Stacks of paper on desks
More is not always better. Nor is less
Data is useful for others (within or without your organization)
If it’s a program – are the results based on theory, and published?
If it’s performance/service delivery data – is it useful to others, and accessible online?
Transportable
In the new normal, it is important to collect data that generate knowledge for other programs.
Communicate lessons from M&E in order to help other design more effective programs.
One clear example in the time of the pandemic: vaccine distribution!
Transportable
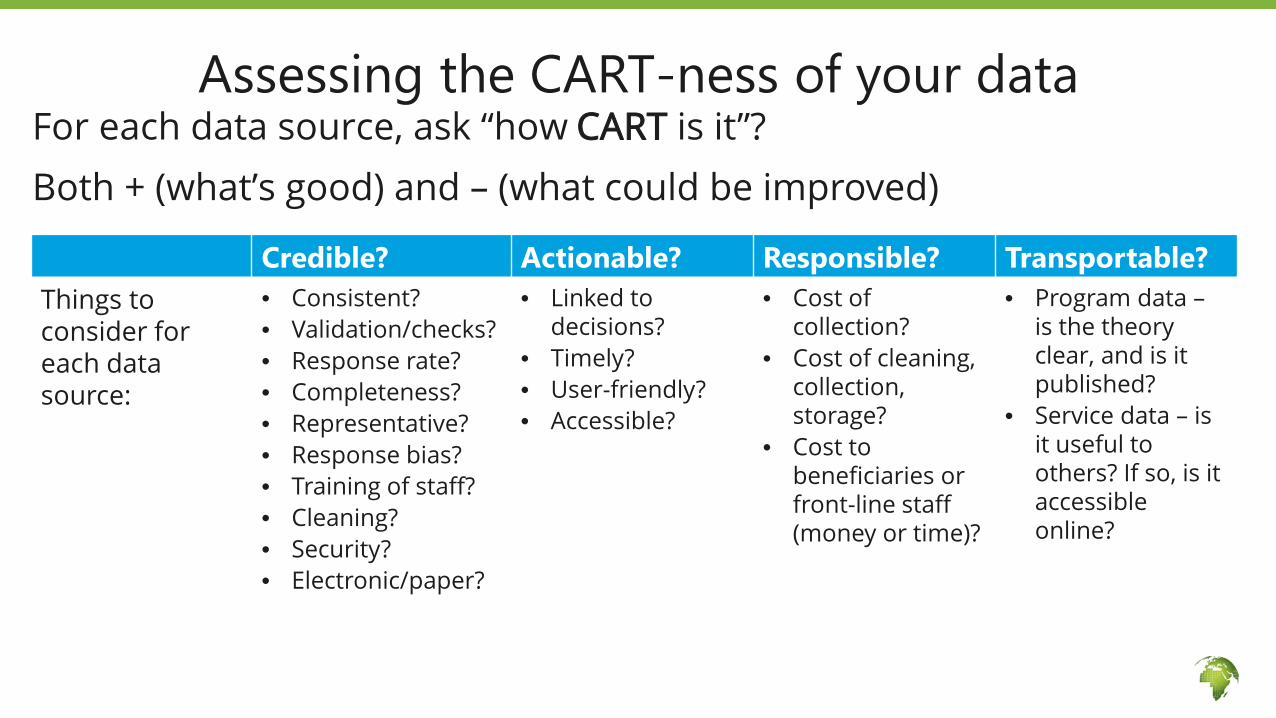
Assessing the CART-ness of your dataFor each data source, ask “how CART is it”? Both + (what’s good) and – (what could be improved)
Credible? Actionable? Responsible? Transportable?Things to consider for each data source:
• Consistent?• Validation/checks?• Response rate?• Completeness?• Representative?• Response bias?• Training of staff?• Cleaning?• Security?• Electronic/paper?
• Linked to decisions?
• Timely?• User-friendly?• Accessible?
• Cost of collection?
• Cost of cleaning, collection, storage?
• Cost to beneficiaries or front-line staff (money or time)?
• Program data –is the theory clear, and is it published?
• Service data – is it useful to others? If so, is it accessible online?

Where to go from here: building an M&E System

IPA’s Right-Fit Evidence UnitHelping organizations make
learning-oriented M&E a reality

Building an M&E System
1. Theory of Change
2. Assumptions
and indicators
3. Prioritization
into M&E plan
4. Data Collection & Management
5. Data Analysis
& Reporting
Iterative process
STEERINGLEARNING
ACCOUNTABILITY

1. Create a Theory of Change for priority interventions
2. Think of the list of possible indicators
a. Indicators along the steps of the Theory of Change
b. Indicators and/or punctual studies to verify assumptions
3. Prioritize based on CART principles4. Create a matrix of how the data will be collected and analyzed5. Implement the M&E plan and refine as you go
Concrete steps to build an M&E plan

Prioritize based on CART principles
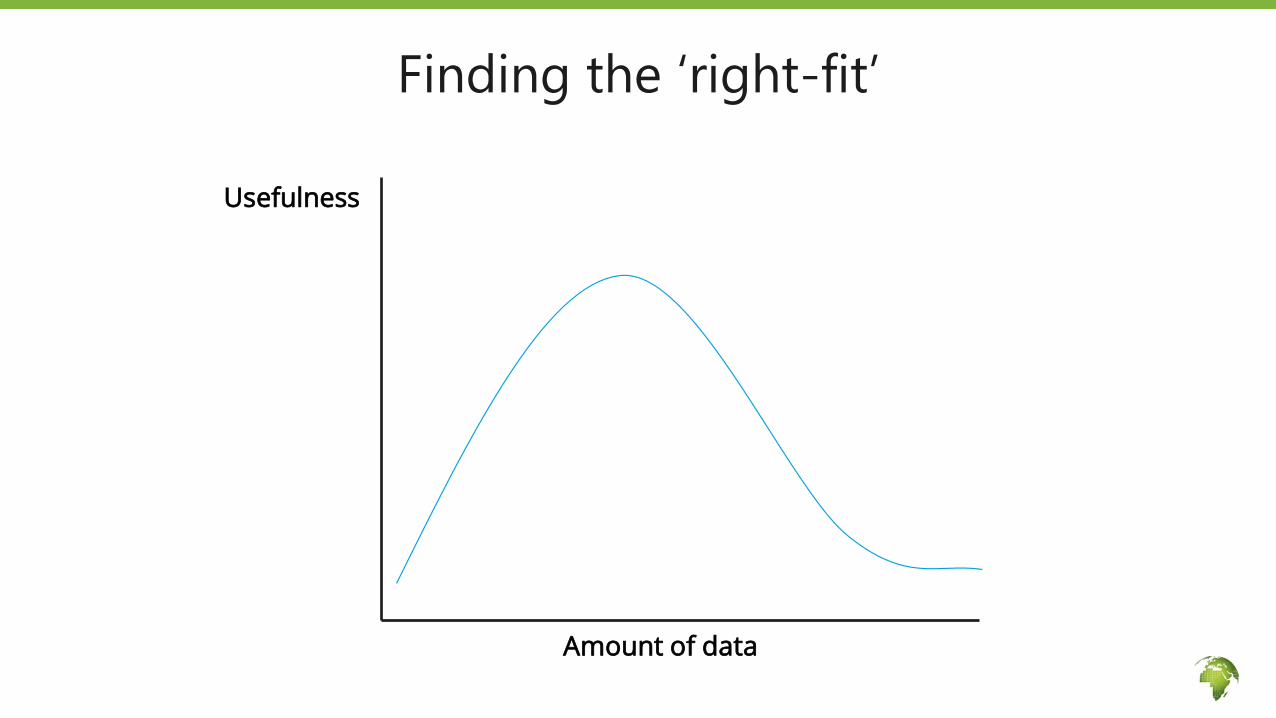
Finding the ‘right-fit’
Usefulness
Amount of data

Create the M&E Plan (list of M&E activities)Data source (Form,Survey, Study etc.)
Indicators to be gathered (from logframe)
Method of data collection Sample Timing and/or
frequency Responsibilities Report going to / to be used by
Training session attendance sheets
-Number of trainings held-Total number of beneficiaries trained
Paper forms All trainings
Following every training session (compilation monthly by M&E assoc.)
-Design: local partner director-Filled by: trainers-Entry and analysis: M&E associate
-local partner director-Global monitoring sheet
End of Training feedback questionnaire
-Retention rate on content of the training
Interactive Voice Recording (IVR)
50 farmers every month who attended training in previous month
Monthly during training period
-Design: local partner director-Delivery: M&E associate-Analysis: M&E associate
-local partner director-Global monitoring sheet
Yearly practice survey
-% farmers employing at least 2 of the sustainable farming practices techniques covered
In-person electronic survey (smartphones with ODK)
25 communities (random)
Yearly ~1 month after harvest
-Design: Programs team of PWP US/local partner director-Delivery: survey team managed by M&E associate-Analysis: M&E associate
-local partner director-Programs & technical teams of PWP US
Yearly farmer organization qualsurvey
-Whether inputs can be found in close market town
Focus group discussion
All farmer organizations in partner communities
Yearly ~1 month after harvest
-Design: Programs team of PWP US/local partner director-Delivery: survey team managed by M&E associate-Analysis: M&E associate
-local partner director-Programs & technical teams of PWP US
Impact Evaluation
-Average amount of relevant crop harvested per acre
In-person electronic survey (smartphones with ODK)
See details on IE design docs Every 3 years
-Design: Programs team of PWP US/local partner director-Delivery: survey team managed by M&E associate-Analysis: M&E associate
-local partner director-Programs & technical teams of PWP US-Donors

Actually allocate the needed resources for this (or reprioritize indicators otherwise)Have someone in charge, but build shared ownershipCommit to use the data, and have reports do the same!Refine as you go
Implement the M&E plan

Maraming Salamat po!
Comments/questions?
www.poverty-action.org