Embed Size (px)
Citation preview

1
Reward for climate change management: the role of
different incentive schemes for employees within firms
Thesis MSc. Business Administration – Strategy Track
Name: Elice Elfriede Groeneveld
Student number: 10203044
Supervisor: Daniel Waeger
Date of submission: 23-01-2017
Faculty of Economics and Business, University of Amsterdam

2
STATEMENT OF ORIGINALITY
This document is written by Elice Groeneveld who declares to take full responsibility for the
contents of this document.
I declare that the text and the work presented in this document is original and that no sources
other than those mentioned in the text and its references have been used in creating it.
The Faculty of Economics and Business is responsible solely for the supervision of
completion of the work, not for the contents.

3
ABSTRACT
Extensive research exists about the effectiveness of different incentivizing schemes within
organizations. Current literature suggests that giving incentives to employees in a firm can
motivate and stimulate them to work towards certain company goals. However, not much
research exists about awarding employee incentives specifically focused on climate change
management and about the effectiveness of this type of reward. Given the increasing threat of
global warming, firms need to implement sustainability management practices. An important
element of these practices is to reduce CO2 emissions by companies. Therefore, within this
study we investigate if firms that give incentives to employees for climate change
management reach higher CO2 emission savings. Furthermore, we study the effect of
rewarding different types of employees - the CEO, the board of directors and all employees
within the organization - on CO2 emission savings. Additionally, we investigate the effect of
monetary incentives contrary to non-monetary incentives for climate change management. For
this study, data from the Carbon Disclosure Project (CDP) is used about sustainability
practices and climate change management initiatives of companies worldwide. In contrast to
our expectations, we did not find any significant effects of rewarding employees for climate
change management on CO2 emission savings. Also, the results do not show significant
differences between monetary and non-monetary incentives. Due to some important
limitations of our data and study, we believe further research is necessary before drawing
conclusions about the effectiveness of rewarding employees for climate change management.
Key words: climate change management, global warming, sustainability, incentives, CO2
emission savings, CEO, board of directors, all employees, monetary incentives, non-monetary
incentives, CDP

4
TABLE OF CONTENTS
ACKNOWLEDGEMTS ........................................................................................................................2
1. INTRODUCTION ..............................................................................................................................5
2. LITERATURE REVIEW ..................................................................................................................9
2.1 STAKEHOLDER APPROACH ..............................................................................................................9
2.2 GLOBALIZATION ............................................................................................................................10
2.3 CARBON FOOTPRINT ......................................................................................................................11
2.4 EMISSION REDUCTION ...................................................................................................................12
2.5 INCENTIVIZING WITHIN ORGANIZATIONS ......................................................................................13
2.6 INCENTIVE TYPES ..........................................................................................................................16
3. THEORETICAL FRAMEWORK..................................................................................................18
3.1 INCENTIVIZING BY COMPANIES .....................................................................................................18
3.2 CEO INCENTIVES............................................................................................................................19
3.3 BOARD INCENTIVES .......................................................................................................................21
3.4 GENERAL WORKFORCE INCENTIVES..............................................................................................22
3.5 MONETARY INCENTIVES ................................................................................................................24
4. METHOD ..........................................................................................................................................26
4.1 SAMPLE AND DATA COLLECTION ..................................................................................................26
4.2 MEASURES .....................................................................................................................................27
4.2.1 INDEPENDENT VARIABLES .........................................................................................................27
4.2.2 DEPENDENT VARIABLE ...............................................................................................................28
4.2.3 MODERATING VARIABLE ............................................................................................................28
4.2.4 CONTROL VARIABLES .................................................................................................................29
4.3 RESULTS ........................................................................................................................................30
5. DISCUSSION....................................................................................................................................38
5.1 ACADEMIC RELEVANCE ................................................................................................................38
5.2 MANAGERIAL IMPLICATIONS ........................................................................................................39
5.3 LIMITATIONS AND FUTURE RESEARCH ..........................................................................................40
6. CONCLUSION ................................................................................................................................42
7. LITERATURE..................................................................................................................................45

5
1. INTRODUCTION
Sustainable development is becoming an increasingly popular topic for today’s business
(Cerin & Karlson, 2002). It requires actions from different parties within society, like
corporations, individuals and the government. Governments and firms can meet those
sustainability demands in different ways. Governments translate those demands into policies
and laws, and firms include environmental responsibility in their operations by developing
major environmental corporate strategies (Welford, 1996). Concern over legitimacy and
responsibility towards their stakeholders forces companies to adopt managerial practices that
are expected to bring value to society (Deephouse, 1999; Scott, 1995). Firms benefit from
legitimacy, because socially legitimate companies are more attractive to partners, customers
and employees and are better able to retain them (Buysee & Verbeke, 2003; Henriques &
Sadorsky, 1999; Sharma & Henriques, 2005; Turban & Greening, 1997).
Global warming is a hot topic on our planet and a serious danger for future life on
earth (Lash & Wellington, 2007). Greenhouse gases building up in the atmosphere lead to a
rapidly changing climate on earth. The ten warmest years on record all have occurred since
1980, with 2005 as the warmest year ever recorded. This warming up of the earth leads to
massive ice-melting areas, shrinking glaciers and tropical hurricanes resulting from warm
ocean waters. For instance, the ice sheets of Greenland and Antarctica have been losing mass
over the period 1992 to 2011, with a faster rate in the period of 2002 to 2011 (IPCC, 2014).
Besides, over the period 1901 to 2010, the global mean sea level rose by 0.19 meters. Since
the mid-19th century, the sea level has been rising at a larger rate than the mean rate during the
previous two millennia. Global data shows that disastrous forces of nature like floods,
droughts and other climate-related disasters are growing more severe and more frequent. For
instance, a study by Hirabayashi, Kanae, Emori, Oki and Kimoto (2008) projected significant
differences in floods and droughts between the 20th and the 21th century. In many global

6
regions, an increase in the frequency of floods is projected, except for North America and
central and western Eurasia. For the regions such as North and South America, Central and
Southern Africa, the Middle East, Central to Western Australia and Indochina to Southern
China, an increase of the number of drought days is expected. Also, during the present
century, a decline of 10% of rainfall is expected in Ethiopia, where droughts are already a
common problem (IPCC, 2007). CO2 emissions from companies heavily contribute to the
increase of global warming; particularly large, international firms could have a big impact
(McKinnon, 2007). Therefore, CO2 reduction should be an important point in the agenda of
companies worldwide.
In today’s society, the potential threat of global warming to our ecosystem is
recognized and climate change is accepted as a necessary practice (Boiral, 2006). This has
made the pursuit of CO2 reductions a major priority for many governments and companies
(McKinnon, 2007). CO2 emission reductions are namely seen as the key component for
achieving more sustainability (CDP, 2014). Companies worldwide have experienced
increasing pressure to reduce their emission of greenhouse gasses (Boiral, 2006). Managers
need to make decisions concerning sustainable management and could better choose a
proactive than a wait-and-see approach. Employees within organizations could be an essential
source towards more sustainability, as their actions and decisions could determine an increase
or a decrease in CO2 emissions. By contributing to the reduction of CO2 emissions, firms will
become part of the solution rather than only part of the problem of worldwide global warming
(Boiral, 2006).
Different attempts have to be made by businesses to meet the environmental
requirements our society is facing nowadays. An important implication is that all stakeholders
must recognize the negative economic and social consequences of poor environmental
performance (Berrone & Gomez-Mejia, 2009a). Argyris (1998) states that empowerment of
7
employees is essential for reaching organizational goals of environmental responsibility. It
will motivate and commit them to participate and engage in good environmental practices.
Incentives can serve as a reinforcement to continuously motivate employees and increase their
commitment to being environmentally responsible (Herzberg, 1966). Berrone and Gomez-
Mejia (2009a) emphasize the threefold benefits of structuring executive pay around
environmental performance: managers receive extra salary, shareholders see their firm
survival secured, and society is protected against harm. In a study of Denton (1999), evidence
came up that even if a company was strongly encouraging environmental improvement,
incentives such as bonuses, salaries or other types of incentives were rarely tied to
environmental performance. Supervisors in firms believe that additional incentives should be
given to employees in order to give them the additional responsibility of engaging in
environmental improvement efforts (Forman & Jorgensen, 2001). Nowadays, several big
firms are incentivizing their employees for climate change management, so does the greater
part of the firms within our study sample.
Berrone and Gomez-Mejia (2009a) argue that firms incentivize their CEOs for good
environmental performance, while they operate in environmental polluting sectors. In this
case, environmental performance is included as a criterion in incentive schemes for chief
executives. Incentives for adopting strategies that enhance environmental wellbeing could be
used to motivate CEOs, with the objective of improving environmental performance (Berrone
& Gomez-Mejia, 2009a). Rewarding those who exhibit good environmental performance is
important, because incentives ensure that CEOs take more risks in engaging in environmental
actions from which the outcome is uncertain (Bloom & Milkovich, 1998; Hart, 1995). It is
interesting to also look at other employee types that receive incentives within an organization
besides the CEO-level. Govindarajulu and Daily (2004) for example, argue that it is important
to actively involve employees at all levels of the organization in environmental performance

8
targets. When all employees feel empowered to reach environmental goals, this contributes to
a so-called ‘participative culture’ and might significantly enhance a company’s chance for
superior environmental performance. This could mean that not only the CEO, but all
employees should be rewarded when they actively pursue good environmental behavior.
Therefore, it is important to analyze who exactly is rewarded for good environmental
behavior in a firm. The type of employee that is rewarded for good environmental behavior
differs per company (Nieland, Kangos, Fixel, Baczewski & Pechenik, 2013). The different
types of employees that are studied within this research are the CEO, the board of directors
and all employees within the organization.
Besides rewarding different types of employees within an organization, also different
types of incentives are distinguished (Atwater & Bass, 1994; Laabs, 1992; Leitch et al., 1995;
Marks, 2001; Patton & Daley, 1998). Within this research, a distinction is made between
monetary and non-monetary incentivizing, where non-monetary incentives mainly include
recognition as incentive. Disagreement between scholars exists about which way of
incentivizing for environmental goals is most effective. Whereas monetary incentives seem
one of the strongest motivators for employees to engage in good environmental activities,
some employees are more sensitive to recognition and praise (Govindarajulu & Daily, 2004).
Some companies stimulate environmental performance through non-monetary rewards. An
example is Dow Chemical, which motivates its employees by awarding plaques to those who
come up with the most innovative ideas to reduce waste (Denton, 1999). According to the
information that incentives are used to motivate employees to assume a more environmentally
responsible behavior, it is interesting to investigate if and how incentives could lead to lower
CO2 emissions on a cross-country and cross-industry level. Therefore, the following research
question can be set up:
9
RQ: What role do incentive systems and incentive types focused on climate change
management play in achieving more sustainability for companies in terms of CO2 emission
savings?
This thesis will contribute to both theory and practice. Given the growing importance
of sustainable behavior and environment protection, businesses should find ways to make
themselves more green (CDP, 2014) . When the effects on CO2 reduction of different ways of
incentivizing within an organization become clear, companies could deploy more effective
strategies to reach their sustainability goals and adjust or reject existing incentives schemes
that seem to be inefficient. Besides this practical contribution, this thesis also makes a
contribution to theory since hardly any research exists about the relationship between CO2
emission reduction and different ways of organizational incentivizing. First, an introduction to
the existing literature will be given in the literature review. Afterwards, hypotheses will be
formulated in the theoretical framework and the research design for this study will be
explained. Finally, results will be presented and discussed.
2. LITERATURE REVIEW
2.1 Stakeholder approach
Stakeholders are defined by Freeman (1984) as “groups or individuals who can affect
or are affected by the achievement of the firm’s objectives” (p. 25). The stakeholder approach
can be directly linked to Corporate Social Responsibility (CSR), as it describes the entities
whose welfare a company is, at least partially, responsible for (Carroll, 1991). CSR implies
that the firm chooses to engage in activities beyond the interest of the company itself or
beyond what is required by law, to improve the wellbeing of stakeholders (McWilliams,
Siegel & Wright, 2006). Thereby a distinction can be made between primary and secondary
stakeholders, whereas the former include entities such as employees, customers and suppliers

10
which are key to the organization, and the latter type is not directly involved with
organizational transactions (Carrol, 1991). According to Friedman’s (1970) well-known and
classical view of the firm “there is one and only one social responsibility of business - to use
its resources and engage in activities designed to increase its profits”. Nowadays, many
scholars and practitioners argue that this classical economic objective of maximizing
‘shareholder’s welfare’ is incomplete (Berrone & Gomez‐Mejia, 2009b). Firms have to deal
with many different kinds of stakeholders with different interests and goals. Since the 21st
century, sustainability has become increasingly important among businesses (Dyllick &
Hockerts, 2002). The general promise is that while doing business, companies should preserve
the natural environment for future generations. Hereby it is important to mention that both
needs of current and future stakeholders must be taken into account. The so-called ‘triple
bottom line’ plays an important role and consists of environmental, social and economic
aspects which must be considered by a firm. Gladwin, Kennelly and Krause (1995a) state that
economic performance alone can succeed in the short run, but in the long run all three
dimensions must be considered simultaneously.
2.2 Globalization
Besides the stakeholder approach as an argument for why businesses should take
environmental issues into account, the phenomenon of globalization also plays an important
role. Scherer and Palazzo (2008) define globalization as “the process of intensification of
cross-area and cross-border social relations between actors from very distant locations, and of
growing transnational interdependence of economic and social activities” (p. 3). Across the
world, big differences in law and regulation exist between governments, which has its effect
on companies’ operations (Stone, 1975). This means that in some countries, firms have much
more regulatory freedom to operate in a way that is most beneficial for them. When the legal
system is imperfect or legal rules are incomplete in a country, an appeal is made to big and

11
influential entities such as businesses and their social responsibilities. Companies are asked to
comply with the law or to even go beyond the requirements of the law, by starting to operate
in a more sustainable way. This has to be realized by managers who have prosocial intentions
and an aspiration to contribute to the common good (Stone, 1975).
Nowadays, firms are viewed not only as the polluters of the environment, but also as a
possible solution to the problems of imperfect global regulation and deteriorating public good
(e.g., Margolis & Walsh, 2003; Matten & Crane, 2005). They could be the key to a more
sustainable world, since in some countries the government lacks the ability to effectively
manage the environment. Today we have to deal with issues that are going beyond the borders
of one country, which gives firms an additional political responsibility to contribute to the
development and proper working of global governance (Scherer & Palazzo, 2008).
2.3 Carbon footprint
With the threat of a changing climate on our globe, the carbon footprint is becoming
an increasingly popular subject (Wiedmann & Minx, 2007). Although the exact definition of
carbon footprint is disputable, the carbon footprint is an indicator of the amount of gaseous
emissions which can affect the climate and are caused by human production or consumption.
Wiedmann and Minx (2007) choose to only include CO2 emissions within their definition,
since many of other potential greenhouse gases are not based on carbon or are more difficult
to collect data about. In addition, CO2 is one of the major greenhouse gases (Worrell, Price,
Martin, Hendriks & Meida, 2001). Therefore, also in this study, the amount of CO2 emissions
of firms is used as indicator of a company’s sustainability.
Big investors are starting to demand more disclosure from firms concerning their
carbon footprint and CO2 emissions (Lash & Wellington, 2007). The Carbon Disclosure
Project (CDP), for example, is a large coalition of institutional investors representing more
than $31 trillion in assets, which inquires information from large multinational companies

12
about their climate risk positioning. The fourth annual Carbon Action Report of the CDP it is
stated that both the number of reported projects and quantity of emission reductions have
stagnated in 2014 (CDP, 2014). The CDP argues that it is important that companies disclose
their emission information and that setting emission reduction targets is crucial for energy
management in businesses. Given the importance of addressing climate change and the
benefits of emission reduction activities, the CDP emphasizes that companies, especially in
heavy emitting industries, need to do more to meet their climate policy targets (Nieland et. al.,
2013). The CDP has data about the amount of CO2 emissions in metric tonnes that a company
has emitted in one year. Within this research, this number of CO2 emissions will be used as
an indicator to measure a company’s environmental responsibility.
2.4 Emission reduction
Companies can reduce their CO2 emissions by means of (1) control or (2) prevention
(Frosch & Gallopoulos, 1989; Cairncross, 1991). In case of control, expensive, non-
productive pollution control equipment is used to achieve compliance with regulations. In
case of prevention, pollution is prevented during the manufacturing process itself through, for
instance, better housekeeping, material substitution, recycling or process innovation.
Prevention is better than cure, because pollution is seen as an inefficiency within
manufacturing processes and waste is a non-recoverable cost (Shrivastava & Hart, 1992).
Pollution prevention may increase productivity and efficiency, because it leads to lower raw
material costs as inputs are used more efficiently. Also compliance and liability costs will be
reduced when a company cuts its emissions well below the levels required by law (Young,
1991; Schmidheiny, 1992). Providing incentives to the entities within the organization that
actively pursue CO2 emission reduction goals can be seen as a preventive method (e.g.,
Coombs & Gilley, 2005). Through incentives, employees can be motivated to find ways to
reduce environmental pollution. Berrone and Gomez-Mejia (2009a) found that firms would

13
rather reward employees pursuing pollution prevention strategies than employees who adopt
so called ‘end-of-pipe strategies’, which can be understood as pollution control.
During the last two decades, together with rising concerns about climate change,
different scholars have argued that enhancing a firm’s environmental performance doesn’t
necessary lead to higher costs, but can also lead to better economic performance (e.g., Porter
& van der Linde, 1995a). Hart and Ahuja (1996) proved that companies can benefit from
being green, although it takes a few years of efforts to reach this gain. King and Lenox (2001)
found a positive relation between financial gain and pollution reduction in their longitudinal
research, although they don’t know the direction of this effect. Also Clarkson, Richardson and
Vasvari (2011) found that firms that actively improve their environmental performance over
time, also see improvements in their financial resources. In their study, Barnett and Salomon
(2010) found a U-shaped relationship between a firm’s corporate social performance and
corporate financial performance. This means that when companies start investing in social
activities, their financial return will be low in the beginning. As soon as they accrue the so-
called ‘stakeholder influence capacity’, their ability to transform social investment into
financial returns will be improved. This indicates that it takes time for firms to gain profits
through socially responsible activities. Considering all those findings about whether a firm
can profit from green behavior, the long-term importance for companies to act green can be
underlined. Companies can benefit from engaging in environmentally responsible behavior
and at the same time this will contribute to a more sustainable society. Therefore, it is
important to investigate effective methods to stimulate this responsible behavior within
companies. One effective method could be the establishment of an incentive system
(Govindarajulu & Daily, 2004), which will be discussed in the next section.
2.5 Incentivizing within organizations

14
Companies are concerned about how green objectives can best be implemented within
large and complex organizational planning, management and control (Gabel & Sinclair-
Desgagné, 1993). In reaction to the sustainability concerns mentioned in the previous
sections, firms are increasingly adopting environmental management practices (Gottlieb,
1995; Porter & van der Linde, 1995b). An example of these environmental management
practices are employee incentive programs, which are meant to motivate employees to reach
certain company goals. Incentives affect behavior in certain ways because of their influence
on three factors: ‘cognitive exertion’, i.e. the incentive affects the amount of thinking a person
puts into a task; ‘motivational focus’, i.e. the incentive changes the goals an employee has in
mind; and ‘emotional triggers’, i.e. the incentive serves as a prerequisite for the agent to
predict or emit their own response (Read, 2005). Due to these factors, people are likely to be
influenced by incentives.
Some literature indicates that reward could motivate and reinforce employees to act in
environmentally responsible ways (Laabs, 1992; Patton & Daley, 1998). By using such
incentives, companies can show their commitment to environmental performance (Lent &
Wells, 1994). If companies care about environmental responsibility, they should align
performance evaluation systems with managerial systems in terms of their corporate
environmental objectives (Epstein & Roy, 1997). Govindarajulu and Daily (2004) recommend
that top management should implement environmental management systems within the
organization and communicate the importance of employee motivation in environmental
improvement. Thereby, it is important that employees at all levels within the organization are
actively involved in chasing environmental improvement goals. Since executives may
experience some feelings of risk for failing when they choose to implement new, more
sustainable technologies to reduce emissions, it might be helpful to give them extra rewards
when they take these risks (Klassen & Whybark, 1999; Russo & Fouts, 1997). In this way,

15
they are rewarded for the fact that they dare to take risky decisions which may enhance the
environmental performance of the company. Otherwise, the risk exists that an employee
chooses the ‘safe way’ by not engaging in new, more sustainable practices, because the
employee fears to make unsuccessful decisions.
Although much research exists about executive compensation, little has been written
about the link between managerial pay and social/environmental issues (Berrone & Gomez‐
Mejia, 2009b). Berrone and Gomez-Mejia (2009a) mention some organizational advantages
of structuring executive pay for managers around environmental performance. First, managers
will be stimulated to build legitimacy, which is a valuable resource to the firms’ survival and
success. Second, it holds managers clearly accountable for the environmental behavior of the
company. And lastly, managers can be encouraged to monitor environmentally responsible
behavior at lower levels within the organization. According to Berrone and Gomex-Meija
(2009a), executives are less likely to engage in socially responsible practices, if they are not
appropriately incentivized for it.
Also on the level of the board of directors, some interesting statements could be made
regarding incentives as stimulators of certain behavior. Roberts, McNulty and Stiles (2005)
state that the effectiveness of the board is dependent on behavioral dynamics of the board.
Multiple scholars argue that many non-executive directors are too passive and even neglectful
in the constitution of management decisions (Johnson, Daily & Ellstrand, 1996; Tosi, Shen &
Gentry, 2003; Westphal & Khanna, 2003). Board members have very little stock ownership in
companies, which makes their personal wealth less dependent on the performance of the
company they oversee (Hambrick & Jackson, 2000; Patton & Baker, 1987). However, they
are responsible for creating a clear and successful strategy to protect shareholders’ interests.
According to Shen (2005) the ultimate solution would be to involve board members more in
business practices by giving them strong incentives to perform their duties. This is applicable

16
to the current research, concerning the involvement of board members in the creation of
awareness for environmental pollution by CO2 emissions.
Proof exists that there are differences in outcomes of rewarding different types of
employees within the organization. For instance, Russo and Harrison (2005) found weak
support for the assumption that certain incentive systems can lead to more environmentally
responsible behavior, but they found a difference between manager types. Environmental
performance is enhanced when it is linked to monetary incentives for facility managers, but
this relationship does not apply to environmental quality managers. Shen (2005) looks at the
distribution of rewards from an agency perspective, and states that both non-executive
directors and executives within a company are the so-called ‘agents’ of the ‘principals’, which
are the shareholders. He argues that if one group of agents is provided with incentives, the
other group of agents should also receive them.
2.6 Incentive types
Besides incentivizing different types of employees, also different types of incentives
can be distinguished. Clark and Wilson (1961) place different incentive types in 3 broad
categories; material incentives, solidary incentives and purposive incentives. Material
incentives are the tangible rewards that have a monetary value or can be translated into
monetary value. They encompass money in the form of salary and wage and all other tangible
benefits obtained by labor. The second incentive type is solidary incentives, which are
intangible and have no monetary value. The main characteristic is that this type of incentive is
separated from the precise outcome of the action. Solidary incentives include, for example,
rewards as status, fun and conviviality and maintenance of social distinctions. The third
incentive type categorized by Clark and Wilson (1961) is purposive incentives. These
incentives are also intangible, but they derive from the outcome of the action rather than, like
solidary incentives, from the simple action itself. This type of incentives is related to the

17
greater whole of firm goals, and does not benefit members personally. An example is the
inducement for eliminating corruption.
Although these both tangible and intangible incentives are used to stimulate
employees, money seems to be the main motivator within firms (Clark & Wilson, 1961). Also
Govindarajulu and Daily (2004) recognize monetary incentives are one of the strongest
motivators for employees. While companies are probably providing additional incentives
besides money, few would work for it if no money at all were paid (Clark & Wilson, 1961).
Parker and Wright (2001) state that, for employees to be committed to the organization they
work for, satisfaction with incentive systems is important. The higher the satisfaction, the
higher the commitment. To make sure employees feel committed to achieving a firms’ goals,
a company must motivate its employees with the right incentives. For instance, Lawler (1973)
found that monetary rewards significantly affect job satisfaction and work motivation. On the
other hand, there is also evidence that employees are not motivated only by money all the
time (Govindarajulu & Daily, 2004). Non-monetary rewards like paid vacations, time off and
gift certificates could also be effective in motivating employees (Bragg, 2000; Geller, 1991).
Some employees seem to be more sensitive to for example recognition and praise, evidenced
by a study which indicates that employees would do their best if their work was recognized
(Jeffries, 1997). However, money seems to be better able to directly influence behavior than
non-monetary stimulators (Parker & Wright, 2001). For example, in their research, Balkon,
Malkman and Gomez-Meija (2000) examined a relationship between pay and innovative
behavior. CEO short-term monetary compensation is related to innovation, which means that
when CEOs receive more money, they pursue innovation more actively. Since being more
sustainable by reducing CO2 emissions could be compared to being more innovative (Theyel,
2000), it could be assumed that also a positive relationship exists between monetary

18
incentives for CEOs and higher CO2 savings. For a company to become more sustainable, for
instance, innovative actions are required.
3. THEORETICAL FRAMEWORK
3.1 Incentivizing by companies
As discussed in the literature review, some proof exists that incentivizing could ensure
that employees become motivated and reinforced to make environmentally responsible
decisions (Laabs, 1992; Patton & Daley, 1998). The use of incentives could determine how
employees in an organization behave (Baker, Jensen & Murphy, 1988). The challenge for
firms lies in stimulating employees and managers in such a way that they make
environmentally responsible decisions instead of being opportunistic (Fandt & Ferris, 1990).
As employees are the actors within an organization that take decisions, they could be the
essential link towards reducing CO2 emissions (Boiral, 2006). According to Porter and
Lawler (1968), traditional expectancy theories indicate that employees act to obtain
incentives. When their job is to take climate change management within their daily practices,
they are expected to act to it, because they will be rewarded for their specific job.
Consequently, when climate change management is taken seriously by employees and when
sustainability is actively pursued, lower amounts of CO2 emissions could be a logical result.
Although much literature exists about rewarding employees, not many researchers studied the
use of incentives specifically for climate change management. Within this research, the focus
is on incentives specifically based on proactive climate change management. CDP asked
companies if they give incentives for climate change management to employees. This means
that an employee in a company receives incentives if he or she strongly considers climate
change management within their decision making. This study investigated whether giving
incentives specifically for managing climate change leads to becoming a more sustainable

19
company, in terms of less CO2 emissions. Since worldwide CO2 emission reduction is a big
issue large enterprises need to deal with (Newell & Paterson, 1998), emission savings would
be the ultimate expression of better environmental behavior. Combining the findings
mentioned above, we expect a positive effect of rewarding employees specifically for climate
change management on CO2 emission reduction:
H1: Companies that give incentives to employees for actively engaging in climate change
management will reach higher CO2 emission savings than companies that do not give
incentives to employees for climate change management.
In many studies, the level of analysis concerning organizational incentives is at the top
level of the company (Berrony & Gomez-Meija, 2009a). In the present study, the focus is on
different employee types that are incentivized, in order to investigate the effect of rewarding
different kinds of employees within the company for climate change management on CO2
emission savings. According, to the CDP data that we used, some companies give incentives
to the CEO, others to the board of directors and some are giving incentives to all employees
within an organization. Therefore, it is interesting to look at the outcomes of these different
incentive schemes on CO2 emission savings. We investigate whether giving incentives to a
certain employee type is actually effective to reach more sustainability, so we can come up
with an advice for firms to continue with the current incentive system or to adjust it. We
investigate the effects of incentivizing the CEO, the board of directors and all employees in
the organization on CO2 emission reduction.
3.2 CEO incentives
According to agency theorists, CEOs consider it important to engage in activities that
increase their own well-being (Jensen & Murphy, 1990). If the success of certain business
initiatives is linked to their own gains, CEOs might be motivated to engage in these business
initiatives. According to King and Lenox (2002) and Klassen and McLaughlin (1996), firms

20
in polluting sectors should motivate their CEOs to engage in strategies aimed at improving
environmental performance. The challenge for firms is to use incentives in such a way that it
influences the behavior of the CEO, whose aim is maximizing his or her personal utility
(Zajac, 1990). Often, especially top managers feel a certain risk when they are implementing
new, more sustainable technologies to reduce or eliminate emissions, because those
implementation initiatives may fail or lead to quality problems or costs (Klassen & Whybark,
1999; Russo & Fouts, 1997). It is the top manager who will be held responsible for these
consequences. If the top managers are rewarded specifically for making these kind of
environmentally responsible choices, they might be willing to take the risks more easily.
Many researchers acknowledge the relationship between the strategy that a firms
pursues and the compensation packages it uses (Barkema & Gomez-Mejia, 1998). In addition,
the strategic importance of the CEO in large organizations is widely recognized (Lorange,
1980). An interesting topic is how the constitution of a CEO’s compensation package can
support the implementation of a certain strategy and stimulate making strategic environmental
management choices. For example, Sanders and Carpenter (1998) found that companies
pursuing a global diversification strategy use efficient CEO compensation methods that
support and fit the implementation of that strategy. If the firm adopts an emission reduction
strategy, pursuing this strategy can be supported by certain incentivizing methods which
motivate the CEO to become committed to this business strategy. Given the magnitude of the
CEO's potential impact on firm performance (Beatty & Zajac, 1987), it is important that firms
find effective methods to motivate the CEO to act in a way that maximizes firm performance.
According to Makri, Lane and Gomez-Meija (2006), firms seem to perform better when
incentives for CEOs are linked to the financial results of the company as a whole. With this
outcome, one can expect that CEOs are motivated to perform better when they receive extra
incentives for certain behaviors. If CEOs are motivated to engage in climate change

21
management, this will have a direct effect on business practice given the influence CEOs have
on firm strategy. This strategy may include emission reduction practices of the company.
Following the findings mentioned above, we formulated the next hypothesis:
H2a: Companies that incentivize their CEOs for actively engaging in climate change
management will reach higher CO2 emission savings than companies that do not give those
incentives to their CEOs.
3.3 Board incentives
Executives careers are directly tied to the success or failure of the company they work
for (Carter & Lorsch, 2004). Their performance is evaluated by the board of directors, while
on the other hand, the individual performance of board members is not directly evaluated in
most of the companies. It may be important to also monitor performance of board members
because corporate control may lie in hands of individuals or small groups, such as boards
(Finkelstein & Hambrick, 1996). This implies that board members could play an important
role in their companies’ decision making. However, board members often experience social
costs when they threaten the interests of top managers in a company, for example by
participating in management decisions or enforcing changes in business operations that
increase board control over management (Westphal & Khanna, 2003). Therefore, board
members may sometimes experience social pressures and must weigh the social cost against
their own benefits. These pressures could influence board members’ personal motivation and
stimulation. This requires a thoughtful approach towards board members concerning reward,
and implies that they should be actively motivated and involved in the pursuit of important
business strategies, like climate change management. Furthermore, it is the board of directors
that oversees the company and determines which top managers are hired (Shen, 2005; Zajac,
1990). If board members are incentivized for engaging in climate change management, they
may rather choose to hire managers that take an environmentally responsible approach.

22
Lorsch and Maclver (1989) mention that non-executive directors are not always able
to invest time to learn enough about the company they oversee, since sometimes they are
operating in the board of other companies as well. A solution to these problems would be to
provide incentives to board members so that they become more committed to their company
duties (Shen, 2005). Without strong incentives, non-executives such as the board of directors
are less likely to become engaged in corporate duties. One of those duties that is important in
a company nowadays is the management of sustainability or climate change. As board
members play an important role in the formulation of a company’s strategy (Shen, 2005), they
should be actively motivated for and involved in the management of CO2 emission reduction
in order for a firm to reach sustainability goals. Companies that reward their board members
for climate change management, are involving them more in reaching environmental
management goals. We expect that if board members are receiving incentives for climate
change management, the company will engage in more environmentally responsible decision
making, which would lead to a more sustainable company in terms of CO2 emission
reduction. Therefore, the following hypotheses is formulated:
H3a: Companies that incentivize the board of directors for actively engaging in climate
change management reach higher CO2 emission savings than companies that do not give
those incentives to the board of directors.
3.4 General workforce incentives
Govindarajulu and Daily (2004) recommend to actively involve employees at all
levels within the organization in fulfilling environmental improvement goals. In this way, the
organization could reach its sustainability goals most effectively. Shen (2005) looks at the
distribution of rewards from an agency perspective, and states that both non-executive
directors and executives within a company are the so called ‘agents’ of the ‘principals’, which
are the shareholders. He argues that if one group of the agents is rewarded with incentives,

23
also the other group of agents should receive them. To make sure employees stay committed
to company goals and to the organization itself, every working person in the company should
be satisfied with its incentive package (Parker and Wright, 2001). When some part of the
workforce is incentivized and others know they are not, this could create a sense of inequality.
Employees do have certain psychological contracts in mind which refer to their perceptions of
reciprocal obligations (Hartley, 1999; Robinson, 1996; Rousseau, 1989; Shore & Tetrick,
1994). When these obligations are unfairly distributed or differ too much within one
company, this may lead to disharmony. In addition, managers should observe what rewards
motivate employees and customize incentive schemes to suit every employee in the right way
(Barrier, 1996; Geller, 1991).
According to the population ecology view, organizations that stimulate collective
action and let its employees work towards a common goal, are more likely to survive
(Freeman & Hannan, 1990; Hannan & Freeman, 1989). Welbourne and Andrews (1996) state
that collective action signifies the existence of structural cohesion, which is an employee-
generated synergy enabling firms to respond to their environment while still moving forward.
To encourage this collective action, incentives can help to link all employees to the
organization and its mission and can reduce competition within the firm (Lawler, 1981;
Welbourne & Gomez-Mejia, 1995). Frequent communication of environmental programs,
initiatives, and goals of the firm could be supported and strengthened by using incentives, so
employees are motivated to work towards accomplishing these goals (Govindarajulu & Daily,
2004). In this way, everyone in the organization has the same objectives in mind so goals will
be achieved faster and more easily. Top management that is actively improving environmental
responsibility within an organization should strive for a culture that provides all its employees
with the freedom to make environmental improvements (Mallak & Kurstedt, 1996).

24
Following the findings mentioned above, we expect that incentivizing all employees within
the organization for climate change management, will lead to CO2 emission savings.
H4a: Companies that give incentives to all employees in the organization for actively
engaging in climate change management will reach higher CO2 emission savings than
companies that do not incentivize everyone in the organization.
3.5 Monetary incentives
Returning to the strategic perspective on compensation design, a focus exists on the
role that incentive systems can play in helping companies to adapt to the characteristics of the
environment they are operating in (Gomez-Mejia & Balkin, 1992). Incentives can be
implemented in various forms such as monetary rewards and recognition rewards. Examples
of systems that can be used to reward employees for good environmental practices are profit-
sharing programs, award and recognition programs, suggestion programs, benefits and
incentives and increase in pay (Atwater & Bass, 1994; Laabs, 1992; Leitch et al., 1995; Patton
& Daley, 1998). Out of these, monetary rewards are one of the strongest motivators for
employees to engage in activities for environmental improvement (Govindarajulu & Daily,
2004).
Several reasons could be given for why people are attracted by the thought of
receiving extra money (Long & Shields, 2010). First, monetary incentives enable employees
to enhance their own wellbeing and the wellbeing of their families. Second, money enables
people to engage more in social leisure activities, which helps satisfying their higher-level
need of the sense of belonging in groups. Third, monetary rewards provide people with the
opportunity to purchase status symbols, which satisfies the need for respect from others.
Fourth, the higher-level need to achieve mastery can be satisfied by engaging in costly
trainings, development or higher education. Finally, money itself is often valued as a symbol
25
of one’s social status (Saleh & Singh, 1973) and monetary incentives are perceives as a
recognition for doing a good job (Trank, Rynes, & Bretz, 2002).
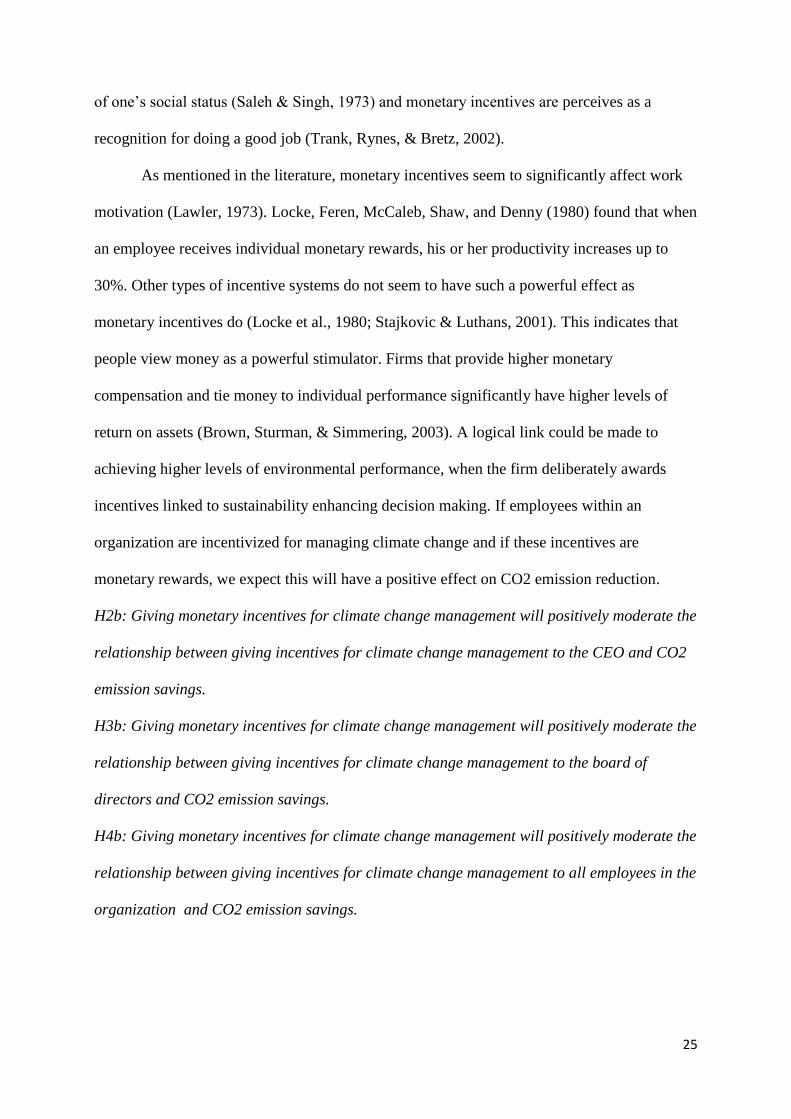
As mentioned in the literature, monetary incentives seem to significantly affect work
motivation (Lawler, 1973). Locke, Feren, McCaleb, Shaw, and Denny (1980) found that when
an employee receives individual monetary rewards, his or her productivity increases up to
30%. Other types of incentive systems do not seem to have such a powerful effect as
monetary incentives do (Locke et al., 1980; Stajkovic & Luthans, 2001). This indicates that
people view money as a powerful stimulator. Firms that provide higher monetary
compensation and tie money to individual performance significantly have higher levels of
return on assets (Brown, Sturman, & Simmering, 2003). A logical link could be made to
achieving higher levels of environmental performance, when the firm deliberately awards
incentives linked to sustainability enhancing decision making. If employees within an
organization are incentivized for managing climate change and if these incentives are
monetary rewards, we expect this will have a positive effect on CO2 emission reduction.
H2b: Giving monetary incentives for climate change management will positively moderate the
relationship between giving incentives for climate change management to the CEO and CO2
emission savings.
H3b: Giving monetary incentives for climate change management will positively moderate the
relationship between giving incentives for climate change management to the board of
directors and CO2 emission savings.
H4b: Giving monetary incentives for climate change management will positively moderate the
relationship between giving incentives for climate change management to all employees in the
organization and CO2 emission savings.

26
Figure 1. Theoretical framework
4. METHOD AND STATISTICAL RESULTS
In the following section the research design and methods are described. First, a description
of the sample and the data collection is given. Second, the different kinds of variables used in
the statistical analyses are explained. Following on this section, the results of this research
will be presented.
4.1. Sample and data collection
The method used for this research is database analysis where, on the basis of the
collected data, statistical analysis in SPSS will be carried out. For this study, data from the
Carbon Disclosure Project (CDP) is used. Besides, for some of the control variables, the
database Datastream is used. CDP has collected extensive annual information related to climate
change management and sustainability practices from companies worldwide. As stated on their

27
website: “CDP is the only global disclosure system for companies, cities, states and regions to
manage their environmental impacts and for investors or purchasers to access environmental
information for use in financial decisions” (CDP, 2016). For about 15 years, CDP has been
working together with companies to take initiatives and actions towards a more sustainable
world. CDP argues than when companies are aware of their environmental risk, they will be
better able to manage it in a strategic way. When companies disclose this information, decision
makers are provided with reliable data which is important to drive sustainable action (CDP,
2016). CDP has collected data from about 3000 different companies worldwide, where data is
obtained from headquarters. Different questionnaires are filled in by these companies, revealing
information about their sustainability initiatives and practices and CO2 emissions. The CDP
data we used for this study contains information about what type of employees in a company is
rewarded for actively engaging in climate change management, what type of incentives
companies use to do this and how much CO2 is emitted in 2013 and 2014.
The data we got at our disposal for this study is data from the years 2013 and 2014.
For the independent variables, the control variables and the moderating variable we used data
from 2013, and for the dependent variable we also used data from 2014, to measure the
percentage change in CO2 emissions between 2013 and 2014. Useful variables for this
research are selected out of this data and coded into usable formats for the analysis in this
study. More about this will follow in the next sections.
4.2. Measures
4.2.1 Independent variables
Within this study, three independent variables exist which include the different
organizational employee types or groups that are incentivized for climate change management.
For this study, we focused on the employee types or groups that are most commonly rewarded
for climate change management in the CDP dataset of firms, which are the CEO, the board of

28
directors and all employees in the organization. For every employee type or group, the question
was asked if this group or person within the organization receives incentives when he or she
actively engages in climate change management, yes or no. In this way, three dummy variables
are created where 1 means ‘yes’ and 0 means ‘no’.
4.2.2 Dependent variable
The dependent variable within this research is CO2 emission savings of a company.
To construct this variable, a company’s amount of CO2 emissions in metric tonnes in 2014 is
compared to the amount of CO2 emissions in metric tonnes in 2013, in terms of the
percentage change. In this way, something can be said about the improvement or the
deterioration concerning the amount of CO2 a company emits in a year. This dependent
variable will be used as an indicator of how environmentally responsible a company is. By
calculating relative differences in CO2 emissions per company, reliable comparisons between
firms could be made. Due to available data about CO2 emissions for both the years 2013 and
2014, the difference between two years could be calculated. The percentage of change
between these two years is computed with the following formula: 2014 – 2013 / 2013 * 100,
where at the place of 2013 and 2014 the absolute number of emitted CO2 by the company of
these years is filled in. If the outcome turns out to be negative, this indicates that the company
emitted less CO2 in 2014 than in 2013 and CO2 emission savings take place. If it is a positive
number, it suggests an increase of CO2 emissions in 2014 compared to 2013. The effect of all
three independent variables on the dependent variable will be separately tested by hierarchical
regression, controlling for control variables.
4.2.3 Moderating variable
Besides information about if a certain employee type is rewarded within a company,
we also have data about which specific incentive type a company generally uses to reward
employees for climate change management. The incentive type we focus on is monetary

29
incentives. For every company that gives rewards for climate change management, the
question was asked if they give monetary incentives, yes or no. For the moderating variable, a
dummy variable is created where 1 is ‘yes’ and indicates that a firm gives monetary incentives
for the management of climate change, and 0 is ‘no’ and indicates that a firm does not give
money as incentive, but implies that the firm uses a non-monetary incentive type for climate
change management. Because in our sample we focused on firms that only use one type of
incentive for climate change management, monetary or non-monetary, we can investigate the
effect of giving monetary contrary to giving non-monetary incentives. With monetary
incentives as the moderator in this study, we will additionally investigated if giving monetary
incentives strengthens or weakens the relationships between the independent and dependent
variables. Within this research, we hypothesized that awarding monetary incentives positively
moderates, or strengthens, the relationship between de independent and dependent variables.
4.2.4 Control variables
Within this research, also some control variables are important. In the current sample,
companies from different kinds of industries exist. Obviously, large differences exist between
industries concerning their CO2 emission. For example, the financial sector in general is
much less polluting than the energy industry (Nieland et. al., 2013). This bias firstly has been
reduced by looking at the relative improvement or deterioration of a company between two
years. Next to that, in this analysis is controlled for industry type. CDP distinguishes the
following ten different types in the sample: utilities, health care, financials, industrials,
consumer discretionary, consumer staples, IT, telecom, materials, energy. These different
industry types are coded into dummy variables, where a 0 indicates ‘no’ and a 1 indicates
‘yes’. Besides differing industries, companies in our sample operate in different countries all
over the world. Also the geographic location of a company could make a significant
difference concerning environmental performance. Because our sample contains firms located

30
in many different countries all over the world, firms are categorized per continent. To control
for geographic region, six different continents are distinguished: Europe, Asia, USA, Africa,
Latin America and Australia. These control variables are also coded into dummies, where 1
indicates ‘yes’ and 0 indicates ‘no’. Within this study, we chose not to categorize per country
but per continent, because there exist many different countries in our sample. When a dummy
variable has to be created for every country, this would result in a large amount of dummy
variables in our analysis. Additionally, for some countries there are very few firms and so it
makes sense to cluster them into a higher-level category, such as continent. Next to these
variables, also firm size, firm profitability and a firm’s debt could count as important
variables. Therefore, within this study we also control for a firm’s number of employees,
return on assets and debt ratio.
4.3 Results
Table 1 and 2 present some descriptives and frequencies of the data and variables used
within this study. Companies in our sample emitted together on average less CO2 in 2014
than in 2013, with a mean decrease of -2043545.90 of CO2 emissions in metric tonnes in
absolute numbers. As shown in table 1, the mean percentage change of CO2 emissions in
2013 and 2014 is -35.22% (SD = 15.91). Out of the total sample of 275 companies, 239 are
providing incentives to their employees for climate change management. Out of the 239 firms
that incentivize employees for this sustainable behavior, 189 give monetary incentives and 86
companies give non-monetary incentives. Within our sample, 172 firms incentivize their
CEO, 144 firms incentivize their board of directors and 123 of the companies give incentives
for climate change management to all employees in the organization. Most companies in our
sample are part of the financial industry, including 58 companies. The energy sector is the
industry type that contains the lowest number with 8 firms. Europe is the geographical region
where most of the companies in our sample are located in, with a number of 118 companies.

31
Following on that, 70 companies are located in the USA and 65 in Asia. Few companies are
located in Africa (8), Australia (8) and Latin America (6).
Variable N Min Max Mean St dev
Debt Ratio 275 00.50 147.58 44.83 25.01
Return on Assets 275 -14.83 39.21 4.60 5.71
Total Employees 275 12 537784 42454.35 69997.16
CO2 savings percentage change 275 -99.99 6919.47 -35.22 15.91
Variable N
Incentives 239
CEO Incentives 172
Board Incentives 144
All employees incentives 123
Monetary incentives 189
Financial Industry 58
Industrials Industry 54
Utilities Industry 24
Healthcare Industry 14
Consumer Discretionary Industry 31
Consumer Staples Industry 20
IT Industry 31
Material Industry 22
Energy Industry 8
Telecom Industry 13
Asia 65
USA 70
Europe 118
Africa 8
Australia 8
Latin America 6
Table 2. Descriptive statistics: dummy variables
Table 1. Descriptive statistics: means and standard deviations

32
To check for multicollinearity, correlations between the independent and control
variables are computed. None of the predictors that are put together in the same regression
model have a correlation higher than 0.5, which is an indicator that no multicollinearity issues
exist in this study. Also in our multiple regression analyses the tolerance level was above 0.2
and the variance inflation factor (VIF) shows a level of around 1.1 for all variables, which
supports the assumption that multicollinearity is not an issue in this research. Some of the
independent variables do correlate strongly, but they are never used within the same
regression model, they are tested independently of each other. The effects of all three
variables, CEO incentives, board incentives and all employees incentives, on CO2 emission
savings are tested separately. In table 3 the Pearson correlations are showed.

33
1 2 3 4 5 6 7 8 9 10 11 12 13 14 15 16 17 18 19 20 21 22 23 24 25
1. Number of
employees
1
2. Return on
Assets
-.03 1
3. Debt ratio .05 -.17** 1
4. Industrials -.01 -.15* -.08 1
5. Utilities -.13* -.05 -.07 -.15* 1
6. Healthcare .04 .18** -.05 -.11 -.07 1
7. Consumer
discretionary
.11 .06 -.07 -.18** -.11 -.08 1
8. Consumer
staples
.19** .21** -.08 -.14* -.09 -.07 -.10 1
9. Financials -.07 -.19** .41** -.26** -.16** -.12* -.18** -.15* 1
10. IT .02 .04 -.11 -.18** -.11 -.08 -.13* -.10 -.18** 1
11. Materials -.08 -.01 -.08 -.15* -.09 -.07 -.11 -.08 -.15* -.11 1
12. Energy -.03 .09 -.02 -.09 -.05 -.04 -.06 -.05 -.09 -.06 -.05 1
13. Telecom -.03 .06 -.04 -.11 -.07 -.05 -.08 -.06 -.12 -.08 -.07 -.04 1
14. Asia -.06 -.16** -.12 .16** -.17** -.05 .02 .01 -.08 .18** -.10 -.05 -.03 1
15. USA .07 .13* .03 -.10 .12 .06 .03 -.04 -.04 .03 -.02 .05 -.01 -.33** 1
16. Europe .03 -.02 .07 -.04 .02 .00 -.01 .01 .07 -.12* .04 -.02 .05 -.48** -.51** 1
17. Africa -.04 .08 -.06 .02 -.05 -.04 -.06 .04 -.04 -.06 .27** -.03 -.04 -.10 -.10 -.15* 1
18. Australia -.05 .02 .08 -.03 -.05 .06 -.06 .04 .12* -.06 -.05 .10 -.04 -.10 -.10 -.15* -.03 1
19. Latin
America
-.06 .05 -.02 -.01 .22** -.04 .03 -.04 -.02 -.05 -.04 -.03 -.03 -.08 -.09 -.13* -.03 -.03 1
20. Incentives .15* -.05 .05 .06 -.11 -.01 .07 -.02 -.04 -.03 .04 .03 .04 .09 .04 -.08 .07 .07 -.16** 1
21. CEO
incentives
.11 -.04 -.01 .12 -.03 .01 -.03 .04 -.10 -.06 .01 .05 .03 .15* -.07 -.03 -.05 .09 -.19** n.a. 1
22. Board
incentives
.12* -.08 .03 .12* -.07 -.04 .02 .02 -.08 .02 -.01 -.01 .01 .24** -.08 -.09 -.01 -.01 -.16** n.a. .61** 1
23. All
employees
incentives
.02 -.11 .04 .14* -.10 -.01 .03 -.06 -.05 .05 -.05 -.03 .01 .34** -.07 -.13* -.16** -.03 -.13* n.a. .67** .84** 1
24. Monetary
incentives
.19** -.05 .10 .08 -.10 .01 -.01 -.02 -.11 -.01 .08 .02 .11 .04 -.06 .01 .02 .12 -.17** n.a. .50** .41** .34** 1
25. CO2
savings
-.06 -.01 -.05 .03 .03 -.05 .02 -.05 .02 -.07 -,05 .10 .02 .09 .02 -.12 -.03 .07 -.01 -.10 .02 -.02 .01 -.02 1
Table 3. Pearson correlations

34
In the first hypotheses is formulated that companies that provide incentives for climate
change management, reach higher CO2 savings than companies which do not provide those
incentives for climate change management. The first hierarchical regression analysis in this
research is carried out with the complete sample of 275 companies and the independent
variable providing incentives yes or no, controlled for all the control variables return on
assets, total employees, debt ratio, geographic region and industry type. Model 1 would
explain 5.1% of the variance in CO2 emission savings but was not significant F (17, 257) =
.820; p >.05 and model 2, which includes giving incentives, would explain 6.2% of the
variance but was also not significant F (18, 256) = .946; p >.05. With this outcome,
hypothesis 1 is rejected.
For the rest of the analysis, we only looked at companies which do provide incentives,
so the ones which do not incentivize employees for climate change management are left out of
the sample, resulting in 239 companies. In the second hypothesis it is predicted that when
companies give incentives to their CEO for climate change management, this will lead to
higher CO2 savings than companies that do not incentivize their CEO. Again, an hierarchical
regression is carried out with all the control variables and the independent variable CEO
incentives. When CEO incentives is added to the model, it would explain 7.8% of the
variance, but was not significant F (18, 220) = 1.039; p >.05. This results in a rejection of
hypothesis 2a. To test hypothesis 2b, the moderating effect of monetary incentives on the
relationship between CEO incentives and CO2 emission savings is tested. To run this
analysis, an interaction variable was created between monetary incentives and CEO
incentives. After entering the moderating variable monetary incentives and the variable
measuring the interaction between CEO incentives and incentive type, the model as a whole
would explain 8.1% of the total variance, F (20, 218) = .965, p > 0.05, but this result was not
significant. Also hypothesis 2b is rejected.

35
In the third hypothesis it is stated that if firms give incentives for climate change
management to the board of directors, this will lead to higher CO2 emission savings than
when companies do not incentivize their board. When the variable board incentives is added
to the model, it would explain 7.6% of the variance in CO2 emissions but it was not
significant F (18, 220) = 1.002; p >.05. Hypothesis 3a is rejected. After creating the
interaction variable between board incentives and monetary incentives, we tested the
moderation. The model would explain 8.1% of the variance in CO2 but was not significant F
(20, 218) = .966; p >.05. Hypothesis 3b is also rejected.
In the fourth hypothesis we formulated that giving incentives for climate change
management to all employees in the organization would lead to higher CO2 emission savings
than when companies do not incentivize all employees. When all employees incentives is
added to the model, it would explain 7.8% of the variance in CO2 emissions but it was not
significant F (18, 220) = 1.003; p >.05. Therefore, we have to reject hypothesis 4a. Also to
test this moderation the interaction variable is constructed between all employees and
monetary incentives. Adding these moderating and interaction variable results in an increase
to 8.4% of explanation but also this result was not significant F (20, 218) = .999; p >.05.
Hypothesis 4b is rejected.

36
Variables Model 1
CVs
Model 2
Hypothesis 1
Model 3
Hypothesis 2a
Model 4
Hypothesis 3a
Model 5
Hypothesis 4a
Control variables
Number of Employees -.028(-.434) -.012(-.190) -.041(-.584) -.040(-.571) -.036(-.520)
Return on Assets .011(.163) .010(.139) .036(.489) .037(.497) .038(.514)
Total Debt%Total Capital -.092(-1.331) -.079(-1.153) -.007(-.096) -.010(-.136) -.012(-.156)
Industrials -.173(-1.112) -.174(-1.120) -.262(-1.563) -.266(-1.582) -.270(-1.610)
Utilities -.081(-.671) -.089(-.740) -.154(-1.262) -.153(-1.256) -.152(-1.250)
Healthcare -.175(-1.777) -.176(-1.796) -.240*(-2.285) -.242*(-2.303) -.246*(-2.341)
Consumer Disctretionary -.141(-1.103) -.137(-1.074) -.201(-1.434) -.210(-1.499) -.212(-1.516)
Consumer Staples -.174(-1.560) -.181(-1.625) -.243*(-2.068) -.245*(-2.080) -.244*(-2.072)
Financials -.165(-1.038) -.173(-1.093) -.375*(-2.237) -.384*(-2.290) -.387*(-2.309)
IT -.252*(-1.965) -.258(-2.018) -.315*(-2.325) -.324*(-2.397) -.326*(-2.416)
Material -.161(-1.384) -.160(-1.378) -.253*(-2.021) -.255*(-2.040) -.257*(-2.058)
Telecom -.079(-.807) -.077(-.793) -.131(-1.237) -.133(-1.255) -.134(-1.262)
Energy
Asia -.131(-.684) .187(.965) .018(.066) .044(.165) .025(.093)
USA .080(.420) .128(.664) .066(.249) .090(.342) .082(.312)
Europe .002(.009) .051(.236) -.057(-.191) -.026(-.089) -.034(-.116)
Africa -.004(-.046) .022(.228) -.013(-.104) -.008(-.063) -.002(-.012)
Australia .085(.903) .112(1.173) .102(.809) .118(.945) .116(.935)
Latin America
Independent variables
Incentives (y/n) -.110(-1.724)
CEO incentives .063(.924)
Board incentives .033(.488)
All employees incentives .062(.869)
Moderating variable
Monetary incentives
Interaction variables
CEO x Monetary
Board x Monetary
All employees x Monetary
R2 .051 .062 .078 .076 .078
Adjusted R2 -.011 -.004 .003 .001 .003
F-statistic .820 .946 1.039 1.002 1.033
P-value .669 .524 .417 .458 .432
Table 4. Results of hierarchical regression with CO2 emission savings as dependent variable

37
Variables Model 6
Hypothesis 2b
Model 7
Hypothesis 3b
Model 8
Hypothesis 4b
Control variables
Number of Employees -.047(-.673) -.051(-.723) -.045(-.635)
Return on Assets .037(.497) .039(.520) .042(.563)
Total Debt%Total Capital -.011(-.141) -.011(-.149) -.015(-.193)
Industrials -.267(-1.583) -.278(-1.645) -.284(-1.682)
Utilities -.157(-1.278) -.156(-1.277) -.159(-1.301)
Healthcare -.242*(-2.299) -.245*(-2.329) -.251*(-2.387)
Consumer Discretionary -.203(-1.440) -.215(-1.526) -.219(-1.557)
Consumer Staples -.240*(-2.028) -.237*(-2.000) -.239*(-2.022)
Financials -.371*(-2.202) -.388*(-2.294) -.392*(-2.322)
IT -.318*(-2.340) -.331*(-2.440) -.336*(-2.471)
Material -.257*(-2.048) -.264*(-2.103) -.265*(-2.115)
Telecom -.137(-1.288) -.143(-1.341) -.144(-1.356)
Energy
Asia .015(.058) .042(.157) .022(.081)
USA .067(.252) .096(.361) .088(.332)
Europe -.060(-.202) -.033(-.113) -.039(-.133)
Africa -.016(-.128) -.006(-.046) -.003(-.025)
Australia .095(.746) .110(.871) .110(.870)
Latin America
Independent variables
Incentives (y/n)
CEO incentives -.007(-.051)
Board incentives -.082(-.550)
All employees incentives -.070(-.453)
Moderating variable
Monetary incentives .013(.127) .012(.127) .006(.069)
Interaction variables
CEO x Monetary .081(.482)
Board x Monetary .134(.772)
All employees x Monetary .153(.885)
R2 .081 .081 .084
Adjusted R2 -.003 -.002 .001
F-statistic .965 .966 .999
P-value .506 .504 .465

38
5. DISCUSSION
5.1 Academic relevance
Within this paper it is made clear that our society of today needs to take measures for
reducing global warming. If we do nothing and continue emitting CO2 at the current rate, our
climate, nature and world will change with dramatic consequences (Hirabayashi et. al., 2008;
IPCC, 2014; IPCC, 2007). Due to increasing temperatures, sea levels keep on rising during
this century, stronger and more frequent hurricanes and storms will occur which have the
power to destroy people’s houses or even entire city’s, floods and droughts will become more
common and diseases such as malaria will be spread more easily (IPCC, 2007). In view of
these disastrous consequences our world is currently experiencing and awaiting, sustainable
development is an important aspect for today’s business (Cerin & Karlson, 2002).
The aim of this study was to find out what incentivizing system could be helpful for
companies to reduce their CO2 emissions. Since companies are entities which could have a
large impact, they should not be seen as just the polluters of our earth, but rather as a part of
the solution towards more sustainability (Boiral, 2006). For example, big multinational
companies with massive production processes, large buildings and goods could emit huge
amounts of CO2 which strongly contribute to global warming. Therefore, from our point of
view, companies should actively search for effective ways in which they can contribute to the
management of climate change. Building on the literature we found, we believe that
incentives are useful to motivate employees in a certain way for the achievement of company
goals. Thanks to the CDP, we obtained data from companies which disclosed information
about their CO2 emissions. We also used their data about companies that reward employees
with specific incentives for the management of climate change. In our literature section, we
have written about how incentives can influence people to act in a certain way (Baker, Jensen
& Murphy, 1988; Berrone & Gomez-Mejia, 2009a; Read, 2005; Long & Shields, 2010). On

39
the basis of existing theories, we believe that employees in general are indeed sensitive to
receiving rewards. In addition to that, we also found some proof in literature that incentives
can be used as a motivator to make employees act more environmentally responsible (Laabs,
1992; Patton & Daley, 1998). However, not much research exists about incentives specifically
linked to climate change management, and the effect of giving those incentives on the CO2
emission reduction of companies. This gap in the literature was the driver for our study. Using
CDP data about different incentivized employee types and different types of incentives for
climate change management, we tested if this reward method was effective for achieving
lower amounts of CO2 emissions.
5.2 Managerial implications
Unfortunately, we did not find any significant results following on the expectations we
formulated. We did not find significant differences in CO2 emissions between companies that
do and do not give incentives for climate change management. Also, firms incentivize their
CEO, the board of directors and firms that incentivize everyone in the organization for climate
change management, do not significantly reach higher CO2 emission savings than firms that
do not incentivize those workers. Furthermore, giving monetary rewards does not lead to
significant differences in our study. Due to these findings, we were obliged to reject all of our
hypotheses. However, enough proof exists for the assumption that incentives can be effective
to motivate people in the organization to work towards certain company goals (e.g. Read,
2005; Baker, Jensen & Murphy, 1988; Porter & Lawler, 1968). In this study, these company
goals concern sustainability objectives, and incentives are linked to engaging in climate
change management practices. We can doubt the fact if companies should reward employees
for climate change management, as it may not be an effective way to achieve sustainability in
terms of CO2 emissions of companies. Companies should also rethink who they reward for
climate change management, because different types of employees may respond differently to
40
incentives. Like mentioned earlier within this paper, Russo & Harrison (2005), for instance,
found a difference in reaction on incentives between facility managers and environmental
quality managers. Evidently, significant outcomes of rewarding may exist for types of
employees other than studied within this research. Furthermore, although money is proven to
be an efficient driver for employees to engage in certain activities (e.g. Clark & Wilson, 1961;
Govindarajulu & Daily, 2004), it may probably not be applicable to the case of climate
change management and CO2 emission reduction. We recommend companies to look for
other methods to reduce CO2 emissions than giving incentives to employees for climate
change management.
5.3 Limitations and future research
Several reasons could be given for why our research may not have led to the findings
we expected to obtain. Concluding from our findings, it may not be right to link awarding
employee incentives for the management of climate change to reducing CO2 emissions.
Possibly, incentivizing employees for climate change management may lead to other
outcomes instead of CO2 emission reduction of the company. A closer look within the
company is necessary to investigate what direct effect incentivizing employees for climate
change management has on the practice of its business. Furthermore, we did not have precise
information about the nature and the extent of the incentives. Because we do not have a clear
view of how frequent, at what times and how many incentives are awarded, discrepancies
may exist between the companies in our sample. For example, the amount of money used as
incentive by one company could be higher than the amount of money used by another. This
could possibly be a disturbing factor in our analyses. In addition, Govindarajulu and Daily
(2004) mention that incentives alone would not lead to significant environmental
improvement, but that they need to be given in combination with feedback, empowerment and
clear communication. We did not have information about those practices within companies in

41
our sample. Moreover, climate change management is a broad concept and implementation of
it may strongly differ between companies, since some people may give meaning to
management of sustainability practices in a completely different way than others. Those
management decisions can vary widely from, for instance, reforestation activities to offset
GHG emissions, to investments in clean technologies or implementation of energy efficiency
programs (Boiral, 2006). This needs to be explored in more detail in further research.
Another important limitation of our study is the time frame used to investigate
the effect incentives could have on CO2 emission savings. Due to limited access to data, we
only had information about the years 2013 and 2014. Therefore, the difference in CO2
emissions was solely based on two consecutive years and this difference was used as an
indicator showing to what extent a company improved its sustainability. In addition to that,
we did not know for how long the companies in our sample have been rewarding their
employees for climate change management.
Furthermore, the sample can contain bias as only companies which voluntarily
disclosed their sustainable data to CDP were used within this study. This means that some
companies could be excluded from this research, which may be the companies that are not
actively engaging in climate change management. Those firms might be hesitant to reveal
information about their pollutive activities or about disappointing efforts they made
concerning the improvement of their company’s sustainability. A possible explanation for this
hesitation relates to the phenomena of greenwashing. Greenwashing means that firms create
an image of being environmentally responsible, by giving false and misleading information
(Vos, 2009). Furthermore, some companies were deleted from the sample because their data
contained missing variables. For instance, some firms only filled in their amount of CO2
emissions for either 2013 or 2014, which eliminates the possibility to calculate CO2 emission
savings for those companies. In addition to that, for our research we were dependent on

42
secondary data obtained by CDP, who generated questionnaires which were filled in by
companies themselves, established worldwide. The risk of receiving unreliable information
from the company may exist since some respondents, answering on behalf of the company,
might not possess the right information, could interpret questions wrongly or might give false
answers.
Also, since we controlled for six geographic regions in our analyses, the geographic
scope might have been too broad. For instance, in Asia large differences in CO2 emissions
seem to exist between on the one hand China, and on the other hand Thailand, Taiwan and
Indonesia (Worrell et. al., 2001). Within this research, we controlled for geographic regions
such as the entire continent of Asia, which may ignore significant differences between
companies within one continent. In Europe as well there seem to exists disparities in CO2
emissions between different countries (Martínez-Zarzoso, Bengochea-Morancho & Morales-
Lage, 2007). Further research is necessary to investigate potential differences between
separate countries.
A final limitation which could be mentioned concerns the fact that we focused only on
one type of incentivized employee per analysis, regardless if other employee types within the
organization were also incentivized. Due to high correlation between the variables CEO
incentives and board incentives, creating an interaction variable may cause a risk of
multicollinearity. In future research, the effect of incentivizing specific combinations of
different employee types could be studied.
6. CONCLUSION
Due to the threat of global warming, firms are experiencing increasing pressures to reduce
their CO2 emissions and are expected to engage in climate change management practices.
Awarding incentives to employees is proven to be an effective method for motivating and

43
stimulating them to work towards certain company goals. However, hardly any research exists
about rewarding employees specifically for climate change management and its effect on CO2
emission reduction. This study investigated if companies that reward their employees for
climate change management reach CO2 emission savings. Contrary to our expectations, we
did not find any significant differences between firms that do and do not give employee
incentives for climate change management, in terms of reaching CO2 emission savings. Also,
no significant results were found for the effect of rewarding the CEO, the board of directors
and all employees within the organization on CO2 emission savings. Additionally, we did not
find significant evidence for our expectation that monetary incentives for climate change
management are more effective than non-monetary incentives to reduce CO2 emissions.
Several important limitations of this study could be highlighted. Since we only used data from
two years to measure the change in CO2 emissions, longitudinal research is necessary to
investigate long-term effects of rewarding employees for climate change management.
Moreover, this study only includes firms that voluntarily disclosed information about their
sustainability practices and CO2 emissions, which may create bias. Firms that are not willing
to reveal this type of information may show significant differences opposed to firms that do
disclose information about climate change management and CO2 emissions. Furthermore, due
to lack of a clear and consistent meaning of organizational climate change management
implementations and lack of information regarding the specifics of the incentives, further and
more detailed research is necessary.
ACKNOWLEDGEMENT
I would like to thank dr. Daniel Waeger, my supervisor at the University of Amsterdam, for
the helpful guidance during writing this thesis.

44
LITERATURE
Argyris, C. (1998). Empowerment: the emperor’s new clothes. Harvard Business
Review, 98-105.
Atwater, D. C., & Bass, B. (1994) “Transformational leadership in teams”, in B. M.
Bass, & B. J. Avolio (Eds.), Improving Organizational Effectiveness through
Transformational Leadership (pp. 48-83). London: Sage Publication.
Baker, G. P., Jensen, M. C., & Murphy, K. J. (1988). Compensation and incentives:
Practice vs. theory. The journal of Finance, 43(3), 593-616.
Balkin, D., Markman, G., & Gomez-Mejia, L. (2000). Is CEO Pay in High-
Technology Firms Related to Innovation? The Academy of Management Journal, 43(6), 1118-
1129.
Barkema, H., & Gomez-Mejia, L. (1998). Managerial Compensation and Firm
Performance: A General Research Framework. The Academy of Management Journal, 41(2),
135-145.
Beatty, R. P., & Zajac, E. J. (1987). CEO change and firm performance in large
corporations: Succession effects and manager effects. Strategic Management Journal, 8(4),
305-317.
Berrone, P., & Gomez-Mejia, L. R. (2009a). Environmental performance and
executive compensation: An integrated agency-institutional perspective. Academy of
Management Journal, 52(1), 103-126.
Berrone, P., & Gomez‐Mejia, L. R. (2009b). The pros and cons of rewarding social
responsibility at the top. Human Resource Management, 48(6), 959-971.
Bloom, M., & Milkovich, G. T. (1998). Relationship among risk, incentive pay, and
organizational performance. Academy of Management Journal, 41, 283–297.

45
Boiral, O. (2006). Global warming: should companies adopt a proactive strategy?.
Long Range Planning, 39(3), 315-330.
Bragg, T. (2000). How to reward and inspire your team. IIE Solutions, 32(8), 38-38.
Buysee, K., & Verbeke, A. (2003). Proactive environmental strategies: A stakeholder
management perspective. Strategic Management Journal, 24(5), 453–470.
Cairncross, F. (1991). Costing the Earth, Harvard Business School Press, Boston.
Cameron, J., & Pierce, W. D. (1994). Reinforcement, reward, and intrinsic motivation:
A meta-analysis. Review of Educational research, 64(3), 363-423.
Carroll, A. B. (1991). The pyramid of corporate social responsibility: Toward the
moral management of organizational stakeholders. Business horizons, 34(4), 39-48.
Carter, C.B., & J.W. Lorsch .2004. Back to the Drawing Board. Designing Corporate
Boards for a Complex World. Harvard Business School Press. Boston Massachusetts.
CDP (2016, November 15). Retrieved from https://www.cdp.net/en
Cerin, P., & Karlson, L. (2002). Business incentives for sustainability: a property
rights approach. Ecological Economics, 40(1), 13-22.
Clark, P. B., & Wilson, J. Q. (1961). Incentive systems: A theory of organizations.
Administrative Science Quarterly, 6(2), 129-166.
Clarkson, P. M., Li, Y., Richardson, G. D., & Vasvari, F. P. (2011). Does it really pay
to be green? Determinants and consequences of proactive environmental strategies. Journal of
Accounting and Public Policy, 30(2), 122-144.
Coombs, J. E., & Gilley, K. M. (2005). Stakeholder management as a predictor of
CEO compensation: Main effects and interactions with financial performance. Strategic
Management Journal, 26(9), 827-840.
Daily, C. M., Johnson, J. L., Ellstrand, A. E. (1996). Boards of Directors: A Review
and Research Agenda. Journal of Management 1996, 22(3), 409-438.

46
Deephouse, D. L. (1999). To be different, or to be the same? It’s a question (and
theory) of strategic balance. Strategic management journal, 20(2), 147-166.
Dyllick, T., & Hockerts, K. (2002). Beyond the business case for corporate
sustainability. Business strategy and the environment, 11(2), 130-141.
Epstein, M. J., & Roy, M. J. (1997). Using ISO 14000 for improved organizational
learning and environmental management. Environmental Quality Management, 7(1), 21-30.
Fandt, P. M., & Ferris, G. R. (1990). The management of information and
impressions: When employees behave opportunistically. Organizational Behavior and Human
Decision Processes, 45(1), 140-158.
Finkelstein, S., & Boyd, B. K. (1998). How much does the CEO matter? The role of
managerial discretion in the setting of CEO compensation. Academy of Management
journal, 41(2), 179-199.
Finkelstein, S., & Hambrick, D. C. (1996). Strategic leadership: Top executives and
their effects on organizations. South-Western Pub.
Forman, M., & Jorgensen, M. S. G. (2001). The social shaping of the participation of
employees in environmental work within enterprises-experiences from a Danish
context. Technology Analysis & Strategic Management, 13(1), 71-90.
Freeman, R. E. 1984. Strategic management: A stakeholder approach. Boston:
Pitman.
Freeman, J., & Hannan, M. T. (1990). Technical change, inertia, and organizational
failure. Department of Sociology, Cornell University.
Friedman, M. (1970). The social responsibility of business is to increase its profits.
New York, 122-124.
Frosch, R. A., & Gallopoulos, N. E. (1989). Strategies for manufacturing. Scientific
American, 261(3), 144-152.

47
Fruitiere, C. (2014, December 11). Why companies need emissions reduction targets:
the key to a low-carbon economy. Retrieved from https://www.cdp.net/CDPResults/Carbon-
action-report-2014.pdf
Gabel, H. L., & Sinclair-Desgagné, B. (1993). Managerial incentives and
environmental compliance. Journal of Environmental Economics and Management, 24(3),
229-240.
Gladwin, T. N., Kennelly, J. J., & Krause, T. S. (1995). Shifting paradigms for
sustainable development: Implications for management theory and research. Academy of
management Review, 20(4), 874-907.
Geller, S. (1991). Safety first. Incentive, December, 59-61.
Gottlieb, R. (1995). Reducing toxics: A new approach to policy and industrial
decisionmaking. Washington, DC: Island Press.
Govindarajulu, N., & Daily, B. F. (2004). Motivating employees for environmental
improvement. Industrial Management & Data Systems, 104(4), 364-372.
Hambrick, D. C., & Jackson, E. M. (2000). Outside directors with a stake: The
linchpin in improving governance. California Management Review, 42(4), 108-127.
Hannan, M. T., & Freeman, J. (1989). Organizational ecology. Cambridge, MA:
Harvard University Press.
Hart, S. L. (1995). A natural-resource-based view of the firm. Academy of
Management Review, 20(4), 986– 1014.
Hart, S. L., & Ahuja, G. (1996). Does it pay to be green? An empirical examination of
the relationship between emission reduction and firm performance. Business strategy and the
Environment, 5(1), 30-37.
Hartley, J. (1999). Models of job insecurity and coping strategies of organizations. In
J. E. Ferrie, M. G. Marmot, J. Griffiths, & E. Ziglio (Eds.), Labour market changes and job
48
insecurity: A challenge for social welfare and health promotion (pp. 127–149). Copenhagen:
WHO Regional Publications.
Henriques, I., & Sadorsky, P. (1999). The relationship between environmental
commitment and managerial perceptions of stakeholder importance. Academy of management
Journal, 42(1), 87-99.
Hirabayashi, Y., Kanae, S., Emori, S., Oki, T., & Kimoto, M. (2008). Global
projections of changing risks of floods and droughts in a changing climate. Hydrological
Sciences Journal, 53(4), 754-772.
IPCC (2007). Climate change 2007: synthesis report. Contribution of Working Groups
I, II and III to the Fourth Assessment Report of the Intergovernmental Panel on Climate
Change (Core Writing Team, Pachauri R. K., & Reininger A., eds.), pp. 104. IPCC, Geneva,
Switzerland.
Jeffries, R. (1997). Reaping the rewards of recognition. HR Focus, 74(1), 9-10.
Jensen, M. C., & Murphy, K. J. (1990). CEO incentives: It's not how much you pay,
but how. Harvard Business Review, 3, 138-153.
King, A. A., & Lenox, M. J. (2001). Does it really pay to be green? An empirical
study of firm environmental and financial performance: An empirical study of firm
environmental and financial performance. Journal of Industrial Ecology, 5(1), 105-116.
King, A. A., & Lenox, M. J. (2002). Exploring the locus of profitable pollution
reduction. Management Science, 48(2), 289-299.
Klassen, R. D., & McLaughlin, C. P. (1996). The impact of environmental
management on firm performance. Management science, 42(8), 1199-1214.
Klassen, R. D., & Whybark, D. C. (1999). The impact of environmental technologies
on manufacturing performance. Academy of Management journal, 42(6), 599-615.
Laabs, J. J. (1992). The greening of HR. Personnel Journal, 71(8), 60-61.

49
Lash, J., & Wellington, F. (2007). Competitive advantage on a warming planet.
Harvard business review, 85(3), 94-102.
Lawler, E. E., III. (1973). Motivation in Work Organizations. Monterey, CA:
Brooks/Cole.
Lawler, E. E., III. (1981). Pay and organization performance. Reading, MA: Addison-
Wesley.
Leitch, J., Nieves, D., Burke, G., Little, M., & Gorin, M. (1995). Strategies for
involving employees. The Journal for Quality and Participation, 18(5), 68-74.
Lent, T., & Wells, R. P. (1992). Corporate environmental management study shows
shift from compliance to strategy. Environmental Quality Management, 1(4), 379-394.
Locke, E. A., Feren, D. B., McCaleb, V. M., Shaw, K. N., & Denny, A. T. (1980). The
relative effectiveness of four methods of motivating employee performance. In K. D. Duncan,
M. M. Gruenberg, & D. Wallis (Eds.), Changes in working life (pp. 363—388). New York:
Wiley.
Lorsch, J.W., Maclver, E., (1989). Pawns or Potentates: The Reality of Corporate
Boards. Boston: Harvard Business School Press.
Makri, M., Lane, P., & Gomez-Mejia, L. (2006). CEO Incentives, Innovation, and
Performance in Technology-Intensive Firms: A Reconciliation of Outcome and Behavior-
Based Incentive Schemes. Strategic Management Journal, 27(11), 1057-1080.
Mallak, L. A., & Kurstedt Jr, H. A. (1996). Using culture gap analysis to manage
organizational change. Engineering Management Journal, 8(2), 35-41.
Margolis, J. D., & Walsh, J. P. (2003). Misery loves companies: Rethinking social
initiatives by business. Administrative Science Quarterly, 48(2), 268−305.
Marks, S. J. (2001). Incentives that really reward and motivate. Workforce, 80(1), 108-
14.

50
Martínez-Zarzoso, I., Bengochea-Morancho, A., & Morales-Lage, R. (2007). The
impact of population on CO2 emissions: evidence from European countries. Environmental
and Resource Economics, 38(4), 497-512.
Matten, D., & Crane, A. (2005). Corporate citizenship: Toward an extended theoretical
conceptualization. Academy of Management review, 30(1), 166-179.
McKinnon, A. (2007). CO2 emissions from freight transport: an analysis of UK data.
In C. Lalwani, J. Mangan, T. Butcher, A. Coronado-Mondragon (Eds.), Logistics Research
Network 2007 Conference Proceedings (pp. 9-14). Hull: University of Hull.
McWilliams, A., Siegel, D. S., & Wright, P. M. (2006). Corporate social
responsibility: Strategic implications. Journal of management studies, 43(1), 1-18.
Newell, P., & Paterson, M. (1998). A climate for business: global warming, the state
and capital. Review of International Political Economy, 5(4), 679-703.
Nieland, K., Kangos, D., Fixel, M.C., Baczewski, J., & Pechenik, T. (2013).
Investment, transformation and leadership: CDP S&P 500 Climate Change Report 2013.
New York, NY: PricewaterhouseCoopers. Retrieved from https://b8f65cb373b1b7b15feb-
c70d8ead6ced550b4d987d7c03fcdd1d.ssl.cf3.rackcdn.com/cms/reports/documents/000/000/6
26/original/CDP-SP500-climate-report-2013.pdf?1470233007
Parker, O., & Wright, L. (2001). The missing link: Pay and employee commitment.
Ivey Business Journal, 65(3), 70-79.
Patton, A., & Baker, J. C. (1987). Why won’t directors rock the boat. Harvard
Business Review, 65(6), 10.
Patton, K. R., & Daley, D. M. (1998). Gainsharing in Zebulon: what do workers
want?. Public Personnel Management, 27(1), 117-131.

51
Porter, M. E., & Van der Linde, C. (1995a). Toward a new conception of the
environment-competitiveness relationship. The journal of economic perspectives, 9(4), 97-
118.
Porter, M. E., & Van der Linde, C. (1995b). Green and competitive: ending the
stalemate. Harvard business review, 73(5), 120-134.
Read, D. (2005). Monetary incentives, what are they good for?. Journal of Economic
Methodology, 12(2), 265-276.
Robinson, S. L. (1996). Trust and breach of the psychological contract. Administrative
Science Quarterly, 41(4), 574–599.
Rousseau, D. M. (1989). Psychological and implied contracts in organizations.
Employee Responsibilities and Rights Journal, 2(2), 121–139.
Russo, M. V., & Fouts, P. A. (1997). A resource-based perspective on corporate
environmental performance and profitability. Academy of management Journal, 40(3), 534-
559.
Russo, M. V., & Harrison, N. S. (2005). Organizational design and environmental
performance: Clues from the electronics industry. Academy of Management Journal, 48(4),
582-593.
Sanders, W. G., & Carpenter, M. A. (1998). Internationalization and firm governance:
The roles of CEO compensation, top team composition, and board structure. Academy of
Management Journal, 41(2), 158-178.
Scherer, A. G. & Palazzo, G. (2008). Globalization and Corporate Social
Responsibility. In A. Crane, A. McWilliams, D. Matten, J. Moon, & D. Siegel (Eds.), The
Oxford Handbook on Corporate Social Responsibility (pp. 413-431). Oxford, England:
Oxford University Press.
Schmidheiny, S. (1992). Changing Course. Cambridge: MIT Press.

52
Scott, W. R. (1995). Institutions and organizations: Foundations for organizational
science. London: A Sage Publication Series.
Sharma, S., & Henriques, I. (2005). Stakeholder influences on sustainability practices
in the Canadian forest products industry. Strategic Management Journal, 26(2), 159–180.
Shrivastava, P., & Hart, S. (1992). Greening organizations. Academy of Management
Best Paper Proceedings, 52, 185-189.
Shore, L. M., & Tetrick, L. E. (1994). The psychological contract as an explanatory
framework in the employment relationship. In C. L. Cooper, & D. M. Rousseau (Eds.),
Trends in organizational behavior (pp. 91–109). Chichester: Wiley.
Stone, C. D. (1975). Where the Law Ends: The Social Control of Corporate Behavior.
New York: Harper & Row.
Theyel, G. (2000). Management practices for environmental innovation and
performance. International Journal of Operations & Production Management, 20(2), 249-
266.
Tosi, H. L., Shen, W., & Gentry, R. J. (2003). Why Outsiders on Boards Can’t Solve
the Corporate Governance Problem. Organizational Dynamics, 32(2), 180-192.
Turban, D. B., & Greening, D. W. (1997). Corporate social performance and
organizational attractiveness to prospective employees. Academy of Management Journal,
40(3), 658–672.
Vos, J. (2009). Actions speak louder than words: Greenwashing in corporate
America. Notre Dame journal of Law, Ethics & Public Policy 23(2), 673-697.
Welbourne, T. M., & Andrews, A. (1996). Predicting the Performance of Initial Public
Offerings: Should Human Resource Management Be in the Equation? The Academy of
Management Journal, 39(4), 891-919.
53
Welbourne, T. M., & Gomez-Mejia, L. R. (1995). Gainsharing: A critical review and a
future research agenda. Journal of Management, 21(3), 559-609.
Welford, R. (1996). Corporate Environmental Management. London: Earthscan
Publications.
Westphal, J. D., & Khanna, P. (2003). Keeping directors in line: Social distancing as a
control mechanism in the corporate elite. Administrative Science Quarterly, 48(3), 361-398.
Wiedmann, T., & Minx, J. (2007). A definition of ‘carbon footprint’. Ecological
economics research trends, 1, 1-11.
Worrell, E., Price, L., Martin, N., Hendriks, C., & Meida, L. O. (2001). Carbon
dioxide emissions from the global cement industry. Annual Review of Energy and the
Environment, 26, 303-329.
Young, J. (1991). Reducing waste, saving materials. In L. Brown, C. Flavin, S. Postel,
& L. Starke (Eds.), State of the World (pp. 39–55). New York: Norton.
Zajac, E. J. (1990). CEO Selection, Succession, Compensation and Firm Performance:
A theoretical integration and empirical analysis. Strategic Management Journal, 11(3), 217-
230.