Embed Size (px)
Citation preview
i
REWARD MANAGEMENT AND EMPLOYEE COMMITMENT IN COMMERCIAL
BANKS IN UGANDA: A CASE OF STANBIC BANK UGANDA (SBU)
BY
MIRIAM NALUGYA
REG NO 14/MBA/12/045
A DISSERTATION SUBMITTED TO THE SCHOOL OF MANAGEMENT SCIENCE
IN PARTIAL FULFILLMENT OF THE REQUIREMENTS FOR THE AWARD OF
THE MASTERS DEGREE IN BUSINESS ADMINISTRATION OF UGANDA
MANAGEMENT INSTITUTE
FEBRUARY, 2018
i
DECLARATION
I, Miriam Nalugya confirm that this dissertation is my original copy and has not been presented
to any institution for an academic award.
Signature: ………………………………………………………
Date: ………………………………………………………….
ii
APPROVAL
This is to certify that this dissertation has been submitted to the School of Management Science
in partial fulfillment of the requirements for the Award of a Master’s Degree in Business
Administration of Uganda Management Institute with approval of appointed supervisors.
DR. KARIM SSESANGA
Signed: …………………………………………………………………….
Date: ……………………………………………………………………….
DR. GODFREY MUGURUSI
Signed: …………………………………………………………………….
Date: ……………………………………………………………………….
iii
DEDICATION
I dedicate this Dissertation to God, who has solely granted me wisdom, grace, finance and ability
to accomplish this research and to expand my Horizon. I also dedicate it to my family that has
tirelessly rendered their moral support throughout my studies and my fellow MBA 14 students
who have constantly encouraged and supported me to accomplish this course.
iv
ACKNOWLEDGEMENT
I would like to acknowledge the people who have assisted me my struggle to complete this.
Special thanks go to my family for the continued support and prayers towards my education; to
my beloved Gensi Peter, my children Seanice, Tasha and Blair for their prayers and
encouragement, to my family members and all my friends for their moral and spiritual support,
to all the staff of Stanbic Bank Uganda at crested towers who responded to the questionnaires
and interviews.
I greatly appreciate my supervisors Dr. Karim Ssesanga and Dr. Godfrey Mugurusi
for their personal commitment to speedily read and comment on my drafts and for their
constructive academic guidance offered throughout the research process plus all my other
lecturers and non-teaching staff of the Uganda Management Institute.
The most gratitude goes to God the almighty, without whom i wouldn’t have made it
Finally, even those not mentioned here, i thank them so much for their contribution.
v
TABLE OF CONTENTS
DECLARATION............................................................................................................................ i
APPROVAL .................................................................................................................................. ii
DEDICATION.............................................................................................................................. iii
ACKNOWLEDGEMENT ........................................................................................................... iv
TABLE OF CONTENTS ............................................................................................................. v
LIST OF TABLES ....................................................................................................................... xi
LIST OF FIGURES .................................................................................................................... xii
ABBREVIATIONS .................................................................................................................... xiii
ABSTRACT ................................................................................................................................ xiv
CHAPTER ONE ........................................................................................................................... 1
INTRODUCTION......................................................................................................................... 1
1.1 Introduction ......................................................................................................................... 1
1.2 Background ......................................................................................................................... 1
1.2.1 Historical background ..................................................................................................... 1
1.2.2 Theoretical background .................................................................................................. 3
1.2.3 Conceptual background .................................................................................................. 4
1.2.4 Contextual background ................................................................................................... 5
1.3 Statement of the Problem .................................................................................................... 7
1.4 Purpose of the study ............................................................................................................ 7
1.5 Objectives for the study ...................................................................................................... 8
1.6 Research Questions ............................................................................................................. 8
1.8 Conceptual Framework ....................................................................................................... 8
vi
1.9 Significance of the study ................................................................................................... 10
1.10 Justification of the study ................................................................................................... 10
1.11 Scope of the study ............................................................................................................. 11
1.11.1 Geographical scope ....................................................................................................... 11
1.11.2 Content scope ................................................................................................................ 11
1.11.3 Time scope .................................................................................................................... 11
1.12 Operational Definitions of terms and concepts ................................................................. 11
CHAPTER TWO ........................................................................................................................ 14
LITERATURE REVIEW .......................................................................................................... 14
2. 1 Introduction ....................................................................................................................... 14
2.2 Theoretical Review ........................................................................................................... 14
2.3 Reward Management ........................................................................................................ 15
2.3.1 Extrinsic Rewards ......................................................................................................... 16
2.3.1.1 Salary ............................................................................................................................ 16
2.3.1.2 Bonus .............................................................................................................................. 17
2.3.1.3 Compensation packages and benefits .......................................................................... 18
2.3.2 Intrinsic Rewards .......................................................................................................... 19
2.3.2.1 Recognition .................................................................................................................. 19
2.3.2.2 Job security ................................................................................................................... 20
2.3.2.3 Training and development ............................................................................................ 20
2.4 The concept of employee commitment ............................................................................. 21
2.4.1 Number of Staff leaving................................................................................................ 22
vii
2.4.2 Employee/ Staff Attitude .............................................................................................. 24
2.4.3 Staff Attendance............................................................................................................ 24
2.5 Rewards Policy as a mediating Variable .......................................................................... 25
2.6 Extrinsic Rewards and Employee Commitment ............................................................... 26
2.7 Intrinsic Rewards and Employee Commitment ................................................................ 28
2.8 Summary of the literature review ..................................................................................... 30
CHAPTER THREE .................................................................................................................... 31
METHODOLOGY ..................................................................................................................... 31
3.1 Introduction ....................................................................................................................... 31
3.2 Research design ................................................................................................................ 31
3.3 Study Population ............................................................................................................... 32
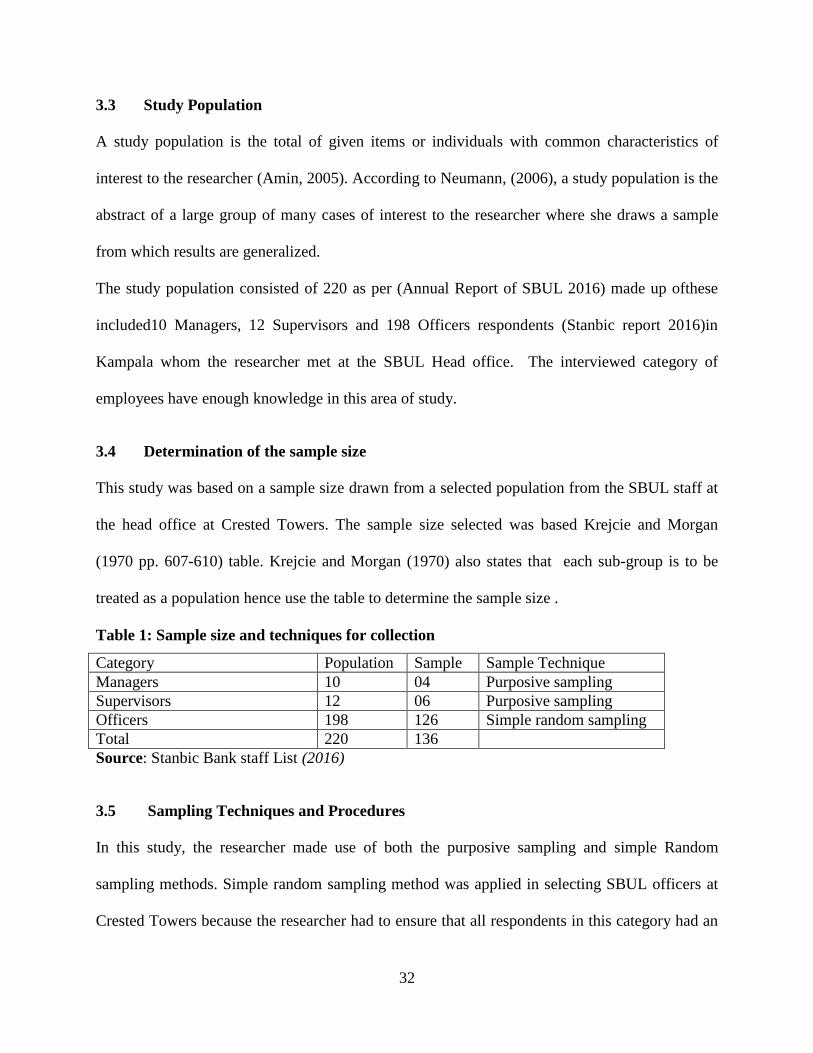
3.4 Determination of the sample size ...................................................................................... 32
3.5 Sampling Techniques and Procedures ............................................................................. 32
3.5.1 Simple Random sampling ............................................................................................. 33
3.5.2 Purposive Sampling Techniques ................................................................................... 33
3.6 Data Collection Methods .................................................................................................. 34
3.6.1 Primary data .................................................................................................................. 34
3.6.2 Secondary data .............................................................................................................. 34
3.7 Data Collection Instruments ............................................................................................. 34
3.7.1 Questionnaires............................................................................................................... 35
3.7.2 The interview guide ........................................................................................................... 35
3.8 Data Collection procedure ................................................................................................ 36
viii
3.9 Data Quality Control .......................................................................................................... 36
3.9.1 Validity ............................................................................................................................. 36
3.9.2 Reliability .......................................................................................................................... 37
3.10 Data Processing and Analysis ........................................................................................... 37
3.10.1 Analysis of Quantitative data ........................................................................................... 38
3.10.2 Qualitative Data analysis ................................................................................................ 38
3.11 Measurement of variables ................................................................................................. 39
3.12 Ethical Considerations ...................................................................................................... 39
CHAPTER FOUR ....................................................................................................................... 40
PRESENTATION, ANALYSIS AND INTERPRETATION OF FINDINGS ...................... 40
4.1 Introduction ............................................................................................................................. 40
4.2 Response rate .......................................................................................................................... 40
4.3 Background of the Respondents ............................................................................................. 41
4.3.1 Distribution of Respondents by Gender ............................................................................... 41
4.3.2 Distribution of Respondents by Age .................................................................................... 42
4.3.3 Distribution of Respondents by Marital Status .................................................................... 43
4.3.4 Distribution of Respondents by Education level ................................................................. 44
4.3.5 Distribution of Respondents by Employment Status ........................................................... 45
4.3.6 Distribution of Respondents by Length of Service .............................................................. 46
4.4 Presentation of the study findings. .......................................................................................... 47
4.4.1 Objective One: To assess the effect of Extrinsic rewards on employee commitment at
Stanbic bank Uganda Limited. ...................................................................................................... 47
ix
4.4.4 Testing Hypothesis One ....................................................................................................... 55
4.4.5 Objective Two: To assess the relationship between Intrinsic Rewardsand Employee
Commitment at Stanbic bank Uganda Limited. ............................................................................ 56
4.4.6 Testing Hypothesis Two ...................................................................................................... 62
4.5 Summary ................................................................................................................................. 63
CHAPTER FIVE ........................................................................................................................ 65
SUMMARY, DISCUSSION, CONCLUSIONS AND RECOMMENDATIONS .................. 65
5.1 Introduction .................................................................................................................... 65
5.2 Summary ........................................................................................................................ 65
5.2.1 Extrinsic rewards and Employee Commitment ............................................................ 65
5.2.2 Intrinsic rewards and employee commitment ............................................................... 65
5.3 Discussion ..................................................................................................................... 66
5.3.1 Extrinsic rewards and Employee Commitment ............................................................ 66
5.3.2 Intrinsic rewards and Employee Commitment ............................................................. 67
5.4 Conclusions .................................................................................................................... 67
5.4.1 Extrinsic Rewards and Employee Commitment ........................................................... 68
5.4.2 Intrinsic Rewards and Employee Commitment ............................................................ 68
5.5 Recommendations .......................................................................................................... 69
5.5.1 Intrinsic Rewards and Employee Commitment ............................................................. 69
5.5.2 Extrinsic Rewards and Employee Commitment ........................................................... 70
5.6 Limitations to the study ................................................................................................. 70
5.7 Contributions of the study ............................................................................................... 70
x
5.8 Areas for further Research ................................................................................................ 71
REFERENCES ............................................................................................................................ 72
APPENDICES ................................................................................................................................ i
Appendix I: Research Questionnaire ............................................................................................... i
Appendix II: Interview Schedule ................................................................................................... vi
Appendix III: Estimated Budget for the Research ....................................................................... viii
Appendix II: Table for determining sample size from a given population .................................... ix
Appendix III: Introductory Letter ................................................................................................... x
Appendix IV: Field Research Letter .............................................................................................. xi
Appendix v: Anti- Plagiarism ....................................................................................................... xii
xi
LIST OF TABLES
Table 1: Sample size and techniques for collection ...................................................................... 32
Table 2: Reliability test for the instruments .................................................................................. 37
Table 3: Response rate according to data collection instruments ................................................. 40
Table 4: Distribution of respondents on Extrinsic Rewards and Employee Commitment ........... 47
Table 5: Correlation results for extrinsic rewards and employee commitment ............................ 55
Table 6: Model Summary of extrinsic rewards and employee commitment at Stanbic bank
Uganda .......................................................................................................................... 55
Table 7: Distribution of respondents by their views on extrinsic rewards and employee
commitment .................................................................................................................. 56
Table 8: Correlations results on intrinsic rewards and employee commitment ............................ 62
Table 9: Model Summary of intrinsic rewards and employee commitment ................................. 62
xii
LIST OF FIGURES
Figure 1: Conceptual framework of the effect of rewards and Employees commitment ............... 9
Figure 2: Distribution of respondents by gender .......................................................................... 41
Figure 3: Bar Chart showing the various age categories of the respondents at Stanbic bank
Uganda .......................................................................................................................... 42
Figure 4: Pie Chart showing marital status of respondents at Stanbic bank Uganda ................... 43
Figure 5: Pie Chart showing the distribution of respondents by their level of education ............. 44
Figure 6: Pie Chart shows the distribution of respondent’s employment status ........................... 45
Figure 7: Bar Chart showing the distribution of respondents by the length of service at Stanbic
Bank Uganda .................................................................................................................. 46
xiii
ABBREVIATIONS
CVI Content Validity Index
DV Dependent Variable
IV Independent Variable
SBU Stanbic Bank Uganda Limited
SBUL Stanbic Bank Uganda Limited
UMI Uganda Management Institute
xiv
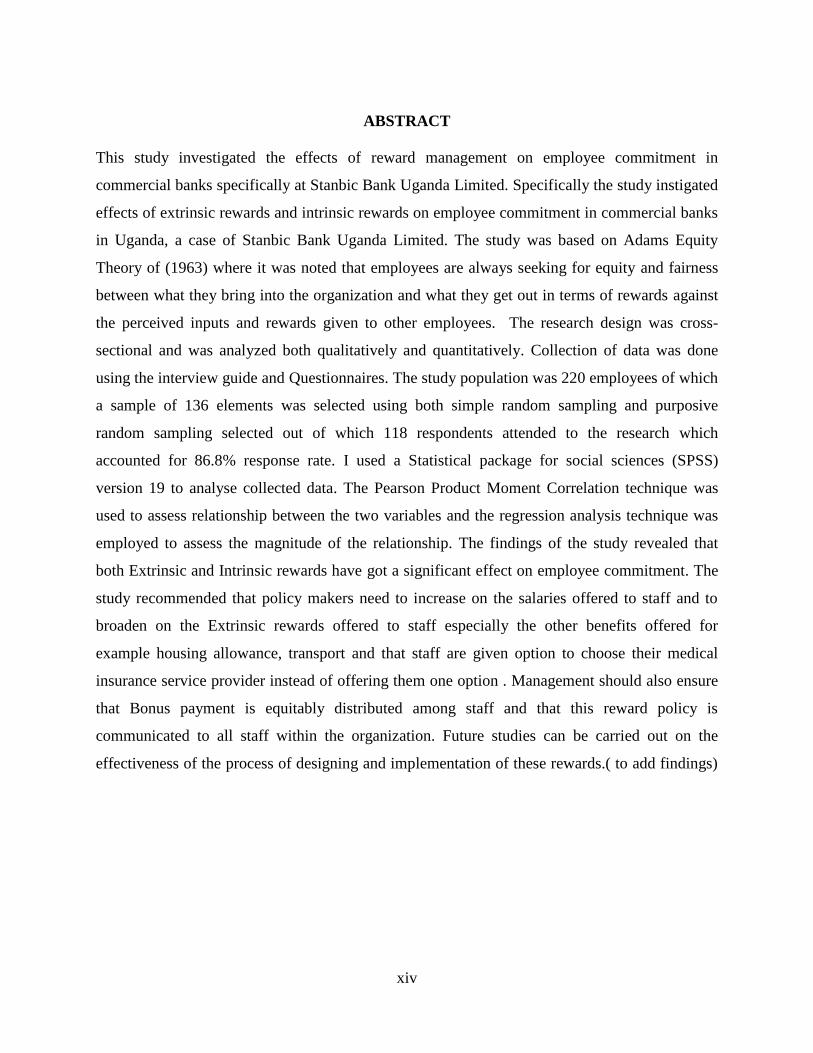
ABSTRACT
This study investigated the effects of reward management on employee commitment in
commercial banks specifically at Stanbic Bank Uganda Limited. Specifically the study instigated
effects of extrinsic rewards and intrinsic rewards on employee commitment in commercial banks
in Uganda, a case of Stanbic Bank Uganda Limited. The study was based on Adams Equity
Theory of (1963) where it was noted that employees are always seeking for equity and fairness
between what they bring into the organization and what they get out in terms of rewards against
the perceived inputs and rewards given to other employees. The research design was cross-
sectional and was analyzed both qualitatively and quantitatively. Collection of data was done
using the interview guide and Questionnaires. The study population was 220 employees of which
a sample of 136 elements was selected using both simple random sampling and purposive
random sampling selected out of which 118 respondents attended to the research which
accounted for 86.8% response rate. I used a Statistical package for social sciences (SPSS)
version 19 to analyse collected data. The Pearson Product Moment Correlation technique was
used to assess relationship between the two variables and the regression analysis technique was
employed to assess the magnitude of the relationship. The findings of the study revealed that
both Extrinsic and Intrinsic rewards have got a significant effect on employee commitment. The
study recommended that policy makers need to increase on the salaries offered to staff and to
broaden on the Extrinsic rewards offered to staff especially the other benefits offered for
example housing allowance, transport and that staff are given option to choose their medical
insurance service provider instead of offering them one option . Management should also ensure
that Bonus payment is equitably distributed among staff and that this reward policy is
communicated to all staff within the organization. Future studies can be carried out on the
effectiveness of the process of designing and implementation of these rewards.( to add findings)
1
CHAPTER ONE
INTRODUCTION
1.1 Introduction
The study investigated reward management and employees’ commitment at Stanbic Bank
Uganda Limited. Employees’ commitment was taken to be the dependent variable while reward
management was taken to be the independent variable. Employees’ commitment was measured
in terms of staff turnover, attitude of the staff and absenteeism. Whereas reward management
was the independent variables which included reward policies, Extrinsic and Intrinsic rewards.
The chapter presents introduction, background, the statement to the problem, purpose,
objectives, research questions, research hypothesis, scope, significance and justification to the
study.
1.2 Background
This section comprises of historical, theoretical, Conceptual and Contextual background to the
study.
1.2.1 Historical background
According to Sheilds and associates (2015), rewards are based on the different employee’s
needs. Some needs can be fulfilled with cash rewards yet other employees are more satisfied
with incentives like car benefits, house rent, holidays, etc. Reward management systems should
have a combination of cash and non-cash incentives so as to satisfy the expectation of all
employees. Financial rewards are based on the concept of pay for your performance. They
normally take the form of Basic salary, Bonus and commission among others.
2
Non-cash incentives can take the form of recognition, appreciation, and improvement in working
conditions, increased responsibilities among others. (Garg and Rastogi2006). Torrington and
associates (2009) concluded that non-monetary rewards can increase job satisfaction of the
workforce within the organization.
Globally, employee commitment is taken to be a natural process for effective performance of
individuals and organizations (Armstrong, 2005). Organizations are using different means and
method to enhance employee’s commitment and it is not surprising that commitment of
employees to an organization is very fundamental for its success. Employee has a desire to reach
their self-actualization motivational level in form of rewards (Dorenbosch & Veldhoven, 2006).
Therefore, organizations must ensure that they put in place an overall reward system with both
cash and non-cash elements to ensure that the level of commitment among Staff is sustainable
In Africa, it is very important for all organizations to retain its committed employees.
Ivancevich, (2010), stated that committed employees work hard and perform their tasks with
dedication. Organizational human development objective is to improve human capacity and
increase its efficiency in order for it to achieve its strategic objectives. It is possible to build the
capacity of the organization if all employees realize their responsibilities and accountability
towards the organizational performance. The fact is that people influence a great number of
aspects of organizational success. Therefore an institution should treat all employees as the most
valued asset and should know what motivates them to be committed at work in order to reach
their full potential. Organizations throughout the world have recognized the significant
opportunity to attract, and retain key talents in this competitive environment. Managers have
recognized that human resource and in particular key committed specialists are vital to the
success of the institution and that they are hard to find and sometimes hard to keep.
3
In Uganda, employee commitment is increasingly becoming a major concern and a great
challenge in Commercial Banks, more especially in Stanbic Bank Uganda Limited. Though a
number of measures are put in place to address this challenge of employee commitment within
Stanbic Bank, the situation has not improved as per the annual report (Stanbic Bank, 2016). If
employee commitment is therefore not properly managed, it affects the Banks competitiveness in
terms of service delivery adversely.
1.2.2 Theoretical background
The study has been guided by Adams Equity Theory of (1963).
The theory asserts that individuals / employees seek to obtain equity between the efforts they
bring to the job for example time, experience, education, and the output they receive from it for
example recognition, increased pay, promotion among others against perceived efforts by other
employees within the same organization. The theory proposes that employees who regard
themselves to be under-rewarded can experience distress which can lead to efforts to restore
equity in the organization. Hellriegel etal (2008:276) argue that such employees can decide to
behave in a way that can severely harm the organization for instance they can decide to quit the
organization hence the company losing its productive talent and the its competitive advantage. If
uncommitted employees decide to stay in the organization, they can show a feeling of hostility to
other employees and may react by holding back their efforts in to restrict output or can
deliberately sabotage the production process putting the organization at a competitive
disadvantage.
Lawler and O'Gara, 1967 observed that there was decreased production and decreased work
quality among low paid subjects
Among the implications of this Theory is that there can be variation from person to person in the
4
value of inputs verses his outcome. An over compensated employees’ outcomes may adjust or
reduce according to either his purchasing power or according to the local market conditions.
However, this theory is criticized that it is too simple to use and that there are many other
variables that can affect people's perceptions of fairness and this varies from one person to
another. Much of the test for equity theory was conducted in laboratories and not tested in real
world
But besides its criticisms, was a very good theory to study employee commitment as a result of
equitable reward management.
1.2.3 Conceptual background
The research was guided by the above concepts of reward management and employee
commitment. Boehm and Lyubomirsky (2008) posited that rewards have all the capacity to
promote employee commitment. Its focus was on both the extrinsic and intrinsic where they
concluded that these determine employee commitment. In a study that was conducted by Andrew
and Kent, (2007), it was concluded that employees are so conscious of the type of reward system
in place as well as performance recognition system in place since these are important variables in
determining job satisfaction. Carraher etal, (2006) concluded that an organization should have a
good reward system to retain high performing employees who have the ability to meet the
strategic expectations. Mendonca (2002) noted from the expectancy theory that the rewards
should be based on the principle that employee are motivated to perform well if they are aware
that the existing rewards are based on good performance. Similarly, a study finding by Guest
(2002) posits that rewards are key in meeting employee commitment and increased performance
as expected by management.
5
In a research conducted by Tsai (2005) he argued that monetary rewards are very effective in
meeting the expectations of individual employees and are key in employee motivation. Chin-Ju
noted that rewards given in terms of pay for employee performance is the best for employees
seeking to be intrinsically motivated though he also noted that this kind of method lacks long
term results. Yousaf and associates, (2012) in his research focused on non-monetary rewards and
in his findings noted that individuals involve themselves in social exchange processes which
motivate them to gain rewards.
Similarly, Schaufeli and associates (2002) noted that reward system help in prevention of
employee burnout. This is a phenomenon experienced by most employees. This can reduce
employee commitment and it affects motivation and productivity adversely.. Bidwell et al,
(2013) highlighted a strong relationship of staff payment and organizational profitability. From
the findings it showed a big relationship between the reward system and employee productivity.
The positive relationship indicates that higher remuneration can lead to higher productivity,
commitment and vice versa. From the statistical tests carried out by Kehoe and Wright, (2013),
the findings showed that a change in reward and recognition system can significantly lead to a
change in employee commitment.
1.2.4 Contextual background
Before its independence in 1962, the Ugandan government owned most Banks and had control
on the issue of both local and foreign currency. In the past 2 decades of 1990’s and 2000’s, the
banking industry in Uganda underwent a significant restructure. During the early 1990’s, the
Ugandan government embarked on banking sector reforms where it mainly focused on
improving the bank performance through strengthening of prudential regulations and
6
liberalization (Bategeka and Okumu, 2010). These reforms restructured the bank as an industry
with advancement in computer technology that led to internet based and electronic banking.
Consequently, changes were noted the banking operations, customer relations and inter-banking
interactions. The above improvements affected the costs as well as revenue of commercial banks
there by affecting performance between domestic and foreign commercial banks. Uganda
Commercial Bank initially was privatized when majority of its shares were sold to a Malaysian
company. Its second sale was done where the Standard Bank of South Africa emerged as the bid
winner. It was later merged with the former Grindlays Bank renaming it Stanbic bank Uganda.
SBU is a Commercial Bank licensed by the national banking regulator, Bank of Uganda. The
Ugandan government in 2005 listed its shares on the Uganda security exchange (USE) hence
divesting its shares. Stanbic Bank Bank is now listed on the USE trading under the symbol SBU.
Some of its products are mobile money, Internet banking, offers debit and credit cards and SME
lending among others. SBU is owned by Standard Bank Group Limited and is a subsidiary of
Stanbic Africa Holdings Limited.
Stanbic Bank Uganda Limited is mandated to provide high quality financial services and it has a
mission of providing financial services suited to the needs of its customers while embracing
latest technology and being innovative to become the leading financial provider. It has core
values of empowerment where it empowers its clients to shape their destinies with self-
empowerment opportunities. In this regard, the management of Stanbic Bank Uganda expects its
employees to be devoted and committed to their job so as to efficiently and effectively serve the
nation. However, it seems to be realizing a gap between employees and their commitment to
work in Stanbic Bank Uganda Limited. It was under this context that the study sought to
investigate reward management and employees’ commitment at Stanbic Bank Uganda.
7
1.3 Statement of the Problem
Commitment of employees is an incentive to the organization since a longer stay at the same
organization helps the employee understand organizational goals. It is implored that commitment
of employee to an organization can be visible when employees become more committed to their
assigned tasks, creative at their work place and very sincere with duty, (Clugston, 2000; Riketta,
2002). From the study that was carried out in Malawi by Hurst in 2002 which focused on
mobility of registered nurses between 25 and 30 years and above 30 years old revealed that
nurses between 25 and 30 were likely to leave as opposed to above 30 years and above therefore
more focus should be put on strategies that retain employees within the above age group. A lot of
research has been conducted focusing on reward and employee Commitment as per Gohari et al.
2013, Syed, and Yan, 2012) but little has been done to vividly show the relationship between
reward management and employee commitment in Commercial banks especially in Stanbic Bank
Uganda. Several instances of long lines to the cash counters and poor attitude of staff while
serving clients have been reported in in the bank. The level of staff turnover at Stanbic bank is
overwhelming as these move to competitor banks like Standard Chartered Bank, DfCU bank,
Diamond trust Bank, centenary bank presumably in search for greener pastures. This is likely to
be attributed to poor reward policy which has led to de-motivation and job dissatisfaction. The
study was therefore conducted to assess the effect of reward management on employee
commitment in Commercial banks specifically in Stanbic Bank Uganda.
1.4 Purpose of the study
The study sought to investigate the effects of reward management on the employee commitment
at Stanbic Bank Uganda Limited.
8
1.5 Objectives for the study
Objectives of the study were;
i) To assess the effect of Extrinsic rewards on employee commitment at Stanbic Bank
Uganda Limited
ii) To assess the effect of Intrinsic rewards on rewards on employee commitment at Stanbic
Bank Uganda Limited
1.6 Research Questions
ii) What is the effect of Extrinsic rewards on employee commitment at Stanbic Bank
Uganda Limited?
iii) What is the effect of Intrinsic rewards on employee commitment at Stanbic Bank Uganda
Limited?
1.7 Hypotheses of the Study
i) Extrinsic rewards have a significant effect on employee commitment
ii) Intrinsic rewards have a significant effect on employee commitment.
1.8 Conceptual Framework
The study was guided by the conceptual frame work that depicted the relationship between
reward management and employee commitment
9
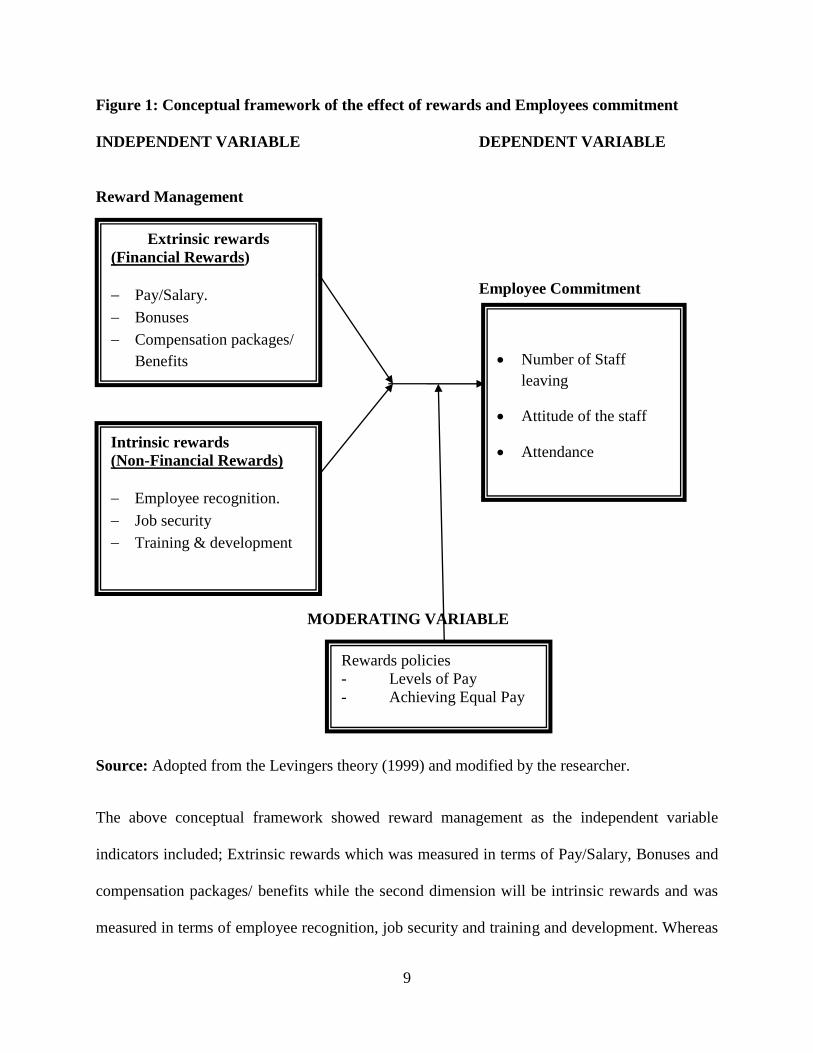
Figure 1: Conceptual framework of the effect of rewards and Employees commitment
INDEPENDENT VARIABLE DEPENDENT VARIABLE
Reward Management
Employee Commitment
MODERATING VARIABLE
Source: Adopted from the Levingers theory (1999) and modified by the researcher.
The above conceptual framework showed reward management as the independent variable
indicators included; Extrinsic rewards which was measured in terms of Pay/Salary, Bonuses and
compensation packages/ benefits while the second dimension will be intrinsic rewards and was
measured in terms of employee recognition, job security and training and development. Whereas
Extrinsic rewards
(Financial Rewards)
Pay/Salary.
Bonuses
Compensation packages/
Benefits
Intrinsic rewards
(Non-Financial Rewards)
Employee recognition.
Job security
Training & development
Rewards policies
- Levels of Pay
- Achieving Equal Pay
Number of Staff
leaving
Attitude of the staff
Attendance
10
employee commitment was shown as the dependent variable measured as number of staff
leaving, attitude of the staff and attendance. Reward policy as moderating variable was measured
as levels of pay and achieving equal pay.
The conceptual framework indicated that good reward management results into better employee
commitment while poor and unfair reward management results into poor employee commitment
hence affecting the organization.
1.9 Significance of the study
The findings are to be useful to different categories of people in different ways:
The study findings may provide useful information to the policy maker’s on how to make
employees committed to the banks and how to reduce the rate of staff turnover by making
employee committed not only at Stanbic Bank Uganda but also other Banks in the country. The
study findings are also expected to identify reward management and commitment gaps which
Stanbic bank management may need to address. In this way, solutions to the past failures may be
sought, while consolidating the achievements at the same time. The findings of the study are
hoped to provide up-to-date literature to academicians who may wish to carry out studies on
reward management and employee commitment. It is thus believed that the study findings may
stimulate further research. Conclusively, it provided the researcher with new knowledge to
extend and develop more knowledge on employee commitment.
1.10 Justification of the study
The reason for this study was to investigate the effect of reward policies and employee
commitment at Stanbic Bank Uganda Limited in order to improve employee commitment. This
also included bridging the gap between management and employees in as far as improving
employees’ commitment were concerned. The researcher was prompted to carry out this
11
investigation because employees’ commitment at Stanbic Bank had greatly affected productivity
as per SBU report (2016).
1.11 Scope of the study
The study scope includes the content, geographical and time coverage of the study.
1.11.1 Geographical scope
The SBUL Head Office at crested Towers was selected for the study because it is the biggest
branch in Uganda and it is where most of the customers including organizations go for banking
services. The researcher is stationed in Kampala and can easily access the required information.
1.11.2 Content scope
The study investigated the relationship between reward management on the employee
commitment at Stanbic Bank Uganda Limited. The independent variable of the study was reward
management and the independent variable employee commitment.
1.11.3 Time scope
This study covered the period from 2013- 2016 because it was period information could easily be
found on organizational performance of the bank. In this period is also when employee migration
in banks is seen in the press. The period also shows in records the performance of SBUL;
Published financial statements and staff lists 2013 – 2016 in form of SBU Annual Reports.
1.12 Operational Definitions of terms and concepts
Rewards are defined as awards offered to employees for contributing towards organizational
goals. They will be looked at in both monetary and non-monetary terms form.
12
Rewards management: Reward management refers to those processes, policies or strategies
designed to ensure that employees contribution towards the organization is adequately
recognized by employees using both cash and non-cash rewards
Extrinsic rewards: are those awards that are either financial or monetory in nature and these
include wages, salaries, bonuses to mention. The assumption is that money may influence
employee behavior or can shape employee attitude.
Salary is the monetary earnings by an employee for the job done. Salary paid should be both
appropriate and competitive. It must be reasonably competitive to those working within the same
industry and offering the same service
Compensation packages and benefits: These are rewards that are given on top of the salary to
make employees more comfortable at their place of work for example housing allowance,
transport allowance among others.
Intrinsic rewards: are those non-monetary awards given to employees to enhance employee
commitment and performance. It gives employee’s satisfaction derived from a job well done.
They are defined as feelings of contentment that an employee finds for completion of a task
because it brings a strong sense of meaning and responsibility. They may include recognition,
Job security among others.
Job security: This means income security derived from employment, either permanent
employment or self-employment.
Recognition It can come in terms of an open praise or awarding of certificate to an employee on
achievement of the set goals or his involvement in the company activities
Employee Commitment: It is a psychological attachment of an employee to the organization
13
Employee attitude refers to how employees in an organization behave while executing their task
and when serving clients. Attitudes can either be positive or negative views of a person.
Reward policy: A reward policy is a strategy that the organization puts in place to fairly and
equitably compensate employees according to the value brought to the organization (Armstrong,
2003)
Level of pay Is the determination of how much an employed staff is to be paid either in terms
of salary or wage based on a number of factors length of time working in an organization, level
of education, rank, and difficulty of the specific work performed mong others. Pay structure can
either be specific or market based.
Achieving equal pay: It looks at a strategy put in place by an organization to ensure employees
at the same level and performing the same job within the same working conditions, both female
and male are paid equally.
14
CHAPTER TWO
LITERATURE REVIEW
2. 1 Introduction
I looked at what has been published on the topic by renowned researchers. It presents a survey
and discussion of the area under study. The purpose here was to review a selection of existing
literature as presented in journals, textbooks, magazines, the World Wide Web and articles
related to employee commitment. The chapter begun by giving a theoretical review of the key
theories which were used to study employee commitment, related literature and finally presented
a summary of the literature reviewed.
2.2 Theoretical Review
This study was guided on the Adams Equity theory of (1963).
The Equity theory was used as a guide for payment and motivation especially when it comes to
quality and quantity of performance. The theory posits that all employees prefer to have equity
between what they bring into the organization for example experience, .commitment and time
among others and what they receive from the organisation forexample salary, Bonus promotion,
increased pay and recognition among others and this is compared to perceived inputs versus
outcomes of other employees within the same organisation. The theory proposes that employees
who regard themselves to be under paid will be distressed hence efforts to restore equity in the
organization. As noted by Hellriegel et al (2008:276) disgruntled employees may behave in
ways that can be of potential harm to the organization for example leaving the organization
hence loosing productive skills and loss of capacity to compete favourably.
An overcompensated employee may also later adjust his efforts or inflate the value of his inputs
15
to adopt a sense of superiority. Among the implications of this Theory is that there can be
variation from person to person in the value of inputs verses his outcome. An over compensated
employees’ outcomes may adjust or reduce according to either his purchasing power or
according to the local market conditions. However, this theory is criticized that it is too simple to
use and that there are many other variables that can affect people's perceptions of fairness and
this varies from one person to another. Much of the test for equity theory was conducted in
laboratories and not tested in real world.
2.3 Reward Management
Management of rewards is considered a process to develope, operate, Implement and evaluate
reward policies and practices that can identify, value and recognize employees basing on the
contribution they bring to the organisation. It should therefore serve as a motivator for
employees to commit to the organization (Armstrong et al, 2010).
Armstrong (2012) noted that a reward management strategy should ensure that organizational
objectives are supported by employees through the culture of performance. Karami et al, (2013)
noted the importance of an effective and timely reward system enhance employee motivation
employees’ motivation which to improve employee commitment to the organization as well as
organization achieving its goals. Wang and Fen, (2003) also noted reward management to be a
strong variable that influence organizational performance and ethics. The reason is that rewards
direct the overall attitude of an employee towards the Job
Heneman (2013) observed the objective of reward management is to ensure reward practices are
aligned with employee needs. According to Armstrong (2012), reward strategies base on
objectives of the organization and what it wants to achieve. Therefore, there must be an
alignment of the reward practices with both the needs of employees and the business goals and
16
objectives. As noted by the Chartered Institute of Personnel Development (2007), this alignment
creates employee satisfaction leading to high productivity which consequently assists the
organization achieve its goals.
Fransson and Frendberg, (2008) noted that rewards can attract or retain high quality and
talented employees therefore organizations must offer appropriate and attractive reward
packages.
Armstrong (2012) posits an organization which provides competitive rewards will satisfy
employees and this makes them want to stay in that same organizations for a long time leading to
high employee retention levels. He further notes that reward defines the right behavior and
outcome through expectations and outlined basic pay and performance management programes.
In a Similar way Manas and Graham, (2003) pointed out that reward system may influence
employee performance through deciding behavior which can lead to achievement of
organizational objectives.
The reward system put in place by an organization will affects employee satisfaction and
commitment levels (Ray tone, 2006). A fair reward system will play a dominant part in raising
the morals of employees and an efficient /effective functioning of the organization.
2.3.1 Extrinsic Rewards
2.3.1.1 Salary
Salary includes cash compensations directly provided by employers to employees for the work
done. Salary consists of base pay and contingent pay. Base pay is based on pre-defined rates
forexample time spent on the Job, work experience, educational among others contingent pay
depends on the employee’s performance for example merit increases, Bonus pay, incentive pay
17
among others. Basic pay can be paid annually, hourly or weekly. The weekly and hourly pay is
also referred to as the time rate payment system. Basic pay can be classified as performance
based pay where pay is related to the value of the Job done. Where base pay looks at the level of
competency Armstrong, (2012). Job evaluations while determining base pay are intended to cater
for both internal relativities and market demands to assess external relativities which help in
determining a competitive base pay rate.
Empirical studies for example done by Harris, 2000; Kinnear & Sutherland, 2000;
Maertz & Griffeth, 2004 and Meudell & Rodham, 1998 have cited factors that are key in
motivating and making employee committed and retained in organizations which include a
friendly working environment, a competitive salary, healthy interpersonal relationships among
others. Salary structure should be considered appropriate, reasonable and competitive for
employees within the same industry. Set company policies must be fair to include flexible dress
code, working hours, vacations among others. The employees can be offered benefits for the
family members, health care plans employee and other help programs. Work conditions must be
safe and work tools must be maintained well and up to dated. Relationship between employees
and peers plus their superiors must be acceptable with humility.
2.3.1.2 Bonus
Sarwar&Abugre,(2013) observed that bonus payments increase employee Job satisfaction for
the organization. It was also noted that dissatisfaction of employee within organizations offering
less pay and other incentives was also recorded. incentives. Gohari at al, (2013) emphasized
rewarding elements like Bonus pay, appreciation, empowerment and fringe benefits have got an
impact on employee Job performance. Usha Priya, &Eshwar, (2014) were in agreement with past
18
studies which pointed out that bank employees give more value to monetary reward as compared
to non-monitory rewards . Organisation have experienced that only big salaries are not enough
to make employees committed but also other benefits (Thompson, 2014). Whitaker, (2009) noted
that employees satisfaction can be satisfied with pay increase and bonus though its effects are
shorter lived as compared to the motivating effects of non- monetary rewards. Non monetory
rewards for example subsidized meals, condensed working hours, holidays and team building
events were noted to improve employee satisfaction and encouraging employee commitment and
loyalty to the organization. (Whitaker, 2009).
Helena (2013) in her study examined the effect of performance related bonus on employees with
the case study of a Motor Vehicle Accident Fund in Namibia. The findings revealed that there is
a substantial impact of performance -related pay bonus on the performance of employees.
Edward, (2013) researched the role of employee bonus on job performance. The study confirmed
that lack of good salary; bonus, rewards and recognition were common reasons for staff turnover.
Feedback on employee performance is very crucial to build confidence in the bonus system of
the Brewery. Garlick (2009) in his study requested employees to rank the incentives in order of
preference. In his findings, cash bonus was ranked the most at 75%. It was also noted that money
related bonus alone have much impact on performance, therefore other incentives should also be
taken into consideration.
2.3.1.3 Compensation packages and benefits
Today, high-performing employees are looking for employer flexibility, more interesting work,
a feeling of being valued and opportunity for advancement and training being the main factors
that influence their decisions to change jobs (Cunningham, 2002).
19
Conclusively, the researcher holds the view that, financial rewards are very important towards
motivation of employees and therefore, the researcher will carry out this study in Stanbic Bank
Uganda Limited to find out how financial rewards influence employee commitment.
2.3.2 Intrinsic Rewards
2.3.2.1 Recognition
From the study by Naveed, (2012), recognition as rewards have a direct internal impact on
employee motivation and can increase their work efficiency. Petresca and Simon, (2008) noted
that recognition refers to acknowledgement of employees’ good performance. According to
Harrison (2005), He observed that recognition of employees is seen an informed, timely and
formal acceptance of employee’s behavior and effort which directly supports organizational
goals and values beyond the normal expectation levels. Here the employer acknowledgement
employee’s actual accomplishment and effort in achieving the set target which can either
psychological, physically or both.
Employee are recognition differently in different organizations for example provisions of
certificate of recognition, gifts cards, shopping vouchers, dinners ,thank you cards, trophies, and
respect among others where it deserves, Nolan, (2012). Organizations have set up recognition
programs forexample recognizing employee of the year, month, week schemes and long service
awards. Studies by Ndetei et al, (2009) noted that failure to include recognition as a component
in the reward policy is common in most organizations. Recognition is taken to be the least
expensive type of reward yet it elicits more benefits from employees, (Corby et al, 2005).
20
According to Nolan, (2012), employees who accomplish their goals depending on the job and
deserve be praised and recognized for this achievements by management.
2.3.2.2 Job security
Job security refers to income security from either permanent employment, contract employment
or self-employment. According to Auer (2007), security is derived from the level of supply of
human capital of the qualified employees on one hand and the functions of the labor market and
supply on the other hand. Job security as defined by Dekker, (2008) refers to protection against
unfair and unjustified dismissals. Employment security means protection against unnecessary
dismissal from the job (ILO,1995). In their study, Wilthagen, (1998), stated that Job security not
only is it important for providing income security but also we should not underestimate the non-
pecuniary benefits for example the sense of social participation, psychological effects on self-
confidence and self-respect that it provides
2.3.2.3 Training and development
Training directly impacts employee performance and commitment further affecting
organizational performance because it creates Job satisfaction (Apospori et al, 2008). It helps the
organizations function both effectively and efficiently (Moorman et al, 1993). Organisations
should make investments in training programs in order to empower its employees in achievement
of organizational goals Bassanini & Scarpetta, (2002). Training and development programs for
mark valuable impact on effective and efficient functioning of the organization (Adeniyi, 1995).
Meyer et al, (2003) noted that employee training is also related to socialization in the workplace
and this contributes to employee retention through employee commitment, provides employees
with means to deal with Job related stress and creates a culture of caring within the organization.
21
Training and development allows employees to see a future at the work place and also provides
employees with the necessary support to face the on-going work related challenges.
Conclusively, research carried out on rewards as a factor for motivation and commitment tend to
support two colleges of thoughts. One argues that financial incentives attract employee
motivation and commitment, (Angle & Perry, 1983) while the other supports non-financial
incentives (Brief & Aldag ,1983).
The researcher is in agreement with the above assertion that both monetary and non-monetary
rewards are powerful and effective in influencing employees’ commitment and this therefore has
prompted the researcher to carry out a study in Stanbic Bank Uganda to find out how both
monetary and non-monetary rewards affect employee commitment.
2.4 The concept of employee commitment
According to Price, (2011), employee commitment to the organization refers to the degree of
involvement and attachment an employee has with organizational values and goals. It is the
desire to stay in an organization if an employee has confidence in its principles and goals.
Armstrong, (2012) states that commitment means allegiance and feelings of an employee to the
organization. It signifies both behavior and the feelings.
Lee, (2010) concluded that commitment involves willingness of an employee to exert effort
towards achieving organizational goals. Porter et al, (1974) and Armstrong, (2012) stated that
commitment can be a link between an organization and individuals because employees always
consider how and whether managerial objectives relate to their own values.
From the study conducted by Meyer & Allen, (1997) those employees considered to have
affective kind of commitment are more motivated to act and make meaningful contribution to the
22
organization than those who showed continuantion and normative kind of commitment simply
because employee identifies herself with every aspects of the organization.
Coetzee ,(2005) , Beck and Wilson, (2000 noted that continuance kind of commitment is
calculative because it focuses on employees’ opinion where he evaluates risks , costs incurred
and benefits on leaving or staying in the an organization. They look at the extrinsic rewards
obtained from the organization and are lured to remain in there.
Meyer and Allen, (1997), and Lee (2010) stated that under continuance kind of commitment
employees are aware of the costs are enthusiastic about remaining in an organization because of
the personal attachment that cannot be transferred.
Meyer and Herscovitch, (2001) continued to argue that commitments can include behavioral
actions a committed employee may take in form of Discretionary behaviors.
Committed employees are able to perform their duties beyond the s target (Bragg, 2002).A high
level of commitment is indispensable in efforts to increase output and maintaining a sustainable
competitive advantages (Whitener, 2001).
Mathieu & Zajac, (1990) in his study noted that commitment is positively related t personal
characteristics forexample length of service in a particular organization, qualification (Glisson &
Durick, 1988), marital status as noted by John & Taylor, (1999).
2.4.1 Number of Staff leaving
A number of factors make staff to leave one organization to another one though not all are
negative impact on wellbeing of the organization. Therefore organizations need to learn to
23
difference between intended and unintended leaving then should only take action one they can
control. intended leaving is caused by the employee’s own choice for example after getting a job
in another organization offering a better salary while involuntary leaving may be a decision by
management for example dismissal after misconduct. Hence all resignations instigated by
employees are intended resignation (Loquercio et al, 2006).
Other factors may be beyond control by management for example death of employee or
incapacitation of staff. In the past voluntary turnover was associated to the need to take care for
children or aged relatives. Currently that is seen as voluntary leaving since company policies and
government regulations should be flexible to create a chance for those staff (Simon et al, 2007).
Staff leaving are also distinguished into dysfunctional for resignations of poor performers and
functional turnovers for high performers. The concern to management should be the functional
turnover since it affects the organization adversely. (Taylor, 2008).
A low number of employee leaving is acceptable because it eliminates poor performers while
encouraging innovation and hard work with the entry of new blood. However , a high number of
employee leaving may leads to low employee commitment hence ineffectiveness of the
organizations resulting in high cost of recruitment (Ingersoll & Smith, 2003). Many authors
regard at high number of employee leaving rates to negatively affect the profitability (Aksu,
2004. Curtis and Wright, (2001) posits that high turnover in an organization may damage quality
of customer service which in a way provides a base for competitive advantage hence limiting
business growth. As observed in a study by Hinkin& Tracey, (2000) that people who leave the
organization are those who are more gifted since they have greater chances elsewhere. Staff
24
leaving results in movement of valued talent to competing firms (Stovel&Bontis, 2002). It is
therefore desirable for management to puts in place strategy to improve staff retention.
2.4.2 Employee/ Staff Attitude
Attitude taken to be a person’s level of dislike or like of a certain thing or situation. They are
either negative or positive views of an enployee, thing or event (Bagherian et al. 2009. Eagly and
Chaiken,(1998) noted that attitudes are a psychological tendency is expressed when people
evaluate an entity with a degree of favour/ like or disfavor/ dislike. They can influence the
individual’s emotion and behavior. Therefore attitude relate to how an individual feel or react to
his surroundings.
When employees are satisfied, they are happy and committed to their work. Attitude and job
satisfaction is a collective effort of both management and employees. When employees enjoy
their work, they may not need management motivation instead satisfaction attained from
completing their work on time will motivate them (Robbins, 2004).
2.4.3 Staff Attendance
Effective management policies on attendance to improve employee commitment consist of
management training of employees on importance of attendance, monitoring, recording and
management of absence of employees. A review of attendance was done using a standard
evidence-based review methodology which comprised of a clear literature where searching of
paper selection was done based on predetermined standards and a critical assessment of these
papers was done (Green, 2010).
Workplace attendance is of critical importance to any industry because it can increases cost of
production and reduces the quality of a product which affects performance of the whole
25
organization. Absence also affects other employees because they are expected to work the extra
load for the absentee in order to complete production. Work attendance or absenteeism is linked
to factors like being disease-related incapacity. Armstrong (2012), posits that attendance is
linked to working environment and indicators like industrial disruptions should not be ignored.
Delays in work, absenteeism and declining production are specific signs that something is wrong
hence need to receive immediate attention by the responsible authorities.
2.5 Rewards Policy as a mediating Variable
According to Memon et al (2010), proficient organizational policies which include reward and
other human resource practices are geared towards employee retention, satisfaction and
performance.
Duncan & Reilly (2009) stated that reward policies which include incentive plans and bonuses
are aspects of reward most researched on. They argue that high performing companies use bonus
share and other incentive plans to reward their employee.
While Wilson (2014) adds that organization should define their compensation strategy based on
existing reward policies if they want to attract, retain and commit employees.
However, in a study conducted by Armstrong, (2007) he stated that reward policies are a set of
written guidelines used in decision making when managing rewards. He indicated what an
organization and its management are expected set procedures on how rewards will be managed
in given situations. Reward policies under the study were categorized as levels of pay and
chieving equal pay. A study by Wilson, (2014) concluded that every organization should define
their compensation strategy based on existing reward policies and processes hoping to attract and
retain the desired talent.
26
Ajila & Abiola, (2004) observed that a well-designed reward package can influence employee
performance since they were motivated to work harder. McShane& Von Glinow (2005), stated
that motivation through pay was mainly based on seniority where the salary level is based on
staff skills and competence.
According to Reichard et al, (2003) contingent pay allow upward adjustment of employee
salaries and provides compensation for higher levels of performance.
Nielsen (2002), noted that decisions for reward policy on an organization’s pay can be a high,
medium or low pay depending on what it can afford or whether it is competitive in the labour
market. CIPD (2001), also noted that employees who completed their assignment on time gave
their own organizations confidence to be paid highly. From the report, there is need to have a fair
and equal reward system because this will impact positively on employee and satisfaction and
perception. Reviewing pay can increase the ability of any organization’s queries by employee
about its pay practices and this can better their overall performance and commitment.
2.6 Extrinsic Rewards and Employee Commitment
Extrinsic rewards are also referred to as monetary or financial rewards for example salary, bonus
pay, wages among others. In ideal situations money influences people’s behavior and shapes
their attitudes (Parker & Wright, 2001). He also adds that, salary can be used to attract and
retain the work force. Lucrative remuneration packages are a broadly discussed factor in
retaining employees. Rewards fulfill both the financial and material needs and defines the social
status of an individual within an organisation. Njanja, (2013), noted that organizations also use
contingency pay in rewarding employees who meet and exceed the set targets. Contingency pay
is based on performance level, employee rank within the organization, career development,
competence and skills exhibited by an employee among other (Armstrong, 2012). Tsai, (2005)
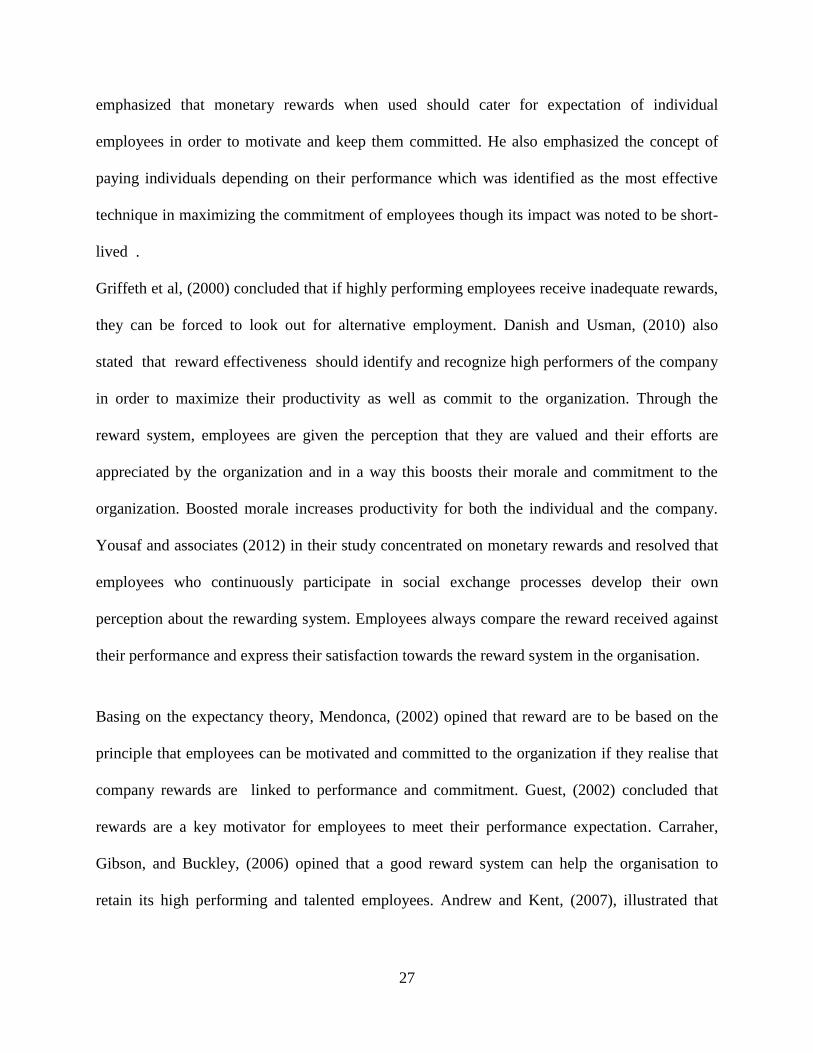
27
emphasized that monetary rewards when used should cater for expectation of individual
employees in order to motivate and keep them committed. He also emphasized the concept of
paying individuals depending on their performance which was identified as the most effective
technique in maximizing the commitment of employees though its impact was noted to be short-
lived .
Griffeth et al, (2000) concluded that if highly performing employees receive inadequate rewards,
they can be forced to look out for alternative employment. Danish and Usman, (2010) also
stated that reward effectiveness should identify and recognize high performers of the company
in order to maximize their productivity as well as commit to the organization. Through the
reward system, employees are given the perception that they are valued and their efforts are
appreciated by the organization and in a way this boosts their morale and commitment to the
organization. Boosted morale increases productivity for both the individual and the company.
Yousaf and associates (2012) in their study concentrated on monetary rewards and resolved that
employees who continuously participate in social exchange processes develop their own
perception about the rewarding system. Employees always compare the reward received against
their performance and express their satisfaction towards the reward system in the organisation.
Basing on the expectancy theory, Mendonca, (2002) opined that reward are to be based on the
principle that employees can be motivated and committed to the organization if they realise that
company rewards are linked to performance and commitment. Guest, (2002) concluded that
rewards are a key motivator for employees to meet their performance expectation. Carraher,
Gibson, and Buckley, (2006) opined that a good reward system can help the organisation to
retain its high performing and talented employees. Andrew and Kent, (2007), illustrated that
28
reward system and performance recognition are some key factors for job satisfaction and
commitment.
A study by Shield (2007) revealed that contingent pay incentive is used to encourage desired
behaviors within an institution. Nevertheless, Armstrong and Mullis (2007) noted that sometimes
these create discontent if they are perceive to be unfairly distributed and if they perceive that
they are badly managed. Contingent pay schemes most cases rely on judgment of management if
there are no proper procedures of measuring employee performance and competence therefore
sometimes it is being biased. Gracci and Kleiner (2006) in their study noted that benefits are
sometimes given to dismay staff turnover through an attractive work atmosphere to staff.
Through employee benefits, employers can attract talented employees because they provide an
employer with significant impact to choice making by an employee. Hong et al., (2005) also
emphasized that most staff get attracted to work where there are enough benefits. Employee
benefits therefore perform a significant role in organizational growth and improvement of
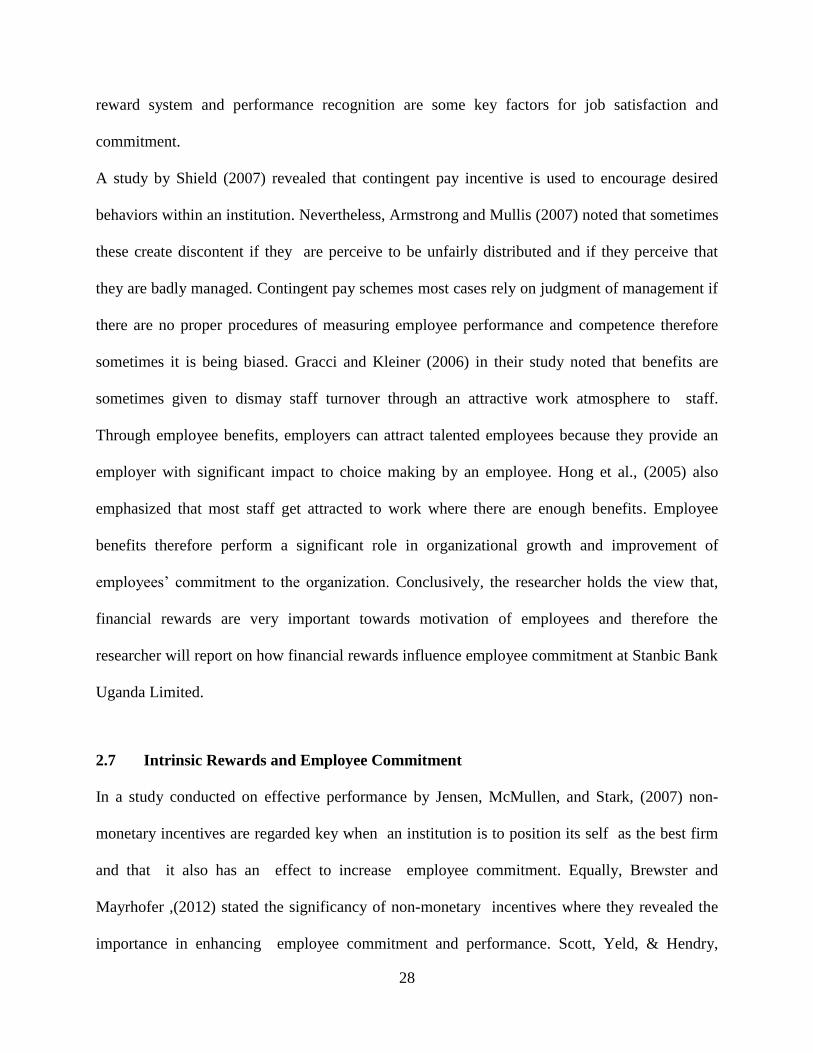
employees’ commitment to the organization. Conclusively, the researcher holds the view that,
financial rewards are very important towards motivation of employees and therefore the
researcher will report on how financial rewards influence employee commitment at Stanbic Bank
Uganda Limited.
2.7 Intrinsic Rewards and Employee Commitment
In a study conducted on effective performance by Jensen, McMullen, and Stark, (2007) non-
monetary incentives are regarded key when an institution is to position its self as the best firm
and that it also has an effect to increase employee commitment. Equally, Brewster and
Mayrhofer ,(2012) stated the significancy of non-monetary incentives where they revealed the
importance in enhancing employee commitment and performance. Scott, Yeld, & Hendry,
29
(2007) regarded non-monetary rewards as a tool in developing value in the reward program to
justify outstanding performance. Fagbenle, Adeyemi, and Adesanya, (2004) in their assessment
noted that application of non-monetary incentives increased productivity time and consequently
enhanced brick laying productivity.
In her study, Keller, (1999) noted that non-monetary rewards motivates and helps to instil a
sense of satisfaction for employees. Several studies showed that employees who are recognised
at the work place get higher self-confidence and a feeling of willingness to embrace innovations
and take up new challenges (Allen &Kilmann, 2001).Appreciated employee always achieve
beyond organizational expectations and are likely to get more committed to the organization.
Welsh et al, (2012), noted that such staffs are always confident and as a result end up being more
reliable and the best employees in the organization translating into greater employee
commitment. Despite its advantages, execution of non-monetary rewards is more difficult
(Armstrong, 2010).
Researches into rewards as a way of committing employees tend to support two schools of
thoughts in terms of both cash and non-cash rewards. One school argues that financial incentives
are more efficient in attaining staff commitment (Angle & Perry, 1983) whereas the other insist
that the other argues that non-financial rewards are more suited for motivating employees( Brief
&Aldag,1983).
Torrington and associates (2009) in their study used the term non material rewards and
concluded that these can increase job satisfaction for high performing employees. They further
noted that these may include recognizing employee of the year, month or week, sharing success
stories among others. In their study, they emphasized balancing both the intrinsic and extrinsic
30
rewards in order for the rewards system to sufficiently meet employee needs and consequently
achieve optimization of employee commitment, inspiration and employee job contentment.
The researcher is in agreement with the above assertion that both monetary l and non-monetary
on-financial rewards are powerful and effective in influencing employees’ commitment and this
therefore has prompted the researcher to carry out a study in Stanbic Bank Uganda to find out
how both financial and non-financial rewards influence employee commitment.
2.8 Summary of the literature review
Conclusively, many studies were done some years ago and in different places not particularly at
Stanbic Bank Uganda Limited. Therefore, this study has been carried at Stanbic Bank Uganda to
cover the gaps and contradiction in the findings of Lee (2010) where he observed that employee
commitment involves an employees willingness and devotion to exert efforts on behalf of an
organization as a results of fair rewards and Meyer and Herscovitch (2001) who argued that
employee commitment involve behavioral terms which describe the actions a committed or non-
committed employee takes.
31
CHAPTER THREE
METHODOLOGY
3.1 Introduction
In this part, the researcher presents some approaches which she used in data collection in order to
respond to the research questions and to investigate the problem researched. it looks at the
research design, population, sample size, data collection instruments , data quality control and
data analysis..
3.2 Research design
A cross-sectional correlation survey design was used to conduct the study. According to Ezeani
(2002), a cross-sectional survey is the best because it is used to gather information about the
population at the same point in time. It was used since it is simple, least costly and less time
consuming. The researcher was able to collect the data within the shortest possible time. The
study also applied the quantitative and qualitative approaches. Quantitative research allows the
researcher to measure and analyze data. It also makes the research findings more objective
(Amin 2003). Qualitative research enables us to explore new areas, deal with value laden-
questions, build theories, and to do in-depth examination of phenomena. The mixed approach
was applied in sample selection, and data collection. Amin (2003) supports the use of a mixed
approach because these help to analyse the research problem from all angles and to confirm the
data accuracy.
32
3.3 Study Population
A study population is the total of given items or individuals with common characteristics of
interest to the researcher (Amin, 2005). According to Neumann, (2006), a study population is the
abstract of a large group of many cases of interest to the researcher where she draws a sample
from which results are generalized.
The study population consisted of 220 as per (Annual Report of SBUL 2016) made up ofthese
included10 Managers, 12 Supervisors and 198 Officers respondents (Stanbic report 2016)in
Kampala whom the researcher met at the SBUL Head office. The interviewed category of
employees have enough knowledge in this area of study.
3.4 Determination of the sample size
This study was based on a sample size drawn from a selected population from the SBUL staff at
the head office at Crested Towers. The sample size selected was based Krejcie and Morgan
(1970 pp. 607-610) table. Krejcie and Morgan (1970) also states that each sub-group is to be
treated as a population hence use the table to determine the sample size .
Table 1: Sample size and techniques for collection
Category Population Sample Sample Technique
Managers 10 04 Purposive sampling
Supervisors 12 06 Purposive sampling
Officers 198 126 Simple random sampling
Total 220 136
Source: Stanbic Bank staff List (2016)
3.5 Sampling Techniques and Procedures
In this study, the researcher made use of both the purposive sampling and simple Random
sampling methods. Simple random sampling method was applied in selecting SBUL officers at
Crested Towers because the researcher had to ensure that all respondents in this category had an
33
equal opportunity to be select. The researcher believed that all the respondents had all the needed
information for the study. Best and Khan (2003) indicated that this technique ensures equal
Chances to all elements to being selected and this also in line with Amin (2005). Before applying
simple random sampling, the researcher constructed a sample frame with all the elements and
then randomly did the selection of the sample using simple random sampling. Purposive
sampling was used when sampling top administrators. Mugenda and Mugenda (1999) says that
purposive sampling normally focuses on a specific characteristics of interest to the researcher in
the population. People who do not fit the study are always eliminated and the most suitable
candidates remain. The researcher used purposive selection approach while selecting the top
administrators where he considered the level of education and work experience for one to be
recruited into the sample and therefore purposive sampling technique was the most appropriate
method for this reason.
3.5.1 Simple Random sampling
The researcher used the above technique to select officers because according to Amin (2005), it
avoided bias. The technique was selected because this category of these respondents had a large
population.
3.5.2 Purposive Sampling Techniques
Purposive sampling was used in selecting managers and supervisors who were targeted due to
their knowledge and experience regarding the employees’ commitment at SBU. The technique
was used since the sample was to be taken from a smaller group and there was need to collect
very informative data (Sekaran, 2003). Kothari, (2000) argued that sampling saves time and
money, labor and the research findings were generalized to the populations from which samples
were selected.
34
3.6 Data Collection Methods
Both primary and secondary data were used in the research. Questionnaires and interviews were
used to gather primary information administered to the respondents following systematic
procedures as proposed by Nunnally & Berstein, (1994). Secondary data was obtained through
review of existing literature on pension schemes.
3.6.1 Primary data
It is referred to as the first-hand information got from the field for a particular purpose (Groves,
2010). This data was collected using questionnaire and interviews. This source was preferred
from other data sources because it gave first-hand information making the work more interesting
and original (Aguti, 2011).
3.6.2 Secondary data
Sekaran, (2003) noted that secondary data is considered to be cheaper and faster to obtain than
primary data. Secondary data is considered more flexible especially where survey data that was
collected is readily available.
Secondary data is also defined as the second hand information or data collected and analyzed by
someone other than the researcher. The researcher used secondary data got from the available
documents on commercial banks in Uganda, SBUAnnual reports,internet and magazines
3.7 Data Collection Instruments
The study applied the following data collection methods to collect data; the use of
questionnaires, face to face interviews, interview schedules and documentary review. According
to Uma (2000), collecting data from multiple sources which gave a more comprehensive data
base about the study area. Multiple sources also provided verification and validity while
35
complementing similar data in the research. This explained why the researcher used multiple
data collection instruments to collect both primary and secondary data, focusing on employee
commitment.
3.7.1 Questionnaires
These are pre- analysed questions which gives the respondent pre-defined alternatives to choose
from (Sekeran 2003). Questionnaires have been used because they increase the degree of
reliability due to the many items in them and they as well enhanced the chances of getting valid
data, (Amin 2005). For example, for quantitative data, the Cronbach’s Alpha Coefficient test was
performed to check consistence. The Cronbach's Alpha Reliability Coefficient for Likert-Type
Scales was done for each variable. The questionnaire consisted of closed ended questions. Both
closed-ended and open-ended questions were used for qualitative and quantitative data
respectively. These questionnaires were administered mainly to pensioners and the public
service employees simply because these respondents were too many hence the questionnaires
became the most convenient and cheapest means of collecting data.
3.7.2 The interview guide
Semi structured interview questions were used in collecting qualitative data since its more
flexible and leads to probing questions from Reponses of the interviewee. According to Turner,
(2010) this enabled in-depth exploration of the views of the respondents. The interview guide
was distributed to Managers due to the nature of their area of responsibility and knowledge in the
same (Sekaran, 2003). The researcher asked probing questions which were pre- determined.
According to Turner, (2010) this enabled in-depth exploration of the views of the respondents.
With interviews more clarification on the issue can be made and interpretation of facial
36
expressions. This is also in line with (Amin 2005). Interviews are good to capture qualitative
data that needs answers beyond the likert scale measure of strongly agree, or disagree. Interviews
can very well measure attitudes and this was part of purpose for their use. In addition interviews
also gave the researcher an opportunity to capture some responses for certain issues which had
been under looked using other instruments yet vital in the study.
3.8 Data Collection procedure
Upon approval of the proposal, an introductory letter from the Institute was sought by the
researcher allowing her to conduct the study. Primary data was obtained from employees of
Stanbic Bank Uganda using a self-administered questionnaire. The researcher collected the
questionnaires and information gathered were analyzed and then she wrote the final report.
3.9 Data Quality Control
This ensured that data collected is reliable and valid
3.9.1 Validity
Jonathan Weiner, (2007) noted that validity can be measured as the degree of quantifying what a
measurement variable can succeed in achieving what it is designed for. Variations from expected
output can be caused by unsystematic events, inconsistencies or change in variable being
measured. The researcher gave the data collection instruments to two experts to establish validity
of data, evaluate relevance of the instrument, and to rate each item from the scale of 1-4. Upon
performing the tests, the results got were 70% or 0.7 and above. So, the instruments were
considered reliable according to Kathuri & Pal (1993) who concluded that validity content of o.7
and above is acceptable and reliable.
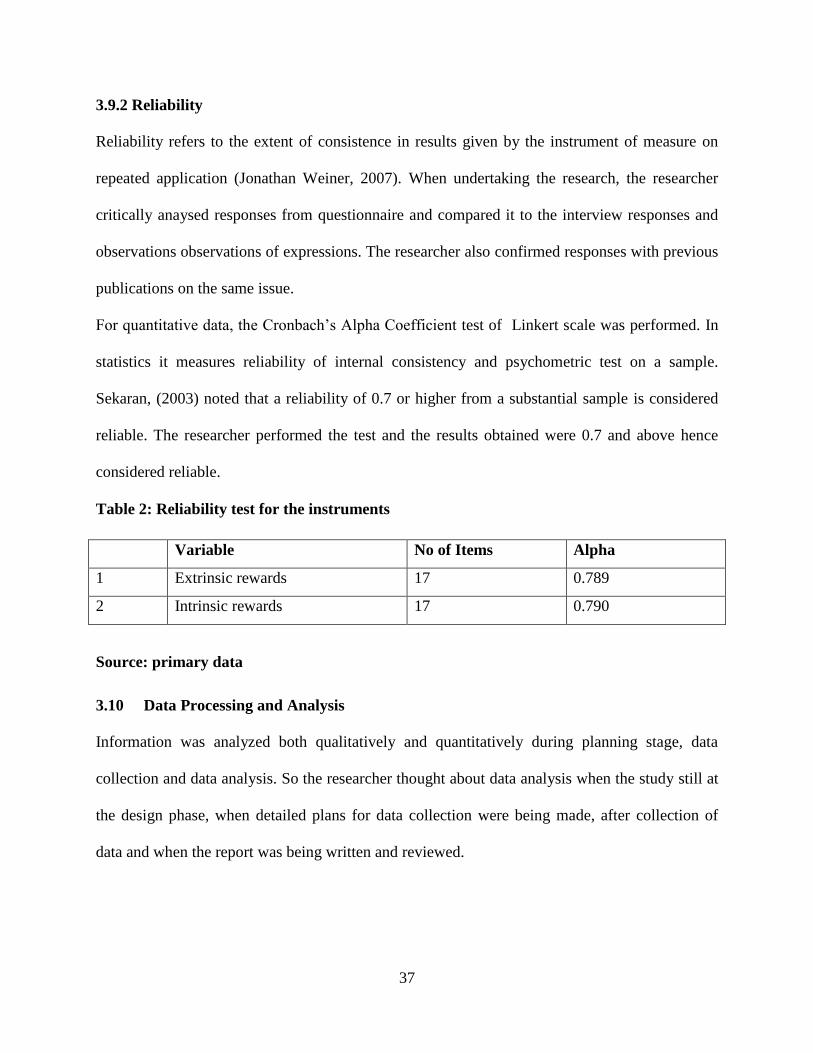
37
3.9.2 Reliability
Reliability refers to the extent of consistence in results given by the instrument of measure on
repeated application (Jonathan Weiner, 2007). When undertaking the research, the researcher
critically anaysed responses from questionnaire and compared it to the interview responses and
observations observations of expressions. The researcher also confirmed responses with previous
publications on the same issue.
For quantitative data, the Cronbach’s Alpha Coefficient test of Linkert scale was performed. In
statistics it measures reliability of internal consistency and psychometric test on a sample.
Sekaran, (2003) noted that a reliability of 0.7 or higher from a substantial sample is considered
reliable. The researcher performed the test and the results obtained were 0.7 and above hence
considered reliable.
Table 2: Reliability test for the instruments
Source: primary data
3.10 Data Processing and Analysis
Information was analyzed both qualitatively and quantitatively during planning stage, data
collection and data analysis. So the researcher thought about data analysis when the study still at
the design phase, when detailed plans for data collection were being made, after collection of
data and when the report was being written and reviewed.
Variable No of Items Alpha
1 Extrinsic rewards 17 0.789
2 Intrinsic rewards 17 0.790
38
3.10.1 Analysis of Quantitative data
Quantitative analysis is measures data with numbers. Its goal is to run a statistical analysis for
data to be put in a numerical form.
Data was sorted using the SPSS method and analysed quantitatively. Correlations were
computed in a sample that the researcher used. In this case the result is denoted by letter "r"
which is sometimes called "Pearson's r.". "Pearson's r” establishes the level of linearity and
ranges from relationship between variables and vice versa. “r” measures the degree of
association between two variables .
Sekaran (2005), noted that when studying correlations, the study should be carried out in an
organisation with natural environment with minimum interference and with no or minimum
manipulation. According to Maki (2004) quantitative method use numbers to interpret data. The
method is distinguished by emphasizing numbers and using statistical method (Palomba &
Banta, 1999). Most studies with big numbers should be analysed using qualitative methods
which normally stems from the hypothesis (Patton, 2002).
3.10.2 Qualitative Data analysis
It mainly focuses on collection of non-numerical information. Unlike statistical analysis,
qualitative data is used to draw patterns and get a general feel of the information. So, both
content and thematic analysis these complement each other.
Further, from the study conducted by Denzin and Lincoln, (2004) qualitative data involves
interpreting the research findings and Upcraft and Schuh (1996) stated that the method give a
detailed account of events and situations plus observed behavior and attitude about a certain
issue.
39
3.11 Measurement of variables
The researcher used nominal, ordinal and Linkert type of rating scales of measurement as stated
in (Mugenda and Mugenda, 2003) in designing of questionnaires. Background variables like
marital status , gender were measured using nominal scale rating while variables like age, level
of experience were measured with ordinal scale rating. The Linkert scale was used in data
collection and measurement of variables.
The Likert rating scale was chosen because it measures perception, values, behaviours and
attitudes of the respondents.
3.12 Ethical Considerations
Ethics are a moral principle and the value influencing the way a researcher conduct his/ her
research activities (Malhotra and Birks, 2002; Saunders et al, 2007). Churchill , (1999) noted
that ethics apply to situations in which there can be potential harm of any kind to anybody
.
In this study, all participants information was kept confidential and not availed to anyone unless
with respondent permission. All respondents were informed of the risks involved and were told
to give information willingly. . The study applied the principle; this required that interviewees
giving information voluntarily. All the interviewees willingly participated in the semi-structured
interview and in filing the questionnaire. In addition participants remained anonymous at all
stages throughout the study.
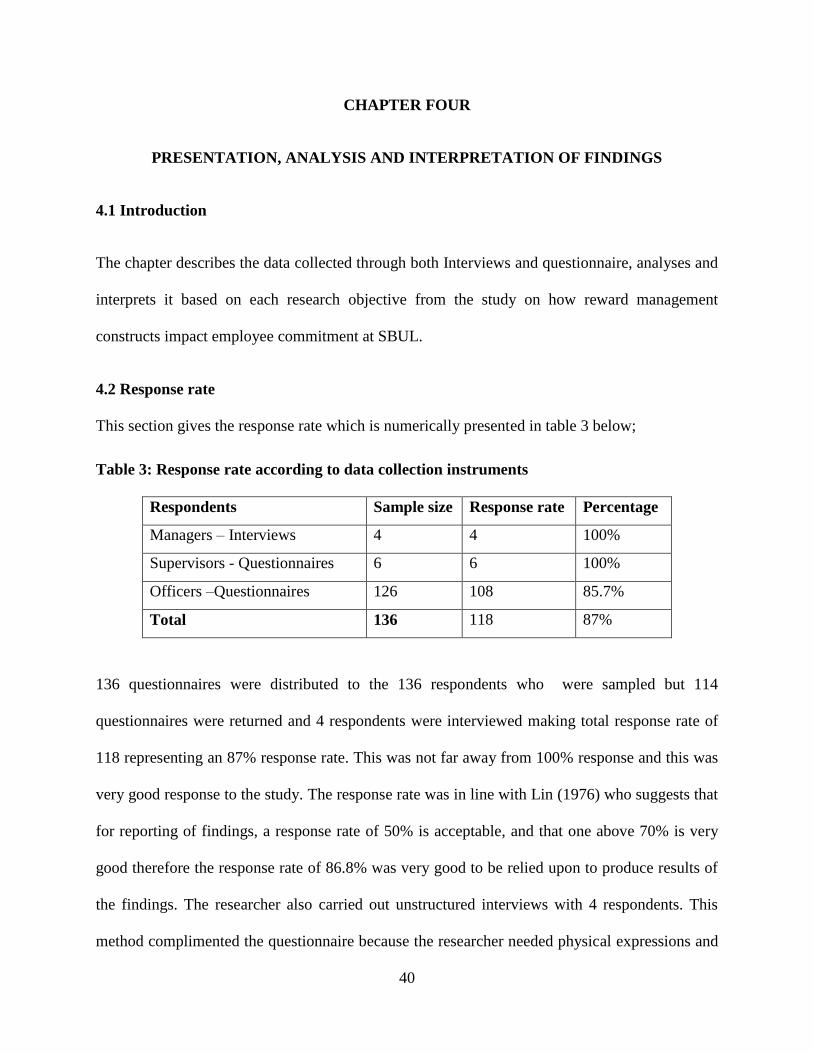
40
CHAPTER FOUR
PRESENTATION, ANALYSIS AND INTERPRETATION OF FINDINGS
4.1 Introduction
The chapter describes the data collected through both Interviews and questionnaire, analyses and
interprets it based on each research objective from the study on how reward management
constructs impact employee commitment at SBUL.
4.2 Response rate
This section gives the response rate which is numerically presented in table 3 below;
Table 3: Response rate according to data collection instruments
Respondents Sample size Response rate Percentage
Managers – Interviews 4 4 100%
Supervisors - Questionnaires 6 6 100%
Officers –Questionnaires 126 108 85.7%
Total 136 118 87%
136 questionnaires were distributed to the 136 respondents who were sampled but 114
questionnaires were returned and 4 respondents were interviewed making total response rate of
118 representing an 87% response rate. This was not far away from 100% response and this was
very good response to the study. The response rate was in line with Lin (1976) who suggests that
for reporting of findings, a response rate of 50% is acceptable, and that one above 70% is very
good therefore the response rate of 86.8% was very good to be relied upon to produce results of
the findings. The researcher also carried out unstructured interviews with 4 respondents. This
method complimented the questionnaire because the researcher needed physical expressions and
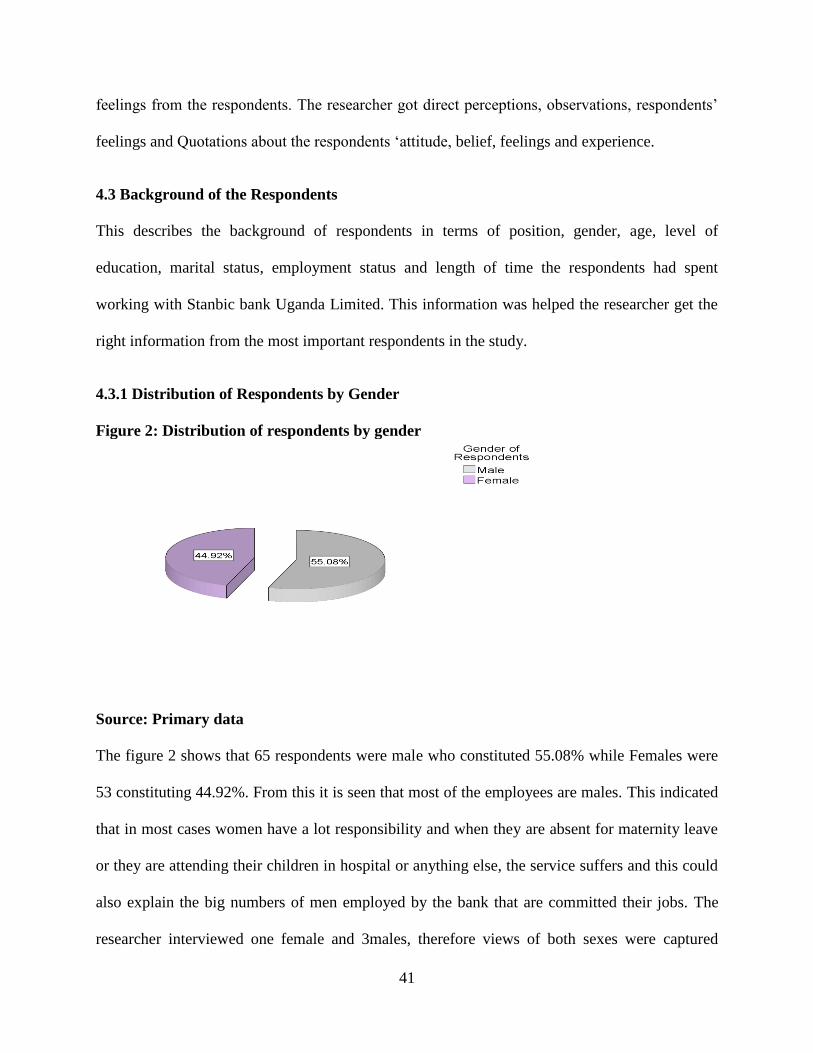
41
feelings from the respondents. The researcher got direct perceptions, observations, respondents’
feelings and Quotations about the respondents ‘attitude, belief, feelings and experience.
4.3 Background of the Respondents
This describes the background of respondents in terms of position, gender, age, level of
education, marital status, employment status and length of time the respondents had spent
working with Stanbic bank Uganda Limited. This information was helped the researcher get the
right information from the most important respondents in the study.
4.3.1 Distribution of Respondents by Gender
Figure 2: Distribution of respondents by gender
Source: Primary data
The figure 2 shows that 65 respondents were male who constituted 55.08% while Females were
53 constituting 44.92%. From this it is seen that most of the employees are males. This indicated
that in most cases women have a lot responsibility and when they are absent for maternity leave
or they are attending their children in hospital or anything else, the service suffers and this could
also explain the big numbers of men employed by the bank that are committed their jobs. The
researcher interviewed one female and 3males, therefore views of both sexes were captured
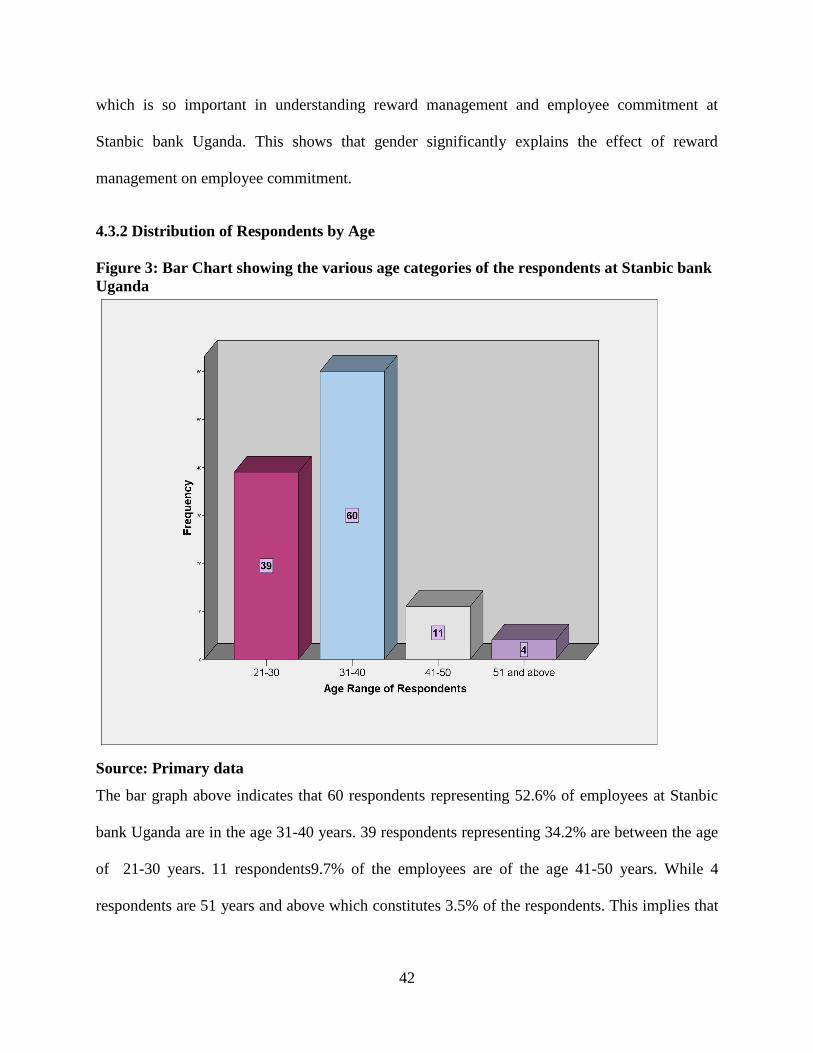
42
which is so important in understanding reward management and employee commitment at
Stanbic bank Uganda. This shows that gender significantly explains the effect of reward
management on employee commitment.
4.3.2 Distribution of Respondents by Age
Figure 3: Bar Chart showing the various age categories of the respondents at Stanbic bank
Uganda
Source: Primary data
The bar graph above indicates that 60 respondents representing 52.6% of employees at Stanbic
bank Uganda are in the age 31-40 years. 39 respondents representing 34.2% are between the age
of 21-30 years. 11 respondents9.7% of the employees are of the age 41-50 years. While 4
respondents are 51 years and above which constitutes 3.5% of the respondents. This implies that
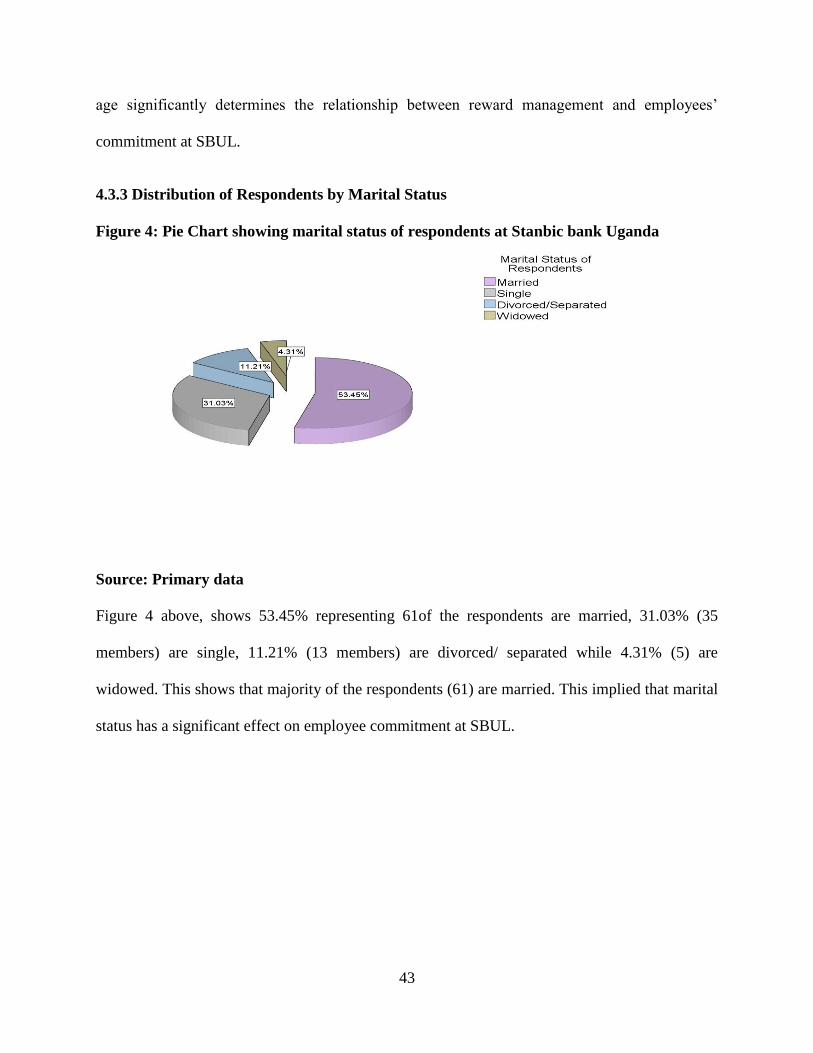
43
age significantly determines the relationship between reward management and employees’
commitment at SBUL.
4.3.3 Distribution of Respondents by Marital Status
Figure 4: Pie Chart showing marital status of respondents at Stanbic bank Uganda
Source: Primary data
Figure 4 above, shows 53.45% representing 61of the respondents are married, 31.03% (35
members) are single, 11.21% (13 members) are divorced/ separated while 4.31% (5) are
widowed. This shows that majority of the respondents (61) are married. This implied that marital
status has a significant effect on employee commitment at SBUL.
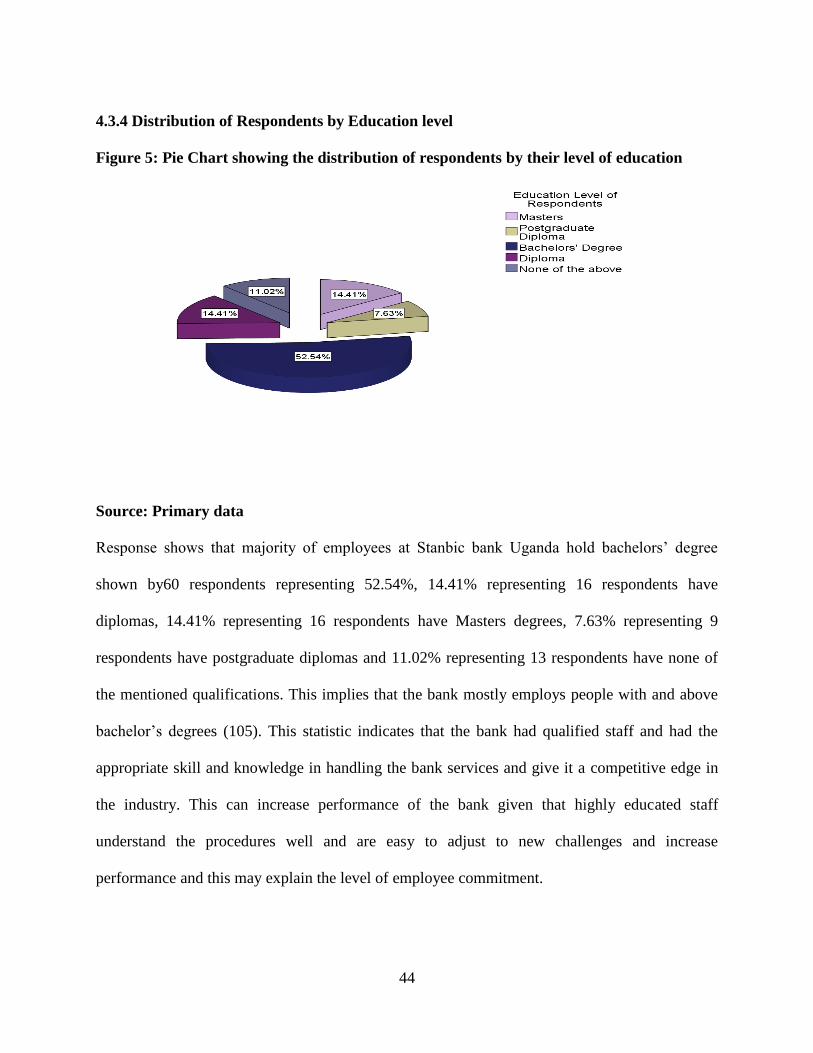
44
4.3.4 Distribution of Respondents by Education level
Figure 5: Pie Chart showing the distribution of respondents by their level of education
Source: Primary data
Response shows that majority of employees at Stanbic bank Uganda hold bachelors’ degree
shown by60 respondents representing 52.54%, 14.41% representing 16 respondents have
diplomas, 14.41% representing 16 respondents have Masters degrees, 7.63% representing 9
respondents have postgraduate diplomas and 11.02% representing 13 respondents have none of
the mentioned qualifications. This implies that the bank mostly employs people with and above
bachelor’s degrees (105). This statistic indicates that the bank had qualified staff and had the
appropriate skill and knowledge in handling the bank services and give it a competitive edge in
the industry. This can increase performance of the bank given that highly educated staff
understand the procedures well and are easy to adjust to new challenges and increase
performance and this may explain the level of employee commitment.
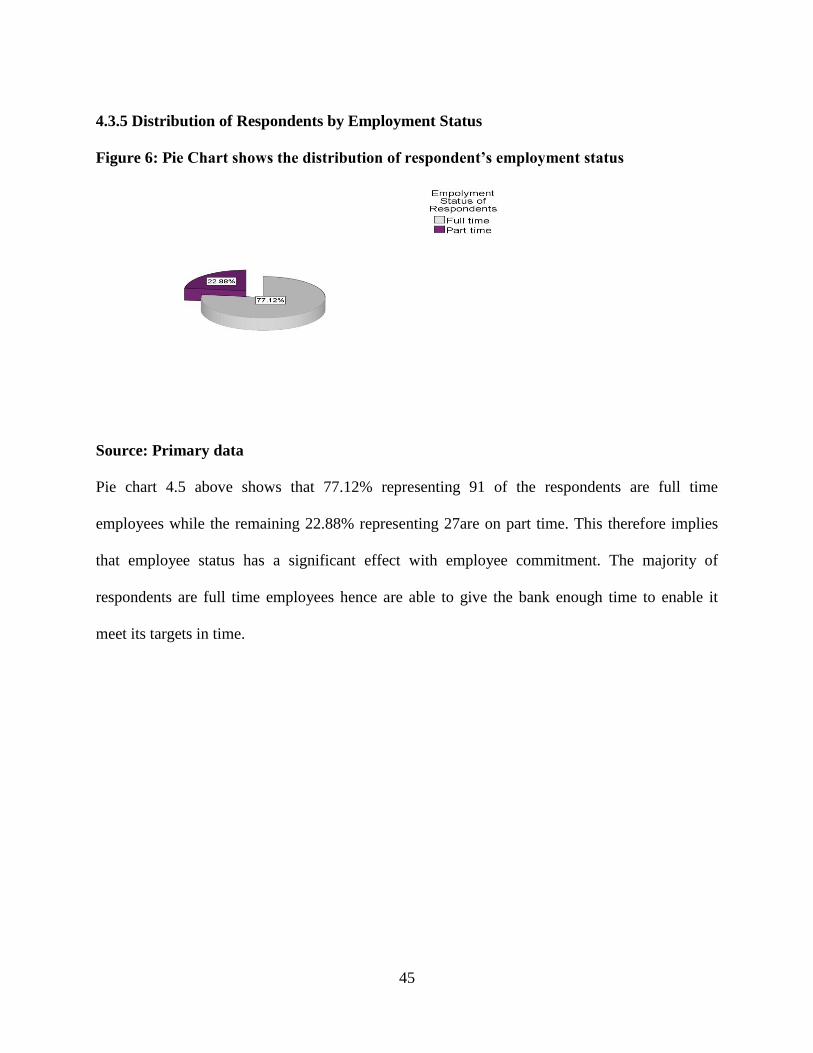
45
4.3.5 Distribution of Respondents by Employment Status
Figure 6: Pie Chart shows the distribution of respondent’s employment status
Source: Primary data
Pie chart 4.5 above shows that 77.12% representing 91 of the respondents are full time
employees while the remaining 22.88% representing 27are on part time. This therefore implies
that employee status has a significant effect with employee commitment. The majority of
respondents are full time employees hence are able to give the bank enough time to enable it
meet its targets in time.
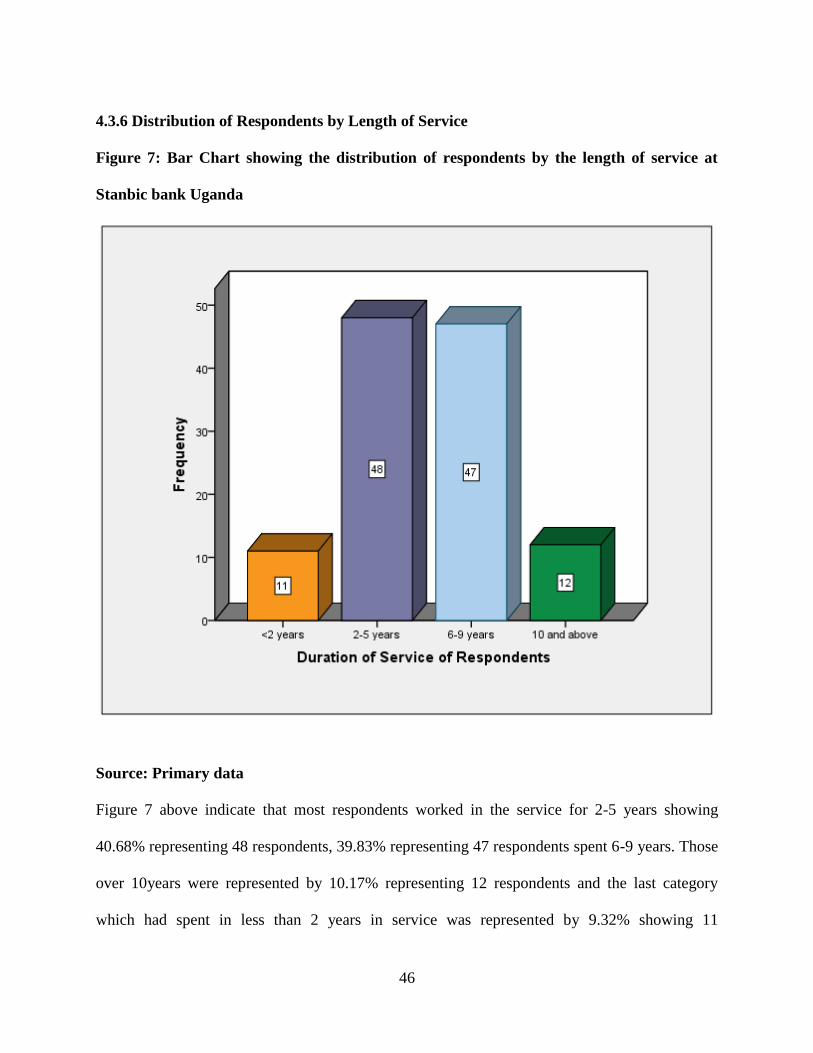
46
4.3.6 Distribution of Respondents by Length of Service
Figure 7: Bar Chart showing the distribution of respondents by the length of service at
Stanbic bank Uganda
Source: Primary data
Figure 7 above indicate that most respondents worked in the service for 2-5 years showing
40.68% representing 48 respondents, 39.83% representing 47 respondents spent 6-9 years. Those
over 10years were represented by 10.17% representing 12 respondents and the last category
which had spent in less than 2 years in service was represented by 9.32% showing 11
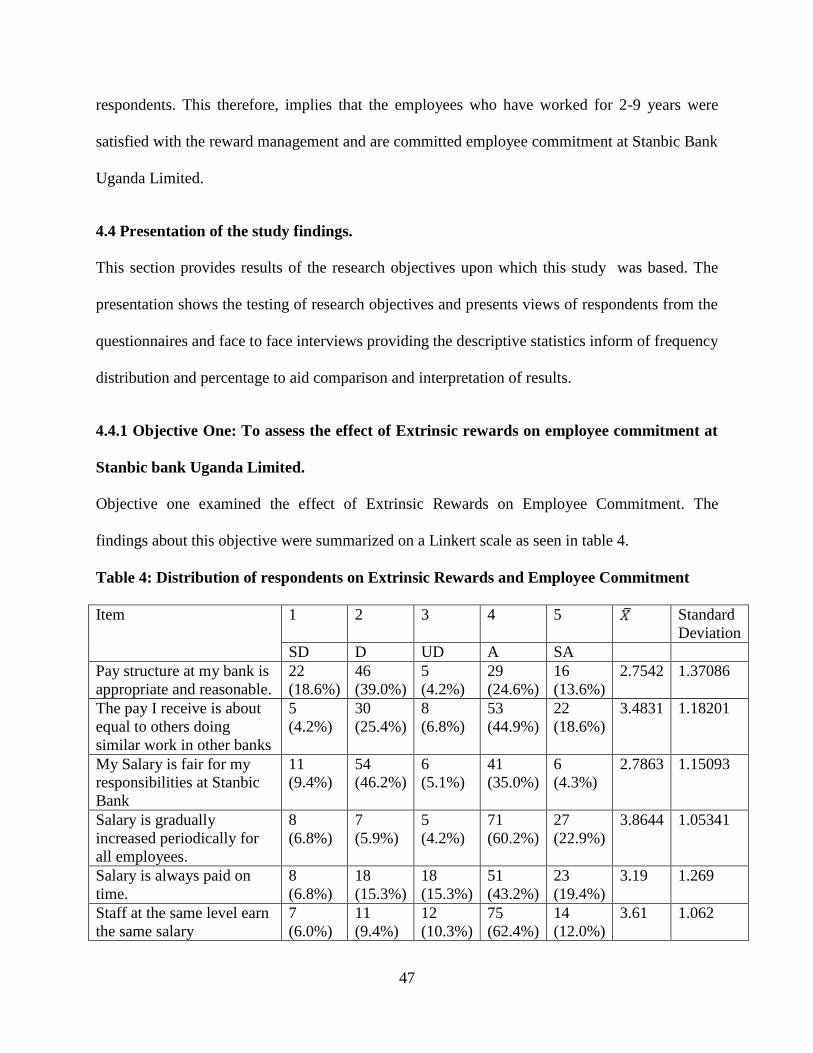
47
respondents. This therefore, implies that the employees who have worked for 2-9 years were
satisfied with the reward management and are committed employee commitment at Stanbic Bank
Uganda Limited.
4.4 Presentation of the study findings.
This section provides results of the research objectives upon which this study was based. The
presentation shows the testing of research objectives and presents views of respondents from the
questionnaires and face to face interviews providing the descriptive statistics inform of frequency
distribution and percentage to aid comparison and interpretation of results.
4.4.1 Objective One: To assess the effect of Extrinsic rewards on employee commitment at
Stanbic bank Uganda Limited.
Objective one examined the effect of Extrinsic Rewards on Employee Commitment. The
findings about this objective were summarized on a Linkert scale as seen in table 4.
Table 4: Distribution of respondents on Extrinsic Rewards and Employee Commitment
Item 1 2 3 4 5 Standard
Deviation
SD D UD A SA
Pay structure at my bank is
appropriate and reasonable.
22
(18.6%)
46
(39.0%)
5
(4.2%)
29
(24.6%)
16
(13.6%)
2.7542 1.37086
The pay I receive is about
equal to others doing
similar work in other banks
5
(4.2%)
30
(25.4%)
8
(6.8%)
53
(44.9%)
22
(18.6%)
3.4831 1.18201
My Salary is fair for my
responsibilities at Stanbic
Bank
11
(9.4%)
54
(46.2%)
6
(5.1%)
41
(35.0%)
6
(4.3%)
2.7863 1.15093
Salary is gradually
increased periodically for
all employees.
8
(6.8%)
7
(5.9%)
5
(4.2%)
71
(60.2%)
27
(22.9%)
3.8644 1.05341
Salary is always paid on
time.
8
(6.8%)
18
(15.3%)
18
(15.3%)
51
(43.2%)
23
(19.4%)
3.19 1.269
Staff at the same level earn
the same salary
7
(6.0%)
11
(9.4%)
12
(10.3%)
75
(62.4%)
14
(12.0%)
3.61 1.062
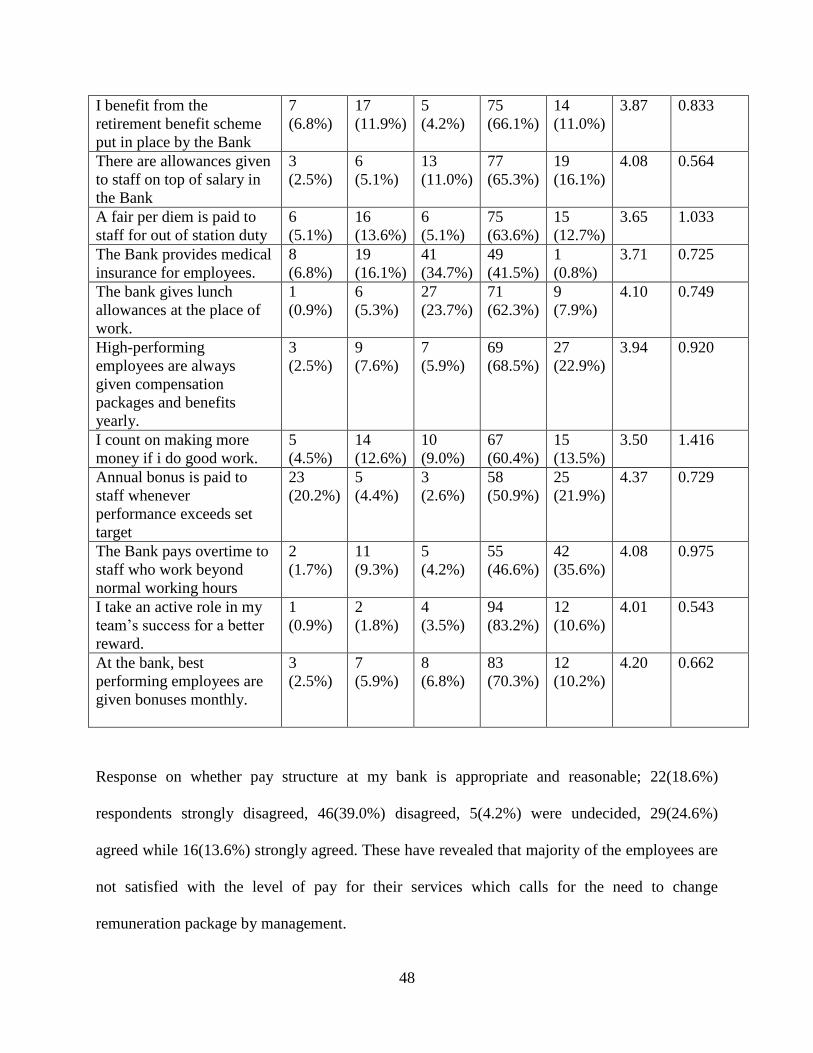
48
I benefit from the
retirement benefit scheme
put in place by the Bank
7
(6.8%)
17
(11.9%)
5
(4.2%)
75
(66.1%)
14
(11.0%)
3.87 0.833
There are allowances given
to staff on top of salary in
the Bank
3
(2.5%)
6
(5.1%)
13
(11.0%)
77
(65.3%)
19
(16.1%)
4.08 0.564
A fair per diem is paid to
staff for out of station duty
6
(5.1%)
16
(13.6%)
6
(5.1%)
75
(63.6%)
15
(12.7%)
3.65 1.033
The Bank provides medical
insurance for employees.
8
(6.8%)
19
(16.1%)
41
(34.7%)
49
(41.5%)
1
(0.8%)
3.71 0.725
The bank gives lunch
allowances at the place of
work.
1
(0.9%)
6
(5.3%)
27
(23.7%)
71
(62.3%)
9
(7.9%)
4.10 0.749
High-performing
employees are always
given compensation
packages and benefits
yearly.
3
(2.5%)
9
(7.6%)
7
(5.9%)
69
(68.5%)
27
(22.9%)
3.94 0.920
I count on making more
money if i do good work.
5
(4.5%)
14
(12.6%)
10
(9.0%)
67
(60.4%)
15
(13.5%)
3.50 1.416
Annual bonus is paid to
staff whenever
performance exceeds set
target
23
(20.2%)
5
(4.4%)
3
(2.6%)
58
(50.9%)
25
(21.9%)
4.37 0.729
The Bank pays overtime to
staff who work beyond
normal working hours
2
(1.7%)
11
(9.3%)
5
(4.2%)
55
(46.6%)
42
(35.6%)
4.08 0.975
I take an active role in my
team’s success for a better
reward.
1
(0.9%)
2
(1.8%)
4
(3.5%)
94
(83.2%)
12
(10.6%)
4.01 0.543
At the bank, best
performing employees are
given bonuses monthly.
3
(2.5%)
7
(5.9%)
8
(6.8%)
83
(70.3%)
12
(10.2%)
4.20 0.662
Response on whether pay structure at my bank is appropriate and reasonable; 22(18.6%)
respondents strongly disagreed, 46(39.0%) disagreed, 5(4.2%) were undecided, 29(24.6%)
agreed while 16(13.6%) strongly agreed. These have revealed that majority of the employees are
not satisfied with the level of pay for their services which calls for the need to change
remuneration package by management.
49
Contrary to this, in the interview conducted one respondent said that the salary has been
structured while considering a number of factors and feels that the earning an employee receives
is commensurate to the time offered for work and the magnitude of one’s task”.
This implied that the pay structure is well thought and fits the duty load on employees and this
results into employee commitment to the bank.
On the issue of whether the amount of salary received for the job is about equal to what others
doing similar work in other banks receive; 5(4.2%) strongly disagreed, 30 (25.4%) disagreed,
8(6.8%) were undecided, 53(44.9%) agreed and 22(18.6%) respondents strongly agreed. Most of
the respondents had information on how much other banks pay their employees and were quite
contented that their services are appreciated for similar jobs elsewhere so they feel not worse off
comparably. In addition, one of the respondents was quoted
“Stanbic is one of the best paying banks in the baking industry and on top of that at least am very
sure that my salary will be on my account by the 24th of every month”
This implied that the employees at the bank are committed to their employer because salary paid
by SBUL is reasonably competitive in the industry and so they would not wish to join other
banks.
Responses on whether my Salary is fair for my responsibilities at Stanbic Bank, 66 respondents
(55%) and 54(45.8%) strongly disagreed and disagreed respectively. 6(5.1%) were undecided,
while 46 respondents, 41(35.0%) and 6(5.1%) agreed and strongly agreed respectively. This
indicated that most of the respondents were contesting mismatch between salary and the size of

50
responsibility. Management is therefore faces the task undertake measures to ensure that these
gap are narrowed to avoid complaints.
In agreement with this, an interviewee had this to say;
“the salary we give is enough though human nature is known to be insatiable that one
will want a pay that is high though they can’t qualify what is high but we have tried our
best to give a good pay though not much as one would you want to fulfill their
expectations”.
This implied that Stanbic management has tried their best to have a competitive pay though it is
not yet to the level that satisfies their employees.
Respondents gave their views on whether salary is gradually increased periodically for all
employees and 8(6.8%) of them strongly disagreed, 7(5.9%) disagreed, 5(4.2%) were undecided,
71(60.2%) agreed while 27(22.9%) strongly agreed. Most of the respondents appreciated the fact
that their salary rises annually which is an attractive motivation mechanism towards maintaining
the services of employees with Stanbic bank Uganda.
This implied that the employees at the bank are well compensated for the duties which is an
incentive for employee commitment
However, one respondent said that it’s true the increment is there but not so attractive because a
percentage of between 2-4% of the salary which is seen as too low to be appreciated.
On whether salary is always paid on time; 7(6.8%) strongly disagreed, 17(11.9%) disagreed,
5(4.2%) were undecided, 75(66.1%) agreed and 14(11.0%) strongly agreed which meant that
though sometimes salary payment is delayed; in most cases it’s paid on time.
This was also confirmed from one interviewee who strongly stressed that by 24th of every month,
you are certain of your salary and if 24th falls on a weekend, then it’s paid before
51
Therefore, the expectations and morale of the employees is kept high which enhances their
concentration and commitment to assigned tasks. This implied that paying employees on time
results into employee commitment.
Response on whether staff at the same level earn the same salary 7(6.0%) strongly disagreed,
11(9.4%) disagreed, 12(10.3%) were undecided, 75(62.4%) agreed while 14(12.0%) strongly
agreed. These figures reflect that there is a narrow financial gap created in the payment of staff
which is likely to reduce tension and social conflicts over earnings. This implied that the salary
policies are good and enhance employee commitment.
The issue concerning benefits from the retirement benefit scheme put in place by the Bank,
8(6.8%) respondents strongly disagreed, 14(11.9%) disagreed, 5(4.2%) were undecided,
78(66.1%) agreed, 13(11.0%) strongly agreed. This showed that majority of respondents who are
employees of Stanbic bank Uganda are aware and they benefit from the retirement benefit
schemeat the bank and therefore their work effort is stimulated which encourages their
commitment with the bank.
Response on whether there are allowances given to staff on top of salary, 3(2.5%) respondents
strongly disagreed, 6(5.1%) disagreed, 13(11.0%) were undecided, 77(65.3%) agreed while
19(16.1%). Most respondents recognized the additional pay they receive in excess of their salary
which facilitates the satisfaction of their basic requirements and encourages them to stay
committed to the job and they can always to go extra mile to fulfill the bank’s objectives. One
interviewee confirmed that some of the additional benefits include lunch allowance for staff,
medical insurance is provided. He however noted that there are still gaps in these allowances for
example for lunch, the bank contributes only half and for medical only one option of the service
provider is given. Management should do a lot to improve.
52
Statistics on whether a fair per diem is paid to staff for out of station duty; 6(5.1%) respondents
strongly disagreed, 16(13.6%) disagreed, 6(5.1%) were undecided, 75(63.6%) agreed while
15(12.7%) strongly agreed. Truly according to majority responses, employees are satisfied with
the facilitation that the offers them for any duty outside the work station. This implies that they
are able to facilitate and sustain their needs in ensuring that the work requirements are fulfilled to
the satisfaction of the Bank.
Opinions on whether the bank provides medical insurance for employees 8(6.8%) respondents
strongly disagreed, 19(16.1%) disagreed, 41(34.7%) were undecided, 49(41.5%) agreed while
1(0.8%) strongly agreed. A big number of employees have been found out to be offered medical
insurance which is a good step the bank has taken in ensuring a healthy workforce. This shows
that the bank minds of the wellbeing of its staff.
However, we cannot ignore the fact that most people were undecided. From the interview most
respondents were also not very contented with the medical insurance since there are so many
challenges cited out for example limitation on the options of the service providers.
Also on whether the bank gives lunch allowances at the place of work; 1(0.9%) strongly
disagreed, 6(5.3%) disagreed, 27(23.7%) were undecided, 71(62.3%) agreed while 9(7.9%)
strongly agreed. These showed that the bank provides fringe benefits to employees in addition to
the salary. This implies that work is never employees are committed. However, some
interviewees argued management to provide full lunch instead of part payment to all staff.
Respondent’s views were sought on whether high-performing employees are always given
compensation packages and benefits yearly had 2(1.7%) strongly disagreed, 3(2.6%) disagreed,
6(5.2%) were undecided, 75(65.2%) agreed and 29(25.2%) strongly agreed. The results showed
53
that Stanbic bank Uganda has created a budget which recognizes and appreciates high
performance among its employees as a way of encouraging others to work harder and aid the
bank hit its targets. This is an incentive that has ensured employee commitment.
The question on whether if I do good work, I can be sure of earning some more money, 5(4.5%)
strongly disagreed generated 14(12.6%) disagreed responses, 10(9.0%) were undecided,
67(60.4%) agreed and 15(13.5%) strongly agreed. By majority response, Stanbic bank Uganda
has piece rate work system incorporated in its payment methods which favours the hardworking
employees at the expense of their less hard working counterparts. This implies that employees
are encouraged to work hard for money rewards and this leads to employee commitment.
Views on whether annual bonus is paid to staff whenever performance exceeds set target;
23(20.2%) strongly disagreed, 5(4.4%) disagreed, 3(2.6%) were undecided, 58(50.9%) agreed
and 25(21.9%) strongly agreed. Most of the respondents accepted there is an annual bonus in
place to reward exceptional employees which encourages them to work harder towards achieving
organization objectives. This was confirmed in an interview with another bank employee who
said;
“as a bank, we give bonuses at every end of year and also sometimes monthly depending on
availability of resources, to the staff that produced exceptional performances for that period so as
to encourage them and also motivate others”. These incentives have yielded wonderful results for
the bank.
Respondent’s views on whether the bank pays overtime to staff who work beyond normal
working hours; 2(1.7%) strongly disagreed, 11(9.3%) disagreed, 5(4.2%) were undecided,
55(46.6%) agreed while 42(35.6%) strongly agreed. These statistics showed the efforts put by
management of Stanbic bank Uganda towards meeting its objectives with ease.
54
Ideas of respondents on i take an active role in my team’s success for a better reward; 1(0.9%)
strongly disagreed, 2(1.8%) disagreed, 4(3.5%) were undecided, 94(83.2%) agreed and
12(10.6%) strongly agreed. These results indicated that much the work is possibly driven by the
team leaders without much involvement of the team members which creates backlog. However,
work load can easily be cleared only with the involvement of each and every member in the
team.
At the bank, best performing employees are given bonuses monthly 0(0.0%) strongly disagreed,
0(0.0%) disagreed, 3(2.7%) were undecided, 96(85.0%) agreed and 14(12.4%) strongly agreed.
The majority response agreed with the fact that the bank recognizes best performers regularly on
monthly basis and this was further affirmed by one of the interviewees who said that the bank
offers monthly bonus to the best performing employee. This compels the employees to excel in
their tasks thereby enabling the Stanbic bank Uganda to meet its monthly targets.
Correlations
Responses on team workshowed that there is a strong spirit of team work where the tasks and
achievements of the team are a collective responsibility of every member. This generates a sense
of belonging and hence employee commitment.
On whether the best performing employees are given bonuses monthly, 3(2.5%) respondents
strongly disagreed, 7(5.9%) disagreed, 8(6.8%) were not decided, 83(70.3%) agreed while
12(10.2%) strongly agreed. This implied that the motivation strategy in place is an enabling
factor for employees to strive for the best work output hence employee commitment.
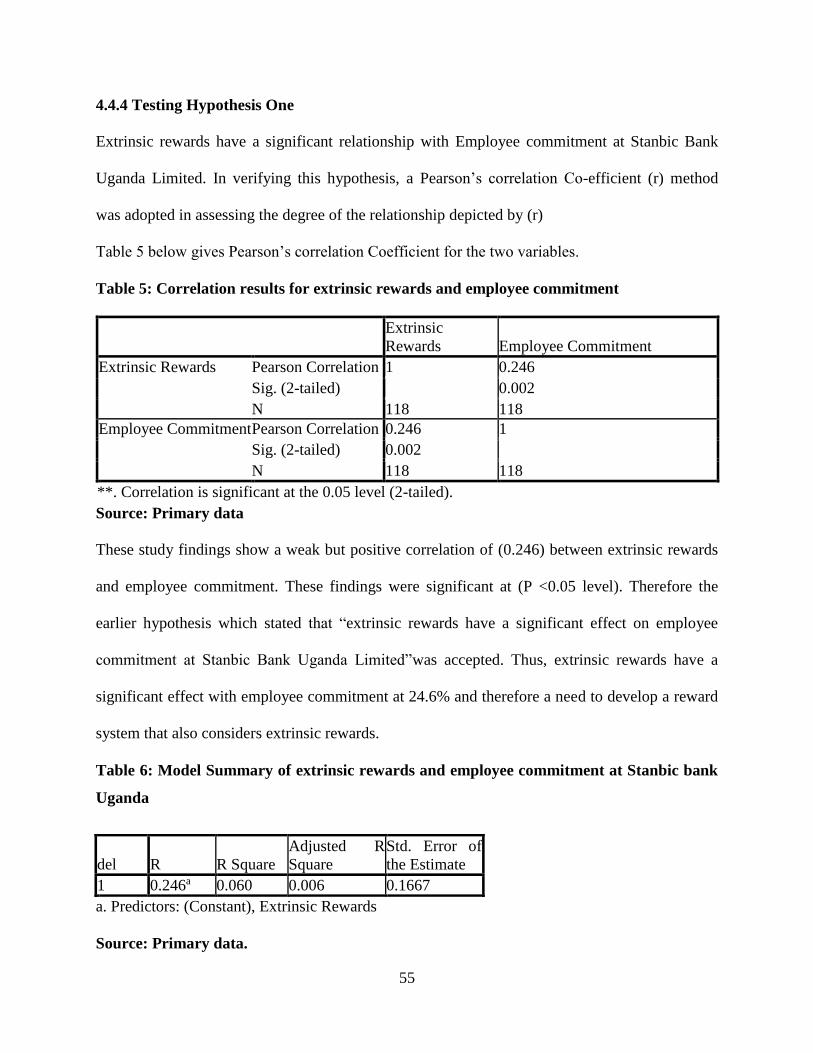
55
4.4.4 Testing Hypothesis One
Extrinsic rewards have a significant relationship with Employee commitment at Stanbic Bank
Uganda Limited. In verifying this hypothesis, a Pearson’s correlation Co-efficient (r) method
was adopted in assessing the degree of the relationship depicted by (r)
Table 5 below gives Pearson’s correlation Coefficient for the two variables.
Table 5: Correlation results for extrinsic rewards and employee commitment
Extrinsic
Rewards Employee Commitment
Extrinsic Rewards Pearson Correlation 1 0.246
Sig. (2-tailed) 0.002
N 118 118
Employee Commitment Pearson Correlation 0.246 1
Sig. (2-tailed) 0.002
N 118 118
**. Correlation is significant at the 0.05 level (2-tailed).
Source: Primary data
These study findings show a weak but positive correlation of (0.246) between extrinsic rewards
and employee commitment. These findings were significant at (P <0.05 level). Therefore the
earlier hypothesis which stated that “extrinsic rewards have a significant effect on employee
commitment at Stanbic Bank Uganda Limited”was accepted. Thus, extrinsic rewards have a
significant effect with employee commitment at 24.6% and therefore a need to develop a reward
system that also considers extrinsic rewards.
Table 6: Model Summary of extrinsic rewards and employee commitment at Stanbic bank
Uganda
del R R Square
Adjusted R
Square
Std. Error of
the Estimate
1 0.246a 0.060 0.006 0.1667
a. Predictors: (Constant), Extrinsic Rewards
Source: Primary data.
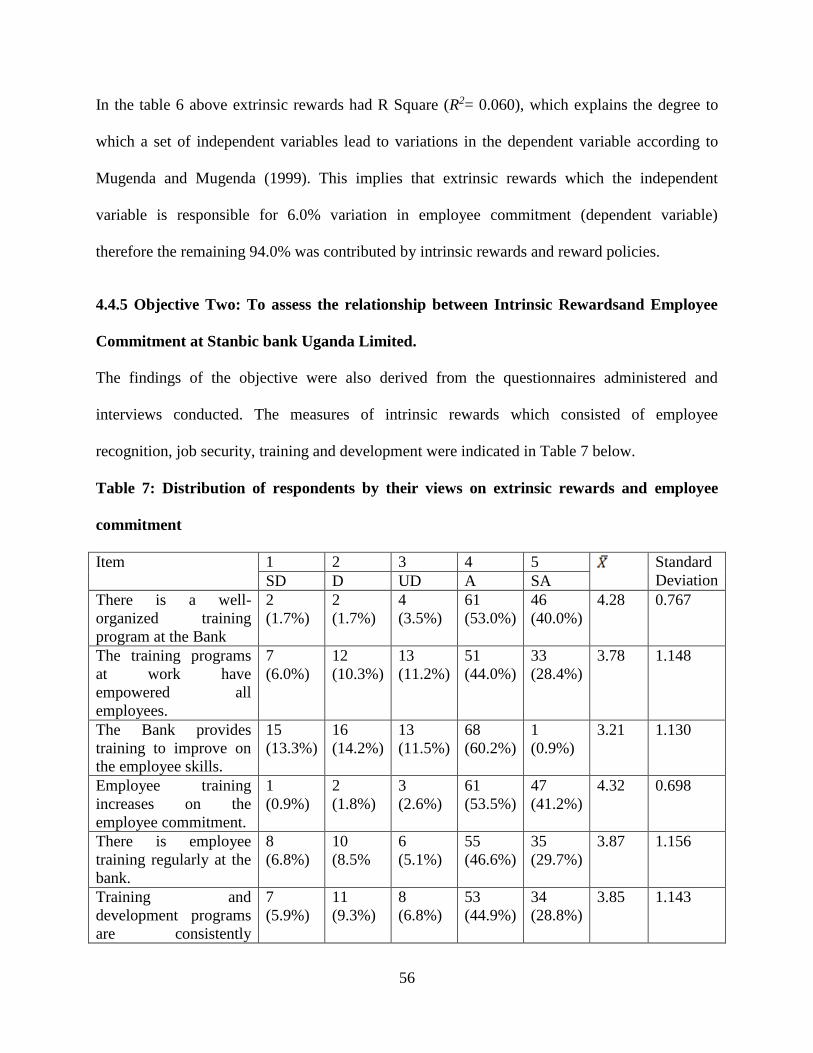
56
In the table 6 above extrinsic rewards had R Square (R2= 0.060), which explains the degree to
which a set of independent variables lead to variations in the dependent variable according to
Mugenda and Mugenda (1999). This implies that extrinsic rewards which the independent
variable is responsible for 6.0% variation in employee commitment (dependent variable)
therefore the remaining 94.0% was contributed by intrinsic rewards and reward policies.
4.4.5 Objective Two: To assess the relationship between Intrinsic Rewardsand Employee
Commitment at Stanbic bank Uganda Limited.
The findings of the objective were also derived from the questionnaires administered and
interviews conducted. The measures of intrinsic rewards which consisted of employee
recognition, job security, training and development were indicated in Table 7 below.
Table 7: Distribution of respondents by their views on extrinsic rewards and employee
commitment
Item 1 2 3 4 5 Standard
Deviation SD D UD A SA
There is a well-
organized training
program at the Bank
2
(1.7%)
2
(1.7%)
4
(3.5%)
61
(53.0%)
46
(40.0%)
4.28 0.767
The training programs
at work have
empowered all
employees.
7
(6.0%)
12
(10.3%)
13
(11.2%)
51
(44.0%)
33
(28.4%)
3.78 1.148
The Bank provides
training to improve on
the employee skills.
15
(13.3%)
16
(14.2%)
13
(11.5%)
68
(60.2%)
1
(0.9%)
3.21 1.130
Employee training
increases on the
employee commitment.
1
(0.9%)
2
(1.8%)
3
(2.6%)
61
(53.5%)
47
(41.2%)
4.32 0.698
There is employee
training regularly at the
bank.
8
(6.8%)
10
(8.5%
6
(5.1%)
55
(46.6%)
35
(29.7%)
3.87 1.156
Training and
development programs
are consistently
7
(5.9%)
11
(9.3%)
8
(6.8%)
53
(44.9%)
34
(28.8%)
3.85 1.143
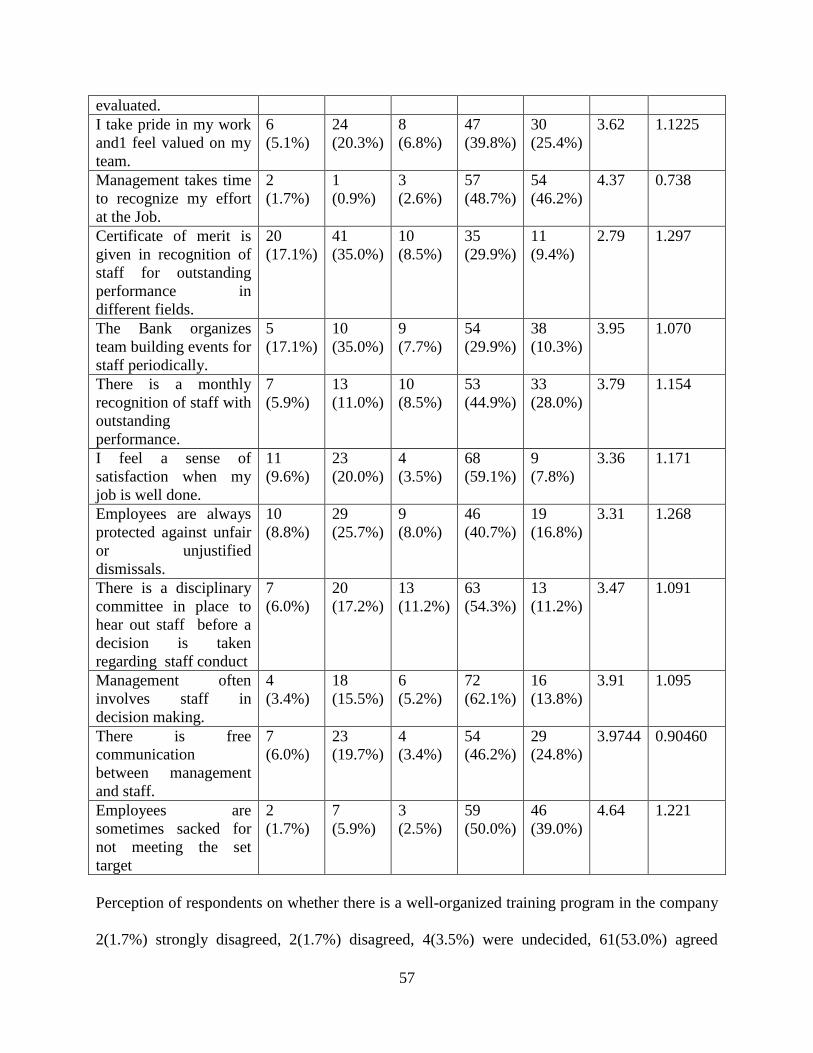
57
evaluated.
I take pride in my work
and1 feel valued on my
team.
6
(5.1%)
24
(20.3%)
8
(6.8%)
47
(39.8%)
30
(25.4%)
3.62 1.1225
Management takes time
to recognize my effort
at the Job.
2
(1.7%)
1
(0.9%)
3
(2.6%)
57
(48.7%)
54
(46.2%)
4.37 0.738
Certificate of merit is
given in recognition of
staff for outstanding
performance in
different fields.
20
(17.1%)
41
(35.0%)
10
(8.5%)
35
(29.9%)
11
(9.4%)
2.79 1.297
The Bank organizes
team building events for
staff periodically.
5
(17.1%)
10
(35.0%)
9
(7.7%)
54
(29.9%)
38
(10.3%)
3.95 1.070
There is a monthly
recognition of staff with
outstanding
performance.
7
(5.9%)
13
(11.0%)
10
(8.5%)
53
(44.9%)
33
(28.0%)
3.79 1.154
I feel a sense of
satisfaction when my
job is well done.
11
(9.6%)
23
(20.0%)
4
(3.5%)
68
(59.1%)
9
(7.8%)
3.36 1.171
Employees are always
protected against unfair
or unjustified
dismissals.
10
(8.8%)
29
(25.7%)
9
(8.0%)
46
(40.7%)
19
(16.8%)
3.31 1.268
There is a disciplinary
committee in place to
hear out staff before a
decision is taken
regarding staff conduct
7
(6.0%)
20
(17.2%)
13
(11.2%)
63
(54.3%)
13
(11.2%)
3.47 1.091
Management often
involves staff in
decision making.
4
(3.4%)
18
(15.5%)
6
(5.2%)
72
(62.1%)
16
(13.8%)
3.91 1.095
There is free
communication
between management
and staff.
7
(6.0%)
23
(19.7%)
4
(3.4%)
54
(46.2%)
29
(24.8%)
3.9744 0.90460
Employees are
sometimes sacked for
not meeting the set
target
2
(1.7%)
7
(5.9%)
3
(2.5%)
59
(50.0%)
46
(39.0%)
4.64 1.221
Perception of respondents on whether there is a well-organized training program in the company
2(1.7%) strongly disagreed, 2(1.7%) disagreed, 4(3.5%) were undecided, 61(53.0%) agreed
58
while 46(40.0%) strongly agreed. This showed that Stanbic bank Uganda does not overly depend
on the qualifications of its employees but rather put in more resources to enhance their skills so
that the predetermined targets are easily attained. The position from an interviewee seemed to
agree with what most respondents in the questionnaire indicated.
An interviewee had this to say;
“Actually in the banking industry, Stanbic Bank known as the training ground for other
banks. An evaluation is made after every training and a pass mark of 80% should be
attained by staff or you are reschedule for another training”.
When they were asked whether the training programs at work have empowered all employees
7(6.0%) strongly disagreed, 12(10.3%) disagreed, 13(11.2%) were undecided, 51(44.0%) agreed
while 33(28.4%) strongly agreed. This implied that the employees have been able to benefit from
the training programs organized by the bank, still on, a manager who was interviewed had this to
say ‘we as managers always try to arrange for enough trainings of the staff because that’s the
only way how we can empower them to strengthen our business in these volatile situations’
Data collected on whether the bank provides training to improve on the employee skills,
15(13.3%) strongly disagreed, 16(14.2%) disagreed, 13(11.5%) were undecided, 1(0.9%) agreed
and 33(28.4%) strongly agreed. This implied that the bank is committed to fulfill its objectives
by enrolling key employees in refresher trainings to boost their knowledge and work confidence.
When respondents were asked whether employee training increases on the employee
commitment; 1(0.9%) strongly disagreed, 2(1.8%) disagreed, 3(2.6%) were undecided,
61(53.5%) disagreed while 47(41.2%) strongly disagreed and whether there is employee training
regularly at the bank 8(6.8%) strongly disagreed, 10(8.5%) disagreed, 6(5.1%) was undecided,
59
55(46.6%) agreed while 35(29.7%) strongly agreed. These indicated that management is
committed to ensuring that employees do their work effectively and in an efficient manner which
is to the bank’s benefit.
In an interview had with one of the mangers,
‘ever since the bank started organizing trainings for the staff; it has had tremendous
improvement in services’.
This implied that the commitment of employees has increased, however the training seemed not
to apply to all employees which leaves out many making them to be unhappy.
Response on whether training and development programs are consistently evaluated, 7(5.9%)
respondents strongly disagreed, 11(9.3%) disagreed, 8(6.8%) were undecided, 53(44.9%) agreed
while 34(28.8%) strongly agreed. These meant that management keenly assesses the outcome of
the organized trainings to determine the costs in relation to the intended benefits. Thus the bank
continues investing resources in such programs whenever it sees that the benefits outweigh its
expenses.
When asked whether they take pride in their work and feel valued on their team, 6(5.1%)
respondents strongly disagreed, 24 (20.3%) disagreed, 8 (6.8%) were undecided, 47 (39.8%)
agreed while 30 (25.4%) strongly agreed. The majority indicated that most employees are proud
and feel valued in the work they do.
Response views on whether management takes time to recognize my effort at the job; 2(1.7%)
respondents strongly disagreed, 1(0.9%) disagreed, 3(2.6%) were undecided, 57(48.7%) agreed
and 54(46.2%) strongly agreed and on whether a certificate of merit is given in recognition of
staff for outstanding performance in different fields 20(17.1%) strongly disagreed, 41(35.0%)
disagreed, 10(8.5%) were undecided, 35(29.9%) agreed while 11(9.4%) strongly agreed.
60
These are in support of the interview remarks from a supervisor who said that
“our bank appreciates all categories of employees and recognizes their efforts in many
ways including a merit certificate given to good performers”.
When asked whether the bank organizes team building events for staff periodically; 5(17.1%)
respondents strongly disagreed, 10(35.0%) disagreed, 9(7.7%) were undecided, 54(29.9%)
agreed while 38(10.3%) strongly agreed. Most of the respondents disagreed that the bank
organizes team building events, this is however contrary to the information collected from the
interview where a supervisor said that the bank organizes annual ‘get together’ events to bring all
staff on board, build team spirit, enjoy together and forget their past experiences.
On whether there is a monthly recognition of staff with outstanding performance;7(5.9%)
strongly disagreed, 13(11.0%) disagreed, 10(8.5%) was undecided, 53(44.9%) agreed,
33(28.0%) strongly agreed. Most respondents confirmed that the bank actually does recognize its
outstanding staff as a way of applauding morale towards attainment of monthly targets, which
is a motivation strategy to employee commitment.
Views were sought on whether employees feel a sense of satisfaction when the job is well done;
11(9.6%) respondents strongly disagreed, 23(20.0%) disagreed, 4(3.5%) were undecided,
68(59.1%) agreed while 9(7.8%) strongly agreed. The results showed a strong desire by the
employees to perform well given the rewards attached which shows commitment to the bank.
On whether employees are always protected against unfair or unjustified dismissals; 11(9.6%)
respondents strongly disagreed, 23(20.0%) disagreed, 4(3.5%) were undecided, 68(59.1%)
agreed while 9(7.8%) strongly agreed. These responses indicate that a large section of staff enjoy
their job because there is security at the Job which motivates them to stay committed at work.
However the protection mechanisms need to be extended to the other categories of staff that are
61
highly susceptible to the risks of job loss. Information from one of the interviews conducted
quoted one respondent saying that “here at Stanbic bank, all our employees sign 2 years
renewable contracts to guard the interest of both the employer and the employees”
There is a disciplinary committee in place to hear out staff before a decision is taken regarding
staff conduct 7(6.0%) strongly disagreed, 20(17.2%) disagreed, 13(11.2%) were undecided,
63(54.3%) agreed and 13(11.2%) strongly agreed. Most of the respondents agreed that there are
normally subjected to fair hearing before decisions pertaining employee behavior are taken. This
committee comprises of representatives from management, senior staff, support staff and other
banking officers.
Responses on whether Management often involves staff in decision making, 4(3.4%)
respondents strongly disagreed, 18(15.5%) disagreed, 6(5.2%) were undecided, 72(62.1%)
agreed while 16(13.8%) strongly agreed and on whether there is free communication between
management and staff; 7(6.0%) strongly disagreed, 23(19.7%) disagreed, 4(3.4%) was
undecided, 54(46.2%) agreed while 29(24.8%) strongly agreed. This clearly showed that
management is flexible and are always ready to listen and help to manage issues that create
discontent among its employees. It also implies that views of the employees are seriously
considered which makes them valued at work.
On whether employees are sometimes sacked for not meeting the set target 2(1.7%) strongly
disagreed, 7(5.9%) disagreed, 3(2.5%) was undecided, 59(50.0%) agreed while 46(39.0%)
strongly agreed. The results showed that employees are encouraged to work hard in order to
continue enjoying benefits given by the bank. However, it was noted from one respondent that an
employee can get sacked after serious warning and being put on performance improvement plan
but cannot change
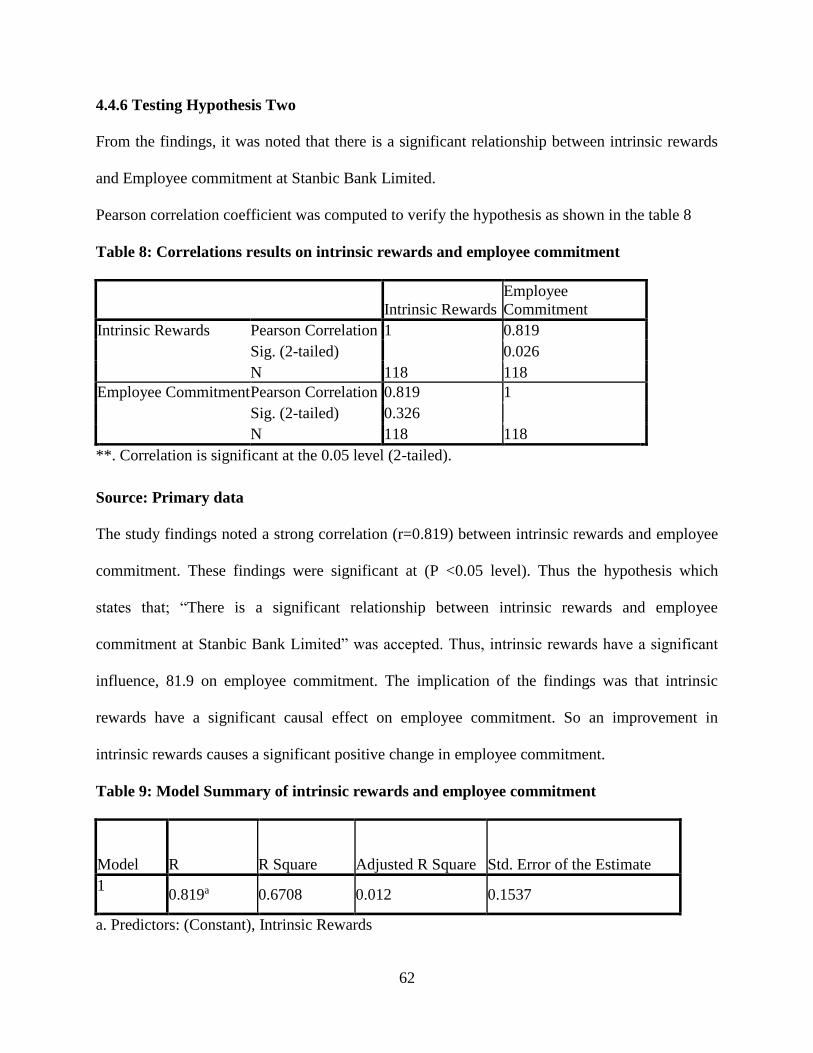
62
4.4.6 Testing Hypothesis Two
From the findings, it was noted that there is a significant relationship between intrinsic rewards
and Employee commitment at Stanbic Bank Limited.
Pearson correlation coefficient was computed to verify the hypothesis as shown in the table 8
Table 8: Correlations results on intrinsic rewards and employee commitment
Intrinsic Rewards
Employee
Commitment
Intrinsic Rewards Pearson Correlation 1 0.819
Sig. (2-tailed) 0.026
N 118 118
Employee Commitment Pearson Correlation 0.819 1
Sig. (2-tailed) 0.326
N 118 118
**. Correlation is significant at the 0.05 level (2-tailed).
Source: Primary data
The study findings noted a strong correlation (r=0.819) between intrinsic rewards and employee
commitment. These findings were significant at (P <0.05 level). Thus the hypothesis which
states that; “There is a significant relationship between intrinsic rewards and employee
commitment at Stanbic Bank Limited” was accepted. Thus, intrinsic rewards have a significant
influence, 81.9 on employee commitment. The implication of the findings was that intrinsic
rewards have a significant causal effect on employee commitment. So an improvement in
intrinsic rewards causes a significant positive change in employee commitment.
Table 9: Model Summary of intrinsic rewards and employee commitment
Model R R Square Adjusted R Square Std. Error of the Estimate
1 0.819a 0.6708 0.012 0.1537
a. Predictors: (Constant), Intrinsic Rewards
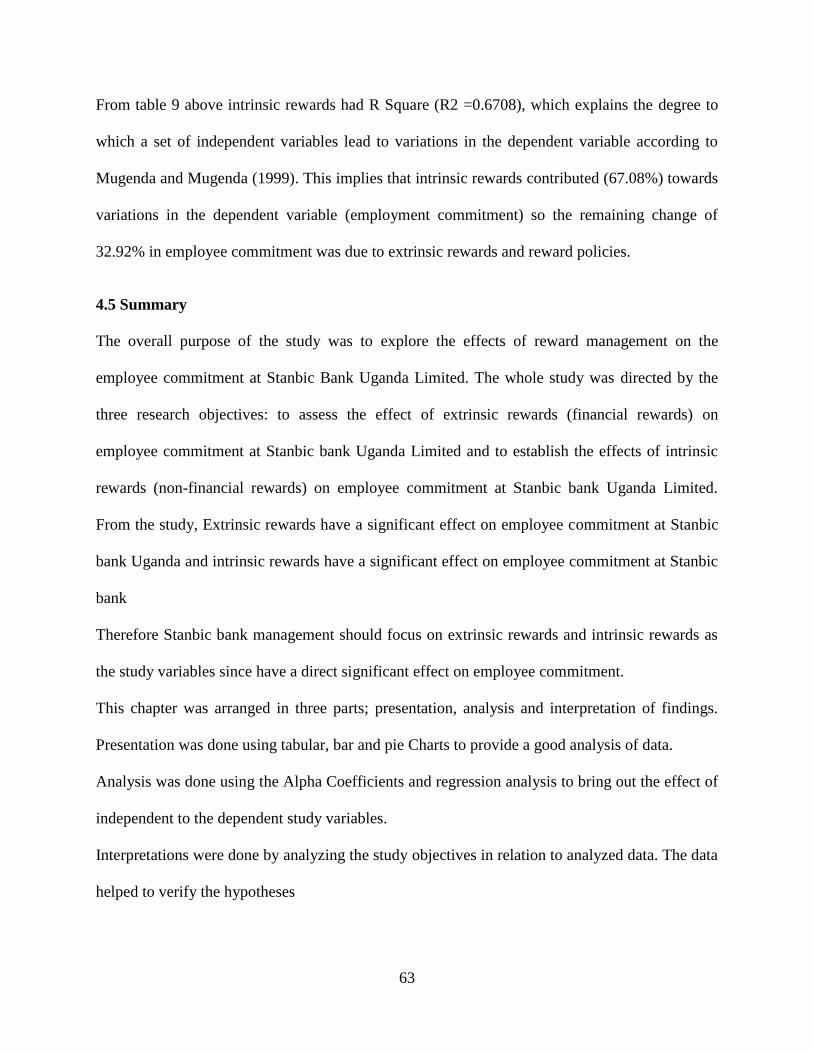
63
From table 9 above intrinsic rewards had R Square (R2 =0.6708), which explains the degree to
which a set of independent variables lead to variations in the dependent variable according to
Mugenda and Mugenda (1999). This implies that intrinsic rewards contributed (67.08%) towards
variations in the dependent variable (employment commitment) so the remaining change of
32.92% in employee commitment was due to extrinsic rewards and reward policies.
4.5 Summary
The overall purpose of the study was to explore the effects of reward management on the
employee commitment at Stanbic Bank Uganda Limited. The whole study was directed by the
three research objectives: to assess the effect of extrinsic rewards (financial rewards) on
employee commitment at Stanbic bank Uganda Limited and to establish the effects of intrinsic
rewards (non-financial rewards) on employee commitment at Stanbic bank Uganda Limited.
From the study, Extrinsic rewards have a significant effect on employee commitment at Stanbic
bank Uganda and intrinsic rewards have a significant effect on employee commitment at Stanbic
bank
Therefore Stanbic bank management should focus on extrinsic rewards and intrinsic rewards as
the study variables since have a direct significant effect on employee commitment.
This chapter was arranged in three parts; presentation, analysis and interpretation of findings.
Presentation was done using tabular, bar and pie Charts to provide a good analysis of data.
Analysis was done using the Alpha Coefficients and regression analysis to bring out the effect of
independent to the dependent study variables.
Interpretations were done by analyzing the study objectives in relation to analyzed data. The data
helped to verify the hypotheses
64
In this study, it was established that Extrinsic and Intrinsic rewards have a significant effect on
employee commitment at Stanbic bank Uganda. Therefore, Stanbic bank management could
focus on Reward policies, Extrinsic and Intrinsic Rewards as these have a direct positive
significant effect on employee commitment.
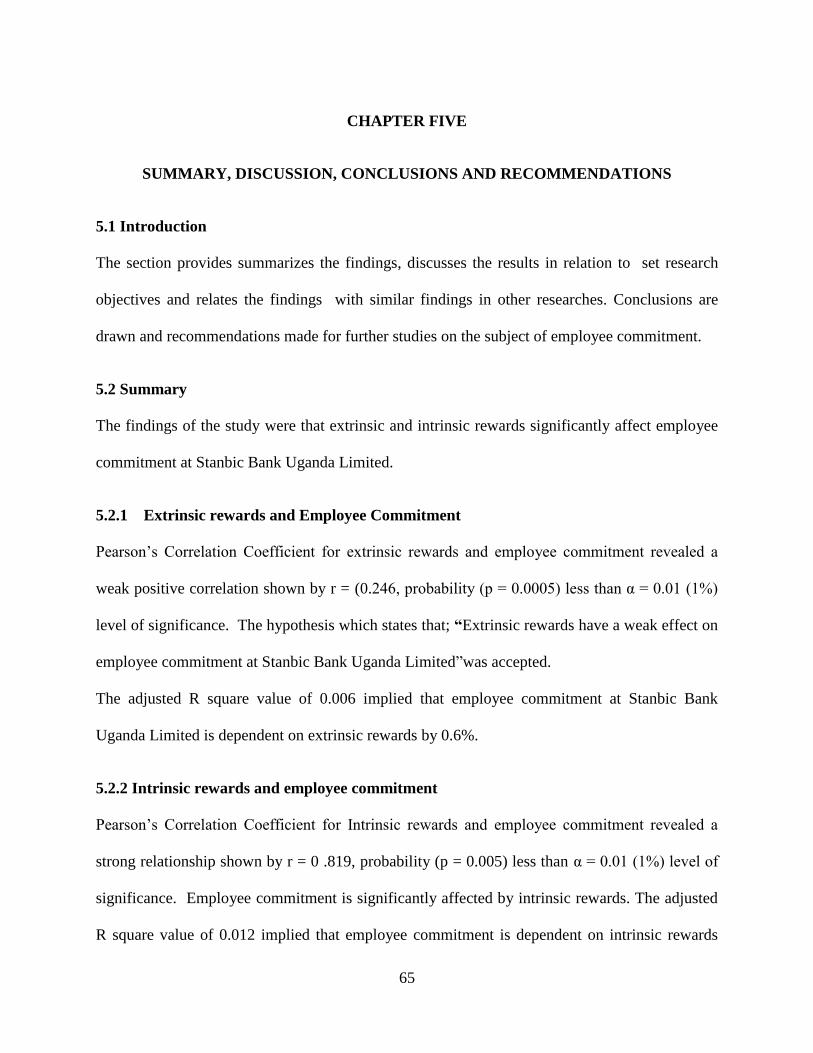
65
CHAPTER FIVE
SUMMARY, DISCUSSION, CONCLUSIONS AND RECOMMENDATIONS
5.1 Introduction
The section provides summarizes the findings, discusses the results in relation to set research
objectives and relates the findings with similar findings in other researches. Conclusions are
drawn and recommendations made for further studies on the subject of employee commitment.
5.2 Summary
The findings of the study were that extrinsic and intrinsic rewards significantly affect employee
commitment at Stanbic Bank Uganda Limited.
5.2.1 Extrinsic rewards and Employee Commitment
Pearson’s Correlation Coefficient for extrinsic rewards and employee commitment revealed a
weak positive correlation shown by r = (0.246, probability (p = 0.0005) less than α = 0.01 (1%)
level of significance. The hypothesis which states that; “Extrinsic rewards have a weak effect on
employee commitment at Stanbic Bank Uganda Limited”was accepted.
The adjusted R square value of 0.006 implied that employee commitment at Stanbic Bank
Uganda Limited is dependent on extrinsic rewards by 0.6%.
5.2.2 Intrinsic rewards and employee commitment
Pearson’s Correlation Coefficient for Intrinsic rewards and employee commitment revealed a
strong relationship shown by r = 0 .819, probability (p = 0.005) less than α = 0.01 (1%) level of
significance. Employee commitment is significantly affected by intrinsic rewards. The adjusted
R square value of 0.012 implied that employee commitment is dependent on intrinsic rewards
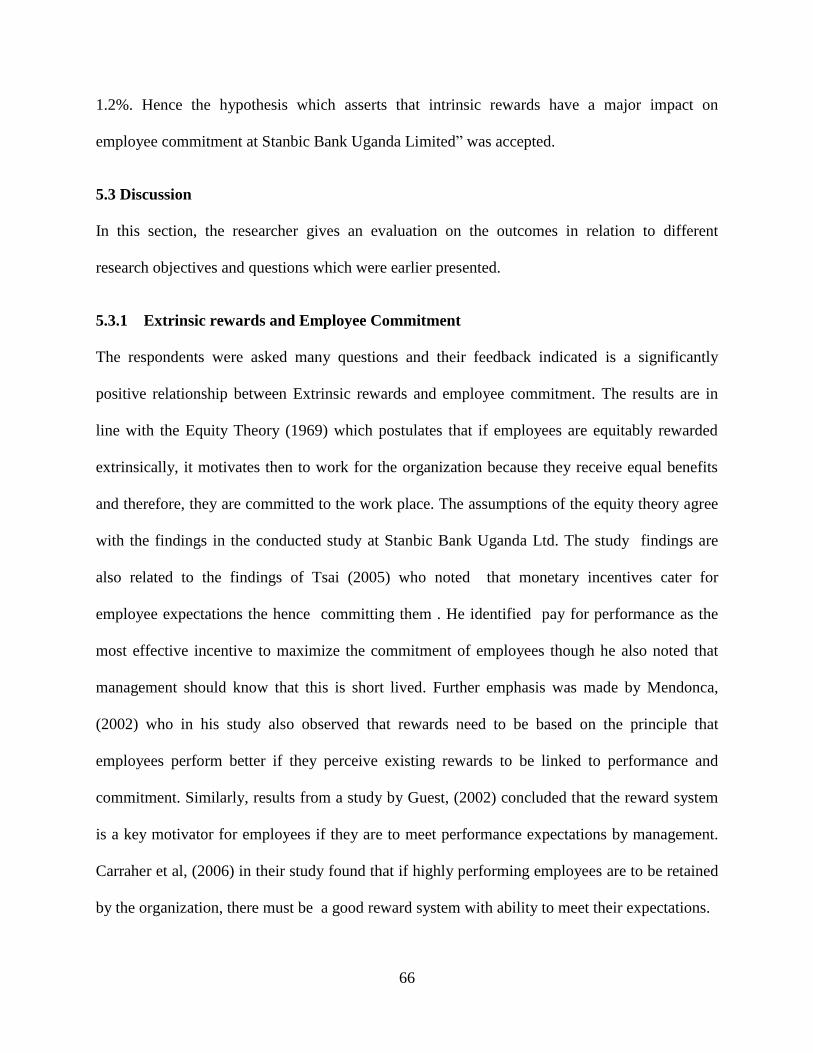
66
1.2%. Hence the hypothesis which asserts that intrinsic rewards have a major impact on
employee commitment at Stanbic Bank Uganda Limited” was accepted.
5.3 Discussion
In this section, the researcher gives an evaluation on the outcomes in relation to different
research objectives and questions which were earlier presented.
5.3.1 Extrinsic rewards and Employee Commitment
The respondents were asked many questions and their feedback indicated is a significantly
positive relationship between Extrinsic rewards and employee commitment. The results are in
line with the Equity Theory (1969) which postulates that if employees are equitably rewarded
extrinsically, it motivates then to work for the organization because they receive equal benefits
and therefore, they are committed to the work place. The assumptions of the equity theory agree
with the findings in the conducted study at Stanbic Bank Uganda Ltd. The study findings are
also related to the findings of Tsai (2005) who noted that monetary incentives cater for
employee expectations the hence committing them . He identified pay for performance as the
most effective incentive to maximize the commitment of employees though he also noted that
management should know that this is short lived. Further emphasis was made by Mendonca,
(2002) who in his study also observed that rewards need to be based on the principle that
employees perform better if they perceive existing rewards to be linked to performance and
commitment. Similarly, results from a study by Guest, (2002) concluded that the reward system
is a key motivator for employees if they are to meet performance expectations by management.
Carraher et al, (2006) in their study found that if highly performing employees are to be retained
by the organization, there must be a good reward system with ability to meet their expectations.
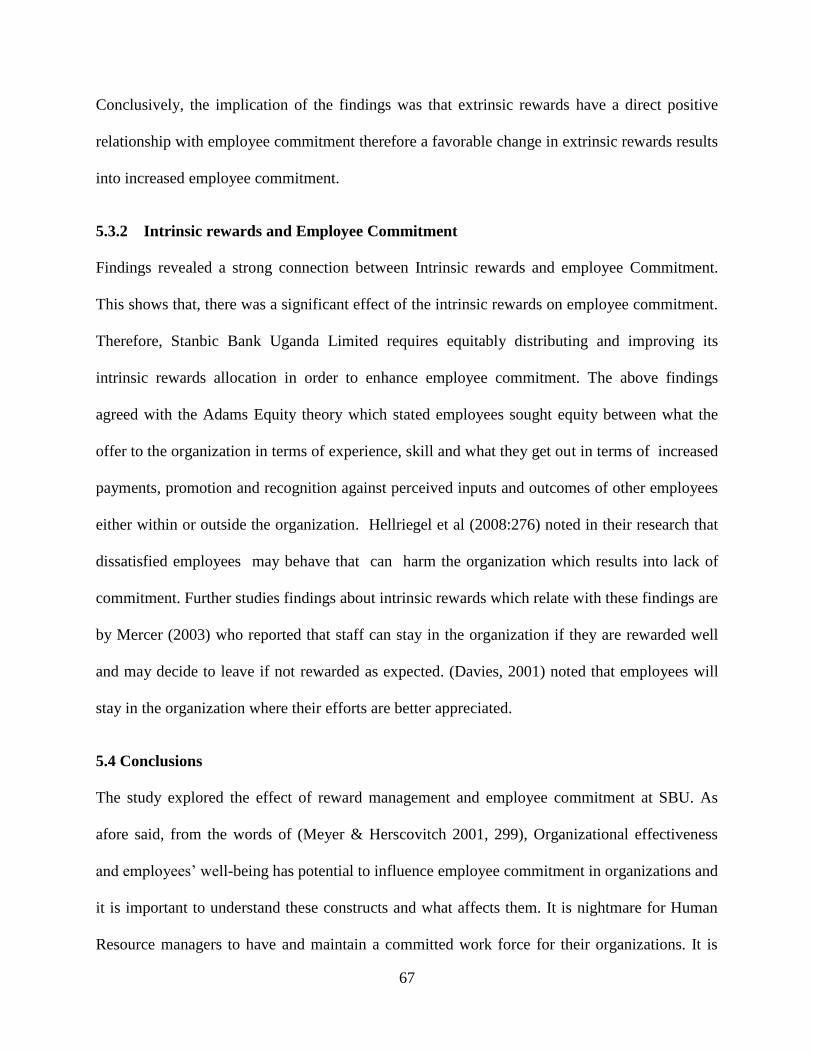
67
Conclusively, the implication of the findings was that extrinsic rewards have a direct positive
relationship with employee commitment therefore a favorable change in extrinsic rewards results
into increased employee commitment.
5.3.2 Intrinsic rewards and Employee Commitment
Findings revealed a strong connection between Intrinsic rewards and employee Commitment.
This shows that, there was a significant effect of the intrinsic rewards on employee commitment.
Therefore, Stanbic Bank Uganda Limited requires equitably distributing and improving its
intrinsic rewards allocation in order to enhance employee commitment. The above findings
agreed with the Adams Equity theory which stated employees sought equity between what the
offer to the organization in terms of experience, skill and what they get out in terms of increased
payments, promotion and recognition against perceived inputs and outcomes of other employees
either within or outside the organization. Hellriegel et al (2008:276) noted in their research that
dissatisfied employees may behave that can harm the organization which results into lack of
commitment. Further studies findings about intrinsic rewards which relate with these findings are
by Mercer (2003) who reported that staff can stay in the organization if they are rewarded well
and may decide to leave if not rewarded as expected. (Davies, 2001) noted that employees will
stay in the organization where their efforts are better appreciated.
5.4 Conclusions
The study explored the effect of reward management and employee commitment at SBU. As
afore said, from the words of (Meyer & Herscovitch 2001, 299), Organizational effectiveness
and employees’ well-being has potential to influence employee commitment in organizations and
it is important to understand these constructs and what affects them. It is nightmare for Human
Resource managers to have and maintain a committed work force for their organizations. It is
68
understood that there are various factors that in today’s world that can shape organizational
commitment, especially now that organizations need to have a committed workforce to gain a
competitive advantage as posited by (Meyer & Parfyonova 2010, 283.).
From the foregoing, it is so challenging for SBUL to maintain and have its work force committed
especially that banks need more of young employees than the old ones. It even becomes harder
that young labour force is always migrant especially in the banking industry. In the words of
(Laurinolli 2010), it has been in the world media that it is more challenging to get younger
employees committed to the organization. From the study, the conclusions were derived from the
results of the hypotheses tested to ground the basis for reward management measures at Stanbic
Bank Uganda Limited.
5.4.1 Extrinsic Rewards and Employee Commitment
It was revealed that extrinsic rewards significantly affect employee commitment. This then, calls
for employees to be equitably rewarded using extrinsic reward approaches; pay, training and
allowances, then they would feel satisfied and motivated to work for Stanbic Bank Uganda. The
contrary might lead to staff turnover and employees de-motivation hence lack of commitment to
the job. This can be implemented through budgeting and putting in place extrinsic rewards that
fit all job descriptions.
5.4.2 Intrinsic Rewards and Employee Commitment
The findings revealed that intrinsic rewards significantly affect employee commitment. This was
revealed from the questionnaires and interviews conducted about intrinsic rewards; appreciation,
recognition and job security. This therefore calls for a strategy in Stanbic Bank Uganda to
improve their intrinsic reward distribution and allocation. It is also be concluded that there are
could be other determinants to employee commitment other than training, employee recognition
69
and job security. It is important that management of Stanbic bank Uganda make adjustments on
their rewarding system if they are to boost commitment of employees to work.
The study conclusions detailed above are based on the different research objectives, questions
and hypotheses;
There is a significant correlation between Entrinsic Rewards and Employee Commitment.
Study findings revealed that Extrinsic Rewards play a crucial role in having employees satisfied
and committed to the organization. Respondents expressed the need for higher salary pay and
reflected that extrinsic rewards influence employee commitment.
There is a significant correlation between Intrinsic rewards and Employee Commitment.
Respondents revealed that other motivation measures are necessary to induce their commitment
to the job other than salary pay. They explain that a salary is mandatory and well laid down in
their contracts but to generate commitment other factors (intrinsic) are necessary.
5.5 Recommendations
The researcher recommended that;
5.5.1 Intrinsic Rewards and Employee Commitment
a) Management of SBU should design clear terms and conditions on how to offer the
intrinsic reward to their employees such that employees understand it clearly and later
feel contented and committed to their job.
b) The Human resource department is advised to manage intrinsic rewards consistently,
fairly and equitably.
70
5.5.2 Extrinsic Rewards and Employee Commitment
a) The bank gives employees some kind of pension/gratuity savings should be increased in
relation to the bank profit margin and maintained and this make the employees to get
committed because as the earns profit, they will also be earning.
b) Secondly, all employees should be given consideration for these rewards depending on
their levels in the organization structure.
5.6 Limitations to the study
The study faced the following limitations; -
1. The study focused on reward management and employee commitment and the variables
included reward policies, Intrinsic and extrinsic rewards at Stanbic Bank Limited. The
data collection instruments were drawn in line with the objectives hence some vital
information that may influence employee commitment was missed out and this could
have negative impact on the study results. Consistency in gathering data in line with the
study variables may have omitted some useful data.
2. The case study design which was used also limited a wide range of areas of study and so
findings are basically limited to Stanbic Bank Uganda Ltd.
5.7 Contributions of the study
The study has had a number of contributions and among these are; - It has highly contributed to
the body of literature and knowledge in as far as employee commitment is concerned and the
study variables. It also provided the management of Stanbic bank with new impression and ways
of handling employees to ensure they get committed. In addition, the study will lead to new
strategies of managing employee commitment. To the researcher, the study improved her
understanding of the concept of employee commitment hand in hand with Extrinsic rewards and
71
Intrnsic rewards. To the employees it helped them to learn better ways f improving and
acknowledging that also intrinsic rewards are rewards therefore they should not only focus on
extrinsic factors to fill committed to their job at Stanbic Bank.
5.8 Areas for further Research
This study explored the effect of reward management and employee commitment at SBU.
Further research may investigate areas as;
i. Employee commitment and Stanbic Bank Uganda performance.
ii. What makes Stanbic Bank Uganda the best employer in the industry in Uganda?
iii. There is a need for future research to replicate the findings employing a multidisciplinary
measure of employee commitment and a wider coverage of employee commitment in
other commercial banks.
72
REFERENCES
Aktar, S., Sachu, M.K. and Ali, M.E. (2012). The impact of rewards on employee performance
in commercial banks of Bangladesh: an empirical study. IOSR Journal of Business and
Management, 6(2), pp.9-15.
Ali, R. and Ahmed, M.S. (2009). The impact of reward and recognition programs on employee’s
motivation and satisfaction: an empirical study. International review of business research
papers, 5(4), pp.270-279.
Amin. E, (2005) Analyzing Social Research 1st edn Kampala: Makerere University Printery
Andrew, D.P. and Kent, A. (2007).The impact of perceived leadership behaviors on satisfaction,
commitment, and motivation. International Journal of Coaching Science, 1(1), pp.37-58.
Armstrong, M. (2013).A Handbook on Human Resource Management, London: Kogan Page
Publishers.
Armstrong, M., Brown, D. and Reilly, P., (2011).Increasing the effectiveness of reward
management: an evidence-based approach. Employee Relations,33(2), pp.106-120.
Bidwell, M., Briscoe, F., Fernandez-Mateo, I. and Sterling, A. (2013). The employment
relationship and inequality: How and why changes in employment practices are rewards
in organizations. The Academy of Management Annals, 7(1), pp.61-121.
Campbell and Pritchard, 1976; Goodman and Friedman, 1971)
Carraher, S.M., Whitney Gibson, J. and Buckley, M.R., (2006). Compensation satisfaction in the
Baltics and the USA. Baltic Journal of Management, 1(1), pp.7-23. , C.P., Nicklin, J.M.
and Ford, M.T., 2014. Intrinsic motivation and extrinsic incentives jointly predict
performance: A 40-year meta-analysis.Psychological Bulletin, 140(4), p.980.\
Creswell, J. W. (2013). Research design: Qualitative, quantitative, and mixed methods
approaches. Sage.
Danish, R.Q. and Usman, A., (2010). Impact of reward and recognition on job satisfaction and
motivation: An empirical study from Pakistan. International journal of business and
management, 5(2), p.159.
Farooqui, M.S. and Nagendra, A., (2014). The Impact of person organization fit on job
satisfaction and performance of the employees. Procedia economics and Finance, 11,
73
Georgellis, Y., Iossa, E. and Tabvuma, V., (2011).Crowding out intrinsic motivation in thpublic
sector. Journal of Public Administration Research and Theory, 21(3), pp.473493.
(Garg and Rastogi2006). Torrington, and associates (2009)
Khan, K.U., Farooq, S.U. and Ullah, M.I., 2010.The relationship between rewards and employee
motivation in commercial banks of Pakistan. Research journal of international studies,
14, pp.37-52.
Kim, B. P. (2010). Work family conflict and its job consequences: From attitudes to behaviors to
the bottom-line..
Krejcie, Robert V, Morgan, Darylew (1970) “Determining Sample size for Research Activities”
Educational and Psychological Measurement
Krejecie, B and Morgan R (2002), Generalized Scientific guidelines for sample size decisions; London,
Pitman Publishing, Long Acre 5th Edition. Social Security in Australia. Newman Publishers–
1956.
Lambrou, P., Kontodimopoulos, N. and Niakas, D., (2010). Motivation and job satisfaction
among medical and nursing staff in a Cyprus public general hospital. Hum Resour
Health, 8(1), pp.26-34.
Latham, G.P., (2012). Work motivation: History, theory, research, and practice. Sage.
Lazaroiu, G. (2015). Employee Motivation and Job Performance. Linguistic and Philosophical
Investigations, 14, 97.
Liu, B.C. and Tang, T.L.P., (2011). Does the love of money moderate the relationship between
public service motivation and job satisfaction? The case of Chinese professionals in the
public sector. Public Administration Review, 71(5), pp.718-727.
Mugenda and Mugenda (1999) Social Research for Higher Institutions of Learning, Nairobi.
Sekran .B, (2003) Basic Research for Social Scientists 2nd edn London: Macmillan Publishing
74
Pakistan. International Journal of Business and Management, 5(6), p.17. Mendonca, M.,
(2002).Human resource management in the emerging countries. International
Encyclopedia of Business and Management, 2(2), pp.697-703.
Myers, M. D. (2013). Qualitative research in business and management.Sage.
Nielsen, M. S. (2013). Understanding employee engagement in a public service context.In
Detdanskeledelsesakademi 2013.
Torrington, D. Hall, L, Taylor, S. & Atkinson C. (2009). Fundamentals of human resource
management, 1st edition. Pearson Education Limited.
Tsai, C., (2005). Reward and incentive compensation and organisational performance: evidence
from the semiconductor industry. In Performance and Reward Conference, Manchester
UK.
Wang, Y., (2004). Observations on the organizational commitment of Chinese employees:
comparative studies of state-owned enterprises and foreign-invested enterprises. The
International Journal of Human Resource Management, 15(4-5), pp.649-669.
Zhang, Y. (2012). The impact of performance management system on employee performance
Analysis with WERS 2004.
Zhu, J. (2014). Quantitative models for performance evaluation and benchmarking: data
envelopment analysis with spreadsheets (Vol. 213). Springer
i
APPENDICES
Appendix I: Research Questionnaire
UGANDA MANAGEMENT INSTITUTE (UMI)
A Questionnaire on Reward management and employee commitment in commercial
banks in uganda. A case of Stanbic Bank Uganda Limited.
Dear Respondent,
Am Nalugya Miriam a student undertaking a Masters of Business Administration at Uganda
Management Institute (UMI), Kampala, Uganda. Am undertaking a research on “Reward
management and employee commitment in commercial banks in uganda; a case of
Stanbic Bank Uganda limited”. As a participant, you were carefully chosen to participate in
this study since the kind of service provided to the bank is relevant to this study and
information required. This information is entirely academic and will be treated as
confidential.You are kindly requested to spare some time and answer the questions by giving
your views or marking on alternatives given. Your name and address are not required for this
purpose to ensure confidentiality.
Thank you so much for your time .
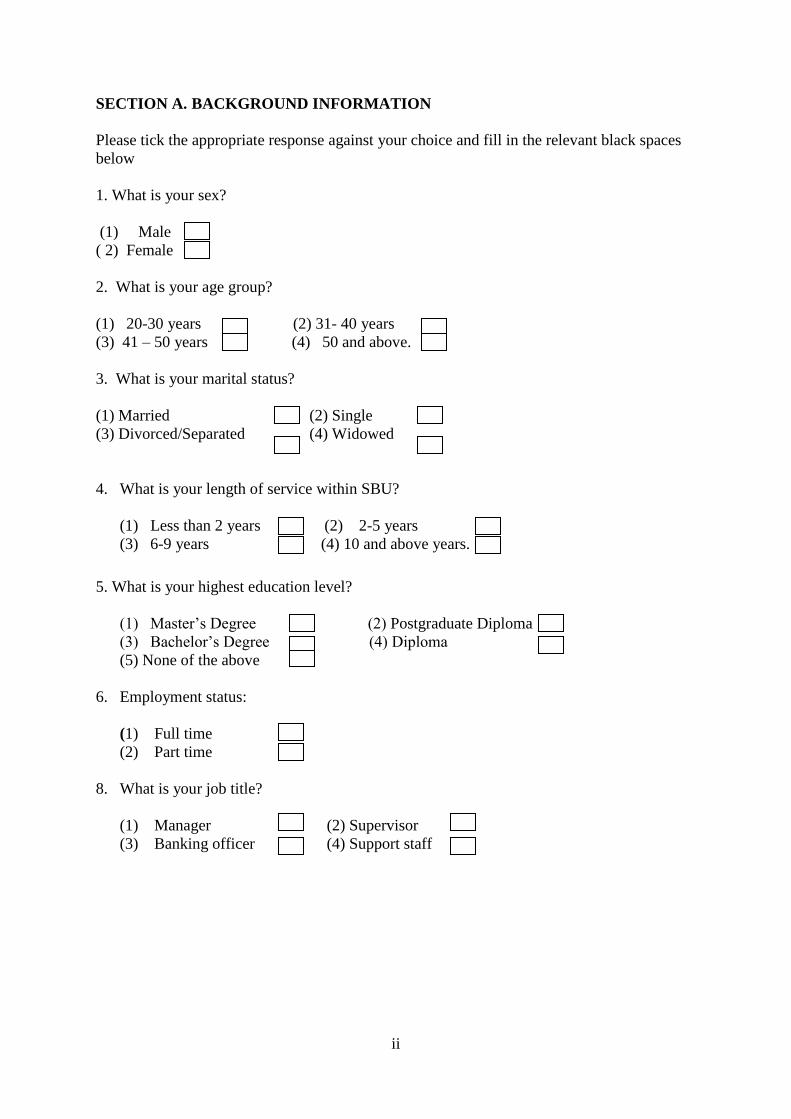
ii
SECTION A. BACKGROUND INFORMATION
Please tick the appropriate response against your choice and fill in the relevant black spaces
below
1. What is your sex?
(1) Male
( 2) Female
2. What is your age group?
(1) 20-30 years (2) 31- 40 years
(3) 41 – 50 years (4) 50 and above.
3. What is your marital status?
(1) Married (2) Single
(3) Divorced/Separated (4) Widowed
4. What is your length of service within SBU?
(1) Less than 2 years (2) 2-5 years
(3) 6-9 years (4) 10 and above years.
5. What is your highest education level?
(1) Master’s Degree (2) Postgraduate Diploma
(3) Bachelor’s Degree (4) Diploma
(5) None of the above
6. Employment status:
(1) Full time
(2) Part time
8. What is your job title?
(1) Manager (2) Supervisor
(3) Banking officer (4) Support staff
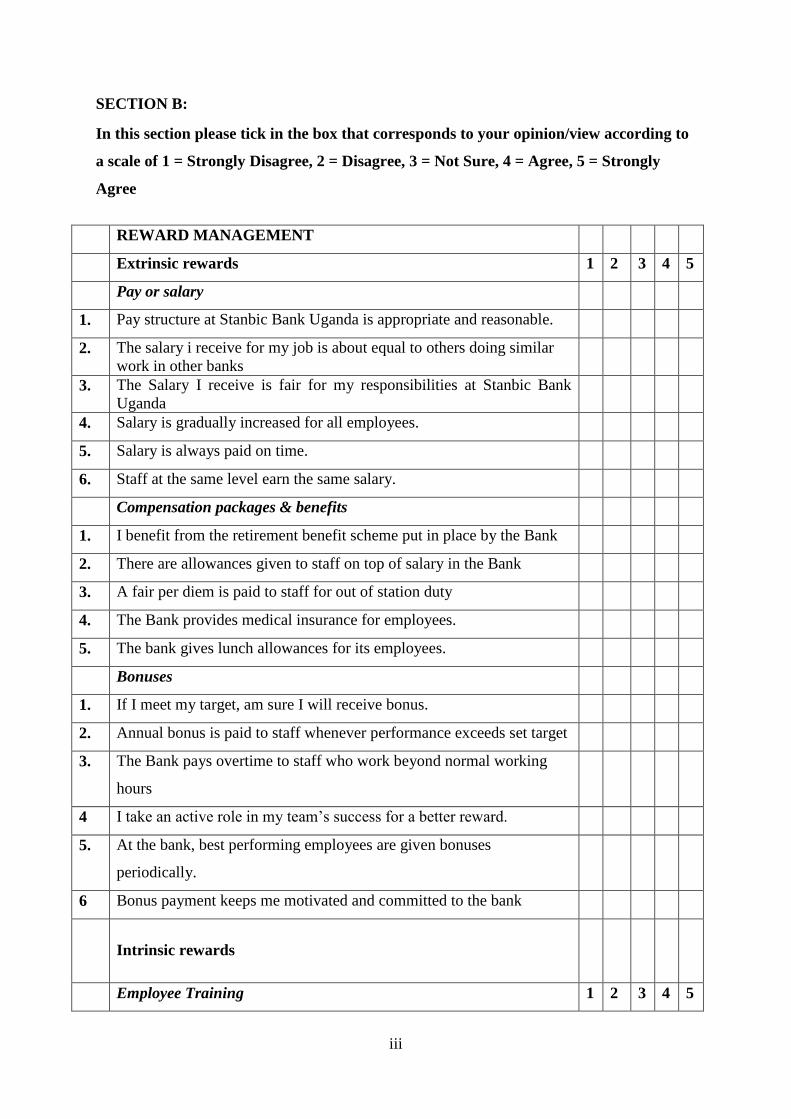
iii
SECTION B:
In this section please tick in the box that corresponds to your opinion/view according to
a scale of 1 = Strongly Disagree, 2 = Disagree, 3 = Not Sure, 4 = Agree, 5 = Strongly
Agree
REWARD MANAGEMENT
Extrinsic rewards 1 2 3 4 5
Pay or salary
1. Pay structure at Stanbic Bank Uganda is appropriate and reasonable.
2. The salary i receive for my job is about equal to others doing similar
work in other banks
3. The Salary I receive is fair for my responsibilities at Stanbic Bank
Uganda
4. Salary is gradually increased for all employees.
5. Salary is always paid on time.
6. Staff at the same level earn the same salary.
Compensation packages & benefits
1. I benefit from the retirement benefit scheme put in place by the Bank
2. There are allowances given to staff on top of salary in the Bank
3. A fair per diem is paid to staff for out of station duty
4. The Bank provides medical insurance for employees.
5. The bank gives lunch allowances for its employees.
Bonuses
1. If I meet my target, am sure I will receive bonus.
2. Annual bonus is paid to staff whenever performance exceeds set target
3. The Bank pays overtime to staff who work beyond normal working
hours
4 I take an active role in my team’s success for a better reward.
5. At the bank, best performing employees are given bonuses
periodically.
6 Bonus payment keeps me motivated and committed to the bank
Intrinsic rewards
Employee Training 1 2 3 4 5

iv
1. There is a well-organized training program atStanbic bank Uganda
2. The training programs at work have empowered all employees.
3. The Bank provides training to improve on the employee skills.
4. The bank sponsors its employees for continuous Professional
development courses.
5. Training and development programs are consistently evaluated
6. Thetraining programs organized by the bank have kept me motivated
and committed to the bank.
Employees Recognition
1. I take pride in my work and1 feel valued on my team.
2. Management takes time to recognize my effort at the Job.
3. A Certificate of merit is given in recognition of staff for outstanding
performance in different fields.
4. The Bank organizes team building events for staff periodically in
recognition of their efforts.
5. There is a monthly recognition of staff with outstanding performance.
6 Am committed to working for Stanbic bank because Top management
takes off time to recognise my efforts
Job security
1. I feel a sense of satisfaction when my job is well done.
2. Employees are always protected against unfair or unjustified
dismissals.
3. There is a disciplinary committee in place to hear out staff before a
decision is taken regarding staff conduct
3. Management often involves staff in decision making.
4. There is free communication between management and staff.
5. Employees are sometimes sacked for not meeting the set target
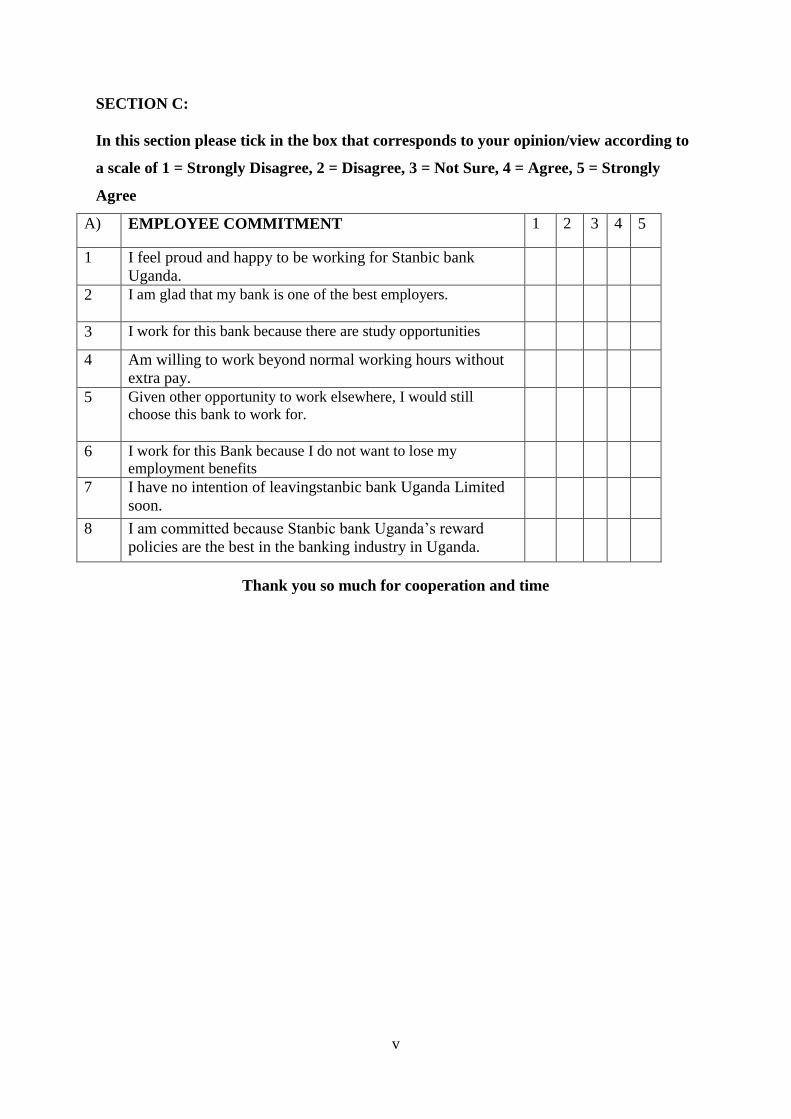
v
SECTION C:
In this section please tick in the box that corresponds to your opinion/view according to
a scale of 1 = Strongly Disagree, 2 = Disagree, 3 = Not Sure, 4 = Agree, 5 = Strongly
Agree
A) EMPLOYEE COMMITMENT 1 2 3 4 5
1 I feel proud and happy to be working for Stanbic bank
Uganda.
2 I am glad that my bank is one of the best employers.
3 I work for this bank because there are study opportunities
4 Am willing to work beyond normal working hours without
extra pay.
5 Given other opportunity to work elsewhere, I would still
choose this bank to work for.
6 I work for this Bank because I do not want to lose my
employment benefits
7 I have no intention of leavingstanbic bank Uganda Limited
soon.
8 I am committed because Stanbic bank Uganda’s reward
policies are the best in the banking industry in Uganda.
Thank you so much for cooperation and time
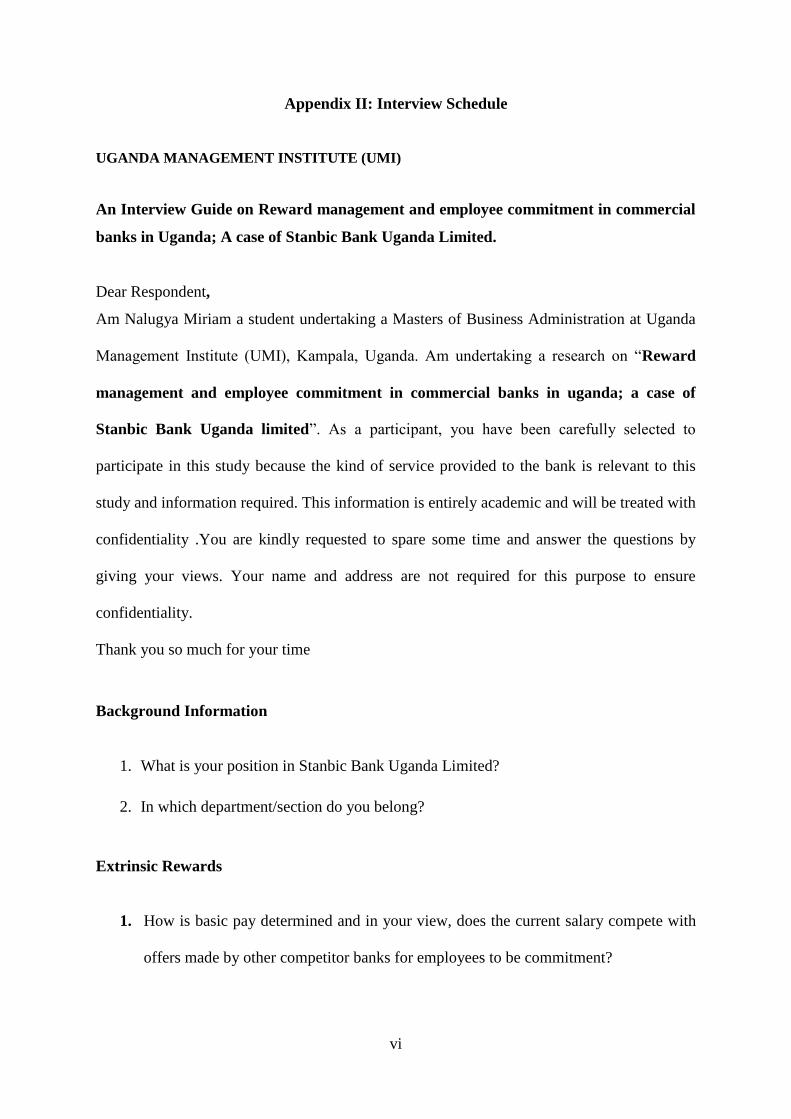
vi
Appendix II: Interview Schedule
UGANDA MANAGEMENT INSTITUTE (UMI)
An Interview Guide on Reward management and employee commitment in commercial
banks in Uganda; A case of Stanbic Bank Uganda Limited.
Dear Respondent,
Am Nalugya Miriam a student undertaking a Masters of Business Administration at Uganda
Management Institute (UMI), Kampala, Uganda. Am undertaking a research on “Reward
management and employee commitment in commercial banks in uganda; a case of
Stanbic Bank Uganda limited”. As a participant, you have been carefully selected to
participate in this study because the kind of service provided to the bank is relevant to this
study and information required. This information is entirely academic and will be treated with
confidentiality .You are kindly requested to spare some time and answer the questions by
giving your views. Your name and address are not required for this purpose to ensure
confidentiality.
Thank you so much for your time
Background Information
1. What is your position in Stanbic Bank Uganda Limited?
2. In which department/section do you belong?
Extrinsic Rewards
1. How is basic pay determined and in your view, does the current salary compete with
offers made by other competitor banks for employees to be commitment?
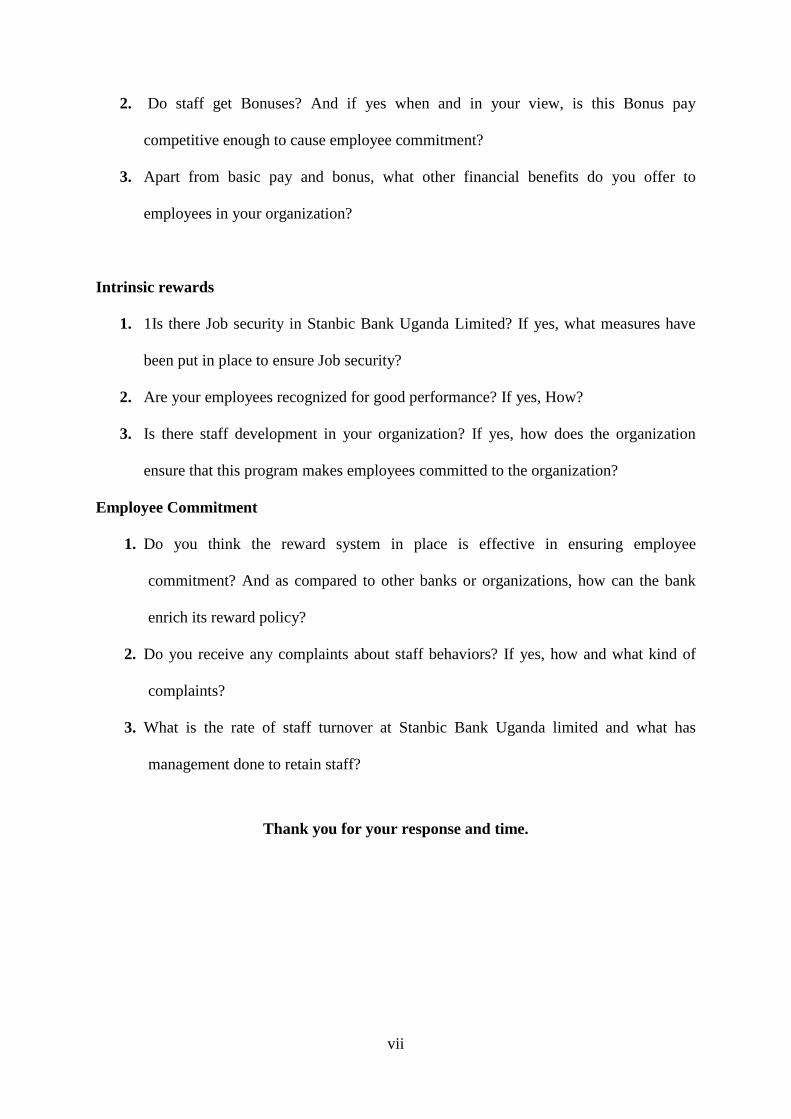
vii
2. Do staff get Bonuses? And if yes when and in your view, is this Bonus pay
competitive enough to cause employee commitment?
3. Apart from basic pay and bonus, what other financial benefits do you offer to
employees in your organization?
Intrinsic rewards
1. 1Is there Job security in Stanbic Bank Uganda Limited? If yes, what measures have
been put in place to ensure Job security?
2. Are your employees recognized for good performance? If yes, How?
3. Is there staff development in your organization? If yes, how does the organization
ensure that this program makes employees committed to the organization?
Employee Commitment
1. Do you think the reward system in place is effective in ensuring employee
commitment? And as compared to other banks or organizations, how can the bank
enrich its reward policy?
2. Do you receive any complaints about staff behaviors? If yes, how and what kind of
complaints?
3. What is the rate of staff turnover at Stanbic Bank Uganda limited and what has
management done to retain staff?
Thank you for your response and time.
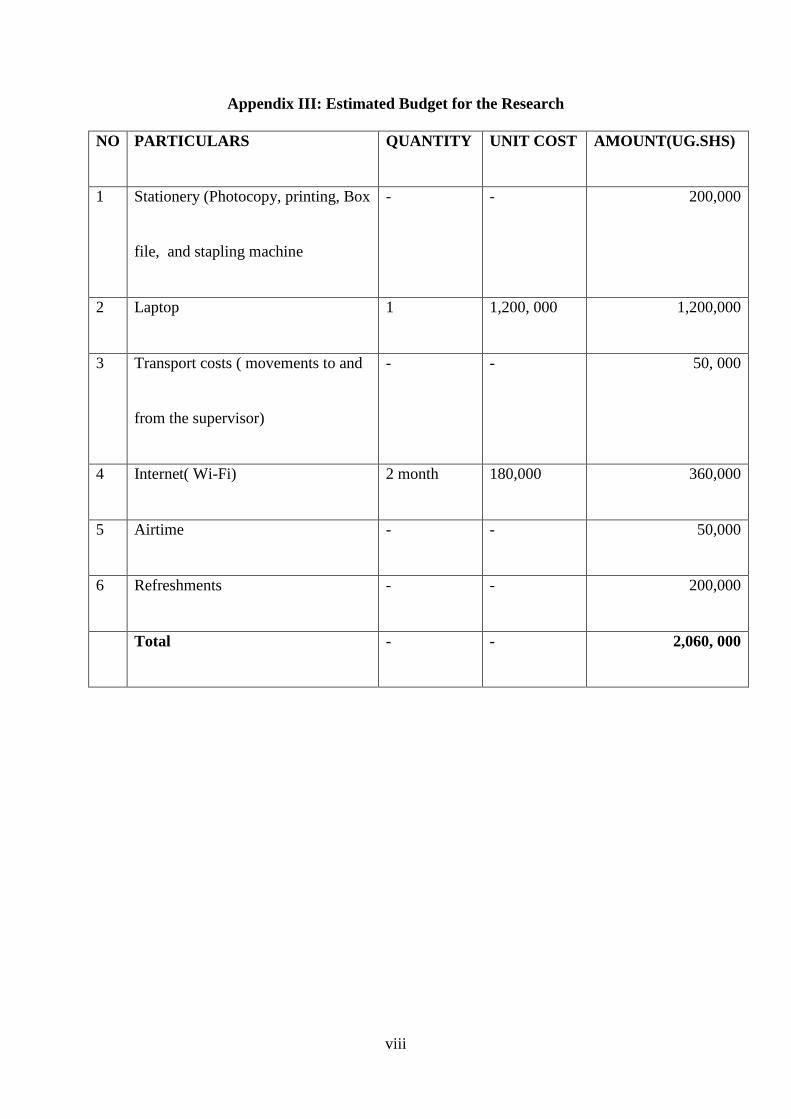
viii
Appendix III: Estimated Budget for the Research
NO PARTICULARS QUANTITY UNIT COST AMOUNT(UG.SHS)
1 Stationery (Photocopy, printing, Box
file, and stapling machine
- - 200,000
2 Laptop 1 1,200, 000 1,200,000
3 Transport costs ( movements to and
from the supervisor)
- - 50, 000
4 Internet( Wi-Fi) 2 month 180,000 360,000
5 Airtime - - 50,000
6 Refreshments - - 200,000
Total - - 2,060, 000
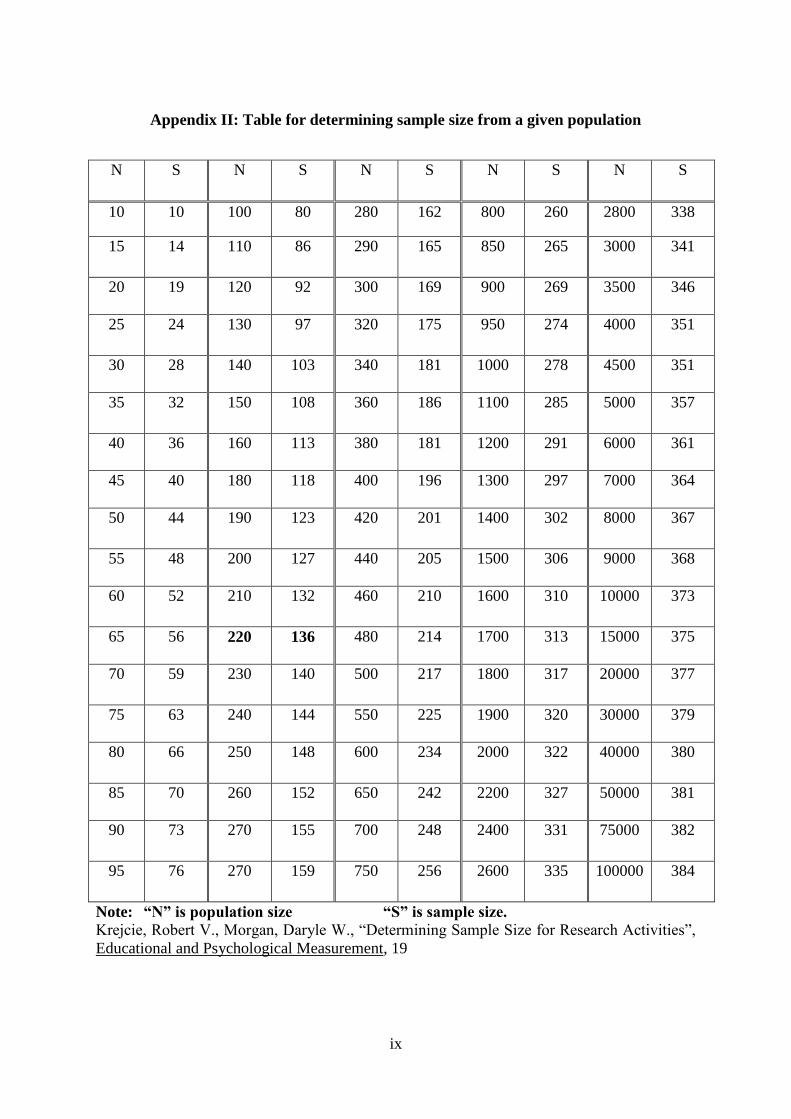
ix
Appendix II: Table for determining sample size from a given population
N S N S N S N S N S
10 10 100 80 280 162 800 260 2800 338
15 14 110 86 290 165 850 265 3000 341
20 19 120 92 300 169 900 269 3500 346
25 24 130 97 320 175 950 274 4000 351
30 28 140 103 340 181 1000 278 4500 351
35 32 150 108 360 186 1100 285 5000 357
40 36 160 113 380 181 1200 291 6000 361
45 40 180 118 400 196 1300 297 7000 364
50 44 190 123 420 201 1400 302 8000 367
55 48 200 127 440 205 1500 306 9000 368
60 52 210 132 460 210 1600 310 10000 373
65 56 220 136 480 214 1700 313 15000 375
70 59 230 140 500 217 1800 317 20000 377
75 63 240 144 550 225 1900 320 30000 379
80 66 250 148 600 234 2000 322 40000 380
85 70 260 152 650 242 2200 327 50000 381
90 73 270 155 700 248 2400 331 75000 382
95 76 270 159 750 256 2600 335 100000 384
Note: “N” is population size “S” is sample size.
Krejcie, Robert V., Morgan, Daryle W., “Determining Sample Size for Research Activities”,
Educational and Psychological Measurement, 19

x
Appendix III: Introductory Letter

xi
Appendix IV: Field Research Letter

xii
Appendix v: Anti- Plagiarism