Embed Size (px)
Citation preview

3. lbid p.316
4. Mirza S.Saiyadain, Human Resources Management, Tata McGraw-Hill Publishing Company
Limited, New Delhi, 2003.
5. lbid p.313.
CHAPTER – 7
REWARD MANAGEMENT
In this chapter responses of the respondents on
various aspects of reward management, collected through the
questionnaire, have been analysed, using certain statistical
measures, to understand acceptability of the human resource
practices relating to reward management. It is assumed that

those practices which are more acceptable to the participants
of the survey are supposed to be the best practices.
7.01 Introduction
People can be motivated by rewards and incentives which will enable them to satisfy their own
needs or will provide them with goals to attain. But the needs of individuals and the goals associated
with them vary so widely that it is difficult if not impossible to predict precisely how a particular reward
or incentive will affect individual behavior.
Managing reward is largely about managing expectations - what employees expect from their
employers in return for their contribution and what employers expect from their employees in return
for their pay and the opportunity to work and develop their skills. Expectations are built into the
employment relationship, the starting-point of which, from the reward point of view, is an undertaking
by an employee to provide effort and skill to the employer, in return for which the employer provides
the employee with a salary or a wage.
7.02 Importance of Reward
Reward constitutes an important element in Human Resources Management. Reward
Management is essentially about designing, implementing and maintaining pay systems which help to
improve organizational performance. Reward management is the process of developing and
implementing strategies, policies and systems which help the organization to achieve its objectives by
obtaining and keeping the people it needs and by increasing their motivation and commitment. The

reward management system should be designed to support the achievement of the organization’s
strategies; it should be based on a philosophy of reward which matches the culture of the organization.
Reward management is also concerned with the development of appropriate organizational
cultures, underpinning core values and increasing the motivation and commitment of employees. There
is no such best practice; there is only good practice which is best for the organization. And also what is
best practice for an organization at one stage of its development may no longer be best practice as it
moves its life cycle. Practices, which were effective when they were introduced, may degenerate as the
organization evolves or it degenerates.
Reward management is not only about money, it is also concerned with intrinsic, as well as
extrinsic motivation; with non-financial, as well as financial rewards.
The design and operation of reward management processes and practices should start from an
understanding of the implications of the psychological contract concept, motivation theory an the
factors affecting pay levels. But it must focus on the needs of the organization and the people who work
in it. These needs are most likely to be met if reward processes are based on an articulated and
integrated approach to the development of a frame work of reward philosophies, strategies and policies
that will support the achievement of the organization’s business strategies, as well as acting as levers for
change.
7.03 Purpose of Rewards
Reward system is developed to make performance more effective. Reward is based on
performance which is outcome of efforts and environmental factors.
The main purpose of performance evaluation is to reward the employees. If they have
performed better than the standards they are positively rewarded or positive reinforcement is

exercised. If the employees have performed less than the standards, they are negatively reinforced.
Punishment reinforcement is exercised temporarily to amend the employees and bring them on right
path.
Similarly the purpose of reward is to provide positive reinforcement and motivate them for
achieving outstanding performance. People work for achieving several needs fulfilled. They want not
only money but also recognition, return and self satisfaction. The purpose of reward is to motivate
them. The motivation differs from time to time depending upon situation, interests and tastes.
Reward is to attempt to motivate job performance through selective distribution. Valued
employees are retained if they are properly rewarded. The organization continues to develop through
reward motivation.
7.04 Types of Rewards
Corporate rewards influence the behavior of employees through internal impact on the
organization and external impact on the organization. It means reward serves internal and external
purposes of organization.
Internal Purposes
Reward aims to enhance job performance, to retain valuable employees and develop corporate
unit. Internal purpose is served with intrinsic rewards. Intrinsic rewards are associated with job itself.
Internal rewards are tied up directly with behavior and performance.
External purposes

External purposes are served mainly with extrinsic reward. The rewards are not associated with
the work itself but are influenced by co-workers, informal groups and other organizations. The extrinsic
rewards include salary, bonus, fringe benefits, profit sharing and incentive plans.
Rewards can also be classified into financial and non-financial rewards.
Financial Rewards can be financial directly or indirectly. The employees can get directly financial
reward such as wages, bonuses and profit sharing. They can also get indirectly supportive benefits such
as pension plans, paid vacations, paid sick leaves and purchase discounts. Employees are more
motivated by financial rewards as money being a strong motivator for them
Non-financial Rewards such as having lunch with the boss of the company or preferred lunch
hours, receiving the office furnishing, having a change to work with congenial colleagues, and achieving
a desired work assignments or an assignments where the worker can operate without close supervision.
Non-monetary rewards can help to build feelings of confidence and satisfaction in the employees.
7.05 Rewards in IT industry
The IT industry has been a leader in changing traditional compensation practices in India.
Pay for performance has become a norm in the IT industry. It rewards those who contribute the
most to an organization’s productivity and profits. The compensation mix depends on deliverables and
the impact it has on the business. Consequently higher the responsibility greater the variable content in
the pay package.

Performance-related pay plans. It is a motivator that improves productivity, and hence, profits.
It is believed to have the potential to result in organizational change, cultural change, reinforce
organizational values and expectations and redefines the employer-employee relationship,
It helps in improving productivity and performance levels across the organization while making
every individual equally accountable for the success and failure of the company. It is a great motivator
for top performers and teams as they can get rewards and pay according to their contributions.
Designing the incentive plan
There is no standard formula for a performance-related incentive plan, it is unique for each
industry and organization.
The incentive plan should be designed to align with an organization’s objectives. Clearly defining
the objective
Communication and understanding of objectives
Consideration of performance against objectives
Translating evaluation into performance rating
A link between ratings and pay
A separate appeals procedure.
7.06 Reward Management in SUBEX
In SUBEX Salaries are based on experience. They also depend upon the employees negotiation
skills. In the company salaries are revised yearly once.
The company provides many benefits and rewards to its employees. It provides incentives but
those are applicable only to employees who work in non-Indian timings. At the time of induction every

employee comes to know about the benefits and how he can avail them. Apart from that, HR policies of
the company are uploaded in the intranet where a new recruit can go through them.
Office working hours are from 9.00 a.m. to 5.30 p.m. from Monday to Friday.
Benefits at Subex:
Leaves: Employees can avail 10 days contingency leave and 20 days earned leave per annum.
Female employees can go on maternity leave for 12 weeks (according to maternity benefit Act, 1961).
Insurance and Gratuity:
Accident insurance covers death/dismemberment, permanent/temporary, and total/partial
disability due to an accident. Premium payable is shared 50:50 between Subex and Subexian.
Medical insurance covers self, spouse and children for Rs.1.5 lakhs in group A. In group B
parents for Rs. 1.5 lakhs. 30 days of pre-hospitalization and 30 days of post hospitalization expenses are
covered. Premium payable is shared 50:50 between Subex and Subexian.
Gratuity through LIC (as per the Payment of Gratuity Act, 1972).
Employee Stock Option plan: It covers subexians across all levels. Stocks will be issued to the
employees who complete one year in Subex and number of them will be decided at the time of joining
and it varies.
School Tie-up: Arrangement is there with Shishu Griha, Indra Nagar, Bangalore, for four seats
every year exclusively to Subex. Admissions will be given to Montessori at the age of 2.5 years or into
classes 1 to 10.
Broadband Connection: It is applicable for Subexians at grade M1 and above, depending on the
nature of job responsibilities.

House Rent Allowance (HRA): To avail of tax exemption under HRA, subexian is expected to
produce rent receipts in the prescribed form. The least of the following is exempt from tax:
(a) 40 per cent of basic salary.
(b) Actual House Rent Allowance received by subexian.
(c) Excess of rent paid over 10 per cent of the salary.
Reimbursement of Medical Expenses: Reimbursement of medical expenses upto Rs.15,000/-
per year, covering doctor’s fees, cost of medicines and expenses incurred towards hospitalization.
Car Lease Scheme: Car lease scheme is applicable to all Subexians at grades E3 and above.
Subex will tie up with a leasing company to provide car lease benefit to the Subexians. Leasing company
would be financing the car identified as per the choice of Subexians.
Vehicle Maintenance (For those who have availed of car lease scheme): Subexians E3 and above
are eligible for reimbursement of vehicle-related expenses. Expenses include fuel expenses, car
maintenance, insurance, repairs, replacements and periodical servicing charges.
Leave Travel Allowance (LTA): Tax exemption on LTA expense twice in a block of four years
(current block period 2006-2009 calendar year Jan-Dec).
Meal Vouchers: Meal Vouchers of Rs.1300/- per month are provided.
Loans: Any one of the following loans can be availed at any particular time as per the eligibility
norms with a gap of 90 days between the closure of previous loan and the start of the subsequent loan.
a) Higher Education Assistance: Higher education allowance is open to Subexians up to level
E3 with minimum 6 months of service at Subex. Coverage including enrollment and pre/post
enrollment expenses is up to a maximum of Rs.30,000/-.

b) Contingency Loans: Contingency loans are available to Subexians at all levels up to a
maximum of Rs.30,000/- to cover urgent, unplanned exigencies including marriage,
education and medical expenses.
c) Young Subexians Assistance: To assist young Subexians (members, associates, executives in
E1 to E3 grades, probationers) in meeting initial expenses, two wheeler purchase up to a
maximum of Rs.30,000/- is provided in the form of loan.
Transportation: On all working days, transportation facility is available for all the Subexians
located at Bangalore. Female Subexians are strictly prohibited from working beyond 8:00 pm in the
office. Male Subexians can opt for late night drop facility from 9:30 pm onwards.
Cafeteria: A cafeteria with about 250 seating capacity is located at the office ground floor.
Occupational Health Centre: A staff nurse will be available on all working days from 9.00 a.m. to
5.00 p.m. There will be a visiting doctor who will be available on all working days from 3:00 p.m. to 4:00
p.m.
Life Skills Catalyst: For all stress or anxiety and related issues help will be provided.
Library: A dedicated library is available; list of books is available in the Subex net.
Gymnasium: Gymnasium facility is available on all working days and gym instructor is available
to assist in the training schedules for all Subexians. Subexians should get a general health check up from
the in-house doctor to get them registered for the gym.
Kiosks: companies like Reebok, HLL, HDFC, and HSBC will come to the company and fair for their
products at discounts rates to the employees.
Recreation: There is a music room and recreation room with two table tennis boards.

Charitable Trust: Subex charitable trust supports activities for development and facilities critical
needs in various communities which are typically done through a voluntary organization that works for
the concerned cause.
Subex Club: The Subex club is the hub of the cultural activities in Subex. The club organizes
periodical get-togethers and other activities.
Reward Policies: The following are the rewards in Subex.
Long Service Award Policy: The objective of this policy is to encourage and provide recognition
to Subexians who have completed certain pre-defined years of tenure in Subex as mentioned below. All
the employees who complete 3/5/7/10/15 years of tenure at Subex are eligible to get this award. The
award consists of a service completion letter, a dinner coupon, a bouquet and gift cheque. The amounts
of dinner coupon and gift cheque vary depending upon the service completed at Subex.
Different awards like Bravo Award, Pat on the Back, Hats Off, Beyond and Most Valued Team
have been instituted for recognizing the existence of and for encouraging acquisition of technical
competence, job knowledge, inter personal skills, problem solving, analytical thinking, domain and
product knowledge, results with quality and customer orientation etc.
7.07 Responses of the Respondents to the Statements on Reward Management
With this background, opinions on various aspects of the rewards management practices in
SUBEX LIMITED have been collected. The responses have been analyzed by three variables namely
educational qualifications, gender and designation and presented in the following tables.
The responses have been structured on a five point scale and weights have been assigned to
responses in the following manner.

Responses Weights
Strongly Agree / Highly Satisfied 5
Agree / Satisfied 4
Neutral / Undecided 3
Disagree / Dissatisfied 2
Strongly Disagree / Highly Dissatisfied 1
Weighted average score is calculated taking into consideration weights and frequency. The
calculated weighted score can be anything between 1 and 5.
Weighted Average Scores are interpreted in the following manner.
Weighted Average Score (WAS) 1.00 to 1.99 indicates very low level of satisfaction or
very low level of agreement with the statement.
Weighted Average Score (WAS) 2.00 to 2.99 indicates low level of satisfaction or low
level of agreement with the statement.
Weighted Average Score (WAS) 3.00 to 3.99 indicates high level of satisfaction or high
level of agreement with the statement.
Weighted Average Score (WAS) 4.00 to 5 indicates very high level of satisfaction or very
high level of agreement with the statement.
Table: 7.01
Educational Qualification-, Gender-, and Designation-Wise Analysis of the Responses to the Statement
that “My Salary is Sufficient to Meet the Needs of my Family”
Variables No. of the Respondents

Strongly
Agree Agree Neutral Disagree
Strongly
Disagree Total
Edu
cati
on
B.E./ B.Tech.
48
(46.60)
[240]
--
49
(47.57)
[196]
--
1
(0.97)
[3]
--
5
(4.85)
[10]
--
0
(0.00)
[0]
--
103
(100)
[449]
{4.36}
M.C.A./
M.Tech.
51
(44.35)
[255]
--
63
(54.78)
[252]
--
1
(0.87)
[3]
--
0
(0.00)
[0]
--
0
(0.00)
[0]
--
115
(100)
[510]
{4.43}
Gen
der
Male
46
(37.40)
[230]
--
72
(58.54)
[288]
--
2
(1.63)
[6]
-
3
(2.44)
[6]
--
0
(0.00)
[0]
--
123
(100)
[530]
{4.31}
Female
53
(55.79)
[265]
--
40
(42.10)
[160]
--
0
(0.00)
[0]
--
2
(2.10)
[4]
--
0
(0.00)
[0]
--
95
(100)
[429]
{4.51}
Des
ign
atio
n
Trainee/
Software
Engineer
13
(31.71)
[65]
--
26
(63.41)
[104]
--
1
(2.44)
[3]
--
1
(2.44)
[2]
--
0
(0.00)
[0]
--
41
(100)
[174]
{4.24}

System Analyst
65
(52.00)
[325]
--
59
(47.20)
[236]
--
1
(0.80)
[3]
--
0
(0.00)
[0]
--
0
(0.00)
[0]
--
125
(100)
[564]
{4.51}
Project
Leader/
Manager
21
(40.38)
[105]
--
27
(51.92)
[108]
--
0
(0.00)
[0]
--
4
(7.69)
[8]
--
0
(0.00)
[0]
--
52
(100)
[221]
{4.25}
Total
99
(45.41)
[495]
--
112
(51.38)
[448]
--
2
(0.92)
[6]
--
5
(2.29)
[10]
--
0
(0.00)
[0]
--
218
(100)
[959]
{4.40}
Source: Field Survey
Note: 1. Figures in the parentheses are the percentages on row totals.
2. Figures in the square brackets are the weighted scores.
3. Figures in the flower brackets are the weighted average scores.
Table 7.01 shows educational qualification-, gender-, and designation-wise analysis of the
responses to the statement that “my salary is sufficient to meet the needs of my family”.
Irrespective of the level of education more than 90 per cent of the respondents either strongly
or simply agree with the statement. Weighted average scores show a very high level of agreement with
the statement. However the level of agreement among M.C.A./M.Tech. qualified respondents is slightly
more than that of the level of agreement among B.E./ B.Tech. qualified respondents.

More than 90 per cent of both male and female respondents either strongly or simply agree
with the statement. Weighted average scores show a very high level of agreement with the statement.
However the level of agreement among female respondents is higher than that of their counterparts.
More than 92 per cent of the trainees/software engineers, system analysts and project
leaders/managers either strongly or simply agree with the statement. Weighted average scores of the
responses of all the three categories of the respondents show a very high level of agreement with the
statement. However, weighted average score of the responses of the system analysts (4.51) is higher
than the weighted average scores of the responses of the trainees/engineers and the project
leaders/managers.
From this it can be concluded that the salary the employees get is sufficient to meet the needs
of their families.
Table: 7.02
Educational Qualification-, Gender-, and Designation-Wise Analysis of the Responses to the Statement
that “My Salary Level is Comparable with the Salary Levels of the Similar Jobs”
Variables
No. of the Respondents
Strongly
Agree Agree Neutral Disagree
Strongly
Disagree Total
Edu
cati
on
B.E./ B.Tech.
29
(28.15)
[145]
--
28
(27.18)
[112]
--
23
(22.33)
[69]
--
22
(21.36)
[44]
--
1
(0.97)
[1]
--
103
(100)
[371]
{3.60}

M.C.A./
M.Tech.
38
(33.04)
[190]
--
37
(32.17)
[148]
--
22
(19.13)
[66]
--
18
(15.65)
[36]
--
0
(0.00)
[0]
--
115
(100)
[440]
{3.83}
Gen
der
Male
34
(27.64)
[170]
--
40
(32.52)
[160]
--
26
(21.14)
[78]
--
23
(18.70)
[46]
--
0
(0.00)
[0]
--
123
(100)
[454]
{3.69}
Female
33
(34.74)
[165]
--
25
(26.31)
[100]
--
19
(20.00)
[57]
--
17
(17.89)
[34]
--
1
(1.05)
[1]
--
95
(100)
[356]
{3.75}
Des
ign
atio
n
Trainee/
Software
Engineer
13
(31.71)
[65]
--
17
(41.46)
[68]
--
6
(14.63)
[18]
--
4
(9.76)
[8]
--
1
(2.44)
[1]
--
41
(100)
[160]
{3.90}
System Analyst
50
(40.00)
[250]
--
22
(17.60)
[88]
--
30
(24.00)
[90]
--
23
(18.40)
[46]
--
0
(0.00)
[0]
--
125
(100)
[474]
{3.79}
Project
Leader/
Manager
4
(7.69)
[20]
--
26
(50)
[104]
--
9
(17.31)
[27]
--
13
(25)
[26]
--
0
(0.00)
[0]
--
52
(100)
[177]
{3.40}

Total
67
(30.73)
[335]
--
65
(29.82)
[260]
--
45
(20.64)
[135]
--
40
(18.35)
[80]
--
1
(0.46)
[1]
--
218
(100)
[811]
{3.72}
Source: Field Survey
Note: 1. Figures in the parentheses are the percentages on row totals.
2. Figures in the square brackets are the weighted scores.
3. Figures in the flower brackets are the weighted average scores.
Table 7.02 shows educational qualification-, gender-, and designation-wise analysis of the
responses to the statement that “my salary level is comparable with the salary levels of the similar jobs”.
As many as 42.61 per cent of the B.E./ B.Tech. qualified respondents and 65.21 per cent of the
M.C.A./M.Tech. qualified respondents either strongly or simply agree with the statement, 22.33 per cent
of the B.E./ B.Tech. qualified respondents and 19.13 per cent of the M.C.A./M.Tech. qualified
respondents are neutral, and 21.33 per cent of the B.E./ B.Tech. qualified respondents and 15.65 per
cent of the M.C.A./M.Tech. respondents disagree with the statement. Weighted average scores show a
high level of agreement with the statement. M.C.A./M.Tech. qualified employees agree more with the
statement than the others.
Gender-wise analysis reveals that 60.16 per cent of the male and 61.05 per cent of the female
respondents agree with the statement, 21.14 per cent of the male and 20.00 per cent of the female are
neutral, and 18.70 per cent of the male and 18.94 per cent of the female respondents disagree with the
statement. Weighted average scores of the responses of both male and female respondents show that
they highly agree with the statement.

As many as 73.17 per cent of the trainees/software engineers, 57.60 per cent of the system
analysts, and 57.69 per cent of the project leaders/managers agree with the statement; 14.63 per cent
of the trainees/software engineers, 24.00 per cent of the system analysts, and 17.31 per cent of the
project leaders/managers are neutral; and 12.2 per cent of the trainees/software engineers, 18.40 per
cent of the system analysts, and 25 per cent of the project leaders/managers disagree with statement.
Weighted average scores of the responses of all the three categories of the respondents highly
agree with the statement. The level of agreement among trainees/software engineers more than the
others.
Table: 7.03
Educational Qualification-, Gender-, and Designation-Wise Analysis of the Responses to the Statement
that “My Dearness Allowance (D.A.) Neutralizes the Increase in Cost of Living”
Variables
No. of the Respondents
Strongly
Agree Agree Neutral Disagree
Strongly
Disagree Total
Edu
cati
on
B.E./ B.Tech.
11
(10.68)
[55]
--
21
(20.39)
[84]
--
40
(38.83)
[120]
--
31
(30.10)
[62]
--
0
(0.00)
[0]
--
103
(100)
[321]
{3.12}
M.C.A./
M.Tech.
25
(21.74)
[125]
--
31
(26.96)
[124]
--
19
(16.52)
[57]
--
27
(23.48)
[54]
--
13
(11.30)
[13]
---
115
(100)
[373]
{3.24}

G
end
er
Male
16
(13.01)
[80]
--
30
(24.39)
[120]
--
34
(27.64)
[102]
--
36
(29.27)
[72]
--
7
(5.69)
[7]
---
123
(100)
[381]
{3.10}
Female
20
(21.05)
[100]
--
22
(23.16)
[88]
--
25
(26.31)
[75]
--
22
(23.16)
[44]
--
6
(6.31)
[6]
---
95
(100)
[313]
{3.29}
Des
ign
atio
n
Trainee/
Software
Engineer
6
(14.63)
[30]
--
19
(46.34)
[76]
--
9
(21.95)
[27]
--
7
(17.07)
[14]
--
0
(0.00)
[0]
--
41
(100)
[147]
{3.58}
System Analyst
27
(21.60)
[135]
--
15
(12.00)
[60]
--
42
(33.60)
[126]
--
41
(32.80)
[82]
--
0
(0.00)
[0]
--
125
(100)
[403]
{3.22}
Project
Leader/
Manager
3
(5.77)
[15]
--
18
(34.61)
[72]
--
8
(15.38)
[24]
--
10
(19.23)
[20]
--
13
(25)
[13]
---
52
(100)
[144]
{2.77}
Total
36
(16.51)
[180]
--
52
(23.85)
[208]
--
59
(27.06)
[177]
--
58
(26.60)
[116]
--
13
(5.96)
[13]
---
218
(100)
[694]
{3.18}
Source: Field Survey

Note: 1. Figures in the parentheses are the percentages on row totals.
2. Figures in the square brackets are the weighted scores.
3. Figures in the flower brackets are the weighted average scores.
Table 7.03 educational qualification-, gender-, and designation-wise analysis of the responses to
the statement that “my dearness allowance (D.A.) neutralizes the increase in cost of living”
Education-wise analysis shows that:
10.68 per cent of the B.E./ B.Tech. qualified respondents and 21.74 per cent of the
M.C.A./M.Tech. qualified respondents strongly agree with the statement.
20.39 per cent of the B.E./ B.Tech. qualified respondents and 26.96 per cent of the
M.C.A./M.Tech. qualified respondents simply agree with the statement.
On the whole 31.07 per cent of the B.E./ B.Tech. qualified respondents and 48.70 per cent of
the M.C.A./M.Tech. qualified respondents either strongly or simply disagree with the
statement.
38.83 per cent of the B.E./ B.Tech. qualified respondents and 16.52 per cent of the
M.C.A./M.Tech. qualified respondents neither agree nor disagree with the statement.
30.10 per cent of the B.E./ B.Tech. qualified respondents and 23.48 per cent of the
M.C.A./M.Tech. qualified respondents disagree with the statement.
11.30 per cent of the M.C.A./M.Tech. qualified respondents strongly disagree with the
statement.
Weighted average scores indicate a high level of agreement with the statement (WAS=3.00
to 4.00).
Though both graduate and postgraduate respondents highly agree with the statement, the
postgraduates agree more than the graduates. The fact that more than 50 per cent of both

graduate and postgraduate respondents are either neutral or disagree with the statement
that “my dearness allowance (D.A.) neutralizes the increase in cost of living”.
Gender-wise analysis shows that:
13.01 per cent of the male respondents and 21.05 per cent of the female respondents
strongly agree with the statement.
24.39 per cent of the male respondents and 23.16 per cent of the female respondents
simply agree with the statement.
On the whole 37.40 per cent of the male respondents and 44.21 per cent of the female
respondents either strongly or simply agree with the statement.
27.64 per cent of the male respondents and 26.31 per cent of the female respondents
neither agree nor disagree with the statement.
29.27 per cent of the male respondents and 23.16 per cent of the female respondents
disagree with the statement.
5.69 per cent of the male respondents and 6.31 per cent of the female respondents strongly
disagree with the statement.
Weighted average scores of the responses of the respondents show a high level of
agreement with the statement. Female respondents agree more with the statement than
the male respondents. It is noteworthy that less than 50 per cent of the respondents carry a
definite positive opinion about the statement.
Designation-wise analysis shows that:
More than 60 per cent of the trainees/software engineers either strongly or simply agree
with the statement and the remaining 39.02 per cent of the trainee/software engineer

respondents are either neutral or disagree with the statement. Weighted average score of
the responses of the trainee/software respondents is 3.58 thus indicating a high level
agreement with the statement.
Only 33.60 per cent of the system analysts either strongly or simply agree with the
statement, an equal percentage of the system analysts neither agree not disagree with the
statement and an almost equal percentage of the system analysts disagree with the
statement. Though the calculated weighted average score or the responses (3.22) show a
high level of agreement with statement nearly two-thirds of the system analysts are either
neutral or disagree with the statement. This is a matter of concern.
Slightly more than 40 per cent of the project leaders/managers either strongly or simply
agree with the statement, 15.38 per cent of the project leaders/managers neither agree nor
disagree with the statement, and 44.23 per cent of the project leaders/managers either
simply or strongly disagree with the statement. Weighted average score (2.77) of the
responses of project leaders/managers show a low level of agreement with the statement.
On the whole 16.51 per cent of the respondents strongly agree, 23.85 per cent of the
respondents simply agree, 27.06 per cent of the respondents neither agree nor agree, 26.60
per cent of the respondents disagree and 5.96 per cent of the respondents strongly disagree
with the statement that ““my dearness allowance (D.A.) neutralizes the increase in cost of
living”.
Table: 7.04
Educational Qualification-, Gender-, and Designation-Wise Analysis of the Responses to the Statement
that “My Salary is in Commensurate with the Efforts I Put in on My Job”
Variables No. of the Respondents

Strongly
Agree Agree Neutral Disagree
Strongly
Disagree Total
Edu
cati
on
B.E./ B.Tech.
10
(9.71)
[50]
--
55
(53.40)
[220]
--
13
(12.62)
[39]
--
25
(24.27)
[50]
--
0
(0.00)
[0]
--
103
(100)
[359]
{3.48}
M.C.A./
M.Tech.
30
(26.09)
[150]
--
44
(38.26)
[176]
--
7
(6.09)
[21]
--
34
(29.56)
[68]
--
0
(0.00)
[0]
--
115
(100)
[415]
{3.61}
Gen
der
Male
24
(19.51)
[120]
--
53
(43.09)
[212]
--
14
(11.38)
[42]
--
32
(26.02)
[64]
--
0
(0.00)
[0]
--
123
(100)
[438]
{3.56}
Female
16
(16.84)
[80]
--
46
(48.42)
[184]
--
6
(6.31)
[18]
--
27
(28.42)
[54]
--
0
(0.00)
[0]
--
95
(100)
[336]
{3.54}
Des
ign
atio
n
Trainee/
Software
Engineer
7
(17.07)
[35]
--
29
(70.73)
[116]
--
4
(9.76)
[12]
--
1
(2.44)
[2]
--
0
(0.00)
[0]
--
41
(100)
[165]
{4.02}

System
Analyst
26
(20.80)
[130]
--
42
(33.60)
[168]
--
16
(12.80)
[48]
--
41
(32.80)
[164]
--
0
(0.00)
[0]
--
125
(100)
[510]
{4.08}
Project
Leader/
Manager
7
(13.46)
[35]
--
28
(53.85)
[112]
--
0
(0.00)
[0]
--
17
(32.69)
[34]
--
0
(0.00)
[0]
--
52
(100)
[181]
{3.48}
Total
40
(18.35)
[200]
--
99
(45.41)
[396]
--
20
(9.17)
[60]
--
59
(27.06)
[118]
--
0
(0.00)
[0]
--
218
(100)
[774]
{3.55}
Source: Field Survey
Note: 1. Figures in the parentheses are the percentages on row totals.
2. Figures in the square brackets are the weighted scores.
3. Figures in the flower brackets are the weighted average scores.
Table 7.04 educational qualification-, gender-, and designation-wise analysis of the responses to
the statement that “my salary is in commensurate with the efforts I put in on my job.”
Education-wise analysis shows 63.11 per cent of the B.E./ B.Tech. qualified respondents and
64.35 per cent of the M.C.A./M.Tech. qualified respondents either strongly or simply agree with the
statement, 24.27 per cent of the B.E./ B.Tech. qualified respondents and 29.56 per cent of the
M.C.A./M.Tech. qualified respondents disagree with the statement, and the remaining 12.62 per cent of
the B.E./ B.Tech. qualified and 6.09 per cent of the M.C.A./M.Tech. qualified respondents are neutral.
Weighted average scores of the responses show a high level of respondents’ agreement with the

statement. However M.C.A./M.Tech. qualified respondents agree more with the statement than the
B.E./ B.Tech. qualified respondents.
Gender-wise analysis shows 62.60 per cent of the male respondents and 65.26 per cent of the
female respondents either strongly or simply agree with the statement, 26.02 per cent of the male
respondents and 28.42 per cent of the female respondents disagree with the statement, and the
remaining 11.38 per cent of the male and 6.31 per cent of the female respondents are neutral.
Weighted average scores of the responses show a high level of male and female respondents’
agreement with the statement.
Designation-wise analysis shows that more than 87 per cent of the trainees/software engineers,
54.40 per cent of the system analysts, and 67.31 per cent of the project leaders/managers either
strongly or simply agree with the statement; a meager 2.44 per cent of the trainees/software engineers,
32.80 per cent of the system analysts, and 32.69 per cent of the project leaders/managers disagree with
the statement; and the remaining 9.76 per cent of the trainee/software engineers and 12.80 per cent of
the system analysts are neutral. Weighted average score of the responses of the trainee/software
engineers and system analysts show a very high level of agreement with the statement whereas
responses of the project leaders/managers show a high level of agreement.
On the whole 18.35 per cent of the respondents strongly agree, 45.41 per cent of the
respondents simply agree, 9.17 per cent of the respondents are neutral and 27.06 per cent of the
respondents disagree with the statement that “my salary is in commensurate with the efforts I put in on
my job.”
Table: 7.05
Educational Qualification-, Gender-, and Designation-Wise Analysis of the Responses to the Statement
that “There is an Improvement Factor in My Salary whenever it is Revised”

Variables
No. of the Respondents
Strongly
Agree Agree Neutral Disagree
Strongly
Disagree Total
Edu
cati
on
B.E./ B.Tech.
35
(33.98)
[175]
--
36
(34.95)
[144]
--
23
(22.33)
[69]
--
9
(8.74)
[18]
--
0
(0.00)
[0]
--
103
(100)
[406]
{3.90}
M.C.A./ M.Tech.
49
(42.61)
[245]
--
45
(39.13)
[180]
--
20
(17.39)
[60]
--
1
(0.87)
[2]
--
0
(0.00)
[0]
--
115
(100)
[487]
{4.23}
Gen
der
Male
50
(40.65)
[250]
--
45
(36.58)
[180]
--
26
(21.14)
[78]
--
2
(1.63)
[4]
--
0
(0.00)
[0]
--
123
(100)
[512]
{4.16}
Female
34
(35.79)
[170]
--
36
(37.89)
[144]
--
17
(17.90)
[51]
--
8
(8.42)
[16]
--
0
(0.00)
[0]
--
95
(100)
[381]
{4.01}
Des
ign
atio
n
Trainee/
Software
Engineer
6
(14.63)
[30]
--
29
(70.73)
[116]
--
5
(12.19)
[15]
--
1
(2.44)
[2]
--
0
(0.00)
[0]
--
41
(100)
[163]
{3.97}

System Analyst
57
(45.60)
[285]
--
25
(20.00)
[100]
--
37
(29.60)
[111]
--
6
(4.80)
[12]
--
0
(0.00)
[0]
--
125
(100)
[508]
{4.06}
Project Leader/
Manager
21
(40.38)
[105]
--
27
(51.92)
[108]
--
1
(1.92)
[3]
--
3
(5.77)
[6]
--
0
(0.00)
[0]
--
52
(100)
[222]
{4.27}
Total
84
(38.53)
[420]
--
81
(37.16)
[324]
--
43
(19.72)
[129]
--
10
(4.59)
[20]
--
0
(0.00)
[0]
--
218
(100)
[893]
{4.10}
Source: Field Survey
Note: 1. Figures in the parentheses are the percentages on row totals.
2. Figures in the square brackets are the weighted scores.
3. Figures in the flower brackets are the weighted average scores.
Table 7.05 shows educational qualification-, gender-, and designation-wise analysis of the
responses to the statement that “there is an improvement factor in my salary whenever it is revised.”
Education-wise analysis shows 68.93 per cent of the B.E./ B.Tech. qualified respondents and
81.74 per cent of the M.C.A./M.Tech. qualified respondents either strongly or simply agree with the
statement, 8.74 per cent of the B.E./ B.Tech. qualified respondents and 0.87 per cent of the

M.C.A./M.Tech. qualified respondents disagree with the statement, and the remaining 22.33 per cent of
the B.E./ B.Tech. qualified and 17.39 per cent of the M.C.A./M.Tech. qualified respondents are neutral.
Weighted average scores of the responses of B.E./ B.Tech. qualified respondent is 3.90 thus indicating a
high level of agreement with the statement and weighted average score of the responses of
M.C.A./M.Tech. qualified respondents is 4.23 thus indicating a very high level of agreement with the
statement.
Gender-wise analysis shows 77.23 per cent of the male respondents and 73.68 per cent of the
female respondents either strongly or simply agree with the statement, a meager 1.63 per cent of the
male respondents and 8.42 per cent of the female respondents disagree with the statement, and the
remaining 21.14 per cent of the male and 17.90 per cent of the female respondents are neutral.
Weighted average scores of the responses of both male and female respondents show a very high level
of agreement with the statement.
Designation-wise analysis shows that more than 84 per cent of the trainees/software engineers,
65.60 per cent of the system analysts, and 92.30 per cent of the project leaders/managers either
strongly or simply agree with the statement; a meager 2.44 per cent of the trainees/software engineers,
4.80 per cent of the system analysts, and 5.77 per cent of the project leaders/managers disagree with
the statement; and the remaining 12.19 per cent of the trainee/software engineers, 29.60 per cent of
the system analysts and 1.92 per cent of the project leaders/managers are neutral. Weighted average
score of the responses of the trainee/software engineers (WAS=3.97) shows a high level of agreement
with the statement, whereas the weighted average scores of the responses of system analysts and
project leaders/managers (4.06 and 4.27) show a very high level of agreement with the statement.
On the whole 38.53 per cent of the respondents strongly agree, 37.16 per cent of the
respondents simply agree, 19.72 per cent of the respondents are neutral and only 4.59 per cent of the
respondents disagree with the statement that “there is an improvement factor in my salary whenever it
is revised.” Weighted average score of the responses of all the respondents shows a very high level of
agreement with the statement (WAS=4.10).
Table: 7.06
Educational Qualification-, Gender-, and Designation-Wise Analysis of the Responses to the Statement
that “My Job Gives Economic Security by Way of Regular Employment and Regular Income”
Variables
No. of the Respondents
Strongly Agree Agree Neutral Disagree Strongly
Disagree Total
Edu
cati
on
B.E./ B.Tech.
14
(13.59)
[70]
--
24
(23.30)
[96]
--
35
(33.98)
[105]
--
30
(29.13)
[60]
--
0
(0.00)
[0]
--
103
(100)
[331]
{3.21}
M.C.A./
M.Tech.
44
(38.26)
[220]
--
45
(39.13)
[180]
--
10
(8.69)
[30]
--
16
(13.91)
[32]
--
0
(0.00)
[0]
--
115
(100)
[462]
{4.02}
Gen
der
Male
25
(20.32)
[125]
--
42
(34.15)
[168]
--
23
(18.70)
[69]
--
33
(26.83)
[66]
--
0
(0.00)
[0]
--
123
(100)
[428]
{3.48}
Female
33
(34.74)
[165]
--
27
(28.42)
[108]
--
22
(23.16)
[66]
--
13
(13.68)
[26]
--
0
(0.00)
[0]
--
95
(100)
[365]
{3.84}

D
esig
nat
ion
Trainee/
Software
Engineer
4
(9.76)
[20]
--
27
(65.85)
[108]
--
6
(14.63)
[18]
--
4
(9.76)
[8]
--
0
(0.00)
[0]
--
41
(100)
[154]
{3.76}
System Analyst
40
(32.00)
[200]
--
13
(10.40)
[52]
--
31
(24.80)
[93]
--
41
(32.80)
[82]
--
0
(0.00)
[0]
--
125
(100)
[427]
{3.42}
Project
Leader/
Manager
14
(26.92)
[70]
--
29
(55.77)
[116]
--
8
(15.38)
[24]
--
1
(1.92)
[2]
--
0
(0.00)
[0]
--
52
(100)
[212]
{4.08}
Total
58
(26.60)
[290]
--
69
(31.65)
[276]
--
45
(20.64)
[135]
--
46
(21.10)
[92]
--
0
(0.00)
[0]
--
218
(100)
[793]
{3.64}
Source: Field Survey
Note: 1. Figures in the parentheses are the percentages on row totals.
2. Figures in the square brackets are the weighted scores.
3. Figures in the flower brackets are the weighted average scores.
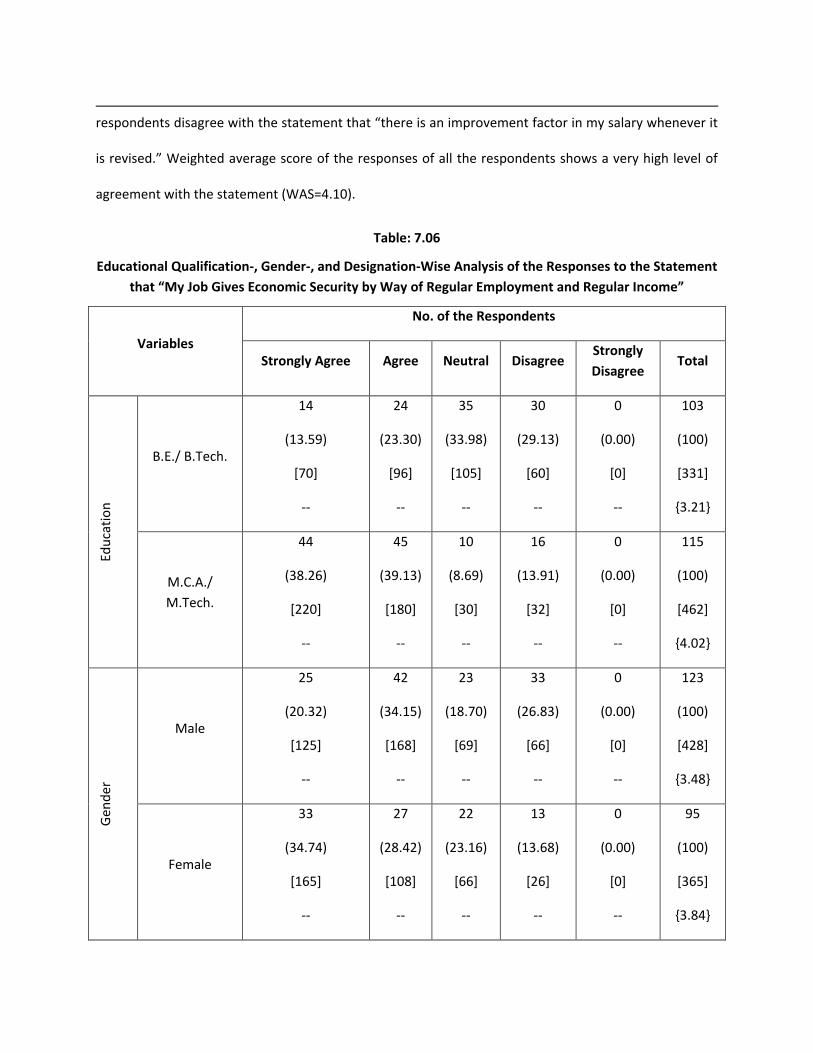
Table 7.06 shows educational qualification-, gender-, and designation-wise analysis of the
responses to the statement that “my job gives economic security by way of regular employment and
regular income”

Education-wise analysis shows 36.89 per cent of the B.E./ B.Tech. qualified respondents and
77.39 per cent of the M.C.A./M.Tech. qualified respondents either strongly or simply agree with the
statement, 29.13 per cent of the B.E./ B.Tech. qualified respondents and 13.91 per cent of the
M.C.A./M.Tech. qualified respondents disagree with the statement, and the remaining 33.98 per cent of
the B.E./ B.Tech. qualified and 8.69 per cent of the M.C.A./M.Tech. qualified respondents are neutral.
Weighted average scores of the responses of B.E./ B.Tech. qualified respondent is 3.21 thus indicating a
high level of agreement with the statement and weighted average score of the responses of
M.C.A./M.Tech. qualified respondents is 4.02 thus indicating a very high level of agreement with the
statement.
Gender-wise analysis shows 54.47 per cent of the male respondents and 63.16 per cent of the
female respondents either strongly or simply agree with the statement, 26.83 per cent of the male
respondents and 13.68 per cent of the female respondents disagree with the statement, and the
remaining 18.70 per cent of the male and 23.16 per cent of the female respondents are neutral.
Weighted average scores of the responses of both male and female respondents show a high level of
agreement with the statement (3.48 and 3.84 respectively).
Designation-wise analysis shows that more than 75 per cent of the trainees/software engineers,
42.40 per cent of the system analysts, and 82.69 per cent of the project leaders/managers either
strongly or simply agree with the statement; a meager 9.76 per cent of the trainees/software engineers,
32.80 per cent of the system analysts, and 1.92 per cent of the project leaders/managers disagree with
the statement; and the remaining 14.63 per cent of the trainee/software engineers, 24.80 per cent of
the system analysts and 15.38 per cent of the project leaders/managers are neutral. Weighted average
score of the responses of the trainee/software engineers (WAS=3.72) and system analysts (WAS=3.42)
show a high level of agreement with the statement, whereas the weighted average score of the

responses of the project leaders/managers (WAS=4.08) shows a very high level of agreement with the
statement.
On the whole 26.60 per cent of the respondents strongly agree, 31.65 per cent of the
respondents simply agree, 20.64 per cent of the respondents are neutral and 21.10 per cent of the
respondents disagree with the statement that “My job gives economic security by way of regular
employment and regular income.” Weighted average score of the responses of all the respondents
shows a high level of agreement with the statement (WAS=3.64).
Table: 7.07
Educational Qualification-, Gender-, and Designation-Wise Analysis of the Responses to the Statement
that “My Job Provides Sufficient Incentives, Leave Facilities and Benefits”
Variables
No. of the Respondents
Strongly
Agree Agree Neutral Disagree
Strongly
Disagree Total
Edu
cati
on
B.E./ B.Tech.
34
(33.00)
[170]
--
54
(52.43)
[216]
--
8
(7.77)
[24]
--
7
(6.80)
[14]
--
0
(0.00)
[0]
--
103
(100)
[424]
{4.12}
M.C.A./
M.Tech.
34
(29.56)
[170]
--
56
(48.69)
[224]
--
2
(1.74)
[6]
--
23
(20)
[46]
--
0
(0.00)
[0]
--
115
(100)
[446]
{3.88}
Gen
der
Male
33
(26.83)
[165]
--
67
(54.47)
[268]
--
3
(2.44)
[9]
--
20
(16.26)
[40]
--
0
(0.00)
[0]
--
123
(100)
[482]
{3.92}

Female
35
(36.84)
[175]
--
43
(45.26)
[172]
--
7
(7.37)
[21]
--
10
(10.53)
[20]
--
0
(0.00)
[0]
--
95
(100)
[388]
{4.08}
Des
ign
atio
n
Trainee/
Software
Engineer
9
(21.95)
[45]
--
25
(60.97)
[100]
--
1
(2.44)
[3]
--
6
(14.63)
[12]
--
0
(0.00)
[0]
--
41
(100)
[160]
{3.90}
System
Analyst
53
(42.40)
[265]
--
61
(48.80)
[244]
--
7
(5.60)
[21]
--
4
(3.20)
[8]
--
0
(0.00)
[0]
--
125
(100)
[538]
{4.30}
Project
Leader/
Manager
6
(11.54)
[30]
--
24
(46.15)
[96]
--
2
(3.85)
[6]
--
20
(38.46)
[40]
--
0
(0.00)
[0]
--
52
(100)
[172]
{3.31}
Total
68
(31.19)
[340]
--
110
(50.46)
[440]
--
10
(4.59)
[30]
--
30
(13.76)
[60]
--
0
(0.00)
[0]
--
218
(100)
[870]
{3.99}
Source: Field Survey
Note: 1. Figures in the parentheses are the percentages on row totals.
2. Figures in the square brackets are the weighted scores.
3. Figures in the flower brackets are the weighted average scores.

Table 7.07 shows educational qualification-, gender-, and designation-wise analysis of the
responses to the statement that “my job provides sufficient incentives, leave facilities and benefits”
Education-wise analysis shows 85.43 per cent of the B.E./ B.Tech. qualified respondents and
78.25 per cent of the M.C.A./M.Tech. qualified respondents either strongly or simply agree with the
statement, 6.80 per cent of the B.E./ B.Tech. qualified respondents and 20.00 per cent of the
M.C.A./M.Tech. qualified respondents disagree with the statement, and the remaining 7.77 per cent of
the B.E./ B.Tech. qualified and 1.74 per cent of the M.C.A./M.Tech. qualified respondents are neutral.
Weighted average scores of the responses of B.E./ B.Tech. qualified respondents is 4.13 thus indicating a
very high level of agreement with the statement and weighted average score of the responses of
M.C.A./M.Tech. qualified respondents is 3.88 thus indicating a high level of agreement with the
statement.
Gender-wise analysis shows 87.30 per cent of the male respondents and 82.10 per cent of the
female respondents either strongly or simply agree with the statement, 16.26 per cent of the male
respondents and 10.53 per cent of the female respondents disagree with the statement, and the
remaining 2.44 per cent of the male and 7.37 per cent of the female respondents are neutral. Weighted
average scores of the responses of male respondents (WAS=3.92) shows a high level of agreement with
the statement and weighted average score of the responses of the female respondents (WAS=4.08)
shows a very high level of agreement with the statement.
Designation-wise analysis shows that about 83 per cent of the trainees/software engineers,
91.20 per cent of the system analysts, and 57.69 per cent of the project leaders/managers either
strongly or simply agree with the statement; a meager 14.63 per cent of the trainees/software
engineers, 3.20 per cent of the system analysts, and 38.46 per cent of the project leaders/managers
disagree with the statement; and the remaining 2.44 per cent of the trainee/software engineers, 5.60
per cent of the system analysts and 3.85 per cent of the project leaders/managers are neutral. Weighted
average score of the responses of the trainee/software engineers (WAS=3.90) and project
leaders/managers (WAS=3.31) show a high level of agreement with the statement, whereas the
weighted average score of the responses of the system analysts (WAS=4.30) shows a very high level of
agreement with the statement.
On the whole 31.19 per cent of the respondents strongly agree, 50.46 per cent of the
respondents simply agree, 4.59 per cent of the respondents are neutral and 13.76 per cent of the
respondents disagree with the statement “my job provides sufficient incentives, leave facilities and
benefits.” Weighted average score of the responses of all the respondents shows a high level of
agreement with the statement (WAS=3.99).
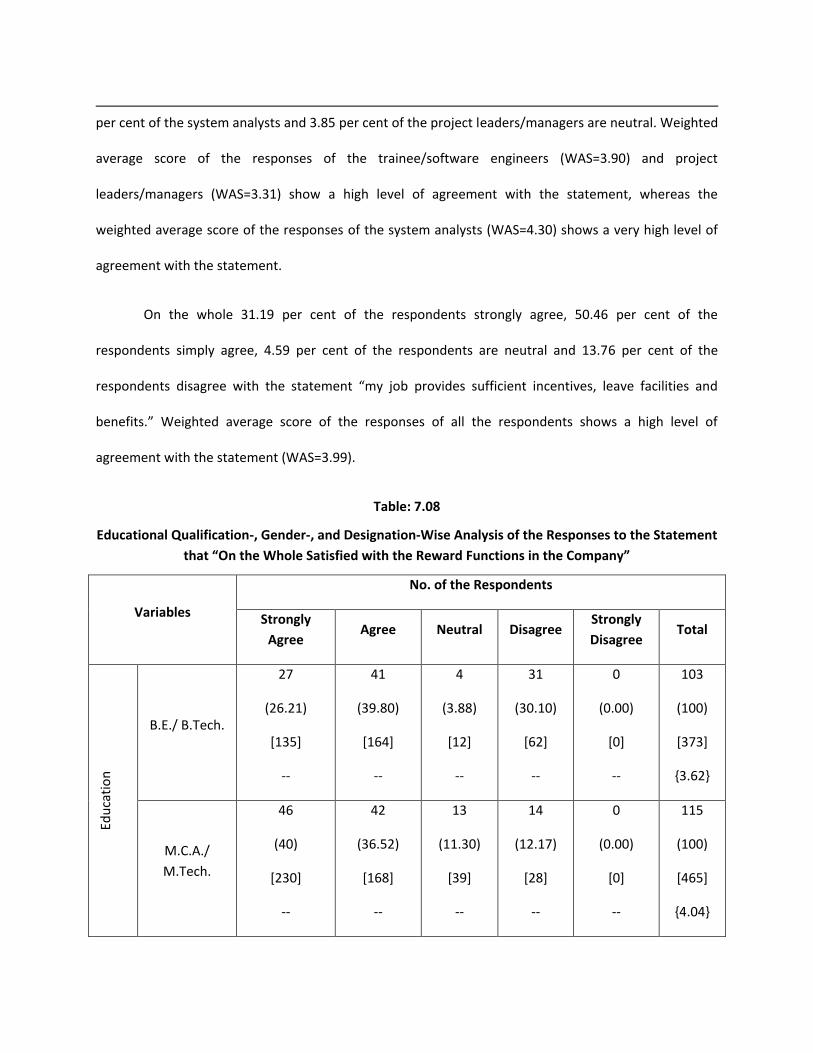
Table: 7.08
Educational Qualification-, Gender-, and Designation-Wise Analysis of the Responses to the Statement
that “On the Whole Satisfied with the Reward Functions in the Company”
Variables
No. of the Respondents
Strongly
Agree Agree Neutral Disagree
Strongly
Disagree Total
Edu
cati
on
B.E./ B.Tech.
27
(26.21)
[135]
--
41
(39.80)
[164]
--
4
(3.88)
[12]
--
31
(30.10)
[62]
--
0
(0.00)
[0]
--
103
(100)
[373]
{3.62}
M.C.A./
M.Tech.
46
(40)
[230]
--
42
(36.52)
[168]
--
13
(11.30)
[39]
--
14
(12.17)
[28]
--
0
(0.00)
[0]
--
115
(100)
[465]
{4.04}

G
end
er
Male
39
(31.71)
[195]
--
49
(39.84)
[196]
--
6
(4.88)
[18]
--
29
(23.58)
[58]
--
0
(0.00)
[0]
--
123
(100)
[467]
{3.80}
Female
34
(35.79)
[170]
--
34
(35.79)
[136]
--
11
(11.58)
[33]
--
16
(16.84)
[32]
--
0
(0.00)
[0]
--
95
(100)
[371]
{3.90}
Des
ign
atio
n
Trainee/
Software
Engineer
8
(19.51)
[40]
--
23
(56.09)
[92]
--
7
(17.07)
[21]
--
3
(7.32)
[6]
--
0
(0.00)
[0]
--
41
(100)
[159]
{3.88}
System
Analyst
55
(44.00)
[275]
--
32
(25.60)
[128]
--
2
(1.60)
[6]
--
36
(28.80)
[72]
--
0
(0.00)
[0]
--
125
(100)
[481]
{3.85}
Project
Leader/
Manager
10
(19.23)
[50]
--
28
(53.85)
[112]
--
8
(15.38)
[24]
--
6
(11.54)
[12]
--
0
(0.00)
[0]
--
52
(100)
[198]
{3.81}
Total
73
(33.49)
[365]
--
83
(38.07)
[332]
--
17
(7.80)
[51]
--
45
(20.64)
[90]
--
0
(0.00)
[0]
--
218
(100)
[838]
{3.84}
Source: Field Survey

Note: 1. Figures in the parentheses are the percentages on row totals.
2. Figures in the square brackets are the weighted scores.
3. Figures in the flower brackets are the weighted average scores.
Table 7.08 shows educational qualification-, gender-, and designation-wise analysis of the
responses to the statement that “on the whole satisfied with the reward functions in the company”
Education-wise analysis shows 66.01 per cent of the B.E./ B.Tech. qualified respondents and
76.52 per cent of the M.C.A./M.Tech. qualified respondents either strongly or simply agree with the
statement, 30.10 per cent of the B.E./ B.Tech. qualified respondents and 12.17 per cent of the
M.C.A./M.Tech. qualified respondents disagree with the statement, and the remaining 3.88 per cent of
the B.E./ B.Tech. qualified and 11.30 per cent of the M.C.A./M.Tech. qualified respondents are neutral.
Weighted average scores of the responses of B.E./ B.Tech. qualified respondent is 3.62 thus indicating a
high level of agreement with the statement and weighted average score of the responses of
M.C.A./M.Tech. qualified respondents is 4.04 thus indicating a very high level of agreement with the
statement.
Gender-wise analysis shows 71.55 per cent of the male respondents and 71.58 per cent of the
female respondents either strongly or simply agree with the statement, 23.58 per cent of the male
respondents and 16.84 per cent of the female respondents disagree with the statement, and the
remaining 4.88 per cent of the male and 11.58 per cent of the female respondents are neutral.
Weighted average scores of the responses of both male (WAS=3.80) female respondents (WAS=3.90)
show a high level of agreement with the statement.
Designation-wise analysis shows that about 75.60 per cent of the trainees/software engineers,
69.60 per cent of the system analysts, and 73.08 per cent of the project leaders/managers either
strongly or simply agree with the statement; a meager 7.32 per cent of the trainees/software engineers,

28.80 per cent of the system analysts, and 11.54 per cent of the project leaders/managers disagree with
the statement; and the remaining 17.07 per cent of the trainee/software engineers, 1.60 per cent of the
system analysts and 15.38 per cent of the project leaders/managers are neutral. Weighted average
score of the responses of the trainee/software engineers (WAS=3.88), system analysts (WAS=3.85) and
project leaders/managers (WAS=3.81) show a high level of agreement with the statement.
On the whole 33.49 per cent of the respondents strongly agree, 38.07 per cent of the
respondents simply agree, 7.80 per cent of the respondents are neutral and 20.64 per cent of the
respondents disagree with the statement “on the whole satisfied with the reward functions in the
company.” Weighted average score of the responses of all the respondents shows a high level of
agreement with the statement (WAS=3.84).
Table: 7.09
Educational Qualification-, Gender-, and Designation-Wise Analysis of the Responses to the Statement
that “I am Satisfied with the Welfare Measures Provided by the Company”
Variables
No. of the Respondents
Strongly
Agree Agree Neutral Disagree
Strongly
Disagree Total
Edu
cati
on
B.E./ B.Tech.
19
(18.45)
[95]
--
66
(64.08)
[264]
--
7
(6.80)
[21]
--
11
(10.68)
[22]
--
0
(0.00)
[0]
--
103
(100)
[402]
{3.90}

M.C.A./
M.Tech.
38
(33.04)
[190]
--
60
(52.17)
[240]
--
10
(8.69)
[30]
--
7
(6.08)
[14]
--
0
(0.00)
[0]
--
115
(100)
[474]
{4.12}
Gen
der
Male
28
(22.76)
[140]
--
80
(65.04)
[320]
--
7
(5.69)
[21]
--
8
(6.50)
[16]
--
0
(0.00)
[0]
--
123
(100)
[497]
{4.04}
Female
29
(30.53)
[145]
--
46
(48.42)
[184]
--
10
(10.53)
[30]
--
10
(10.53)
[20]
--
0
(0.00)
[0]
--
95
(100)
[379]
{3.99}
Des
ign
atio
n
Trainee/
Software
Engineer
13
(31.71)
[65]
--
23
(56.10)
[92]
--
2
(4.88)
[6]
--
3
(7.32)
[6]
--
0
(0.00)
[0]
--
41
(100)
[169]
{4.12}
System
Analyst
30
(24.00)
[150]
--
81
(64.80)
[324]
--
7
(5.60)
[21]
--
7
(5.60)
[14]
--
0
(0.00)
[0]
--
125
(100)
[509]
{4.07}
Project
Leader/
Manager
14
(26.92)
[70]
--
22
(42.31)
[88]
--
8
(15.38)
[24]
--
8
(15.38)
[16]
--
0
(0.00)
[0]
--
52
(100)
[198]
{3.81}

Total
57
(26.15)
[285]
--
126
(57.80)
[504]
--
17
(7.80)
[51]
--
18
(8.26)
[36]
--
0
(0.00)
[0]
--
218
(100)
[876]
{4.02}
Source: Field Survey
Note: 1. Figures in the parentheses are the percentages on row totals.
2. Figures in the square brackets are the weighted scores.
3. Figures in the flower brackets are the weighted average scores.
Table 7.09 shows educational qualification-, gender-, and designation-wise analysis of the
responses to the statement that “satisfied with the welfare measures provided by the company.”
Education-wise analysis shows 82.53 per cent of the B.E./ B.Tech. qualified respondents and
85.53 per cent of the M.C.A./M.Tech. qualified respondents either strongly or simply agree with the
statement, 10.68 per cent of the B.E./ B.Tech. qualified respondents and 6.08 per cent of the
M.C.A./M.Tech. qualified respondents disagree with the statement, and the remaining 6.80 per cent of
the B.E./ B.Tech. qualified and 8.69 per cent of the M.C.A./M.Tech. qualified respondents are neutral.
Weighted average scores of the responses of B.E./ B.Tech. qualified respondent is 3.90 thus indicating a
high level of agreement with the statement and weighted average score of the responses of
M.C.A./M.Tech. qualified respondents is 4.12 thus indicating a very high level of agreement with the
statement.
Gender-wise analysis shows 87.80 per cent of the male respondents and 78.95 per cent of the
female respondents either strongly or simply agree with the statement, 6.50 per cent of the male
respondents and 10.53 per cent of the female respondents disagree with the statement, and the
remaining 5.69 per cent of the male and 10.53 per cent of the female respondents are neutral.

Weighted average scores of the responses of male respondents is 4.04 thus indicating a very high level
agreement with the statement and that of female respondents is 3.99 thus indicating a high level of
agreement with the statement.
Designation-wise analysis shows that 87.81 per cent of the trainees/software engineers, 88.80
per cent of the system analysts, and 69.23 per cent of the project leaders/managers either strongly or
simply agree with the statement; a meager 7.32 per cent of the trainees/software engineers, 5.60 per
cent of the system analysts, and 15.38 per cent of the project leaders/managers disagree with the
statement; and the remaining 4.88 per cent of the trainees/software engineers, 5.60 per cent of the
system analysts and 15.38 per cent of the project leaders/managers are neutral. Weighted average
score of the responses of the trainee/software engineers (WAS=4.12), system analysts (WAS=4.07) show
a very high level of agreement with the statement, whereas weighted average score of the responses of
the project leaders/managers is 3.81 shows a high level of agreement with the statement.
On the whole 26.15 per cent of the respondents strongly agree, 57.80 per cent of the
respondents simply agree, 7.80 per cent of the respondents are neutral and 8.26 per cent of the
respondents disagree with the statement “I am satisfied with the welfare measures provided by the
company.” Weighted average score of the responses of all the respondents shows a very high level of
agreement with the statement (WAS=4.02).
Table: 7.10
Educational Qualification-, Gender-, and Designation-Wise Analysis of the Responses to the Statement
that “I am Satisfied with Allowances Provided by the Company”
Variables
No. of the Respondents
Strongly
Agree Agree Neutral Disagree
Strongly
Disagree Total

Ed
uca
tio
n
B.E./ B.Tech.
35
(33.98)
[175]
--
46
(44.66)
[184]
--
12
(11.65)
[36]
--
10
(9.71)
[20]
--
0
(0.00)
[0]
--
103
(100)
[415]
{4.03}
M.C.A./
M.Tech.
48
(41.74)
[240]
--
47
(40.87)
[188]
--
16
(13.91)
[48]
--
4
(9.76)
[8]
--
0
(0.00)
[0]
--
115
(100)
[484]
{4.21}
Gen
der
Male
52
(42.28)
[260]
--
43
(34.96)
[172]
--
18
(14.63)
[54]
--
10
(8.13)
[20]
--
0
(0.00)
[0]
--
123
(100)
[506]
{4.11}
Female
31
(32.63)
[155]
--
50
(52.63)
[200]
--
10
(10.53)
[30]
--
4
(4.21)
[8]
--
0
(0.00)
[0]
--
95
(100)
[393]
{4.14}
Des
ign
atio
n
Trainee/
Software
Engineer
13
(31.71)
[65]
--
17
(41.46)
[68]
--
7
(17.07)
[21]
--
4
(9.76)
[8]
--
0
(0.00)
[0]
--
41
(100)
[162]
{3.95}
System
Analyst
58
(46.40)
[290]
--
51
(40.80)
[204]
--
12
(9.60)
[36]
--
4
(3.20)
[8]
--
0
(0.00)
[0]
--
125
(100)
[538]
{4.30}

Project
Leader/
Manager
12
(23.08)
[60]
--
25
(48.08)
[100]
--
9
(17.31)
[27]
--
6
(11.54)
[12]
--
0
(0.00)
[0]
--
52
(100)
[199]
{3.83}
Total
83
(38.07)
[415]
--
93
(42.66)
[372]
--
28
(12.84)
[84]
--
14
(6.42)
[28]
--
0
(0.00)
[0]
--
218
(100)
[899]
{4.12}
Source: Field Survey
Note: 1. Figures in the parentheses are the percentages on row totals.
2. Figures in the square brackets are the weighted scores.
3. Figures in the flower brackets are the weighted average scores.
Table 7.10 shows educational qualification-, gender-, and designation-wise analysis of the
responses to the statement that “I am satisfied with allowances provided by the company”
Education-wise analysis shows 78.64 per cent of the B.E./ B.Tech. qualified respondents and
82.61 per cent of the M.C.A./M.Tech. qualified respondents either strongly or simply agree with the
statement, 9.71 per cent of the B.E./ B.Tech. qualified respondents and 9.76 per cent of the
M.C.A./M.Tech. qualified respondents disagree with the statement, and the remaining 11.65 per cent of
the B.E./ B.Tech. qualified and 13.91 per cent of the M.C.A./M.Tech. qualified respondents are neutral.
Weighted average scores of the responses of B.E./ B.Tech. qualified (WAS=4.03) M.C.A./M.Tech.
qualified respondents (WAS=4.21) indicate a very high level of agreement with the statement.
Gender-wise analysis shows 77.24 per cent of the male respondents and 85.26 per cent of the
female respondents either strongly or simply agree with the statement, 8.13 per cent of the male

respondents and 4.21 per cent of the female respondents disagree with the statement, and the
remaining 14.63 per cent of the male and 10.53 per cent of the female respondents are neutral.
Weighted average scores of the responses of male (WAS=4.11) and that of female respondents
(WAS=4.14) indicate a very high level of agreement with the statement.
Designation-wise analysis shows that 73.17 per cent of the trainees/software engineers, 87.20
per cent of the system analysts, and 71.16 per cent of the project leaders/managers either strongly or
simply agree with the statement; a meager 9.76 per cent of the trainees/software engineers, 3.20 per
cent of the system analysts, and 11.54 per cent of the project leaders/managers disagree with the
statement; and the remaining 17.07 per cent of the trainees/software engineers, 9.60 per cent of the
system analysts and 17.31 per cent of the project leaders/managers are neutral. Weighted average
score of the responses of the system analysts (WAS=4.30) show a very high level of agreement with the
statement, whereas weighted average scores of the responses of the trainees/software engineers
(WAS=3.95) and project leaders/managers (WAS=3.81) show a high level of agreement with the
statement.
On the whole 38.07 per cent of the respondents strongly agree, 42.66 per cent of the
respondents simply agree, 12.84 per cent of the respondents are neutral and 6.42 per cent of the
respondents disagree with the statement “I am satisfied with allowances provided by the company”
Weighted average score of the responses of all the respondents shows a very high level of agreement
with the statement (WAS=4.12).
Table: 7.11

Educational Qualification-, Gender-, and Designation-Wise Analysis of the Responses to the Statement
that “I am Satisfied with the Increments Provided by the Company”
Variables
No. of the Respondents
Strongly
Agree Agree Neutral Disagree
Strongly
Disagree Total
Edu
cati
on
B.E./ B.Tech.
18
(17.47)
[90]
--
28
(27.18)
[112]
--
23
(22.33)
[69]
--
34
(33.01)
[68]
--
0
(0.00)
[0]
--
103
(100)
[339]
{3.29}
M.C.A./
M.Tech.
32
(27.83)
[160]
--
29
(25.22)
[116]
--
19
(16.52)
[57]
--
35
(30.43)
[70]
--
0
(0.00)
[0]
--
115
(100)
[403]
{3.50}
Gen
der
Male
27
(21.95)
[135]
--
29
(23.58)
[116]
--
21
(17.07)
[63]
--
46
(37.40)
[92]
--
0
(0.00)
[0]
--
123
(100)
[406]
{3.30}
Female
23
(24.21)
[115]
--
28
(29.47)
[112]
--
21
(22.10)
[63]
--
23
(24.21)
[46]
--
0
(0.00)
[0]
--
95
(100)
[336]
{3.54}
Des
ign
atio
n
Trainee/
Software
Engineer
7
(17.07)
[35]
--
18
(43.90)
[72]
--
14
(34.15)
[42]
--
2
(4.88)
[4]
--
0
(0.00)
[0]
--
41
(100)
[153]
{3.73}

System Analyst
32
(25.60)
[160]
--
16
(12.80)
[64]
--
23
(18.40)
[69]
--
54
(43.20)
[108]
--
0
(0.00)
[0]
--
125
(100)
[401]
{3.21}
Project
Leader/
Manager
11
(21.15)
[55]
--
23
(44.23)
[92]
--
5
(9.61)
[15]
--
13
(25)
[26]
--
0
(0.00)
[0]
--
52
(100)
[188]
{3.61}
Total
50
(22.93)
[250]
--
57
(26.15)
[228]
--
42
(19.27)
[126]
--
69
(31.65)
[138]
--
0
(0.00)
[0]
--
218
(100)
[742]
{3.40}
Source: Field Survey
Note: 1. Figures in the parentheses are the percentages on row totals.
2. Figures in the square brackets are the weighted scores.
3. Figures in the flower brackets are the weighted average scores.
Table 7.11 shows educational qualification-, gender-, and designation-wise analysis of the
responses to the statement that “I am satisfied with the increments provided by the company”.
Education-wise analysis shows 44.65 per cent of the B.E./ B.Tech. qualified respondents and
53.05 per cent of the M.C.A./M.Tech. qualified respondents either strongly or simply agree with the
statement, 33.01 per cent of the B.E./ B.Tech. qualified respondents and 30.43 per cent of the
M.C.A./M.Tech. qualified respondents disagree with the statement, and the remaining 22.33 per cent of
the B.E./ B.Tech. qualified and 16.52 per cent of the M.C.A./M.Tech. qualified respondents are neutral.

Weighted average scores of the responses of B.E./ B.Tech. qualified (WAS=3.29) M.C.A./M.Tech.
qualified respondents (WAS=3.50) indicate a high level of agreement with the statement.
Gender-wise analysis shows 45.53 per cent of the male respondents and 53.68 per cent of the
female respondents either strongly or simply agree with the statement, 37.40 per cent of the male
respondents and 24.21 per cent of the female respondents disagree with the statement, and the
remaining 17.07 per cent of the male and 22.10 per cent of the female respondents are neutral.
Weighted average scores of the responses of male (WAS=3.30) and that of female respondents
(WAS=3.54) indicate a high level of agreement with the statement.
Designation-wise analysis shows that 60.97 per cent of the trainees/software engineers, 38.40
per cent of the system analysts, and 65.38 per cent of the project leaders/managers either strongly or
simply agree with the statement; a meager 4.88 per cent of the trainees/software engineers, 43.20 per
cent of the system analysts, and 25.00 per cent of the project leaders/managers disagree with the
statement; and the remaining 34.15 per cent of the trainees/software engineers, 18.40 per cent of the
system analysts and 9.61 per cent of the project leaders/managers are neutral. Weighted average score
of the responses of the trainees/software engineers (WAS=3.73), system analysts (WAS=3.21) and
project leaders/managers (WAS=3.61) show a high level of agreement with the statement.
On the whole 22.93 per cent of the respondents strongly agree, 26.15 per cent of the
respondents simply agree, 19.27 per cent of the respondents are neutral and 31.65 per cent of the
respondents disagree with the statement “I am satisfied with the increments provided by the company.”
Weighted average score of the responses of all the respondents shows a high level of agreement with
the statement (WAS=3.40).
Table: 7.12
Educational Qualification-, Gender-, and Designation-Wise Analysis of the Responses to the Statement
that “I am Satisfied with the Periodical Review of Salaries and Other Benefits”

Variables
No. of the Respondents
Strongly
Agree Agree Neutral Disagree
Strongly
Disagree Total
Edu
cati
on
B.E./ B.Tech.
45
(43.69)
[225]
--
43
(41.75)
[172]
--
6
(5.82)
[18]
--
9
(8.74)
[18]
--
0
(0.00)
[0]
--
103
(100)
[433]
{4.20}
M.C.A./
M.Tech.
39
(33.91)
[195]
--
38
(33.04)
[152]
--
12
(10.43)
[36]
--
25
(21.74)
[50]
--
0
(0.00)
[0]
--
115
(100)
[434]
{3.77}
Gen
der
Male
46
(37.40)
[230]
--
45
(36.58)
[180]
--
10
(8.13)
[30]
--
22
(17.89)
[44]
--
0
(0.00)
[0]
--
123
(100)
[484]
{3.93}
Female
38
(40.00)
[190]
--
36
(37.89)
[144]
--
8
(8.42)
[24]
--
12
(12.63)
[24]
--
1
(1.05)
[1]
--
95
(100)
[383]
{4.03}
Des
ign
atio
n
Trainee/
Software
Engineer
9
(21.95)
[45]
--
10
(24.39)
[40]
--
13
(31.71)
[39]
--
9
(21.95)
[18]
--
0
(0.00)
[0]
--
41
(100)
[142]
{3.46}

System Analyst
70
(56.00)
[350]
--
50
(40.00)
[200]
--
2
(1.60)
[6]
--
2
(1.60)
[4]
--
1
(0.8)
[1]
--
125
(100)
[561)
{4.49}
Project
Leader/
Manager
5
(9.61)
[25]
--
21
(40.38)
[84]
--
3
(5.77)
[9]
--
23
(44.23)
[46]
--
0
(0.00)
[0]
--
52
(100)
[164]
{3.15}
Total
84
(38.53)
[420]
--
81
(37.15)
[324]
--
18
(8.26)
[54]
--
34
(15.60)
[68]
--
1
(0.46)
[1]
--
218
(100)
[867]
{3.98}
Source: Field Survey
Note: 1. Figures in the parentheses are the percentages on row totals.
2. Figures in the square brackets are the weighted scores.
3. Figures in the flower brackets are the weighted average scores.
Table 7.12 shows educational qualification-, gender-, and designation-wise analysis of the
responses to the statement that “I am satisfied with the periodical review of salaries and other benefits”
Education-wise analysis shows 77.60 per cent of the B.E./ B.Tech. qualified respondents and
66.95 per cent of the M.C.A./M.Tech. qualified respondents either strongly or simply agree with the
statement, 8.74 per cent of the B.E./ B.Tech. qualified respondents and 21.74 per cent of the
M.C.A./M.Tech. qualified respondents disagree with the statement, and the remaining 5.82 per cent of
the B.E./ B.Tech. qualified and 10.43 per cent of the M.C.A./M.Tech. qualified respondents are neutral.
Weighted average scores of the responses of B.E./ B.Tech. qualified respondents is 4.20 indicates a very

high level of agreement with the statement. Weighted average score of the responses of
M.C.A./M.Tech. qualified respondents is 3.77 indicates a high level of agreement with the statement.
Gender-wise analysis shows 73.98 per cent of the male respondents and 77.89 per cent of the
female respondents either strongly or simply agree with the statement, 17.89 per cent of the male
respondents and 12.63 per cent of the female respondents disagree with the statement, and the
remaining 8.13 per cent of the male and 8.42 per cent of the female respondents are neutral. Weighted
average scores of the responses of male respondents is 3.93 indicates a high level of agreement with the
statement. Weighted average scores of the responses of female respondents is 4.03 indicates a very
high level of agreement with the statement.
Designation-wise analysis shows that 46.34 per cent of the trainees/software engineers, 96.00
per cent of the system analysts, and 49.99 per cent of the project leaders/managers either strongly or
simply agree with the statement; 21.95 per cent of the trainees/software engineers, 1.60 per cent of the
system analysts, and 44.23 per cent of the project leaders/managers disagree with the statement; and
the remaining 31.71 per cent of the trainees/software engineers, 1.60 per cent of the system analysts
and 5.77 per cent of the project leaders/managers are neutral. Weighted average score of the responses
of the trainees/software engineers (WAS=3.46) and project leaders/managers (WAS=3.15) indicate a
high level of agreement with the statement, Weighted average score of the responses of system
analysts is 4.49 indicates a very high level of agreement with the statement.
On the whole 38.53 per cent of the respondents strongly agree, 37.15 per cent of the
respondents simply agree, 8.26 per cent of the respondents are neutral, 15.60 per cent of the
respondents disagree and 0.46 per cent of the respondents strongly disagree with the statement “I am
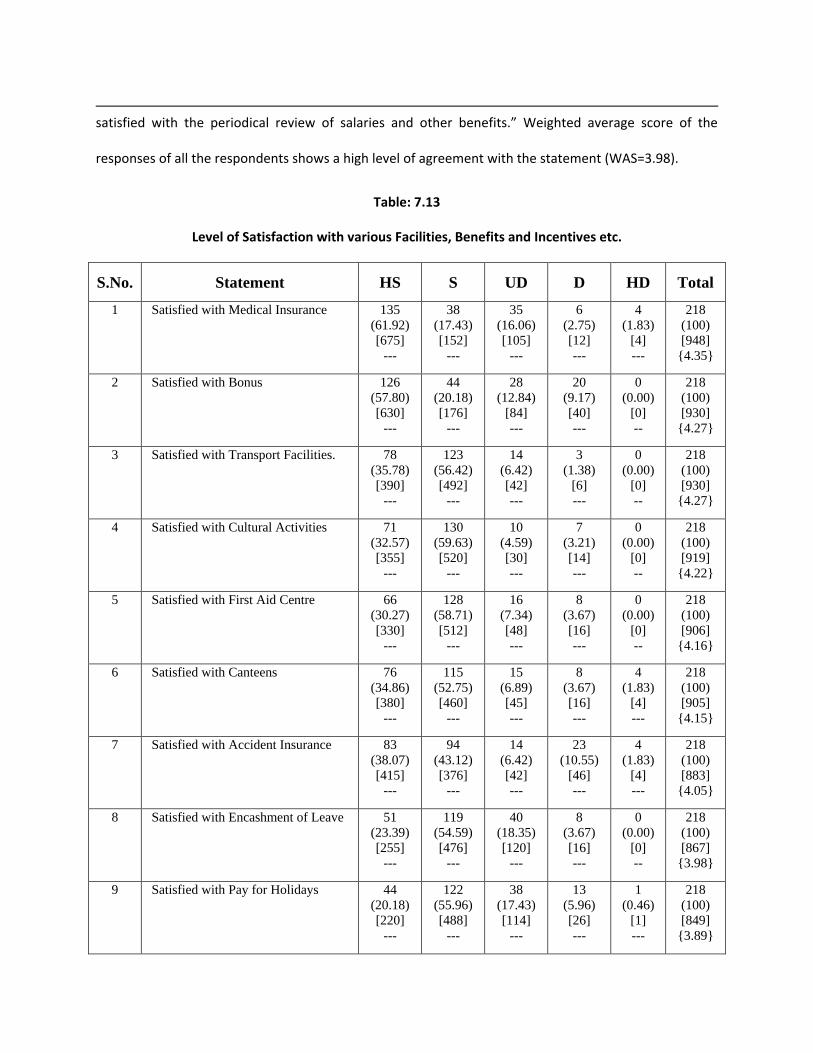
satisfied with the periodical review of salaries and other benefits.” Weighted average score of the
responses of all the respondents shows a high level of agreement with the statement (WAS=3.98).
Table: 7.13
Level of Satisfaction with various Facilities, Benefits and Incentives etc.
S.No. Statement HS S UD D HD Total
1 Satisfied with Medical Insurance 135
(61.92)
[675]
---
38
(17.43)
[152]
---
35
(16.06)
[105]
---
6
(2.75)
[12]
---
4
(1.83)
[4]
---
218
(100)
[948]
{4.35}
2 Satisfied with Bonus 126
(57.80)
[630]
---
44
(20.18)
[176]
---
28
(12.84)
[84]
---
20
(9.17)
[40]
---
0
(0.00)
[0]
--
218
(100)
[930]
{4.27}
3 Satisfied with Transport Facilities. 78
(35.78)
[390]
---
123
(56.42)
[492]
---
14
(6.42)
[42]
---
3
(1.38)
[6]
---
0
(0.00)
[0]
--
218
(100)
[930]
{4.27}
4 Satisfied with Cultural Activities 71
(32.57)
[355]
---
130
(59.63)
[520]
---
10
(4.59)
[30]
---
7
(3.21)
[14]
---
0
(0.00)
[0]
--
218
(100)
[919]
{4.22}
5 Satisfied with First Aid Centre 66
(30.27)
[330]
---
128
(58.71)
[512]
---
16
(7.34)
[48]
---
8
(3.67)
[16]
---
0
(0.00)
[0]
--
218
(100)
[906]
{4.16}
6 Satisfied with Canteens 76
(34.86)
[380]
---
115
(52.75)
[460]
---
15
(6.89)
[45]
---
8
(3.67)
[16]
---
4
(1.83)
[4]
---
218
(100)
[905]
{4.15}
7 Satisfied with Accident Insurance 83
(38.07)
[415]
---
94
(43.12)
[376]
---
14
(6.42)
[42]
---
23
(10.55)
[46]
---
4
(1.83)
[4]
---
218
(100)
[883]
{4.05}
8 Satisfied with Encashment of Leave 51
(23.39)
[255]
---
119
(54.59)
[476]
---
40
(18.35)
[120]
---
8
(3.67)
[16]
---
0
(0.00)
[0]
--
218
(100)
[867]
{3.98}
9 Satisfied with Pay for Holidays 44
(20.18)
[220]
---
122
(55.96)
[488]
---
38
(17.43)
[114]
---
13
(5.96)
[26]
---
1
(0.46)
[1]
---
218
(100)
[849]
{3.89}

10 Satisfied with Life Insurance 53
(24.31)
[265]
---
116
(53.21)
[464]
---
26
(11.93)
[78]
---
19
(8.71)
[38]
---
4
(1.83)
[4]
---
218
(100)
[849]
{3.89}
11 Satisfied with Pay for Sick Leaves 76
(34.86)
[380]
---
60
(27.52)
[240]
---
57
(26.15)
[171]
---
23
(10.55)
[46]
---
2
(0.92)
[2]
---
218
(100)
[839]
{3.85}
12 Satisfied with Tuition Fee Refunds
for Educational Courses
57
(26.15)
[285]
---
74
(33.94)
[296]
---
64
(29.36)
[192]
---
19
(8.71)
[38]
---
4
(1.83)
[4]
---
218
(100)
[815]
{3.74}
13 Satisfied with Lunch Allowance 68
(31.19)
[340]
---
71
(32.57)
[284]
---
37
(16.97)
[111]
---
38
(17.43)
[76]
---
4
(1.83)
[4]
---
218
(100)
[815]
{3.74}
14 Satisfied with Vacations with Pay 30
(13.76)
[150]
---
100
(45.87)
[400]
---
78
(35.78)
[234]
---
10
(4.59)
[20]
---
0
(0.00)
[0]
--
218
(100)
[804]
{3.69}
15 Satisfied with Leave Travel
Concessions
37
(16.97)
[185]
---
88
(40.37)
[352]
---
68
(31.19)
[204]
---
20
(9.17)
[40]
---
5
(2.29)
[5]
---
218
(100)
[786]
{3.61}
16 Satisfied with Pay for Rest Periods 36
(16.51)
180
---
88
(40.37)
352
---
55
(25.23)
165
---
39
(17.89)
78
---
0
(0.00)
[0]
--
218
(100)
[775]
{3.56}
17 Satisfied with Counseling 51
(23.39)
[255]
---
59
(27.06)
[236]
---
63
(28.89)
[189]
---
41
(18.81)
[82]
---
4
(1.83)
[4]
---
218
(100)
[766]
{3.51}
18 Satisfied with Stock Options 41
(18.81)
[205]
---
57
(26.15)
[228]
---
92
(42.20)
[276]
---
27
(12.39)
[54]
---
1
(0.46)
[1]
---
218
(100)
[764]
{3.50}
19 Satisfied with Conveyance
Allowance
31
(14.22)
[155]
---
92
(42.20)
[368]
---
51
(23.39)
[153]
---
44
(20.18)
[88]
---
0
(0.00)
[0]
--
218
(100)
[764]
{3.50}
20 Satisfied with Night Shift Allowance 49
(22.48)
[245]
---
47
(21.56)
[188]
---
81
(37.16)
[243]
---
41
(18.81)
[82]
---
0
(0.00)
[0]
--
218
(100)
[758]
{3.48}

21 Satisfied with Maternity Benefits 23
(10.55)
[115]
---
15
(6.89)
[60]
---
178
(81.65)
[534]
---
2
(0.92)
[4]
---
0
(0.00)
[0]
--
218
(100)
[713]
{3.27}
22 Satisfied with Pension Plan 38
(17.43)
[190]
---
67
(30.73)
[268]
---
24
(11.01)
[72]
---
85
(38.99)
[170]
---
4
(1.83)
[4]
---
218
(100)
[704]
{3.23}
23 Satisfied with Study Permission 34
(15.59)
[170]
---
47
(21.56)
[188]
---
53
(24.31)
[159]
---
83
(38.07)
[166]
---
1
(0.46)
[1]
---
218
(100)
[684]
{3.14}
24 Satisfied with Baby Crèche 1
(0.46)
[5]
---
8
(3.67)
[32]
---
196
(89.91)
[588]
---
12
(5.50)
[24]
---
1
(0.46)
[1]
---
218
(100)
[650]
{2.98}
25 Satisfied with Discounts on Purchase 29
(13.30)
[145]
---
29
(13.30)
[116]
---
67
(30.73)
[201]
---
89
(40.82)
[178]
---
4
(1.83)
[4]
---
218
(100)
[644]
{2.95}
Source: Field Survey
Note: 1. FS stands for Fully Satisfied; S stands for Satisfied; UD stands for Undecided; D stands for
Dissatisfied; HD stands for Highly Dissatisfied
2. Figures in the parentheses are the percentages on row totals.
3. Figures in the square brackets are the weighted scores.
4. Figures in the flower brackets are the weighted average scores.
Table 7.15 show the level of satisfaction with various facilities, benefits and Incentives etc. in
descending order.
Respondents are very highly satisfied with medical insurance (WAS=4.35), bonus (WAS=4.27),
transport facilities (WAS=4.27), cultural activities (WAS=4.22), first aid centre (WAS=4.16), canteens
(WAS=4.15), and accident insurance (WAS=4.05).
Respondents are highly satisfied with encashment of leave (WAS=3.98), pay for holidays
(WAS=3.89), life insurance (WAS=3.89), pay for sick leaves (WAS=3.85), tuition fee refunds for
educational courses (WAS=3.74), lunch allowance (WAS=3.74), vacations with pay (WAS=3.69), leave

travel concessions (WAS=3.61), pay for rest periods (WAS=3.56), counseling (WAS=3.51), stock options
(WAS=3.50), conveyance allowance (WAS=3.50), night shift allowance (WAS=3.48), maternity benefits
(WAS=3.74), pension plan (WAS=3.23), and study permission (WAS=3.14).
Respondents are less satisfied with baby crèche (WAS=2.98), and discounts on purchase
(WAS=2.95).
7.08 Conclusions
The agreement level of the respondents with the following statements is very high.
a) My salary is sufficient to meet the needs of my family (WAS=4.40),
b) I am satisfied with allowances provided by the company (WAS=4.12),
c) There is an improvement factor in my salary whenever it is revised (4.10),
d) I am satisfied with the welfare measures provided by the company (WAS=4.02)
The agreement level of the respondents with the following statements is high.
a) My job provides sufficient incentives, leave facilities and benefits (WAS=3.99)
b) I am satisfied with the periodical review of salaries and other benefits (WAS=3.98)
c) On the whole satisfied with the reward functions in the company (WAS=3.84)
d) My salary level is comparable with the salary levels of the similar jobs (WAS=3.72)
e) My job gives economic security by way of regular employment and regular income (WAS=3.64)
f) My salary is in commensurate with the efforts i put in on my job (WAS=3.55)
g) I am satisfied with the increments provided by the company (WAS=3.40)
h) My dearness allowance (D.A.) neutralizes the increase in cost of living (WAS=3.18)
From this it can concluded that respondents are either satisfied or very much satisfied with various
practices relating to reward management in the company. Hence it can be said that the existing HR
practices relating to reward management are either good or acceptable to the management so they can
be continued.
References
1. Michael Armstrong, Helen Murlis, Reward management, Remuneration Strategy and Practice,
Crest publishing house, New Delhi, Volume 9.
2. G.Kalaiselvi, “Performance Evaluation and Reward Systems”, HRD Times, April 2008.
3. http://www.expresscomputeronline.com/2006220/technologylife01.shtml