Embed Size (px)
Citation preview
Table of Contents
Summary………………………………………………………………………………….…2
Objective……………………………………………………………………………….…….2
Data, Observations and Results……………………………………………………………2
Discussions…………………………………………………………………………………..4
Conclusion……………….………………………………………………………………….6
References………………………………………………………………..…………………6
Appendices
1
Summary
The name of the equipment used for this experiment is TecQuipment Reynolds Number and
Transitional Flow Apparatus, H215/215A TecQuiment Hydraulic Bench, H1. This equipment
is used to see the pattern of the water flow rate. This equipment can help us to find pattern of
flow rate and also can help us to calculate the flow rate of the water. It is important to study
how to use the Reynolds number to calculate the flow pattern and also the Reynolds numbers
can be used to calculate other properties such as density, velocity, diameter and viscosity. We
must understand that Reynolds number is a ratio of inertia to viscous effect of a flow. The
experiment was conducted in UNITEN lab with my lab mates and was supervised by my lab
instructor Mr. Ibrahim. The procedure and rules which has been taught by Mr. Ibrahim were
strictly followed. We handle the equipment with care to avoid any damage. Before opening
the pipe flow we checked all the safety precaution and the experiment is done one by one by
my group members and me.
Objective
To investigate the relationship of flow condition and fluid velocity.
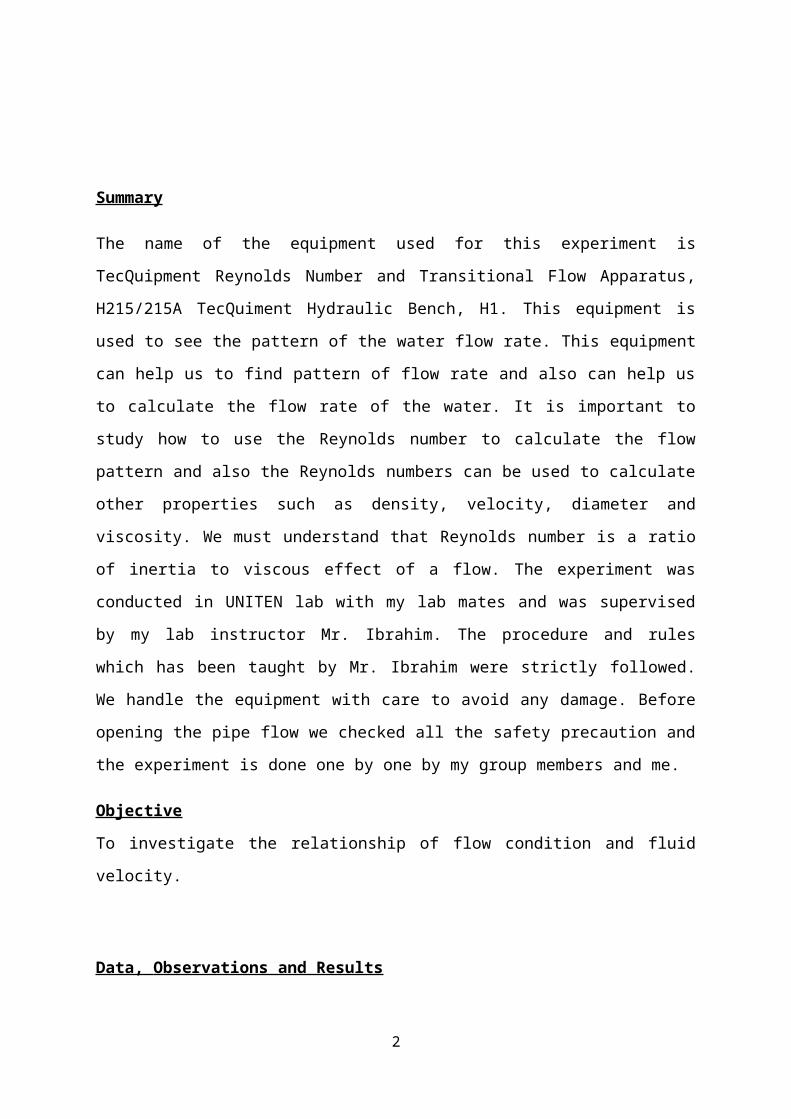
Data, Observations and Results
Table 1
Sample calculation
Flow rate, Q =volume (mᵌ)time(s)
= 0.001259
=0.00000385 mᵌ/s
2
The area is A=π d ²4
= 3.14159×(0.012) ²
4
=1.13×10^ (-4) m²
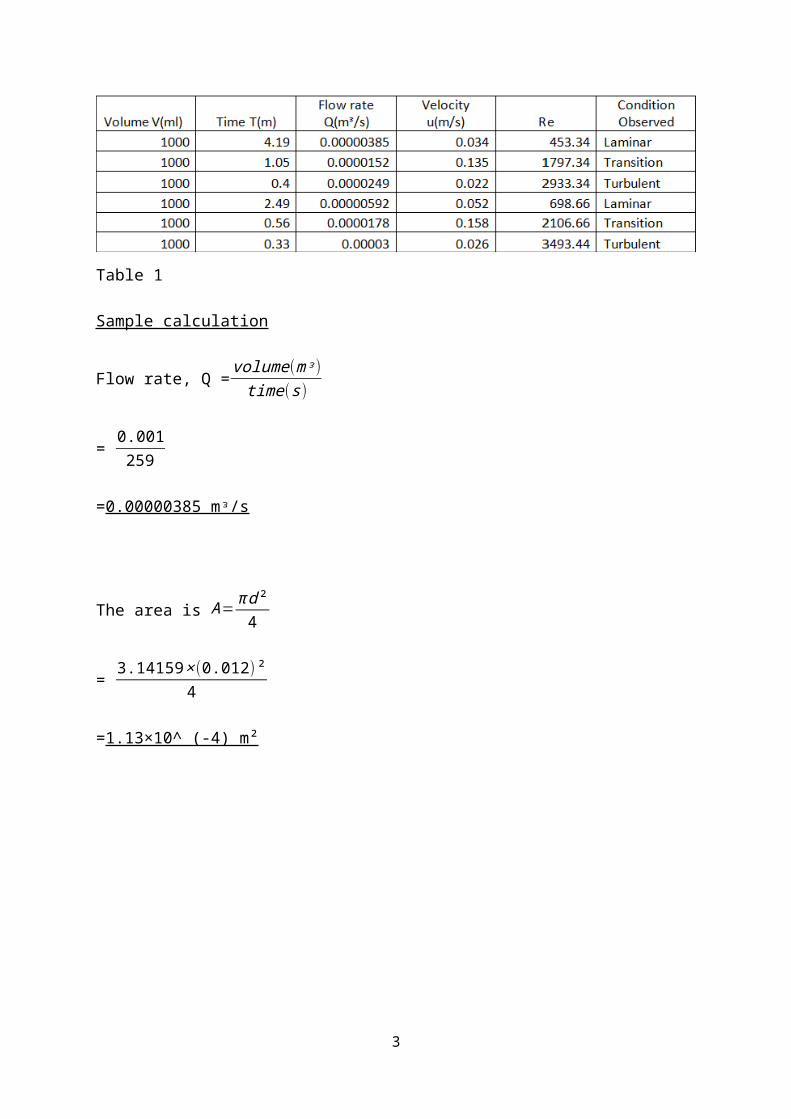
(B) Graph 1: kinematics viscosity graph
With the above graph the kinematics viscosity is = 0.9×10^ (-6) m²/s
The equation use to find Re number is from equation 5 which is:
ℜ=udV
…………. (5)
=0.135(0.012)0.9×10(−6)
=1797.34(transition flow)
3
0 500 1000 1500 2000 2500 3000 3500 40000
0.000005
0.00001
0.000015
0.00002
0.000025
0.00003
Flow rate versus Reynolds Number
first readingsecond reading
Re
flow
rate
,Q
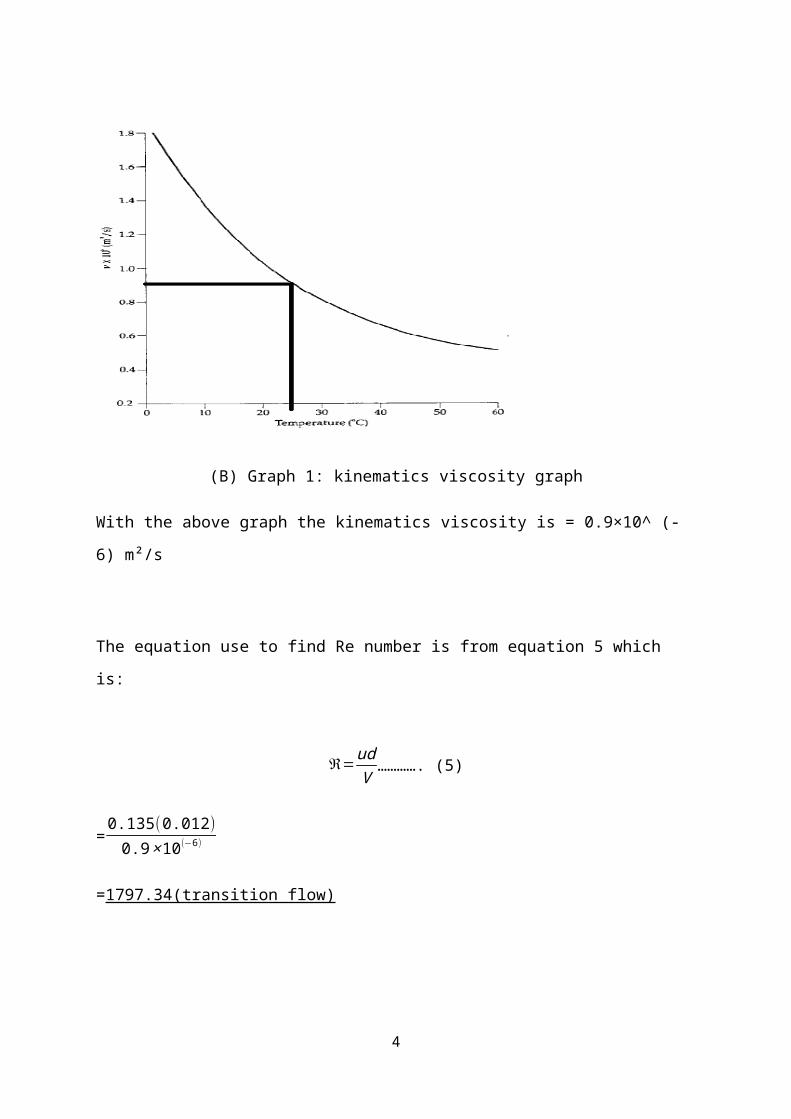
(B) Graph 2: flow rate versus Re
Discussion
4
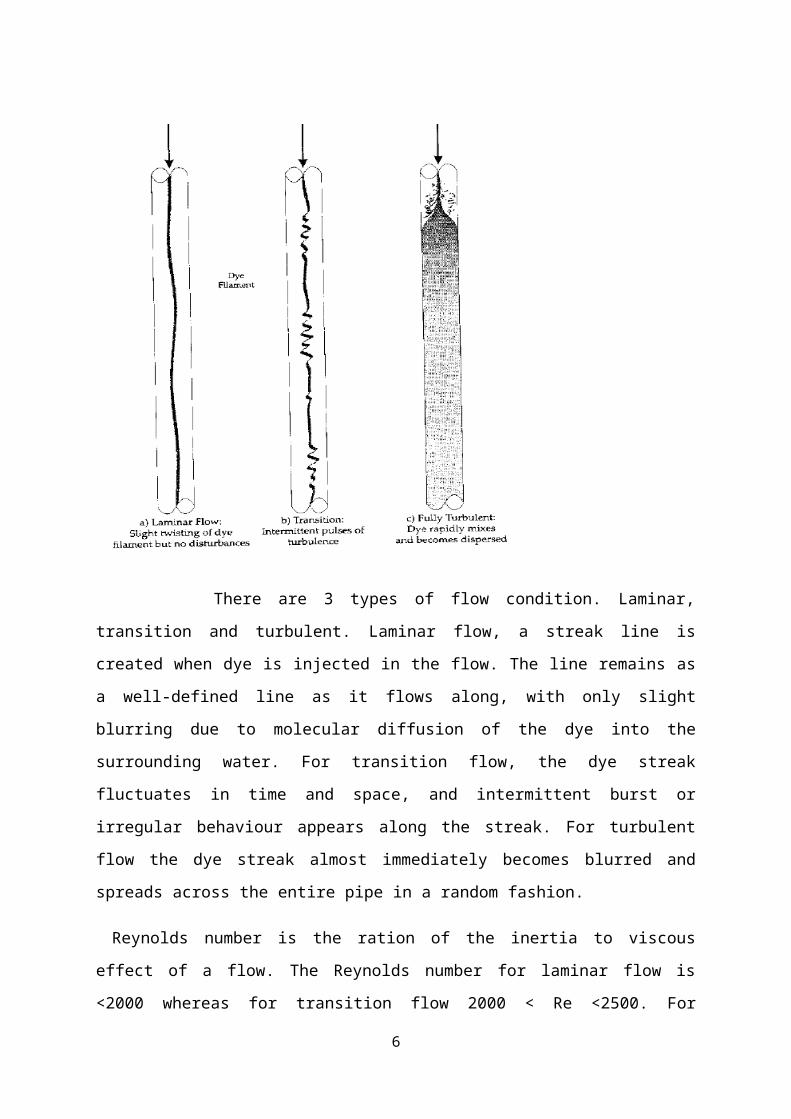
There are 3 types of flow condition. Laminar, transition and turbulent. Laminar flow, a
streak line is created when dye is injected in the flow. The line remains as a well-defined line
as it flows along, with only slight blurring due to molecular diffusion of the dye into the
surrounding water. For transition flow, the dye streak fluctuates in time and space, and
intermittent burst or irregular behaviour appears along the streak. For turbulent flow the dye
streak almost immediately becomes blurred and spreads across the entire pipe in a random
fashion.
Reynolds number is the ration of the inertia to viscous effect of a flow. The Reynolds
number for laminar flow is <2000 whereas for transition flow 2000 < Re <2500. For
turbulent flow is Reynolds number is > 2500. Based on our result that we got conducting the
experiment, we did the experiment two times to get accurate result. For the first time, the
laminar Re number that we got was 453.34, transition Re was 1797.34 and turbulent flow was
2933.34, Laminar and turbulent flow have achieve the theoretical value ,but our transition
didn’t achieve the theoretical value due to some parallax errors . Net we conduct again our
experiment and we got three different reading. First laminar Re was 698.66, transition Re was
2106.66 and turbulent Re was 3493.44. The second reading was perfect and all three reading
achieve the theoretical value.
In the graph it shows that the second reading is higher than the first reading. For laminar flow
the first reading we got was 453.34 but for the same laminar reading we got 698.66 for the
second reading. Transition value for first reading according to graph 1 is 1797.34 whereas for
second reading is 2106.66. For turbulent flow the first reading from graph is 2933.34,
whereas for second reading is 3493.44.
The experiment should be set up perfectly to get accurate data. The flow must be constant
and should not be high for the first time. The water flow in must be equal with the flow going
out through discharge pipe. Time is an important factor because it is used to calculate flow
rate of water. The time should be measured accurately because minor error in time will affect
the flow rate calculation. The most important precautions are our observation must be correct
when looking at the dye. We have to identify the flow correctly to avoid major error on
classifying the flow pattern.
5
Conclusion
In this experiment the main objectives was to investigate the relationship of flow condition
and fluids velocity. If the velocity increases the flow the Reynolds number increases. If we
look at the equation Reynolds number is ℜ= ρudμ
which says that the Re is directly
proportion with the density, velocity and diameter of the pipe. If the viscosity of the fluids
increases than Reynolds number will decrease. So in this experiment we tested upon the flow
pattern and velocity. We found that when the flow is low the dye show us a straight line
which we conclude it as a laminar flow. Whereas when the flow is fasten the dye
immediately goes away from view which we conclude it to be turbulent flow. What we learn
from this is that there is another flow called transition flow which is in between laminar and
turbulent flow. The flow is in medium speed and we can see the changes of the dye, it was I
straight line but the line was not long like laminar flow it started to blur. In conclusion we
know that when the velocity increase the flow is called turbulent and when the velocity is
decrease the condition of the water becomes laminar flow. If the flow is in medium speed the
flow is known to be transition flow.
References
MUHAMAD IBRAHIM BIN MAHMOD 2012, MEHB221 THERMOFLUIDS LAB
MANUAL
BRUCE R.MUNSON 2010, FUNDAMENTAL OF FLUIDS MECHANICS. 6th Ed. John
Wiley & Sons
Appendices
6