Embed Size (px)
Citation preview

AIAA Aviation 2014-2151 16-20 June 2014, Atlanta, GA 32nd AIAA Applied Aerodynamics Conference
Copyright © 2014 by the authors. Published by the American Institute of Aeronautics and Astronautics, Inc., with permission.
Reynolds Number Effects on the Performance of
Small-Scale Propellers
Robert W. Deters,∗ Gavin K. Ananda,† and Michael S. Selig‡
Department of Aerospace Engineering, University of Illinois at Urbana-Champaign, Urbana, IL 61801, USA
The growing use of small UAVs and MAVs has increased the interest in determining theperformance of small-scale propellers that power them. These small-scale propellers oper-ate at much lower Reynolds numbers than propellers for larger aircraft; typical Reynoldsnumbers for small-scale propellers are less than 100,000 based on the velocity and chordat the 75% span station. The low Reynolds numbers of the propellers make predictingthe performance of these propellers difficult as the performance of the propellers generallychange with Reynolds numbers. In order to understand the Reynolds number effects onsmall-scale propellers, the performance data of twenty-seven off-the-shelf propellers andfour 3D-printed propellers were measured in both static and advancing-flow conditions.The diameters of these propellers ranged from 2.25 in to 9 in. From these tests, the per-formance of the propellers was shown to improve as the Reynolds number increased. Thisimprovement was seen as either an increase in the thrust coefficient, a decrease in thepower coefficient, or both. For propellers in an advancing flow, performance improvementwas also seen as an increase in the propeller efficiency. Results from some of the propellerstested showed an efficiency improvement of around 10%. Nevertheless, the maximum effi-ciency achieved by the small-scale propellers is still low when compared to typical valuesof larger propellers.
I. Introduction
The number of small Unmanned Air Vehicles (UAVs) being designed and built is growing. Besides beinga popular hobby in the form of remote-controlled (RC) aircraft, small UAVs are finding military and civilianapplications. Many of these UAVs are fixed-wing aircraft and rotorcraft designed to carry small payloads andare mainly used for surveillance and reconnaissance. A subset of the small UAVs is the Micro Air Vehicles(MAVs), which have a maximum size of 6 in (15 cm). The small size of these aircraft leads to interestingand difficult aerodynamic concerns such as low Reynolds number effects.
Propellers provide the thrust for many of these small UAVs, and the small size of these propellers hasthem operating with Reynolds numbers typically less than 100,000. Airfoil testing at Reynolds numbers of40,000 to 500,000 has shown that the lift decreases and the drag increases as the Reynolds number decreaseswith more pronounced effects at 100,000 and lower.1–7 Since propeller thrust is largely dependent on the liftand power is largely dependent on the drag, the efficiency of a propeller is highly influenced by the Reynoldsnumber.
The low Reynolds number effects can make predicting the performance of small-scale propellers diffi-cult,8–11 therefore a number of wind tunnel tests have been performed on small off-the-shelf propellers. Mostof the current wind tunnel tests have been for propellers with a diameter of 6 in and larger,10,12–17 with a fewtests for propellers with a diameter of 5 in and smaller.18–20 The main outcome from these propeller testsis that the Reynolds number of the propeller plays a significant part in determining its performance. Thegeneral trends are that as Reynolds number increases, the thrust increases, the power decreases, or both.
∗Graduate Student, AIAA Student Member.†Graduate Student, AIAA Student Member.‡Associate Professor, AIAA Associate Fellow.
1 of 43
American Institute of Aeronautics and Astronautics

To help determine the effect of changing Reynolds numbers on the propeller performance, a testing rigwas designed to measure the thrust and torque of propellers with diameters ranging from 2.25 in to 9 in.In total, the performance data of twenty-seven off-the-shelf propellers were measured in both static andadvancing-flow conditions. Besides the off-the-shelf propellers, four propeller blades were designed and builtusing a 3D printer. A 5- and 9-in diameter version of each new propeller was built so that a large rangeof Reynolds numbers could be tested in both static and advancing-flow conditions. The 5-in propellerstypically have a Reynolds number based on the chord at the 75% span location of less than 50,000, andthe 9-in propellers have Reynolds numbers typically less than 100,000. The 5-in and 9-in propellers have anoverlap Reynolds number region usually starting around a Reynolds number between 20,000 and 30,000.
II. Experimental Methodology
A. Equipment
Propeller tests were conducted in the UIUC low-turbulence subsonic wind tunnel. The wind tunnel is anopen-return type with a 7.5:1 contraction ratio. The rectangular test section is 2.8×4.0 ft (0.853×1.22 m) incross section and is 8 ft (2.44-m) in length. To account for the boundary-layer growth at the side wall, thewidth of the test section increases by approximately 0.5 in (1.27 cm) over the length of the test section. Inorder to have low turbulence levels at the test section, a 4-in (10.2-cm) honeycomb and four anti-turbulencescreens are in the settling chamber. The resulting turbulence intensity for an empty tunnel has been measuredto be less than 0.1% at all operating conditions.21 A 125-hp (93.2-kW) AC motor driving a five-bladed fan isused to control the test-section speed up to 235 ft/s (71.6 m/s). The maximum test-section speed for thesetests was 80 ft/s (24.4 m/s). Test-section speeds were measured using a MKS differential pressure transducerconnected to static ports at the settling chamber and at the beginning of the test section. For test-sectionspeeds below 40 ft/s, a MKS 220 1-torr transducer was used, and for speeds greater than 40 ft/s, a MKS 22110-torr transducer was used. Ambient pressure was measured using a Setra Model 270 pressure transducer,and ambient temperature was measured using an Omega GTMQSS thermocouple.
Propeller performance was measured using the thrust and torque balance shown in Fig. 1. Thrust wasmeasured outside of the tunnel test section using a T-shaped pendulum balance that pivoted about twoflexural pivots and was constrained on one side by a load cell.12 The Interface SMT S-Type load cell witha load capacity of 2.2 lb (9.8 N) was used for propellers with a diameter of 5.5 in (14.0 cm) and smaller,and the Interface SM S-Type load cell with a load capacity of 10 lb (44 N) was used for larger propellers.The balance was designed to allow the load cell to be placed in 10 different locations in order to use the fullrange of the load cell based on the thrust produced. The load cell locations ranged from 3.25 in (8.26 cm)from the pivot point to 7.75 in (19.69 cm) in 0.5-in (1.27-cm) increments. A preload weight was added tothe balance on the opposite side to the load cell. This preload weight kept the load cell in tension during allaspects of testing to make sure the load cell would not slip during negative thrust conditions.
The torque from the propeller was measured using a reaction torque sensor (RTS) from TransducerTechniques. Propellers with a diameter of 5.5 in and smaller used a transducer with a capacity of 5 oz-in(0.0353 N-m) while 9-in propeller used a 25 oz-in (0.177 N-m) transducer. The torque cell was placed betweenthe motor sting and the support arm of the thrust balance. To remove the torque cell, motor sting, balancesupport arm, and any wires from the propeller slipstream and test section velocity, a fairing surroundedthe setup as shown in Fig. 2. The fairing spanned the test section from the floor to the ceiling in order tokeep the test section flow symmetric. The NACA 0025 airfoil with a 24-in chord was used for the fairing toprovide the necessary width required for torque sensor, motor sting, and all wires. The motor sting was longenough for all the propellers to be more than 1.5 diameters from the fairing in order to minimize the effectof the fairing on the propeller performance.
Propeller RPM was measured by shining a red laser with a wavelength of 630–680 nm through thepropeller disc area to a phototransistor with a rise time of 5 μsec. The output from the phototransistor isamplified so that the maximum voltage when the laser shines on the receiver is over 2 V. As the propellerspins, the propeller blades block the laser beam, and the receiver output voltage drops to around zero. Eachtime the propeller RPM was measured, the voltage was recorded at 40,000 Hz for 30,000 samples. The highrate and sample number is used so that the resulting square wave is captured and the voltage peaks can becounted. The RPM was calculated by dividing the number of peaks by the sample time and by the numberof propeller blades. The phototransistor rise time and the sample rate have been more than sufficient in
2 of 43
American Institute of Aeronautics and Astronautics

2.8 ft(0.85 m)
torquecell
thrustload cell
propeller
motor
Figure 1: Propeller thrust and torque balance. Figure 2: Propeller balance enclosed in fairing.
finding the typical RPM values for the propellers tested. This measurement technique was compared toresults from a handheld digital tachometer, and the results agreed.
A variety of propellers were tested for this research. These propellers include off-the-shelf propellers fromseveral manufacturers and some rapid-prototyped propellers. A discussion of the propellers is included inSection III. During the tests, the propellers with a diameter of less than 9-in were driven by the MedusaMR-012-030-4000 brushless motor using a Castle Creations Phoenix 10 speed controller. Propellers witha diameter of 9 in used an AstroFlight 803P Astro 020 Planetary System with a 4.4:1 gear ratio using aCastle Creations Phoenix 25 speed controller. To simplify the laboratory setup, a power supply by BKPrecision was used to power the motor and speed controller. To set the rotational speed of the motor, thespeed controller was connected to a modified ServoXciter EF from Vexa Control. While designed to testRC servos by adjusting the pulse-width signal to the servo, the ServoXciter also works well as the throttlefor the motor. A voltage from the computer would be sent to the ServoXciter, and in turn the ServoXciterwould then send a pulse-width signal to the speed controller to control the motor speed.
B. Testing Procedure
All voltages from the testing equipment were recorded by a National Instruments PCI-6031E 16-bit analog-to-digital data acquisition (DAQ) board connected to a personal computer. The DAQ board is capable ofmeasuring 32 differential analog inputs simultaneously at a maximum sample rate of 100,000 samples/s. Asmentioned earlier, propeller RPM measurements were recorded at 40,000 Hz for 30,000 samples. This highsample rate required the RPM measurement to be taken separately from the rest of the measurements. Allother measurements (thrust, torque, tunnel pressures, atmospheric pressure, and temperature) were takensimultaneously immediately after the RPM measurement at a rate of 3,000 Hz for 3,000 samples. Thismethod has been more than sufficient as differences in motor speed have been observed to change less than1% during these time periods. A LabVIEW R© program was written to read the DAQ board as well as controlthe motor speed and wind tunnel speed.
For static performance tests, the propeller thrust and torque were measured along with the ambientpressure and temperature at different RPM values. For advancing-flow performance tests, the propellerRPM was set and the tunnel speed was increased from 8 ft/s to 40 ft/s by 2 ft/s increments. During thistest, a MKS 1-torr pressure transducer was used to measure the tunnel speed. At each velocity, the propellerthrust and torque were measured along with the tunnel speed and ambient pressure and temperature. If
3 of 43
American Institute of Aeronautics and Astronautics

the torque value became too close to zero, the test was stopped because the propeller was approaching thewindmill brake state. If the propeller reached 40 ft/s before the windmill brake state was achieved, the sameRPM was used for tunnel speeds of 34 ft/s to 80 ft/s by 2 ft/s increments using a MKS 10-torr transducerto measure the tunnel speed. Again the test would stop early if the propeller was close to windmilling. Theoverlap with the 1-torr and 10-torr tests were to ensure consistent data between low and high speed tests.Typically, at least three RPM values were tested to measure any Reynolds number effects.
C. Calibration
Since the DAQ board only records voltages from the transducers and load cells, each voltage is convertedto a physical measurement through calibration curves. The pressure transducer that measured the ambientpressure and the thermocouple that measured ambient temperature used manufacturer supplied calibrationequations to convert the voltages to pressure and temperature. The MKS differential pressure transducersused to measure tunnel pressures also used manufacturer calibration slopes.
The load and torque cells do not use manufacturer supplied calibration values. Instead, the calibrationslopes are found during testing. Thrust calibration used precisely measured weights and a low-friction pulleysystem to create an applied axial load to simulate thrust on the load cell. By increasing and decreasinga known force on the load cell, a linear relationship between the thrust and voltage was determined. Fortorque calibration, the precision weights were used with a moment arm to create a known torque, and byadding and removing weights, a linear relationship between the torque and voltage was calculated. Thesecalibration procedures were performed regularly to ensure consistent results, and any change in the slopeswere typically 1% or less.
D. Data Reduction
As mentioned in Section A, the ambient pressure and temperature were measured using a pressure transducerand thermocouple, respectively. Air density was then calculated from the equation of state
p = ρRT (1)
where R is the universal gas constant. The standard value of 1716 ft2/s2/◦R (287.0 m2/s2/K) for air wasused.
Propeller power is calculated from the measured propeller torque by
P = 2πnQ (2)
Performance of a propeller is typically given in terms of the thrust and power coefficients, defined as
CT =T
ρn2D4(3)
CP =P
ρn3D5(4)
where nD can be considered the reference velocity and D2 can be considered the reference area. When thepropeller is in a freestream flow, the advance ratio is defined in terms of the velocity and the rotation rate.
J =V
nD(5)
By using the advance ratio, the thrust and power coefficients are now only a function of J , the Reynoldsnumber, and the Mach number. The maximum Mach number for a propeller tip in these tests was about 0.26,which is below the incompressible limit. Therefore, compressibility effects were ignored, and the propellerperformance is only a function of J and the Reynolds number. For this paper, the Reynolds number of apropeller was defined by the rotational speed and chord at the 75% blade station. The Reynolds number isdefined as
Re =ρV c
μ(6)
4 of 43
American Institute of Aeronautics and Astronautics
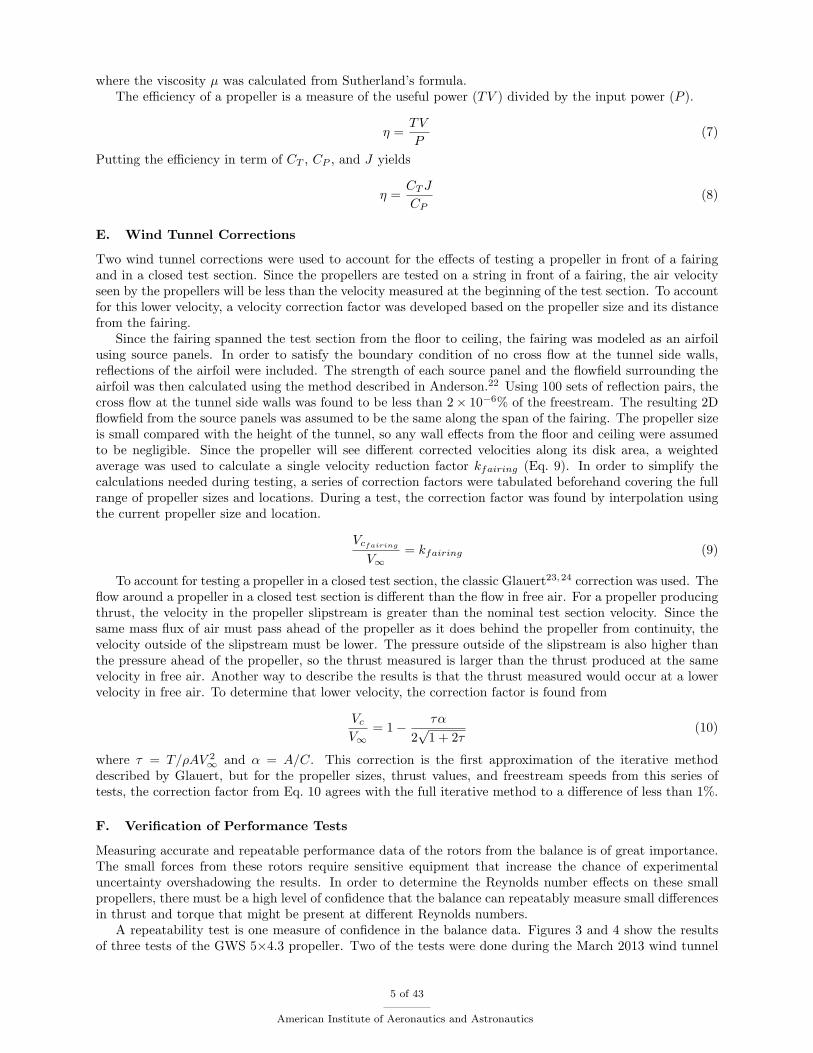
where the viscosity μ was calculated from Sutherland’s formula.The efficiency of a propeller is a measure of the useful power (TV ) divided by the input power (P ).
η =TV
P(7)
Putting the efficiency in term of CT , CP , and J yields
η =CTJ
CP(8)
E. Wind Tunnel Corrections
Two wind tunnel corrections were used to account for the effects of testing a propeller in front of a fairingand in a closed test section. Since the propellers are tested on a string in front of a fairing, the air velocityseen by the propellers will be less than the velocity measured at the beginning of the test section. To accountfor this lower velocity, a velocity correction factor was developed based on the propeller size and its distancefrom the fairing.
Since the fairing spanned the test section from the floor to ceiling, the fairing was modeled as an airfoilusing source panels. In order to satisfy the boundary condition of no cross flow at the tunnel side walls,reflections of the airfoil were included. The strength of each source panel and the flowfield surrounding theairfoil was then calculated using the method described in Anderson.22 Using 100 sets of reflection pairs, thecross flow at the tunnel side walls was found to be less than 2× 10⁻⁶% of the freestream. The resulting 2Dflowfield from the source panels was assumed to be the same along the span of the fairing. The propeller sizeis small compared with the height of the tunnel, so any wall effects from the floor and ceiling were assumedto be negligible. Since the propeller will see different corrected velocities along its disk area, a weightedaverage was used to calculate a single velocity reduction factor kfairing (Eq. 9). In order to simplify thecalculations needed during testing, a series of correction factors were tabulated beforehand covering the fullrange of propeller sizes and locations. During a test, the correction factor was found by interpolation usingthe current propeller size and location.
Vcfairing
V∞= kfairing (9)
To account for testing a propeller in a closed test section, the classic Glauert23,24 correction was used. Theflow around a propeller in a closed test section is different than the flow in free air. For a propeller producingthrust, the velocity in the propeller slipstream is greater than the nominal test section velocity. Since thesame mass flux of air must pass ahead of the propeller as it does behind the propeller from continuity, thevelocity outside of the slipstream must be lower. The pressure outside of the slipstream is also higher thanthe pressure ahead of the propeller, so the thrust measured is larger than the thrust produced at the samevelocity in free air. Another way to describe the results is that the thrust measured would occur at a lowervelocity in free air. To determine that lower velocity, the correction factor is found from
Vc
V∞= 1− τα
2√1 + 2τ
(10)
where τ = T/ρAV 2∞ and α = A/C. This correction is the first approximation of the iterative method
described by Glauert, but for the propeller sizes, thrust values, and freestream speeds from this series oftests, the correction factor from Eq. 10 agrees with the full iterative method to a difference of less than 1%.
F. Verification of Performance Tests
Measuring accurate and repeatable performance data of the rotors from the balance is of great importance.The small forces from these rotors require sensitive equipment that increase the chance of experimentaluncertainty overshadowing the results. In order to determine the Reynolds number effects on these smallpropellers, there must be a high level of confidence that the balance can repeatably measure small differencesin thrust and torque that might be present at different Reynolds numbers.
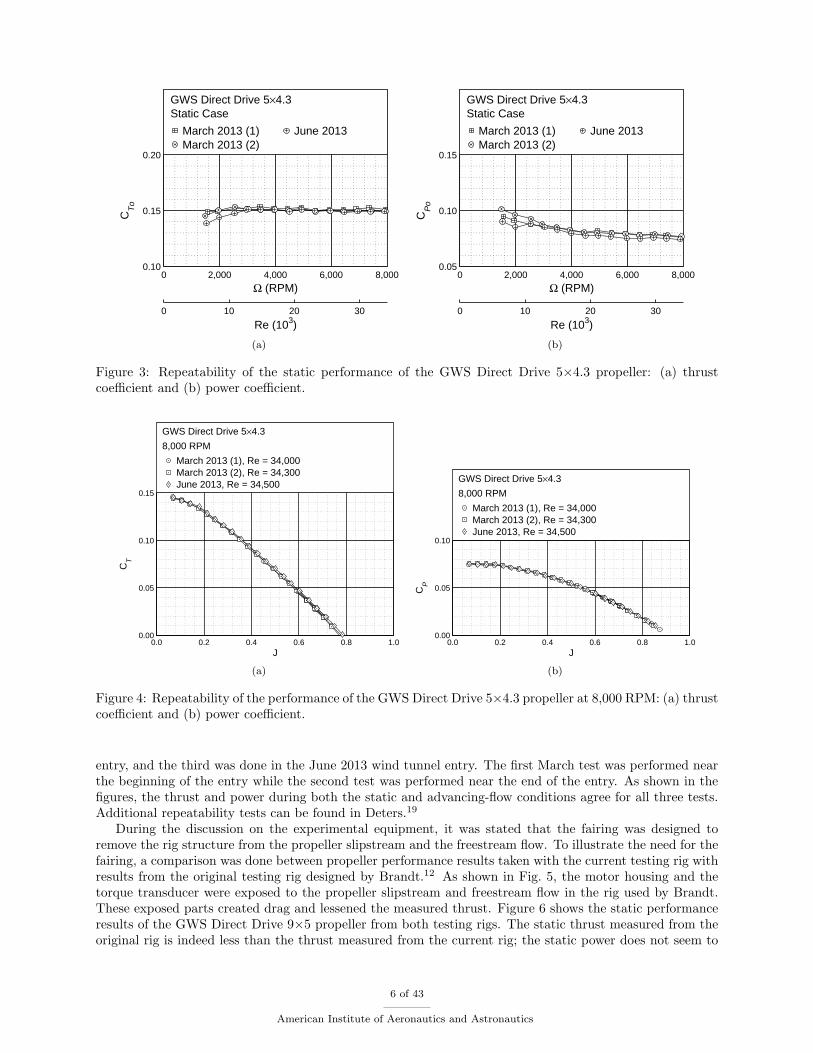
A repeatability test is one measure of confidence in the balance data. Figures 3 and 4 show the resultsof three tests of the GWS 5×4.3 propeller. Two of the tests were done during the March 2013 wind tunnel
5 of 43
American Institute of Aeronautics and Astronautics
0 2,000 4,000 6,000 8,0000.10
0.15
0.20
Ω (RPM)
CT
o
GWS Direct Drive 5×4.3Static Case
March 2013 (1)March 2013 (2)
June 2013
Re (103)0 10 20 30
(a)
0 2,000 4,000 6,000 8,0000.05
0.10
0.15
Ω (RPM)
CP
o
GWS Direct Drive 5×4.3Static Case
March 2013 (1)March 2013 (2)
June 2013
Re (103)0 10 20 30
(b)
Figure 3: Repeatability of the static performance of the GWS Direct Drive 5×4.3 propeller: (a) thrustcoefficient and (b) power coefficient.
0.0 0.2 0.4 0.6 0.8 1.00.00
0.05
0.10
0.15
J
CT
GWS Direct Drive 5×4.3
8,000 RPM
March 2013 (1), Re = 34,000March 2013 (2), Re = 34,300June 2013, Re = 34,500
(a)
0.0 0.2 0.4 0.6 0.8 1.00.00
0.05
0.10
J
CP
GWS Direct Drive 5×4.3
8,000 RPM
March 2013 (1), Re = 34,000March 2013 (2), Re = 34,300June 2013, Re = 34,500
(b)
Figure 4: Repeatability of the performance of the GWS Direct Drive 5×4.3 propeller at 8,000 RPM: (a) thrustcoefficient and (b) power coefficient.
entry, and the third was done in the June 2013 wind tunnel entry. The first March test was performed nearthe beginning of the entry while the second test was performed near the end of the entry. As shown in thefigures, the thrust and power during both the static and advancing-flow conditions agree for all three tests.Additional repeatability tests can be found in Deters.19
During the discussion on the experimental equipment, it was stated that the fairing was designed toremove the rig structure from the propeller slipstream and the freestream flow. To illustrate the need for thefairing, a comparison was done between propeller performance results taken with the current testing rig withresults from the original testing rig designed by Brandt.12 As shown in Fig. 5, the motor housing and thetorque transducer were exposed to the propeller slipstream and freestream flow in the rig used by Brandt.These exposed parts created drag and lessened the measured thrust. Figure 6 shows the static performanceresults of the GWS Direct Drive 9×5 propeller from both testing rigs. The static thrust measured from theoriginal rig is indeed less than the thrust measured from the current rig; the static power does not seem to
6 of 43
American Institute of Aeronautics and Astronautics

Figure 5: Original propeller testing rig designed by Brandt (figure taken from Brandt12).
0 2,000 4,000 6,000 8,0000.15
0.10
0.15
Ω (RPM)
CT
o
GWS Direct Drive 9×5Static Case
Current Original
Re (103)0 25 50 75
(a)
0 2,000 4,000 6,000 8,0000.00
0.05
0.10
Ω (RPM)
CP
o
GWS Direct Drive 9×5Static Case
Current Original
Re (103)0 25 50 75
(b)
Figure 6: Static performance comparison of the GWS Direct Drive 9×5 propeller between the current rigand the original rig: (a) thrust coefficient and (b) power coefficient (original data taken from Brandt12).
be affected. The comparison between the two rigs for the same propeller running at 5,000 RPM are shownin Fig. 7. Thrust is again lower for the original rig, and the power is basically the same. The difference inmeasured thrust greatly changes the calculated maximum efficiency of the propeller, the advance ratio forthe maximum efficiency, and the advance ratio for zero thrust.
Since many of the propellers tested were off-the-shelf, it was deemed interesting to determine how con-sistent the performance of one propeller was to another of the same type. Results from Merchant et al.14
showed that two APC Thin Electric 16×12 propellers agreed well while two Zinger 16×6 varied in theirmeasured thrust. For these tests, three GWS 2.5×0.8 and three GWS 5×4.3 propellers were statically testedand compared. From Fig. 8, the static performance of the GWS 2.5×0.8 propellers are consistent; however, alarge difference is seen in the performance of the GWS 5×4.3 propellers (Fig. 9). The differences in the GWS5×4.3 propellers are significant. To determine the reason for the similarity in the GWS 2.5×0.8 propellersand the large differences in the GWS 5×4.3 propellers, the geometry was measured for each propeller usingPropellerScanner25 (a more detailed discussion on PropellerScanner is included in Section III). From themeasured geometry of the GWS 2.5×0.8 propellers (Fig. 10), the similarity for the static performance resultsis from the expected result that the three propellers have the same geometry. The measured geometry of thethree GWS 5×4.3 propellers (Fig. 11) shows that, while the chord distribution is the same, the difference inthe propellers is with the pitch. While the twist distribution for the three propeller is about the same, the
7 of 43
American Institute of Aeronautics and Astronautics

0.0 0.2 0.4 0.6 0.80.00
0.05
0.10
J
CT
GWS Direct Drive 9×5
5,000 RPM
Current, Re = 49,400Original, Re = 50,000
(a)
0.0 0.2 0.4 0.6 0.80.00
0.05
0.10
J
CP
GWS Direct Drive 9×5
5,000 RPM
Current, Re = 49,400Original, Re = 50,000
(b)
0.0 0.2 0.4 0.6 0.80.0
0.2
0.4
0.6
0.8
J
η
GWS Direct Drive 9×5
5,000 RPM
Current, Re = 49,400Original, Re = 50,000
(c)
Figure 7: Performance comparison of the GWS Direct Drive 9×5 propeller between the current rig and theoriginal rig at 5,000 RPM: (a) thrust coefficient, (b) power coefficient, and (c) efficiency curves (original datataken from Brandt12).
amount of pitch varies. From the geometry measurements, the differences in the performance is explained.Specimen 2 has a larger pitch, so it is expected that it would produce a larger thrust and power at a givenrotation rate. Specimen 3 has a lower pitch, so it would produce a smaller thrust and power. This inconsis-tency between propellers shows that care should be taken when assuming the performance of one propellerbased on the results of another.
Another way to measure the confidence of the balance data is to compare the results to another test.Smedresman et al.20 from the University of Michigan have built a test stand to measure the performance ofsmall propellers. A propeller tested at both the University of Michigan and UIUC is the Union U-80, andFig. 12 shows a comparison between the different tests. As seen in the figure, the performance data agree.With the results from the repeatability tests and the results from the comparison to Michigan, performancedata from the thrust and torque balance are reliable.
8 of 43
American Institute of Aeronautics and Astronautics

0 7,500 15,000 22,500 30,0000.00
0.05
0.10
Ω (RPM)
CT
o
GWS Direct Drive 2.5×0.8Static Case
Specimen 1Specimen 2
Specimen 3
Re (103)0 10 20 30 40 50
(a)
0 7,500 15,000 22,500 30,0000.00
0.05
0.10
Ω (RPM)
CP
o
GWS Direct Drive 2.5×0.8Static Case
Specimen 1Specimen 2
Specimen 3
Re (103)0 10 20 30 40 50
(b)
Figure 8: Static performance of three GWS Direct Drive 2.5×0.8 propellers: (a) thrust coefficient and(b) power coefficient.
0 2,000 4,000 6,000 8,0000.10
0.15
0.20
Ω (RPM)
CT
o
GWS Direct Drive 5×4.3Static Case
Specimen 1Specimen 2
Specimen 3
Re (103)0 10 20 30
(a)
0 2,000 4,000 6,000 8,0000.05
0.10
0.15
Ω (RPM)
CP
o
GWS Direct Drive 5×4.3Static Case
Specimen 1Specimen 2
Specimen 3
Re (103)0 10 20 30
(b)
Figure 9: Static performance of three GWS Direct Drive 5×4.3 propellers: (a) thrust coefficient and (b) powercoefficient.
9 of 43
American Institute of Aeronautics and Astronautics

0.00 0.25 0.50 0.75 1.000.00
0.25
0.50
0.75
r/R
c/R
GWS Direct Drive 2.5×0.8
True Diameter: 2.55 in (6.5 cm)
Specimen 1Specimen 2
Specimen 3
(a)
0.00 0.25 0.50 0.75 1.00 0
15
30
45
r/R
β (d
eg)
GWS Direct Drive 2.5×0.8
True Diameter: 2.55 in (6.5 cm)
Specimen 1Specimen 2
Specimen 3
(b)
Figure 10: Geometry comparison of the three GWS Direct Drive 2.5×0.8 propellers: (a) chord distributionand (b) twist distribution.
0.00 0.25 0.50 0.75 1.000.00
0.25
0.50
0.75
r/R
c/R
GWS Direct Drive 5×4.3
True Diameter: 2.55 in (6.5 cm)
Specimen 1Specimen 2
Specimen 3
(a)
0.00 0.25 0.50 0.75 1.00 0
15
30
45
r/R
β (d
eg)
GWS Direct Drive 5×4.3
True Diameter: 2.55 in (6.5 cm)
Specimen 1Specimen 2
Specimen 3
(b)
Figure 11: Geometry comparison of the three GWS Direct Drive 5×4.3 propellers: (a) chord distributionand (b) twist distribution.
10 of 43
American Institute of Aeronautics and Astronautics

0 5000 10000 15000 200000.0
1.0
2.0
3.0
Ω (RPM)
Thr
ust (
oz)
Union U−80 80 mm × 50 mmStatic Case
UIUC Michigan
(a)
0 5000 10000 15000 200000.0
0.2
0.4
0.6
0.8
Ω (RPM)
Tor
que
(oz−
in)
Union U−80 80 mm × 50 mmStatic Case
UIUC Michigan
(b)
Figure 12: Comparison between UIUC and Michigan static performance data of the Union U-80 propeller:(a) thrust and (b) torque (Michigan data taken from Smedresman et al.20)
III. Propellers Tested
Two types of propellers were tested in this research: off-the-shelf propellers and in-house 3D-printedpropellers. The off-the-shelf propellers are widely available and come in a variety of sizes. Nevertheless, it isdifficult to find propellers that are scaled, i.e. have different diameters but have the same twist distributionand the same chord-to-radius distribution. For this reason, 3D-printed propellers with diameters of 5 and9 in were designed, built, and tested. With these 3D-printed propellers, the geometry could be specified.
A range of diameters were tested for the off-the-shelf propellers. The largest diameter tested was 9 inand the smallest was 2.25 in. In total, the performance of 27 off-the-shelf propellers was measured, and alist of these propellers with their true diameters is given in Table 1. The chord and twist distributions foreach propeller were measured using the PropellerScanner software created by Hepperle.25 The program usesimages of the side and top view of the propeller to calculate the chord and twist distribution. Propeller-Scanner is designed to measure the chord and twist of a 2-blade propeller; geometry results shown in thisreport are the average of both blades. While this method might not be as accurate as physically measuringslices of the propeller, PropellerScanner provides a quick method to compare the geometry of many pro-pellers without the need to slice and destroy the propeller. Uhlig et al.13,26 compared the chord and twistdistributions of a propeller measured using PropellerScanner and from slices of the propeller. It was shownthat the chord distribution agreed well, but the twist distribution from PropellerScanner underestimated thephysically measured twist. The finite thickness of the propeller airfoil accounts for the differences betweenthe results from PropellerScanner and the true propeller chord and twist distributions. Results from thePropellerScanner measurements are available in Deters et al.18,19 and on the UIUC propeller database.27
From the PropellerScanner results, it is clear that manufacturers use a large variety of chord and twistdistributions in their propellers. Even propellers from the same manufacturer that have the same pitch-to-diameter ratio generally will not have the same chord or twist distributions. The geometry of the GWSpropellers shows this variety well. The GWS propellers tested were divided into two categories based ontheir planform shape, and an example of each planform is given in Fig. 13. For the rectangular planformpropellers (Fig. 14), the shape of the chord distribution is basically the same for all four propellers withonly the magnitude of the chord-to-radius values changing; smaller diameter propellers have larger c/R.
11 of 43
American Institute of Aeronautics and Astronautics

Table 1: Summary of off-the-shelf propellers tested
Manufacturer Type Propeller Diameter (in)
4.2×4 4.20Free Flight
9×4 9.00APC
4.2×2 4.20Sport
9×6 9.00
E-Flite – 100 mm×70 mm 5.10
2.5×0.8 2.55
2.5×1 2.55
3×2 3.25
3×3 3.20
4×2.5 4.00GWS Direct Drive
4×4 4.00
4.5×3 4.50
4.5×4 4.50
5×3 5.00
5×4.3 5.00
9×5 9.00
KP Folding 96 mm×70 mm 3.80
3.2×2.2 3.20
2-Blade 4×2.7 3.95
Micro Invent 5×3.5 4.90
4.3×3.5 4.403-Blade
5×4 4.90
57 mm×20 mm 2.25
Plantraco – Tri-Turbofan 2.55
100 mm×80 mm 4.00
Union U-80 80 mm×50 mm 3.15
Vapor – 140 mm×45 mm 5.50
12 of 43
American Institute of Aeronautics and Astronautics

(a) GWS 3×2 with a rectangular planform.
(b) GWS 3×3 with a tapered planform.
Figure 13: Example planforms of the GWS propellers.
0.00 0.25 0.50 0.75 1.000.00
0.25
0.50
0.75
r/R
c/R
GWS Rectangular
2.5×0.82.5×1
3×24×2.5
(a)
0.00 0.25 0.50 0.75 1.00 0
15
30
45
r/R
β (d
eg)
GWS Rectangular
2.5×0.82.5×1
3×24×2.5
(b)
Figure 14: Geometry comparison of the GWS propellers with a rectangular planform: (a) chord distributionand (b) twist distribution.
However, the shape of the twist distribution is not the same for all of the propellers. Even though the 3×2and 4×2.5 propellers have about the same pitch, the twist distribution is clearly not the same for the for theinboard portion of the propellers. The differences seen with the tapered propellers are even more pronounced(Fig. 15). While the shape of the twist distribution is very similar between the two 5-in propellers, it doesnot match with the other diameters. The 3×3 and 4×4 propellers have about the same pitch and twistdistribution, but the c/R is greater for the 3-in propeller. Of all of the off-the-shelf propellers tested, theAPC propellers were the closest in matching chord and twist distributions between propellers of differentdiameters. Figure 16 shows the geometry of the 4.2×2 and 9×4 propellers, which have about the samepitch-to-diameter ratio. The twist distribution of the two propellers is basically the same, and the shape ofthe chord distribution is the same except that the 4.2-in propeller has a larger c/R.
With the large variety in chord and twist distributions found in the off-the-shelf propellers, it is difficultto make comparisons between the propellers. While determining the general Reynolds number effects onthese propellers could still be made, comparisons between propellers of different diameters but having thesame chord and twist distributions could not be done. For this reason, 3D-printed propellers with diametersof 5 and 9 in were designed, built, and tested. With these 3D-printed propellers, the geometry could bespecified. An overview on the design of the 3D-printed propellers follows with a more detailed discussionavailable in Deters.19
Each propeller was built using the MechSE Rapid Prototyping Lab at the University of Illinois at Urbana-Champaign. To reduce the number of parts to manufacture, the propeller blades and hub were built as
13 of 43
American Institute of Aeronautics and Astronautics

0.00 0.25 0.50 0.75 1.000.00
0.25
0.50
0.75
r/R
c/R
GWS Taper
3×34×44.5×34.5×4
5×35×4.39×5
(a)
0.00 0.25 0.50 0.75 1.00 0
15
30
45
r/R
β (d
eg)
GWS Taper
3×34×44.5×34.5×4
5×35×4.39×5
(b)
Figure 15: Geometry comparison of the GWS propellers with a tapered planform: (a) chord distributionand (b) twist distribution.
0.00 0.25 0.50 0.75 1.000.00
0.25
0.50
0.75
r/R
c/R
APC 4 and 9 in
4.2 × 2 9 × 4
(a)
0.00 0.25 0.50 0.75 1.00 0
15
30
45
r/R
β (d
eg)
APC 4 and 9 in
4.2 × 2 9 × 4
(b)
Figure 16: Geometry comparison of the 4.2 and 9-in APC propellers with a similar pitch-to-diameter ratio:(a) chord distribution and (b) twist distribution.
separate parts (Fig. 17). The propeller blades were manufactured using an Objet Eden 350 16-micronlayer 3D printer with VeroBlack used as the material. The hubs were built using a Viper stereolithographyapparatus (SLA). The blades were then attached to the hub and secured in place with screws. This separatepart method allowed the pitch of the propeller to be changed by only requiring a new hub to be built. Fourtypes of hubs were manufactured for the 2-bladed propellers based on the desired pitch of the propeller.Figure 18 shows the four hubs designed to change the pitch. The first hub is designed to test the propellerat its original pitch angle, the second decreases the pitch by 10 deg, the third decreases the pitch by 5 deg,
14 of 43
American Institute of Aeronautics and Astronautics
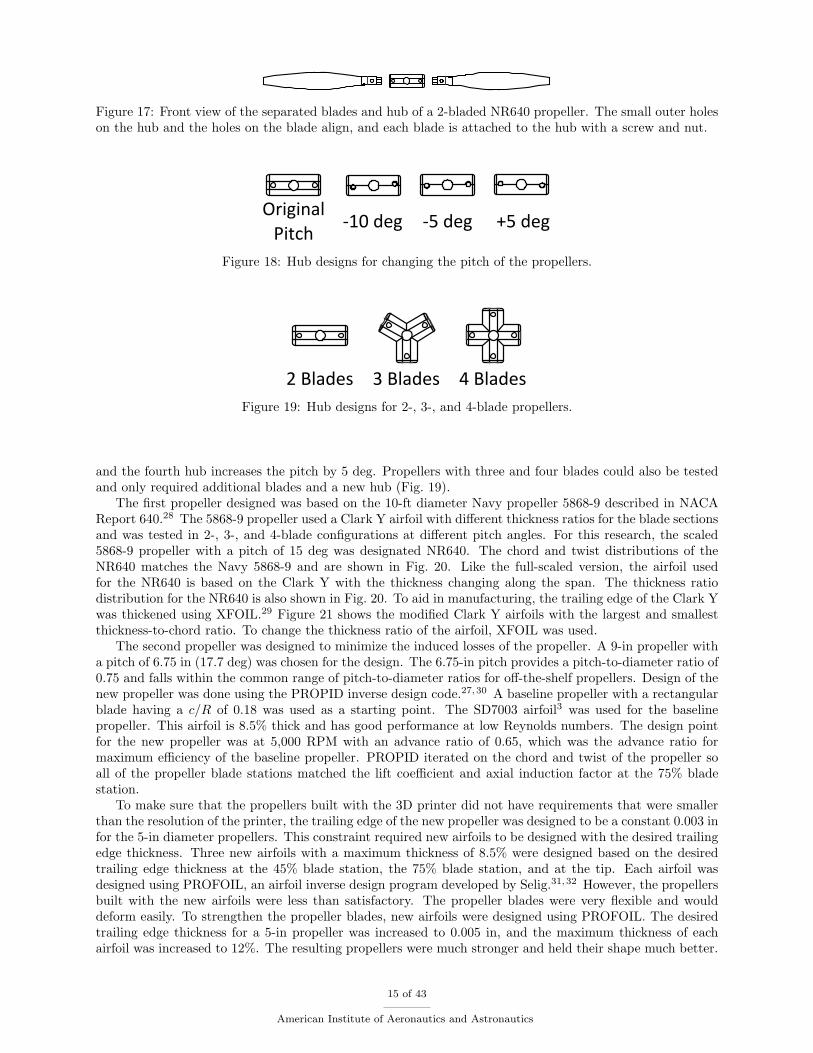
Figure 17: Front view of the separated blades and hub of a 2-bladed NR640 propeller. The small outer holeson the hub and the holes on the blade align, and each blade is attached to the hub with a screw and nut.
OriginalPitch -10 deg -5 deg +5 deg
Figure 18: Hub designs for changing the pitch of the propellers.
2 Blades 3 Blades 4 BladesFigure 19: Hub designs for 2-, 3-, and 4-blade propellers.
and the fourth hub increases the pitch by 5 deg. Propellers with three and four blades could also be testedand only required additional blades and a new hub (Fig. 19).
The first propeller designed was based on the 10-ft diameter Navy propeller 5868-9 described in NACAReport 640.28 The 5868-9 propeller used a Clark Y airfoil with different thickness ratios for the blade sectionsand was tested in 2-, 3-, and 4-blade configurations at different pitch angles. For this research, the scaled5868-9 propeller with a pitch of 15 deg was designated NR640. The chord and twist distributions of theNR640 matches the Navy 5868-9 and are shown in Fig. 20. Like the full-scaled version, the airfoil usedfor the NR640 is based on the Clark Y with the thickness changing along the span. The thickness ratiodistribution for the NR640 is also shown in Fig. 20. To aid in manufacturing, the trailing edge of the Clark Ywas thickened using XFOIL.29 Figure 21 shows the modified Clark Y airfoils with the largest and smallestthickness-to-chord ratio. To change the thickness ratio of the airfoil, XFOIL was used.
The second propeller was designed to minimize the induced losses of the propeller. A 9-in propeller witha pitch of 6.75 in (17.7 deg) was chosen for the design. The 6.75-in pitch provides a pitch-to-diameter ratio of0.75 and falls within the common range of pitch-to-diameter ratios for off-the-shelf propellers. Design of thenew propeller was done using the PROPID inverse design code.27,30 A baseline propeller with a rectangularblade having a c/R of 0.18 was used as a starting point. The SD7003 airfoil3 was used for the baselinepropeller. This airfoil is 8.5% thick and has good performance at low Reynolds numbers. The design pointfor the new propeller was at 5,000 RPM with an advance ratio of 0.65, which was the advance ratio formaximum efficiency of the baseline propeller. PROPID iterated on the chord and twist of the propeller soall of the propeller blade stations matched the lift coefficient and axial induction factor at the 75% bladestation.
To make sure that the propellers built with the 3D printer did not have requirements that were smallerthan the resolution of the printer, the trailing edge of the new propeller was designed to be a constant 0.003 infor the 5-in diameter propellers. This constraint required new airfoils to be designed with the desired trailingedge thickness. Three new airfoils with a maximum thickness of 8.5% were designed based on the desiredtrailing edge thickness at the 45% blade station, the 75% blade station, and at the tip. Each airfoil wasdesigned using PROFOIL, an airfoil inverse design program developed by Selig.31,32 However, the propellersbuilt with the new airfoils were less than satisfactory. The propeller blades were very flexible and woulddeform easily. To strengthen the propeller blades, new airfoils were designed using PROFOIL. The desiredtrailing edge thickness for a 5-in propeller was increased to 0.005 in, and the maximum thickness of eachairfoil was increased to 12%. The resulting propellers were much stronger and held their shape much better.
15 of 43
American Institute of Aeronautics and Astronautics

0.00 0.25 0.50 0.75 1.000.00
0.25
0.50
0.75
r/Rc/
R, t
/c
NR640
chord
thickness
twist
β (deg)
0
15
30
45
Front View
Side View
Figure 20: NR640 geometric characteristics.
Figure 21: Modified Clark Y airfoils near the hub and tip of the NR640 propeller.
The new propeller was named DA4052, and the geometry is provided in Fig. 22. Figures 23, 24, and 25 showthe shape of the three 12% thick airfoils designed using PROFOIL. The coordinates of the three airfoils areprovided in Appendix A.
The last two propellers were simple rectangular blades with a constant pitch of 6.75 in for the 9-inpropellers and 3.75 in for the 5-in propellers. One propeller was designed with a c/R of 0.18 and was namedDA4002. The other had a c/R of 0.23 and was named DA4022. Both propellers used the SDA1075 airfoilfor the full blade. The geometry of the DA4002 is given in Fig. 26, and the geometry of the DA4022 is thesame as the DA4002 with only the c/R at 0.23.
A summary of the 3D-printed propellers tested is given in Table 2. With the different hubs available, allof the 3D-printed propellers were tested with more than two blades or at different pitch angles. As statedearlier, the DA4052, DA4002, and DA4022 were designed with a p/D of 0.75 where that corresponds to6.75 in for the 9-in propellers and 3.75 in for the 5-in propellers. In terms of an angle, the pitch is 17.7 deg.The table provides the pitch for the propellers in inches and in degrees for clarity.
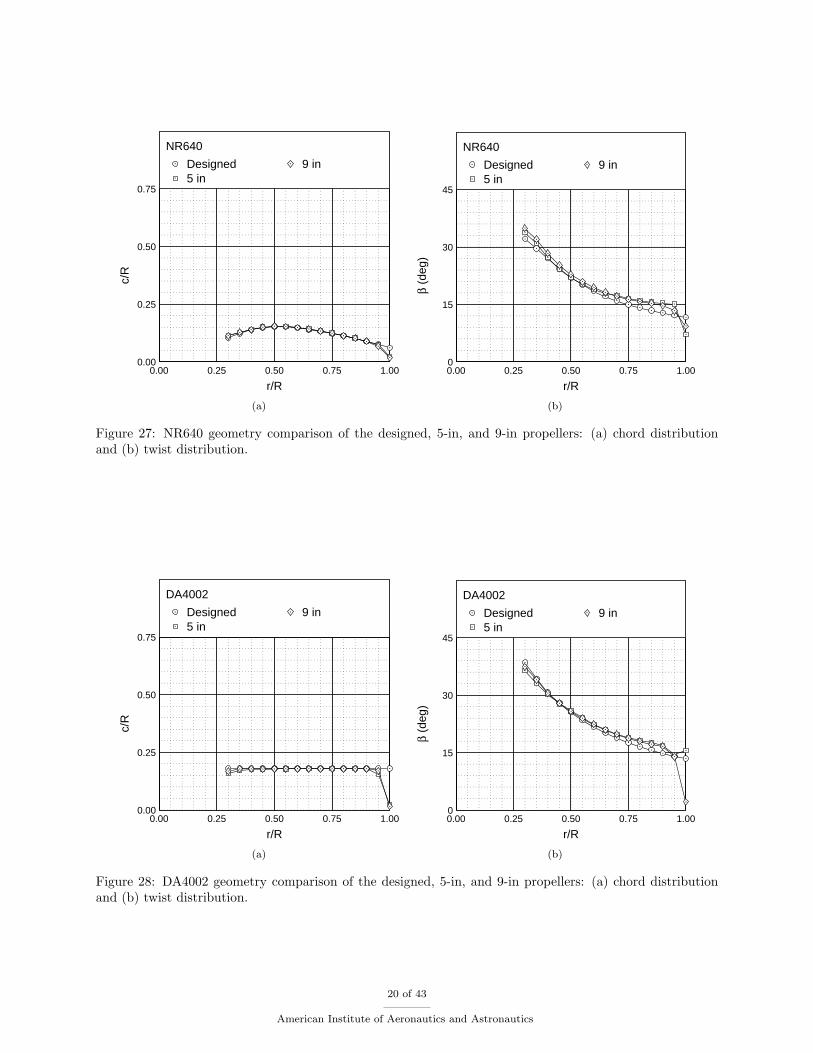
In order to judge the manufacturing accuracy of the 3D-printed propellers, the geometries of the NR640and DA4002 propellers were measured using PropScanner. Both the 5-in and 9-in versions were compared tothe designed geometry, and the results are shown in Fig. 27. While the chord distributions of the 3D-printedpropellers match the designed chord distribution, there is some difference in the twist distribution. For thelast 35% of the blade, the two manufactured propellers are similar to each other except around 90% where
16 of 43
American Institute of Aeronautics and Astronautics

0.00 0.25 0.50 0.75 1.000.00
0.25
0.50
0.75
r/Rc/
R
DA4052
chord twist
β (deg)
0
15
30
45
Front View
Side View
Figure 22: DA4052 geometric characteristics.
Figure 23: Propeller airfoil for the 45% blade station (SDA1045).
the 9-in propeller has a smaller twist angle. Both manufactured propellers have twist angles about 1 to 2 deglarger than the designed twist for the outer 35%. For the inner portion of the blade, the two manufacturedpropellers do not agree in twist. The 9-in propeller has a slightly larger twist angle than the 5-in. Fromabout 40% to 60%, the twist of the 5-in propeller matches the designed twist. With this geometry differencebetween the 5- and 9-in propellers, it is expected that there will be differences in their performance.
The geometry comparison of the DA4002 is shown in Fig. 27. Similar to the NR640, the chord distributionof the manufactured DA4002 propellers match the designed. The twist distributions for the 5- and 9-inmanufactured propellers are in close agreement and are about 1 to 2 deg larger than the designed twist.As mentioned earlier, Uhlig et al.13,26 showed that PropScanner underestimated the twist angle for one ofthe propellers they measured, so the twist values measured for the NR640 and DA4002 could be furtheroff. However, since the twist from the 5- and 9-in versions of both propellers were measured to be veryclose to the designed case, it is likely that the manufacturing process was fairly accurate. The most likelycause between the difference in accuracy seen in the NR640 and DA4002 propellers is airfoil thickness. TheDA4002 propeller has a larger chord than the NR640 along the entire span. This larger chord led to a stifferblade especially near the tips.
17 of 43
American Institute of Aeronautics and Astronautics

Figure 24: Propeller airfoil for the 75% blade station (SDA1075).
Figure 25: Propeller airfoil for the tip (SDA1100).
0.00 0.25 0.50 0.75 1.000.00
0.25
0.50
0.75
r/R
c/R
DA4002
chord twist
β (deg)
0
15
30
45
Front View
Side View
Figure 26: DA4002 geometric characteristics.
18 of 43
American Institute of Aeronautics and Astronautics

Table 2: Summary of 3D-printed propellers tested
Propeller Diameter (in) Pitch (in) Pitch (deg) p/D Number of Blades
2
3.16 15 0.63 35
4
4.29 20 0.86 2NR640
2
5.68 15 0.63 39
4
7.72 20 0.68 2
2
3.75 17.7 0.75 3
45
1.58 7.7 0.32
2.65 12.7 0.53 2
DA4052 4.92 22.7 0.98
26.75 17.7 0.75
3
9 2.85 7.7 0.32
4.76 12.7 0.53 2
8.85 22.7 0.98
1.58 7.7 0.32
2.65 12.7 0.535
3.75 17.7 0.752
4.92 22.7 0.98DA4002
2.85 7.7 0.32
4.76 12.7 0.539
6.75 17.7 0.752
8.95 22.7 0.98
2
5 3.75 17.7 0.75 3
4DA4022
2
9 6.75 17.7 0.75 3
4
19 of 43
American Institute of Aeronautics and Astronautics
0.00 0.25 0.50 0.75 1.000.00
0.25
0.50
0.75
r/R
c/R
NR640
Designed5 in
9 in
(a)
0.00 0.25 0.50 0.75 1.00 0
15
30
45
r/R
β (d
eg)
NR640
Designed5 in
9 in
(b)
Figure 27: NR640 geometry comparison of the designed, 5-in, and 9-in propellers: (a) chord distributionand (b) twist distribution.
0.00 0.25 0.50 0.75 1.000.00
0.25
0.50
0.75
r/R
c/R
DA4002
Designed5 in
9 in
(a)
0.00 0.25 0.50 0.75 1.00 0
15
30
45
r/R
β (d
eg)
DA4002
Designed5 in
9 in
(b)
Figure 28: DA4002 geometry comparison of the designed, 5-in, and 9-in propellers: (a) chord distributionand (b) twist distribution.
20 of 43
American Institute of Aeronautics and Astronautics

dT
dFQ
dD
dL
dFR
ωr
V∞
VR
VE
wwt
wa
α
αiβ
φ
Figure 29: Blade element of a propeller with the corresponding forces and velocities (adapted from Mc-Cormick35).
IV. Expected Propeller Results from Theory
Before the results from the performance and slipstream tests are presented and discussed, this sectionreviews the expected results from propeller theory, specifically the determination of propeller forces fromblade element theory. Results from theory are discussed, but the theory is not derived. Derivations of thesetheories are presented in many sources such as Johnson,33 Leishman,34 and McCormick.35 The namingscheme for the variables in the discussion is similar to that used by McCormick.35
The forces acting on a single blade element of a propeller at a radius r from the propeller center areshown in Fig. 29 (adapted from McCormick35). The incremental thrust and torque can be put in terms ofthe lift and drag by
dT = dL cos (φ+ αi)− dD sin (φ+ αi) (11)
dQ = r [dL sin (φ+ αi) + dD cos (φ+ αi)] (12)
In terms of the lift and drag coefficients, the incremental forces can be integrated to find the propeller thrustand power coefficients as shown in Eqs. 13 and 14.
CT =π
8
∫ 1
xh
(J2 + π2x2
)σ1 cos
2 αi [Cl cos (φ+ αi)− Cd sin (φ+ αi)] dx (13)
CP =π
8
∫ 1
xh
πx(J2 + π2x2
)σ1 cos
2 αi [Cl sin (φ+ αi) + Cd cos (φ+ αi)] dx (14)
The variables x and σ1 are defined by Eqs. 15 and 16, respectively, xh is the hub location where the propellerblade starts, B is the number of blades, R is propeller radius, and c is the chord length.
x =r
R(15)
σ1 =Bc
πR(16)
From the thrust and power coefficient equations (Eqs. 13 and 14), the effect of Reynolds number can bediscussed. Airfoil tests at Reynolds numbers below 500,000 have shown that the lift coefficient decreases and
21 of 43
American Institute of Aeronautics and Astronautics

0.00 0.01 0.02 0.03 0.04 0.05−0.5
0.0
0.5
1.0
1.5
Cd
Cl
Re = 40,000
Re = 60,000
Re = 100,000
SDA1075
XFOIL results
−10 0 10 20−0.5
0.0
0.5
1.0
1.5
2.0
α (deg)
Cl
Figure 30: Drag polar for the SDA1075 airfoil from XFOIL analysis.
the drag coefficient increases as the Reynolds number decreases. The effects on the lift and drag coefficientsare more pronounced at Reynolds numbers below 100,000.1–7 If the lift coefficient decreases, both the thrustand power coefficients will decrease, but typically the decrease in thrust will be more due to the cosine term.If the drag coefficient increases, the thrust coefficient will decrease and the power coefficient will increase.Ideally a designer wants a propeller that will produce a given thrust at the lowest power. A decrease inthrust and an increase in power with decreasing Reynolds number cause a propeller to be less efficient.
To illustrate the effect of Reynolds number on the performance of a propeller, the 9-in DA4002 propellerwith two blades was analyzed in PROPID, a BEMT code developed by Prof. Selig.27,30 As discussed inSection III, the blades of the DA4002 are rectangular and have a c/R ratio of 0.18. The SDA1075 airfoilis used all along the blade except near the hub, and the airfoil aerodynamic characteristics are shown inFig. 30. These aerodynamic characteristics were found using XFOIL and show that, as the Reynolds numberdecreases, the lift coefficient decreases and the drag coefficient increases. The change in the lift and dragwith Reynolds number can be explained by the behavior of the boundary layer. At these Reynolds numbersa laminar separation bubble can form on the airfoil.1,36 Figure 31 from McGranahan36 shows a schematicof a laminar separation bubble. Point ‘S’ is where the laminar flow separates from the airfoil due to anadverse pressure gradient. The flow off of the airfoil surface eventually transitions to turbulent and is shownin the figure as point ‘T.’ If the more energetic flow reattaches to the airfoil, it is at point ‘R’ in the figure.After reattachment, the flow continues downstream as a turbulent boundary layer. The size of the laminarseparation bubble will affect the lift and drag of the airfoil. A larger bubble will decrease the lift and increasethe drag more, and the bubble typically grows as the Reynolds number decreases.
The DA4002 propeller was analyzed at rotational rates of 2,000, 3,000, 4,000, and 5,000 RPM, whichcorrespond to Reynolds numbers based on the rotational velocity and chord at the 75% station of 25,300,37,900, 50,600, and 63,200. Figure 32 shows how the Reynolds number along the propeller blade changeswith different rotational rates. This figure shows the Reynolds number calculated from PROPID at anadvance ratio of 0.60. As the rotational rate increases, the variation in Reynolds number along the spanincreases, and a larger portion of the blade sees the benefits of larger Reynolds numbers.
22 of 43
American Institute of Aeronautics and Astronautics

Figure 31: Laminar separation bubble schematic from McGranahan.36
0.3 0.4 0.5 0.6 0.7 0.8 0.9 1.010,000
20,000
30,000
40,000
50,000
60,000
70,000
80,000
90,000
r/R
Re
2000 RPM3000 RPM
4000 RPM5000 RPM
Figure 32: Reynolds number variation along the propeller blade for the DA4002 9×6.75 at an advance ratioof 0.60.
As shown in Fig. 33, the thrust coefficient increases as the rotational rate, and therefore the Reynoldsnumber, increases. This thrust coefficient increase is seen for all the advance ratios. The Reynolds numbereffect on the power coefficient (Fig. 34) is different in that the power coefficient decreases with increasingReynolds number at lower advance ratios but then increases with increasing Reynolds number at largeradvance ratios. To help explain the Reynolds number effects on CT and CP , the lift and drag coefficientsalong the propeller blade are plotted in Figs. 35a and 35b, respectively, for two rotational rates and twoadvance ratios. For both advance ratios, the increase in Reynolds number (rotation rate) leads to an increasein the lift coefficient and a decrease in the drag coefficient. Both of these changes are beneficial to increasingthe thrust coefficient as shown in Eq. 13. For the power coefficient, a decrease in the drag coefficient isbeneficial while an increase in lift is not (Eq. 14). At J=0.30, the drag coefficient decrease is larger thanat J=0.60, and the lift coefficient increase is smaller at J=0.30 than at J=0.60. These differences at thetwo advance ratios explain the reason why a larger Reynolds number is beneficial to the power coefficientat lower advance ratios but not at the higher advance ratios. The larger decrease in the drag coefficient at
23 of 43
American Institute of Aeronautics and Astronautics

0.0 0.2 0.4 0.6 0.80.00
0.05
0.10
0.15
J
CT
DA4002 9 in
2000 RPM3000 RPM
4000 RPM5000 RPM
Figure 33: DA4002 9×6.75 thrust coefficient fromPROPID.
0.0 0.2 0.4 0.6 0.80.00
0.05
0.10
J
CP
DA4002 9 in
2000 RPM3000 RPM
4000 RPM5000 RPM
Figure 34: DA4002 9×6.75 power coefficient fromPROPID.
0.3 0.4 0.5 0.6 0.7 0.8 0.9 1.00.0
0.2
0.4
0.6
0.8
1.0
r/R
Cl
J=0.3, 2k RPMJ=0.3, 5k RPM
J=0.6, 2k RPMJ=0.6, 5k RPM
(a)
0.3 0.4 0.5 0.6 0.7 0.8 0.9 1.00.00
0.02
0.04
0.06
0.08
0.10
r/R
Cd
J=0.3, 2k RPMJ=0.3, 5k RPM
J=0.6, 2k RPMJ=0.6, 5k RPM
(b)
Figure 35: Lift coefficient (a) and drag coefficient (b) distributions for the DA4002 9×6.75 at two rotationalrates and two advance ratios.
the lower advance ratios is enough to offset the lift coefficient increase, but at the higher advance ratios, thedrag decrease is less and the larger increase in the lift coefficient dominates.
Nevertheless, for all of the advance ratios, the differences in the power coefficient are not as large asdifferences in the thrust coefficient, and the increase in the thrust coefficient is the reason for the increase inthe efficiency shown in Fig. 36. At lower advance ratios, the differences in the efficiency are not as large asthose near the point of maximum efficiency. Beyond the advance ratio for maximum efficiency, the curvesspread out and the higher Reynolds number cases will cross the line of zero efficiency at a larger advanceratio. This delay in zero efficiency is due to the propeller being able to produce more thrust (CT ) at largeradvance ratios as was shown in Fig. 33. The efficiency plot also shows that the maximum efficiency achievedfor this propeller at these Reynolds numbers is around 70%. According to McCormick,35 a well-designpropeller typically has an efficiency around 85%. The difference of 15% in maximum efficiency highlights thelarge performance loss that occurs when operating propellers at Reynolds numbers around 100,000 and less.
Another expected result from blade element theory deals with scaling propellers. From the equations forthe thrust and power coefficients (Eqs. 13 and 14), the size of the propeller should not matter since all of the
24 of 43
American Institute of Aeronautics and Astronautics

0.0 0.2 0.4 0.6 0.80.0
0.2
0.4
0.6
0.8
J
η
DA4002 9 in
2000 RPM3000 RPM
4000 RPM5000 RPM
Figure 36: DA4002 9×6.75 efficiency curves from PROPID.
terms are nondimensional. However, the effect of the propeller size is important to these equations in that itaffects the Reynolds number and the Mach number, which in turn will affect Cl, Cd, and αi. The propellersstudied in this research are small enough that the Mach number will not be a factor, but as shown earlier,the Reynolds number will have an effect. If two propellers of different sizes are tested at the same Reynoldsnumber, then the CT and CP values for both propellers should be the same when the advance ratio is thesame. To have propellers of different sizes have the same Reynolds number requires the smaller propeller tospin at a higher rotational rate. PROPID was used to simulate a 5-in and 9-in DA4002 propeller. The 9-inpropeller had a rotational rate of 2,000 RPM, and the 5-in had a rotational rate of 6,480 RPM. These ratescorrespond to a Reynolds number of 25,300. The results for CT , CP , and η are shown in Fig. 37 and areexactly the same for both propellers. While the coefficients are the same, some of the dimensional valueswill be different. The thrust for both propellers is the same, but the disk loading for the 5-in propeller willbe 3.24 times the 9-in propeller. Also the power for the 5-in propeller will be 1.8 times the power of the 9-inpropeller. The thrust and power values show that to produce the same thrust, the smaller 5-in propeller willrequire more power.
V. Performance Testing Results
Static and advancing-flow performance tests were done on all of the propellers listed in Tables 1 and 2.Results for some of the propellers will be discussed in this section to demonstrate the Reynolds numbereffects. Performance results for all of the propellers can be found in Deters et al.18,19 and on the UIUCpropeller database.27
A. Static Tests
Figure 38 shows the results of the static tests on the four APC propellers. The thrust and power coefficientsare plotted against the Reynolds number in order to compare the four propellers. The magnitude of eachperformance curves follows the pitch-to-diameter ratio of the propeller. The 4.2×4 propeller has the highestratio, so its thrust and power curves have the largest values. Since the 4.2×2 and 9×4 have about the sameratio and, as shown in Fig. 16, about the same twist and chord distributions, it is not surprising that resultsfor the two propellers are nearly the same at the same Reynolds number. The 4.2×2 propeller has larger
25 of 43
American Institute of Aeronautics and Astronautics

0.0 0.2 0.4 0.6 0.80.00
0.05
0.10
J
CT
DA4002, Re=25,300
5 in 9 in
(a)
0.0 0.2 0.4 0.6 0.80.00
0.05
0.10
J
CP
DA4002, Re=25,300
5 in 9 in
(b)
0.0 0.2 0.4 0.6 0.80.0
0.2
0.4
0.6
0.8
J
η
DA4002, Re=25,300
5 in 9 in
(c)
Figure 37: Performance comparison of the 5- and 9-in DA4002 at Re = 28, 7000 from PROPID: (a) thrustcoefficient, (b) power coefficient, and (c) efficiency.
c/R values and that is seen as a slightly larger thrust and power coefficient values. Also seen in Fig. 38 isthe effect of the Reynolds number. While the power coefficient changes very little for most of the propellers,there is a clear increase in the thrust coefficient as the Reynolds number increases. From Eq. 13, the increasein thrust is most likely due to an increase in the lift coefficient along the blade. Since the power coefficientis not increasing, a decrease in drag is probably also occurring (Eq. 14).
A different Reynolds number effect is seen in the static results of the GWS 5×4.3 propeller (Fig. 39).As the Reynolds number increases, the thrust coefficient stays about the same while the power coefficientdecreases. These results show that the drag decrease along the propeller blade is more dominate than anylift increase.
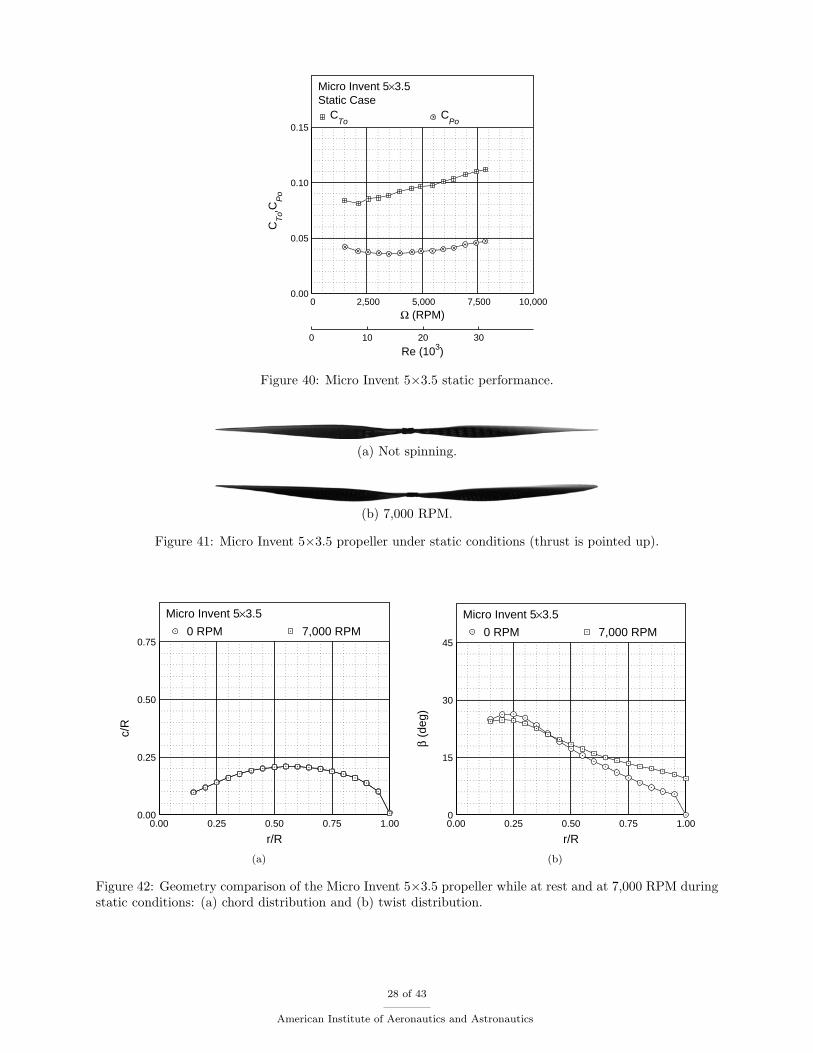
The static results of the Micro Invent 5×3.5 (Fig. 40) are discussed to demonstrate a problem thatcan occur for small propellers with thin blades. As seen in the static results, both the thrust and powercoefficients increase with the Reynolds number, so it might be concluded that the lift increase along the bladeovercomes any drag decrease. However, noticeable bending was seen in the propeller during testing. Fromthe APC static results shown in Fig. 38, an increase in the pitch will increase both the thrust and powercoefficients, so it is possible that while the Micro Invent propeller was bending, it was also twisting to create
26 of 43
American Institute of Aeronautics and Astronautics

0 25 50 75 1000.00
0.05
0.10
0.15
Re (103)
CT
o
APC4.2×24.2×4
9×49×6
(a)
0 25 50 75 1000.00
0.05
0.10
0.15
Re (103)
CP
o
APC4.2×24.2×4
9×49×6
(b)
Figure 38: Static performance of the APC propellers as a function of Reynolds number: (a) CT0data and
(b) CP0data.
0 2,000 4,000 6,000 8,0000.05
0.10
0.15
0.20
Ω (RPM)
CT
o,CP
o
GWS Direct Drive 5×4.3Static Case
CTo
CPo
Re (103)0 10 20 30
Figure 39: GWS Direct Drive 5×4.3 static performance.
a larger pitch. To determine if twisting occurred, photographs of the propeller were taken using a strobelight and digital camera while it was spinning. From the side views in Fig. 41, it is seen that the propelleris deforming under load. Using PropellerScanner, the geometry of the propeller was measured while it wasunder load, and those results are shown in Fig. 42. A clear increase in the pitch of the propeller is shown.While Reynolds number effects could be present for the Micro Invent propeller, the change in the propellerpitch is most likely the dominate reason for the thrust and power increase seen in the static performanceresults.
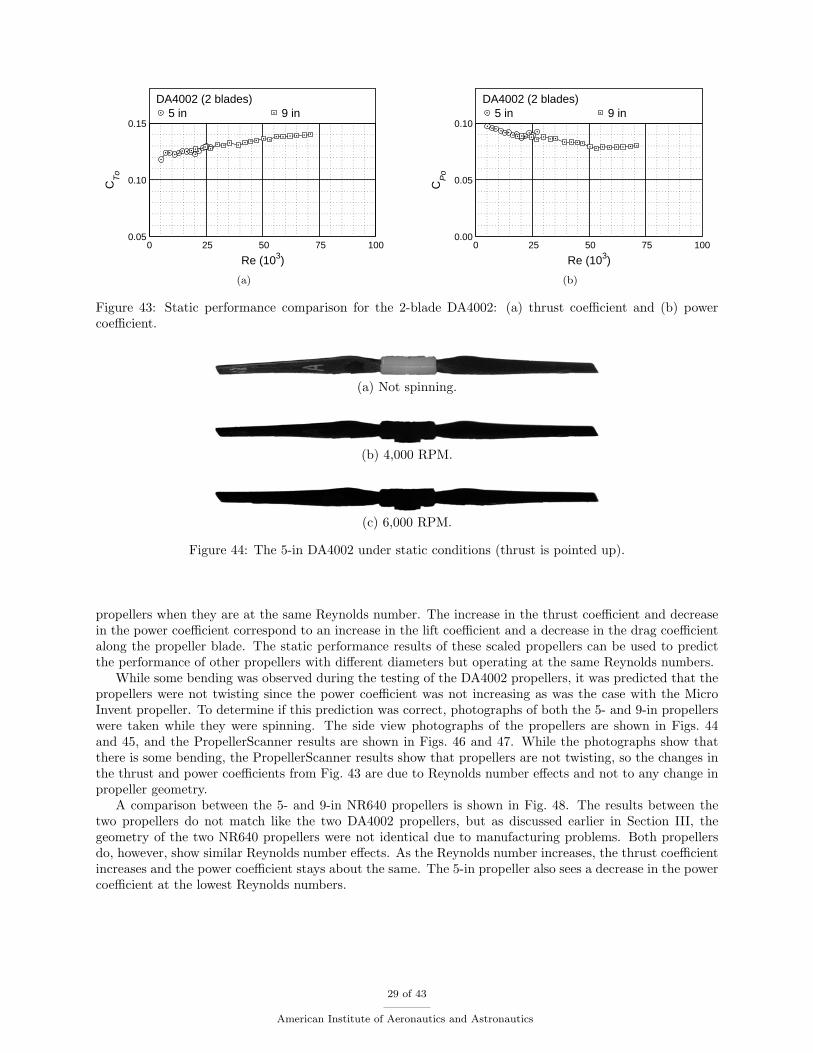
Results for the 3D printed DA4002 propeller are shown in Fig. 43, and Reynolds number effects are seenin both the thrust and power coefficients. As the Reynolds number increases, the thrust coefficient increasesand the drag coefficient decreases. It is also seen that there is good agreement between the 5- and 9-in
27 of 43
American Institute of Aeronautics and Astronautics
0 2,500 5,000 7,500 10,0000.00
0.05
0.10
0.15
Ω (RPM)
CT
o,CP
o
Micro Invent 5×3.5Static Case
CTo
CPo
Re (103)0 10 20 30
Figure 40: Micro Invent 5×3.5 static performance.
(a) Not spinning.
(b) 7,000 RPM.
Figure 41: Micro Invent 5×3.5 propeller under static conditions (thrust is pointed up).
0.00 0.25 0.50 0.75 1.000.00
0.25
0.50
0.75
r/R
c/R
Micro Invent 5×3.5
0 RPM 7,000 RPM
(a)
0.00 0.25 0.50 0.75 1.00 0
15
30
45
r/R
β (d
eg)
Micro Invent 5×3.5
0 RPM 7,000 RPM
(b)
Figure 42: Geometry comparison of the Micro Invent 5×3.5 propeller while at rest and at 7,000 RPM duringstatic conditions: (a) chord distribution and (b) twist distribution.
28 of 43
American Institute of Aeronautics and Astronautics
0 25 50 75 1000.05
0.10
0.15
Re (103)
CT
o
DA4002 (2 blades)5 in 9 in
(a)
0 25 50 75 1000.00
0.05
0.10
Re (103)
CP
o
DA4002 (2 blades)5 in 9 in
(b)
Figure 43: Static performance comparison for the 2-blade DA4002: (a) thrust coefficient and (b) powercoefficient.
(a) Not spinning.
(b) 4,000 RPM.
(c) 6,000 RPM.
Figure 44: The 5-in DA4002 under static conditions (thrust is pointed up).
propellers when they are at the same Reynolds number. The increase in the thrust coefficient and decreasein the power coefficient correspond to an increase in the lift coefficient and a decrease in the drag coefficientalong the propeller blade. The static performance results of these scaled propellers can be used to predictthe performance of other propellers with different diameters but operating at the same Reynolds numbers.
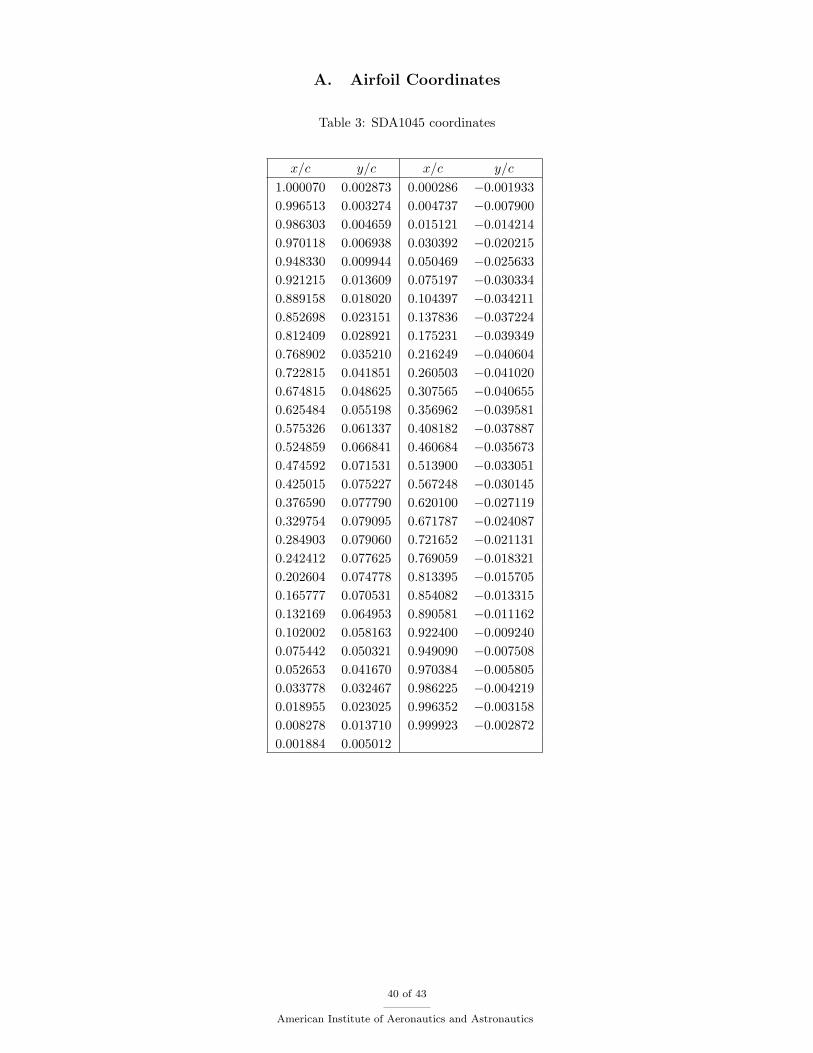
While some bending was observed during the testing of the DA4002 propellers, it was predicted that thepropellers were not twisting since the power coefficient was not increasing as was the case with the MicroInvent propeller. To determine if this prediction was correct, photographs of both the 5- and 9-in propellerswere taken while they were spinning. The side view photographs of the propellers are shown in Figs. 44and 45, and the PropellerScanner results are shown in Figs. 46 and 47. While the photographs show thatthere is some bending, the PropellerScanner results show that propellers are not twisting, so the changes inthe thrust and power coefficients from Fig. 43 are due to Reynolds number effects and not to any change inpropeller geometry.
A comparison between the 5- and 9-in NR640 propellers is shown in Fig. 48. The results between thetwo propellers do not match like the two DA4002 propellers, but as discussed earlier in Section III, thegeometry of the two NR640 propellers were not identical due to manufacturing problems. Both propellersdo, however, show similar Reynolds number effects. As the Reynolds number increases, the thrust coefficientincreases and the power coefficient stays about the same. The 5-in propeller also sees a decrease in the powercoefficient at the lowest Reynolds numbers.
29 of 43
American Institute of Aeronautics and Astronautics

(a) Not spinning.
(b) 2,000 RPM.
(c) 3,000 RPM.
Figure 45: The 9-in DA4002 under static conditions (thrust is pointed up).
0.00 0.25 0.50 0.75 1.000.00
0.25
0.50
0.75
r/R
c/R
DA4002 (5 in)
0 RPM4,000 RPM
6,000 RPM
(a)
0.00 0.25 0.50 0.75 1.00 0
15
30
45
r/R
β (d
eg)
DA4002 (5 in)
0 RPM4,000 RPM
6,000 RPM
(b)
Figure 46: Geometry comparison of the 5-in DA4002 while at rest, 4,000 RPM, and 6,000 RPM during staticconditions: (a) chord distribution and (b) twist distribution.
30 of 43
American Institute of Aeronautics and Astronautics

0.00 0.25 0.50 0.75 1.000.00
0.25
0.50
0.75
r/R
c/R
DA4002 (9 in)
0 RPM2,000 RPM
3,000 RPM
(a)
0.00 0.25 0.50 0.75 1.00 0
15
30
45
r/Rβ
(deg
)
DA4002 (9 in)
0 RPM2,000 RPM
3,000 RPM
(b)
Figure 47: Geometry comparison of the 9-in DA4002 while at rest, 2,000 RPM, and 3,000 RPM during staticconditions: (a) chord distribution and (b) twist distribution.
0 25 50 75 1000.00
0.05
0.10
Re (103)
CT
o
NR640 (2 blades)5 in 9 in
(a)
0 25 50 75 1000.00
0.05
0.10
Re (103)
CP
o
NR640 (2 blades)5 in 9 in
(b)
Figure 48: Static performance comparison for the 2-blade NR640: (a) thrust coefficient and (b) powercoefficient.
31 of 43
American Institute of Aeronautics and Astronautics

0.0 0.2 0.4 0.6 0.80.00
0.05
0.10
J
CT
APC Free Flight 9×4
Re = 28,900 (3,000 RPM)Re = 38,700 (4,000 RPM)Re = 48,400 (5,000 RPM)Re = 58,000 (6,000 RPM)
Figure 49: APC Free Flight 9×4 thrust coefficient.
0.0 0.2 0.4 0.6 0.80.00
0.05
0.10
J
CP
APC Free Flight 9×4
Re = 28,900 (3,000 RPM)Re = 38,700 (4,000 RPM)Re = 48,400 (5,000 RPM)Re = 58,000 (6,000 RPM)
Figure 50: APC Free Flight 9×4 power coefficient.
B. Advancing-Flow Tests
Results for the APC 9×4 propeller in an advancing flow are shown in Figs. 49–51. As was seen in thestatic performance results (Fig. 38), the thrust coefficient increases with the Reynolds number, but no largechange is visible with the power coefficient. The thrust coefficient increase leads to an increase in the propellerefficiency as shown in Fig. 51. Similar to the static results, the Reynolds number effects for the GWS 5×4.3propeller are different than the APC 9×4. As the Reynolds number increases, the thrust coefficient (Fig. 52)does not change while the power coefficient (Fig. 53) decreases. An increase in the efficiency (Fig. 54) withan increase in the Reynolds number is still measured with this propeller. From these two propellers, it isclear that as the Reynolds number increases, an increase in the thrust coefficient, a decrease in the powercoefficient, or both will increase the propeller efficiency. For the APC propeller, the maximum efficiencyincreased from about 45% to 55%, and the maximum efficiency for the GWS propeller increased from about62% to 66%.
Figures 55–57 show the results of the Micro Invent 5×3.5 propeller. It was shown earlier that thispropeller deformed during static testing, and the advancing-flow results also show this geometry change.The largest difference in the behavior of the Micro Invent propeller to the APC and GWS propellers is seenin the power coefficient (Fig. 56). At the two larger rotation rates, the power coefficient did not continue
32 of 43
American Institute of Aeronautics and Astronautics

0.0 0.2 0.4 0.6 0.80.0
0.2
0.4
0.6
J
η
APC Free Flight 9×4
Re = 28,900 (3,000 RPM)Re = 38,700 (4,000 RPM)Re = 48,400 (5,000 RPM)Re = 58,000 (6,000 RPM)
Figure 51: APC Free Flight 9×4 efficiency curves.
0.0 0.2 0.4 0.6 0.8 1.00.00
0.05
0.10
0.15
J
CT
GWS Direct Drive 5×4.3
Re = 17,300 (4,000 RPM)Re = 25,900 (6,000 RPM)Re = 34,500 (8,000 RPM)
Figure 52: GWS Direct Drive 5×4.3 thrust coefficient.
towards zero as the advance ratio increased, but instead it started to increase. It is believed that as theadvance ratio increased past the point of zero thrust, the propeller continued to deform.
The advancing-flow results of the 9-in DA4002 propeller are shown in Figs. 58–60. A clear increase inthe thrust coefficient is seen along with a decrease in the power coefficient at lower advance ratios as theReynolds number increases. Overall the efficiency of the propeller increases with the Reynolds number. TheReynolds number effects seen in these results are similar to the effects seen in the PROPID results fromSection IV. The 5- and 9-in propellers were both tested at approximately the same Reynolds number, andFig. 61 shows that the results are very close as expected.
Performance data of the 9-in NR640 propeller are compared to the full-scale tests28 in Figs. 62–64. The9-in propeller shows the effect of increasing the Reynolds number as an increase in the thrust coefficient.Thrust and power coefficient values for the 9-in propeller are lower than the 10-ft propeller though the
33 of 43
American Institute of Aeronautics and Astronautics

0.0 0.2 0.4 0.6 0.8 1.00.00
0.05
0.10
J
CP
GWS Direct Drive 5×4.3
Re = 17,300 (4,000 RPM)Re = 25,900 (6,000 RPM)Re = 34,500 (8,000 RPM)
Figure 53: GWS Direct Drive 5×4.3 power coefficient.
0.0 0.2 0.4 0.6 0.8 1.00.0
0.2
0.4
0.6
0.8
J
η
GWS Direct Drive 5×4.3
Re = 17,300 (4,000 RPM)Re = 25,900 (6,000 RPM)Re = 34,500 (8,000 RPM)
Figure 54: GWS Direct Drive 5×4.3 efficiency curves.
difference in the thrust coefficient is significantly more than the difference in the power coefficient. In factat the lower advance ratios, the power coefficient between the two propellers is very close. While the 9-inpropeller tested in this research was not an exact match to the desired geometry (Fig. 27), the difference ingeometry is small and would not account for all of the differences seen in the performance. The full-scalepropeller was tested at a much larger Reynolds number, so the lift coefficient is expected to be larger and thedrag coefficient is expected to be smaller than those of the 9-in propeller. The size and speed of the propelleralso places part of 10-ft propeller blade beyond the incompressible limit of Mach 0.3. The tip Mach numberfor the full-scale propeller is around 0.56. These Reynolds number and Mach number differences explain thelarge differences in the thrust coefficient between the 9-in and 10-ft propellers, and this difference in alsoseen in the efficiency curves. While the 10-ft propeller reaches a maximum efficiency of just over 80%, themaximum efficiency of the 9-in propeller is below 65%.
34 of 43
American Institute of Aeronautics and Astronautics

0.0 0.2 0.4 0.6 0.80.00
0.05
0.10
JC
T
Micro Invent 5×3.5
Re = 16,000 (4,000 RPM)Re = 23,900 (6,000 RPM)Re = 31,900 (8,000 RPM)
Figure 55: Micro Invent 5×3.5 thrust coefficient.
0.0 0.2 0.4 0.6 0.80.00
0.05
0.10
J
CP
Micro Invent 5×3.5
Re = 16,000 (4,000 RPM)Re = 23,900 (6,000 RPM)Re = 31,900 (8,000 RPM)
Figure 56: Micro Invent 5×3.5 power coefficient.
0.0 0.2 0.4 0.6 0.80.0
0.2
0.4
0.6
J
η
Micro Invent 5×3.5
Re = 16,000 (4,000 RPM)Re = 23,900 (6,000 RPM)Re = 31,900 (8,000 RPM)
Figure 57: Micro Invent 5×3.5 efficiency curves.
35 of 43
American Institute of Aeronautics and Astronautics

0.0 0.2 0.4 0.6 0.8 1.00.00
0.05
0.10
0.15
J
CT
DA4002 9 in (2 blades)
Re = 24,100 (2,000 RPM)Re = 36,200 (3,000 RPM)Re = 48,400 (4,000 RPM)Re = 61,800 (5,000 RPM)
Figure 58: DA4002 9×6.75 thrust coefficient.
0.0 0.2 0.4 0.6 0.8 1.00.00
0.05
0.10
J
CP
DA4002 9 in (2 blades)
Re = 24,100 (2,000 RPM)Re = 36,200 (3,000 RPM)Re = 48,400 (4,000 RPM)Re = 61,800 (5,000 RPM)
Figure 59: DA4002 9×6.75 power coefficient.
36 of 43
American Institute of Aeronautics and Astronautics

0.0 0.2 0.4 0.6 0.8 1.00.0
0.2
0.4
0.6
0.8
J
η
DA4002 9 in (2 blades)
Re = 24,100 (2,000 RPM)Re = 36,200 (3,000 RPM)Re = 48,400 (4,000 RPM)Re = 61,800 (5,000 RPM)
Figure 60: DA4002 9×6.75 efficiency curves.
0.0 0.2 0.4 0.6 0.8 1.00.00
0.05
0.10
0.15
J
CT
DA4002 (2 blades)
5 in, Re = 22,100 (6,000 RPM)9 in, Re = 24,100 (2,000 RPM)
(a)
0.0 0.2 0.4 0.6 0.8 1.00.00
0.05
0.10
J
CP
DA4002 (2 blades)
5 in, Re = 22,100 (6,000 RPM)9 in, Re = 24,100 (2,000 RPM)
(b)
Figure 61: Performance comparison for the 2-blade DA4002: (a) thrust coefficient and (b) power coefficient.
37 of 43
American Institute of Aeronautics and Astronautics

0.0 0.2 0.4 0.6 0.8 1.00.00
0.05
0.10
J
CT
NR640 (2 blades)
9 in, Re = 24,900 (3,000 RPM)9 in, Re = 33,100 (4,000 RPM)9 in, Re = 41,000 (5,000 RPM)9 in, Re = 49,000 (6,000 RPM)10 ft, Re = 1,800,000 (1,200 RPM)
Figure 62: Thrust coefficient for the 2-blade NR640 (10-ft propeller data from NACA Report 64028).
0.0 0.2 0.4 0.6 0.8 1.00.00
0.05
0.10
J
CP
NR640 (2 blades)
9 in, Re = 24,900 (3,000 RPM)9 in, Re = 33,100 (4,000 RPM)9 in, Re = 41,000 (5,000 RPM)9 in, Re = 49,000 (6,000 RPM)10 ft, Re = 1,800,000 (1,200 RPM)
Figure 63: Power coefficient for the 2-blade NR640 (10-ft propeller data from NACA Report 64028).
38 of 43
American Institute of Aeronautics and Astronautics

0.0 0.2 0.4 0.6 0.8 1.00.0
0.2
0.4
0.6
0.8
1.0
J
η
NR640 (2 blades)
9 in, Re = 24,900 (3,000 RPM)9 in, Re = 33,100 (4,000 RPM)9 in, Re = 41,000 (5,000 RPM)9 in, Re = 49,000 (6,000 RPM)10 ft, Re = 1,800,000 (1,200 RPM)
Figure 64: Efficiency curves for the 2-blade NR640 (10-ft propeller data from NACA Report 64028).
VI. Conclusions
The small-scale nature of propellers used for small UAVs and MAVs lead to difficulty in predicting theirbehavior. Part of this difficulty is from the large dependence the performance has on the propeller Reynoldsnumber. To help measure this Reynolds number dependence, static and advancing-flow performance datawere measured for a variety of off-the-shelf and 3D-printed propellers. From these tests, the main Reynoldsnumber effects have been confirmed. As the Reynolds number increases, the thrust coefficient increases,the power coefficient decreases, or both. The changes in the thrust and power coefficients are due to theincrease in the sectional lift coefficients and the decrease in the sectional drag coefficients with increasingReynolds numbers, which are typical in this Reynolds number range. For propellers in an advancing flow,the Reynolds number effects lead to an increase in the propeller efficiency, and as shown with the APC 9×4,this increase can be at least 10%. Nevertheless, the maximum efficiency of these propellers is still low whencompared to the efficiency of a full scale propeller as was shown with the NR640 propeller.
While the off-the-shelf propellers were useful in measuring the general Reynolds number trends, theywere limiting in the geometry available. The 3D-printed propellers developed for this researched showedthat propellers of different diameters will have the same performance coefficients when they operate at thesame Reynolds number. With this behavior, the performance of a new propeller with a different diametercan be predicted based on the known performance of a propeller; the new propeller will have the sameperformance when it operates in the Reynolds number range of the known propeller. If the new propelleralso operates at larger Reynolds numbers, it is expected that its efficiency will increase; however, its efficiencywill decrease at lower Reynolds numbers.
Acknowledgments
The authors would like to thank Matthew Dempsey and Rushant Badani for their help in taking propellerwind tunnel data.
39 of 43
American Institute of Aeronautics and Astronautics
A. Airfoil Coordinates
Table 3: SDA1045 coordinates
x/c y/c x/c y/c
1.000070 0.002873 0.000286 −0.001933
0.996513 0.003274 0.004737 −0.007900
0.986303 0.004659 0.015121 −0.014214
0.970118 0.006938 0.030392 −0.020215
0.948330 0.009944 0.050469 −0.025633
0.921215 0.013609 0.075197 −0.030334
0.889158 0.018020 0.104397 −0.034211
0.852698 0.023151 0.137836 −0.037224
0.812409 0.028921 0.175231 −0.039349
0.768902 0.035210 0.216249 −0.040604
0.722815 0.041851 0.260503 −0.041020
0.674815 0.048625 0.307565 −0.040655
0.625484 0.055198 0.356962 −0.039581
0.575326 0.061337 0.408182 −0.037887
0.524859 0.066841 0.460684 −0.035673
0.474592 0.071531 0.513900 −0.033051
0.425015 0.075227 0.567248 −0.030145
0.376590 0.077790 0.620100 −0.027119
0.329754 0.079095 0.671787 −0.024087
0.284903 0.079060 0.721652 −0.021131
0.242412 0.077625 0.769059 −0.018321
0.202604 0.074778 0.813395 −0.015705
0.165777 0.070531 0.854082 −0.013315
0.132169 0.064953 0.890581 −0.011162
0.102002 0.058163 0.922400 −0.009240
0.075442 0.050321 0.949090 −0.007508
0.052653 0.041670 0.970384 −0.005805
0.033778 0.032467 0.986225 −0.004219
0.018955 0.023025 0.996352 −0.003158
0.008278 0.013710 0.999923 −0.002872
0.001884 0.005012
40 of 43
American Institute of Aeronautics and Astronautics
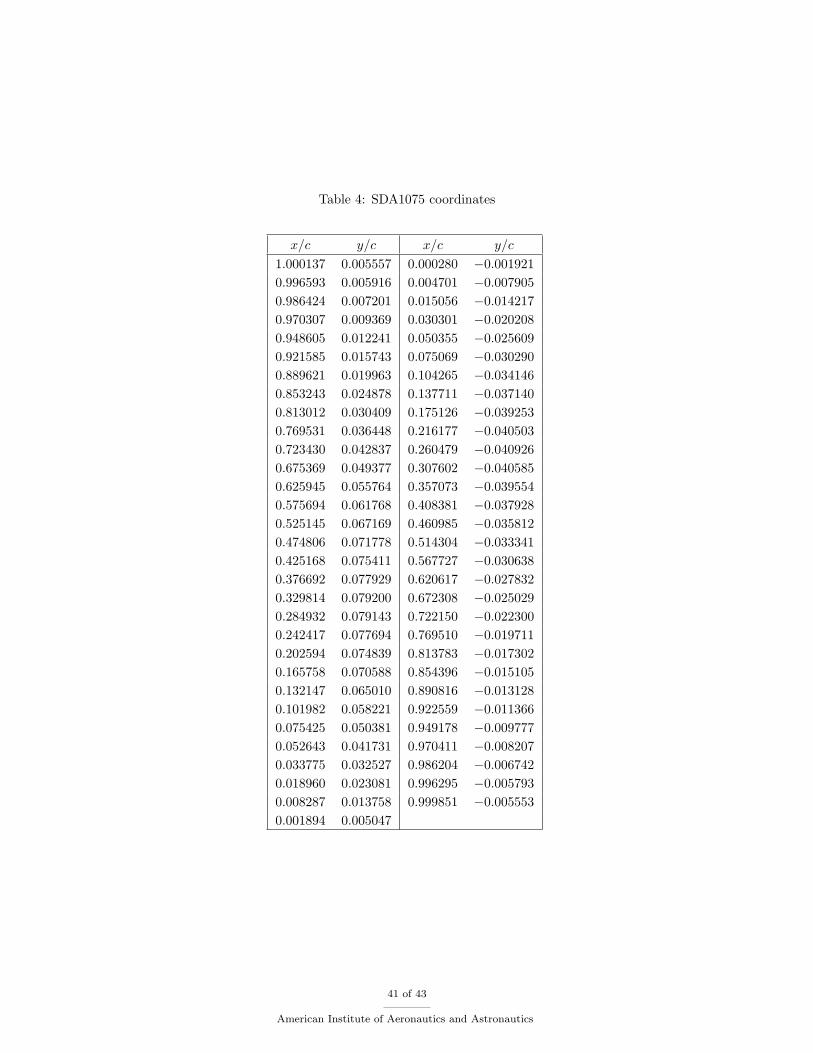
Table 4: SDA1075 coordinates
x/c y/c x/c y/c
1.000137 0.005557 0.000280 −0.001921
0.996593 0.005916 0.004701 −0.007905
0.986424 0.007201 0.015056 −0.014217
0.970307 0.009369 0.030301 −0.020208
0.948605 0.012241 0.050355 −0.025609
0.921585 0.015743 0.075069 −0.030290
0.889621 0.019963 0.104265 −0.034146
0.853243 0.024878 0.137711 −0.037140
0.813012 0.030409 0.175126 −0.039253
0.769531 0.036448 0.216177 −0.040503
0.723430 0.042837 0.260479 −0.040926
0.675369 0.049377 0.307602 −0.040585
0.625945 0.055764 0.357073 −0.039554
0.575694 0.061768 0.408381 −0.037928
0.525145 0.067169 0.460985 −0.035812
0.474806 0.071778 0.514304 −0.033341
0.425168 0.075411 0.567727 −0.030638
0.376692 0.077929 0.620617 −0.027832
0.329814 0.079200 0.672308 −0.025029
0.284932 0.079143 0.722150 −0.022300
0.242417 0.077694 0.769510 −0.019711
0.202594 0.074839 0.813783 −0.017302
0.165758 0.070588 0.854396 −0.015105
0.132147 0.065010 0.890816 −0.013128
0.101982 0.058221 0.922559 −0.011366
0.075425 0.050381 0.949178 −0.009777
0.052643 0.041731 0.970411 −0.008207
0.033775 0.032527 0.986204 −0.006742
0.018960 0.023081 0.996295 −0.005793
0.008287 0.013758 0.999851 −0.005553
0.001894 0.005047
41 of 43
American Institute of Aeronautics and Astronautics

Table 5: SDA1100 coordinates
x/c y/c x/c y/c
1.000560 0.023438 0.000340 −0.002210
0.997176 0.023296 0.004895 −0.008428
0.987335 0.023394 0.015242 −0.014980
0.971591 0.024273 0.030432 −0.021172
0.950250 0.025737 0.050398 −0.026752
0.923550 0.027790 0.075000 −0.031600
0.891891 0.030470 0.104069 −0.035622
0.855748 0.033756 0.137381 −0.038791
0.815637 0.037595 0.174659 −0.041092
0.772117 0.041913 0.215573 −0.042554
0.725782 0.046610 0.259744 −0.043220
0.677260 0.051562 0.306745 −0.043157
0.627196 0.056606 0.356104 −0.042445
0.576247 0.061546 0.407313 −0.041185
0.525001 0.066102 0.459831 −0.039483
0.473983 0.070072 0.513086 −0.037462
0.423703 0.073265 0.566488 −0.035252
0.374641 0.075528 0.619404 −0.033012
0.327253 0.076718 0.671164 −0.030854
0.281953 0.076738 0.721110 −0.028861
0.239131 0.075504 0.768602 −0.027101
0.199125 0.072979 0.813026 −0.025615
0.162245 0.069148 0.853802 −0.024436
0.128746 0.064047 0.890388 −0.023569
0.098854 0.057737 0.922293 −0.023005
0.072735 0.050335 0.949072 −0.022707
0.050524 0.041973 0.970376 −0.022572
0.032250 0.032866 0.986071 −0.022580
0.017968 0.023382 0.995899 −0.023006
0.007743 0.013912 0.999280 −0.023331
0.001686 0.004982
42 of 43
American Institute of Aeronautics and Astronautics

References
1Carmichael, B. H., “Low Reynolds Number Airfoil Survey,” NASA CR 165803, 1981.2Selig, M. S., Donovan, J. F., and Fraser, D. B.,, Airfoils at Low-Speeds, SoarTech Publications, Virginia Beach, VA, 1989.3Selig, M. S., Guglielmo, J. J. A. P. Broeren, A. P., and Giguere, P., Summary of Low-Speed Airfoil Data, Vol. 1, SoarTech
Publications, Virginia Beach, VA, 1995.4Selig, M. S., Lyon, C. A., Giguere, P., Ninham, C. P., and Guglielmo, J. J., Summary of Low-Speed Airfoil Data, Vol. 2,
SoarTech Publications, Virginia Beach, VA, 1996.5Lyon, C. A., Broeren, A. P., Giguere, P., Gopalarathnam, A., and Selig, M. S., Summary of Low-Speed Airfoil Data,
Vol. 3, SoarTech Publications, Virginia Beach, VA, 1998.6Selig, M. S., and McGranahan, B. D., “Wind Tunnel Aerodynamic Tests of Six Airfoils for Use on Small Wind Turbines,”
National Renewable Energy Laboratory, NREL/SR-500-34515, Golden, CO, 2004.7Williamson, G. A., McGranahan, B. D., Broughton, B. A., Deters, R.W ., Brandt, J. B., and Selig, M. S., Summary of
Low-Speed Airfoil Data, Vol. 5, 2012.8Borst, H. V. and Associates, “Aerodynamic Design and Analysis of Propellers for Mini-Remotely Piloted Air Vehicles:
Volume 1 — Open Propellers,” USAAMRDL-TR-77-45A, 1978.9Bass, R. M., “Small Scale Wind Tunnel Testing of Model Propellers,” AIAA Paper 86-0392, 1986.
10Ol, M., Zeune, C., and Logan M., “Analytical-Experimental Comparison for Small Electric Unmanned Air VehiclePropellers,” AIAA Paper 2008-7345, 2008.
11Moffitt, B. A., Bradley, T. H., Parekh, D. E., and Mavris, D., “Validation of Vortex Propeller Theory for UAV Designwith Uncertainty Analysis,” AIAA Paper 2008-0406, 2008.
12Brandt, J. B., “Small-Scale Propeller Performance at Low Speeds,” M.S. Thesis, University of Illinois at Urbana-Champaign, Urbana, IL, 2005.
13Uhlig, D. V., “Post Stall Propeller Behavior at Low Reynolds Numbers,” M.S. Thesis, University of Illinois at Urbana-Champaign, Urbana, IL, 2007.
14Merchant, M. P. and Miller, L. S., “Propeller Performance Measurement for Low Reynolds Number UAV Applications,”AIAA Paper 2006-1127, 2006.
15Gamble, D. E. and Arena, A., “Automated Dynamic Propeller Testing at Low Reynolds Numbers,” AIAA Paper 2010-0853, 2010.
16Baranski, J. A., Fernelius, M. H., Hoke, J. L., Wilson, C. W., and Litke, P. J., “Characterization of Propeller Performanceand Engine Mission Matching for Small Remotely Piloted Aircraft,” AIAA Paper 2011-6058, 2011.
17Brandt, J. B. and Selig, M. S., “Propeller Performance Data at Low Reynolds Numbers,” AIAA Paper 2011-1255, 2011.18Deters, R. W. and Selig, M. S., “Static Testing of Micro Propellers,” AIAA Paper 2008-6246, 2008.19Deters, R. W., “Performance and Slipstream Characteristics of Small-Scale Propellers at Low Reynolds Numbers,” Ph.D.
Dissertation, University of Illinois at Urbana-Champaign, Urbana, IL, 2014.20Smedresman, A., Yeo, D., and Shyy, W., “Design, Fabrication, Analysis, and Testing of a Micro Air Vehicle Propeller,”
AIAA Paper 2011-3817, 2011.21Khodadoust, A., “An Experimental Study of the Flowfield on a Semispan Rectangular Wing with a Simulated Glaze Ice
Accretion,” Ph.D. Dissertation, University of Illinois at Urbana-Champaign, Urbana, IL, 1993.22Anderson, J. D., Jr., Fundamentals of Aerodynamics, 2nd ed., McGraw-Hill, Inc., New York, 1991.23Glauert, H., “Wind Tunnel Interference on Wings, Bodies and Airscrews,” Aeronautical Research Committee R&M 1566,
1933.24Barlow, J. B., Rae, W. H., Jr., and Pope, A., Low-Speed Wind Tunnel Testing, 3rd ed., John Wiley & Sons, Inc., New
York, 1999.25Hepperle, M., PropellerScanner, http://mh-aerotools.de, Accessed May 27, 2014.26Uhlig, D. V. and Selig, M. S., “Post Stall Propeller Behavior at Low Reynolds Numbers,” AIAA Paper 2008-0407, 2008.27Selig, M. S., UIUC Applied Aerodynamics Group, http://aerospace.illinois.edu/m-selig/, Accessed May 27, 2014.28Hartman, E. P. and Biermann, D., “The Aerodynamic Characteristics of Full-Scale Propellers Having 2, 3, and 4 Blades
of Clark Y and R.A.F. 6 Airfoil Sections,” NACA Report 640, 1938.29Drela, M., XFOIL, http://web.mit.edu/drela/Public/web/xfoil/, Accessed May 27, 2014.30Selig, M. S. and Tangler, J. L., “Development and Application of a Multipoint Inverse Design Method for Horizontal
Axis Wind Turbines,” Wind Engineering, Vol. 19, No. 2, 1995, pp. 91.31Selig, M. S. and Maughmer, M. D., “Multipoint Inverse Airfoil Design Method Based on Conformal Mapping,” AIAA
Journal , Vol. 30, No. 5, May 1992, pp. 1162–1170.32Selig, M. S. and Maughmer, M. D., “Generalized Multipoint Inverse Airfoil Design,” AIAA Journal , Vol. 30, No. 11,
November 1992, pp. 2618–2625.33Johnson, W., Helicopter Theory, Dover Publications, Inc., New York, 1980.34Leishman, J. G., Principles of Helicopter Aerodynamics, Cambridge University Press, Cambridge, 2000.35McCormick, B. W., Aerodynamics, Aeronautics, and Flight Mechanics, John Wiley and Sons, Inc, New York, 1995.36McGranahan, B. D., “Surface Oil Flow Measurements on Several Airfoils at Low Reynolds Numbers,” M.S. Thesis,
University of Illinois at Urbana-Champaign, Urbana, IL, 2003.
43 of 43
American Institute of Aeronautics and Astronautics