Embed Size (px)
Citation preview
Program RF-STEEL © 2013 Dlubal Software GmbH
Dlubal
Add-on Module
RF-STEEL Stress Analysis for Surfaces and Members
Program Description
Version July 2013
All rights, including those of translations, are reserved.
No portion of this book may be reproduced – mechanically, electroni-cally, or by any other means, including photocopying – without written permission of DLUBAL SOFTWARE GMBH. © Dlubal Software GmbH
Am Zellweg 2 D-93464 Tiefenbach
Tel.: +49 9673 9203-0 Fax: +49 9673 9203-51 E-Mail: [email protected] Web: www.dlubal.com

Dlubal
3
Content
Content Page
Content Page
Program RF-STEEL © 2013 Dlubal Software GmbH
1. Introduction 4 1.1 RF-STEEL Add-on Modules 4 1.2 RF-STEEL Team 5 1.3 Using the Manual 6 1.4 Start RF-STEEL Modules 6 2. RF-STEEL Surfaces 8 2.1 Input Data 8 2.1.1 General Data 8 2.1.1.1 Ultimate Limit State 10 2.1.1.2 Serviceability 11 2.1.2 Materials 12 2.1.3 Surfaces 16 2.1.4 Serviceability Data 18 2.2 Calculation 19 2.2.1 Detail Settings 19 2.2.1.1 Stresses 19 2.2.1.2 Serviceability 24 2.2.1.3 Options 25 2.2.2 Start Calculation 27 2.3 Results 29 2.3.1 Stresses by Load Case 30 2.3.2 Stresses by Material 33 2.3.3 Stresses by Surface 33 2.3.4 Stresses by Line 34 2.3.5 Stresses in All Points 35 2.3.6 Stress Ranges 36 2.3.7 Displacements 37 2.3.8 Parts List 38 3. RF-STEEL Members 40 3.1 Input Data 40 3.1.1 General Data 40 3.1.2 Materials 42 3.1.3 Cross-Sections 47 3.2 Calculation 51 3.2.1 Detail Settings 51 3.2.2 Stresses and Ratio 54 3.2.3 Start Calculation 59
3.3 Results 60 3.3.1 Stresses by Cross-Section 61 3.3.2 Stresses by Set of Members 63 3.3.3 Stresses by Member 64 3.3.4 Stresses by x-Location 65 3.3.5 Stresses at Every Stress Point 66 3.3.6 Governing Internal Forces by Member 67 3.3.7 Governing Internal Forces by Set of
Members 68 3.3.8 Parts List by Member 69 3.3.9 Parts List by Set of Members 70 4. Results Evaluation 71 4.1 RF-STEEL Surfaces 73 4.1.1 Selection of Stresses 73 4.1.2 Results in RFEM Model 74 4.2 RF-STEEL Members 77 4.2.1 Selection of Stresses 77 4.2.2 Results on Cross-Section 78 4.2.3 Results in RFEM Model 80 4.2.4 Result Diagrams 83 4.3 Filter for Results 84 5. Printout 86 5.1 Printout report 86 5.2 Printing RF-STEEL Graphics 86 5.2.1 Results in the RFEM Model 86 5.2.2 Results on Cross-section 88 6. General Functions 90 6.1 Design Cases 90 6.2 Optimization 92 6.2.1 RF-STEEL Surfaces 92 6.2.2 RF-STEEL Members 93 6.3 Units and Decimal Places 96 6.4 Data Transfer 97 6.4.1 Material Export to RFEM 97 6.4.2 Export of Results 97 A Literature 99
B Index 100
1 Introduction
Dlubal
4 Program RF-STEEL © 2013 Dlubal Software GmbH
1. Introduction
1.1 RF-STEEL Add-on Modules
Both RF-STEEL add-on modules are integrated in the graphical user interface of the RFEM pro-gram. RF-STEEL Surfaces is used for the stress and serviceability limit state design of surface and shell elements. The stresses of member elements are designed by RF-STEEL Members. Both modules are described in this manual.
RF-STEEL performs general stress designs by calculating normal, shear, and equivalent stresses of surfaces, members, and sets of members and by comparing them with the limit stresses. The add-on modules provide a comprehensive library for cross-sections and materials with stand-ard-specific limit stresses that can be adjusted and expanded. All member cross-sections are provided with design relevant stress points. The results of these points can also be used for graphical evaluations.
The design relevant input data of the model as well as the internal forces are imported auto-matically when you open the modules. After the design is carried out, you can evaluate the design results in the RFEM work window graphically and include them in the global printout report.
When you design members and sets of members, the internal forces that are found to be gov-erning are displayed, too. In addition, RF-STEEL allows you to optimize the surfaces and cross-sections automatically and to export the changes to RFEM.
Using the so-called design cases, you can analyze the different types of stress designs. A parts list with quantity surveying completes the design.
The following useful features facilitate the work with RF-STEEL:
• Determination of equivalent stresses according to different approaches: VON MISES, TRESCA, RANKINE, or BACH
• Serviceability limit state design by checking surface displacements
• Output of stress ranges for fatigue designs
• Display of maximum stress ratios in surface and cross-section tables, helping you to decide how to carry out the optimization
• Connection between RF-STEEL tables and RFEM work window, thus selecting, for exam-ple, the current member of the table in the background graphic
• View mode to change the view in the RFEM work window
• Colored relation scales in results windows
• Info icon for successful or failed stress design
• Representation of RF-STEEL stresses and stress ratios in the form of result diagrams
• Filter function for surfaces, lines, and nodes in tables as well as stresses and stress ratios in the RFEM graphic
• Data export to MS Excel and OpenOffice.org Calc or as a CSV file
All this makes RF-STEEL the appropriate program for general stress analyses. Note, however, that stability analyses, as required for example in EN 1993-1-1 or DIN 18000 part 2, cannot be performed. For such analyses, the add-on modules RF-STEEL EC3 or RF-KAPPA and RF-LTB are recommended.
We hope you will enjoy working with the RF-STEEL add-on modules.
Your DLUBAL Team
1 Introduction
Dlubal
5 Program RF-STEEL © 2013 Dlubal Software GmbH
1.2 RF-STEEL Team The following people were involved in the development of RF-STEEL Surfaces and RF-STEEL Members:
Program coordination Dipl.-Ing. Georg Dlubal Dipl.-Ing. (FH) Younes El Frem
Programming Ing. Ing. Zdeněk Kosáček Dipl.-Ing. Georg Dlubal Ing. Martin Budáč
Mgr. Petr Oulehle Zbyněk Zámečník
Cross-section and material database Ing. Ph.D. Jan Rybín Mgr. Petr Oulehle
Ing. Jiří Kubíček
Program design, dialog figures, and icons Dipl.-Ing. Georg Dlubal MgA. Robert Kolouch
Ing. Jan Miléř
Program supervision Ing. Martin Vasek M.Eng. Dipl.-Ing. (BA) Andreas Niemeier
Localization, manual Ing. Fabio Borriello Ing. Dmitry Bystrov Eng.º Rafael Duarte Ing. Jana Duníková Ing. Lara Freyer Alessandra Grosso Bc. Chelsea Jennings Jan Jeřábek Ing. Ladislav Kábrt Ing. Aleksandra Kociołek Mgr. Michaela Kryšková Dipl.-Ing. Tingting Ling
Ing. Roberto Lombino Eng.º Nilton Lopes Mgr. Ing. Hana Macková Ing. Téc. Ind. José Martínez MA SKT Anton Mitleider Dipl.-Ü. Gundel Pietzcker Mgr. Petra Pokorná Ing. Zoja Rendlová Dipl.-Ing. Jing Sun Ing. Marcela Svitáková Dipl.-Ing. (FH) Robert Vogl Ing. Marcin Wardyn
Technical support M.Eng. Cosme Asseya Dipl.-Ing. (BA) Markus Baumgärtel Dipl.-Ing. Moritz Bertram M.Sc. Sonja von Bloh Dipl.-Ing. (FH) Steffen Clauß Dipl.-Ing. Frank Faulstich Dipl.-Ing. (FH) René Flori Dipl.-Ing. (FH) Stefan Frenzel Dipl.-Ing. (FH) Walter Fröhlich Dipl.-Ing. Wieland Götzler Dipl.-Ing. (FH) Andreas Hörold Dipl.-Ing. (FH) Paul Kieloch
Dipl.-Ing. (FH) Bastian Kuhn Dipl.-Ing. (FH) Ulrich Lex Dipl.-Ing. (BA) Sandy Matula Dipl.-Ing. (FH) Alexander Meierhofer M.Eng. Dipl.-Ing. (BA) Andreas Niemeier Dipl.-Ing. (FH) Gerhard Rehm M.Eng. Dipl.-Ing. (FH) Walter Rustler M.Sc. Dipl.-Ing. (FH) Frank Sonntag Dipl.-Ing. (FH) Christian Stautner Dipl.-Ing. (FH) Lukas Sühnel Dipl.-Ing. (FH) Robert Vogl
1 Introduction
Dlubal
6 Program RF-STEEL © 2013 Dlubal Software GmbH
1.3 Using the Manual Topics like installation, graphical user interface, results evaluation, and printout are described in detail in the manual of the main program RFEM. The present manual focuses on typical fea-tures of the RF-STEEL add-on modules.
The descriptions in this manual follow the sequence of the module's input and results win-dows as well as their structure. The text of the manual shows the described buttons in square brackets, for example [View mode]. At the same time, they are pictured on the left. Expres-sions appearing in dialog boxes, windows, and menus are set in italics to clarify the explana-tions.
At the end of the manual, you find the index. However, if you don’t find what you are looking for, please check our website www.dlubal.com where you can go through our comprehensive FAQ pages by selecting particular criteria.
1.4 Start RF-STEEL Modules RFEM provides the following options to start the RF-STEEL add-on modules.
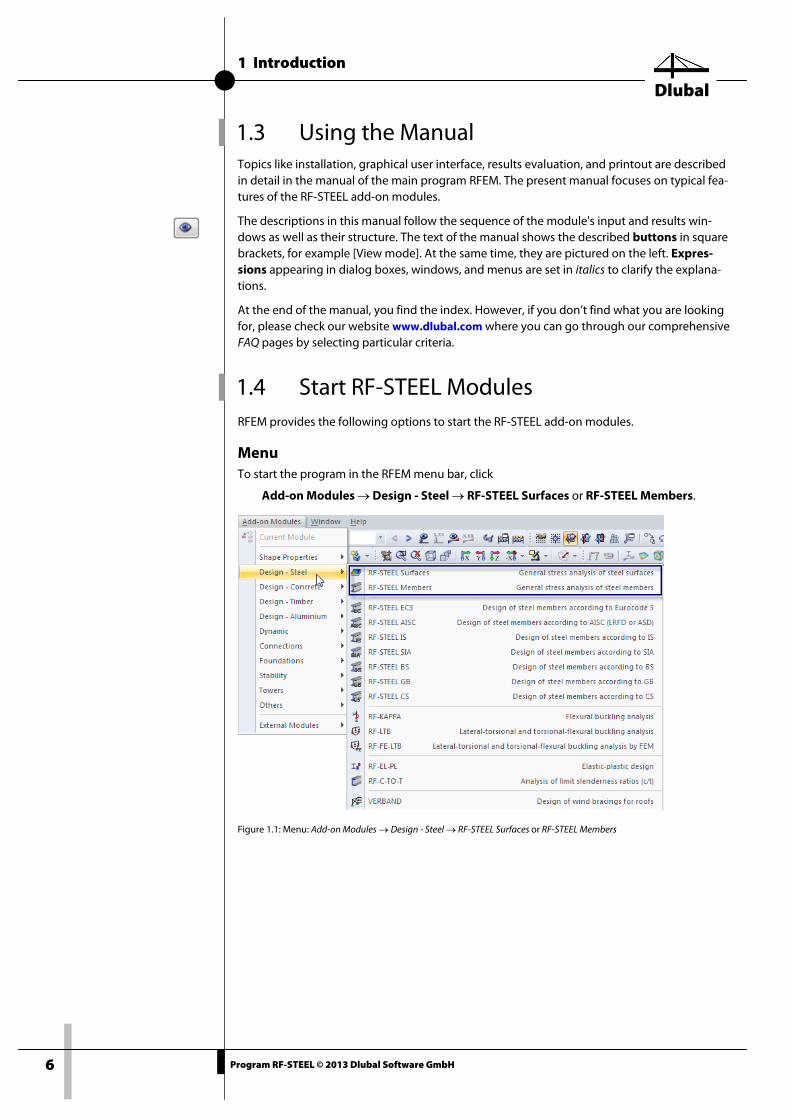
Menu To start the program in the RFEM menu bar, click
Add-on Modules → Design - Steel → RF-STEEL Surfaces or RF-STEEL Members.
Figure 1.1: Menu: Add-on Modules → Design - Steel → RF-STEEL Surfaces or RF-STEEL Members
1 Introduction
Dlubal
7 Program RF-STEEL © 2013 Dlubal Software GmbH
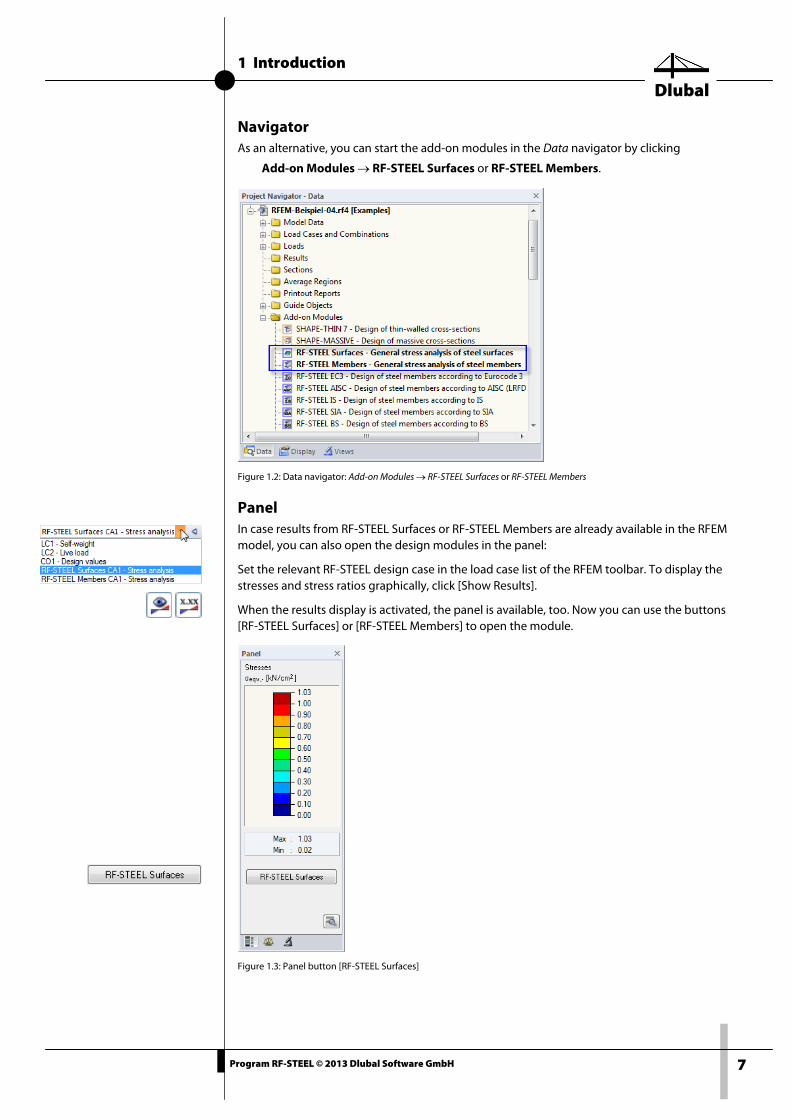
Navigator As an alternative, you can start the add-on modules in the Data navigator by clicking
Add-on Modules → RF-STEEL Surfaces or RF-STEEL Members.
Figure 1.2: Data navigator: Add-on Modules → RF-STEEL Surfaces or RF-STEEL Members
Panel In case results from RF-STEEL Surfaces or RF-STEEL Members are already available in the RFEM model, you can also open the design modules in the panel:
Set the relevant RF-STEEL design case in the load case list of the RFEM toolbar. To display the stresses and stress ratios graphically, click [Show Results].
When the results display is activated, the panel is available, too. Now you can use the buttons [RF-STEEL Surfaces] or [RF-STEEL Members] to open the module.
Figure 1.3: Panel button [RF-STEEL Surfaces]
2 RF-STEEL Surfaces
Dlubal
8 Program RF-STEEL © 2013 Dlubal Software GmbH
2. RF-STEEL Surfaces
2.1 Input Data When you have started the add-on module, a new window opens. In this window, a Navigator is displayed on the left, managing the tables that can be selected currently. The drop-down list above the navigator contains the design cases (see chapter 6.1, page 90).
The design relevant data is defined in three input windows. When you open RF-STEEL Surfaces for the first time, the following parameters are imported automatically:
• Surfaces and surface thicknesses
• Load cases, load combinations, result combinations, and RF-DYNAM cases
• Materials
• Internal forces (in background, if calculated)
To select a table, click the corresponding entry in the navigator. To set the previous or next in-put window, use the buttons shown on the left. You can also use the function keys to select the next [F2] or previous [F3] window.
Click [OK] to save the results, thus exiting RF-STEEL and returning to the main program. If you click [Cancel], you exit the add-on module but without saving the data.
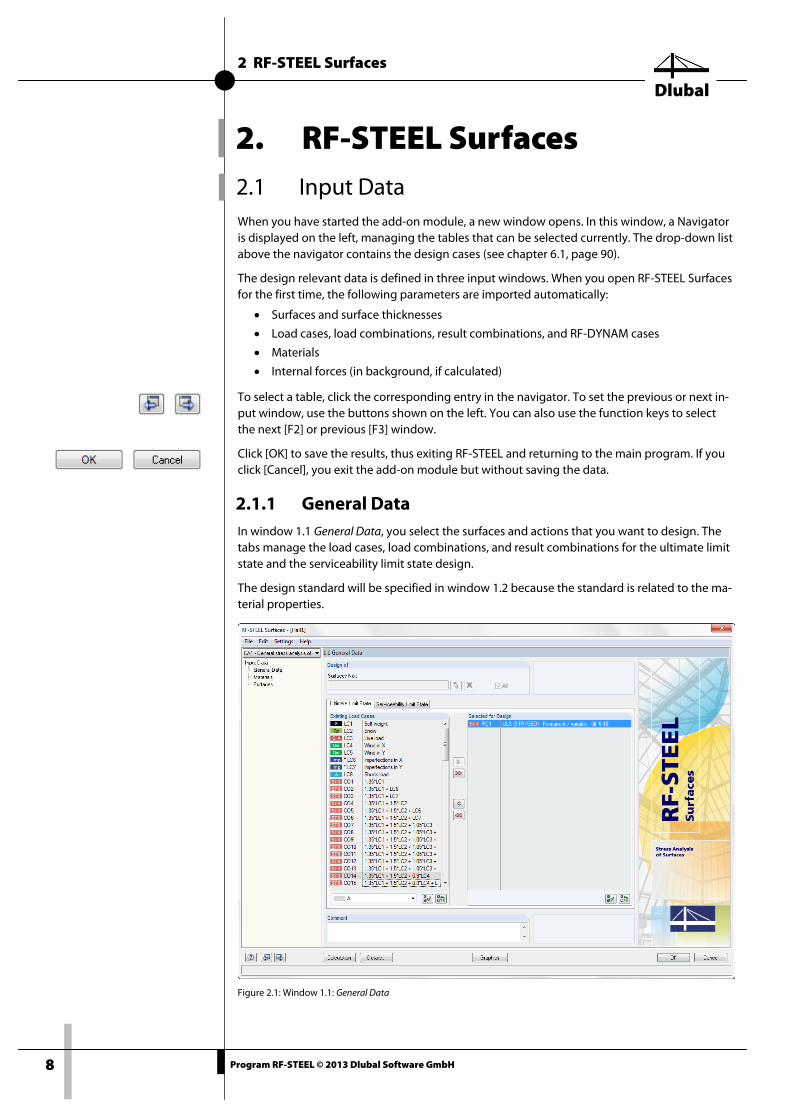
2.1.1 General Data In window 1.1 General Data, you select the surfaces and actions that you want to design. The tabs manage the load cases, load combinations, and result combinations for the ultimate limit state and the serviceability limit state design.
The design standard will be specified in window 1.2 because the standard is related to the ma-terial properties.
Figure 2.1: Window 1.1: General Data
2 RF-STEEL Surfaces
Dlubal
9 Program RF-STEEL © 2013 Dlubal Software GmbH
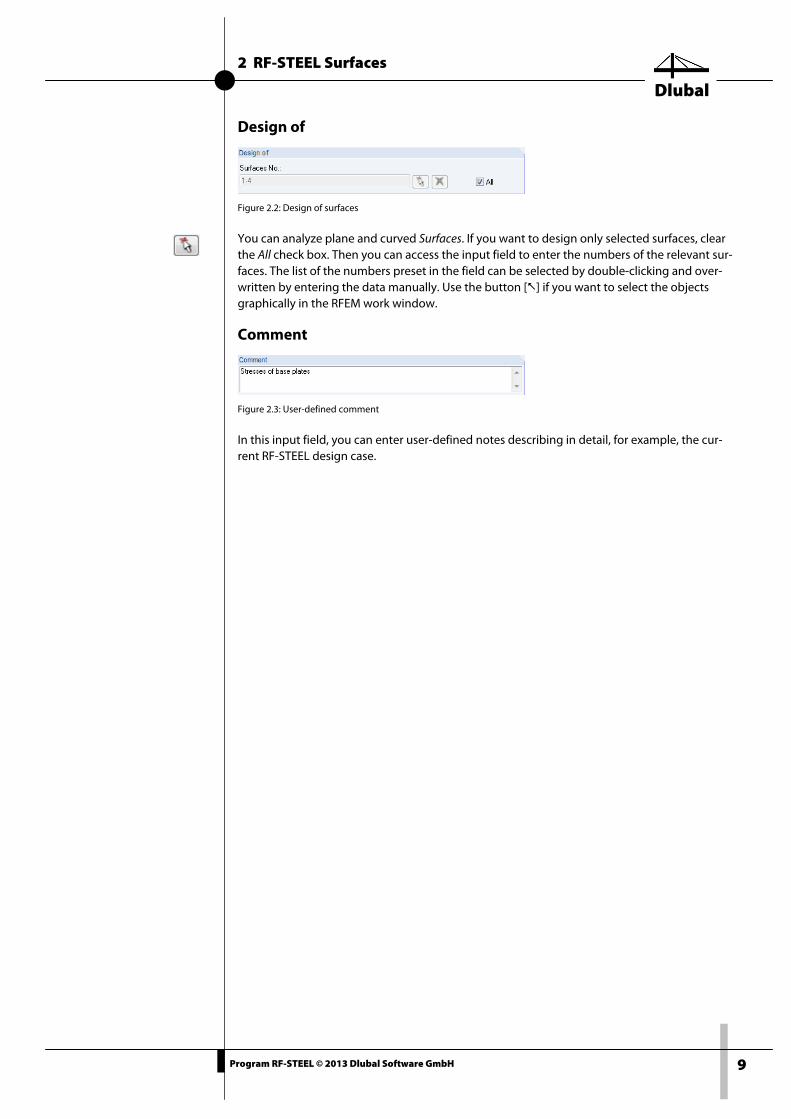
Design of
Figure 2.2: Design of surfaces
You can analyze plane and curved Surfaces. If you want to design only selected surfaces, clear the All check box. Then you can access the input field to enter the numbers of the relevant sur-faces. The list of the numbers preset in the field can be selected by double-clicking and over-written by entering the data manually. Use the button [] if you want to select the objects graphically in the RFEM work window.
Comment
Figure 2.3: User-defined comment
In this input field, you can enter user-defined notes describing in detail, for example, the cur-rent RF-STEEL design case.
2 RF-STEEL Surfaces
Dlubal
10 Program RF-STEEL © 2013 Dlubal Software GmbH
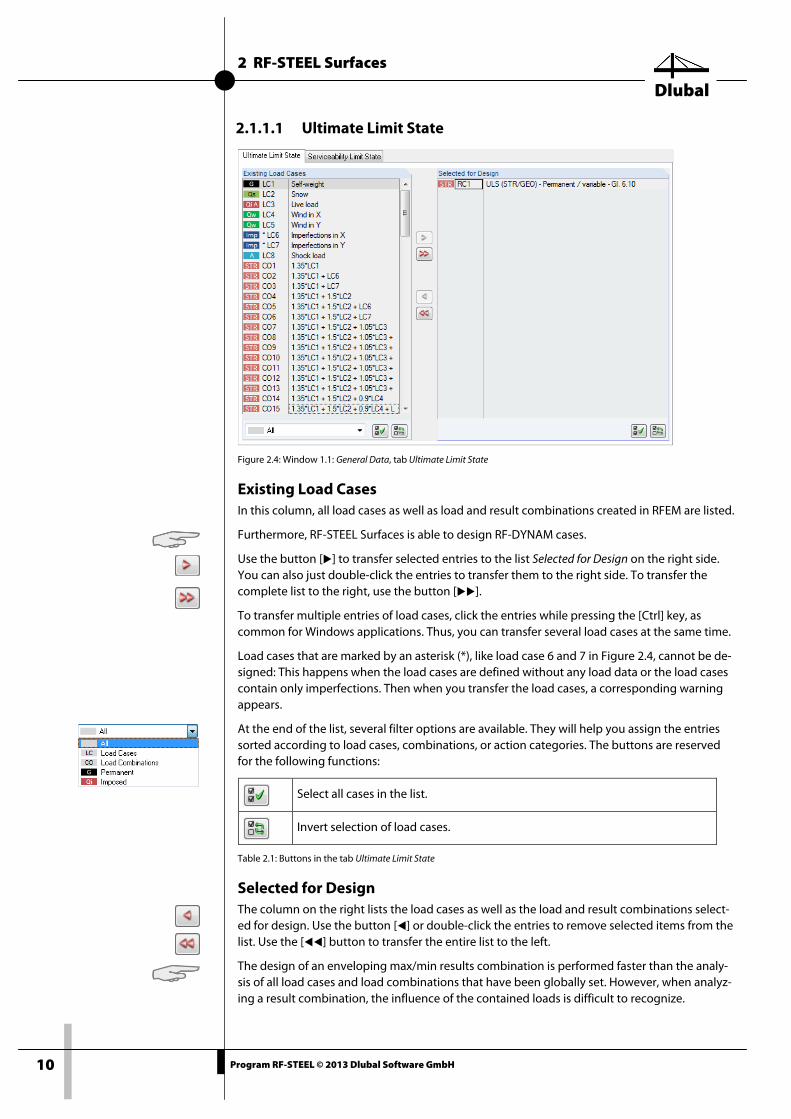
2.1.1.1 Ultimate Limit State
Figure 2.4: Window 1.1: General Data, tab Ultimate Limit State
Existing Load Cases In this column, all load cases as well as load and result combinations created in RFEM are listed.
Furthermore, RF-STEEL Surfaces is able to design RF-DYNAM cases.
Use the button [] to transfer selected entries to the list Selected for Design on the right side. You can also just double-click the entries to transfer them to the right side. To transfer the complete list to the right, use the button [].
To transfer multiple entries of load cases, click the entries while pressing the [Ctrl] key, as common for Windows applications. Thus, you can transfer several load cases at the same time.
Load cases that are marked by an asterisk (*), like load case 6 and 7 in Figure 2.4, cannot be de-signed: This happens when the load cases are defined without any load data or the load cases contain only imperfections. Then when you transfer the load cases, a corresponding warning appears.
At the end of the list, several filter options are available. They will help you assign the entries sorted according to load cases, combinations, or action categories. The buttons are reserved for the following functions:
Select all cases in the list.
Invert selection of load cases.
Table 2.1: Buttons in the tab Ultimate Limit State
Selected for Design The column on the right lists the load cases as well as the load and result combinations select-ed for design. Use the button [] or double-click the entries to remove selected items from the list. Use the [] button to transfer the entire list to the left.
The design of an enveloping max/min results combination is performed faster than the analy-sis of all load cases and load combinations that have been globally set. However, when analyz-ing a result combination, the influence of the contained loads is difficult to recognize.
2 RF-STEEL Surfaces
Dlubal
11 Program RF-STEEL © 2013 Dlubal Software GmbH
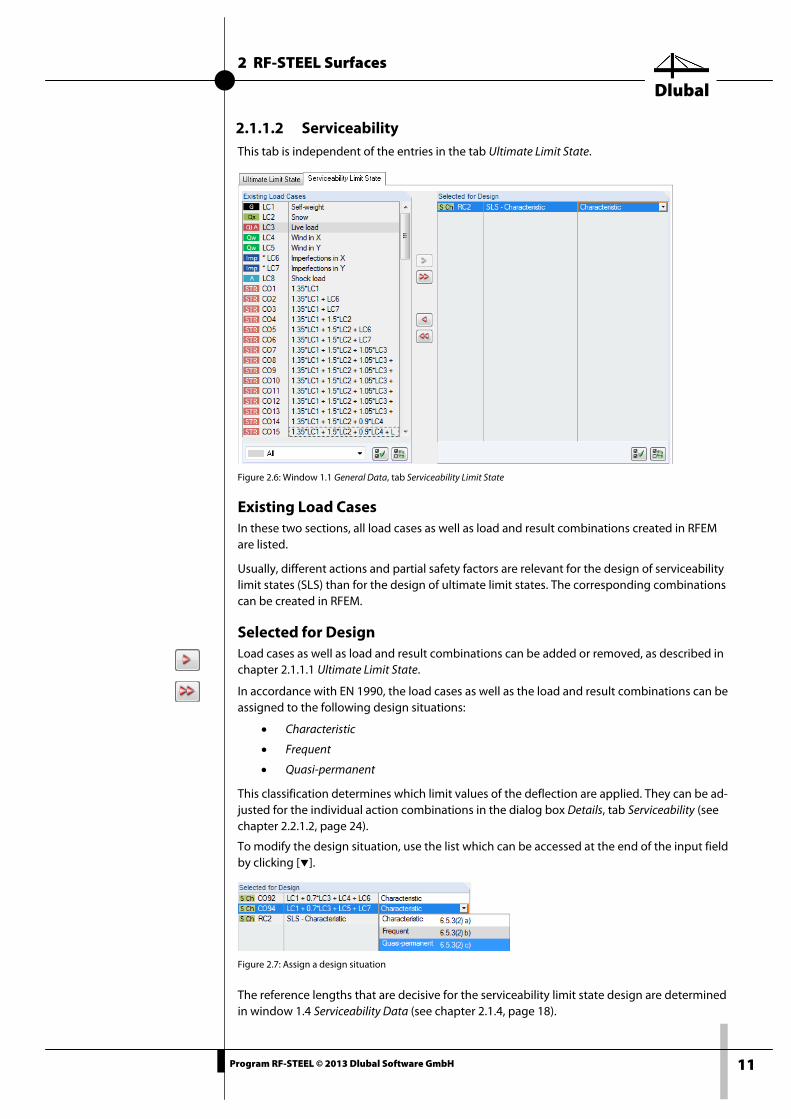
2.1.1.2 Serviceability This tab is independent of the entries in the tab Ultimate Limit State.
Figure 2.6: Window 1.1 General Data, tab Serviceability Limit State
Existing Load Cases In these two sections, all load cases as well as load and result combinations created in RFEM are listed.
Usually, different actions and partial safety factors are relevant for the design of serviceability limit states (SLS) than for the design of ultimate limit states. The corresponding combinations can be created in RFEM.
Selected for Design Load cases as well as load and result combinations can be added or removed, as described in chapter 2.1.1.1 Ultimate Limit State.
In accordance with EN 1990, the load cases as well as the load and result combinations can be assigned to the following design situations:
• Characteristic
• Frequent
• Quasi-permanent
This classification determines which limit values of the deflection are applied. They can be ad-justed for the individual action combinations in the dialog box Details, tab Serviceability (see chapter 2.2.1.2, page 24).
To modify the design situation, use the list which can be accessed at the end of the input field by clicking [].
Figure 2.7: Assign a design situation
The reference lengths that are decisive for the serviceability limit state design are determined in window 1.4 Serviceability Data (see chapter 2.1.4, page 18).
2 RF-STEEL Surfaces
Dlubal
12 Program RF-STEEL © 2013 Dlubal Software GmbH
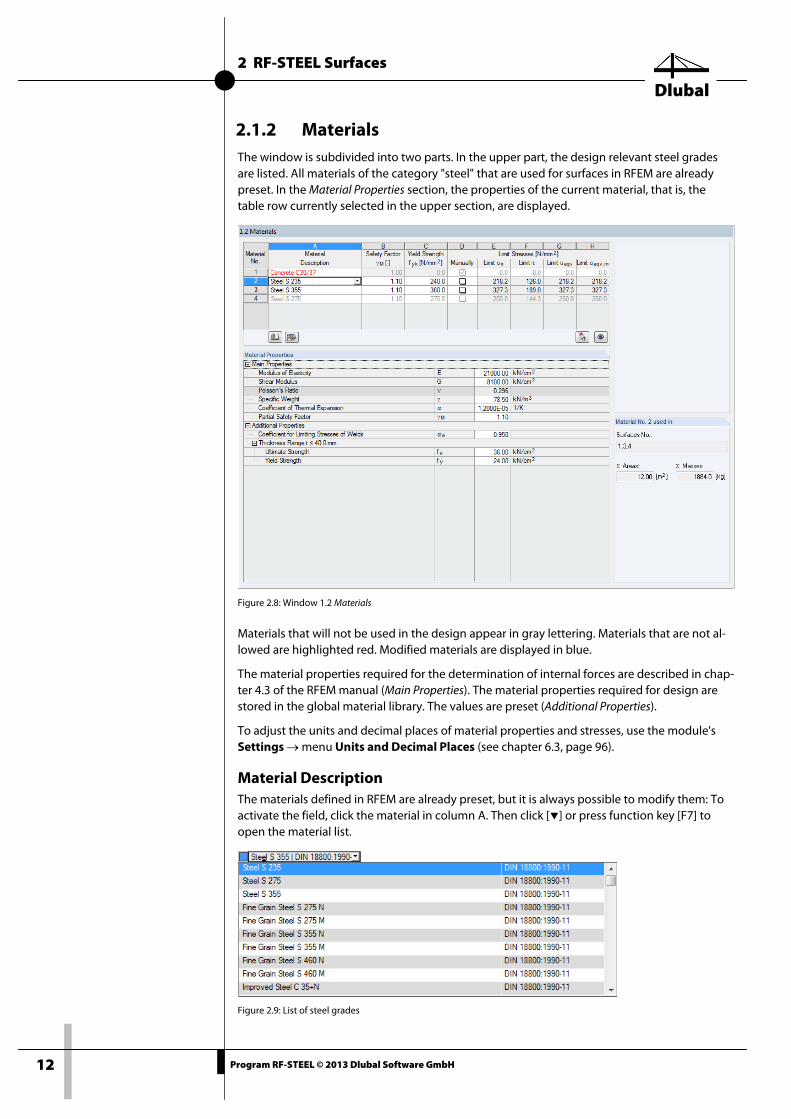
2.1.2 Materials The window is subdivided into two parts. In the upper part, the design relevant steel grades are listed. All materials of the category "steel" that are used for surfaces in RFEM are already preset. In the Material Properties section, the properties of the current material, that is, the table row currently selected in the upper section, are displayed.
Figure 2.8: Window 1.2 Materials
Materials that will not be used in the design appear in gray lettering. Materials that are not al-lowed are highlighted red. Modified materials are displayed in blue.
The material properties required for the determination of internal forces are described in chap-ter 4.3 of the RFEM manual (Main Properties). The material properties required for design are stored in the global material library. The values are preset (Additional Properties).
To adjust the units and decimal places of material properties and stresses, use the module's Settings → menu Units and Decimal Places (see chapter 6.3, page 96).
Material Description The materials defined in RFEM are already preset, but it is always possible to modify them: To activate the field, click the material in column A. Then click [] or press function key [F7] to open the material list.
Figure 2.9: List of steel grades
2 RF-STEEL Surfaces
Dlubal
13 Program RF-STEEL © 2013 Dlubal Software GmbH
Only "Steel" materials are available in the list. In principle, you can carry out the design with other materials if their stress design concept is based on the comparison of existing normal, shear, and equivalent stresses with allowable stresses (for example the design of cross-sections consisting of aluminum or stainless steel). Of course, you must take into account further stand-ard specifications additionally.
When you have imported a material, the design relevant Material Properties are updated.
Limit stresses of a material that is not allowed (for example coniferous timber) can be defined by means of Yield Strength (column C) or by selecting the check box Manually (column D) and entering user-defined specifications. When you have defined the allowable stresses in the col-umns E to G, the red color will disappear.
The import of materials from the library is described later.
Safety Factor γM
This factor describes the safety factor contained in the design values of the material stiffnesses. Therefore, M is indicated. By means of the factor γM, the characteristic value of the yield strength fyk is reduced in order to determine the limit normal stress σR,d (see Equation 2.1) and the limit shear stress τR,d (Equation 2.2).
Yield Strength fy,k
The yield strength describes the limit to which the material can be strained without plastic deformation. The characteristic values of several steel grades can be found, for example, in EN 1993-1-1, section 3 or DIN 18800 part 1, section 4.
When modifying the yield strength, the limit stresses in the columns E, F and G are adjusted automatically.
For some materials, there is a relation between the characteristic yield strength fy,k and the thickness t of the relevant structural component. In the section Material Properties, the Thick-ness Range of the material selected above is shown with the corresponding yield strength.
The zones of the yield strength are specified in the standards, for example in DIN 18800 part 1, table 1. Click [Edit] to control and, if required, adjust the thicknesses of structural components including yield strength (see Figure 3.8, page 46).
Limit Stresses The limit stresses of materials that are stored in the material library are preset.
If you want to adjust the limit stresses, you can use the check box Manually or the button [Edit Material] (see Figure 3.8, page 46).
Manually
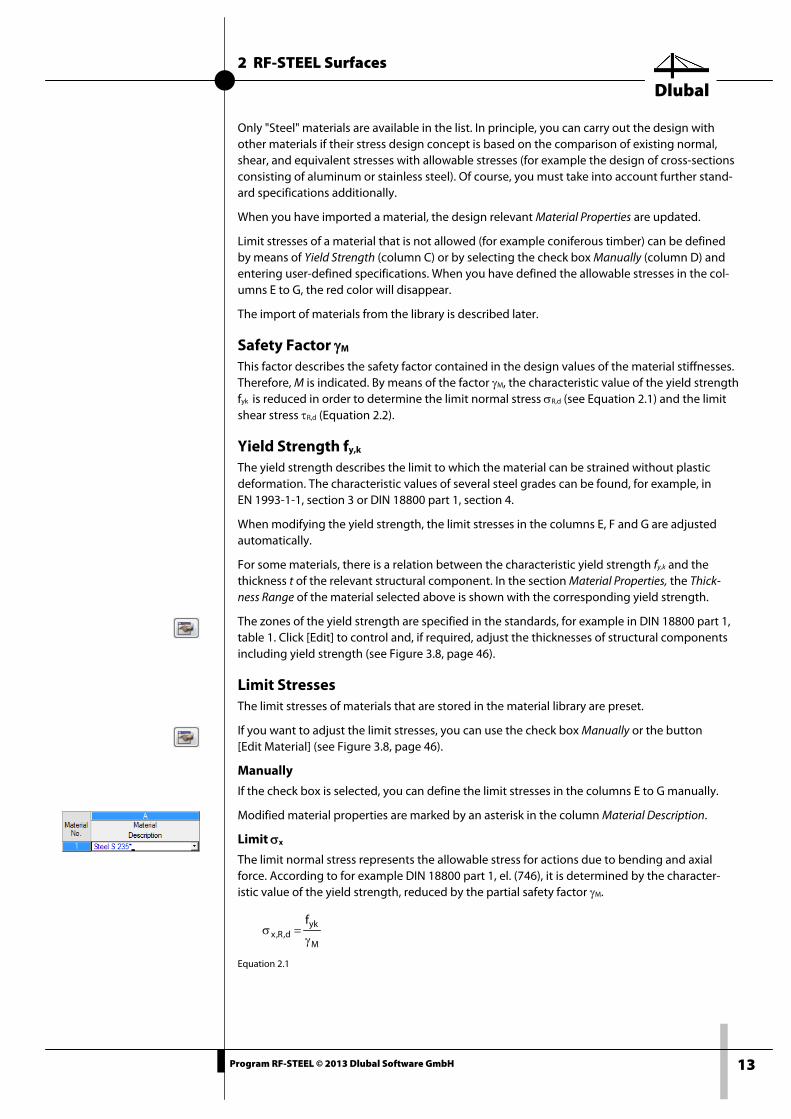
If the check box is selected, you can define the limit stresses in the columns E to G manually.
Modified material properties are marked by an asterisk in the column Material Description.
Limit σx
The limit normal stress represents the allowable stress for actions due to bending and axial force. According to for example DIN 18800 part 1, el. (746), it is determined by the character-istic value of the yield strength, reduced by the partial safety factor γM.
M
ykd,R,x
f
γ=σ
Equation 2.1
2 RF-STEEL Surfaces
Dlubal
14 Program RF-STEEL © 2013 Dlubal Software GmbH
Limit τ
The limit shear stress indicates the allowable shear stress due to shear force and torsion. To determine the limit shear stress according to DIN 18800 part 1, el. (746), the partial safety factor γM is also included in the equation used to determine the limit shear stress.
3
f
M
ykd,R
⋅γ=τ
Equation 2.2
Limit σeqv
The limit equivalent stress represents the allowable equivalent stress for the simultaneous ef-fect of several stresses. According to DIN 18800 part 1, el. (746), it is determined by Equation 2.1.
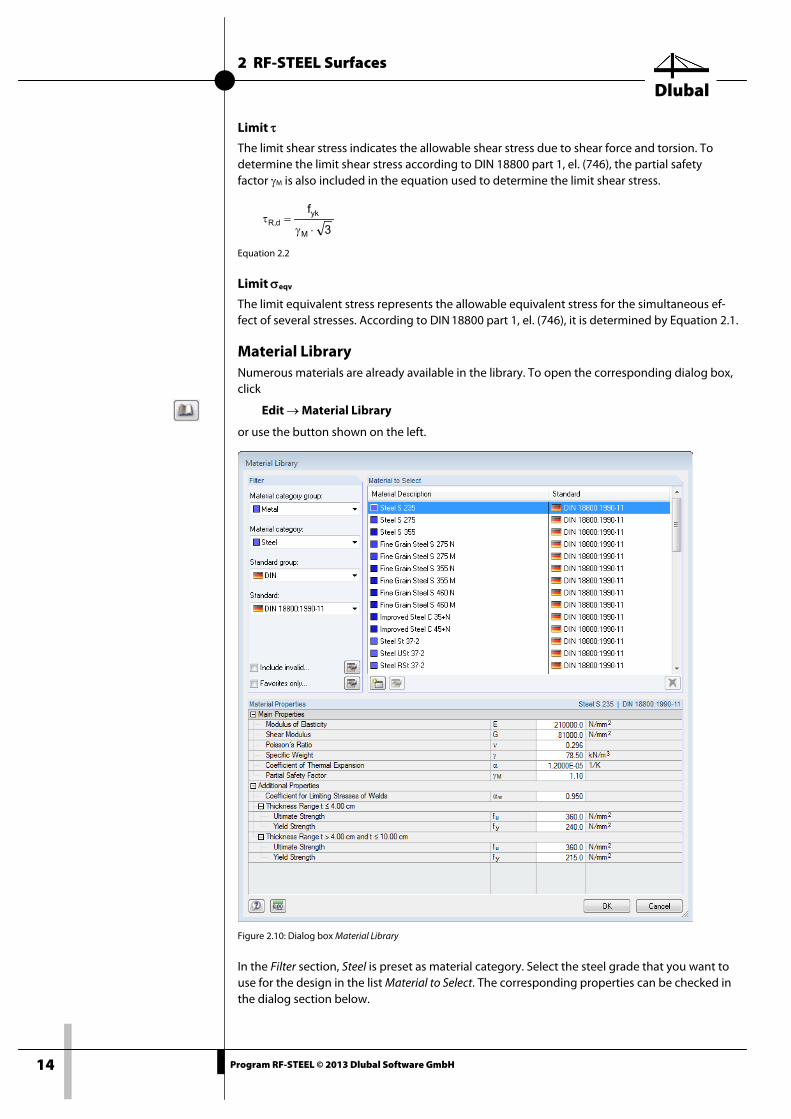
Material Library Numerous materials are already available in the library. To open the corresponding dialog box, click
Edit → Material Library
or use the button shown on the left.
Figure 2.10: Dialog box Material Library
In the Filter section, Steel is preset as material category. Select the steel grade that you want to use for the design in the list Material to Select. The corresponding properties can be checked in the dialog section below.
2 RF-STEEL Surfaces
Dlubal
15 Program RF-STEEL © 2013 Dlubal Software GmbH
Click [OK] or use the [↵] button to transfer the selected material to window 1.2 of the add-on module RF-STEEL Surfaces.
Chapter 4.3 in the RFEM manual describes in detail how materials can be filtered, added, or rearranged.
You can also select materials of categories like Cast Iron or Stainless Steel. Please check, how-ever, whether these materials are allowed by the standard's design concept.
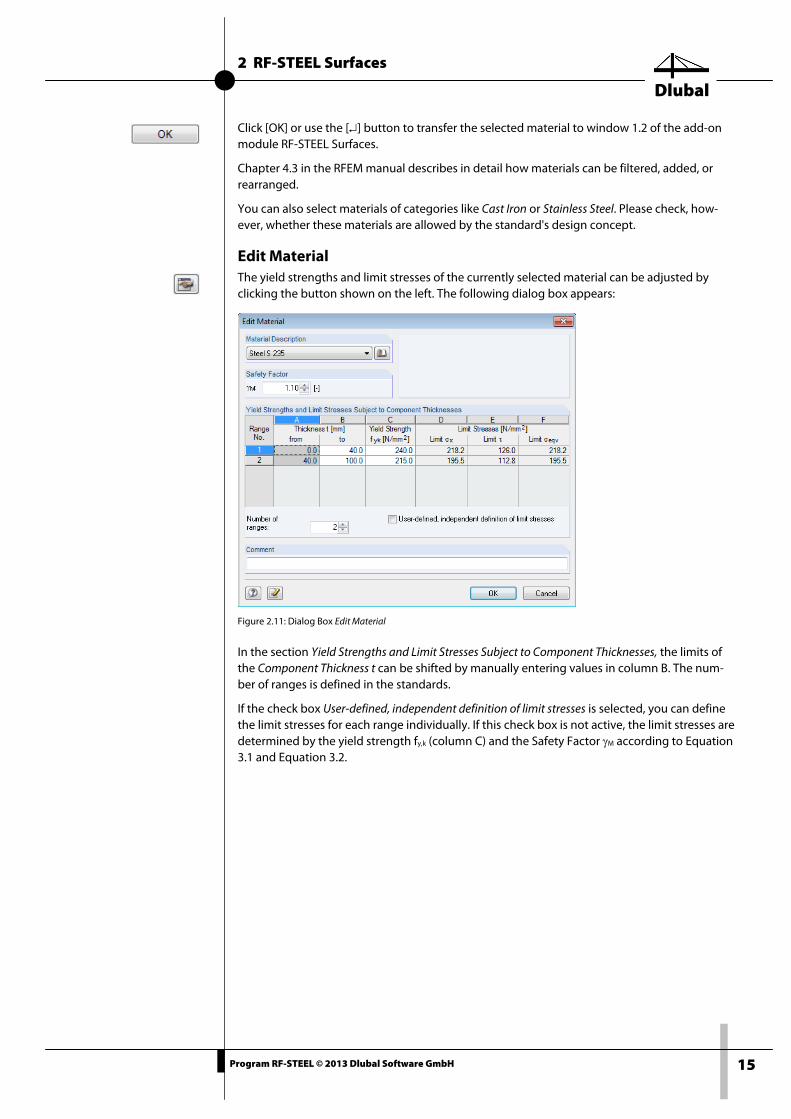
Edit Material The yield strengths and limit stresses of the currently selected material can be adjusted by clicking the button shown on the left. The following dialog box appears:
Figure 2.11: Dialog Box Edit Material
In the section Yield Strengths and Limit Stresses Subject to Component Thicknesses, the limits of the Component Thickness t can be shifted by manually entering values in column B. The num-ber of ranges is defined in the standards.
If the check box User-defined, independent definition of limit stresses is selected, you can define the limit stresses for each range individually. If this check box is not active, the limit stresses are determined by the yield strength fy,k (column C) and the Safety Factor γM according to Equation 3.1 and Equation 3.2.
2 RF-STEEL Surfaces
Dlubal
16 Program RF-STEEL © 2013 Dlubal Software GmbH
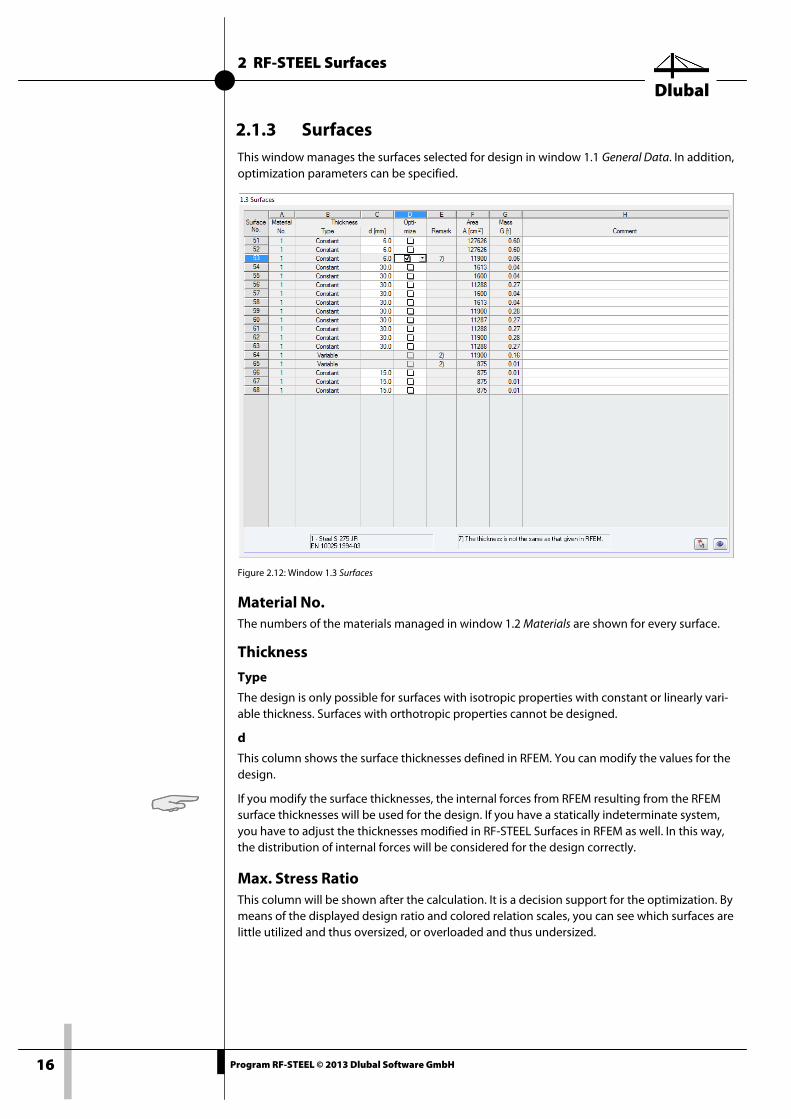
2.1.3 Surfaces This window manages the surfaces selected for design in window 1.1 General Data. In addition, optimization parameters can be specified.
Figure 2.12: Window 1.3 Surfaces
Material No. The numbers of the materials managed in window 1.2 Materials are shown for every surface.
Thickness
Type
The design is only possible for surfaces with isotropic properties with constant or linearly vari-able thickness. Surfaces with orthotropic properties cannot be designed.
d
This column shows the surface thicknesses defined in RFEM. You can modify the values for the design.
If you modify the surface thicknesses, the internal forces from RFEM resulting from the RFEM surface thicknesses will be used for the design. If you have a statically indeterminate system, you have to adjust the thicknesses modified in RF-STEEL Surfaces in RFEM as well. In this way, the distribution of internal forces will be considered for the design correctly.
Max. Stress Ratio This column will be shown after the calculation. It is a decision support for the optimization. By means of the displayed design ratio and colored relation scales, you can see which surfaces are little utilized and thus oversized, or overloaded and thus undersized.
2 RF-STEEL Surfaces
Dlubal
17 Program RF-STEEL © 2013 Dlubal Software GmbH
Optimize For each surface, you can carry out an optimization process. For the RFEM internal forces, the program determines the surface thickness that comes as close as possible to a user-defined maximum ratio. The maximum ratio can be defined in the dialog box Details, tab Options (see Figure 2.17, page 25).
If you want to optimize a surface, select the corresponding check box in column D or E. Recom-mendations for optimization can be found in chapter 6.2.1 on page 92.
Remark This column shows remarks in the form of footers that are described in detail in the status bar.
Area A This column gives information about the area of each surface.
Mass G This column indicates the mass of the respective surface.
Comment The input fields in this column allow you to enter user-defined notes.
The buttons at the bottom right are reserved for the following functions:
Table 2.2: Buttons in window 1.3 Surfaces
Button Function
Jumps to the RFEM work window to adjust the view
Allows you to pick a surface in the RFEM work window
2 RF-STEEL Surfaces
Dlubal
18 Program RF-STEEL © 2013 Dlubal Software GmbH
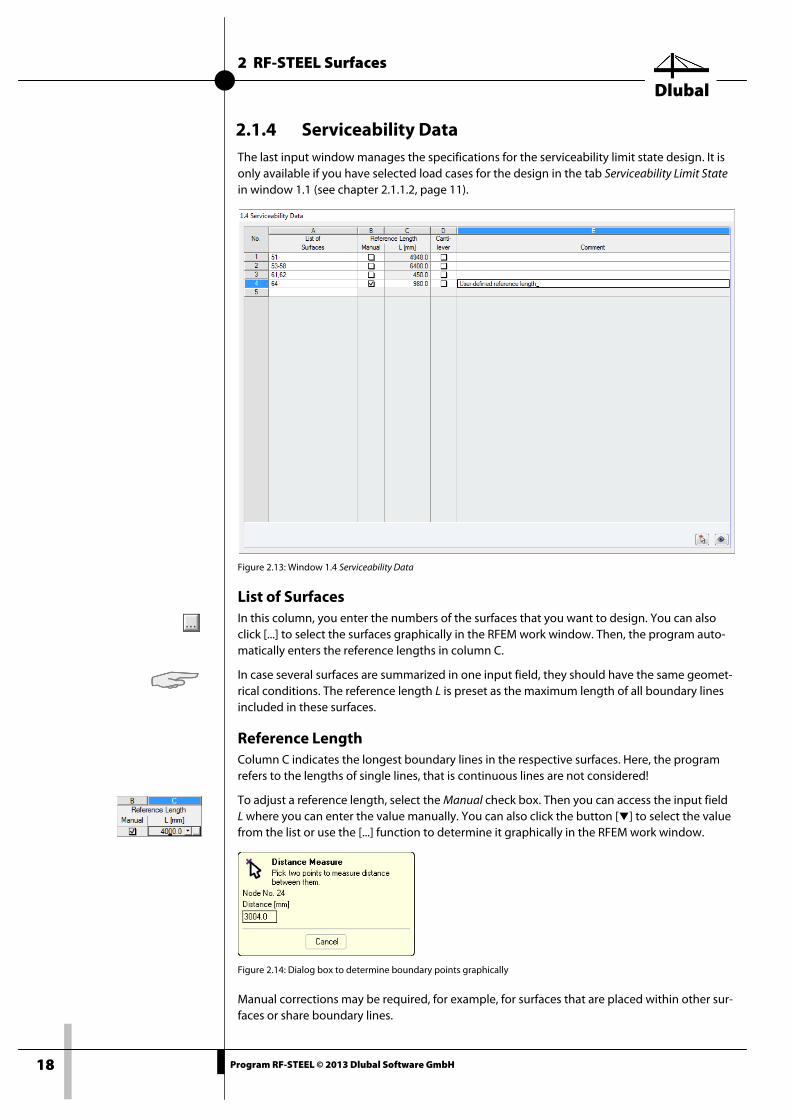
2.1.4 Serviceability Data The last input window manages the specifications for the serviceability limit state design. It is only available if you have selected load cases for the design in the tab Serviceability Limit State in window 1.1 (see chapter 2.1.1.2, page 11).
Figure 2.13: Window 1.4 Serviceability Data
List of Surfaces In this column, you enter the numbers of the surfaces that you want to design. You can also click [...] to select the surfaces graphically in the RFEM work window. Then, the program auto-matically enters the reference lengths in column C.
In case several surfaces are summarized in one input field, they should have the same geomet-rical conditions. The reference length L is preset as the maximum length of all boundary lines included in these surfaces.
Reference Length Column C indicates the longest boundary lines in the respective surfaces. Here, the program refers to the lengths of single lines, that is continuous lines are not considered!
To adjust a reference length, select the Manual check box. Then you can access the input field L where you can enter the value manually. You can also click the button [] to select the value from the list or use the [...] function to determine it graphically in the RFEM work window.
Figure 2.14: Dialog box to determine boundary points graphically
Manual corrections may be required, for example, for surfaces that are placed within other sur-faces or share boundary lines.
2 RF-STEEL Surfaces
Dlubal
19 Program RF-STEEL © 2013 Dlubal Software GmbH
Cantilever To determine limit deformations correctly, it is also important to know if the surface is sup-ported on all sides or if it is a cantilevered surface.
If a surface in column D is defined as Cantilever, higher limit values will be used for the design of the deflection. These values can be checked and, if necessary, adjusted in the Serviceability tab of the Details dialog box, (see Figure 2.16, page 24).
2.2 Calculation Before you start the calculation by clicking [Calculation], it is recommended to check the de-sign details. The corresponding dialog box can be accessed in all windows of the add-on mod-ule by clicking [Details].
2.2.1 Detail Settings The dialog box Details has the following tabs:
• Stresses
• Serviceability
• Options
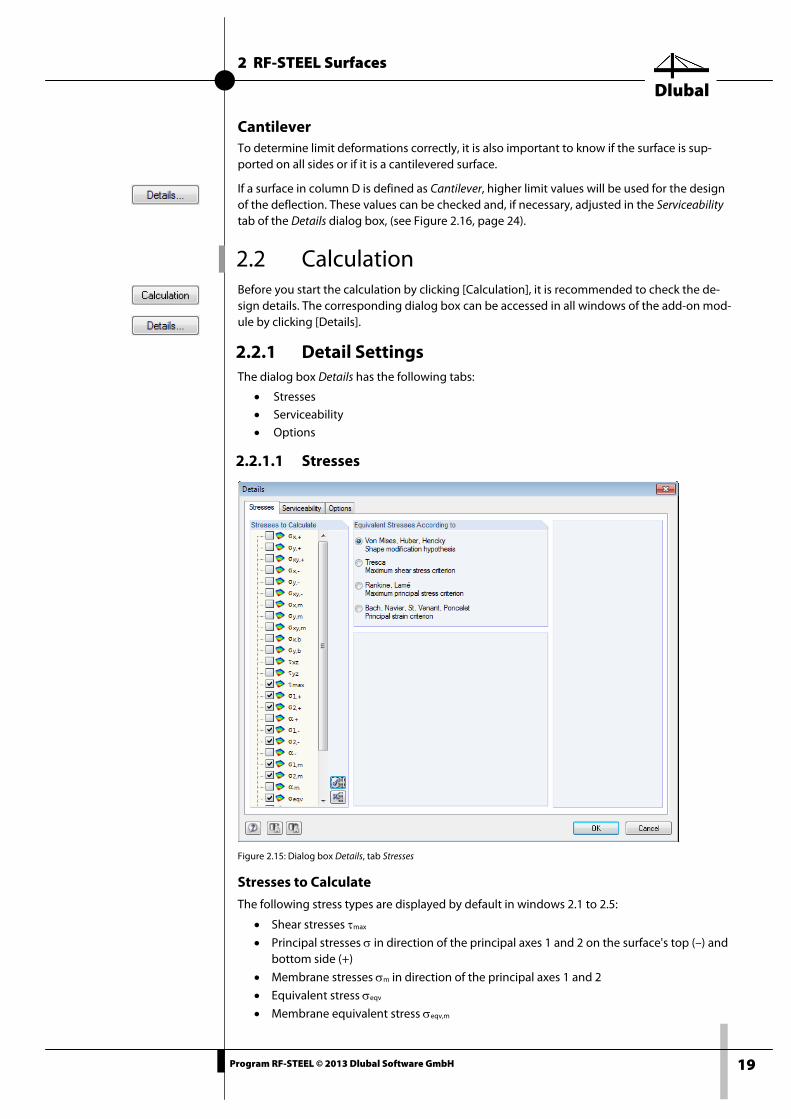
2.2.1.1 Stresses
Figure 2.15: Dialog box Details, tab Stresses
Stresses to Calculate
The following stress types are displayed by default in windows 2.1 to 2.5:
• Shear stresses τmax
• Principal stresses σ in direction of the principal axes 1 and 2 on the surface's top (–) and bottom side (+)
• Membrane stresses σm in direction of the principal axes 1 and 2
• Equivalent stress σeqv
• Membrane equivalent stress σeqv,m
2 RF-STEEL Surfaces
Dlubal
20 Program RF-STEEL © 2013 Dlubal Software GmbH
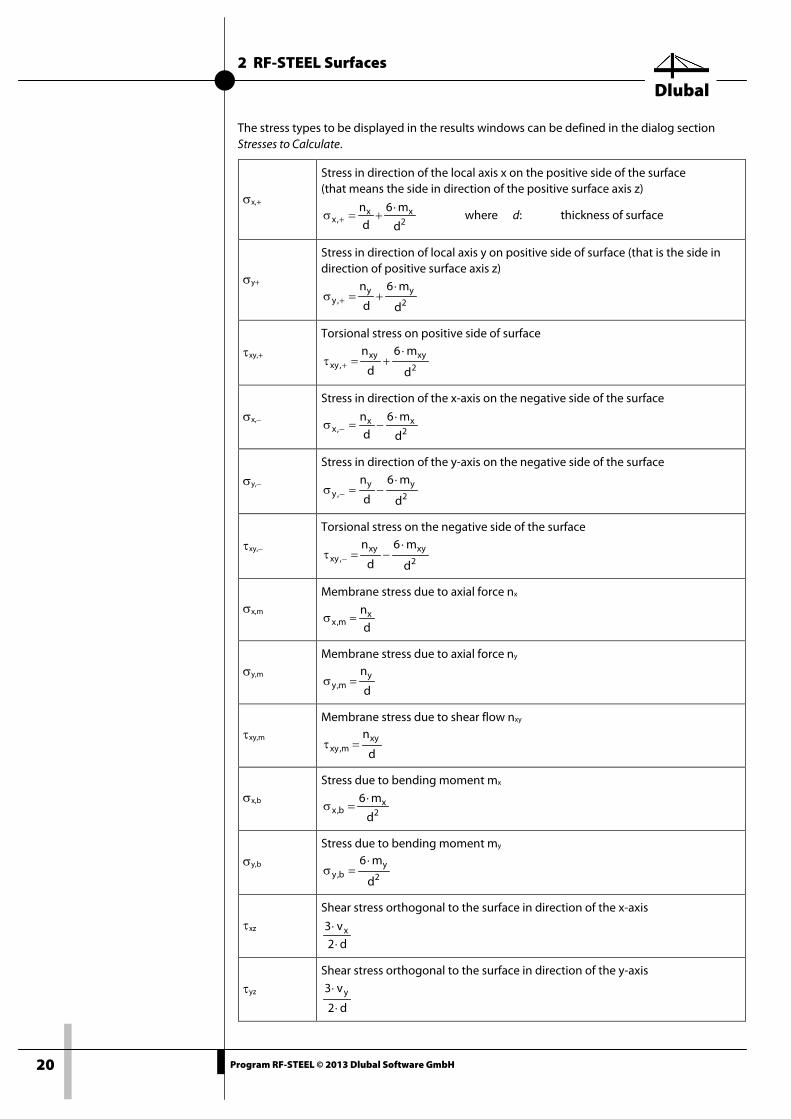
The stress types to be displayed in the results windows can be defined in the dialog section Stresses to Calculate.
σx,+
Stress in direction of the local axis x on the positive side of the surface (that means the side in direction of the positive surface axis z)
2xx
,xd
m6d
n ⋅+=σ + where d: thickness of surface
σy+
Stress in direction of local axis y on positive side of surface (that is the side in direction of positive surface axis z)
2yy
,yd
m6
d
n ⋅+=σ +
τxy,+
Torsional stress on positive side of surface
2xyxy
,xyd
m6
d
n ⋅+=τ +
σx,− Stress in direction of the x-axis on the negative side of the surface
2xx
,xd
m6
d
n ⋅−=σ −
σy,−
Stress in direction of the y-axis on the negative side of the surface
2yy
,yd
m6
d
n ⋅−=σ −
τxy,−
Torsional stress on the negative side of the surface
2xyxy
,xyd
m6
d
n ⋅−=τ −
σx,m Membrane stress due to axial force nx
dnx
m,x =σ
σy,m Membrane stress due to axial force ny
d
nym,y =σ
τxy,m Membrane stress due to shear flow nxy
d
nxym,xy =τ
σx,b
Stress due to bending moment mx
2x
b,xd
m6 ⋅=σ
σy,b Stress due to bending moment my
2y
b,yd
m6 ⋅=σ
τxz Shear stress orthogonal to the surface in direction of the x-axis
d2v3 x
⋅⋅
τyz Shear stress orthogonal to the surface in direction of the y-axis
d2
v3 y
⋅
⋅
2 RF-STEEL Surfaces
Dlubal
21 Program RF-STEEL © 2013 Dlubal Software GmbH
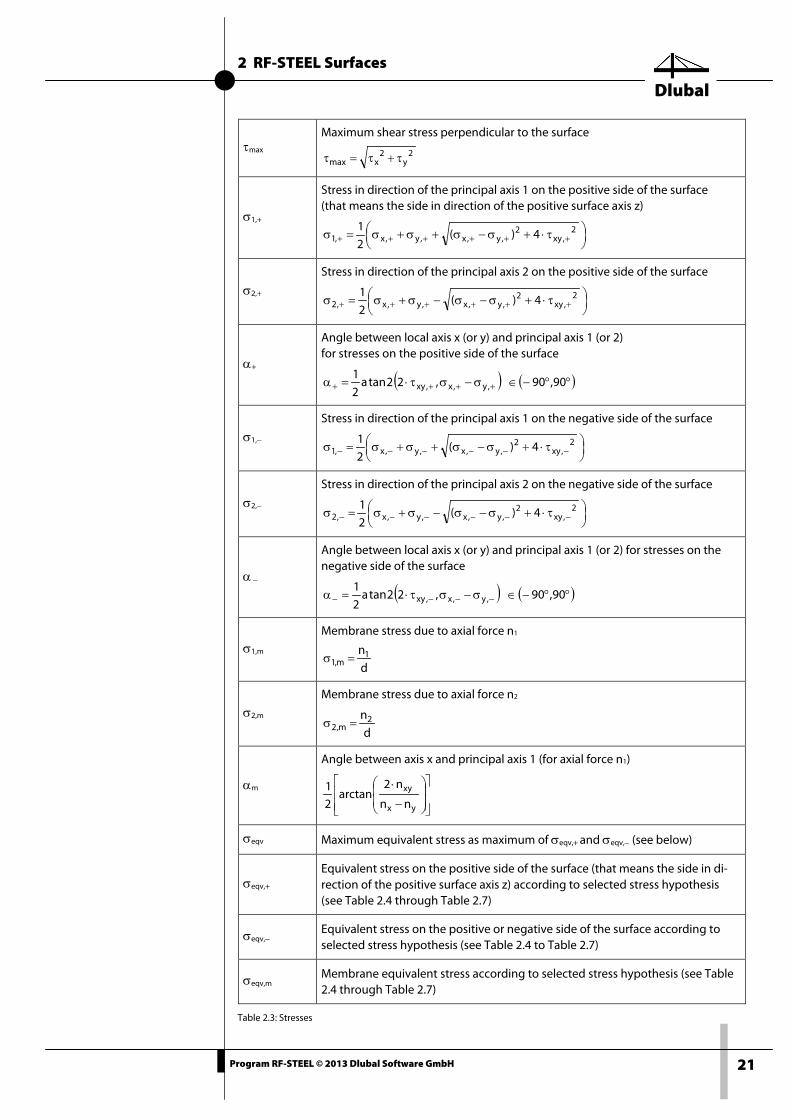
τmax Maximum shear stress perpendicular to the surface
2y
2xmax τ+τ=τ
σ1,+
Stress in direction of the principal axis 1 on the positive side of the surface (that means the side in direction of the positive surface axis z)
τ⋅+σ−σ+σ+σ=σ ++++++
2,xy
2,y,x,y,x,1 4)(
21
σ2,+ Stress in direction of the principal axis 2 on the positive side of the surface
τ⋅+σ−σ−σ+σ=σ ++++++
2,xy
2,y,x,y,x,2 4)(
21
α+
Angle between local axis x (or y) and principal axis 1 (or 2) for stresses on the positive side of the surface
( ) ( )°°−∈σ−στ⋅=α ++++ 90,90,22tana21
,y,x,xy
σ1,− Stress in direction of the principal axis 1 on the negative side of the surface
τ⋅+σ−σ+σ+σ=σ −−−−−−
2,xy
2,y,x,y,x,1 4)(
21
σ2,− Stress in direction of the principal axis 2 on the negative side of the surface
τ⋅+σ−σ−σ+σ=σ −−−−−−
2,xy
2,y,x,y,x,2 4)(
21
α −
Angle between local axis x (or y) and principal axis 1 (or 2) for stresses on the negative side of the surface
( ) ( )°°−∈σ−στ⋅=α −−−− 90,90,22tana21
,y,x,xy
σ1,m Membrane stress due to axial force n1
dn1
m,1 =σ
σ2,m Membrane stress due to axial force n2
dn2
m,2 =σ
αm
Angle between axis x and principal axis 1 (for axial force n1)
−
⋅
yx
xy
nn
n2arctan
21
σeqv Maximum equivalent stress as maximum of σeqv,+ and σeqv,− (see below)
σeqv,+ Equivalent stress on the positive side of the surface (that means the side in di-rection of the positive surface axis z) according to selected stress hypothesis (see Table 2.4 through Table 2.7)
σeqv,− Equivalent stress on the positive or negative side of the surface according to selected stress hypothesis (see Table 2.4 to Table 2.7)
σeqv,m Membrane equivalent stress according to selected stress hypothesis (see Table 2.4 through Table 2.7)
Table 2.3: Stresses
2 RF-STEEL Surfaces
Dlubal
22 Program RF-STEEL © 2013 Dlubal Software GmbH
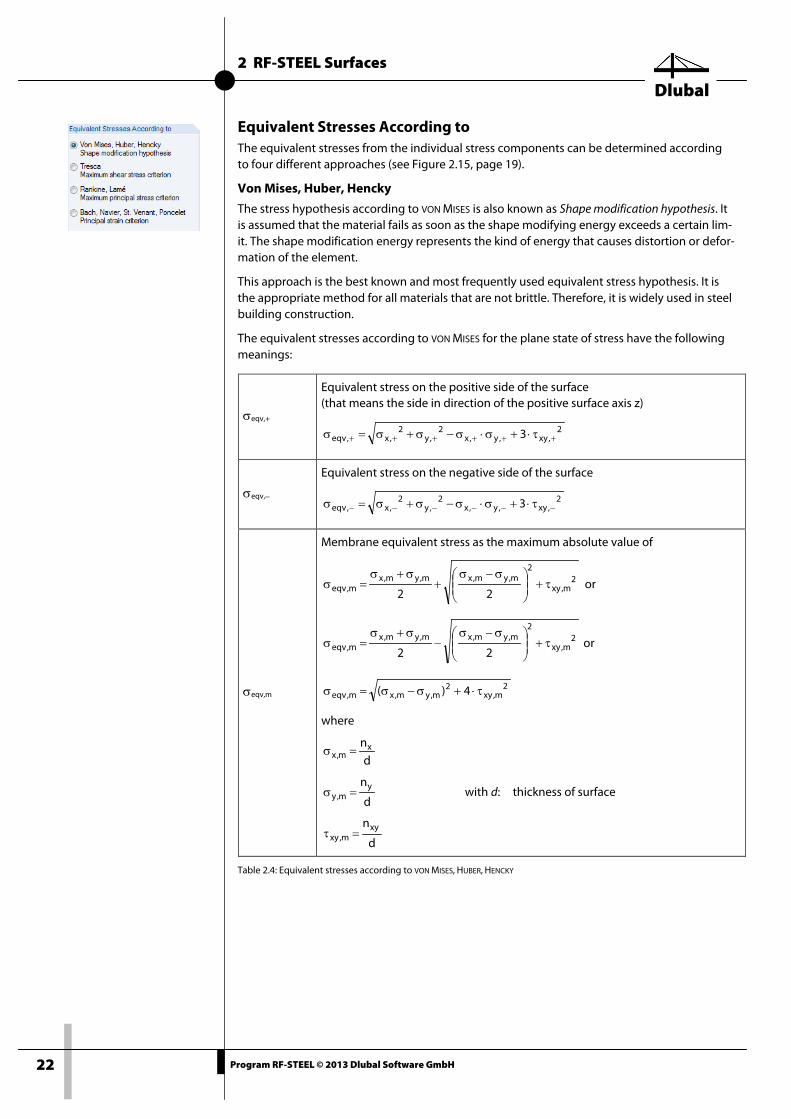
Equivalent Stresses According to The equivalent stresses from the individual stress components can be determined according to four different approaches (see Figure 2.15, page 19).
Von Mises, Huber, Hencky
The stress hypothesis according to VON MISES is also known as Shape modification hypothesis. It is assumed that the material fails as soon as the shape modifying energy exceeds a certain lim-it. The shape modification energy represents the kind of energy that causes distortion or defor-mation of the element.
This approach is the best known and most frequently used equivalent stress hypothesis. It is the appropriate method for all materials that are not brittle. Therefore, it is widely used in steel building construction.
The equivalent stresses according to VON MISES for the plane state of stress have the following meanings:
σeqv,+
Equivalent stress on the positive side of the surface (that means the side in direction of the positive surface axis z)
2,xy,y,x
2,y
2,x,eqv 3 ++++++ τ⋅+σ⋅σ−σ+σ=σ
σeqv,−
Equivalent stress on the negative side of the surface
2,xy,y,x
2,y
2,x,eqv 3 −−−−−− τ⋅+σ⋅σ−σ+σ=σ
σeqv,m
Membrane equivalent stress as the maximum absolute value of
2m,xy
2m,ym,xm,ym,x
m,eqv 22τ+
σ−σ+
σ+σ=σ or
2m,xy
2m,ym,xm,ym,x
m,eqv 22τ+
σ−σ−
σ+σ=σ or
2m,xy
2m,ym,xm,eqv 4)( τ⋅+σ−σ=σ
where
dnx
m,x =σ
d
nym,y =σ with d: thickness of surface
d
nxym,xy =τ
Table 2.4: Equivalent stresses according to VON MISES, HUBER, HENCKY
2 RF-STEEL Surfaces
Dlubal
23 Program RF-STEEL © 2013 Dlubal Software GmbH
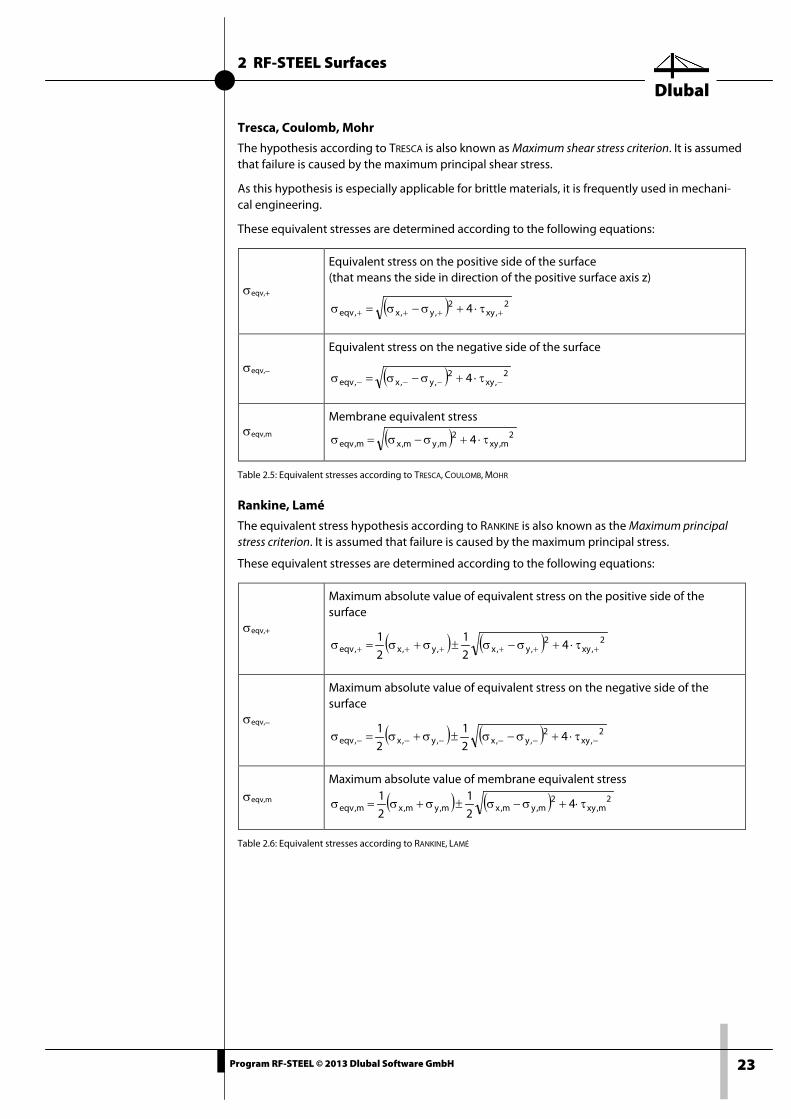
Tresca, Coulomb, Mohr
The hypothesis according to TRESCA is also known as Maximum shear stress criterion. It is assumed that failure is caused by the maximum principal shear stress.
As this hypothesis is especially applicable for brittle materials, it is frequently used in mechani-cal engineering.
These equivalent stresses are determined according to the following equations:
σeqv,+
Equivalent stress on the positive side of the surface (that means the side in direction of the positive surface axis z)
( ) 2,xy
2,y,x,eqv 4 ++++ τ⋅+σ−σ=σ
σeqv,−
Equivalent stress on the negative side of the surface
( ) 2,xy
2,y,x,eqv 4 −−−− τ⋅+σ−σ=σ
σeqv,m
Membrane equivalent stress
( ) 2m,xy
2m,ym,xm,eqv 4 τ⋅+σ−σ=σ
Table 2.5: Equivalent stresses according to TRESCA, COULOMB, MOHR
Rankine, Lamé
The equivalent stress hypothesis according to RANKINE is also known as the Maximum principal stress criterion. It is assumed that failure is caused by the maximum principal stress.
These equivalent stresses are determined according to the following equations:
σeqv,+
Maximum absolute value of equivalent stress on the positive side of the surface
( ) ( ) 2,xy
2,y,x,y,x,eqv 4
21
21
++++++ τ⋅+σ−σ±σ+σ=σ
σeqv,−
Maximum absolute value of equivalent stress on the negative side of the surface
( ) ( ) 2,xy
2,y,x,y,x,eqv 4
21
21
−−−−−− τ⋅+σ−σ±σ+σ=σ
σeqv,m
Maximum absolute value of membrane equivalent stress
( ) ( ) 2m,xy
2m,ym,xm,ym,xm,eqv 4
21
21
τ⋅+σ−σ±σ+σ=σ
Table 2.6: Equivalent stresses according to RANKINE, LAMÉ
2 RF-STEEL Surfaces
Dlubal
24 Program RF-STEEL © 2013 Dlubal Software GmbH
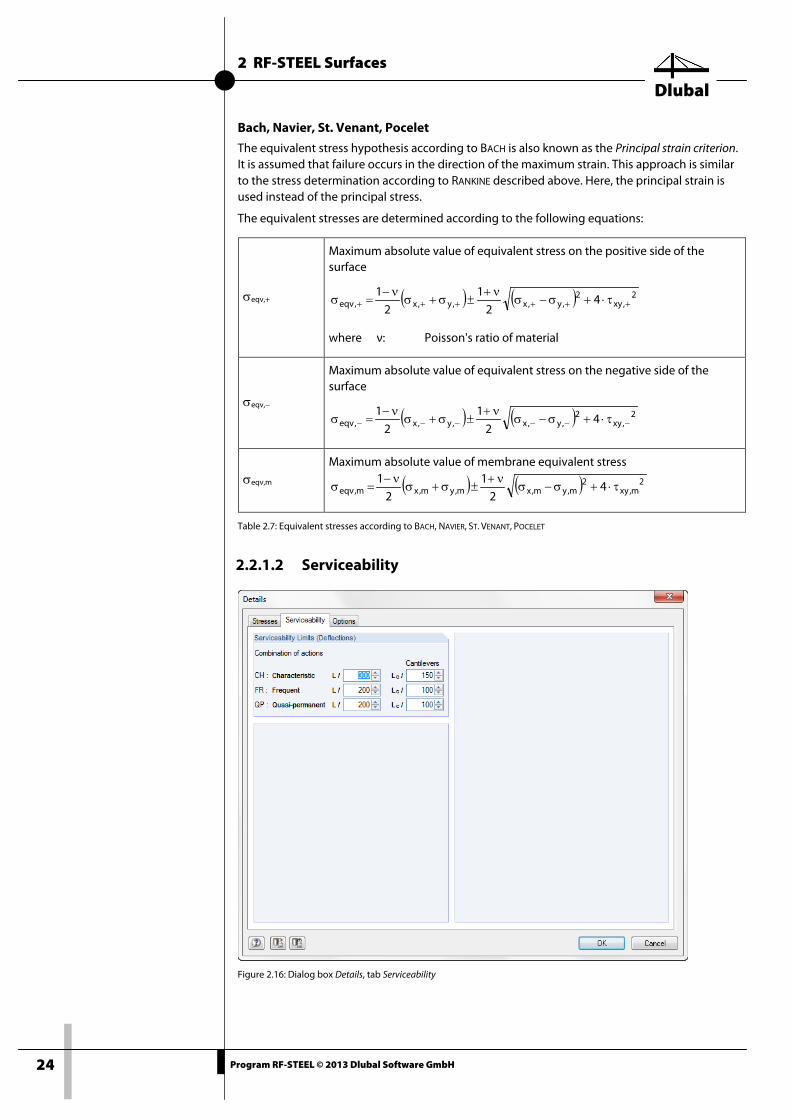
Bach, Navier, St. Venant, Pocelet
The equivalent stress hypothesis according to BACH is also known as the Principal strain criterion. It is assumed that failure occurs in the direction of the maximum strain. This approach is similar to the stress determination according to RANKINE described above. Here, the principal strain is used instead of the principal stress.
The equivalent stresses are determined according to the following equations:
σeqv,+
Maximum absolute value of equivalent stress on the positive side of the surface
( ) ( ) 2,xy
2,y,x,y,x,eqv 4
21
21
++++++ τ⋅+σ−σν+
±σ+σν−
=σ
where ν: Poisson's ratio of material
σeqv,−
Maximum absolute value of equivalent stress on the negative side of the surface
( ) ( ) 2,xy
2,y,x,y,x,eqv 4
21
21
−−−−−− τ⋅+σ−σν+
±σ+σν−
=σ
σeqv,m
Maximum absolute value of membrane equivalent stress
( ) ( ) 2m,xy
2m,ym,xm,ym,xm,eqv 4
21
21
τ⋅+σ−σν+
±σ+σν−
=σ
Table 2.7: Equivalent stresses according to BACH, NAVIER, ST. VENANT, POCELET
2.2.1.2 Serviceability
Figure 2.16: Dialog box Details, tab Serviceability
2 RF-STEEL Surfaces
Dlubal
25 Program RF-STEEL © 2013 Dlubal Software GmbH
The six input fields are used to manage the Serviceability Limits of the allowable deflections. It is possible to enter specific settings for the different action combinations –
• Characteristic
• Frequent
• Quasi-permanent
– as well as for both-sided and one-sided supported surfaces.
The classification of action combinations is determined in the Serviceability Limit State tab of table 1.1 General Data (see chapter 2.1.1.2, page 11).
The reference lengths L are defined for each surface in window 1.4 Serviceability Data (see chapter 2.1.4, page 18).
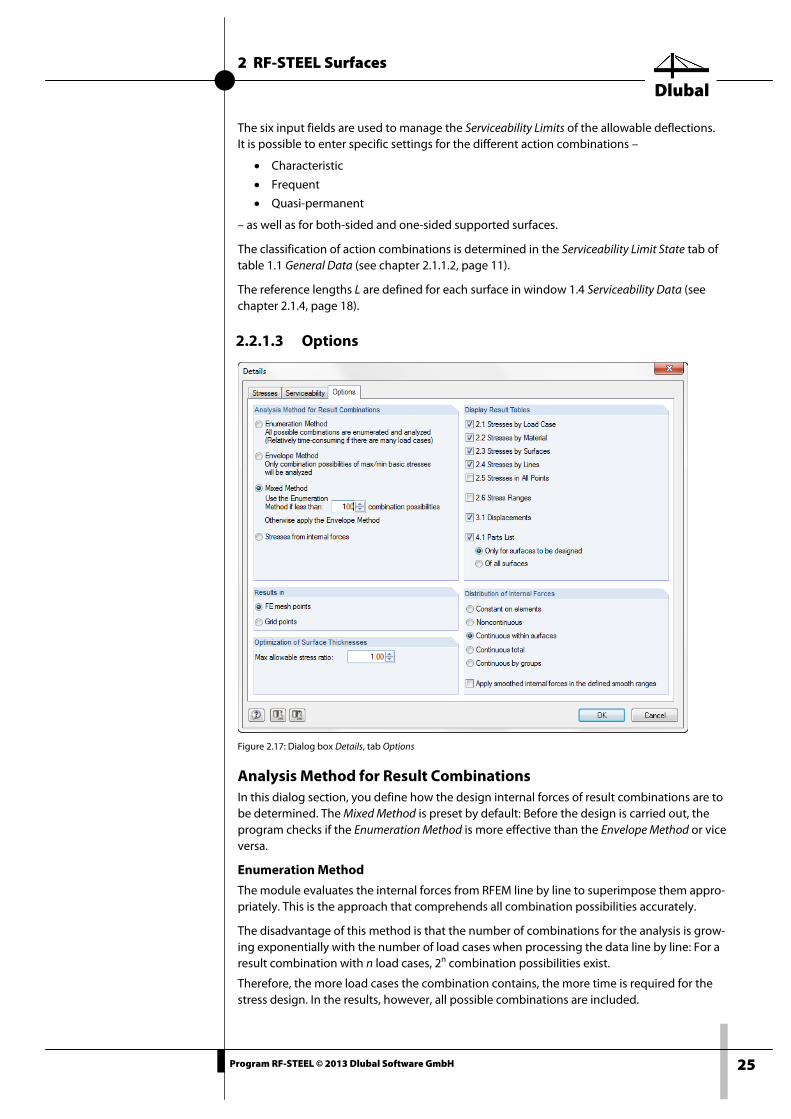
2.2.1.3 Options
Figure 2.17: Dialog box Details, tab Options
Analysis Method for Result Combinations In this dialog section, you define how the design internal forces of result combinations are to be determined. The Mixed Method is preset by default: Before the design is carried out, the program checks if the Enumeration Method is more effective than the Envelope Method or vice versa.
Enumeration Method
The module evaluates the internal forces from RFEM line by line to superimpose them appro-priately. This is the approach that comprehends all combination possibilities accurately.
The disadvantage of this method is that the number of combinations for the analysis is grow-ing exponentially with the number of load cases when processing the data line by line: For a result combination with n load cases, 2n combination possibilities exist.
Therefore, the more load cases the combination contains, the more time is required for the stress design. In the results, however, all possible combinations are included.
2 RF-STEEL Surfaces
Dlubal
26 Program RF-STEEL © 2013 Dlubal Software GmbH
Envelope Method
The module considers only the extreme values of the internal forces of each load case to com-bine them subsequently. In this way, this approach might not comprehend the most unfavor-able combinations that would be included in a line by line process. However, the computing time for a relatively large number of load cases in a result combination is quite acceptable when this kind of method is used.
As only the maximum values are analyzed, the designs may be incorrect. Combinations with load cases whose effective directions tend to be orthogonal must be handled carefully. In such cases, a calculation according to the enumeration method is recommended to check the re-sults.
Mixed Method
Before the design is carried out, the module checks how many combinations with the load cases exist. If the result combination contains, for example, seven load cases, then 27= 128 combinations of internal forces are possible (see Enumeration Method). As this number is high-er than the preset number of 100 possibilities, the design will be carried out according to the Envelope Method.
In this field, you can define the upper limit of the combination possibilities for the design ac-cording to the accurate enumeration method.
Thus, the Mixed Method represents a compromise between result accuracy and design velocity.
Stresses from internal forces
For this method, the stresses are determined directly from the surface internal forces of the re-sult combination. The internal forces are taken from the RFEM result windows 4.14 and 4.15. In this way, you can check for example result combinations created in the add-on module RF-STAGES, as this module does not calculate internal forces of load cases.
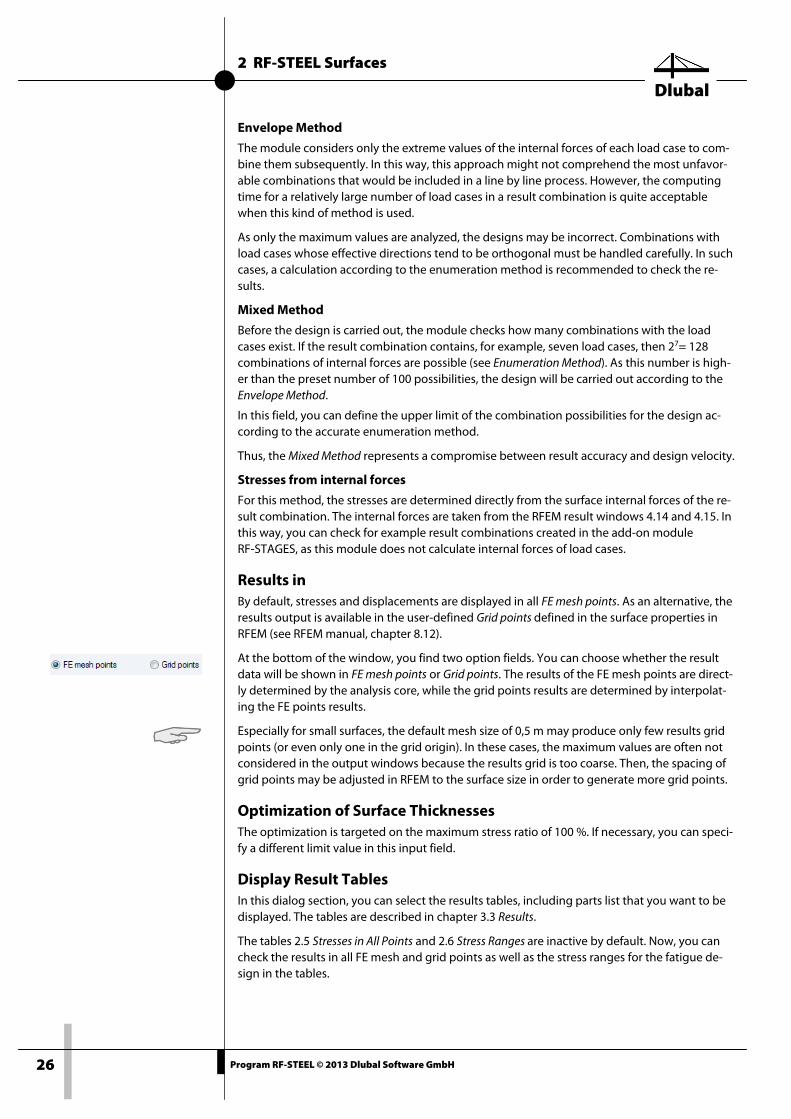
Results in By default, stresses and displacements are displayed in all FE mesh points. As an alternative, the results output is available in the user-defined Grid points defined in the surface properties in RFEM (see RFEM manual, chapter 8.12).
At the bottom of the window, you find two option fields. You can choose whether the result data will be shown in FE mesh points or Grid points. The results of the FE mesh points are direct-ly determined by the analysis core, while the grid points results are determined by interpolat-ing the FE points results.
Especially for small surfaces, the default mesh size of 0,5 m may produce only few results grid points (or even only one in the grid origin). In these cases, the maximum values are often not considered in the output windows because the results grid is too coarse. Then, the spacing of grid points may be adjusted in RFEM to the surface size in order to generate more grid points.
Optimization of Surface Thicknesses The optimization is targeted on the maximum stress ratio of 100 %. If necessary, you can speci-fy a different limit value in this input field.
Display Result Tables In this dialog section, you can select the results tables, including parts list that you want to be displayed. The tables are described in chapter 3.3 Results.
The tables 2.5 Stresses in All Points and 2.6 Stress Ranges are inactive by default. Now, you can check the results in all FE mesh and grid points as well as the stress ranges for the fatigue de-sign in the tables.
2 RF-STEEL Surfaces
Dlubal
27 Program RF-STEEL © 2013 Dlubal Software GmbH
Distribution of Internal Forces The FE analysis determines the results for each FE mesh node. However, for a continuous dis-tribution of the stresses or stress ratios in the graphic, it is necessary to smooth the results. An example can be found in the RFEM manual, chapter 9.7.1.
The smoothing option Continuous within surfaces is preset, as this provides the best graphical results in most cases. This means the values of the FE nodes are averaged. Averaging stops on the surface boundary, thus potentially resulting in discontinuities between adjacent surfaces.
For plastic material models, the option Constant on elements is recommended: The values of the FE nodes are averaged and the result is shown in the middle of the elements. The distribu-tion is constant in every element.
Apply smoothed internal forces in the defined smooth ranges
Usually, the RFEM internal forces smoothed by surface are used for design.
If you select the check box in this dialog section, the internal forces of the user-defined smooth ranges in RFEM will be used for design. The smoothed results can help reduce singularities and take into account local redistribution effects in the model.
The smooth ranges are described in the RFEM manual, chapter 9.7.3.
2.2.2 Start Calculation To start the calculation, click the [Calculation] button, which is available in all input windows.
RF-STEEL Surfaces searches for the results of the load cases as well as the load and result com-binations you want to design. If they cannot be found, the program starts the RFEM calculation to determine the design relevant internal forces.
You can also start the calculation in the RFEM user interface: The dialog box To Calculate (menu Calculate → To Calculate) lists design cases of the add-on modules like load cases and load combinations.
2 RF-STEEL Surfaces
Dlubal
28 Program RF-STEEL © 2013 Dlubal Software GmbH
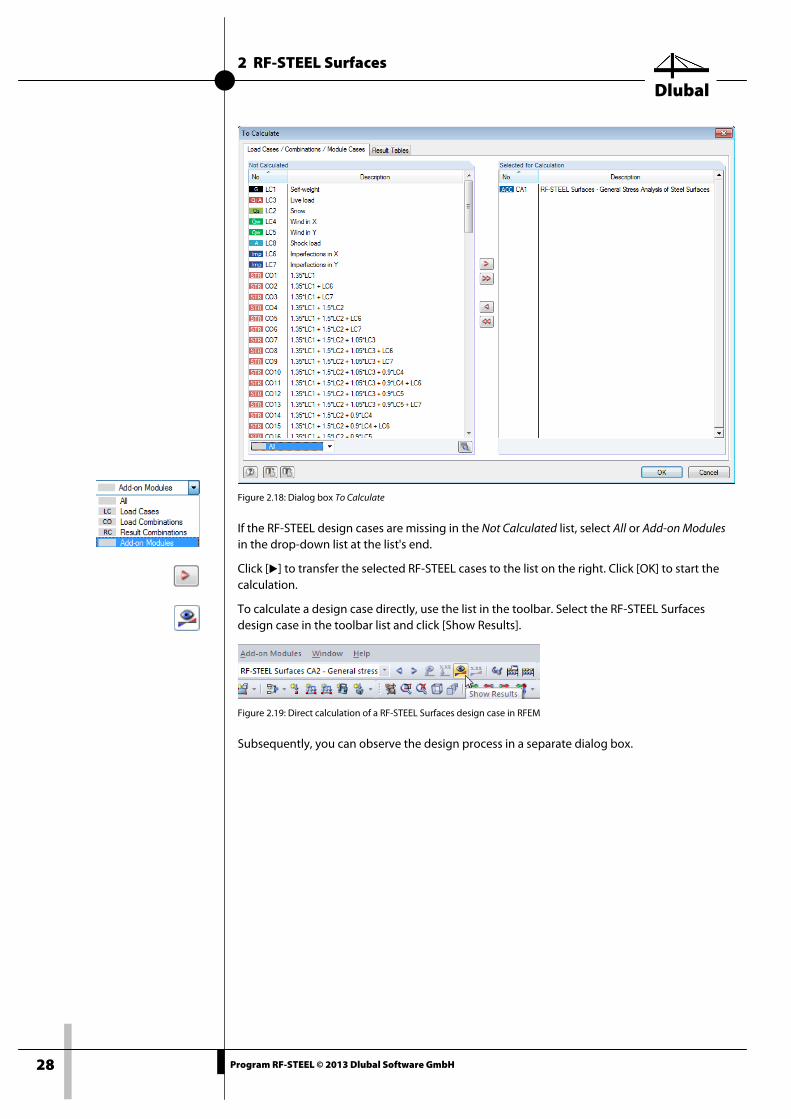
Figure 2.18: Dialog box To Calculate
If the RF-STEEL design cases are missing in the Not Calculated list, select All or Add-on Modules in the drop-down list at the list's end.
Click [] to transfer the selected RF-STEEL cases to the list on the right. Click [OK] to start the calculation.
To calculate a design case directly, use the list in the toolbar. Select the RF-STEEL Surfaces design case in the toolbar list and click [Show Results].
Figure 2.19: Direct calculation of a RF-STEEL Surfaces design case in RFEM
Subsequently, you can observe the design process in a separate dialog box.
2 RF-STEEL Surfaces
Dlubal
29 Program RF-STEEL © 2013 Dlubal Software GmbH
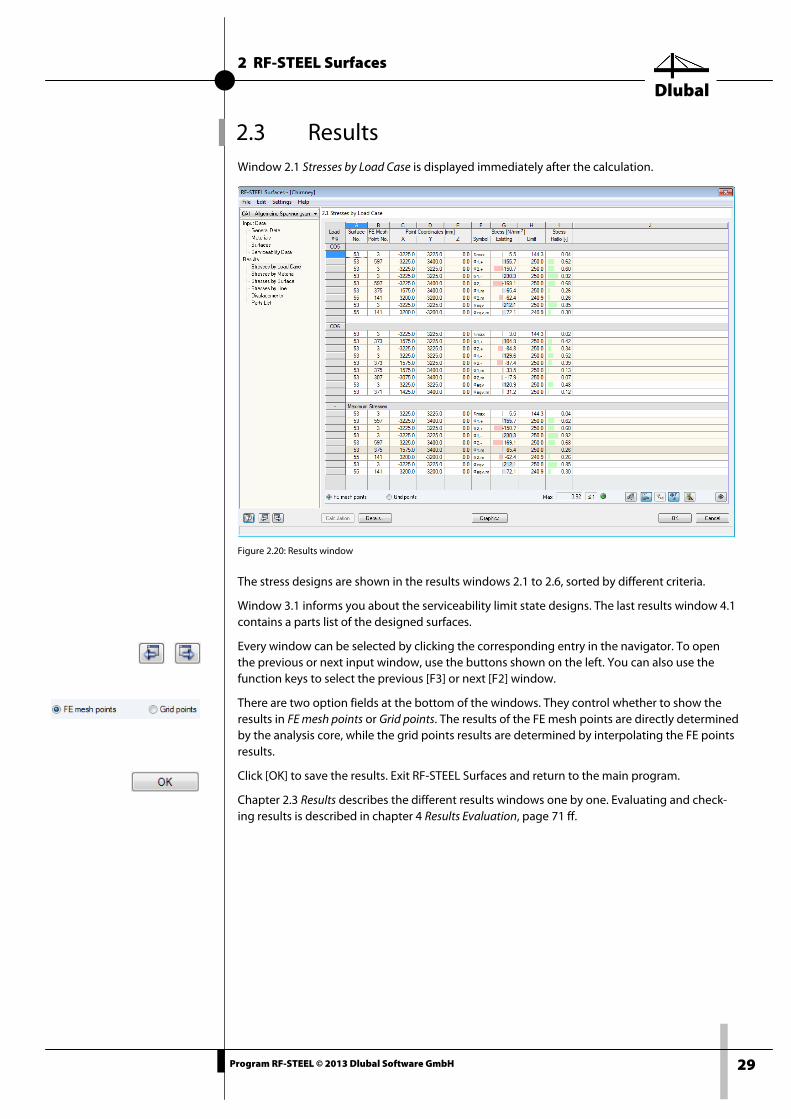
2.3 Results Window 2.1 Stresses by Load Case is displayed immediately after the calculation.
Figure 2.20: Results window
The stress designs are shown in the results windows 2.1 to 2.6, sorted by different criteria.
Window 3.1 informs you about the serviceability limit state designs. The last results window 4.1 contains a parts list of the designed surfaces.
Every window can be selected by clicking the corresponding entry in the navigator. To open the previous or next input window, use the buttons shown on the left. You can also use the function keys to select the previous [F3] or next [F2] window.
There are two option fields at the bottom of the windows. They control whether to show the results in FE mesh points or Grid points. The results of the FE mesh points are directly determined by the analysis core, while the grid points results are determined by interpolating the FE points results.
Click [OK] to save the results. Exit RF-STEEL Surfaces and return to the main program.
Chapter 2.3 Results describes the different results windows one by one. Evaluating and check-ing results is described in chapter 4 Results Evaluation, page 71 ff.
2 RF-STEEL Surfaces
Dlubal
30 Program RF-STEEL © 2013 Dlubal Software GmbH
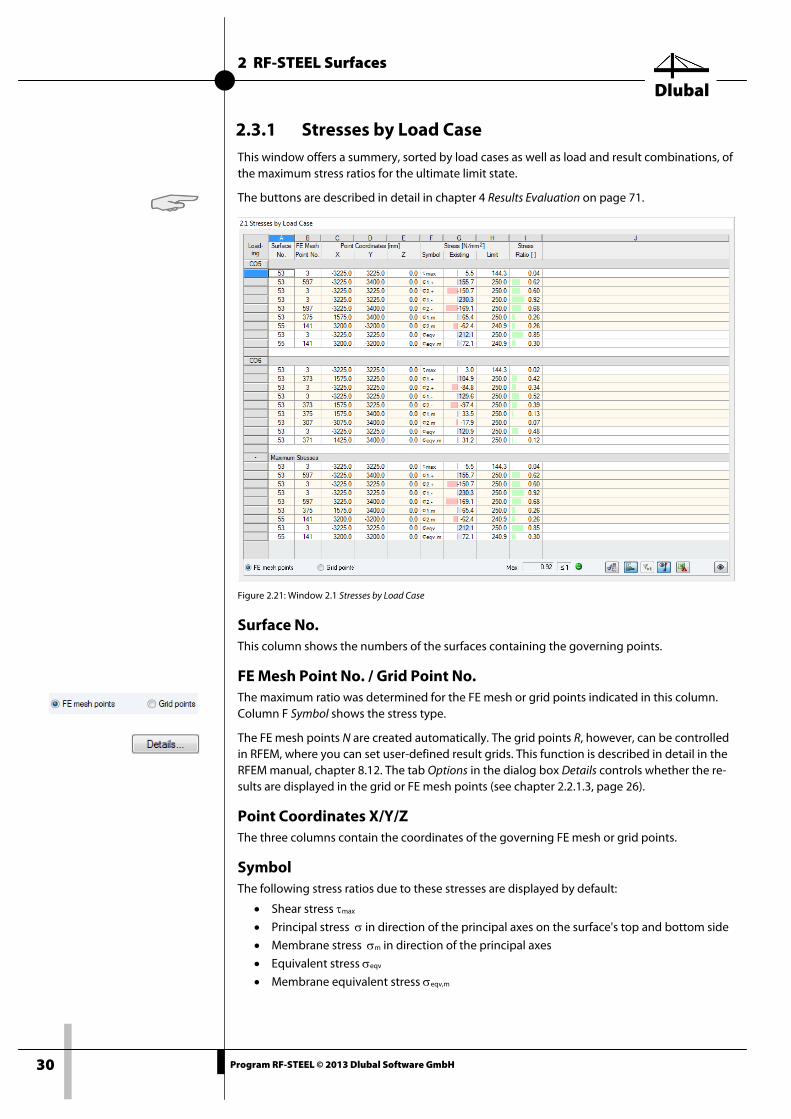
2.3.1 Stresses by Load Case This window offers a summery, sorted by load cases as well as load and result combinations, of the maximum stress ratios for the ultimate limit state.
The buttons are described in detail in chapter 4 Results Evaluation on page 71.
Figure 2.21: Window 2.1 Stresses by Load Case
Surface No. This column shows the numbers of the surfaces containing the governing points.
FE Mesh Point No. / Grid Point No. The maximum ratio was determined for the FE mesh or grid points indicated in this column. Column F Symbol shows the stress type.
The FE mesh points N are created automatically. The grid points R, however, can be controlled in RFEM, where you can set user-defined result grids. This function is described in detail in the RFEM manual, chapter 8.12. The tab Options in the dialog box Details controls whether the re-sults are displayed in the grid or FE mesh points (see chapter 2.2.1.3, page 26).
Point Coordinates X/Y/Z The three columns contain the coordinates of the governing FE mesh or grid points.
Symbol The following stress ratios due to these stresses are displayed by default:
• Shear stress τmax
• Principal stress σ in direction of the principal axes on the surface's top and bottom side
• Membrane stress σm in direction of the principal axes
• Equivalent stress σeqv
• Membrane equivalent stress σeqv,m
2 RF-STEEL Surfaces
Dlubal
31 Program RF-STEEL © 2013 Dlubal Software GmbH
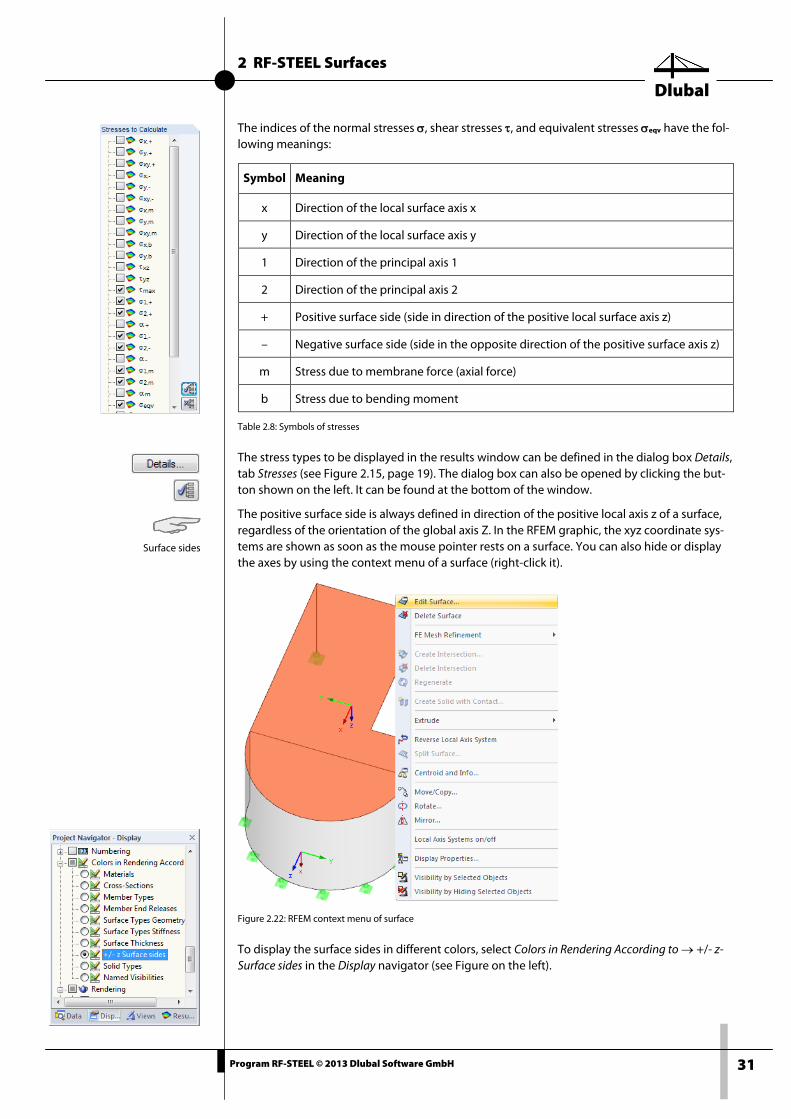
The indices of the normal stresses σ, shear stresses τ, and equivalent stresses σeqv have the fol-lowing meanings:
Table 2.8: Symbols of stresses
The stress types to be displayed in the results window can be defined in the dialog box Details, tab Stresses (see Figure 2.15, page 19). The dialog box can also be opened by clicking the but-ton shown on the left. It can be found at the bottom of the window.
The positive surface side is always defined in direction of the positive local axis z of a surface, regardless of the orientation of the global axis Z. In the RFEM graphic, the xyz coordinate sys-tems are shown as soon as the mouse pointer rests on a surface. You can also hide or display the axes by using the context menu of a surface (right-click it).
Figure 2.22: RFEM context menu of surface
To display the surface sides in different colors, select Colors in Rendering According to → +/- z-Surface sides in the Display navigator (see Figure on the left).
Symbol Meaning
x Direction of the local surface axis x
y Direction of the local surface axis y
1 Direction of the principal axis 1
2 Direction of the principal axis 2
+ Positive surface side (side in direction of the positive local surface axis z)
– Negative surface side (side in the opposite direction of the positive surface axis z)
m Stress due to membrane force (axial force)
b Stress due to bending moment
Surface sides
2 RF-STEEL Surfaces
Dlubal
32 Program RF-STEEL © 2013 Dlubal Software GmbH
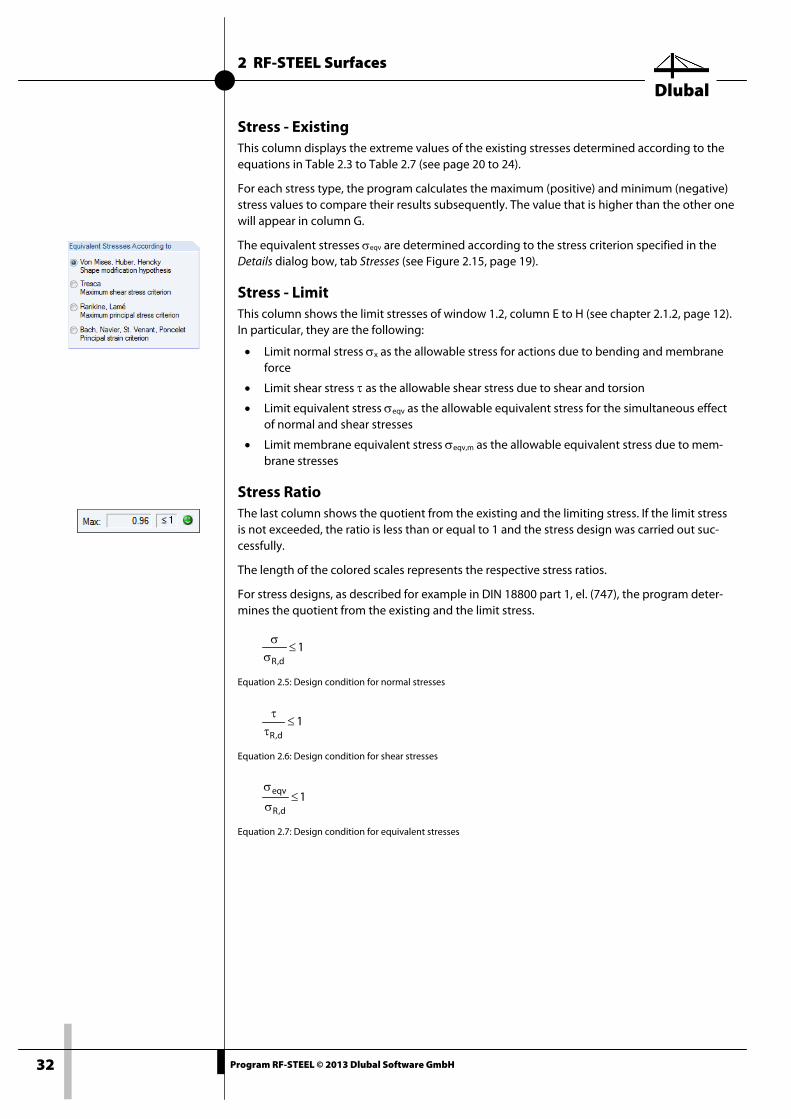
Stress - Existing This column displays the extreme values of the existing stresses determined according to the equations in Table 2.3 to Table 2.7 (see page 20 to 24).
For each stress type, the program calculates the maximum (positive) and minimum (negative) stress values to compare their results subsequently. The value that is higher than the other one will appear in column G.
The equivalent stresses σeqv are determined according to the stress criterion specified in the Details dialog bow, tab Stresses (see Figure 2.15, page 19).
Stress - Limit This column shows the limit stresses of window 1.2, column E to H (see chapter 2.1.2, page 12). In particular, they are the following:
• Limit normal stress σx as the allowable stress for actions due to bending and membrane force
• Limit shear stress τ as the allowable shear stress due to shear and torsion
• Limit equivalent stress σeqv as the allowable equivalent stress for the simultaneous effect of normal and shear stresses
• Limit membrane equivalent stress σeqv,m as the allowable equivalent stress due to mem-brane stresses
Stress Ratio The last column shows the quotient from the existing and the limiting stress. If the limit stress is not exceeded, the ratio is less than or equal to 1 and the stress design was carried out suc-cessfully.
The length of the colored scales represents the respective stress ratios.
For stress designs, as described for example in DIN 18800 part 1, el. (747), the program deter-mines the quotient from the existing and the limit stress.
1d,R≤
σσ
Equation 2.5: Design condition for normal stresses
1d,R≤
ττ
Equation 2.6: Design condition for shear stresses
1d,R
eqv ≤σ
σ
Equation 2.7: Design condition for equivalent stresses
2 RF-STEEL Surfaces
Dlubal
33 Program RF-STEEL © 2013 Dlubal Software GmbH
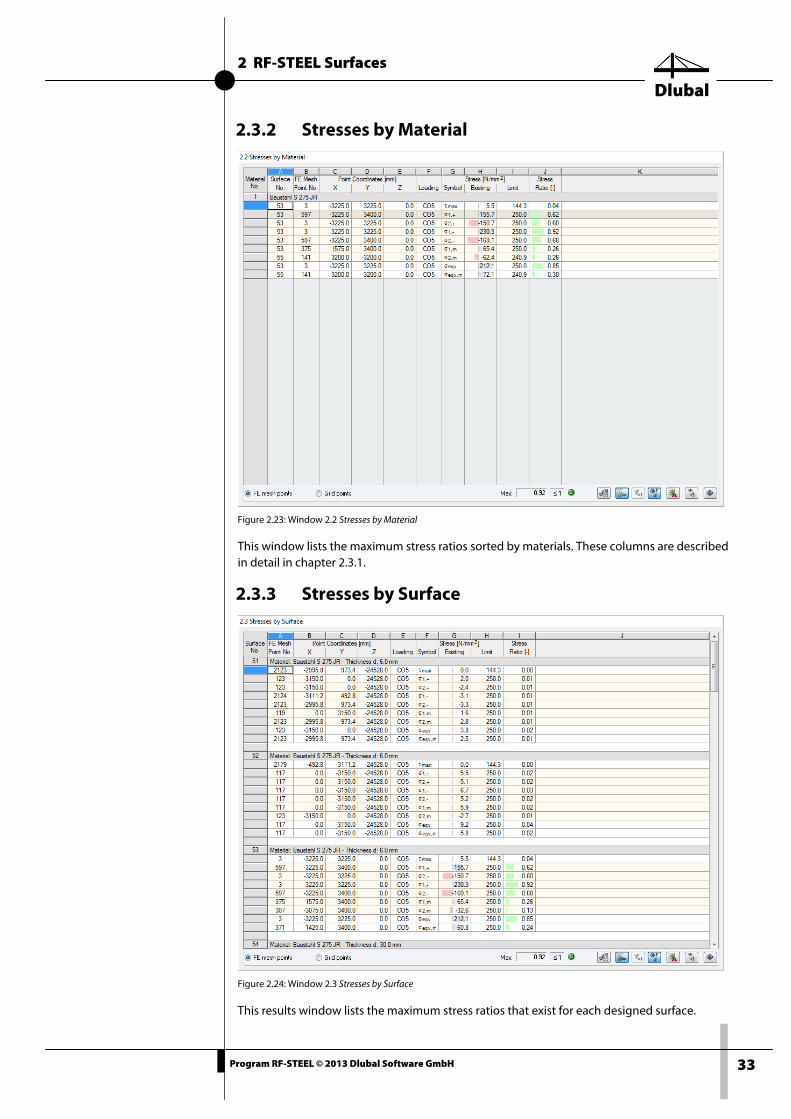
2.3.2 Stresses by Material
Figure 2.23: Window 2.2 Stresses by Material
This window lists the maximum stress ratios sorted by materials. These columns are described in detail in chapter 2.3.1.
2.3.3 Stresses by Surface
Figure 2.24: Window 2.3 Stresses by Surface
This results window lists the maximum stress ratios that exist for each designed surface.
2 RF-STEEL Surfaces
Dlubal
34 Program RF-STEEL © 2013 Dlubal Software GmbH
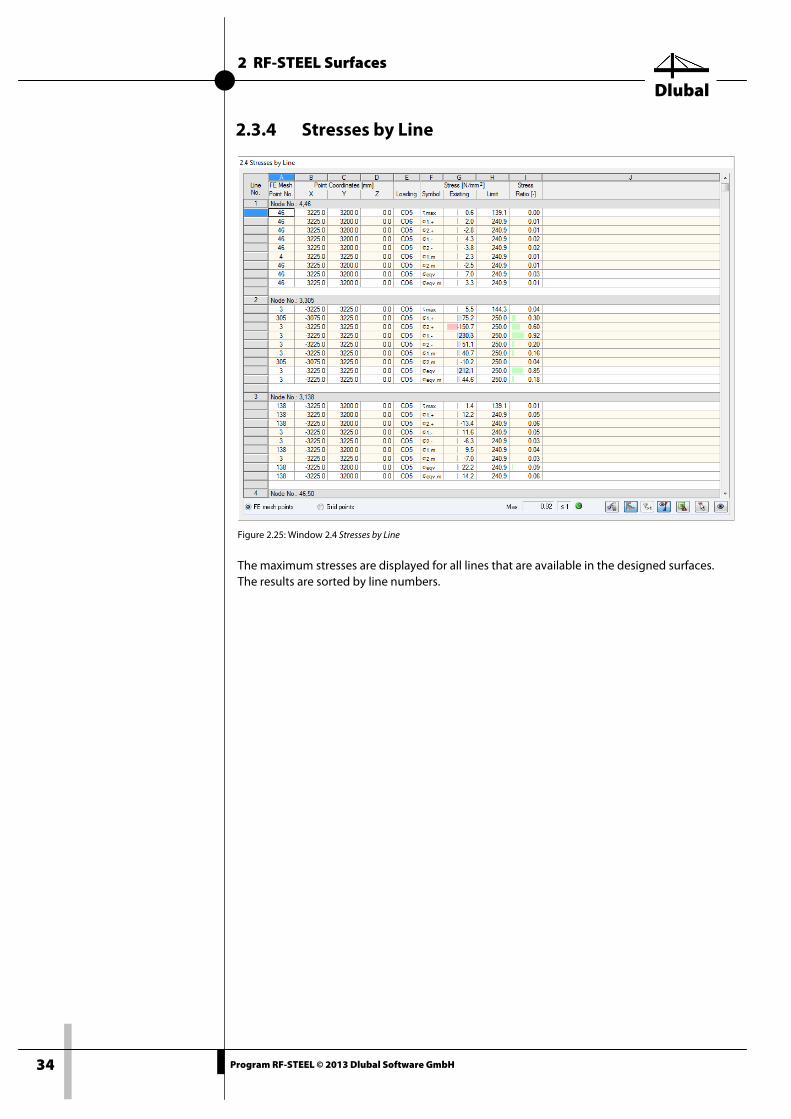
2.3.4 Stresses by Line
Figure 2.25: Window 2.4 Stresses by Line
The maximum stresses are displayed for all lines that are available in the designed surfaces. The results are sorted by line numbers.
2 RF-STEEL Surfaces
Dlubal
35 Program RF-STEEL © 2013 Dlubal Software GmbH
Filter function
2.3.5 Stresses in All Points
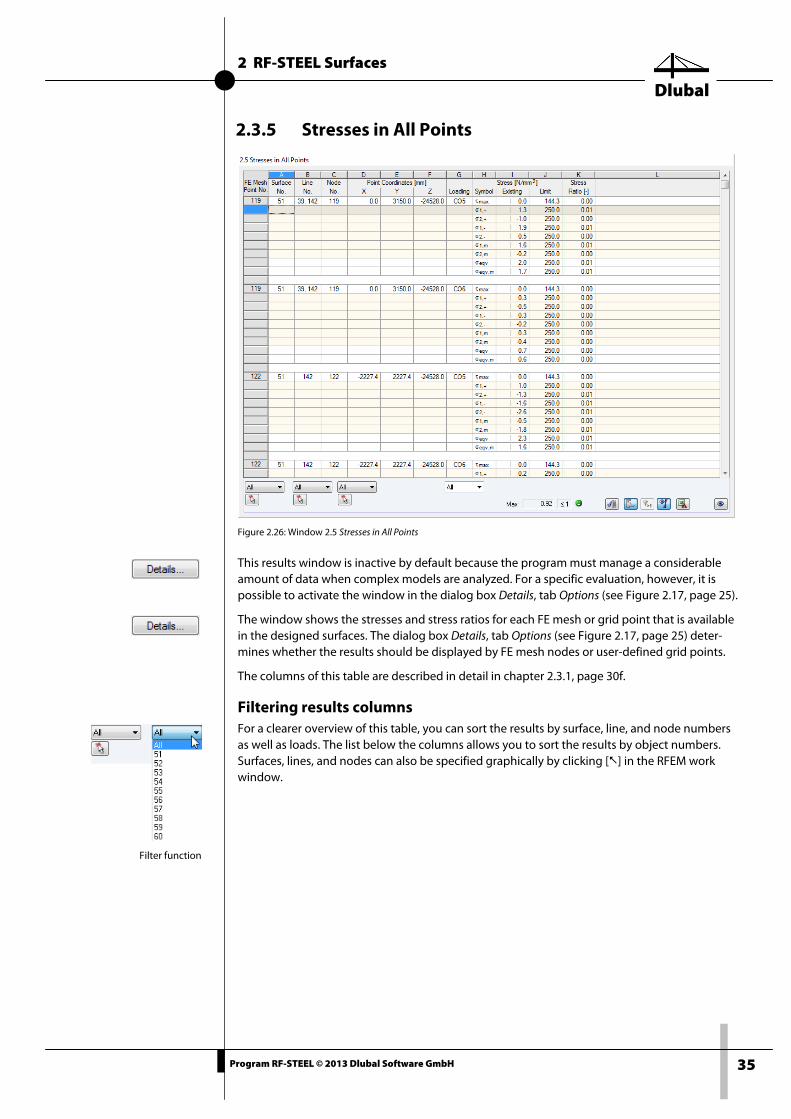
Figure 2.26: Window 2.5 Stresses in All Points
This results window is inactive by default because the program must manage a considerable amount of data when complex models are analyzed. For a specific evaluation, however, it is possible to activate the window in the dialog box Details, tab Options (see Figure 2.17, page 25).
The window shows the stresses and stress ratios for each FE mesh or grid point that is available in the designed surfaces. The dialog box Details, tab Options (see Figure 2.17, page 25) deter-mines whether the results should be displayed by FE mesh nodes or user-defined grid points.
The columns of this table are described in detail in chapter 2.3.1, page 30f.
Filtering results columns For a clearer overview of this table, you can sort the results by surface, line, and node numbers as well as loads. The list below the columns allows you to sort the results by object numbers. Surfaces, lines, and nodes can also be specified graphically by clicking [] in the RFEM work window.
2 RF-STEEL Surfaces
Dlubal
36 Program RF-STEEL © 2013 Dlubal Software GmbH
2.3.6 Stress Ranges
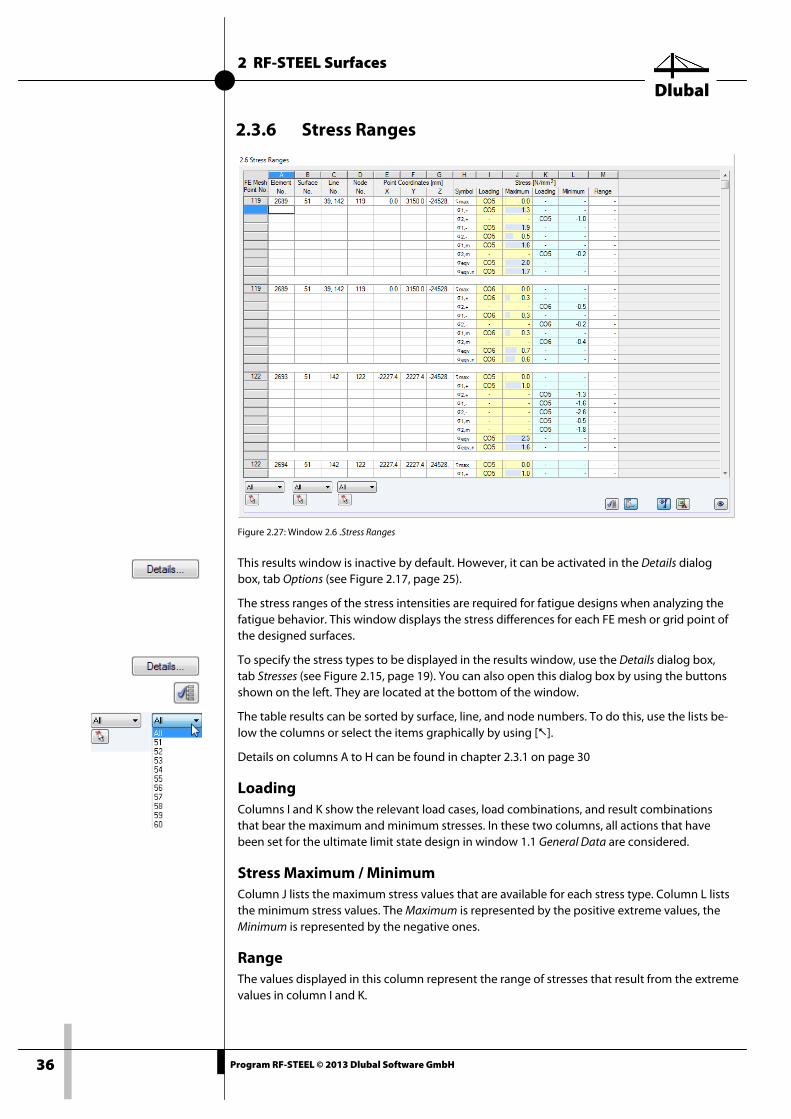
Figure 2.27: Window 2.6 .Stress Ranges
This results window is inactive by default. However, it can be activated in the Details dialog box, tab Options (see Figure 2.17, page 25).
The stress ranges of the stress intensities are required for fatigue designs when analyzing the fatigue behavior. This window displays the stress differences for each FE mesh or grid point of the designed surfaces.
To specify the stress types to be displayed in the results window, use the Details dialog box, tab Stresses (see Figure 2.15, page 19). You can also open this dialog box by using the buttons shown on the left. They are located at the bottom of the window.
The table results can be sorted by surface, line, and node numbers. To do this, use the lists be-low the columns or select the items graphically by using [].
Details on columns A to H can be found in chapter 2.3.1 on page 30
Loading Columns I and K show the relevant load cases, load combinations, and result combinations that bear the maximum and minimum stresses. In these two columns, all actions that have been set for the ultimate limit state design in window 1.1 General Data are considered.
Stress Maximum / Minimum Column J lists the maximum stress values that are available for each stress type. Column L lists the minimum stress values. The Maximum is represented by the positive extreme values, the Minimum is represented by the negative ones.
Range The values displayed in this column represent the range of stresses that result from the extreme values in column I and K.
2 RF-STEEL Surfaces
Dlubal
37 Program RF-STEEL © 2013 Dlubal Software GmbH
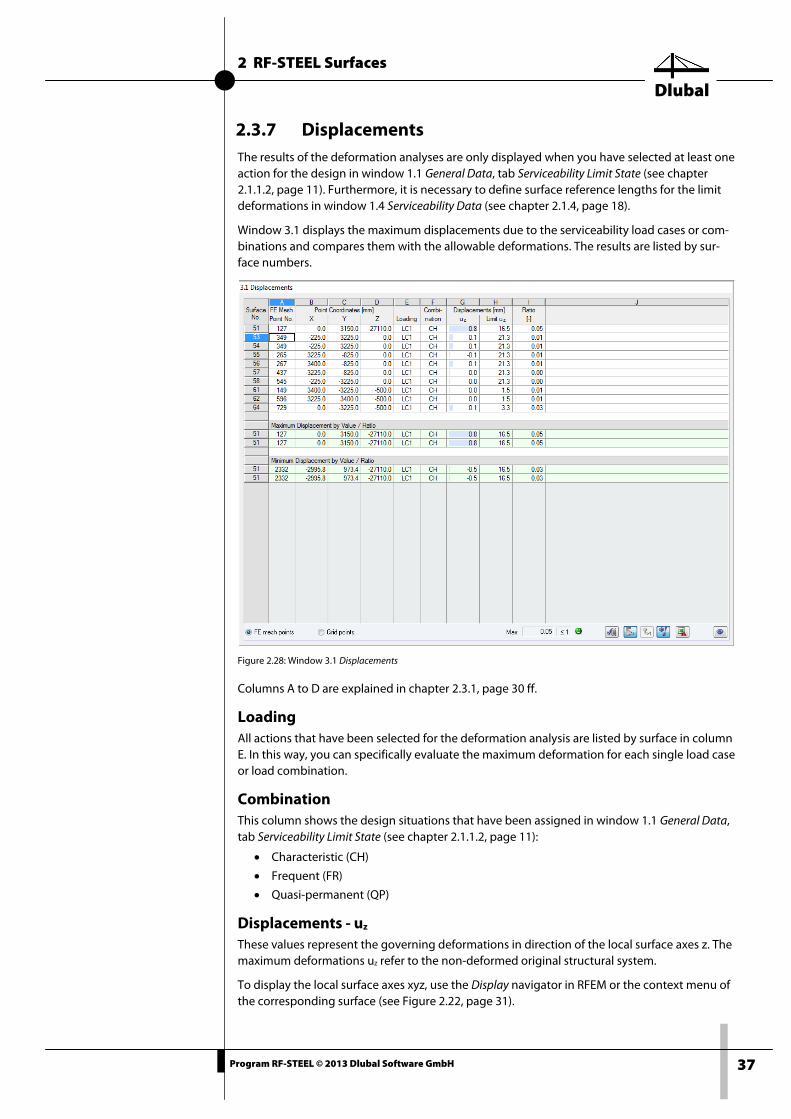
2.3.7 Displacements The results of the deformation analyses are only displayed when you have selected at least one action for the design in window 1.1 General Data, tab Serviceability Limit State (see chapter 2.1.1.2, page 11). Furthermore, it is necessary to define surface reference lengths for the limit deformations in window 1.4 Serviceability Data (see chapter 2.1.4, page 18).
Window 3.1 displays the maximum displacements due to the serviceability load cases or com-binations and compares them with the allowable deformations. The results are listed by sur-face numbers.
Figure 2.28: Window 3.1 Displacements
Columns A to D are explained in chapter 2.3.1, page 30 ff.
Loading All actions that have been selected for the deformation analysis are listed by surface in column E. In this way, you can specifically evaluate the maximum deformation for each single load case or load combination.
Combination This column shows the design situations that have been assigned in window 1.1 General Data, tab Serviceability Limit State (see chapter 2.1.1.2, page 11):
• Characteristic (CH)
• Frequent (FR)
• Quasi-permanent (QP)
Displacements - uz These values represent the governing deformations in direction of the local surface axes z. The maximum deformations uz refer to the non-deformed original structural system.
To display the local surface axes xyz, use the Display navigator in RFEM or the context menu of the corresponding surface (see Figure 2.22, page 31).
2 RF-STEEL Surfaces
Dlubal
38 Program RF-STEEL © 2013 Dlubal Software GmbH
Displacements - Limit uz This column shows the limit deformations in direction of the z-axis of each surface. These de-formations are determined by the reference lengths L of the boundary lines that have been defined in window 1.4 (see chapter 2.1.4, page 18) and serviceability limits of the dialog box Details, tab Serviceability (see Figure 2.16, page 24).
Ratio The final column shows the quotients determined from the existing displacement uz (column G) and the allowable displacement Limit uz (column H). If the limit deformations are kept, the ratio is less than or equal to 1 and the serviceability limit state design was carried out success-fully.
Maximum and Minimum Displacement by Value / Ratio At the bottom of the window, a summary is displayed showing the extreme displacement val-ues uz (column G) and the extreme stress ratios (Column I) of all designed surfaces. The output is divided in maximum (positive) and minimum (negative) results.
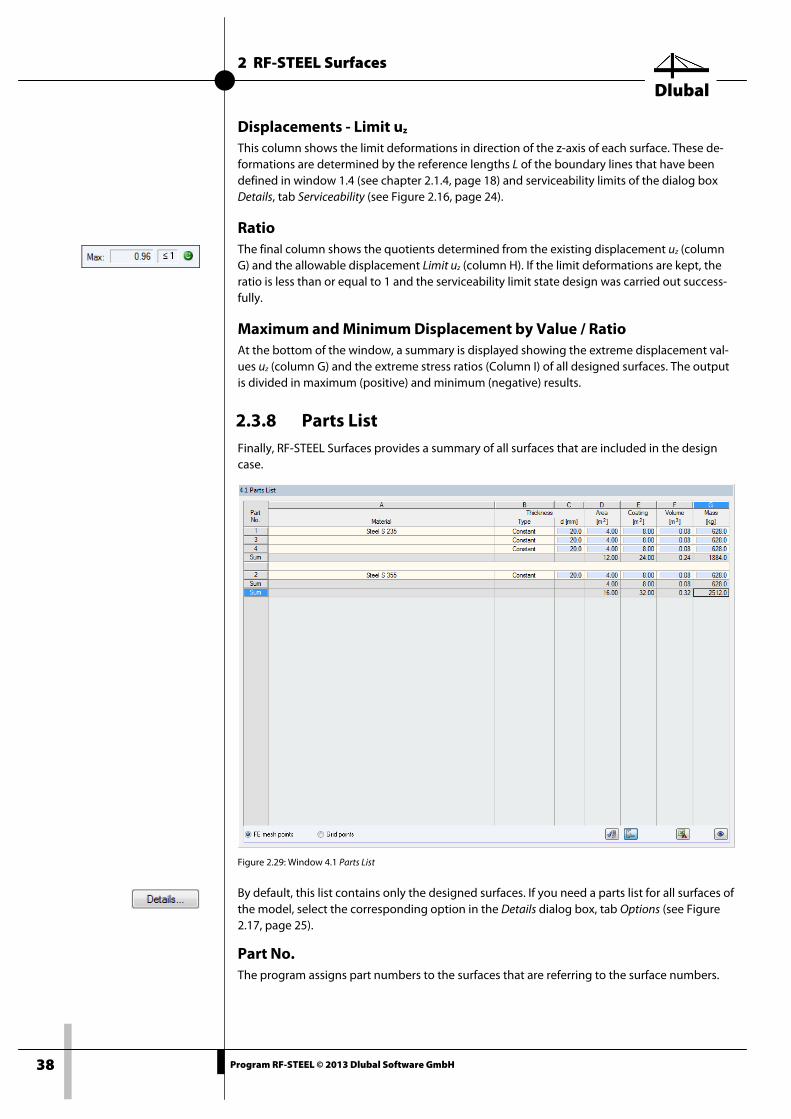
2.3.8 Parts List Finally, RF-STEEL Surfaces provides a summary of all surfaces that are included in the design case.
Figure 2.29: Window 4.1 Parts List
By default, this list contains only the designed surfaces. If you need a parts list for all surfaces of the model, select the corresponding option in the Details dialog box, tab Options (see Figure 2.17, page 25).
Part No. The program assigns part numbers to the surfaces that are referring to the surface numbers.
2 RF-STEEL Surfaces
Dlubal
39 Program RF-STEEL © 2013 Dlubal Software GmbH
Material The results are listed by materials. The material column ends with row the Sum of the values that are displayed in column D to G.
Thickness Columns B and C show the Type of thickness as well as the thickness d. The entries refer to the input data in window 1.3 Surfaces.
Area This column gives information about the area of each surface.
Coating The surface area is determined from the top and bottom side of a surface. The lateral surfaces of the thin-walled steel surface are not considered.
Volume The volume of a surface is determined by the product of its thickness and area. If the surface has a variable thickness, the program considers this property accordingly.
Mass The final column indicates the total mass of each part.
Sum At the bottom of the list, you find a summary of the summed up values of column D to G. The last data field of the column Mass shows the total amount of steel required.
3 RF-STEEL Members
Dlubal
40 Program RF-STEEL © 2013 Dlubal Software GmbH
3. RF-STEEL Members
3.1 Input Data
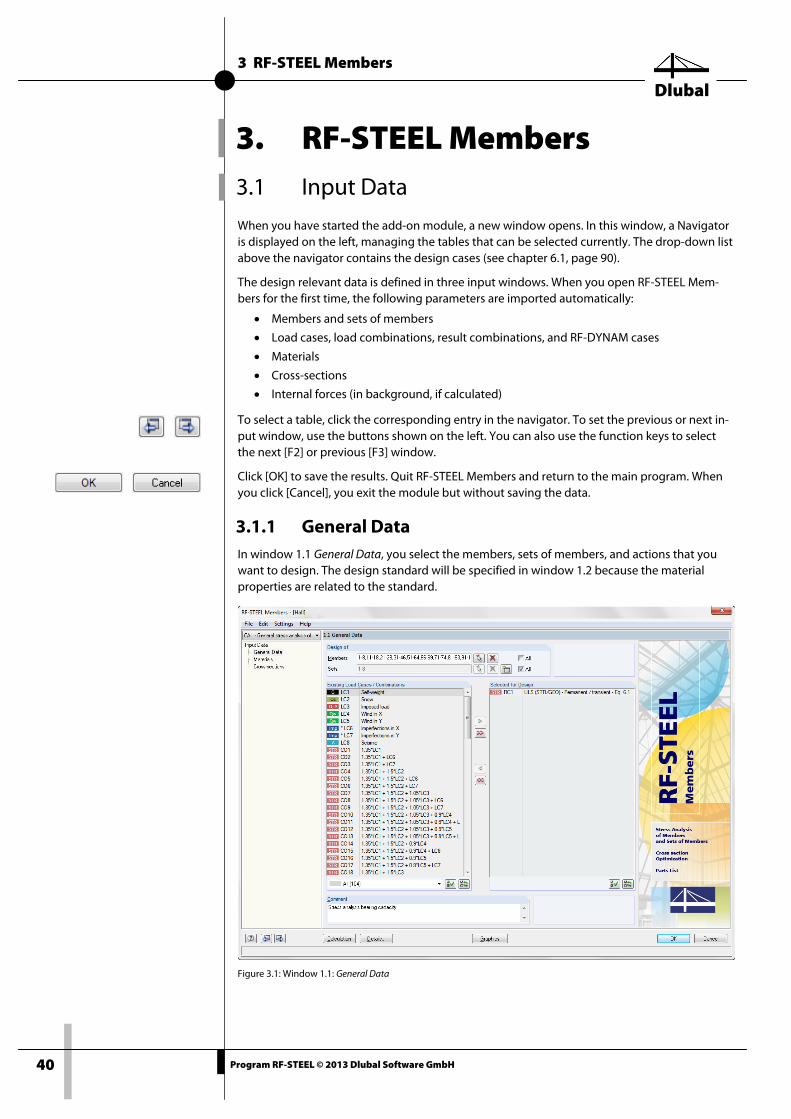
When you have started the add-on module, a new window opens. In this window, a Navigator is displayed on the left, managing the tables that can be selected currently. The drop-down list above the navigator contains the design cases (see chapter 6.1, page 90).
The design relevant data is defined in three input windows. When you open RF-STEEL Mem-bers for the first time, the following parameters are imported automatically:
• Members and sets of members
• Load cases, load combinations, result combinations, and RF-DYNAM cases
• Materials
• Cross-sections
• Internal forces (in background, if calculated)
To select a table, click the corresponding entry in the navigator. To set the previous or next in-put window, use the buttons shown on the left. You can also use the function keys to select the next [F2] or previous [F3] window.
Click [OK] to save the results. Quit RF-STEEL Members and return to the main program. When you click [Cancel], you exit the module but without saving the data.
3.1.1 General Data In window 1.1 General Data, you select the members, sets of members, and actions that you want to design. The design standard will be specified in window 1.2 because the material properties are related to the standard.
Figure 3.1: Window 1.1: General Data
3 RF-STEEL Members
Dlubal
41 Program RF-STEEL © 2013 Dlubal Software GmbH
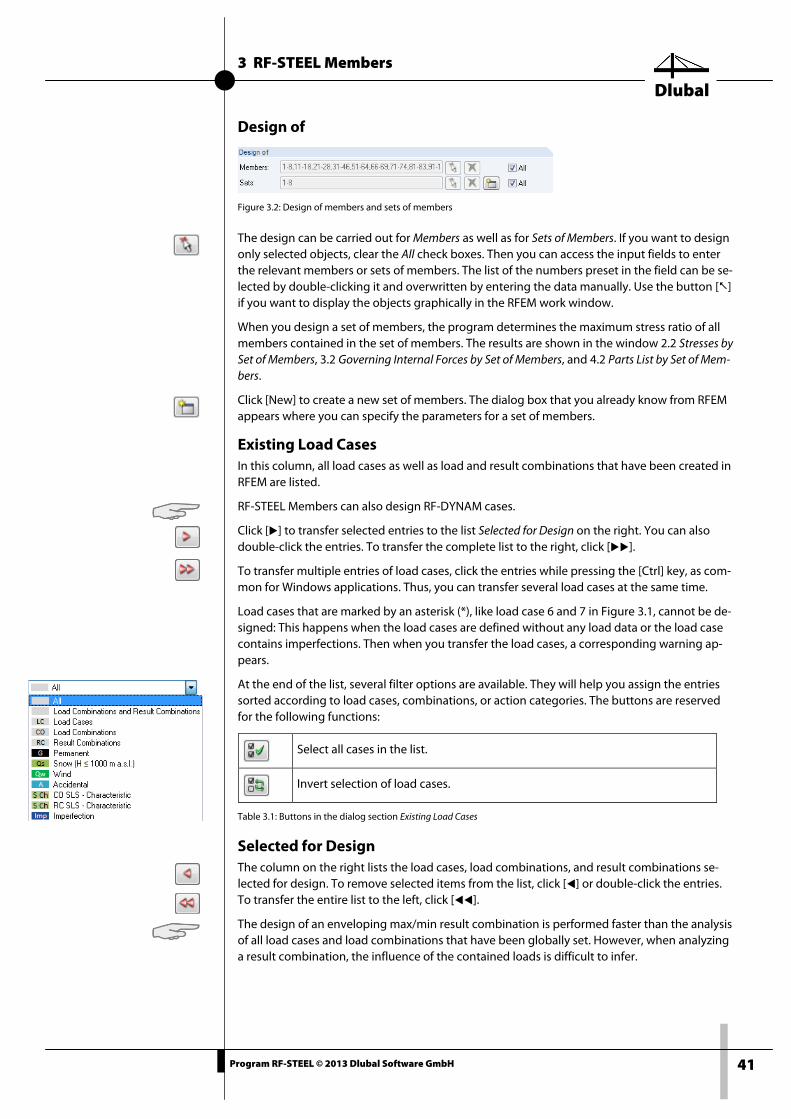
Design of
Figure 3.2: Design of members and sets of members
The design can be carried out for Members as well as for Sets of Members. If you want to design only selected objects, clear the All check boxes. Then you can access the input fields to enter the relevant members or sets of members. The list of the numbers preset in the field can be se-lected by double-clicking it and overwritten by entering the data manually. Use the button [] if you want to display the objects graphically in the RFEM work window.
When you design a set of members, the program determines the maximum stress ratio of all members contained in the set of members. The results are shown in the window 2.2 Stresses by Set of Members, 3.2 Governing Internal Forces by Set of Members, and 4.2 Parts List by Set of Mem-bers.
Click [New] to create a new set of members. The dialog box that you already know from RFEM appears where you can specify the parameters for a set of members.
Existing Load Cases In this column, all load cases as well as load and result combinations that have been created in RFEM are listed.
RF-STEEL Members can also design RF-DYNAM cases.
Click [] to transfer selected entries to the list Selected for Design on the right. You can also double-click the entries. To transfer the complete list to the right, click [].
To transfer multiple entries of load cases, click the entries while pressing the [Ctrl] key, as com-mon for Windows applications. Thus, you can transfer several load cases at the same time.
Load cases that are marked by an asterisk (*), like load case 6 and 7 in Figure 3.1, cannot be de-signed: This happens when the load cases are defined without any load data or the load case contains imperfections. Then when you transfer the load cases, a corresponding warning ap-pears.
At the end of the list, several filter options are available. They will help you assign the entries sorted according to load cases, combinations, or action categories. The buttons are reserved for the following functions:
Select all cases in the list.
Invert selection of load cases.
Table 3.1: Buttons in the dialog section Existing Load Cases
Selected for Design The column on the right lists the load cases, load combinations, and result combinations se-lected for design. To remove selected items from the list, click [] or double-click the entries. To transfer the entire list to the left, click [].
The design of an enveloping max/min result combination is performed faster than the analysis of all load cases and load combinations that have been globally set. However, when analyzing a result combination, the influence of the contained loads is difficult to infer.
3 RF-STEEL Members
Dlubal
42 Program RF-STEEL © 2013 Dlubal Software GmbH
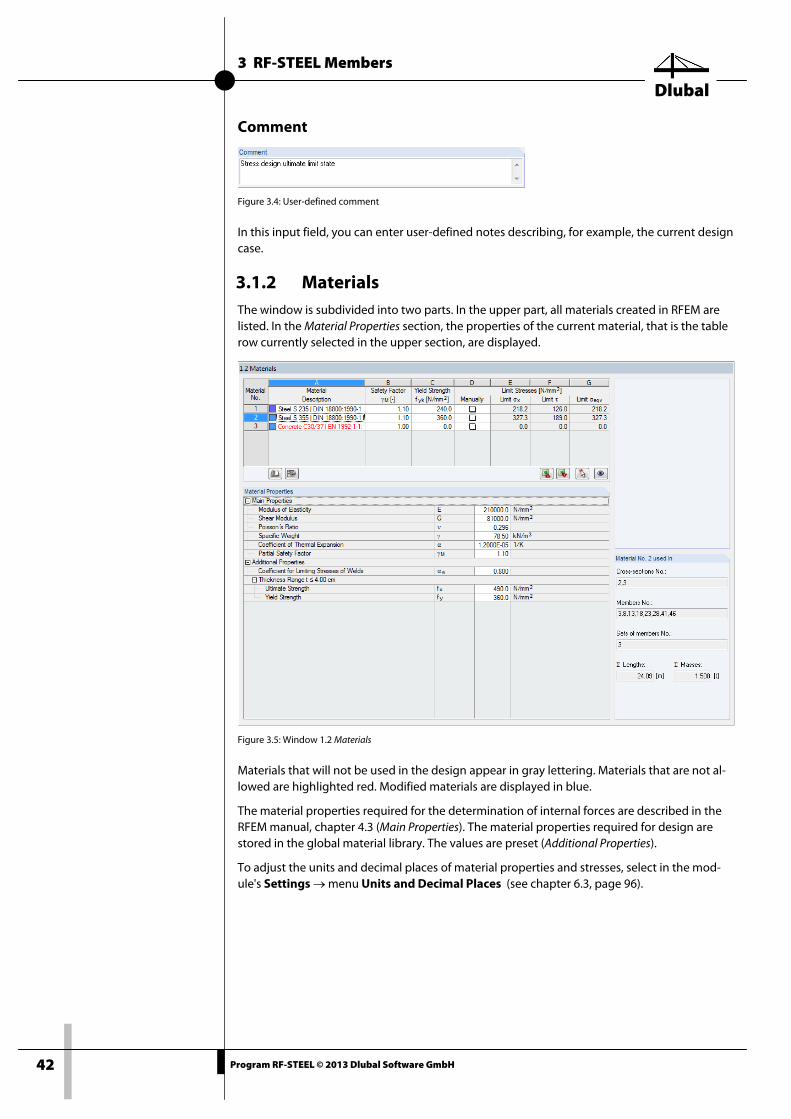
Comment
Figure 3.4: User-defined comment
In this input field, you can enter user-defined notes describing, for example, the current design case.
3.1.2 Materials The window is subdivided into two parts. In the upper part, all materials created in RFEM are listed. In the Material Properties section, the properties of the current material, that is the table row currently selected in the upper section, are displayed.
Figure 3.5: Window 1.2 Materials
Materials that will not be used in the design appear in gray lettering. Materials that are not al-lowed are highlighted red. Modified materials are displayed in blue.
The material properties required for the determination of internal forces are described in the RFEM manual, chapter 4.3 (Main Properties). The material properties required for design are stored in the global material library. The values are preset (Additional Properties).
To adjust the units and decimal places of material properties and stresses, select in the mod-ule's Settings → menu Units and Decimal Places (see chapter 6.3, page 96).
3 RF-STEEL Members
Dlubal
43 Program RF-STEEL © 2013 Dlubal Software GmbH
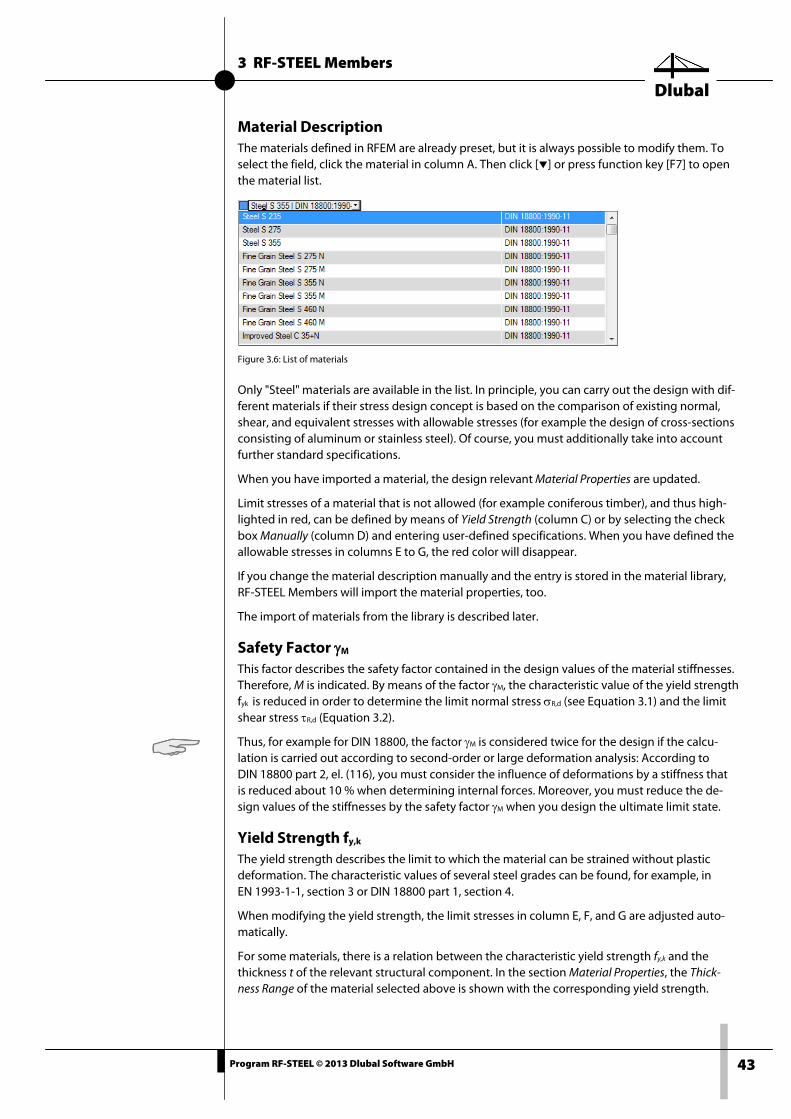
Material Description The materials defined in RFEM are already preset, but it is always possible to modify them. To select the field, click the material in column A. Then click [] or press function key [F7] to open the material list.
Figure 3.6: List of materials
Only "Steel" materials are available in the list. In principle, you can carry out the design with dif-ferent materials if their stress design concept is based on the comparison of existing normal, shear, and equivalent stresses with allowable stresses (for example the design of cross-sections consisting of aluminum or stainless steel). Of course, you must additionally take into account further standard specifications.
When you have imported a material, the design relevant Material Properties are updated.
Limit stresses of a material that is not allowed (for example coniferous timber), and thus high-lighted in red, can be defined by means of Yield Strength (column C) or by selecting the check box Manually (column D) and entering user-defined specifications. When you have defined the allowable stresses in columns E to G, the red color will disappear.
If you change the material description manually and the entry is stored in the material library, RF-STEEL Members will import the material properties, too.
The import of materials from the library is described later.
Safety Factor γM
This factor describes the safety factor contained in the design values of the material stiffnesses. Therefore, M is indicated. By means of the factor γM, the characteristic value of the yield strength fyk is reduced in order to determine the limit normal stress σR,d (see Equation 3.1) and the limit shear stress τR,d (Equation 3.2).
Thus, for example for DIN 18800, the factor γM is considered twice for the design if the calcu-lation is carried out according to second-order or large deformation analysis: According to DIN 18800 part 2, el. (116), you must consider the influence of deformations by a stiffness that is reduced about 10 % when determining internal forces. Moreover, you must reduce the de-sign values of the stiffnesses by the safety factor γM when you design the ultimate limit state.
Yield Strength fy,k The yield strength describes the limit to which the material can be strained without plastic deformation. The characteristic values of several steel grades can be found, for example, in EN 1993-1-1, section 3 or DIN 18800 part 1, section 4.
When modifying the yield strength, the limit stresses in column E, F, and G are adjusted auto-matically.
For some materials, there is a relation between the characteristic yield strength fy,k and the thickness t of the relevant structural component. In the section Material Properties, the Thick-ness Range of the material selected above is shown with the corresponding yield strength.
3 RF-STEEL Members
Dlubal
44 Program RF-STEEL © 2013 Dlubal Software GmbH
The zones of the yield strength are specified in the standards, for example in DIN 18800 part 1, table 1. To control and, if required, adjust the thickness of structural components including yield strength, click [Edit] (see Figure 3.8 page 46).
Limit Stresses The limit stresses of materials that are stored in the material library are preset automatically.
If you want to adjust the limit stresses, you can use the check box Manually or the button [Edit Material] (see Figure 3.8, page 46).
Manually
If the check box is selected, you can define the limit stresses in column E to G manually.
Modified material properties are marked by an asterisk in the column Material Description.
Limit σx
The limit normal stress represents the allowable stress for actions due to bending and axial force. According to DIN 18800 part 1, el. (746), it is determined by the characteristic value of the yield strength, reduced by the safety factor γM.
M
ykd,R,x
f
γ=σ
Equation 3.1
Limit τ
The limit shear stress indicates the allowable shear stress due to shear and torsion. To deter-mine the limit shear stress according to DIN 18800 part 1, el. (746), the safety factor γM is also taken into account by the equation.
3
f
M
ykd,R
⋅γ=τ
Equation 3.2
Limit σeqv
The limit equivalent stress represents the allowable equivalent stress for the simultaneous ef-fect of several stresses. According to DIN 18800 part 1, el. (746), it is determined by Equation 3.1.
3 RF-STEEL Members
Dlubal
45 Program RF-STEEL © 2013 Dlubal Software GmbH
Material Library Numerous materials are already available in the library. To open the corresponding dialog box, click
Edit → Material Library
or use the button shown on the left.
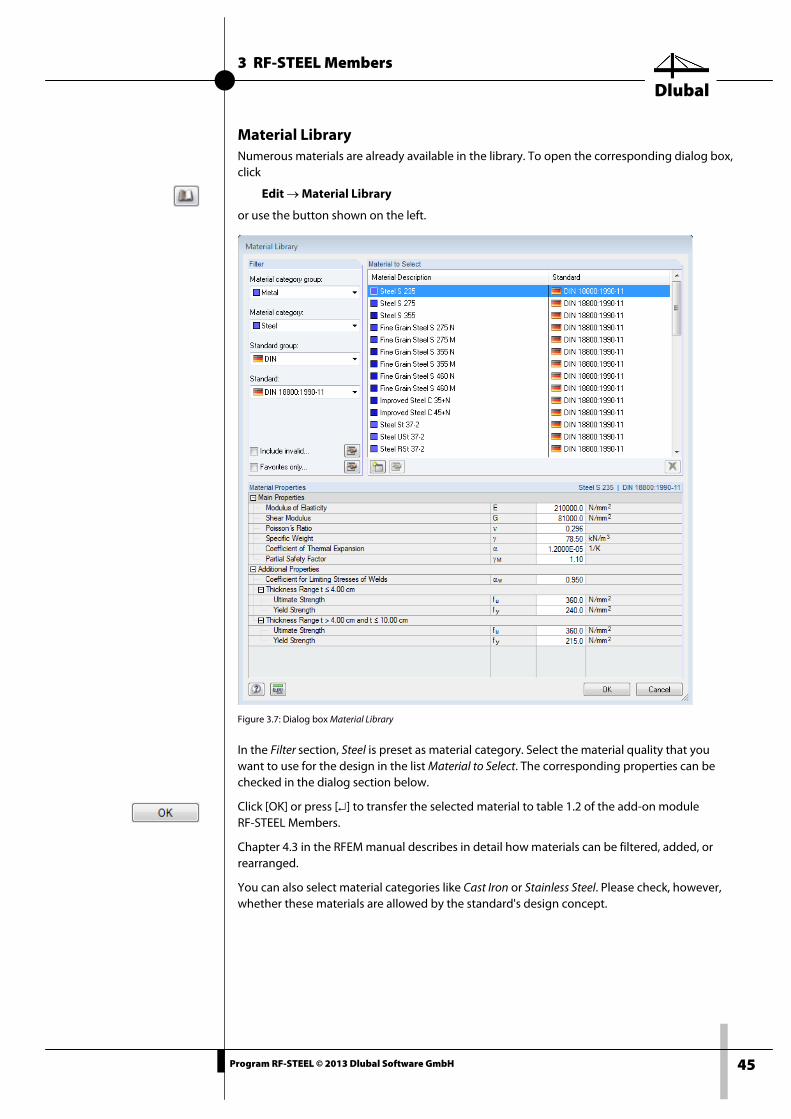
Figure 3.7: Dialog box Material Library
In the Filter section, Steel is preset as material category. Select the material quality that you want to use for the design in the list Material to Select. The corresponding properties can be checked in the dialog section below.
Click [OK] or press [↵] to transfer the selected material to table 1.2 of the add-on module RF-STEEL Members.
Chapter 4.3 in the RFEM manual describes in detail how materials can be filtered, added, or rearranged.
You can also select material categories like Cast Iron or Stainless Steel. Please check, however, whether these materials are allowed by the standard's design concept.
3 RF-STEEL Members
Dlubal
46 Program RF-STEEL © 2013 Dlubal Software GmbH
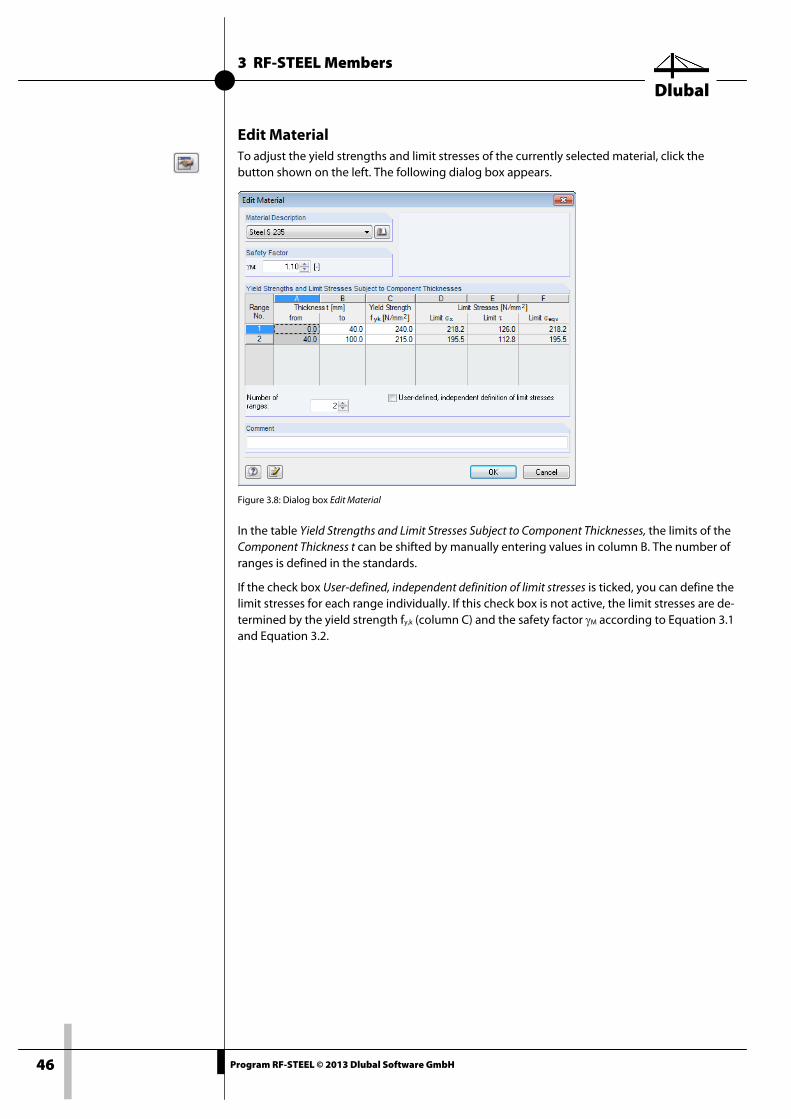
Edit Material To adjust the yield strengths and limit stresses of the currently selected material, click the button shown on the left. The following dialog box appears.
Figure 3.8: Dialog box Edit Material
In the table Yield Strengths and Limit Stresses Subject to Component Thicknesses, the limits of the Component Thickness t can be shifted by manually entering values in column B. The number of ranges is defined in the standards.
If the check box User-defined, independent definition of limit stresses is ticked, you can define the limit stresses for each range individually. If this check box is not active, the limit stresses are de-termined by the yield strength fy,k (column C) and the safety factor γM according to Equation 3.1 and Equation 3.2.
3 RF-STEEL Members
Dlubal
47 Program RF-STEEL © 2013 Dlubal Software GmbH
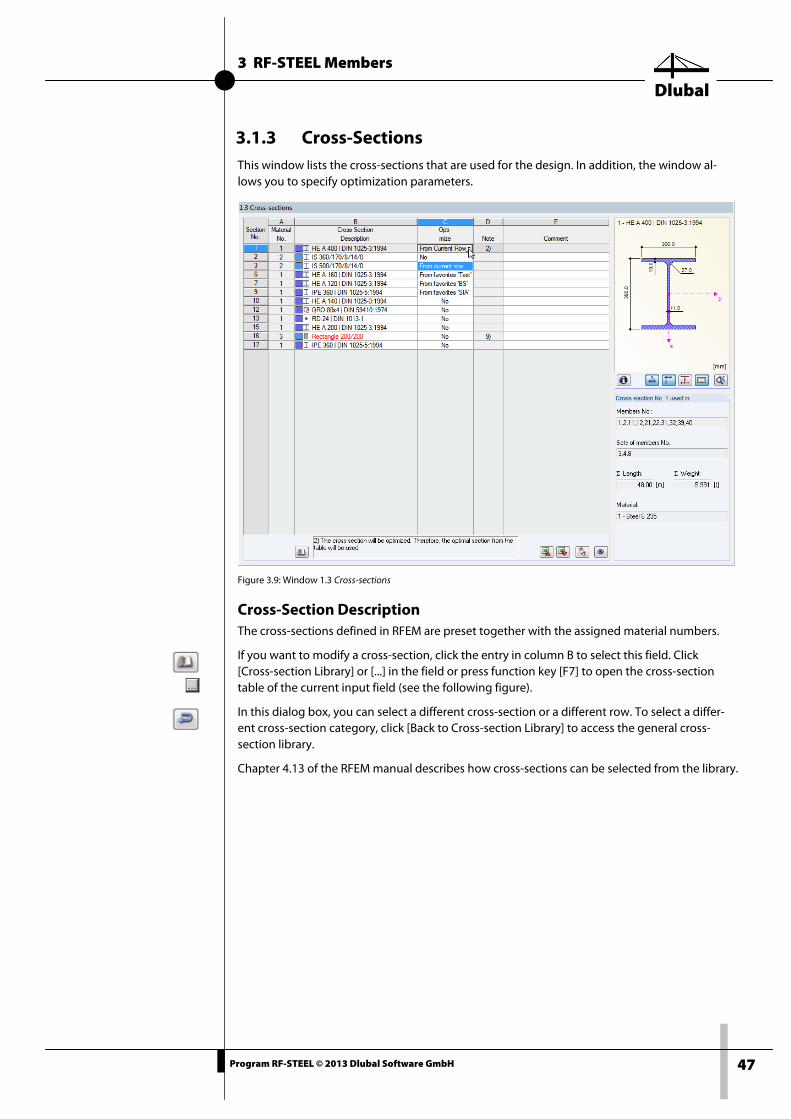
3.1.3 Cross-Sections This window lists the cross-sections that are used for the design. In addition, the window al-lows you to specify optimization parameters.
Figure 3.9: Window 1.3 Cross-sections
Cross-Section Description The cross-sections defined in RFEM are preset together with the assigned material numbers.
If you want to modify a cross-section, click the entry in column B to select this field. Click [Cross-section Library] or [...] in the field or press function key [F7] to open the cross-section table of the current input field (see the following figure).
In this dialog box, you can select a different cross-section or a different row. To select a differ-ent cross-section category, click [Back to Cross-section Library] to access the general cross-section library.
Chapter 4.13 of the RFEM manual describes how cross-sections can be selected from the library.
3 RF-STEEL Members
Dlubal
48 Program RF-STEEL © 2013 Dlubal Software GmbH
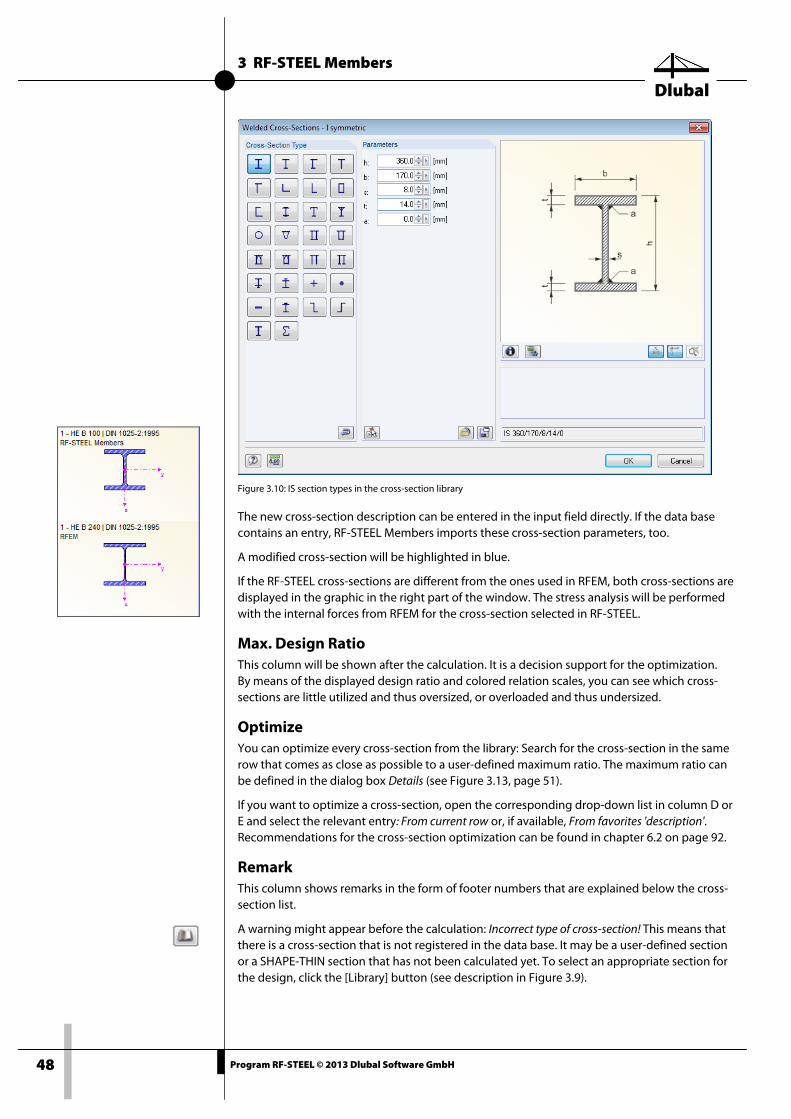
Figure 3.10: IS section types in the cross-section library
The new cross-section description can be entered in the input field directly. If the data base contains an entry, RF-STEEL Members imports these cross-section parameters, too.
A modified cross-section will be highlighted in blue.
If the RF-STEEL cross-sections are different from the ones used in RFEM, both cross-sections are displayed in the graphic in the right part of the window. The stress analysis will be performed with the internal forces from RFEM for the cross-section selected in RF-STEEL.
Max. Design Ratio This column will be shown after the calculation. It is a decision support for the optimization. By means of the displayed design ratio and colored relation scales, you can see which cross-sections are little utilized and thus oversized, or overloaded and thus undersized.
Optimize You can optimize every cross-section from the library: Search for the cross-section in the same row that comes as close as possible to a user-defined maximum ratio. The maximum ratio can be defined in the dialog box Details (see Figure 3.13, page 51).
If you want to optimize a cross-section, open the corresponding drop-down list in column D or E and select the relevant entry: From current row or, if available, From favorites 'description'. Recommendations for the cross-section optimization can be found in chapter 6.2 on page 92.
Remark This column shows remarks in the form of footer numbers that are explained below the cross-section list.
A warning might appear before the calculation: Incorrect type of cross-section! This means that there is a cross-section that is not registered in the data base. It may be a user-defined section or a SHAPE-THIN section that has not been calculated yet. To select an appropriate section for the design, click the [Library] button (see description in Figure 3.9).
3 RF-STEEL Members
Dlubal
49 Program RF-STEEL © 2013 Dlubal Software GmbH
Member with tapered cross-section For tapered members with different cross-sections at the member start and member end, the module displays both cross-section numbers, in accordance with the definition in RFEM, in two table rows.
RF-STEEL Members also designs tapered members, provided that the cross-section at the mem-ber's start has the same number of stress points as the cross-section at the member's end. The normal stresses, for example, are determined from the moments of inertia and the centroidal distances of the stress points. If the start and the end cross-section of a tapered member have not the same number of stress points, the intermediate values cannot be interpolated. A calcu-lation will not be possible neither in RFEM nor in RF-STEEL.
To produce the same number of stress points, you can, for example, define the second profile as a copy of the cross-section start with adjusted geometry parameters. The easiest way to do this is to describe both cross-sections as parametric profiles. In such a case, the cross-section group IVU I-Section Plus Lower Flange is recommended.
The cross-section's stress points including numbering can also be checked graphically: Select the cross-section in window 1.3 and click [Info]. The dialog box shown in Figure 3.11 appears.
Cross-section graphic In the right part of the window, the currently selected cross-section is displayed.
The buttons below the graphic are reserved for the following functions:
Table 3.2: Buttons of cross-section graphic
Info About Cross-Section In the dialog box Info About Cross-Section, you can view the cross-section properties, stress points, and c/t-parts.
Button Function
Opens the dialog box Info about Cross-Section (see Figure 3.11)
Displays or hides the dimensions of the cross-section
Displays or hides the principal axes of the cross-section
Displays or hides the stress points
Displays or hides the numbering of stress points or c/t-parts
Resets the full view of the cross-section graphic
3 RF-STEEL Members
Dlubal
50 Program RF-STEEL © 2013 Dlubal Software GmbH
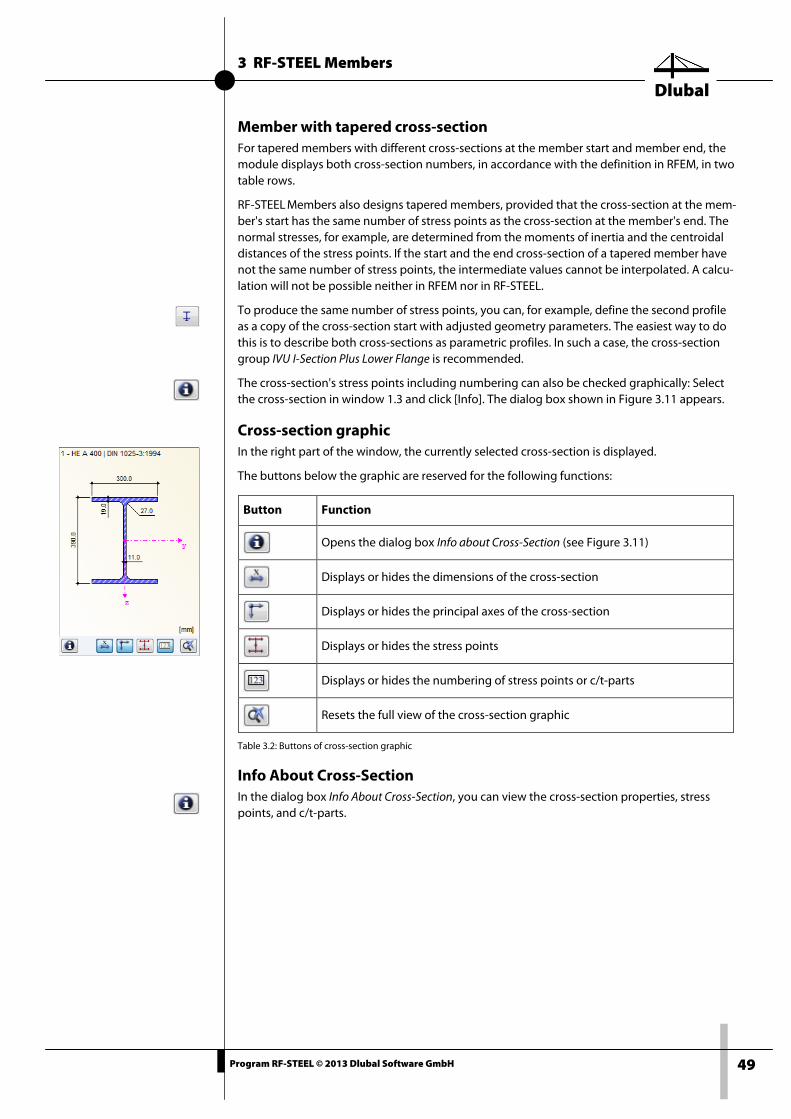
Figure 3.11: Dialog box Info About Cross-Section
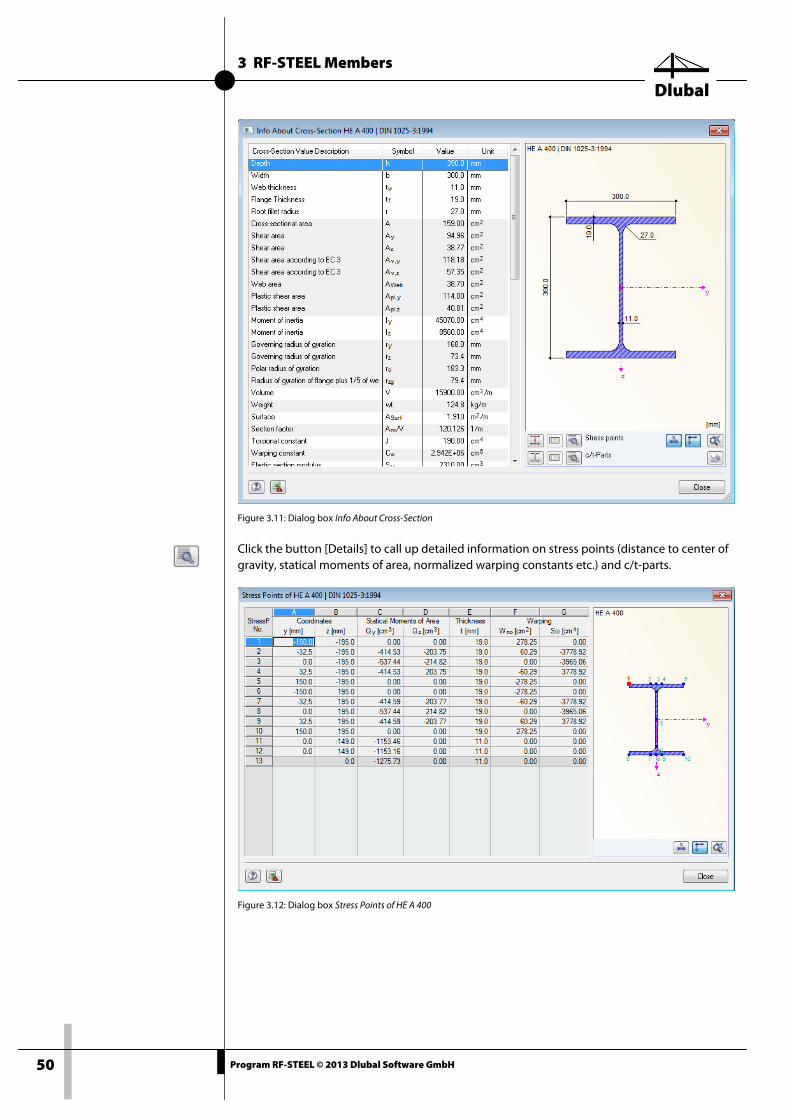
Click the button [Details] to call up detailed information on stress points (distance to center of gravity, statical moments of area, normalized warping constants etc.) and c/t-parts.
Figure 3.12: Dialog box Stress Points of HE A 400
3 RF-STEEL Members
Dlubal
51 Program RF-STEEL © 2013 Dlubal Software GmbH
3.2 Calculation
3.2.1 Detail Settings
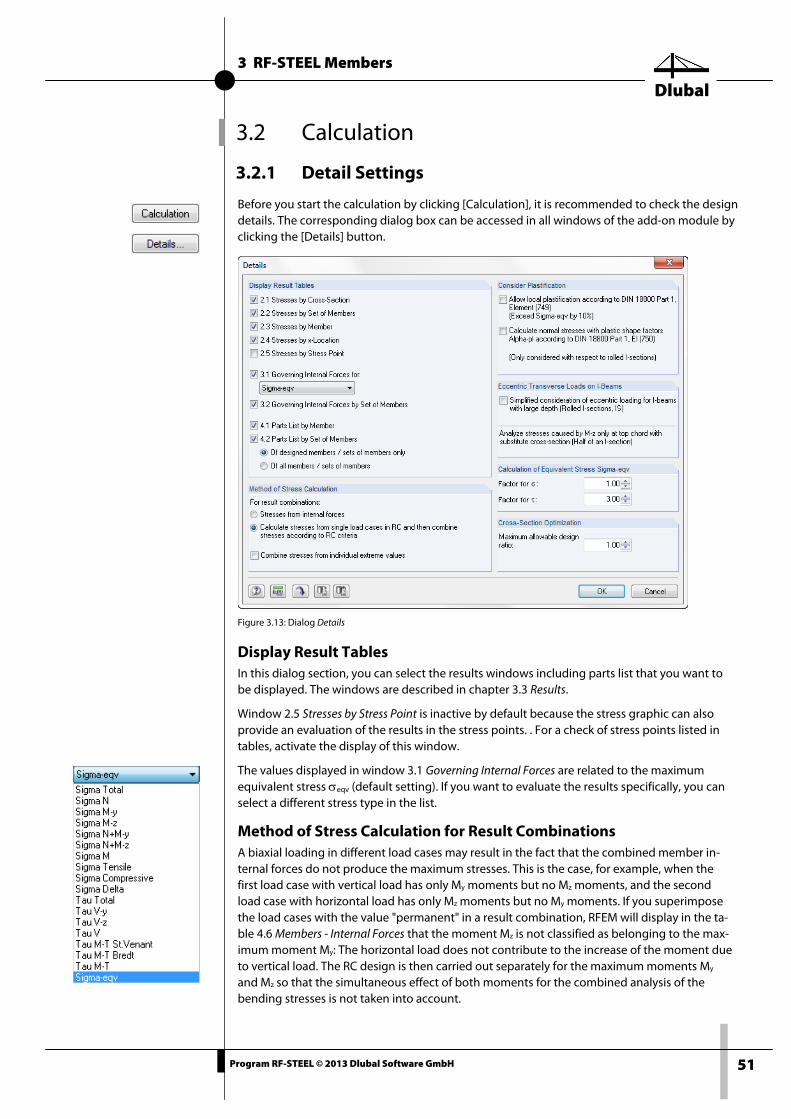
Before you start the calculation by clicking [Calculation], it is recommended to check the design details. The corresponding dialog box can be accessed in all windows of the add-on module by clicking the [Details] button.
Figure 3.13: Dialog Details
Display Result Tables In this dialog section, you can select the results windows including parts list that you want to be displayed. The windows are described in chapter 3.3 Results.
Window 2.5 Stresses by Stress Point is inactive by default because the stress graphic can also provide an evaluation of the results in the stress points. . For a check of stress points listed in tables, activate the display of this window.
The values displayed in window 3.1 Governing Internal Forces are related to the maximum equivalent stress σeqv (default setting). If you want to evaluate the results specifically, you can select a different stress type in the list.
Method of Stress Calculation for Result Combinations A biaxial loading in different load cases may result in the fact that the combined member in-ternal forces do not produce the maximum stresses. This is the case, for example, when the first load case with vertical load has only My moments but no Mz moments, and the second load case with horizontal load has only Mz moments but no My moments. If you superimpose the load cases with the value "permanent" in a result combination, RFEM will display in the ta-ble 4.6 Members - Internal Forces that the moment Mz is not classified as belonging to the max-imum moment My: The horizontal load does not contribute to the increase of the moment due to vertical load. The RC design is then carried out separately for the maximum moments My and Mz so that the simultaneous effect of both moments for the combined analysis of the bending stresses is not taken into account.
3 RF-STEEL Members
Dlubal
52 Program RF-STEEL © 2013 Dlubal Software GmbH
Stresses from Internal Forces
This type of calculation makes direct use of the RFEM table 4.6 Members - Internal Forces. By processing the maximum or minimum internal forces row by row, the stresses for each ex-treme value together with the corresponding internal forces are determined.
The advantage is that the values of the result combinations can be used directly. This has a positive impact on the duration of calculation. In addition to that, the designed internal forces become transparent because in the RF-STEEL window 3.1 Governing Internal Forces by Member the module displays the result rows from the RFEM results table 4.6 Members - Internal Forces.
Calculate Stresses from Single Load Cases and then Combine
This type of calculation is preset to calculate the stresses of result combinations. First, the pro-gram determines the normal and shear stresses of the load cases contained in the RC. Then, these stress components are superimposed according to the conditions specified in the com-bination criterion. Thus, the program ensures that a biaxial bending stress from different load cases results in correct stresses in a biaxial load state.
The calculation is performed for each stress point. The compression, tension and shear stresses determined for each load case are summed up according to the RC superposition criterion and displayed subsequently as stresses of the result combination. The equivalent stress σeqv repre-sents an exception because it is determined by the RC components of σtotal and τtotal. A super-position of equivalent stresses from the load cases would not be correct as it would lead to too high stress ratios.
This type of calculation requires more computing time than the direct use of RC internal forces. Furthermore, the values displayed in window 3.1 Governing Internal Forces by Member for the equivalent stresses are more difficult to understand.
As pure uniaxial bending usually does not occur in complex 3D models, both calculation meth-ods should show the same ratios in the output.
Combine stresses from individual extreme values
The check box is deactivated by default so that the stresses are considered row by row (table of internal forces from RSTAB or stresses from load case internal forces).
If you select this check box, RF-STEEL Members calculates the stresses not from the according internal forces or stresses but from the extreme values of the internal forces or stress compo-nents at each x-location (for example max/min values of N, My, and Mz for normal stress). These "extreme value diagonals" guarantee that the most unfavorable constellation is considered (see the text above introducing the section "Method of Stress Calculation").
Consider Plastification
Allow Local Plastification
If a local plastification according to DIN 18800 part 1, el. (749) is allowed, the equivalent stress σeqv may exceed the allowed limit stress by 10 % in "small areas."
RF-STEEL Members analyzes the conditions mentioned in el. (749) for small areas.
d,RMN 8,0y
σ⋅≤σ+σ
Equation 3.3
d,RMN 8,0z
σ⋅≤σ+σ
Equation 3.4
If the conditions are fulfilled, the limit stress for the design of σeqv will be increased.
3 RF-STEEL Members
Dlubal
53 Program RF-STEEL © 2013 Dlubal Software GmbH
Calculate normal stresses with plastic shape factors αpl
According to DIN 18800 part 1, el. (750), stresses can be reduced by plastic shape factors αpl. This reduction refers to the normal stresses σM due to the bending moments My and Mz.
yzz,pl
zz
yy,pl
yM e
IM
eI
M⋅
⋅α±⋅
⋅α±=σ
Equation 3.5
If you use this plastification option, RF-STEEL Members applies the plastic shape factors αpl,y = 1.14 and αpl,z = 1.25 mentioned in the standard.
The reduction of normal stresses by plastic shape factors according to DIN 18800 part 1, el. (750) is allowed only for rolled I-shaped cross-sections.
Eccentric Transverse Loads on I-Beams If transverse loads are introduced on the upper flange of beams, their influence on the bend-ing stress in the lower flange decreases with increasing cross-section depth. For this reason, it is possible to consider eccentrically acting transverse loads by a simplified method for high I-sections. For each(!) rolled or parametrical symmetrical I-section that is set for design, the bending moment Mz is calculated only on the upper flange. RF-STEEL uses a substitute cross-section with half of the moment of inertia Iz for stress determination.
The advantage of this option is that you can enter the loads in the RFEM model in relation to the centroidal axes in order to avoid torsion.
As the ticked check box affects all symmetrical I-sections of the design case, it is recommended to design all high I-beams in a separate RF-STEEL case (see chapter 6.1, page 90).
Equivalent stress σeqv In this dialog section, you can adjust the factors for the determination of the equivalent stress.
2total2
2total1eqv ff τ⋅+σ⋅=σ
where f1: factor for normal stresses
f2: factor for shear stresses
Equation 3.6
The factors mentioned in DIN 18800 part 1, el. (748) are preset with f1 = 1.0 and f2 = 3.0.
Cross-section Optimization The optimization is targeted on the maximum stress ratio of 100 %. If necessary, you can speci-fy a different limit value in this input field.
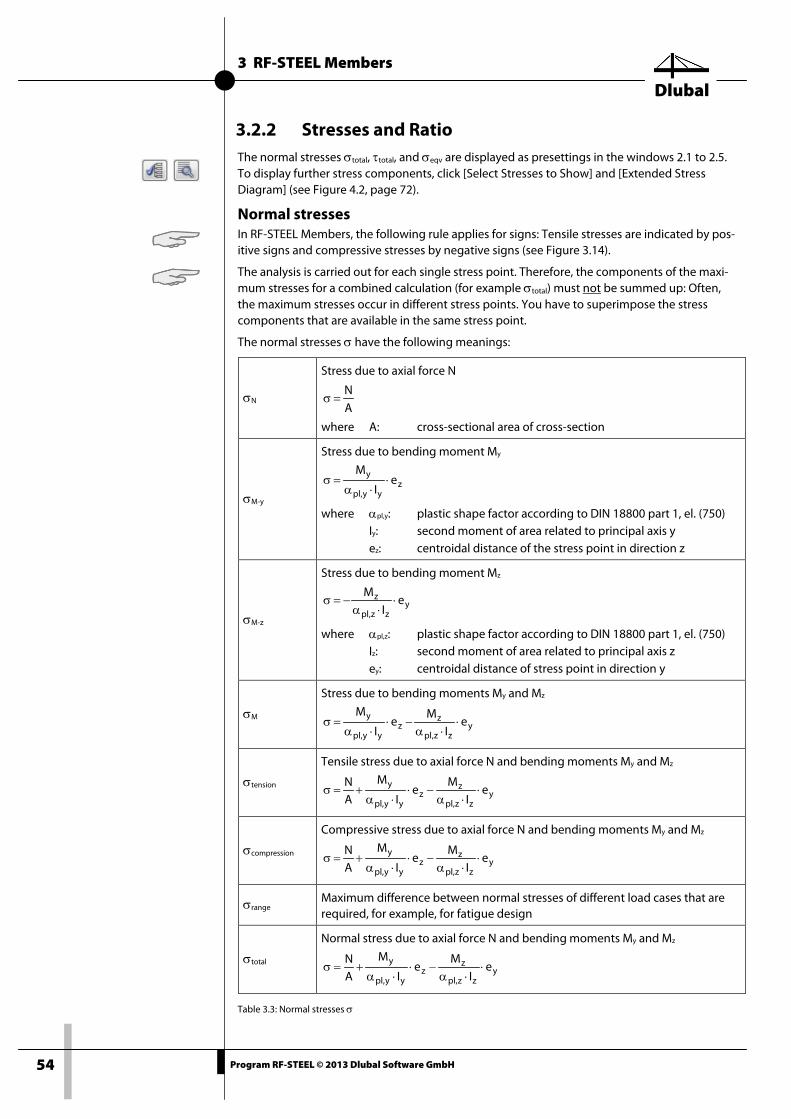
3 RF-STEEL Members
Dlubal
54 Program RF-STEEL © 2013 Dlubal Software GmbH
3.2.2 Stresses and Ratio The normal stresses σtotal, τtotal, and σeqv are displayed as presettings in the windows 2.1 to 2.5. To display further stress components, click [Select Stresses to Show] and [Extended Stress Diagram] (see Figure 4.2, page 72).
Normal stresses In RF-STEEL Members, the following rule applies for signs: Tensile stresses are indicated by pos-itive signs and compressive stresses by negative signs (see Figure 3.14).
The analysis is carried out for each single stress point. Therefore, the components of the maxi-mum stresses for a combined calculation (for example σtotal) must not be summed up: Often, the maximum stresses occur in different stress points. You have to superimpose the stress components that are available in the same stress point.
The normal stresses σ have the following meanings:
σN
Stress due to axial force N
AN
=σ
where A: cross-sectional area of cross-section
σM-y
Stress due to bending moment My
zyy,pl
y eI
M⋅
⋅α=σ
where αpl,y: plastic shape factor according to DIN 18800 part 1, el. (750) Iy: second moment of area related to principal axis y ez: centroidal distance of the stress point in direction z
σM-z
Stress due to bending moment Mz
yzz,pl
z eI
M⋅
⋅α−=σ
where αpl,z: plastic shape factor according to DIN 18800 part 1, el. (750) Iz: second moment of area related to principal axis z ey: centroidal distance of stress point in direction y
σM
Stress due to bending moments My and Mz
yzz,pl
zz
yy,pl
y eI
Me
I
M⋅
⋅α−⋅
⋅α=σ
σtension
Tensile stress due to axial force N and bending moments My and Mz
yzz,pl
zz
yy,pl
y eI
Me
I
M
AN
⋅⋅α
−⋅⋅α
+=σ
σcompression
Compressive stress due to axial force N and bending moments My and Mz
yzz,pl
zz
yy,pl
y eI
Me
I
M
AN
⋅⋅α
−⋅⋅α
+=σ
σrange Maximum difference between normal stresses of different load cases that are required, for example, for fatigue design
σtotal
Normal stress due to axial force N and bending moments My and Mz
yzz,pl
zz
yy,pl
y eI
Me
I
M
AN
⋅⋅α
−⋅⋅α
+=σ
Table 3.3: Normal stresses σ
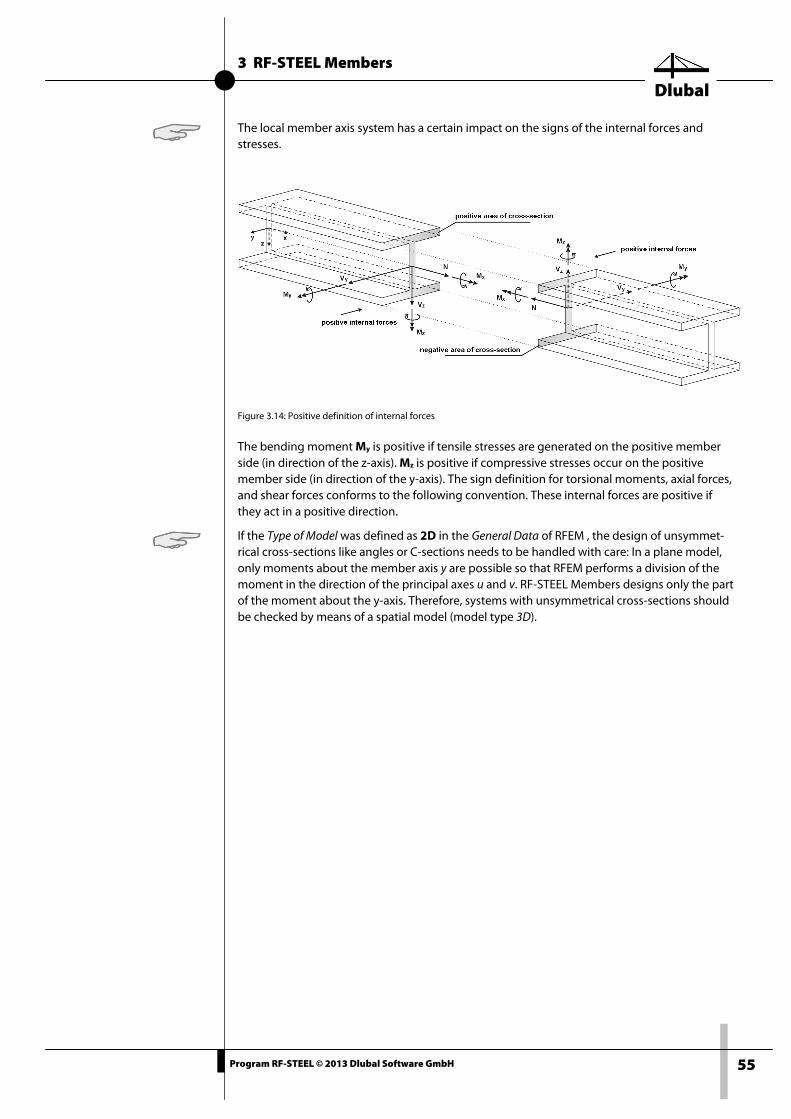
3 RF-STEEL Members
Dlubal
55 Program RF-STEEL © 2013 Dlubal Software GmbH
The local member axis system has a certain impact on the signs of the internal forces and stresses.
Figure 3.14: Positive definition of internal forces
The bending moment My is positive if tensile stresses are generated on the positive member side (in direction of the z-axis). Mz is positive if compressive stresses occur on the positive member side (in direction of the y-axis). The sign definition for torsional moments, axial forces, and shear forces conforms to the following convention. These internal forces are positive if they act in a positive direction.
If the Type of Model was defined as 2D in the General Data of RFEM , the design of unsymmet-rical cross-sections like angles or C-sections needs to be handled with care: In a plane model, only moments about the member axis y are possible so that RFEM performs a division of the moment in the direction of the principal axes u and v. RF-STEEL Members designs only the part of the moment about the y-axis. Therefore, systems with unsymmetrical cross-sections should be checked by means of a spatial model (model type 3D).
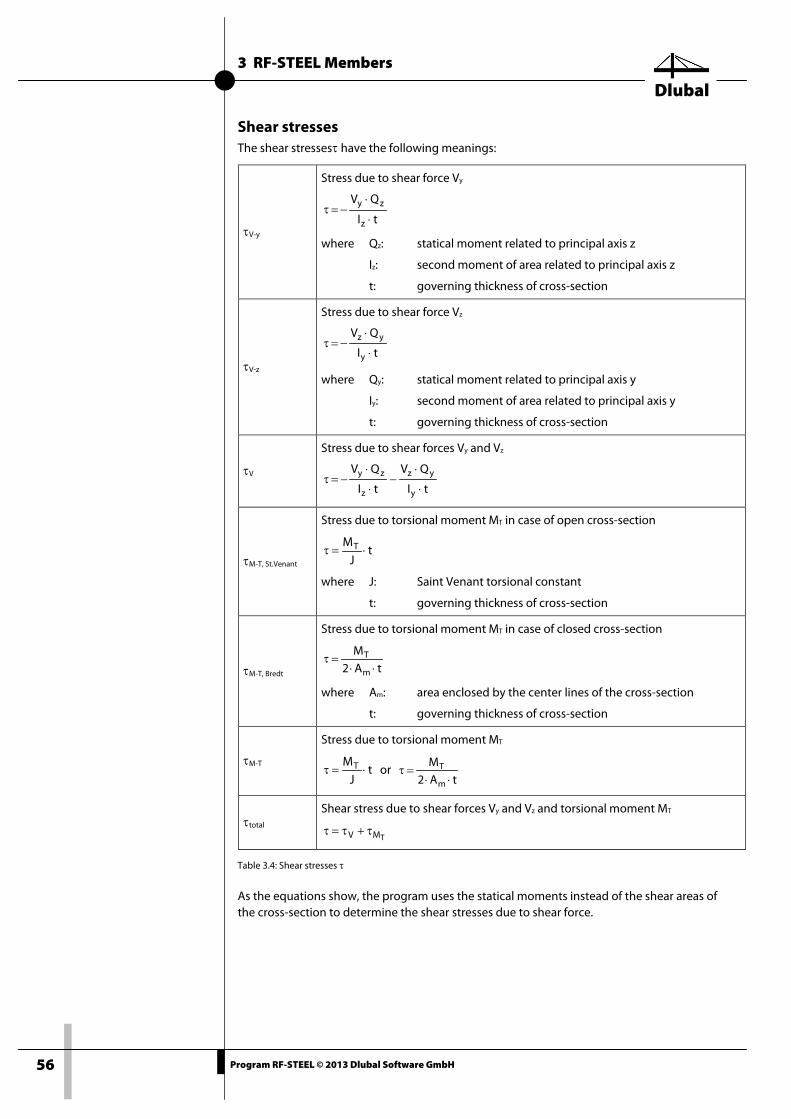
3 RF-STEEL Members
Dlubal
56 Program RF-STEEL © 2013 Dlubal Software GmbH
Shear stresses The shear stressesτ have the following meanings:
τV-y
Stress due to shear force Vy
tI
QV
z
zy
⋅
⋅−=τ
where Qz: statical moment related to principal axis z
Iz: second moment of area related to principal axis z
t: governing thickness of cross-section
τV-z
Stress due to shear force Vz
tI
QV
y
yz
⋅
⋅−=τ
where Qy: statical moment related to principal axis y
Iy: second moment of area related to principal axis y
t: governing thickness of cross-section
τV
Stress due to shear forces Vy and Vz
tI
QV
tI
QV
y
yz
z
zy
⋅
⋅−
⋅
⋅−=τ
τM-T, St.Venant
Stress due to torsional moment MT in case of open cross-section
tJ
MT ⋅=τ
where J: Saint Venant torsional constant
t: governing thickness of cross-section
τM-T, Bredt
Stress due to torsional moment MT in case of closed cross-section
tA2M
m
T
⋅⋅=τ
where Am: area enclosed by the center lines of the cross-section
t: governing thickness of cross-section
τM-T
Stress due to torsional moment MT
tJ
MT ⋅=τ or tA2
M
m
T
⋅⋅=τ
τtotal Shear stress due to shear forces Vy and Vz and torsional moment MT
TMV τ+τ=τ
Table 3.4: Shear stresses τ
As the equations show, the program uses the statical moments instead of the shear areas of the cross-section to determine the shear stresses due to shear force.
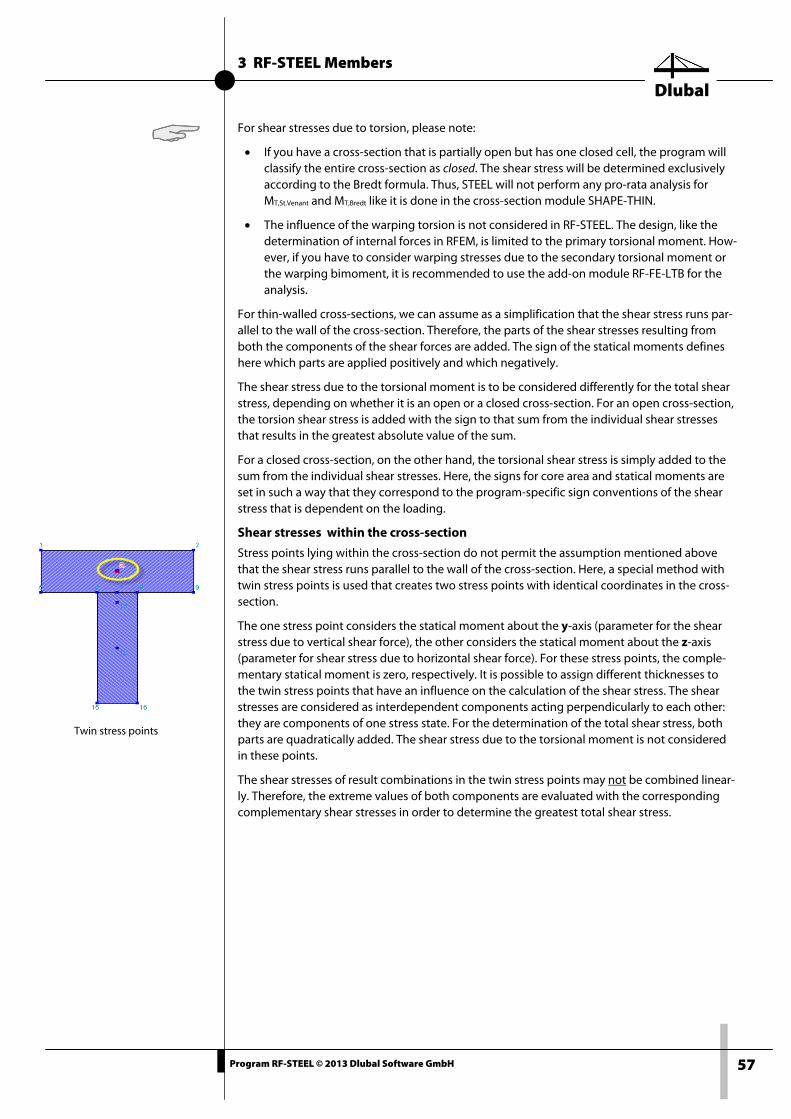
3 RF-STEEL Members
Dlubal
57 Program RF-STEEL © 2013 Dlubal Software GmbH
Twin stress points
For shear stresses due to torsion, please note:
• If you have a cross-section that is partially open but has one closed cell, the program will classify the entire cross-section as closed. The shear stress will be determined exclusively according to the Bredt formula. Thus, STEEL will not perform any pro-rata analysis for MT,St.Venant and MT,Bredt like it is done in the cross-section module SHAPE-THIN.
• The influence of the warping torsion is not considered in RF-STEEL. The design, like the determination of internal forces in RFEM, is limited to the primary torsional moment. How-ever, if you have to consider warping stresses due to the secondary torsional moment or the warping bimoment, it is recommended to use the add-on module RF-FE-LTB for the analysis.
For thin-walled cross-sections, we can assume as a simplification that the shear stress runs par-allel to the wall of the cross-section. Therefore, the parts of the shear stresses resulting from both the components of the shear forces are added. The sign of the statical moments defines here which parts are applied positively and which negatively.
The shear stress due to the torsional moment is to be considered differently for the total shear stress, depending on whether it is an open or a closed cross-section. For an open cross-section, the torsion shear stress is added with the sign to that sum from the individual shear stresses that results in the greatest absolute value of the sum.
For a closed cross-section, on the other hand, the torsional shear stress is simply added to the sum from the individual shear stresses. Here, the signs for core area and statical moments are set in such a way that they correspond to the program-specific sign conventions of the shear stress that is dependent on the loading.
Shear stresses within the cross-section
Stress points lying within the cross-section do not permit the assumption mentioned above that the shear stress runs parallel to the wall of the cross-section. Here, a special method with twin stress points is used that creates two stress points with identical coordinates in the cross-section.
The one stress point considers the statical moment about the y-axis (parameter for the shear stress due to vertical shear force), the other considers the statical moment about the z-axis (parameter for shear stress due to horizontal shear force). For these stress points, the comple-mentary statical moment is zero, respectively. It is possible to assign different thicknesses to the twin stress points that have an influence on the calculation of the shear stress. The shear stresses are considered as interdependent components acting perpendicularly to each other: they are components of one stress state. For the determination of the total shear stress, both parts are quadratically added. The shear stress due to the torsional moment is not considered in these points.
The shear stresses of result combinations in the twin stress points may not be combined linear-ly. Therefore, the extreme values of both components are evaluated with the corresponding complementary shear stresses in order to determine the greatest total shear stress.
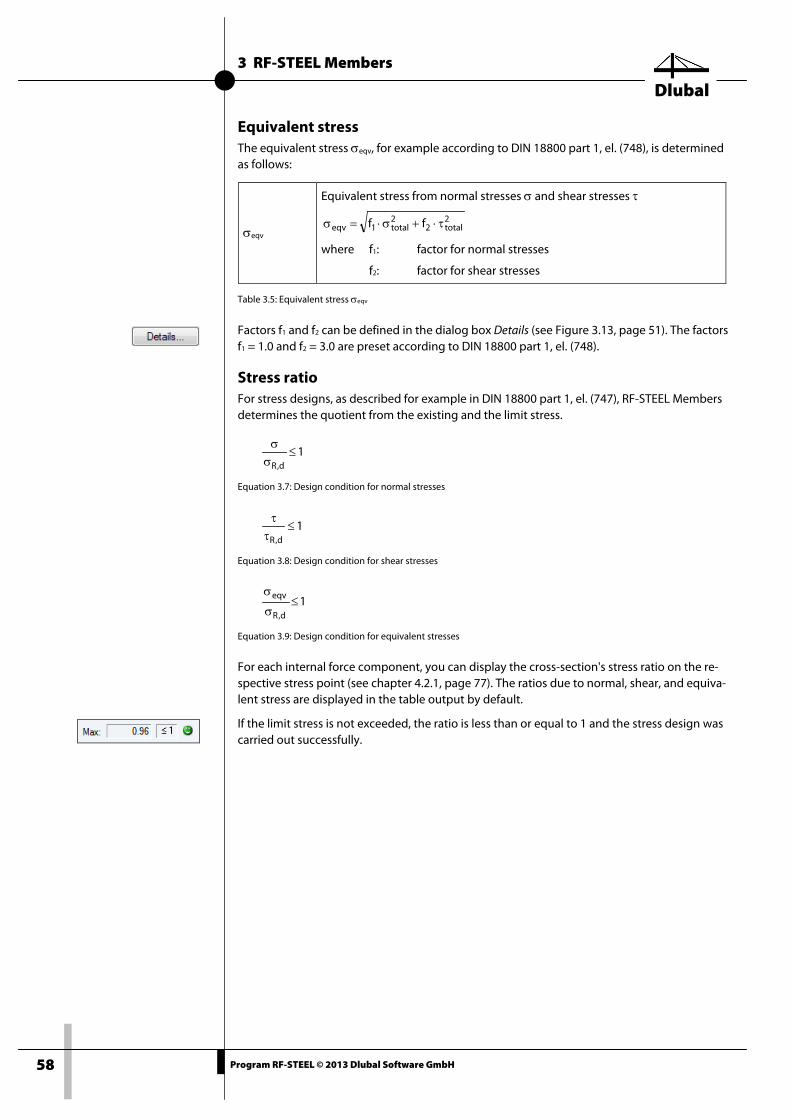
3 RF-STEEL Members
Dlubal
58 Program RF-STEEL © 2013 Dlubal Software GmbH
Equivalent stress The equivalent stress σeqv, for example according to DIN 18800 part 1, el. (748), is determined as follows:
σeqv
Equivalent stress from normal stresses σ and shear stresses τ
2total2
2total1eqv ff τ⋅+σ⋅=σ
where f1: factor for normal stresses
f2: factor for shear stresses
Table 3.5: Equivalent stress σeqv
Factors f1 and f2 can be defined in the dialog box Details (see Figure 3.13, page 51). The factors f1 = 1.0 and f2 = 3.0 are preset according to DIN 18800 part 1, el. (748).
Stress ratio For stress designs, as described for example in DIN 18800 part 1, el. (747), RF-STEEL Members determines the quotient from the existing and the limit stress.
1d,R≤
σσ
Equation 3.7: Design condition for normal stresses
1d,R≤
ττ
Equation 3.8: Design condition for shear stresses
1d,R
eqv ≤σ
σ
Equation 3.9: Design condition for equivalent stresses
For each internal force component, you can display the cross-section's stress ratio on the re-spective stress point (see chapter 4.2.1, page 77). The ratios due to normal, shear, and equiva-lent stress are displayed in the table output by default.
If the limit stress is not exceeded, the ratio is less than or equal to 1 and the stress design was carried out successfully.
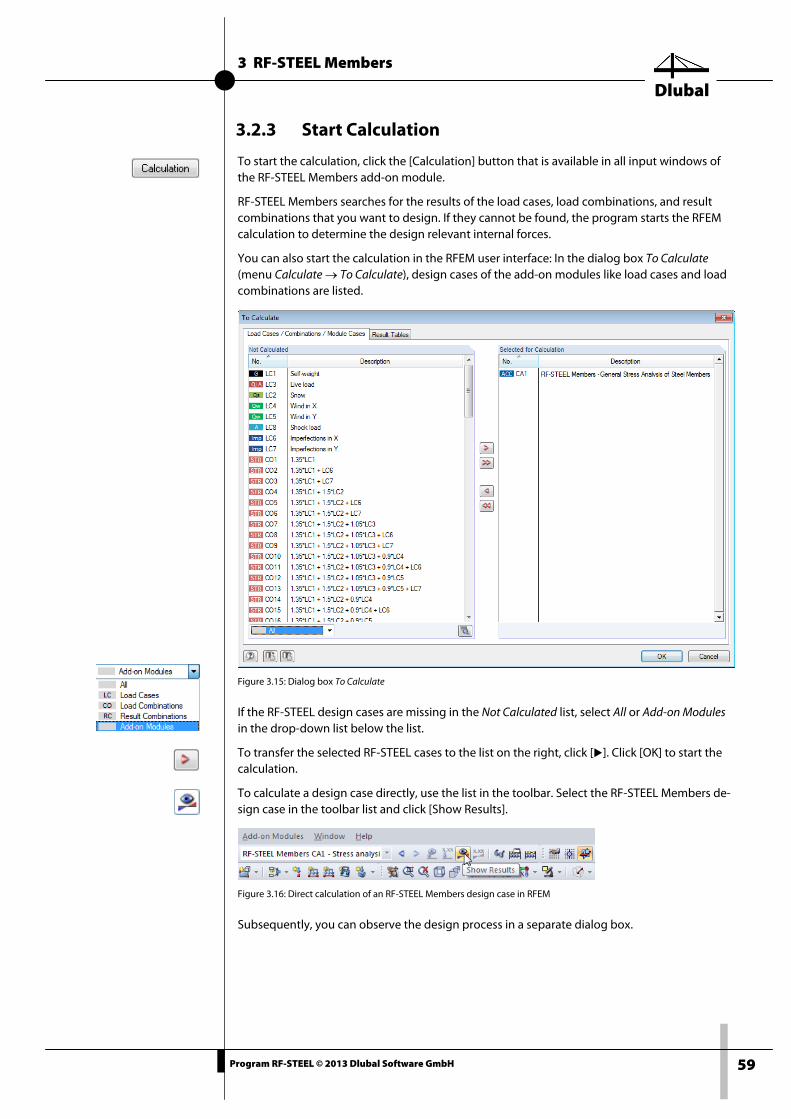
3 RF-STEEL Members
Dlubal
59 Program RF-STEEL © 2013 Dlubal Software GmbH
3.2.3 Start Calculation
To start the calculation, click the [Calculation] button that is available in all input windows of the RF-STEEL Members add-on module.
RF-STEEL Members searches for the results of the load cases, load combinations, and result combinations that you want to design. If they cannot be found, the program starts the RFEM calculation to determine the design relevant internal forces.
You can also start the calculation in the RFEM user interface: In the dialog box To Calculate (menu Calculate → To Calculate), design cases of the add-on modules like load cases and load combinations are listed.
Figure 3.15: Dialog box To Calculate
If the RF-STEEL design cases are missing in the Not Calculated list, select All or Add-on Modules in the drop-down list below the list.
To transfer the selected RF-STEEL cases to the list on the right, click []. Click [OK] to start the calculation.
To calculate a design case directly, use the list in the toolbar. Select the RF-STEEL Members de-sign case in the toolbar list and click [Show Results].
Figure 3.16: Direct calculation of an RF-STEEL Members design case in RFEM
Subsequently, you can observe the design process in a separate dialog box.
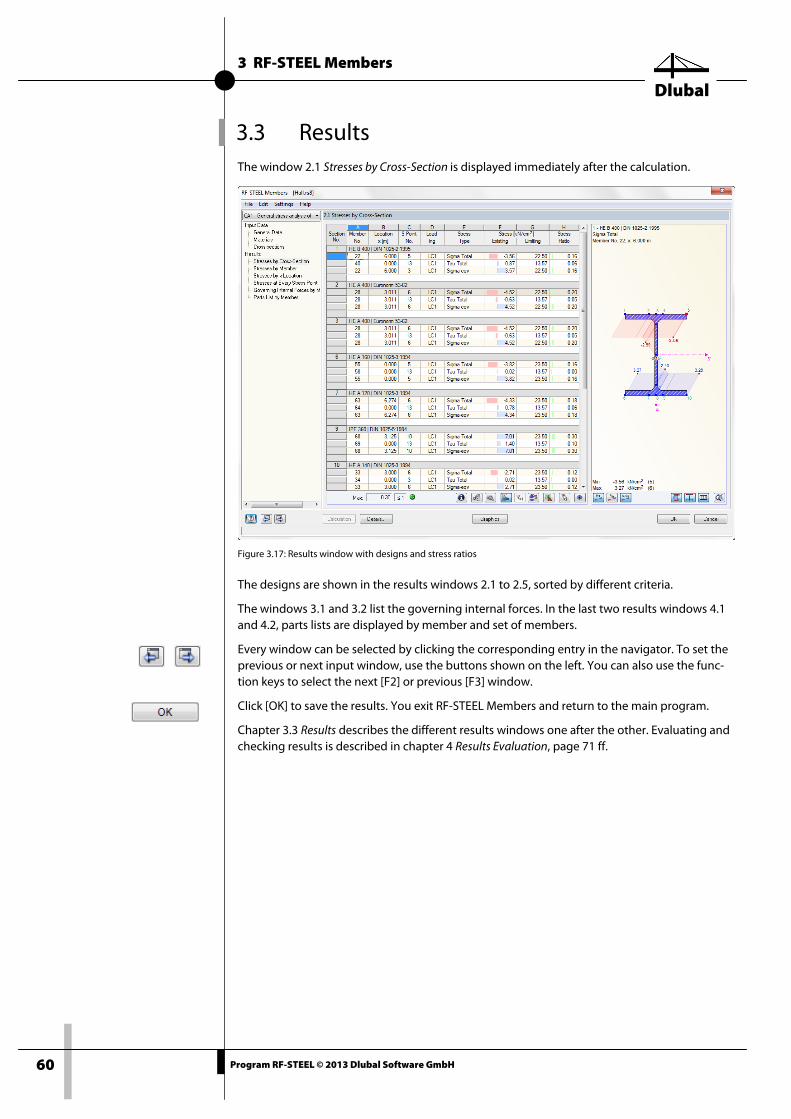
3 RF-STEEL Members
Dlubal
60 Program RF-STEEL © 2013 Dlubal Software GmbH
3.3 Results The window 2.1 Stresses by Cross-Section is displayed immediately after the calculation.
Figure 3.17: Results window with designs and stress ratios
The designs are shown in the results windows 2.1 to 2.5, sorted by different criteria.
The windows 3.1 and 3.2 list the governing internal forces. In the last two results windows 4.1 and 4.2, parts lists are displayed by member and set of members.
Every window can be selected by clicking the corresponding entry in the navigator. To set the previous or next input window, use the buttons shown on the left. You can also use the func-tion keys to select the next [F2] or previous [F3] window.
Click [OK] to save the results. You exit RF-STEEL Members and return to the main program.
Chapter 3.3 Results describes the different results windows one after the other. Evaluating and checking results is described in chapter 4 Results Evaluation, page 71 ff.
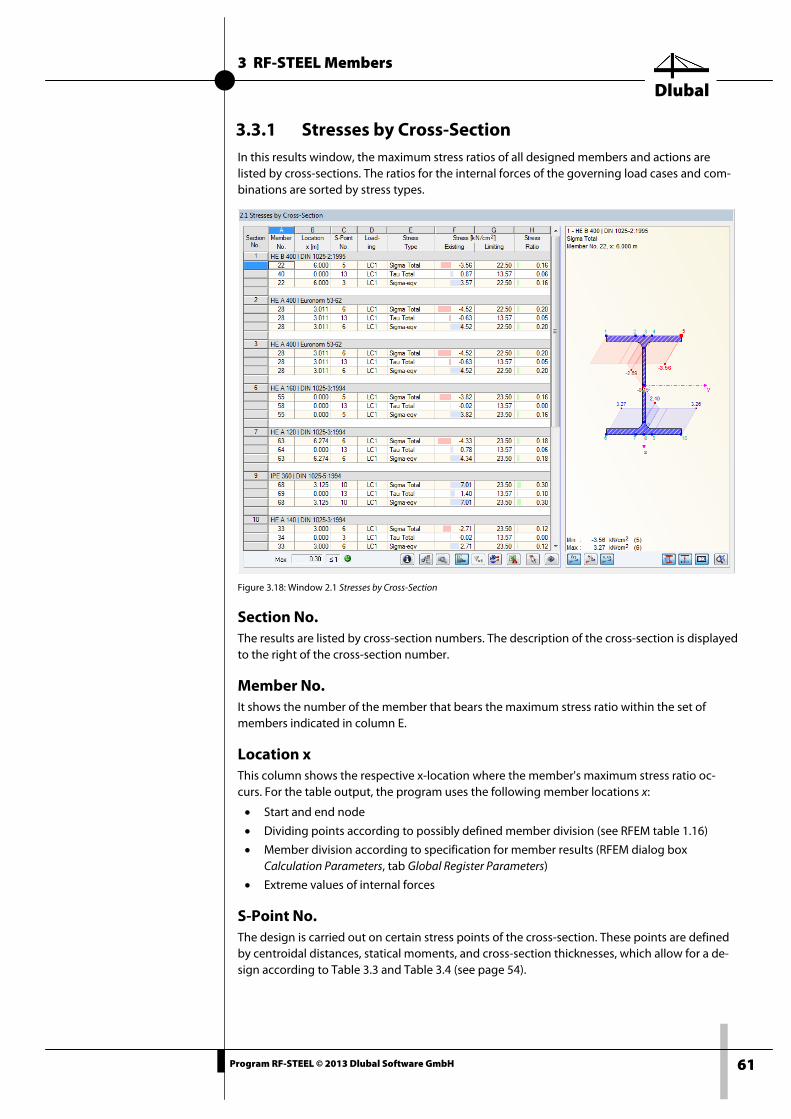
3 RF-STEEL Members
Dlubal
61 Program RF-STEEL © 2013 Dlubal Software GmbH
3.3.1 Stresses by Cross-Section In this results window, the maximum stress ratios of all designed members and actions are listed by cross-sections. The ratios for the internal forces of the governing load cases and com-binations are sorted by stress types.
Figure 3.18: Window 2.1 Stresses by Cross-Section
Section No. The results are listed by cross-section numbers. The description of the cross-section is displayed to the right of the cross-section number.
Member No. It shows the number of the member that bears the maximum stress ratio within the set of members indicated in column E.
Location x This column shows the respective x-location where the member's maximum stress ratio oc-curs. For the table output, the program uses the following member locations x:
• Start and end node
• Dividing points according to possibly defined member division (see RFEM table 1.16)
• Member division according to specification for member results (RFEM dialog box Calculation Parameters, tab Global Register Parameters)
• Extreme values of internal forces
S-Point No. The design is carried out on certain stress points of the cross-section. These points are defined by centroidal distances, statical moments, and cross-section thicknesses, which allow for a de-sign according to Table 3.3 and Table 3.4 (see page 54).
3 RF-STEEL Members
Dlubal
62 Program RF-STEEL © 2013 Dlubal Software GmbH
All default cross-sections of the library as well as the SHAPE cross-sections are provided with stress points on the design relevant cross-section locations. For user-defined cross-sections, the parameters of the stress points must be defined manually or else a design in RF-STEEL Members will not be possible.
The cross-section dialog graphic on the right shows the stress points including numbering. The currently selected stress point (that means the stress point of the table row where the pointer is placed) is highlighted red.
To check the stress point's properties, click [Extended Stress Diagram] (see chapter 4.2.2, page 79).
Loading Column D displays the numbers of the load cases, load combinations, and result combinations whose internal forces produce the respective maximum stress ratios.
Stress Type Ratios due to normal stress σtotal, shear stress τtotal, and equivalent stress σeqv are set by default. The determination of these stresses is described in Table 3.3, Table 3.4, and Table 3.5 on page 54 to 58.
You can display the components of the total stresses in order to check the data (see Figure 3.19). The stress components can be selected in the dialog box Stresses - Filter which can be opened using the button shown on the left (see Figure 4.6, page 77).
Stress Existing This column displays the extreme values of the existing stresses determined according to the equations in Table 3.3, Table 3.4, and Table 3.5 (see page 54 to 58).
Stress Limiting This column shows the limit stresses of window 1.2, column E to G (see chapter 3.1.2, page 42). In particular, they are the following:
• Limit normal stress σx as the allowable stress for actions due to bending and axial force
• Limit shear stress τ as the allowable shear stress due to shear and torsion
• Limit equivalent stress σeqv as the allowable equivalent stress for the simultaneous effect of normal and shear stresses
Stress ratio The last column shows the quotient from the existing and the limiting stress. If the limiting stress is kept, the ratio is less than or equal to 1 and the stress design was carried out success-fully.
The length of the colored scales represents the respective stress ratios.
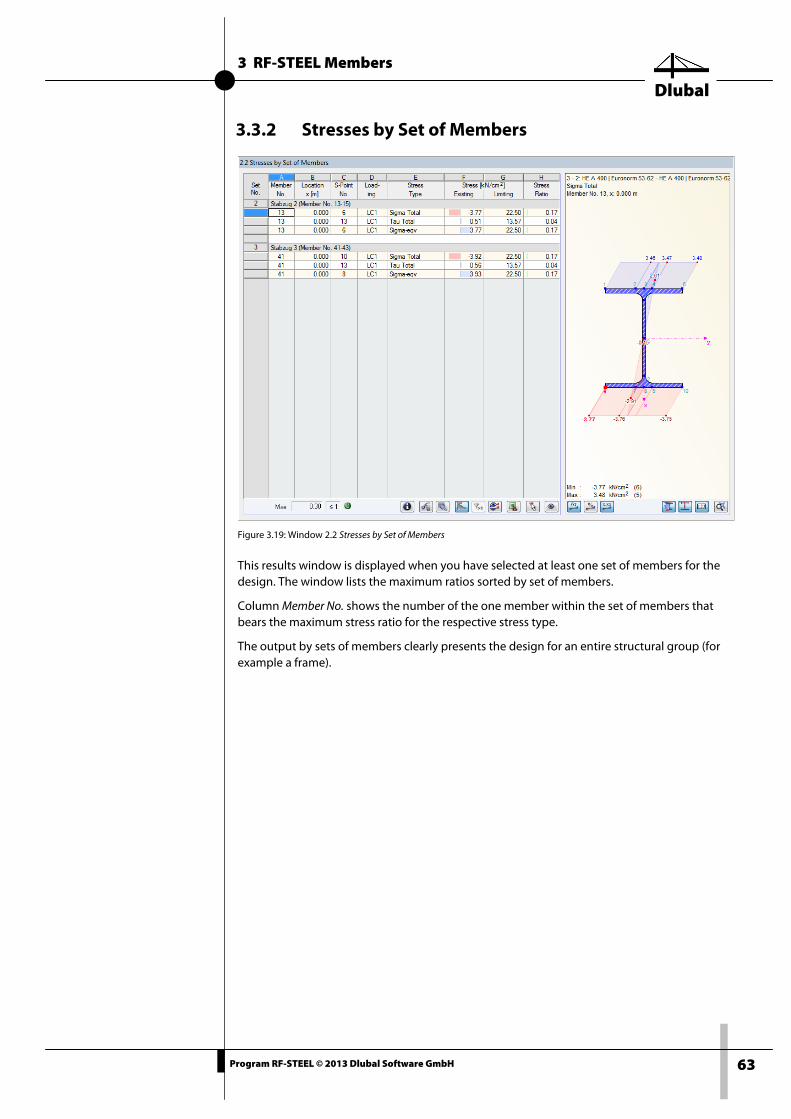
3 RF-STEEL Members
Dlubal
63 Program RF-STEEL © 2013 Dlubal Software GmbH
3.3.2 Stresses by Set of Members
Figure 3.19: Window 2.2 Stresses by Set of Members
This results window is displayed when you have selected at least one set of members for the design. The window lists the maximum ratios sorted by set of members.
Column Member No. shows the number of the one member within the set of members that bears the maximum stress ratio for the respective stress type.
The output by sets of members clearly presents the design for an entire structural group (for example a frame).
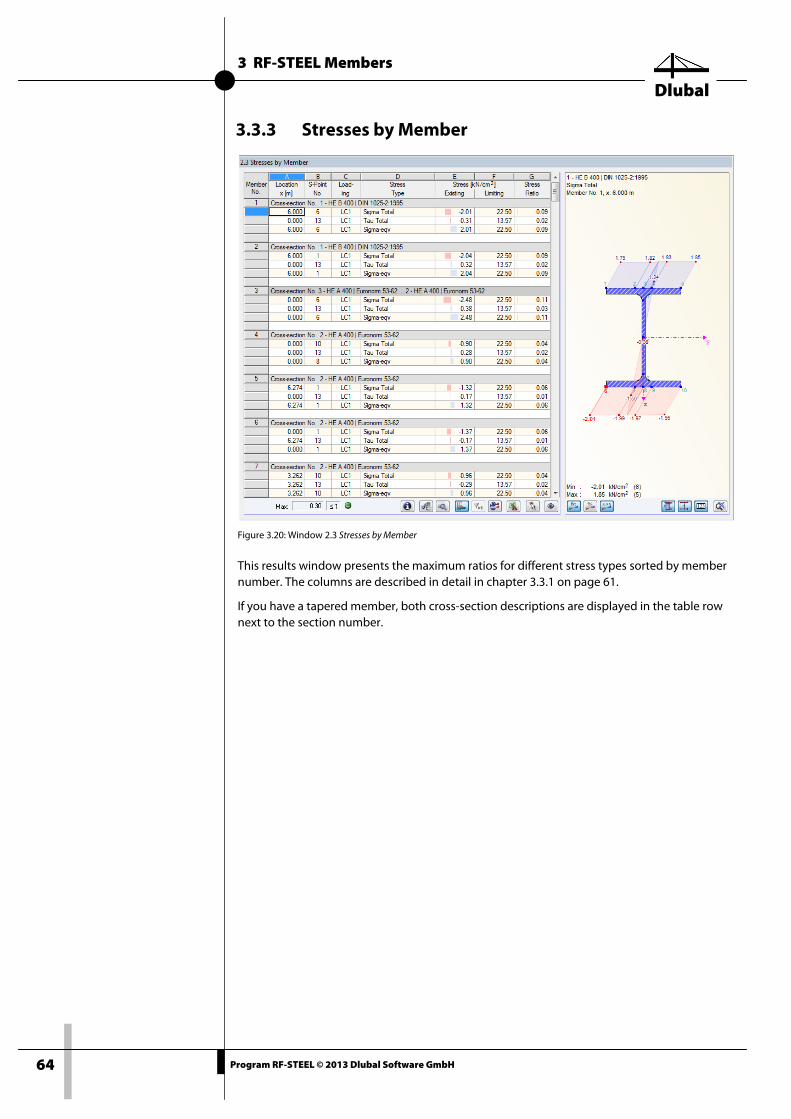
3 RF-STEEL Members
Dlubal
64 Program RF-STEEL © 2013 Dlubal Software GmbH
3.3.3 Stresses by Member
Figure 3.20: Window 2.3 Stresses by Member
This results window presents the maximum ratios for different stress types sorted by member number. The columns are described in detail in chapter 3.3.1 on page 61.
If you have a tapered member, both cross-section descriptions are displayed in the table row next to the section number.
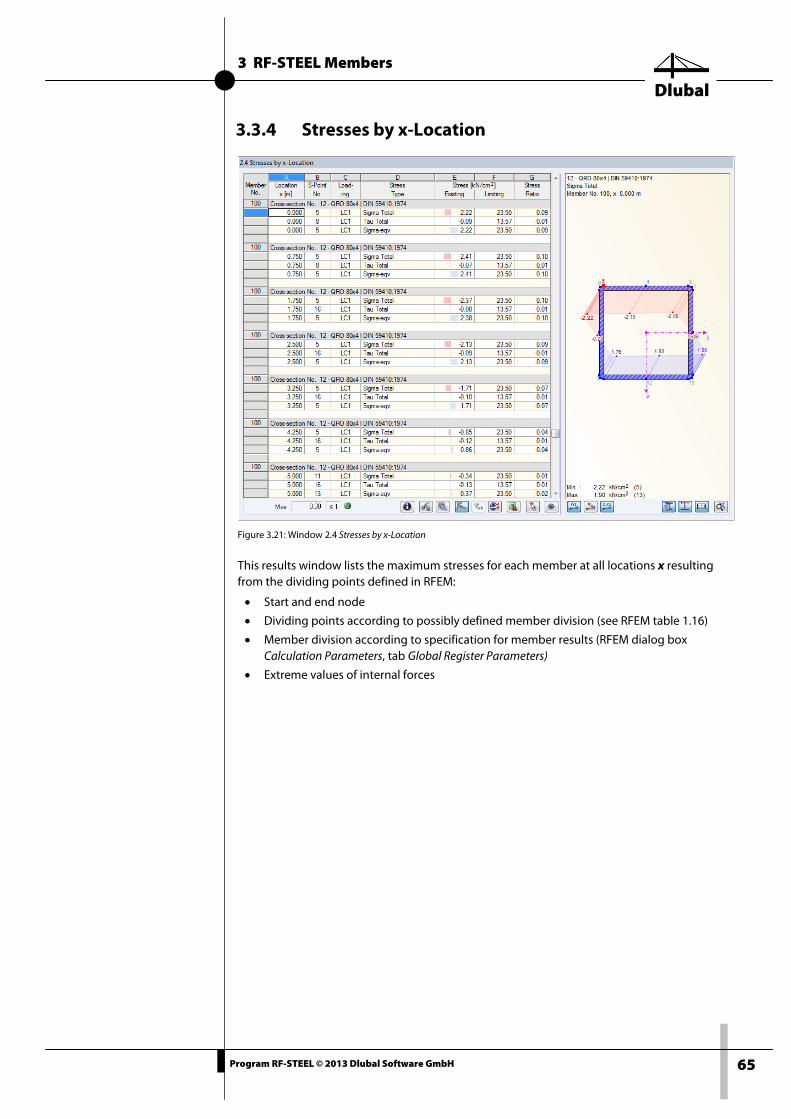
3 RF-STEEL Members
Dlubal
65 Program RF-STEEL © 2013 Dlubal Software GmbH
3.3.4 Stresses by x-Location
Figure 3.21: Window 2.4 Stresses by x-Location
This results window lists the maximum stresses for each member at all locations x resulting from the dividing points defined in RFEM:
• Start and end node
• Dividing points according to possibly defined member division (see RFEM table 1.16)
• Member division according to specification for member results (RFEM dialog box Calculation Parameters, tab Global Register Parameters)
• Extreme values of internal forces
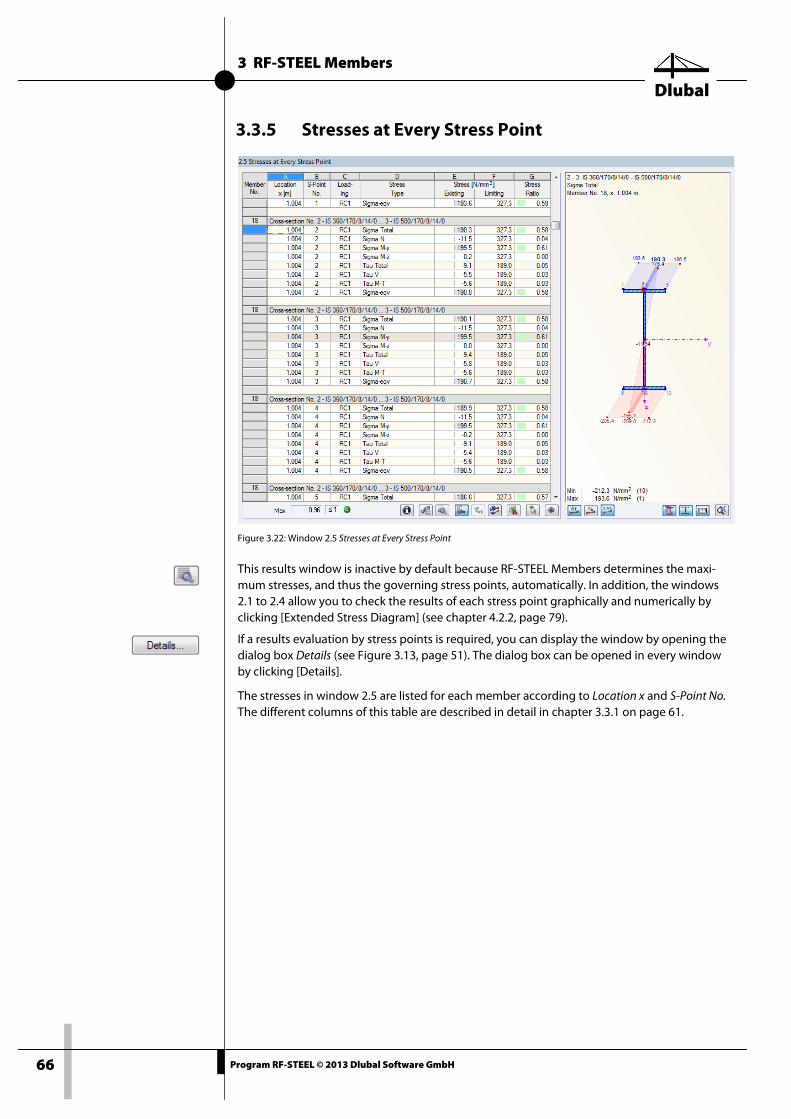
3 RF-STEEL Members
Dlubal
66 Program RF-STEEL © 2013 Dlubal Software GmbH
3.3.5 Stresses at Every Stress Point
Figure 3.22: Window 2.5 Stresses at Every Stress Point
This results window is inactive by default because RF-STEEL Members determines the maxi-mum stresses, and thus the governing stress points, automatically. In addition, the windows 2.1 to 2.4 allow you to check the results of each stress point graphically and numerically by clicking [Extended Stress Diagram] (see chapter 4.2.2, page 79).
If a results evaluation by stress points is required, you can display the window by opening the dialog box Details (see Figure 3.13, page 51). The dialog box can be opened in every window by clicking [Details].
The stresses in window 2.5 are listed for each member according to Location x and S-Point No. The different columns of this table are described in detail in chapter 3.3.1 on page 61.
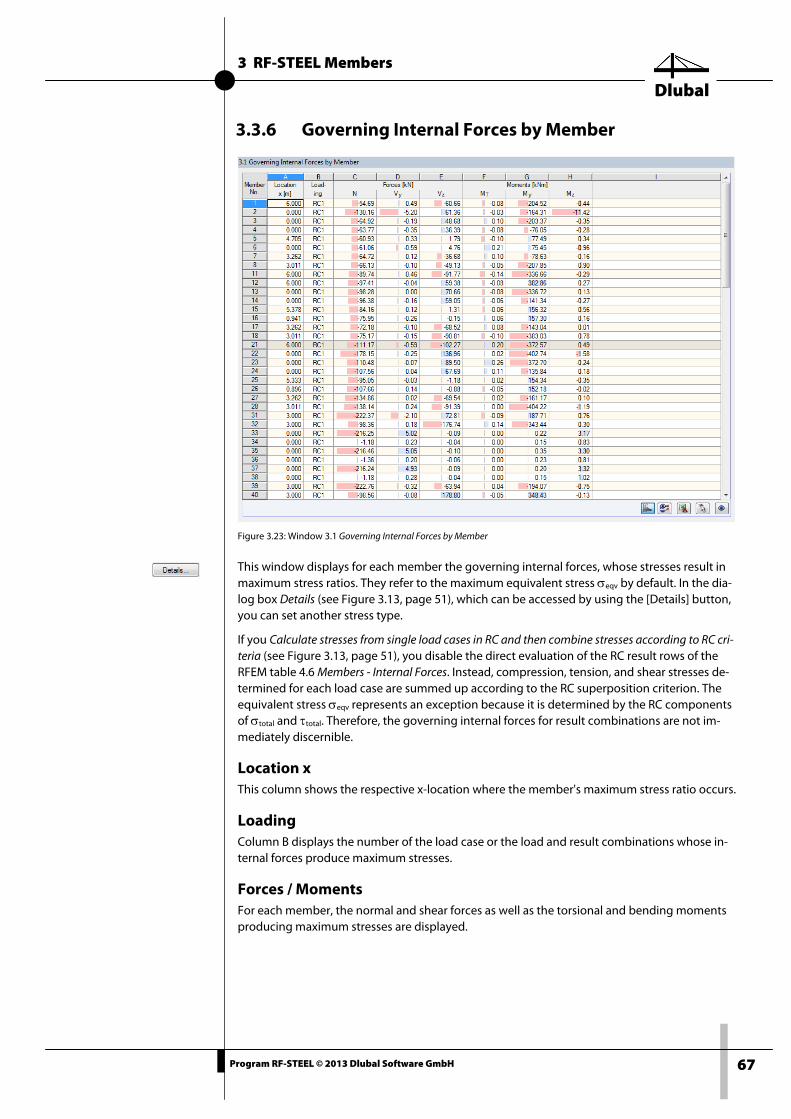
3 RF-STEEL Members
Dlubal
67 Program RF-STEEL © 2013 Dlubal Software GmbH
3.3.6 Governing Internal Forces by Member
Figure 3.23: Window 3.1 Governing Internal Forces by Member
This window displays for each member the governing internal forces, whose stresses result in maximum stress ratios. They refer to the maximum equivalent stress σeqv by default. In the dia-log box Details (see Figure 3.13, page 51), which can be accessed by using the [Details] button, you can set another stress type.
If you Calculate stresses from single load cases in RC and then combine stresses according to RC cri-teria (see Figure 3.13, page 51), you disable the direct evaluation of the RC result rows of the RFEM table 4.6 Members - Internal Forces. Instead, compression, tension, and shear stresses de-termined for each load case are summed up according to the RC superposition criterion. The equivalent stress σeqv represents an exception because it is determined by the RC components of σtotal and τtotal. Therefore, the governing internal forces for result combinations are not im-mediately discernible.
Location x This column shows the respective x-location where the member's maximum stress ratio occurs.
Loading Column B displays the number of the load case or the load and result combinations whose in-ternal forces produce maximum stresses.
Forces / Moments For each member, the normal and shear forces as well as the torsional and bending moments producing maximum stresses are displayed.
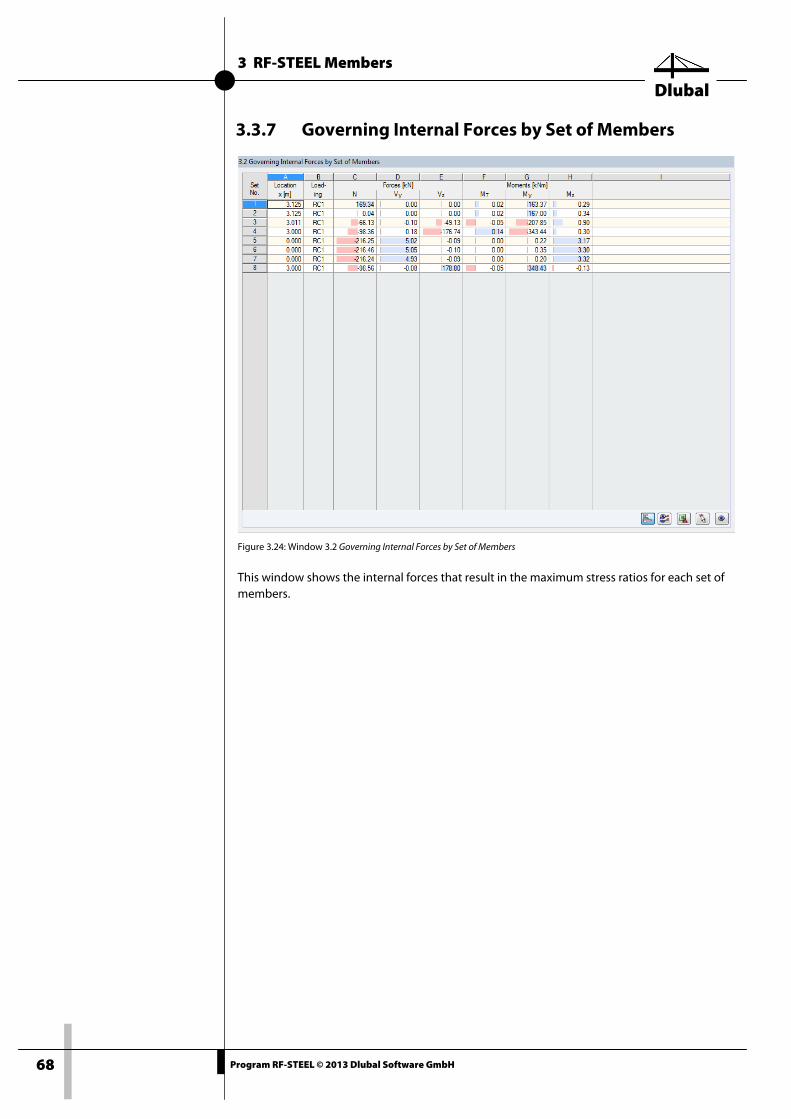
3 RF-STEEL Members
Dlubal
68 Program RF-STEEL © 2013 Dlubal Software GmbH
3.3.7 Governing Internal Forces by Set of Members
Figure 3.24: Window 3.2 Governing Internal Forces by Set of Members
This window shows the internal forces that result in the maximum stress ratios for each set of members.
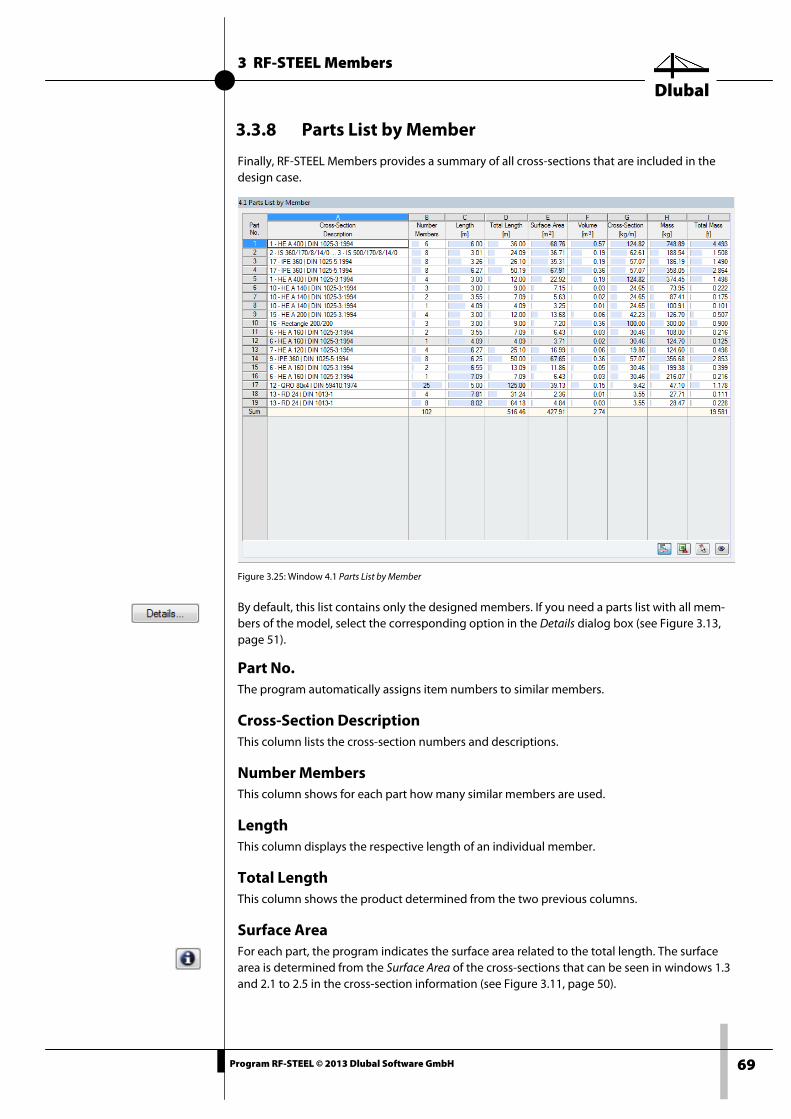
3 RF-STEEL Members
Dlubal
69 Program RF-STEEL © 2013 Dlubal Software GmbH
3.3.8 Parts List by Member
Finally, RF-STEEL Members provides a summary of all cross-sections that are included in the design case.
Figure 3.25: Window 4.1 Parts List by Member
By default, this list contains only the designed members. If you need a parts list with all mem-bers of the model, select the corresponding option in the Details dialog box (see Figure 3.13, page 51).
Part No. The program automatically assigns item numbers to similar members.
Cross-Section Description This column lists the cross-section numbers and descriptions.
Number Members This column shows for each part how many similar members are used.
Length This column displays the respective length of an individual member.
Total Length This column shows the product determined from the two previous columns.
Surface Area For each part, the program indicates the surface area related to the total length. The surface area is determined from the Surface Area of the cross-sections that can be seen in windows 1.3 and 2.1 to 2.5 in the cross-section information (see Figure 3.11, page 50).
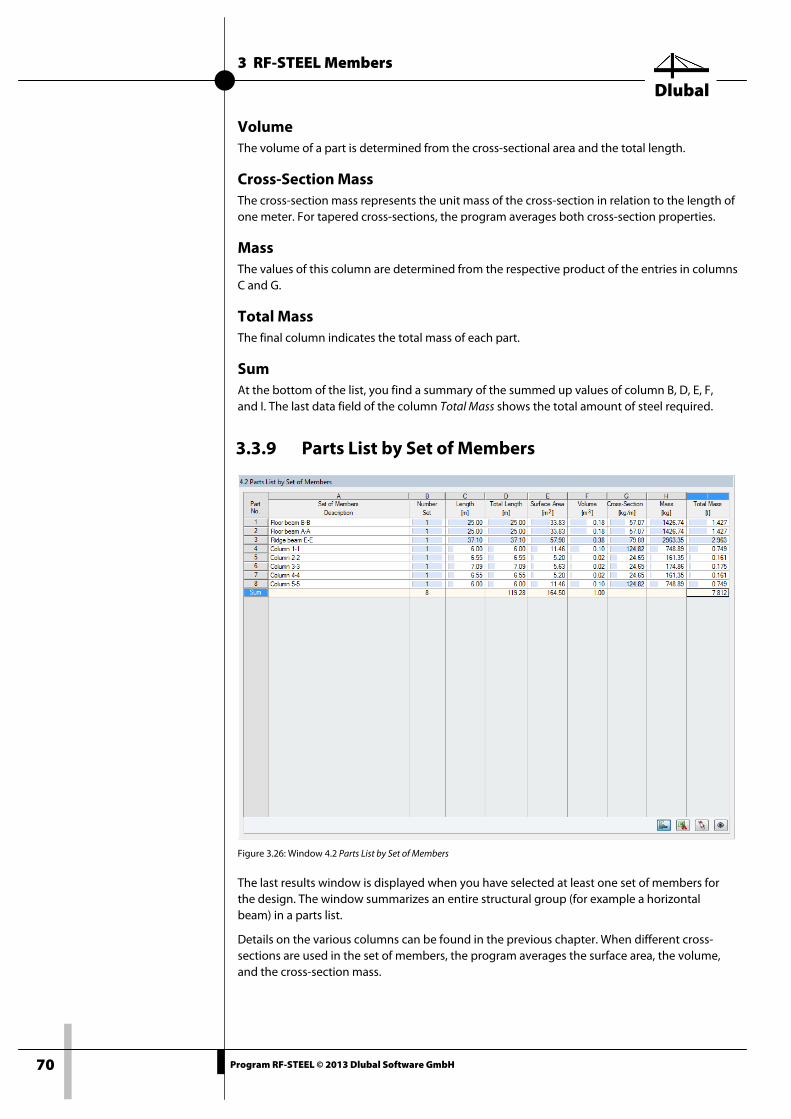
3 RF-STEEL Members
Dlubal
70 Program RF-STEEL © 2013 Dlubal Software GmbH
Volume The volume of a part is determined from the cross-sectional area and the total length.
Cross-Section Mass The cross-section mass represents the unit mass of the cross-section in relation to the length of one meter. For tapered cross-sections, the program averages both cross-section properties.
Mass The values of this column are determined from the respective product of the entries in columns C and G.
Total Mass The final column indicates the total mass of each part.
Sum At the bottom of the list, you find a summary of the summed up values of column B, D, E, F, and I. The last data field of the column Total Mass shows the total amount of steel required.
3.3.9 Parts List by Set of Members
Figure 3.26: Window 4.2 Parts List by Set of Members
The last results window is displayed when you have selected at least one set of members for the design. The window summarizes an entire structural group (for example a horizontal beam) in a parts list.
Details on the various columns can be found in the previous chapter. When different cross-sections are used in the set of members, the program averages the surface area, the volume, and the cross-section mass.
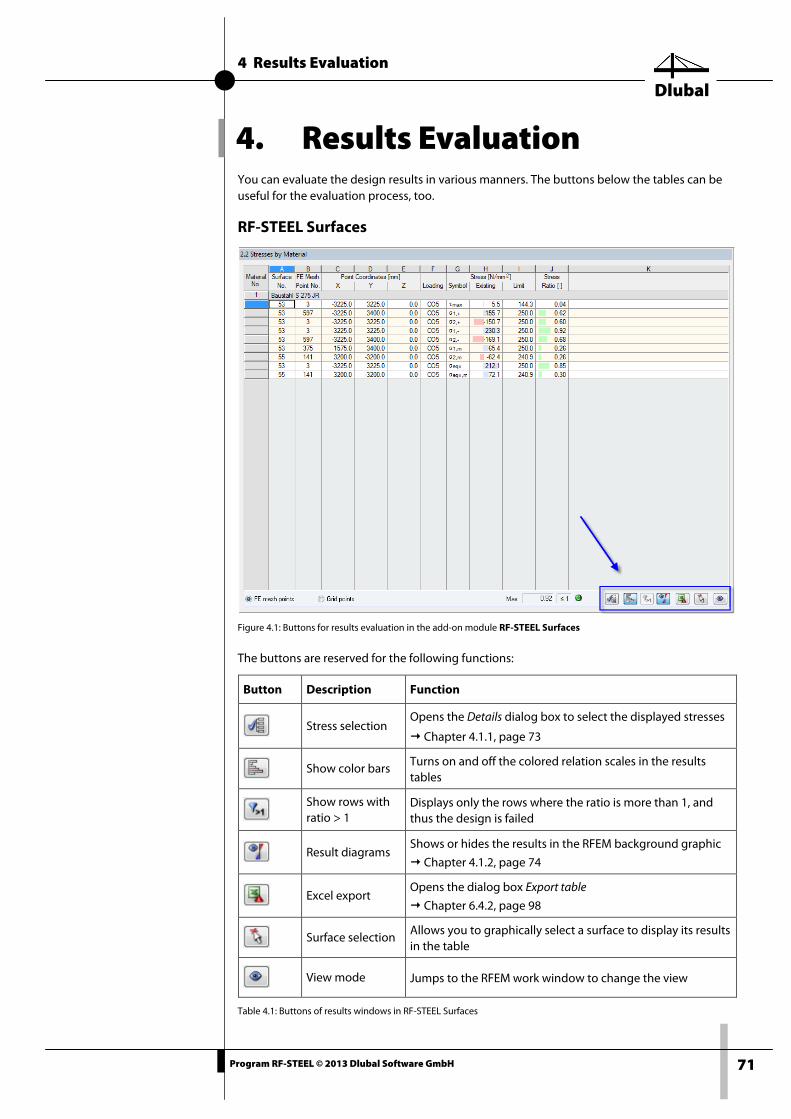
4 Results Evaluation
Dlubal
71 Program RF-STEEL © 2013 Dlubal Software GmbH
4. Results Evaluation You can evaluate the design results in various manners. The buttons below the tables can be useful for the evaluation process, too.
RF-STEEL Surfaces
Figure 4.1: Buttons for results evaluation in the add-on module RF-STEEL Surfaces
The buttons are reserved for the following functions:
Button Description Function
Stress selection Opens the Details dialog box to select the displayed stresses
Chapter 4.1.1, page 73
Show color bars Turns on and off the colored relation scales in the results tables
Show rows with ratio > 1
Displays only the rows where the ratio is more than 1, and thus the design is failed
Result diagrams Shows or hides the results in the RFEM background graphic
Chapter 4.1.2, page 74
Excel export Opens the dialog box Export table
Chapter 6.4.2, page 98
Surface selection Allows you to graphically select a surface to display its results in the table
View mode Jumps to the RFEM work window to change the view
Table 4.1: Buttons of results windows in RF-STEEL Surfaces
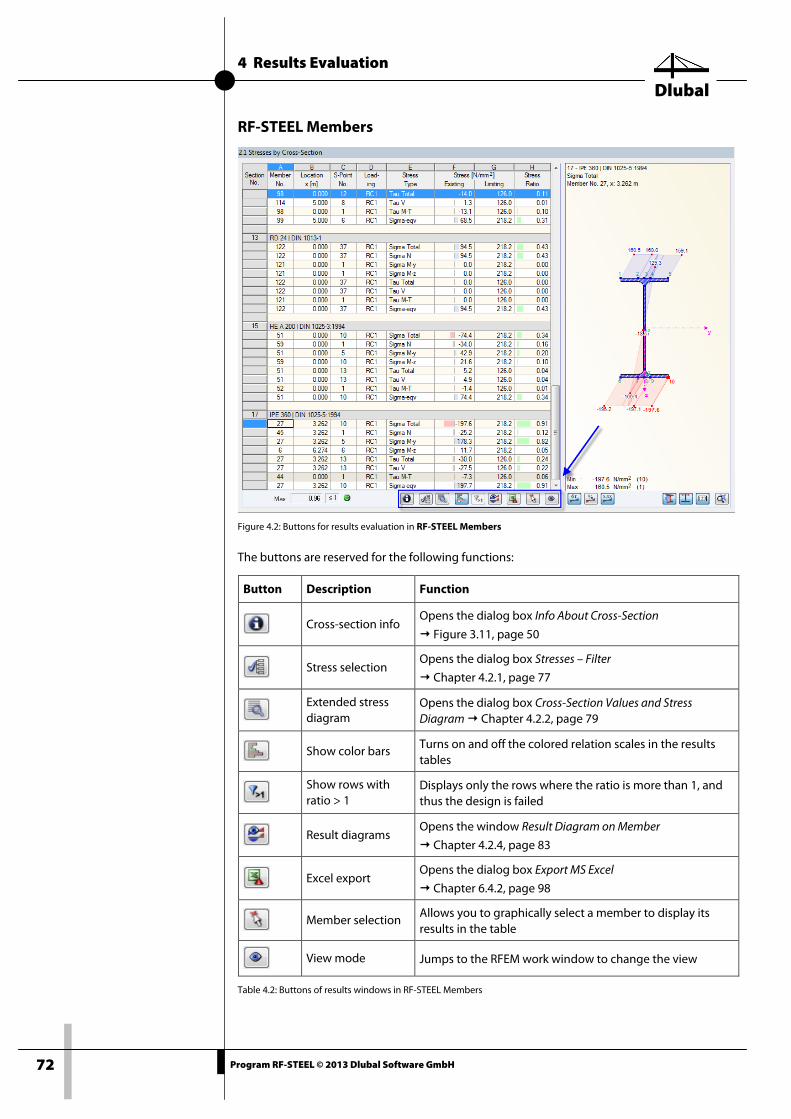
4 Results Evaluation
Dlubal
72 Program RF-STEEL © 2013 Dlubal Software GmbH
RF-STEEL Members
Figure 4.2: Buttons for results evaluation in RF-STEEL Members
The buttons are reserved for the following functions:
Button Description Function
Cross-section info Opens the dialog box Info About Cross-Section
Figure 3.11, page 50
Stress selection Opens the dialog box Stresses – Filter
Chapter 4.2.1, page 77
Extended stress diagram
Opens the dialog box Cross-Section Values and Stress Diagram Chapter 4.2.2, page 79
Show color bars Turns on and off the colored relation scales in the results tables
Show rows with ratio > 1
Displays only the rows where the ratio is more than 1, and thus the design is failed
Result diagrams Opens the window Result Diagram on Member
Chapter 4.2.4, page 83
Excel export Opens the dialog box Export MS Excel
Chapter 6.4.2, page 98
Member selection Allows you to graphically select a member to display its results in the table
View mode Jumps to the RFEM work window to change the view
Table 4.2: Buttons of results windows in RF-STEEL Members
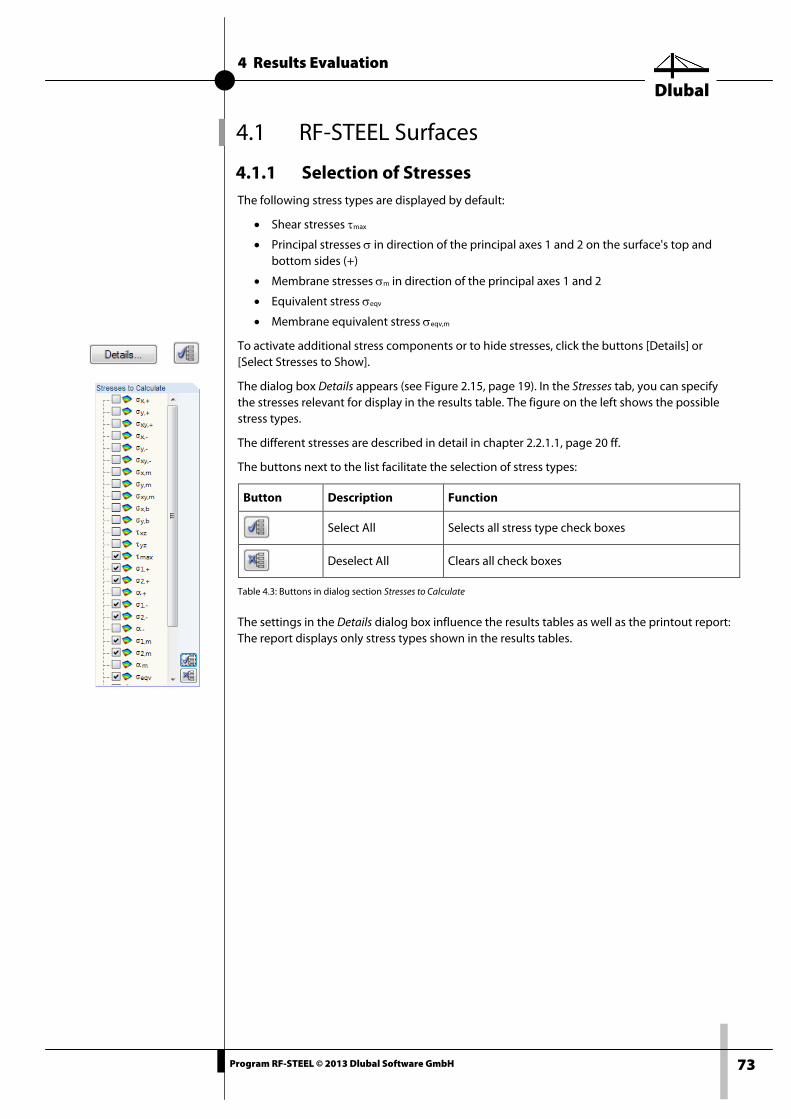
4 Results Evaluation
Dlubal
73 Program RF-STEEL © 2013 Dlubal Software GmbH
4.1 RF-STEEL Surfaces
4.1.1 Selection of Stresses The following stress types are displayed by default:
• Shear stresses τmax
• Principal stresses σ in direction of the principal axes 1 and 2 on the surface's top and bottom sides (+)
• Membrane stresses σm in direction of the principal axes 1 and 2
• Equivalent stress σeqv
• Membrane equivalent stress σeqv,m
To activate additional stress components or to hide stresses, click the buttons [Details] or [Select Stresses to Show].
The dialog box Details appears (see Figure 2.15, page 19). In the Stresses tab, you can specify the stresses relevant for display in the results table. The figure on the left shows the possible stress types.
The different stresses are described in detail in chapter 2.2.1.1, page 20 ff.
The buttons next to the list facilitate the selection of stress types:
Button Description Function
Select All Selects all stress type check boxes
Deselect All Clears all check boxes
Table 4.3: Buttons in dialog section Stresses to Calculate
The settings in the Details dialog box influence the results tables as well as the printout report: The report displays only stress types shown in the results tables.
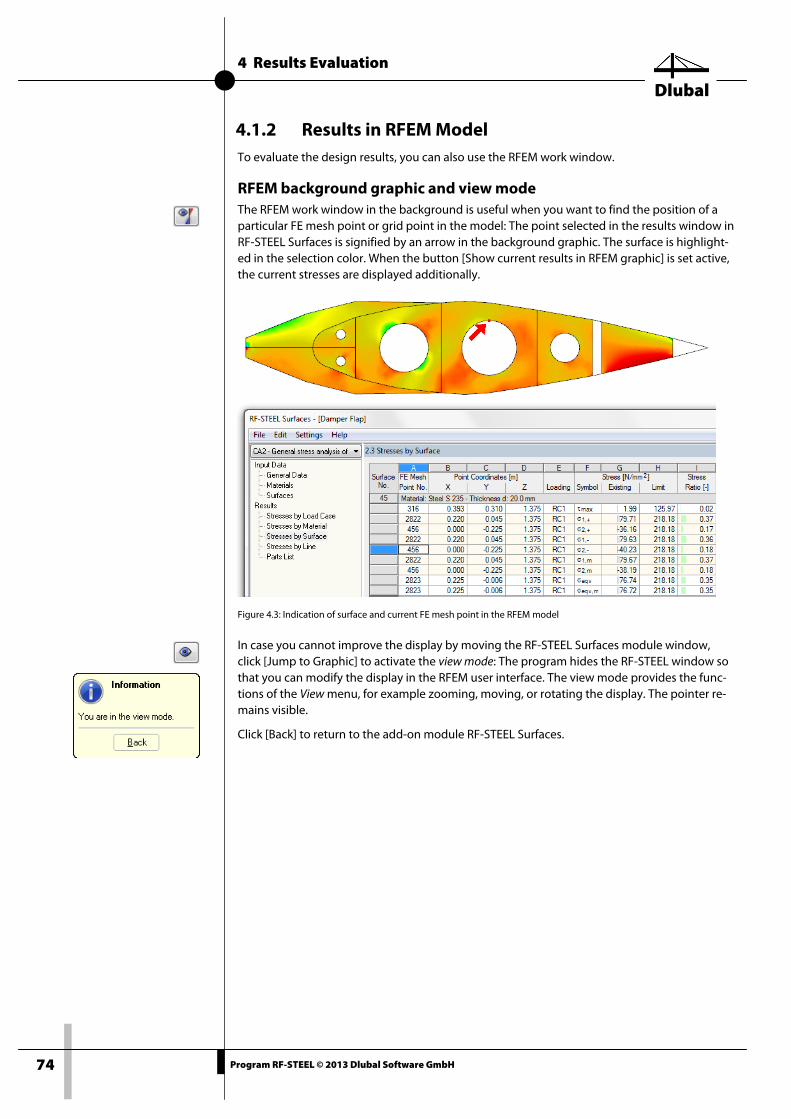
4 Results Evaluation
Dlubal
74 Program RF-STEEL © 2013 Dlubal Software GmbH
4.1.2 Results in RFEM Model To evaluate the design results, you can also use the RFEM work window.
RFEM background graphic and view mode The RFEM work window in the background is useful when you want to find the position of a particular FE mesh point or grid point in the model: The point selected in the results window in RF-STEEL Surfaces is signified by an arrow in the background graphic. The surface is highlight-ed in the selection color. When the button [Show current results in RFEM graphic] is set active, the current stresses are displayed additionally.
Figure 4.3: Indication of surface and current FE mesh point in the RFEM model
In case you cannot improve the display by moving the RF-STEEL Surfaces module window, click [Jump to Graphic] to activate the view mode: The program hides the RF-STEEL window so that you can modify the display in the RFEM user interface. The view mode provides the func-tions of the View menu, for example zooming, moving, or rotating the display. The pointer re-mains visible.
Click [Back] to return to the add-on module RF-STEEL Surfaces.
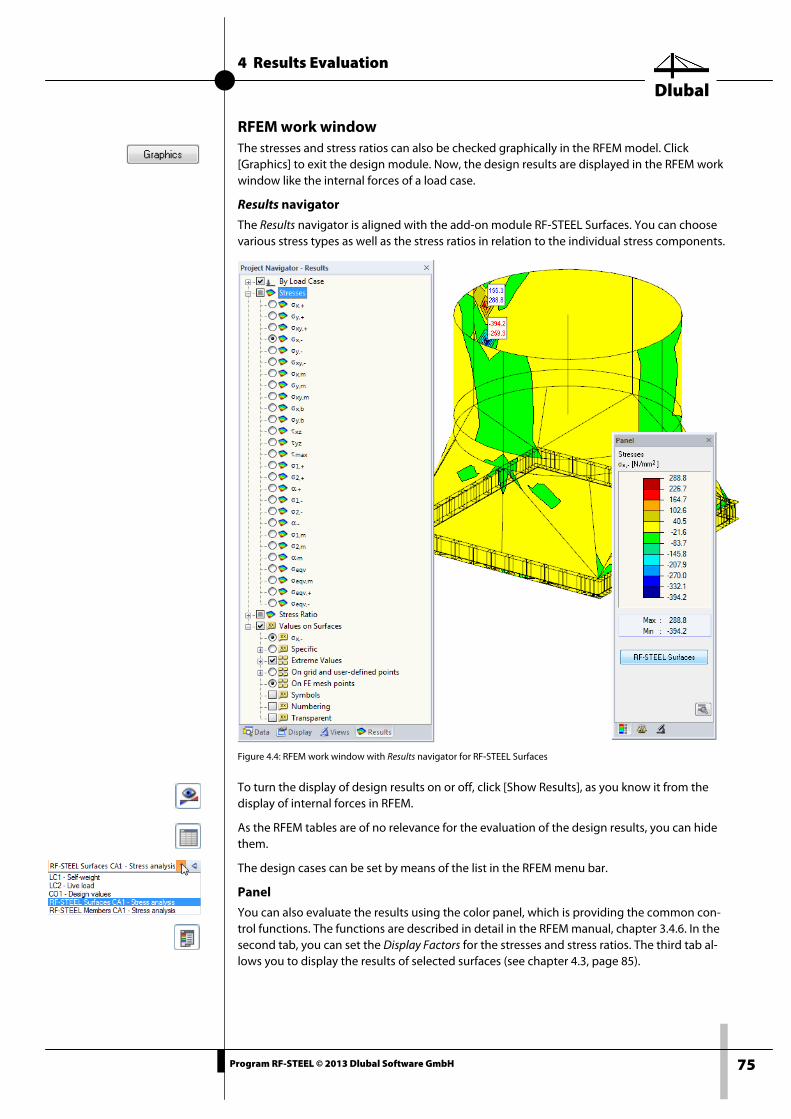
4 Results Evaluation
Dlubal
75 Program RF-STEEL © 2013 Dlubal Software GmbH
RFEM work window The stresses and stress ratios can also be checked graphically in the RFEM model. Click [Graphics] to exit the design module. Now, the design results are displayed in the RFEM work window like the internal forces of a load case.
Results navigator
The Results navigator is aligned with the add-on module RF-STEEL Surfaces. You can choose various stress types as well as the stress ratios in relation to the individual stress components.
Figure 4.4: RFEM work window with Results navigator for RF-STEEL Surfaces
To turn the display of design results on or off, click [Show Results], as you know it from the display of internal forces in RFEM.
As the RFEM tables are of no relevance for the evaluation of the design results, you can hide them.
The design cases can be set by means of the list in the RFEM menu bar.
Panel
You can also evaluate the results using the color panel, which is providing the common con-trol functions. The functions are described in detail in the RFEM manual, chapter 3.4.6. In the second tab, you can set the Display Factors for the stresses and stress ratios. The third tab al-lows you to display the results of selected surfaces (see chapter 4.3, page 85).
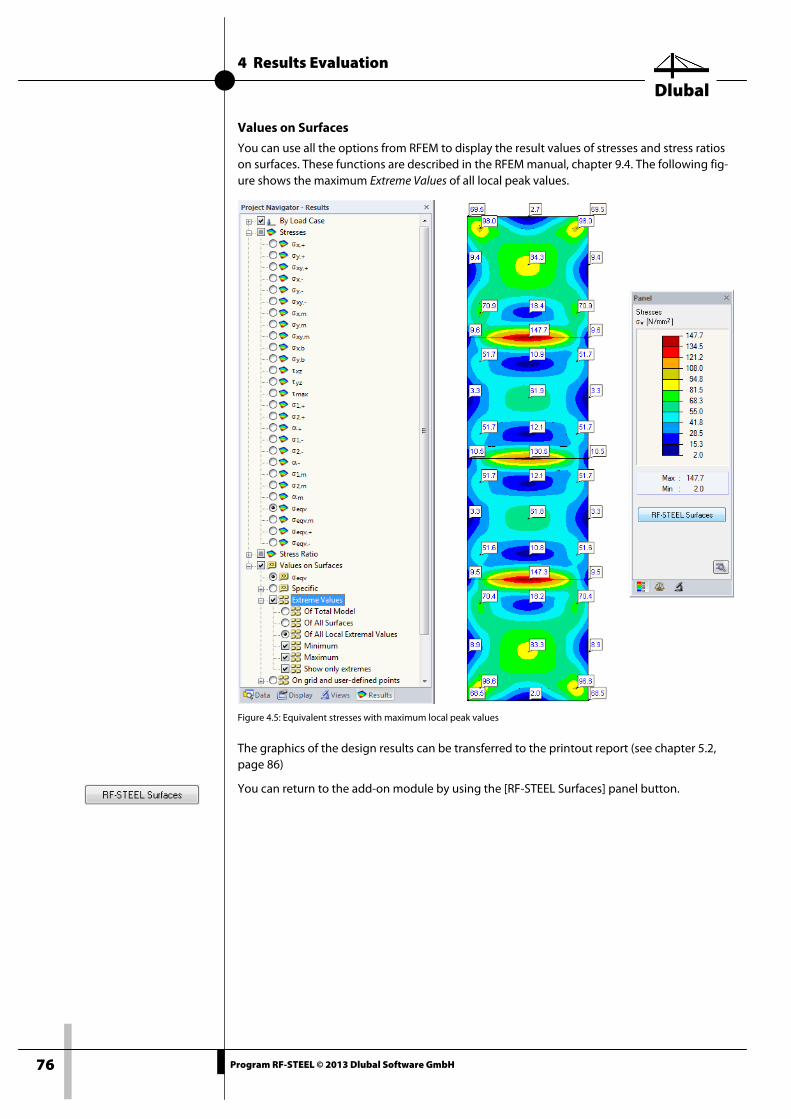
4 Results Evaluation
Dlubal
76 Program RF-STEEL © 2013 Dlubal Software GmbH
Values on Surfaces
You can use all the options from RFEM to display the result values of stresses and stress ratios on surfaces. These functions are described in the RFEM manual, chapter 9.4. The following fig-ure shows the maximum Extreme Values of all local peak values.
Figure 4.5: Equivalent stresses with maximum local peak values
The graphics of the design results can be transferred to the printout report (see chapter 5.2, page 86)
You can return to the add-on module by using the [RF-STEEL Surfaces] panel button.
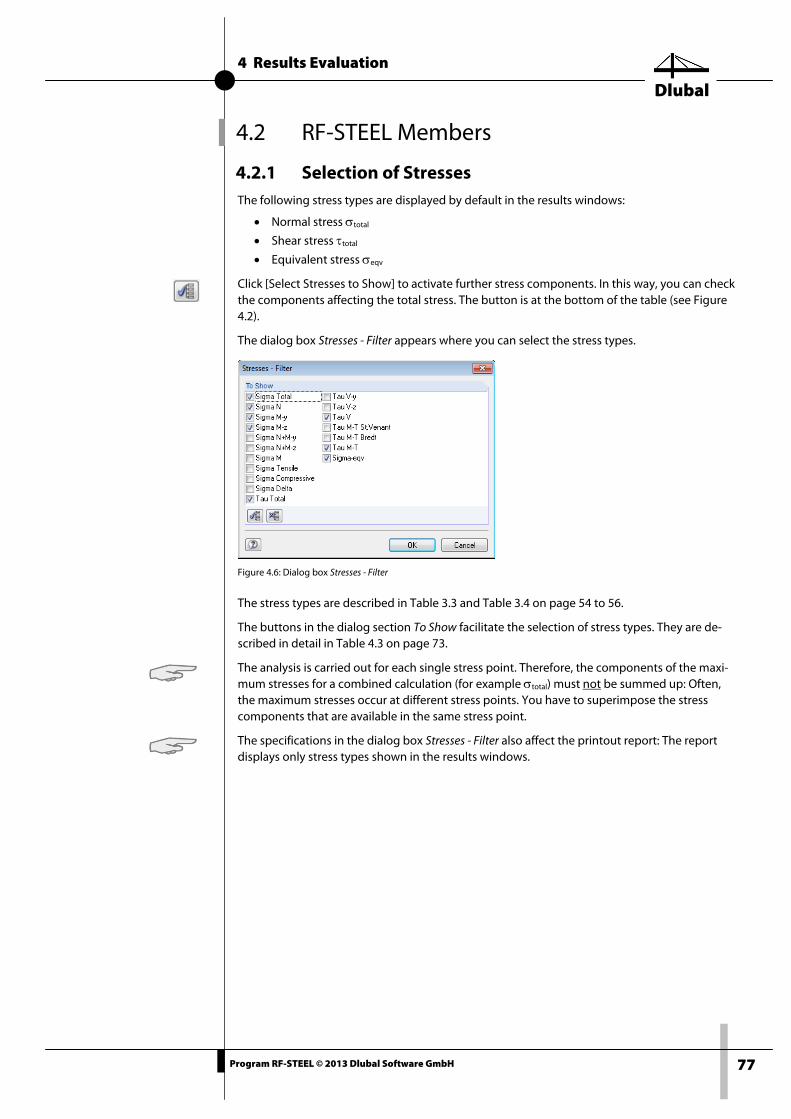
4 Results Evaluation
Dlubal
77 Program RF-STEEL © 2013 Dlubal Software GmbH
4.2 RF-STEEL Members
4.2.1 Selection of Stresses The following stress types are displayed by default in the results windows:
• Normal stress σtotal
• Shear stress τtotal
• Equivalent stress σeqv
Click [Select Stresses to Show] to activate further stress components. In this way, you can check the components affecting the total stress. The button is at the bottom of the table (see Figure 4.2).
The dialog box Stresses - Filter appears where you can select the stress types.
Figure 4.6: Dialog box Stresses - Filter
The stress types are described in Table 3.3 and Table 3.4 on page 54 to 56.
The buttons in the dialog section To Show facilitate the selection of stress types. They are de-scribed in detail in Table 4.3 on page 73.
The analysis is carried out for each single stress point. Therefore, the components of the maxi-mum stresses for a combined calculation (for example σtotal) must not be summed up: Often, the maximum stresses occur at different stress points. You have to superimpose the stress components that are available in the same stress point.
The specifications in the dialog box Stresses - Filter also affect the printout report: The report displays only stress types shown in the results windows.
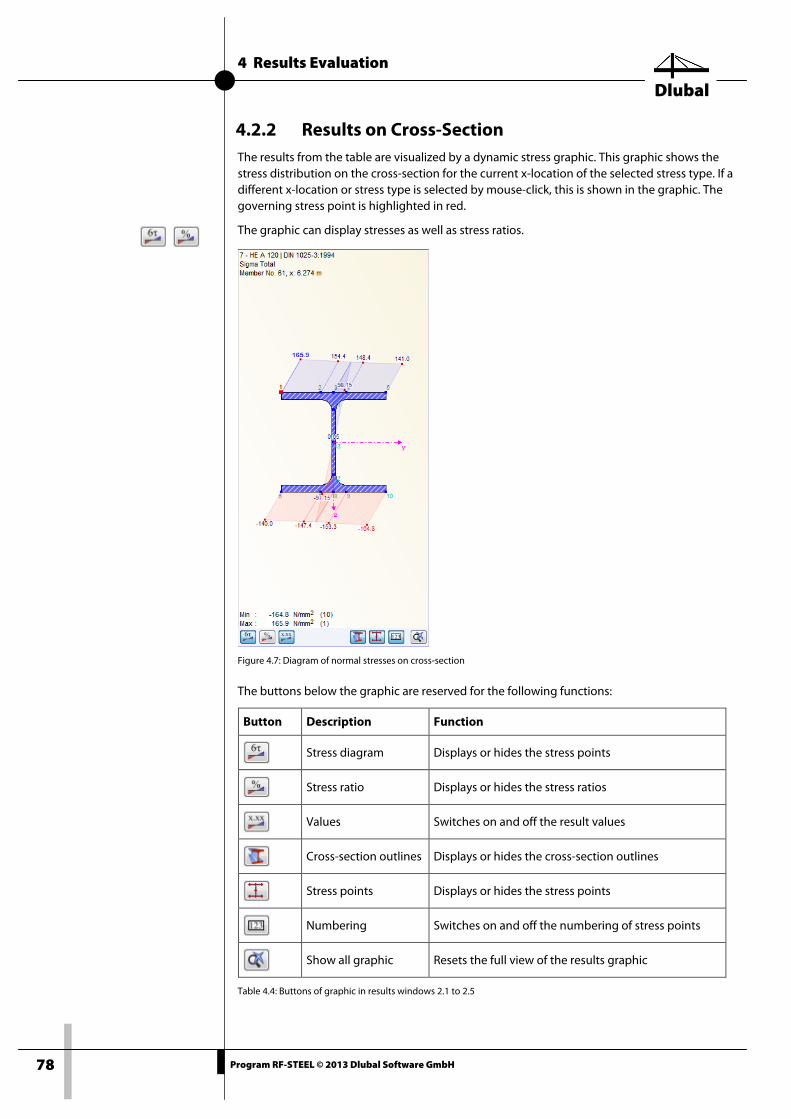
4 Results Evaluation
Dlubal
78 Program RF-STEEL © 2013 Dlubal Software GmbH
4.2.2 Results on Cross-Section The results from the table are visualized by a dynamic stress graphic. This graphic shows the stress distribution on the cross-section for the current x-location of the selected stress type. If a different x-location or stress type is selected by mouse-click, this is shown in the graphic. The governing stress point is highlighted in red.
The graphic can display stresses as well as stress ratios.
Figure 4.7: Diagram of normal stresses on cross-section
The buttons below the graphic are reserved for the following functions:
Button Description Function
Stress diagram Displays or hides the stress points
Stress ratio Displays or hides the stress ratios
Values Switches on and off the result values
Cross-section outlines Displays or hides the cross-section outlines
Stress points Displays or hides the stress points
Numbering Switches on and off the numbering of stress points
Show all graphic Resets the full view of the results graphic
Table 4.4: Buttons of graphic in results windows 2.1 to 2.5
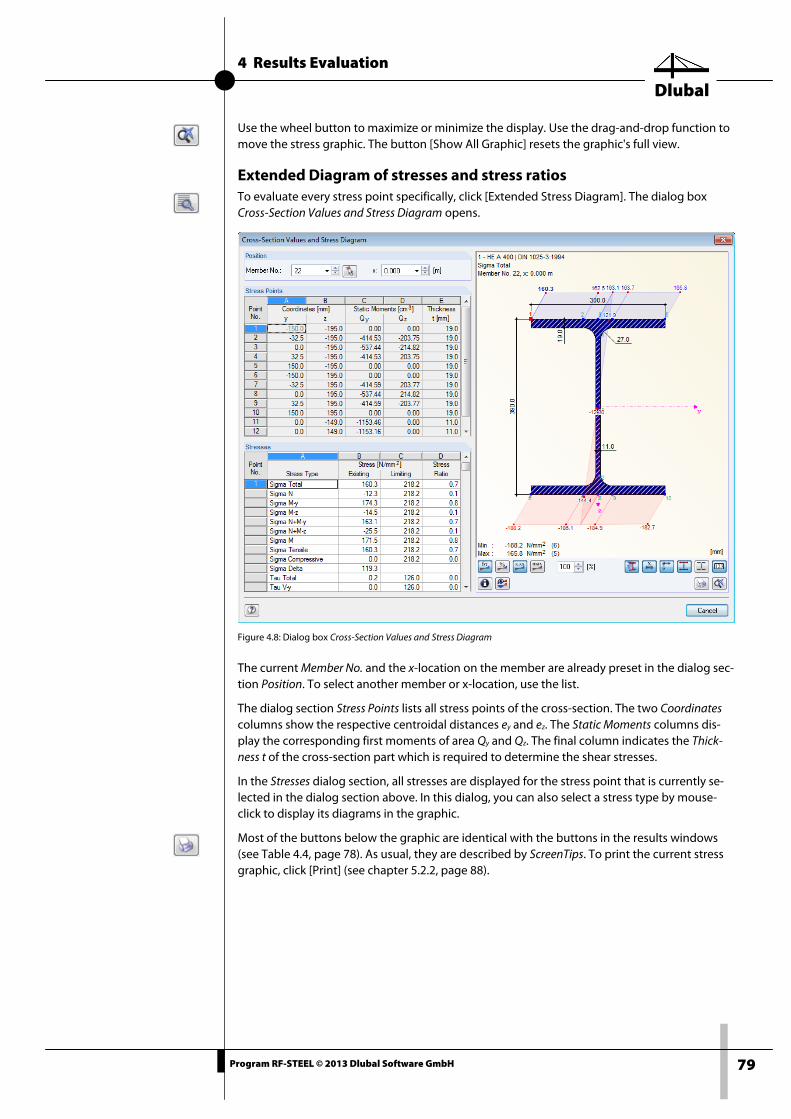
4 Results Evaluation
Dlubal
79 Program RF-STEEL © 2013 Dlubal Software GmbH
Use the wheel button to maximize or minimize the display. Use the drag-and-drop function to move the stress graphic. The button [Show All Graphic] resets the graphic's full view.
Extended Diagram of stresses and stress ratios To evaluate every stress point specifically, click [Extended Stress Diagram]. The dialog box Cross-Section Values and Stress Diagram opens.
Figure 4.8: Dialog box Cross-Section Values and Stress Diagram
The current Member No. and the x-location on the member are already preset in the dialog sec-tion Position. To select another member or x-location, use the list.
The dialog section Stress Points lists all stress points of the cross-section. The two Coordinates columns show the respective centroidal distances ey and ez. The Static Moments columns dis-play the corresponding first moments of area Qy and Qz. The final column indicates the Thick-ness t of the cross-section part which is required to determine the shear stresses.
In the Stresses dialog section, all stresses are displayed for the stress point that is currently se-lected in the dialog section above. In this dialog, you can also select a stress type by mouse-click to display its diagrams in the graphic.
Most of the buttons below the graphic are identical with the buttons in the results windows (see Table 4.4, page 78). As usual, they are described by ScreenTips. To print the current stress graphic, click [Print] (see chapter 5.2.2, page 88).
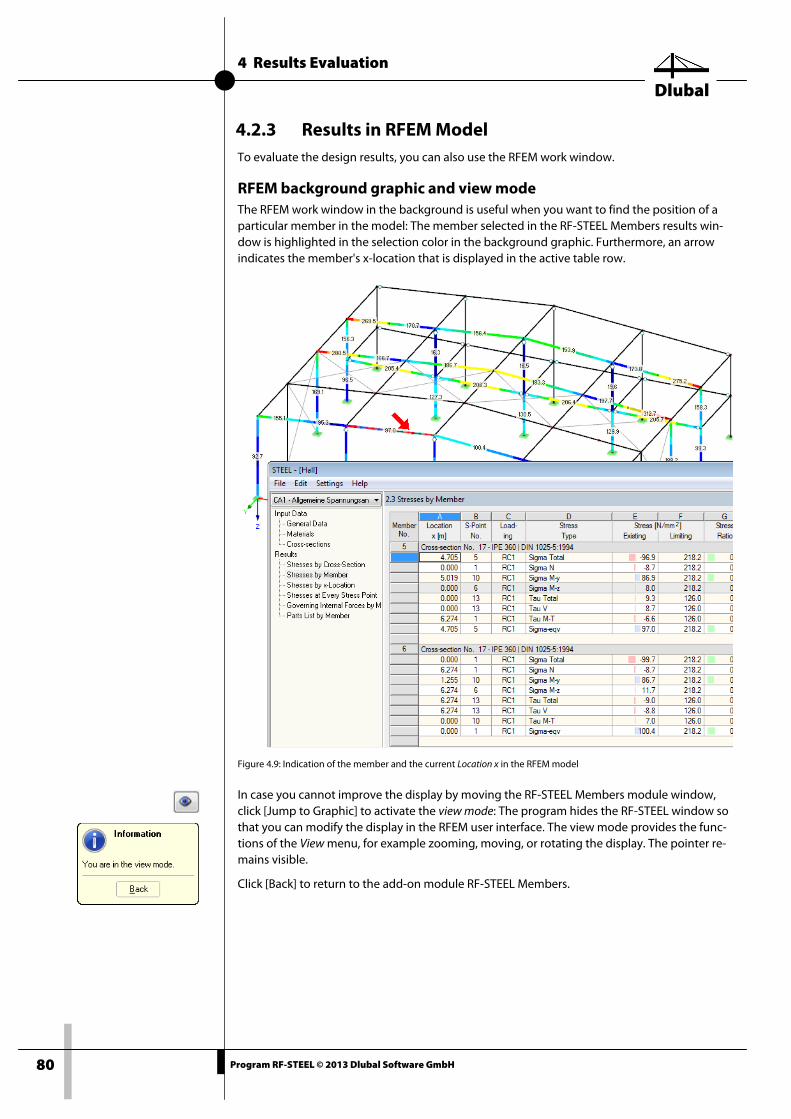
4 Results Evaluation
Dlubal
80 Program RF-STEEL © 2013 Dlubal Software GmbH
4.2.3 Results in RFEM Model To evaluate the design results, you can also use the RFEM work window.
RFEM background graphic and view mode The RFEM work window in the background is useful when you want to find the position of a particular member in the model: The member selected in the RF-STEEL Members results win-dow is highlighted in the selection color in the background graphic. Furthermore, an arrow indicates the member's x-location that is displayed in the active table row.
Figure 4.9: Indication of the member and the current Location x in the RFEM model
In case you cannot improve the display by moving the RF-STEEL Members module window, click [Jump to Graphic] to activate the view mode: The program hides the RF-STEEL window so that you can modify the display in the RFEM user interface. The view mode provides the func-tions of the View menu, for example zooming, moving, or rotating the display. The pointer re-mains visible.
Click [Back] to return to the add-on module RF-STEEL Members.
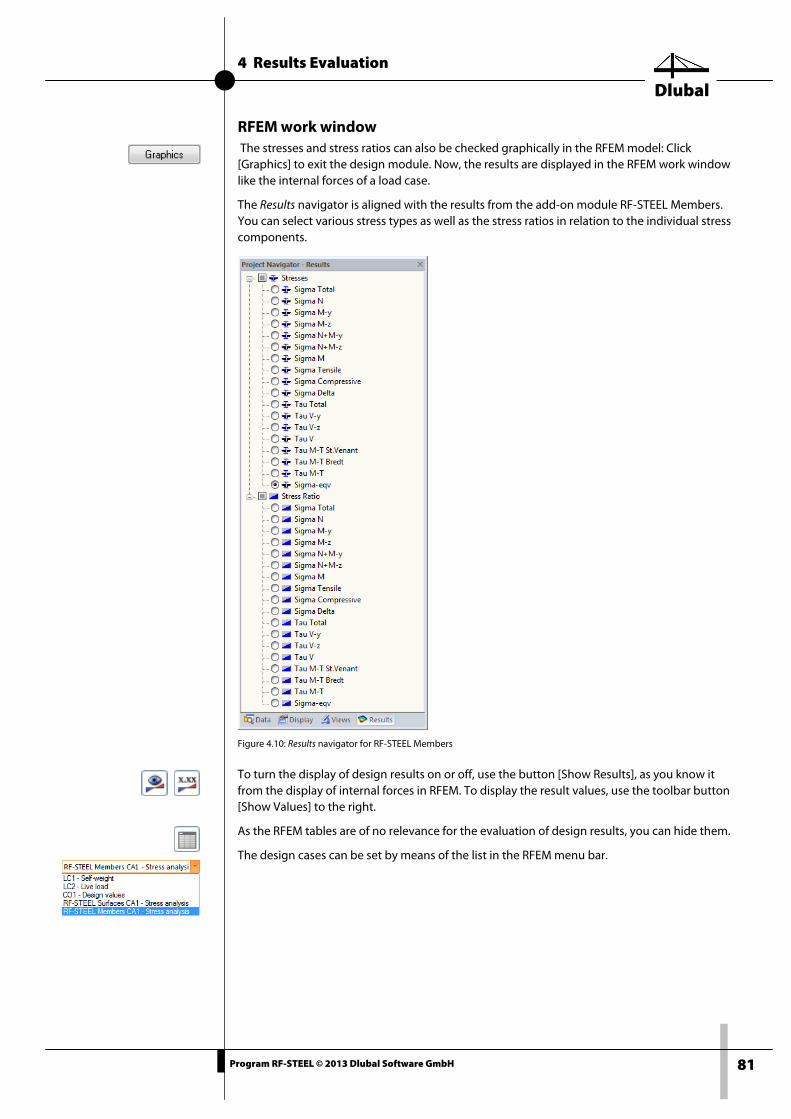
4 Results Evaluation
Dlubal
81 Program RF-STEEL © 2013 Dlubal Software GmbH
RFEM work window The stresses and stress ratios can also be checked graphically in the RFEM model: Click [Graphics] to exit the design module. Now, the results are displayed in the RFEM work window like the internal forces of a load case.
The Results navigator is aligned with the results from the add-on module RF-STEEL Members. You can select various stress types as well as the stress ratios in relation to the individual stress components.
Figure 4.10: Results navigator for RF-STEEL Members
To turn the display of design results on or off, use the button [Show Results], as you know it from the display of internal forces in RFEM. To display the result values, use the toolbar button [Show Values] to the right.
As the RFEM tables are of no relevance for the evaluation of design results, you can hide them.
The design cases can be set by means of the list in the RFEM menu bar.
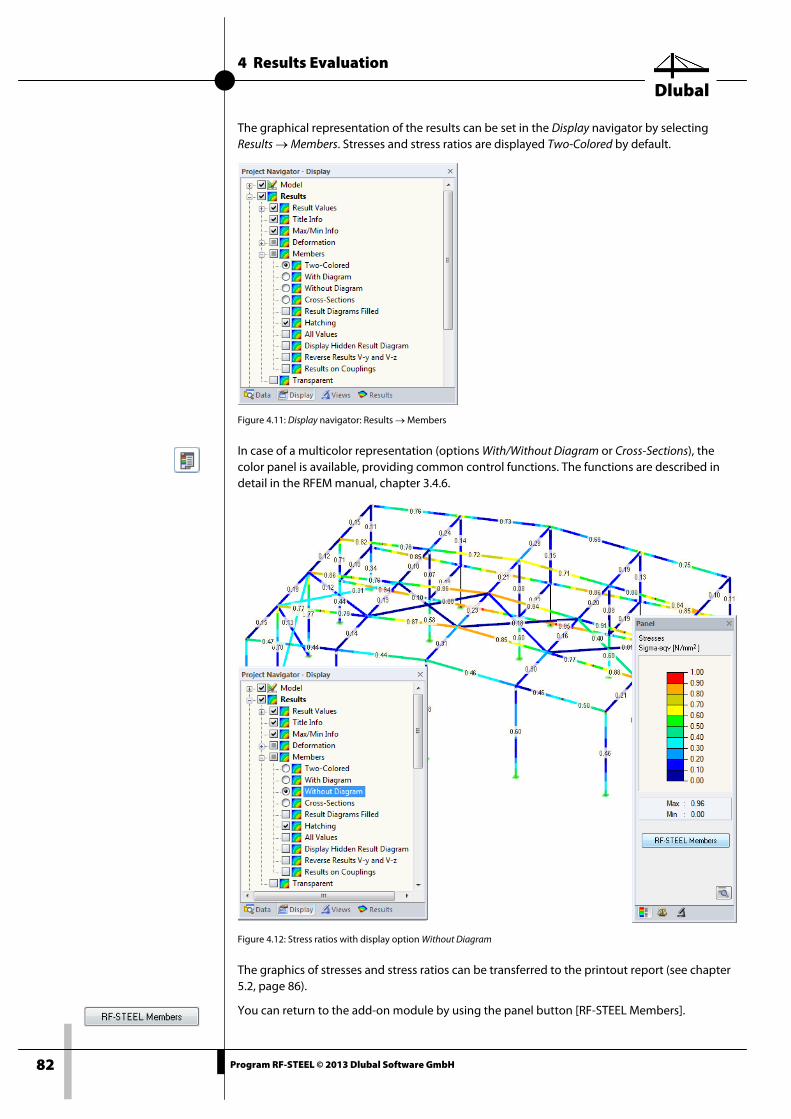
4 Results Evaluation
Dlubal
82 Program RF-STEEL © 2013 Dlubal Software GmbH
The graphical representation of the results can be set in the Display navigator by selecting Results → Members. Stresses and stress ratios are displayed Two-Colored by default.
Figure 4.11: Display navigator: Results → Members
In case of a multicolor representation (options With/Without Diagram or Cross-Sections), the color panel is available, providing common control functions. The functions are described in detail in the RFEM manual, chapter 3.4.6.
Figure 4.12: Stress ratios with display option Without Diagram
The graphics of stresses and stress ratios can be transferred to the printout report (see chapter 5.2, page 86).
You can return to the add-on module by using the panel button [RF-STEEL Members].
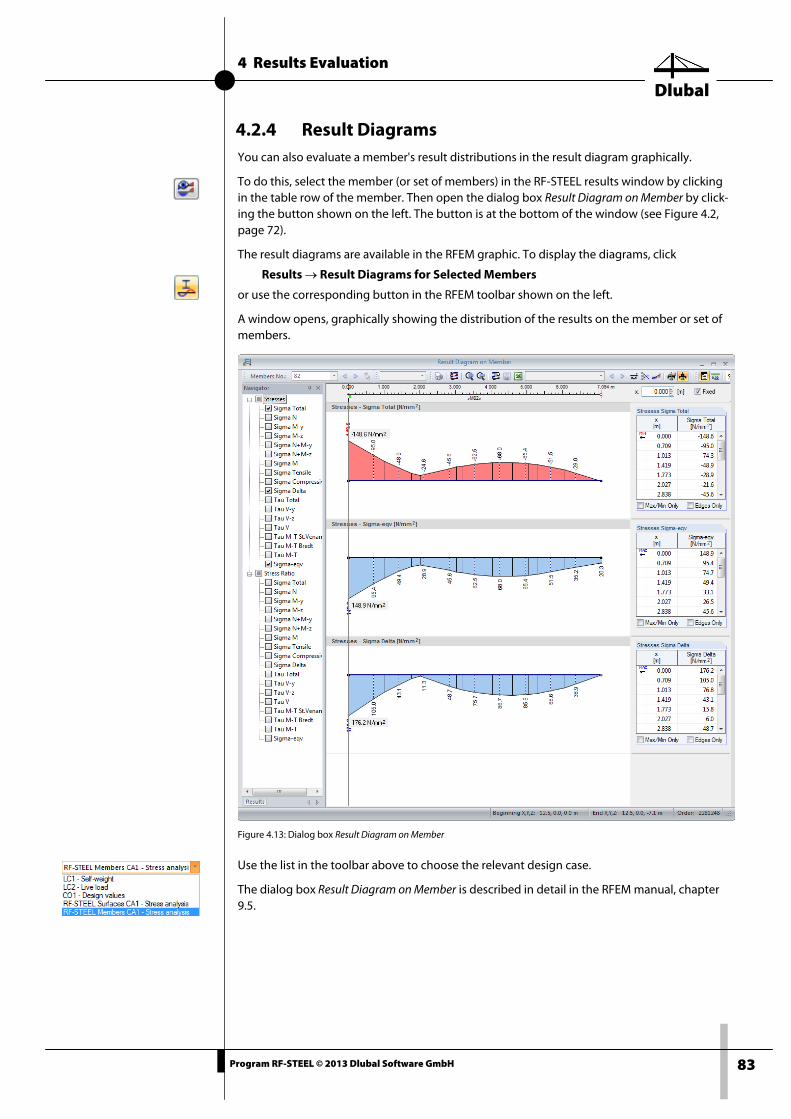
4 Results Evaluation
Dlubal
83 Program RF-STEEL © 2013 Dlubal Software GmbH
4.2.4 Result Diagrams You can also evaluate a member's result distributions in the result diagram graphically.
To do this, select the member (or set of members) in the RF-STEEL results window by clicking in the table row of the member. Then open the dialog box Result Diagram on Member by click-ing the button shown on the left. The button is at the bottom of the window (see Figure 4.2, page 72).
The result diagrams are available in the RFEM graphic. To display the diagrams, click
Results → Result Diagrams for Selected Members
or use the corresponding button in the RFEM toolbar shown on the left.
A window opens, graphically showing the distribution of the results on the member or set of members.
Figure 4.13: Dialog box Result Diagram on Member
Use the list in the toolbar above to choose the relevant design case.
The dialog box Result Diagram on Member is described in detail in the RFEM manual, chapter 9.5.
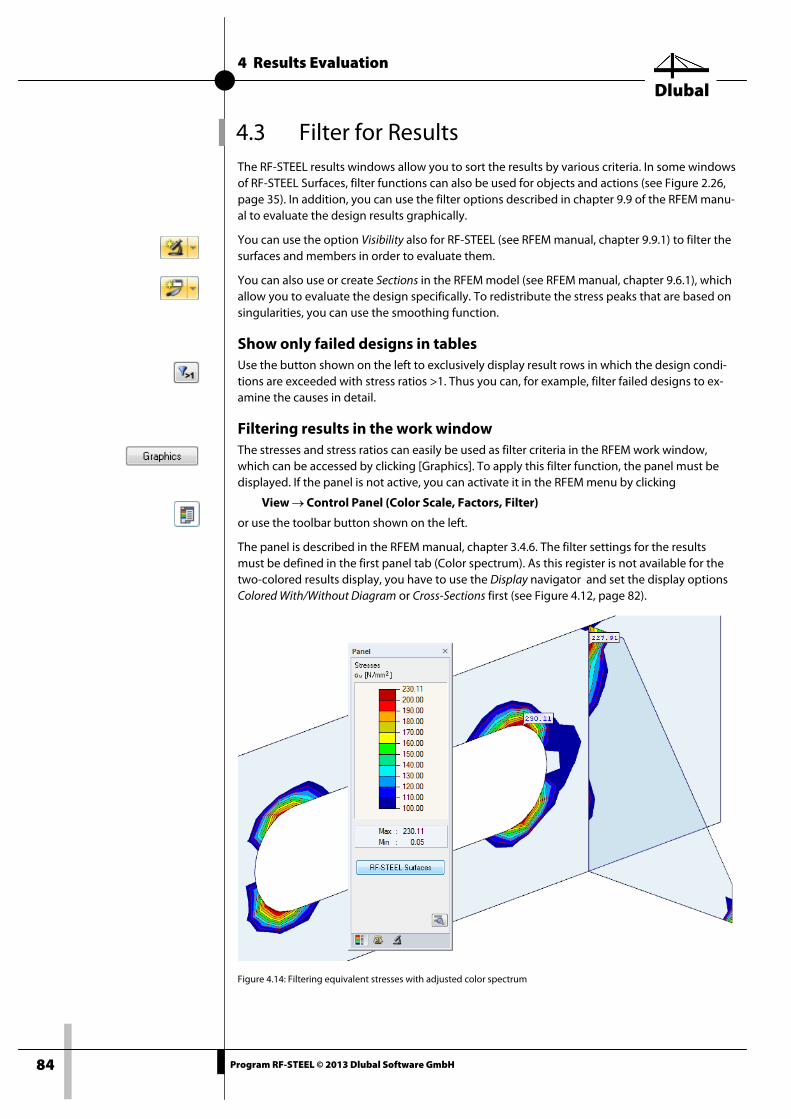
4 Results Evaluation
Dlubal
84 Program RF-STEEL © 2013 Dlubal Software GmbH
4.3 Filter for Results The RF-STEEL results windows allow you to sort the results by various criteria. In some windows of RF-STEEL Surfaces, filter functions can also be used for objects and actions (see Figure 2.26, page 35). In addition, you can use the filter options described in chapter 9.9 of the RFEM manu-al to evaluate the design results graphically.
You can use the option Visibility also for RF-STEEL (see RFEM manual, chapter 9.9.1) to filter the surfaces and members in order to evaluate them.
You can also use or create Sections in the RFEM model (see RFEM manual, chapter 9.6.1), which allow you to evaluate the design specifically. To redistribute the stress peaks that are based on singularities, you can use the smoothing function.
Show only failed designs in tables Use the button shown on the left to exclusively display result rows in which the design condi-tions are exceeded with stress ratios >1. Thus you can, for example, filter failed designs to ex-amine the causes in detail.
Filtering results in the work window The stresses and stress ratios can easily be used as filter criteria in the RFEM work window, which can be accessed by clicking [Graphics]. To apply this filter function, the panel must be displayed. If the panel is not active, you can activate it in the RFEM menu by clicking
View → Control Panel (Color Scale, Factors, Filter)
or use the toolbar button shown on the left.
The panel is described in the RFEM manual, chapter 3.4.6. The filter settings for the results must be defined in the first panel tab (Color spectrum). As this register is not available for the two-colored results display, you have to use the Display navigator and set the display options Colored With/Without Diagram or Cross-Sections first (see Figure 4.12, page 82).
Figure 4.14: Filtering equivalent stresses with adjusted color spectrum
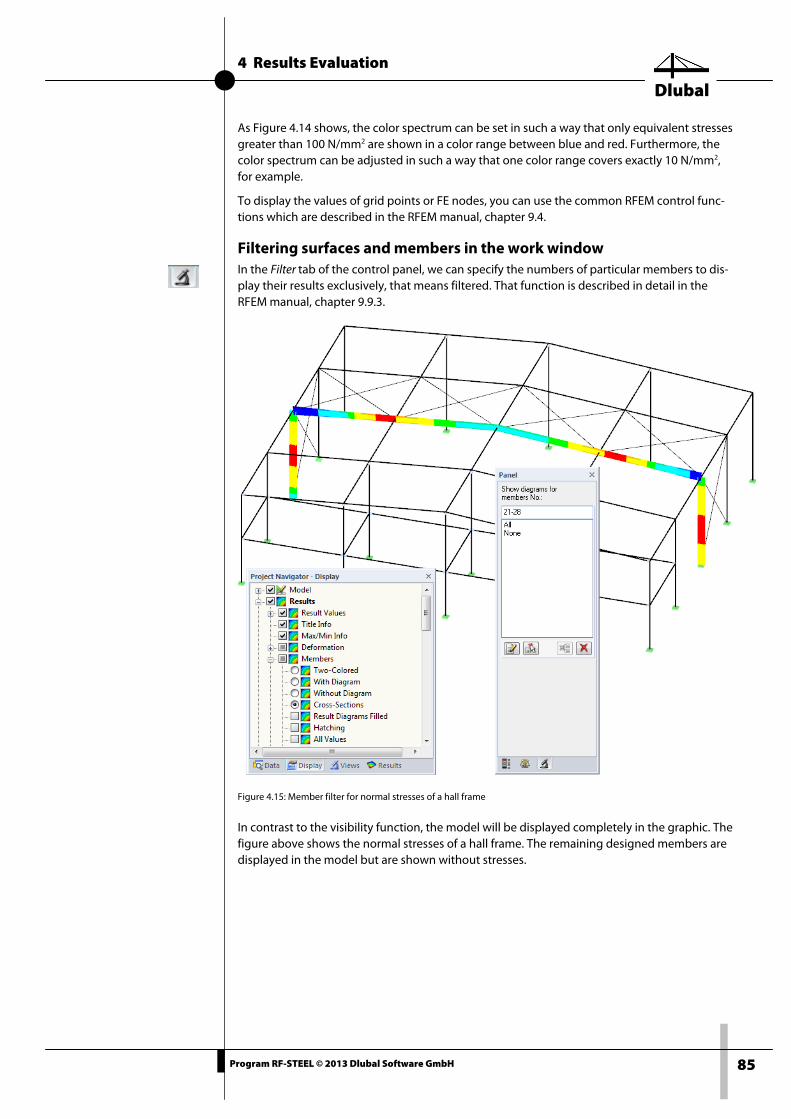
4 Results Evaluation
Dlubal
85 Program RF-STEEL © 2013 Dlubal Software GmbH
As Figure 4.14 shows, the color spectrum can be set in such a way that only equivalent stresses greater than 100 N/mm2 are shown in a color range between blue and red. Furthermore, the color spectrum can be adjusted in such a way that one color range covers exactly 10 N/mm2, for example.
To display the values of grid points or FE nodes, you can use the common RFEM control func-tions which are described in the RFEM manual, chapter 9.4.
Filtering surfaces and members in the work window In the Filter tab of the control panel, we can specify the numbers of particular members to dis-play their results exclusively, that means filtered. That function is described in detail in the RFEM manual, chapter 9.9.3.
Figure 4.15: Member filter for normal stresses of a hall frame
In contrast to the visibility function, the model will be displayed completely in the graphic. The figure above shows the normal stresses of a hall frame. The remaining designed members are displayed in the model but are shown without stresses.
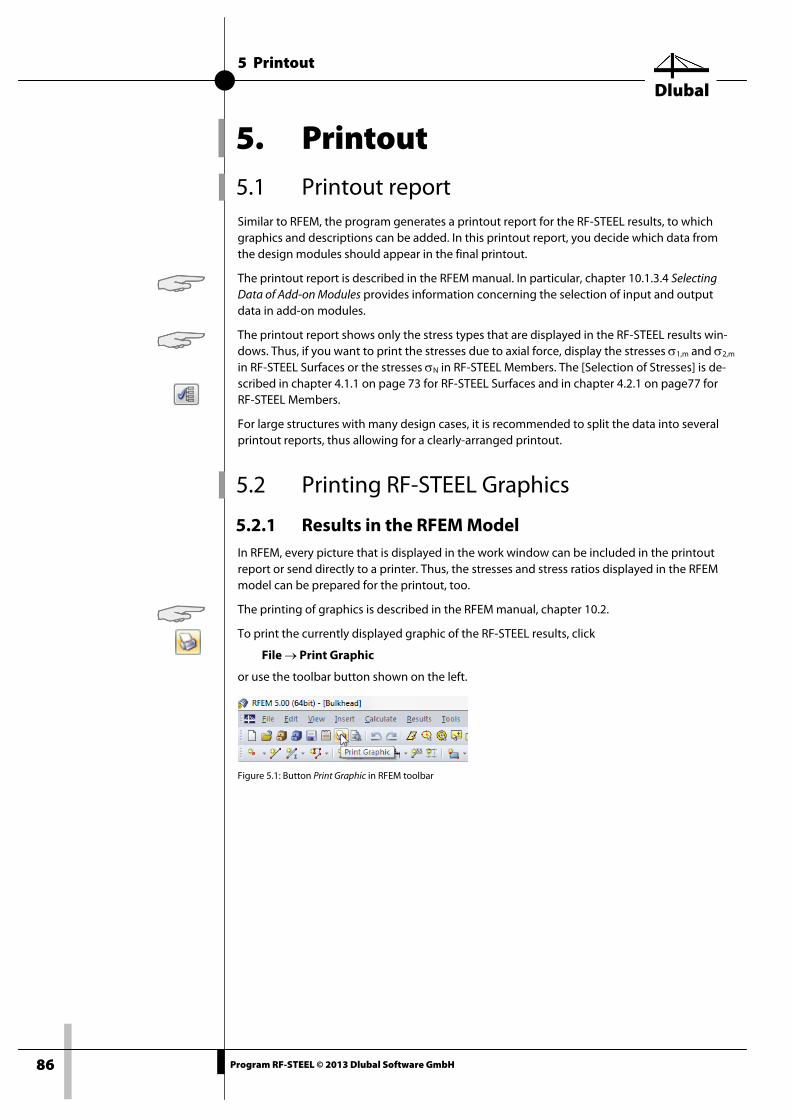
5 Printout
Dlubal
86 Program RF-STEEL © 2013 Dlubal Software GmbH
5. Printout
5.1 Printout report Similar to RFEM, the program generates a printout report for the RF-STEEL results, to which graphics and descriptions can be added. In this printout report, you decide which data from the design modules should appear in the final printout.
The printout report is described in the RFEM manual. In particular, chapter 10.1.3.4 Selecting Data of Add-on Modules provides information concerning the selection of input and output data in add-on modules.
The printout report shows only the stress types that are displayed in the RF-STEEL results win-dows. Thus, if you want to print the stresses due to axial force, display the stresses σ1,m and σ2,m in RF-STEEL Surfaces or the stresses σN in RF-STEEL Members. The [Selection of Stresses] is de-scribed in chapter 4.1.1 on page 73 for RF-STEEL Surfaces and in chapter 4.2.1 on page77 for RF-STEEL Members.
For large structures with many design cases, it is recommended to split the data into several printout reports, thus allowing for a clearly-arranged printout.
5.2 Printing RF-STEEL Graphics
5.2.1 Results in the RFEM Model In RFEM, every picture that is displayed in the work window can be included in the printout report or send directly to a printer. Thus, the stresses and stress ratios displayed in the RFEM model can be prepared for the printout, too.
The printing of graphics is described in the RFEM manual, chapter 10.2.
To print the currently displayed graphic of the RF-STEEL results, click
File → Print Graphic
or use the toolbar button shown on the left.
Figure 5.1: Button Print Graphic in RFEM toolbar
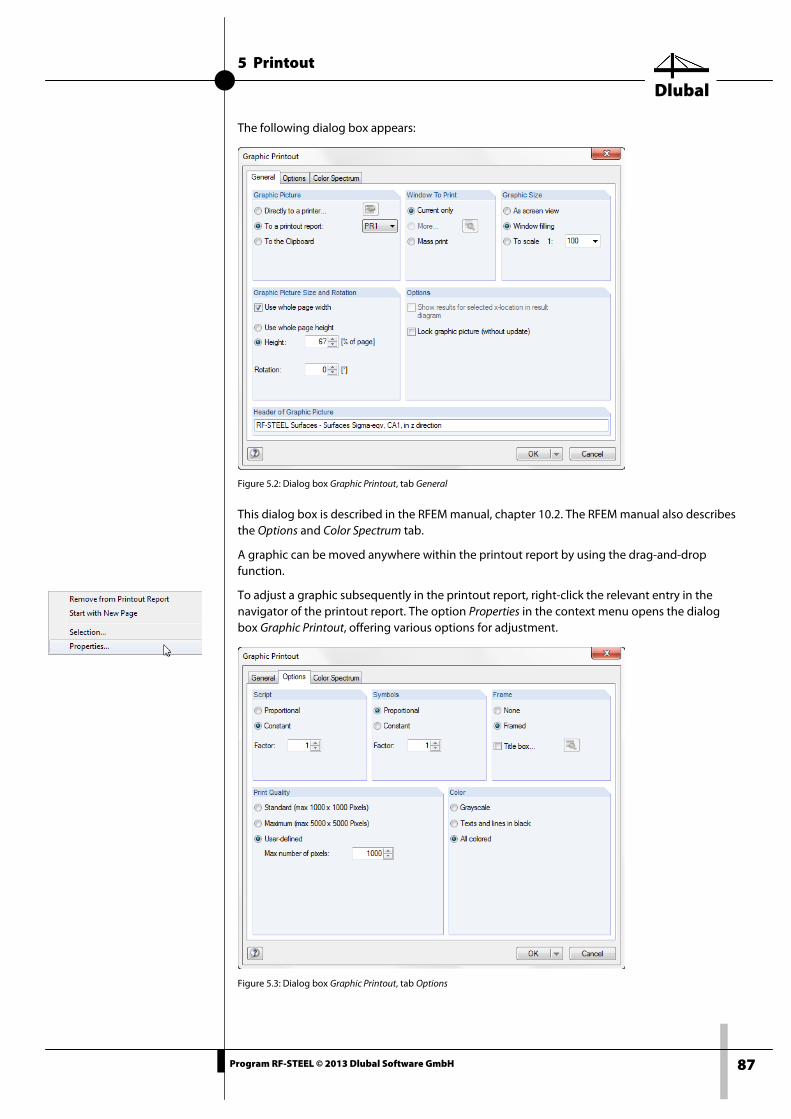
5 Printout
Dlubal
87 Program RF-STEEL © 2013 Dlubal Software GmbH
The following dialog box appears:
Figure 5.2: Dialog box Graphic Printout, tab General
This dialog box is described in the RFEM manual, chapter 10.2. The RFEM manual also describes the Options and Color Spectrum tab.
A graphic can be moved anywhere within the printout report by using the drag-and-drop function.
To adjust a graphic subsequently in the printout report, right-click the relevant entry in the navigator of the printout report. The option Properties in the context menu opens the dialog box Graphic Printout, offering various options for adjustment.
Figure 5.3: Dialog box Graphic Printout, tab Options
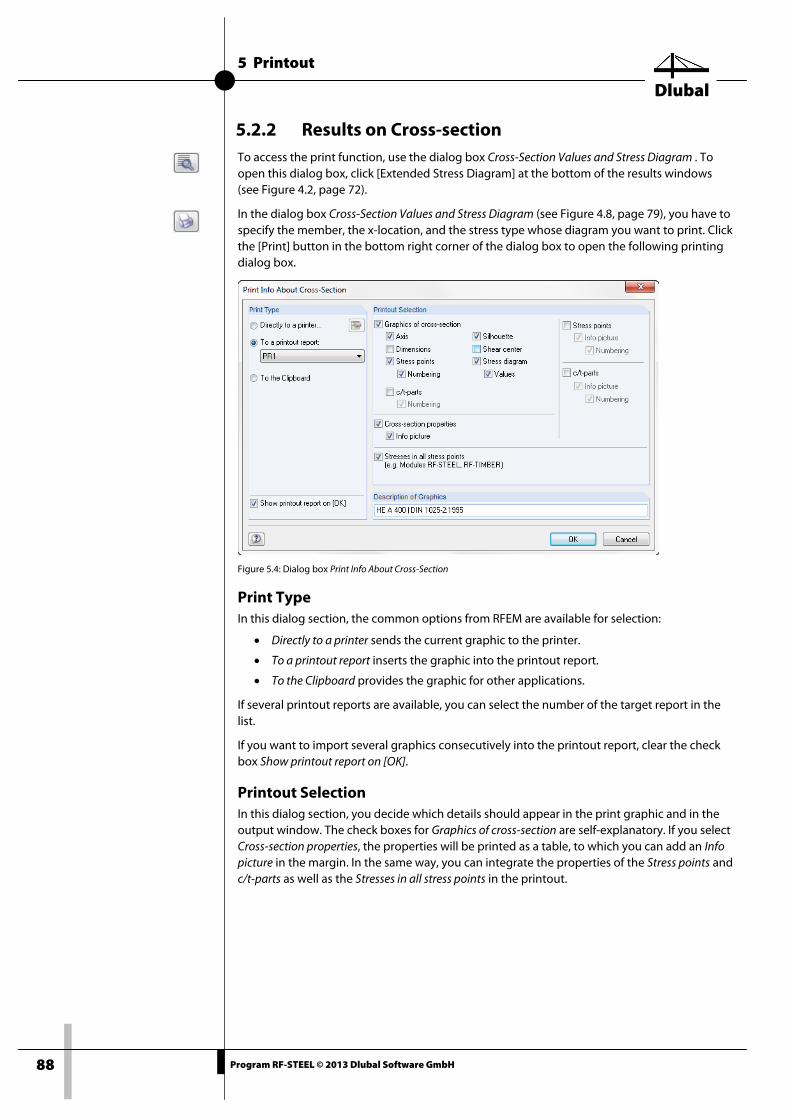
5 Printout
Dlubal
88 Program RF-STEEL © 2013 Dlubal Software GmbH
5.2.2 Results on Cross-section To access the print function, use the dialog box Cross-Section Values and Stress Diagram . To open this dialog box, click [Extended Stress Diagram] at the bottom of the results windows (see Figure 4.2, page 72).
In the dialog box Cross-Section Values and Stress Diagram (see Figure 4.8, page 79), you have to specify the member, the x-location, and the stress type whose diagram you want to print. Click the [Print] button in the bottom right corner of the dialog box to open the following printing dialog box.
Figure 5.4: Dialog box Print Info About Cross-Section
Print Type In this dialog section, the common options from RFEM are available for selection:
• Directly to a printer sends the current graphic to the printer.
• To a printout report inserts the graphic into the printout report.
• To the Clipboard provides the graphic for other applications.
If several printout reports are available, you can select the number of the target report in the list.
If you want to import several graphics consecutively into the printout report, clear the check box Show printout report on [OK].
Printout Selection In this dialog section, you decide which details should appear in the print graphic and in the output window. The check boxes for Graphics of cross-section are self-explanatory. If you select Cross-section properties, the properties will be printed as a table, to which you can add an Info picture in the margin. In the same way, you can integrate the properties of the Stress points and c/t-parts as well as the Stresses in all stress points in the printout.
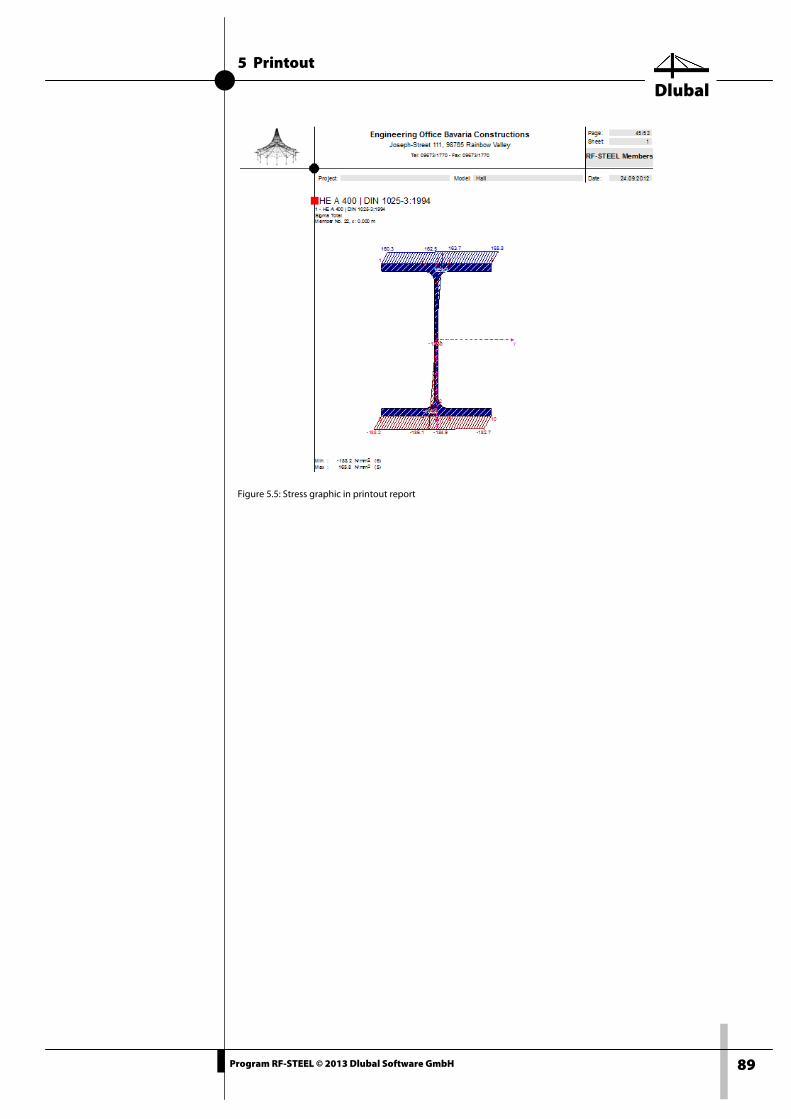
5 Printout
Dlubal
89 Program RF-STEEL © 2013 Dlubal Software GmbH
Figure 5.5: Stress graphic in printout report
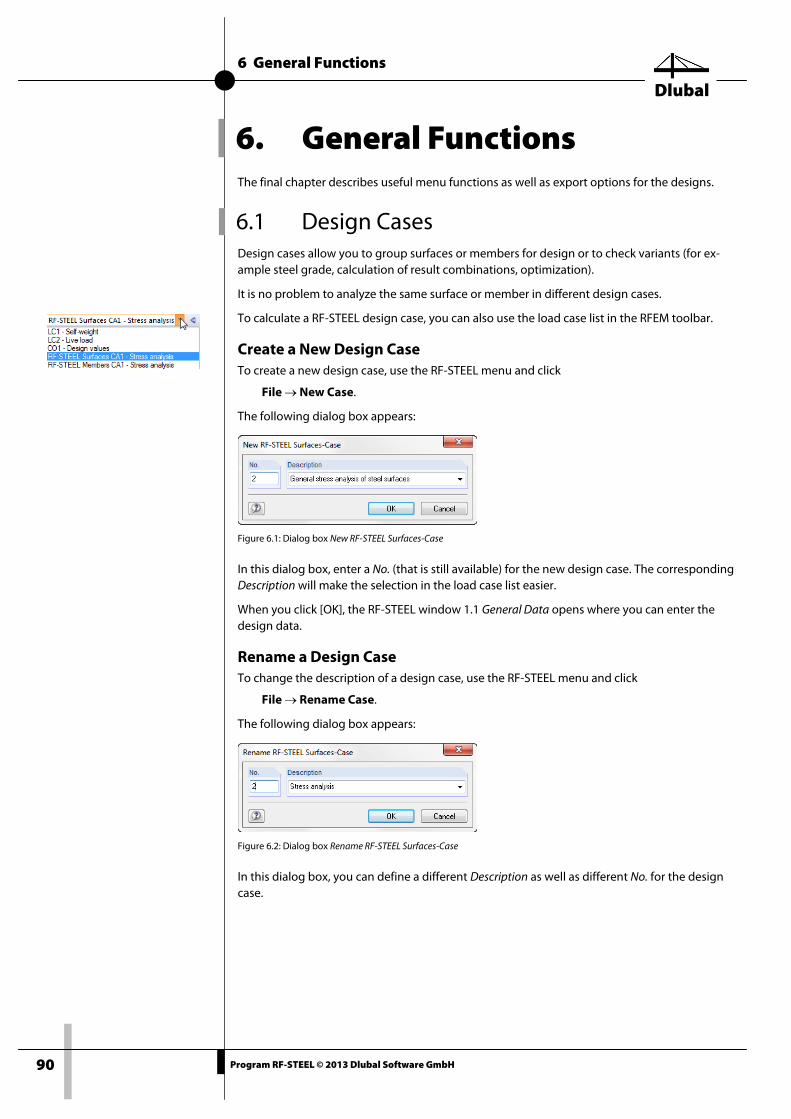
6 General Functions
Dlubal
90 Program RF-STEEL © 2013 Dlubal Software GmbH
6. General Functions The final chapter describes useful menu functions as well as export options for the designs.
6.1 Design Cases Design cases allow you to group surfaces or members for design or to check variants (for ex-ample steel grade, calculation of result combinations, optimization).
It is no problem to analyze the same surface or member in different design cases.
To calculate a RF-STEEL design case, you can also use the load case list in the RFEM toolbar.
Create a New Design Case To create a new design case, use the RF-STEEL menu and click
File → New Case.
The following dialog box appears:
Figure 6.1: Dialog box New RF-STEEL Surfaces-Case
In this dialog box, enter a No. (that is still available) for the new design case. The corresponding Description will make the selection in the load case list easier.
When you click [OK], the RF-STEEL window 1.1 General Data opens where you can enter the design data.
Rename a Design Case To change the description of a design case, use the RF-STEEL menu and click
File → Rename Case.
The following dialog box appears:
Figure 6.2: Dialog box Rename RF-STEEL Surfaces-Case
In this dialog box, you can define a different Description as well as different No. for the design case.
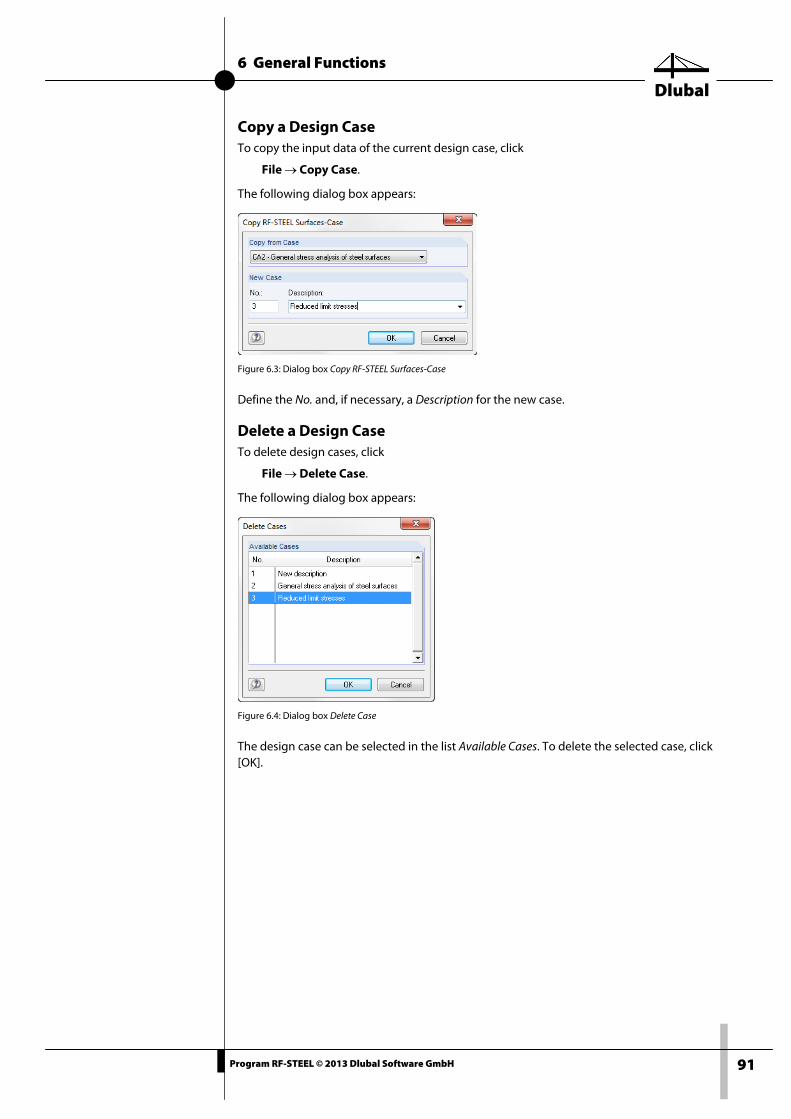
6 General Functions
Dlubal
91 Program RF-STEEL © 2013 Dlubal Software GmbH
Copy a Design Case To copy the input data of the current design case, click
File → Copy Case.
The following dialog box appears:
Figure 6.3: Dialog box Copy RF-STEEL Surfaces-Case
Define the No. and, if necessary, a Description for the new case.
Delete a Design Case To delete design cases, click
File → Delete Case.
The following dialog box appears:
Figure 6.4: Dialog box Delete Case
The design case can be selected in the list Available Cases. To delete the selected case, click [OK].
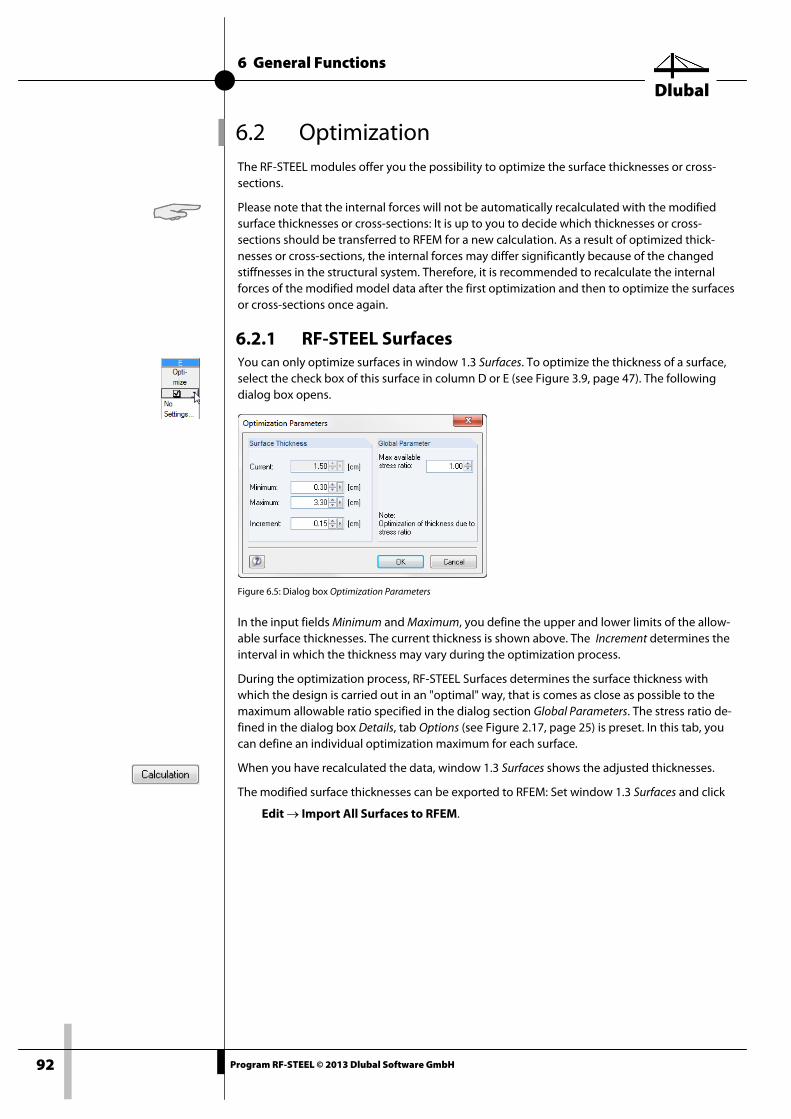
6 General Functions
Dlubal
92 Program RF-STEEL © 2013 Dlubal Software GmbH
6.2 Optimization The RF-STEEL modules offer you the possibility to optimize the surface thicknesses or cross-sections.
Please note that the internal forces will not be automatically recalculated with the modified surface thicknesses or cross-sections: It is up to you to decide which thicknesses or cross-sections should be transferred to RFEM for a new calculation. As a result of optimized thick-nesses or cross-sections, the internal forces may differ significantly because of the changed stiffnesses in the structural system. Therefore, it is recommended to recalculate the internal forces of the modified model data after the first optimization and then to optimize the surfaces or cross-sections once again.
6.2.1 RF-STEEL Surfaces You can only optimize surfaces in window 1.3 Surfaces. To optimize the thickness of a surface, select the check box of this surface in column D or E (see Figure 3.9, page 47). The following dialog box opens.
Figure 6.5: Dialog box Optimization Parameters
In the input fields Minimum and Maximum, you define the upper and lower limits of the allow-able surface thicknesses. The current thickness is shown above. The Increment determines the interval in which the thickness may vary during the optimization process.
During the optimization process, RF-STEEL Surfaces determines the surface thickness with which the design is carried out in an "optimal" way, that is comes as close as possible to the maximum allowable ratio specified in the dialog section Global Parameters. The stress ratio de-fined in the dialog box Details, tab Options (see Figure 2.17, page 25) is preset. In this tab, you can define an individual optimization maximum for each surface.
When you have recalculated the data, window 1.3 Surfaces shows the adjusted thicknesses.
The modified surface thicknesses can be exported to RFEM: Set window 1.3 Surfaces and click
Edit → Import All Surfaces to RFEM.
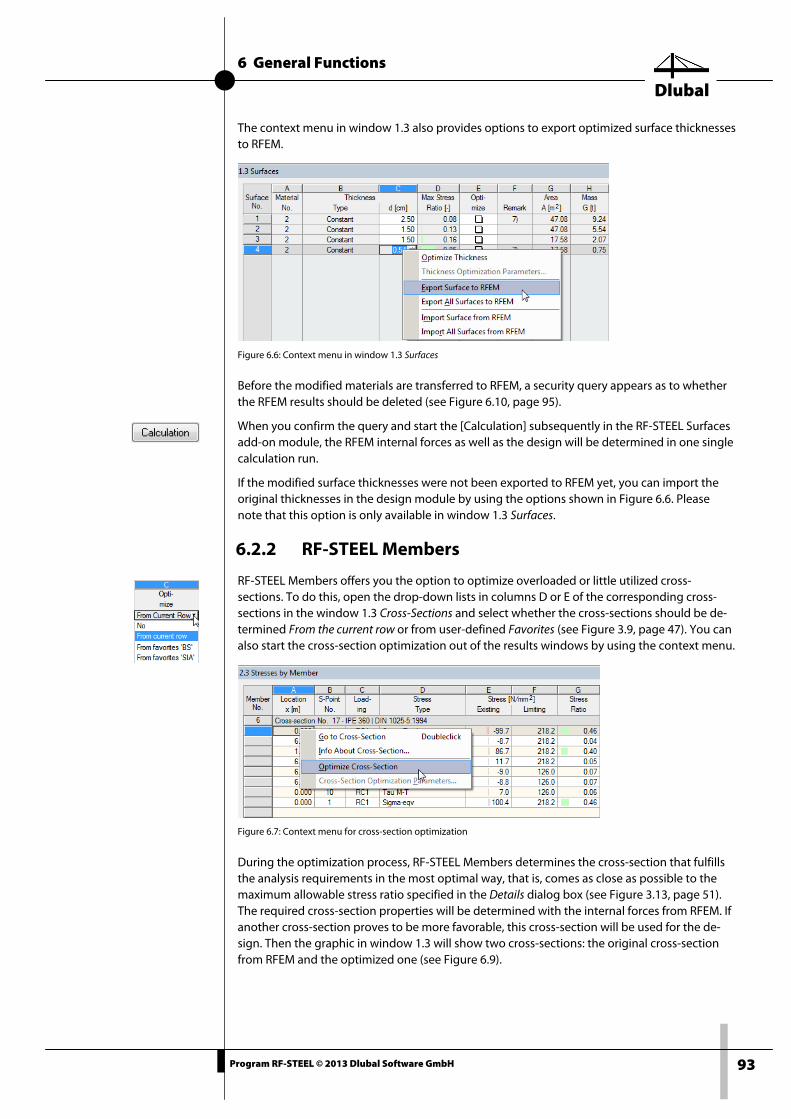
6 General Functions
Dlubal
93 Program RF-STEEL © 2013 Dlubal Software GmbH
The context menu in window 1.3 also provides options to export optimized surface thicknesses to RFEM.
Figure 6.6: Context menu in window 1.3 Surfaces
Before the modified materials are transferred to RFEM, a security query appears as to whether the RFEM results should be deleted (see Figure 6.10, page 95).
When you confirm the query and start the [Calculation] subsequently in the RF-STEEL Surfaces add-on module, the RFEM internal forces as well as the design will be determined in one single calculation run.
If the modified surface thicknesses were not been exported to RFEM yet, you can import the original thicknesses in the design module by using the options shown in Figure 6.6. Please note that this option is only available in window 1.3 Surfaces.
6.2.2 RF-STEEL Members
RF-STEEL Members offers you the option to optimize overloaded or little utilized cross-sections. To do this, open the drop-down lists in columns D or E of the corresponding cross-sections in the window 1.3 Cross-Sections and select whether the cross-sections should be de-termined From the current row or from user-defined Favorites (see Figure 3.9, page 47). You can also start the cross-section optimization out of the results windows by using the context menu.
Figure 6.7: Context menu for cross-section optimization
During the optimization process, RF-STEEL Members determines the cross-section that fulfills the analysis requirements in the most optimal way, that is, comes as close as possible to the maximum allowable stress ratio specified in the Details dialog box (see Figure 3.13, page 51). The required cross-section properties will be determined with the internal forces from RFEM. If another cross-section proves to be more favorable, this cross-section will be used for the de-sign. Then the graphic in window 1.3 will show two cross-sections: the original cross-section from RFEM and the optimized one (see Figure 6.9).
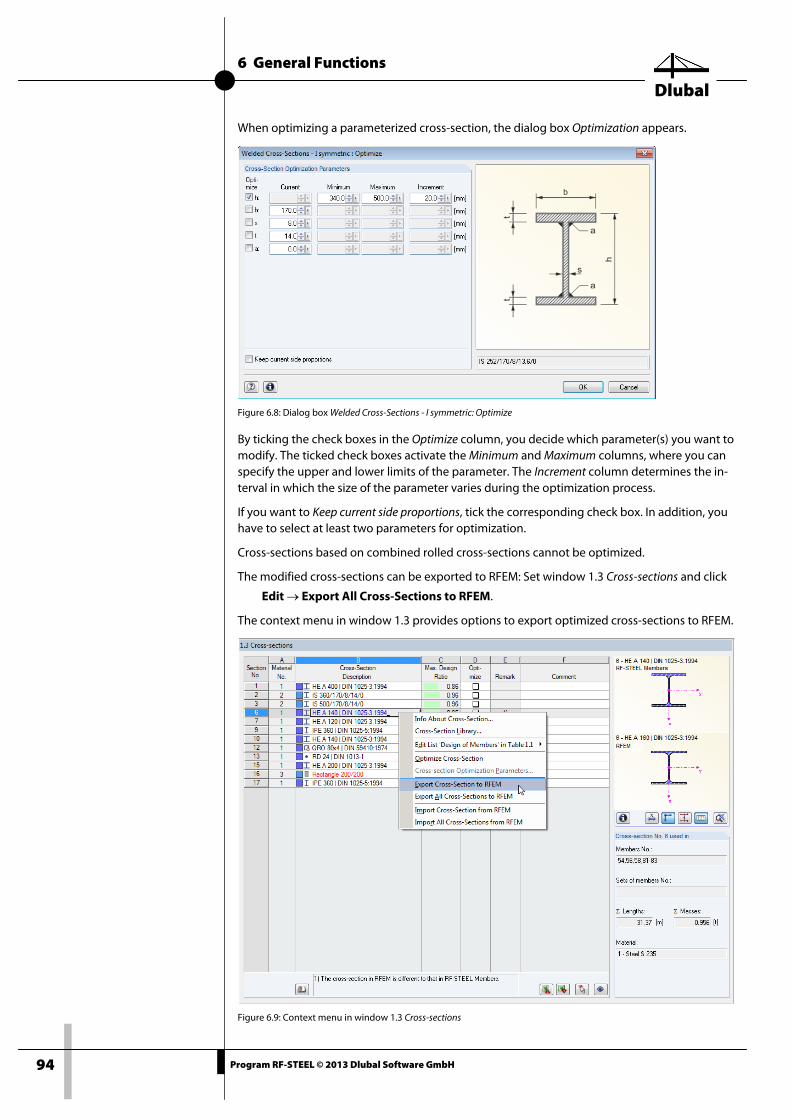
6 General Functions
Dlubal
94 Program RF-STEEL © 2013 Dlubal Software GmbH
When optimizing a parameterized cross-section, the dialog box Optimization appears.
Figure 6.8: Dialog box Welded Cross-Sections - I symmetric: Optimize
By ticking the check boxes in the Optimize column, you decide which parameter(s) you want to modify. The ticked check boxes activate the Minimum and Maximum columns, where you can specify the upper and lower limits of the parameter. The Increment column determines the in-terval in which the size of the parameter varies during the optimization process.
If you want to Keep current side proportions, tick the corresponding check box. In addition, you have to select at least two parameters for optimization.
Cross-sections based on combined rolled cross-sections cannot be optimized.
The modified cross-sections can be exported to RFEM: Set window 1.3 Cross-sections and click
Edit → Export All Cross-Sections to RFEM.
The context menu in window 1.3 provides options to export optimized cross-sections to RFEM.
Figure 6.9: Context menu in window 1.3 Cross-sections
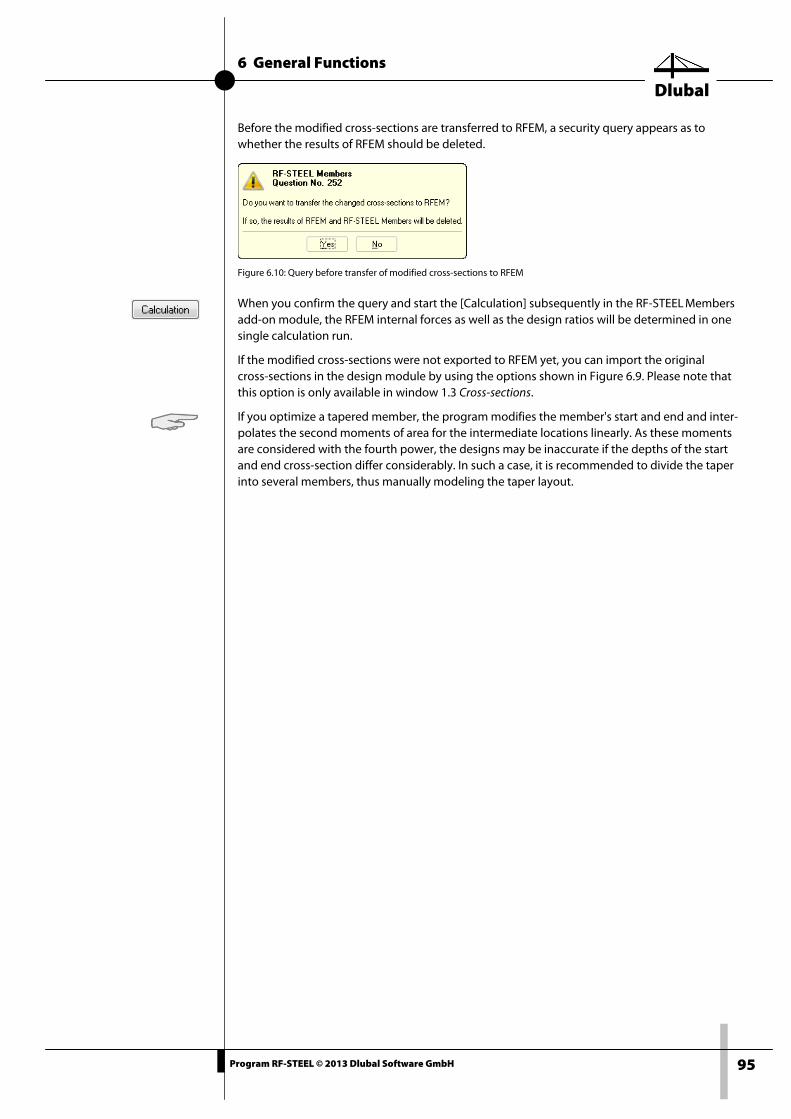
6 General Functions
Dlubal
95 Program RF-STEEL © 2013 Dlubal Software GmbH
Before the modified cross-sections are transferred to RFEM, a security query appears as to whether the results of RFEM should be deleted.
Figure 6.10: Query before transfer of modified cross-sections to RFEM
When you confirm the query and start the [Calculation] subsequently in the RF-STEEL Members add-on module, the RFEM internal forces as well as the design ratios will be determined in one single calculation run.
If the modified cross-sections were not exported to RFEM yet, you can import the original cross-sections in the design module by using the options shown in Figure 6.9. Please note that this option is only available in window 1.3 Cross-sections.
If you optimize a tapered member, the program modifies the member's start and end and inter-polates the second moments of area for the intermediate locations linearly. As these moments are considered with the fourth power, the designs may be inaccurate if the depths of the start and end cross-section differ considerably. In such a case, it is recommended to divide the taper into several members, thus manually modeling the taper layout.
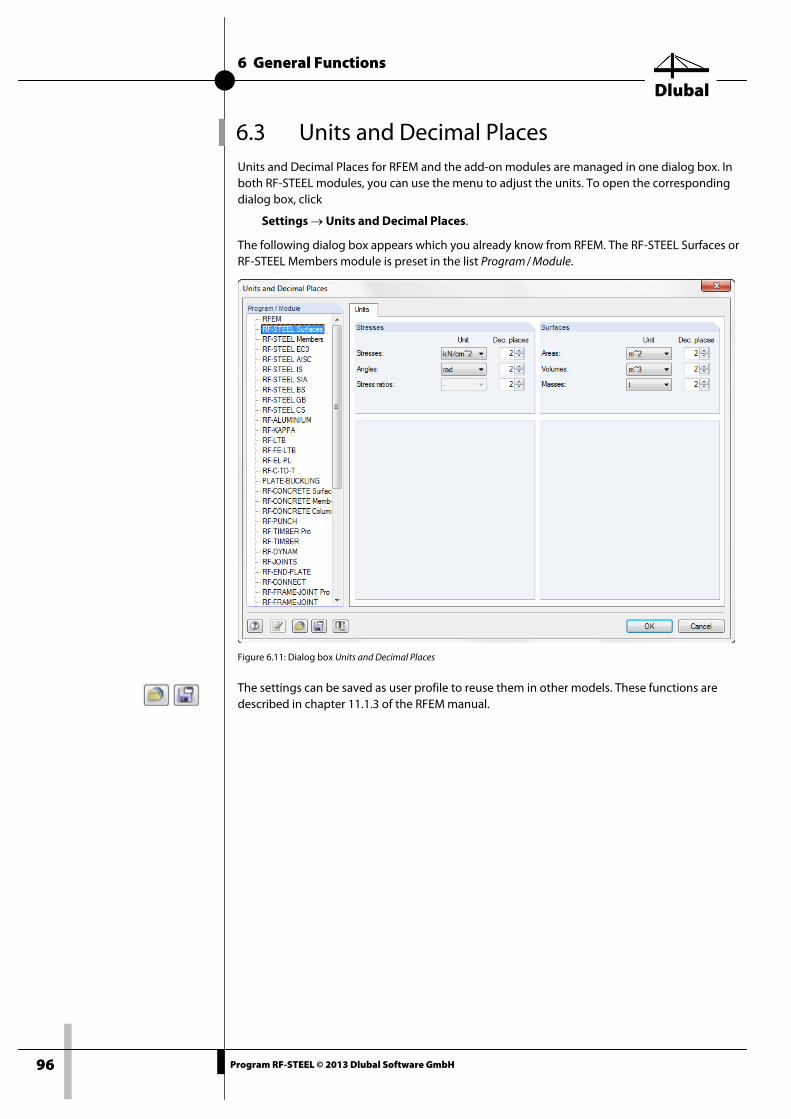
6 General Functions
Dlubal
96 Program RF-STEEL © 2013 Dlubal Software GmbH
6.3 Units and Decimal Places Units and Decimal Places for RFEM and the add-on modules are managed in one dialog box. In both RF-STEEL modules, you can use the menu to adjust the units. To open the corresponding dialog box, click
Settings → Units and Decimal Places.
The following dialog box appears which you already know from RFEM. The RF-STEEL Surfaces or RF-STEEL Members module is preset in the list Program / Module.
Figure 6.11: Dialog box Units and Decimal Places
The settings can be saved as user profile to reuse them in other models. These functions are described in chapter 11.1.3 of the RFEM manual.
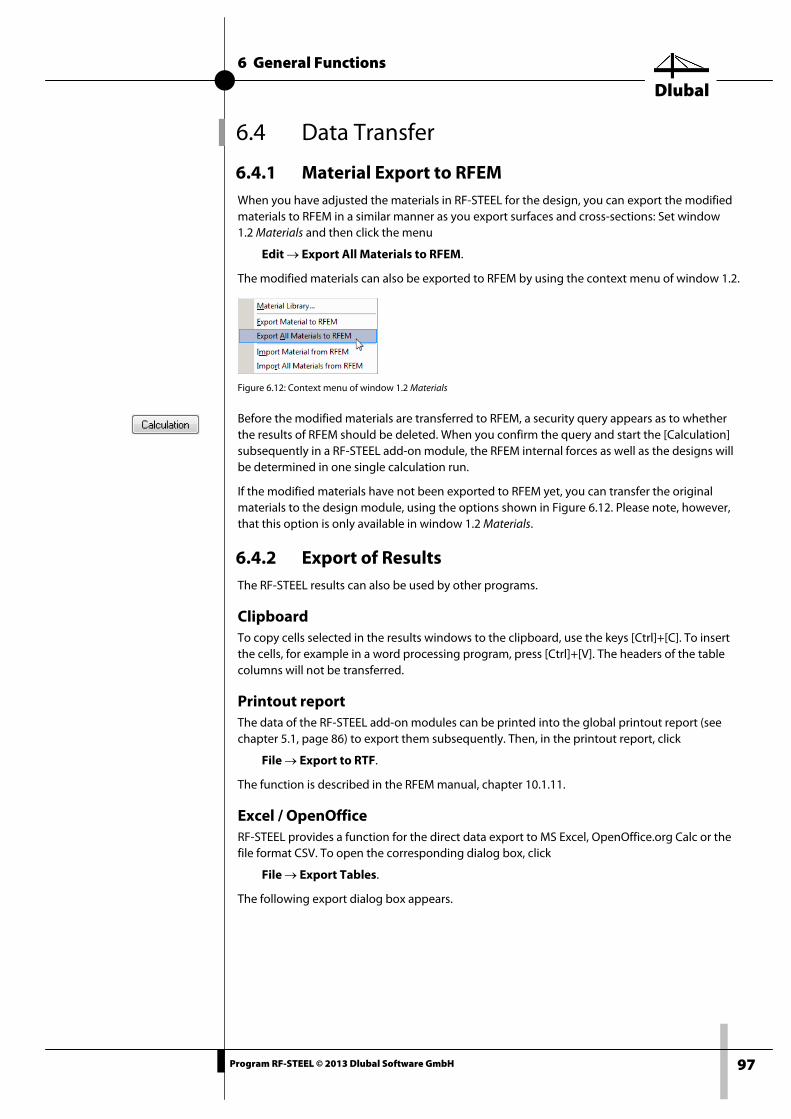
6 General Functions
Dlubal
97 Program RF-STEEL © 2013 Dlubal Software GmbH
6.4 Data Transfer
6.4.1 Material Export to RFEM When you have adjusted the materials in RF-STEEL for the design, you can export the modified materials to RFEM in a similar manner as you export surfaces and cross-sections: Set window 1.2 Materials and then click the menu
Edit → Export All Materials to RFEM.
The modified materials can also be exported to RFEM by using the context menu of window 1.2.
Figure 6.12: Context menu of window 1.2 Materials
Before the modified materials are transferred to RFEM, a security query appears as to whether the results of RFEM should be deleted. When you confirm the query and start the [Calculation] subsequently in a RF-STEEL add-on module, the RFEM internal forces as well as the designs will be determined in one single calculation run.
If the modified materials have not been exported to RFEM yet, you can transfer the original materials to the design module, using the options shown in Figure 6.12. Please note, however, that this option is only available in window 1.2 Materials.
6.4.2 Export of Results The RF-STEEL results can also be used by other programs.
Clipboard To copy cells selected in the results windows to the clipboard, use the keys [Ctrl]+[C]. To insert the cells, for example in a word processing program, press [Ctrl]+[V]. The headers of the table columns will not be transferred.
Printout report The data of the RF-STEEL add-on modules can be printed into the global printout report (see chapter 5.1, page 86) to export them subsequently. Then, in the printout report, click
File → Export to RTF.
The function is described in the RFEM manual, chapter 10.1.11.
Excel / OpenOffice RF-STEEL provides a function for the direct data export to MS Excel, OpenOffice.org Calc or the file format CSV. To open the corresponding dialog box, click
File → Export Tables.
The following export dialog box appears.
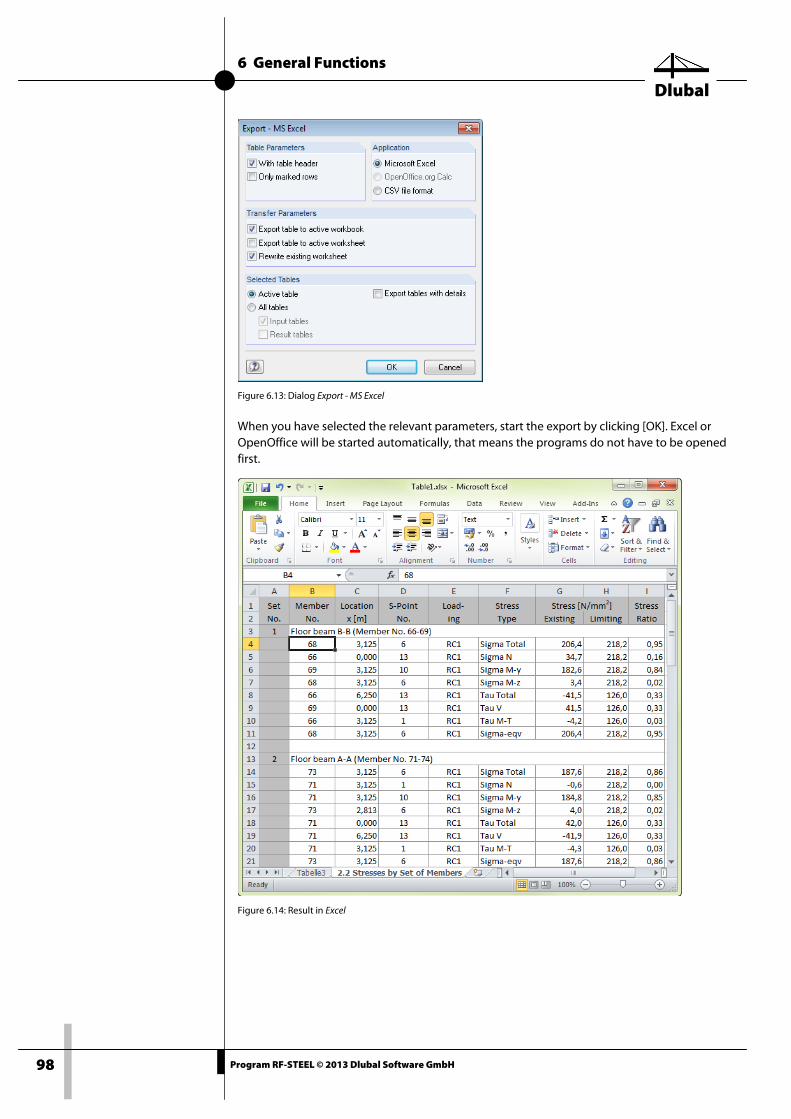
6 General Functions
Dlubal
98 Program RF-STEEL © 2013 Dlubal Software GmbH
Figure 6.13: Dialog Export - MS Excel
When you have selected the relevant parameters, start the export by clicking [OK]. Excel or OpenOffice will be started automatically, that means the programs do not have to be opened first.
Figure 6.14: Result in Excel
A Literature
Dlubal
99 Program RF-STEEL © 2013 Dlubal Software GmbH
A Literature
[1] DIN 18800 Teil 1: Stahlbauten, Bemessung und Konstruktion, 1990
[2] DIN 18800 Teil 2: Stahlbauten, Stabilitätsfälle, Knicken von Stäben und Stabwerken, 1990
[3] Erläuterungen zu DIN 18 800 Teil 1 bis 4, Beuth-Kommentar, Beuth Verlag,2. Auflage 1994
[4] Eurocode 3 Part 1-1: Design of steel structures, 1993
[5] PETERSEN, Chr.: Stahlbau, Vieweg und Sohn, Braunschweig/Wiesbaden, 3. Auflage1993
[6] SCHNEIDER Bautabellen, Werner Verlag, 20. Auflage 2012
[7] Stahlbau Handbuch, Band 1, Stahlbau-Verlagsgesellschaft mbH, Köln 1993
[8] ZIENKIEWICZ, O. C., CHEUNG, Y.K.: The Finite Element Method in Structural and Continuum Mechanics, McGraw-Hill, New York/London, 1967
[9] KOLÁR, V. et al.: Berechnung von Flächen- und Raumtragwerken nach der Methode der finiten Elemente, Springer Verlag, Wien/New York, 1975
[10] TIMOSHENKO, S. P., WOINOWSKI-KRIEGER, S.: Theory of Plates and Shells, 2. Auflage, McGraw - Hill, New York, 1959
[11] KOLÁR, V., NEMEC, I.: Finite Element Analysis of Structures. United Nations Development Program, Economic Com. for Europe, Workshop on CAD Techniques, June 1984, Pra-gue/Geneva, Vol. 1, 248 pp.
[12] BERGAN, P.G. - FELIPPA, C. A.: A Triangular Membrane Element With Rotational Degrees of Freedom. Computer Methods in Applied Mechanics and Engineering, 50 (1985), 25 - 69
[13] ZIENKIEWIC, O.C.: The Finite Element Method in Engineering Science, Mc Graw - Hill, Lon-don 3rd Ed., repr. 1979, 787 pp., Chapter 18 - 19 (Nonlinear Problems)
[14] ŠEVČÍK, I., 3D Finite Element with Rotational Degrees of Freedom, FEM-Consulting s.r.o., Brno
[15] MANG, H., HOFSTETTER, G.: Festigkeitslehre, Springer Verlag, Wien/New York, 2000
B Index
Dlubal
100 Program RF-STEEL © 2013 Dlubal Software GmbH
B Index 2 2D model type ................................................................. 55
A Action combinations ..................................................... 25
Aluminum .................................................................. 13, 43
Area ..................................................................................... 39
B Bach .................................................................................... 24
Background graphic ............................................... 74, 80
Buttons ....................................................................... 71, 72
C c/t-part ............................................................................... 88
Calculation ................................................................. 19, 51
Calculation method ....................................................... 51
Cantilever ................................................................... 19, 25
Characteristic ..................................................... 11, 25, 37
Clipboard .......................................................................... 97
Closed cross-section...................................................... 57
Coating .............................................................................. 39
Color bars ................................................................... 71, 72
Color spectrum ............................................................... 84
Colored design diagram .............................................. 84
Combination .................................................................... 37
Comment ............................................................... 9, 17, 42
Component thickness .................................... 15, 46, 79
Control panel ................................................................... 84
Coordinates ...................................................................... 30
Coordinates of stress point ......................................... 79
Cross-section ............................................................ 47, 93
Cross-section graphic ................................................... 49
Cross-section library ...................................................... 47
Cross-section optimization ......................................... 93
D Decimal places .................................................. 12, 42, 96
Deformation analysis .................................................... 37
Design ................................................................................ 48
Design case ................................................. 75, 81, 90, 91
Design of .......................................................................9, 41
Design situation ....................................................... 11, 37
Design standard .........................................................8, 40
Detail settings ................................................................. 51
Details ................................................................................ 19
Displacement limits ...................................................... 38
Displacements ................................................................ 37
Display factors ................................................................ 75
Display navigator .................................................... 82, 84
Distribution of internal forces ................................... 27
E Eccentric transverse load ............................................ 53
Enumeration method ................................................... 25
Envelope method .......................................................... 26
Equivalent stress ................... 21, 22, 30, 32, 52, 53, 58
Excel ................................................................................... 97
Exit RF-STEEL ............................................................... 8, 40
Export ................................................................................ 97
Export cross-section ...................................................... 94
Export material ............................................................... 97
Export surfaces ............................................................... 93
Extreme value ................................................................. 52
F Fatigue design ......................................................... 36, 54
Favorite ............................................................................. 93
FE mesh point .......................................................... 26, 35
FE point ................................................................ 26, 29, 30
Filter ........................................................ 35, 73, 77, 84, 85
Frequent .............................................................. 11, 25, 37
G General data ................................................................ 8, 40
Governing internal forces .................................... 51, 67
Graphic ....................................................................... 75, 81
Grid point ..................................................... 26, 29, 30, 35
I Increment ......................................................................... 92
Info about cross-section .............................................. 49
Installation .......................................................................... 6
Internal forces ............................................. 26, 27, 67, 92
L Length ............................................................................... 69
Limit τ ............................................................ 14, 32, 44, 62
Limit σeqv ....................................................... 14, 32, 44, 62
Limit σx .......................................................... 13, 32, 44, 62
Limit state design .......................................................... 38
Limit stress ..................................... 13, 32, 43, 44, 52, 62
B Index
101 Program RF-STEEL © 2013 Dlubal Software GmbH
Dlubal
Line ..................................................................................... 34
Load case .............................................. 10, 11, 41, 62, 67
Load combination ................................................... 10, 41
Loading ......................................................... 36, 37, 62, 67
Location x .................................................................. 61, 65
M Manually adjusted reference length ........................ 18
Manually defined limit stresses .......................... 13, 44
Mass ...................................................................... 17, 39, 70
Mass of cross-section .................................................... 70
Material ............................................ 12, 15, 33, 42, 46, 97
Material description ............................................... 12, 43
Material library ......................................................... 14, 45
Material properties ................................................. 12, 42
Maximum ................................................................... 36, 92
Maximum principal stress criterion .......................... 23
Maximum shear stress criterion ................................ 23
Member ...................................................................... 41, 64
Membrane equivalent stress ............................... 21, 22
Membrane stress .............................................. 20, 21, 30
Minimum .................................................................... 36, 92
Mixed method ................................................................. 26
N Navigator ......................................................................8, 40
Negative side of the surface .................. 20, 21, 22, 31
Normal stresses ............................................................... 54
O Open cross-section ........................................................ 57
OpenOffice ....................................................................... 97
Optimization .................................. 17, 26, 48, 53, 92, 93
Orthotropy........................................................................ 16
P Panel ................................................................. 7, 75, 82, 84
Parametric cross-section .............................................. 94
Parts list ............................................................... 38, 69, 70
Plastic material models ................................................ 27
Plastic shape factor αpl .......................................... 53, 54
Plastification .................................................................... 52
Point coordinates ........................................................... 30
Position ....................................................................... 38, 69
Positive side of the surface .................... 20, 21, 22, 31
Principal strain criterion ............................................... 24
Principal stress ................................................................ 30
Print ............................................................................. 86, 88
Print graphic .................................................................... 86
Printout report ......................................................... 86, 87
Printout selection .......................................................... 88
Q Quasi-permanent .............................................. 11, 25, 37
R Range ................................................................................. 36
Rankine .............................................................................. 23
Ratio ................................................................................... 38
Reference length ..................................................... 18, 25
Remark ....................................................................... 17, 48
Rendering ......................................................................... 84
Result combination .............. 10, 25, 41, 51, 52, 57, 67
Result diagrams .............................................................. 83
Result representation ................................................... 82
Result values .................................................................... 81
Results evaluation ......................................................... 71
Results navigator .................................................... 75, 81
Results on cross-section .............................................. 78
Results tables .................................................................. 26
Results values .................................................................. 76
Results windows ..................................................... 29, 60
RF-DYNAM................................................................. 10, 41
RFEM graphic .................................................................. 86
RFEM work window ............................................... 74, 80
RF-FE-LTB .......................................................................... 57
RF-STEEL case .................................................................. 53
S
Safety factor γM ........................................... 13, 15, 43, 46
Section ............................................................................... 84
Selecting windows .................................................... 8, 40
Selection of stresses ............................................... 73, 77
Serviceability ...................................................... 11, 18, 24
Serviceability limit state design ................................ 18
Set of members .......................................... 41, 63, 68, 70
Shape Massive ................................................................ 62
Shape modification hypothesis ................................ 22
SHAPE Thin ...................................................................... 62
Shear stress ........................................... 20, 21, 30, 56, 79
Shear stresses .................................................................. 57
Signs ............................................................................ 54, 55
Singularity ........................................................... 27, 84, 85
Smooth range ................................................................. 27
Smoothing ....................................................................... 27
B Index
102 Program RF-STEEL © 2013 Dlubal Software GmbH
Dlubal
Stainless steel ............................................. 13, 15, 43, 45
Start calculation ....................................................... 27, 59
Start RF-STEEL.................................................................... 6
Static moment ................................................................. 79
Stress .................................................................................. 32
Stress components .......................................... 75, 77, 81
Stress design ...................................................... 32, 58, 62
Stress diagram ................................................... 72, 78, 88
Stress graphic .................................................................. 78
Stress point ................ 50, 51, 54, 57, 61, 66, 78, 79, 88
Stress ranges .................................................................... 36
Stress ratio ...................................... 16, 32, 58, 62, 78, 84
Stress type .......................................................... 30, 62, 73
Stresses ....................... 19, 20, 29, 30, 54, 56, 60, 62, 64
Stresses on cross-sections ........................................... 88
Sum .............................................................................. 39, 70
Surface ................................................................. 16, 18, 33
Surface area ............................................................... 17, 69
Surface axes ..................................................................... 37
Surface side ...................................................................... 31
Surface thickness ............................................................ 92
Surfaces ............................................................................... 9
Symbol ............................................................................... 30
T Taper ..................................................................... 49, 64, 95
Thickness ................................................................... 16, 39
Torsion .................................................................. 53, 56, 57
Torsional stress ............................................................... 20
Transverse load............................................................... 53
Tresca ................................................................................. 23
Twin stress point ............................................................ 57
U Ultimate limit state ................................................. 10, 30
Units ...................................................................... 12, 42, 96
Unsymmetrical cross-section ..................................... 55
User profile ....................................................................... 96
User-defined cross-sections ....................................... 62
V Variable thickness .......................................................... 39
View mode ................................................... 71, 72, 74, 80
Visibility ............................................................................. 84
Volume ....................................................................... 39, 70
von Mises .......................................................................... 22
W Warping torsion ............................................................. 57
Windows ....................................................................... 8, 40
Y Yield strength fy,k ........................................ 13, 15, 43, 46