Embed Size (px)
Citation preview

RFI Management for the EVLA
Principles and Progress
Rick Perley

16 Oct 2006 CORF MeetingRick Perley
2
EVLA Emission Limits
• EVLA emission limits based on standard treatment:
– PRFI= RFI power, as measured at the input to the receiver, within some astronomical bandwidth, Δν,
– σP is the system noise power, referenced to the receiver input:
• These are combined to give the standard limit:
1.0<=P
RFIPINRσ
wattsτυ
τυυ
σ Δ=
Δ
Δ= sys
sysP kT
kT
watts10 τ
υΔ< sys
RFI
kTP

16 Oct 2006 CORF MeetingRick Perley
3
Application to Interferometers
• Application of the limit is simple for total power telescopes. • It is more complicated for interferometers:
– A 2-element interferometer is more sensitive than a single dish.– Signal coherency: The signals arriving at each antenna must
themselves be coherent. (We assume this to be true).– Imaging coherency: Each antenna impresses a different phase onto
the interfering signal – different than that of the astronomical signal. In general, this attenuates the effect of the RFI in the image by a factor of up to 1/Nantant ~ ~ --14 dB for the EVLA. 14 dB for the EVLA.
–– Fringe phase winding: Earth rotation imposes a differential phaFringe phase winding: Earth rotation imposes a differential phase se rate upon the astronomical source. This is removed in a correlarate upon the astronomical source. This is removed in a correlator, tor, so stationary sources of emission suffer a differential phase slso stationary sources of emission suffer a differential phase slip ip which can be a little, or a lot which can be a little, or a lot –– up to up to --60 dB! 60 dB!
2/1

16 Oct 2006 CORF MeetingRick Perley
4

16 Oct 2006 CORF MeetingRick Perley
5
Limits for Interferometers
• In EVLA memo # 49, I give a useful approximation for the attenuation, in an image, of external RFI, due to fringe rotation:
– τ is the integration time in seconds– νG is the frequency in GHz,– BK is the maximum baseline length in km, and– δ is the source declination.
• Combining this with the INR requirement, employing the ITU velocity resolution of 3 km/sec, and assuming Nant = 27, we find
δυτ cos12~ KGBR
wattscos2.17.2100 ⎟⎟⎠
⎞⎜⎜⎝
⎛+< δυ
τυ
KGG
sysh BkTP

16 Oct 2006 CORF MeetingRick Perley
6
Application to the EVLA
• The 2nd term is nearly always larger than the first. • The worst case for the EVLA is the D-configuration, for
which BK = 1.• For practical application, we must accept a northern
declination limit. We take δ = 85 (north of which is only 0.25% of the observable sky).
• With all these, our final emissions limit becomes:
• An important conclusion is that the limit is independent of integration time!
watts10x5 22sysGh TP υ−<

16 Oct 2006 CORF MeetingRick Perley
7
Shielding and Distance
• Conversion to power flux density, at the antenna feed, requires knowledge of the antenna collecting area. For an isotropic antenna, Ae = λ2/4π. We get, for the EVLA:
• Conversion to EIRP for the radiating source requires further knowledge of shielding factor (S) and distance (r). For the EVLA, we set:
• Where G is the antenna gain, relative to isotropic, through which the RFI enters.
2320 watt/m10x0.7 sysGh TF υ−<
watts/4 2 GFSrEIRP hπ<

16 Oct 2006 CORF MeetingRick Perley
8
The EVLA Limits
• From all this, we obtain the limits on power flux density, and spectral power flux density:
Band νG Δνk Tsys Fh Sh
4 .075 GHz .75 kHz 1000 K -195 dB(W/m2) 3.0e3 JyP .325 3.25 50 -189 3.7e3L 1.5 15 25 -172 3.9e4S 3.0 30 25 -163 1.6e5C 6.0 60 25 -154 6.3e5X 10 100 30 -147 2.1e6U 15 150 35 -141 5.5e6K 23 230 40 -135 1.5e7A 34 340 45 -129 3.4e7Q 45 450 66 -124 9.4e7

16 Oct 2006 CORF MeetingRick Perley
9
Comments on these Limits
• Our adopted limits apply for a scenario where the fringe winding provides significant attenuation. – This always applies for long baselines and high frequencies.– This will not apply for short observations (‘snapshots’) at low
frequencies, and/or short baselines. – For such situations, a more stringent (total power-like) limit would
be more appropriate. – However, for these scenarios, we have hope that post-correlation
excision techniques can be applied. • These limits presume a 3 km/sec velocity BW. For bi-
static radar experiments, the resolution needed is 1/30,000 narrower – a limit lower by 22 dB is necessary. – But this limit need only apply over ~1000 channels at specific
frequencies: 2.38, 8.51, and 34.32 GHz.

16 Oct 2006 CORF MeetingRick Perley
10
EVLA RFI Management Plan
• Modern radio astronomy requires high sensitivity, and full frequency coverage (ability to tune to any frequency).
• The EVLA will provide ‘full frequency coverage’ from 1 to 50 GHz.
• Much strong RFI within this range! • We design for:
– High linearity (maximum headroom) to prevent harmonic distortion
– Frequency agility, to spectrally avoid strongest emitters– Suppression of locally generated emissions– Retaining capability of future post-correlation excision.

16 Oct 2006 CORF MeetingRick Perley
11
EVLA Linearity
• The first line of defense is high linearity.
• Table shows the headroom from the nominal operating point to 1 db compression.
• In addition, we will employ 8-bit sampling at P, L, S bands.
• The WIDAR correlator has up to 58 dB spectral linearity.
Band HeadroomAt Receiver
HeadroomAt Sampler
L 47
48
43
42
40
33
35
27
37
S 36
C 35
X 33
Ku 32
K 33
Ka 32
Q 27
NB: 1% compression point is 13 db lower

16 Oct 2006 CORF MeetingRick Perley
12
Frequency Agility
• The EVLA’s WIDAR correlator has enormous frequency agility.
• Each of the eight 2-GHz inputs are spectrally decomposed via FIR filters into 16 tunable sub-bands of selectable BW (128, 64, 32, … .031 MHz).
• This feature will permit avoidance of particularly strong RFI.
• Correlator itself has ~44 to ~58 dB spectral dynamic range to prevent 3rd-order products from contaminating the spectrum.
16 Oct 2006 CORF MeetingRick Perley
13
Suppression of Internal RFI
• An early decision for EVLA design was to go `all-digital’. • Sampling, and digital M/C done in the antenna. • Required much careful design to minimize emissions, and
to design good RFI-tight enclosures.• MIB (module interface board) specially designed to
minimize emissions. – ~35 of these in each antenna.

16 Oct 2006 CORF MeetingRick Perley
14
LasersLasersLasersLasers
Right PolarizationLeft Polarization
Four 7.5-12.5 GHz Bands
IF-AThree 128 bitFormatters
L2_IF-LThree 128 bitFormatters
L1_IF-RThree128 bitFormatters
L2_IF-RThree 128 bitFormatters
L-2L-1 L-3 L-10 L-11 L-12L-4 L-7 L-8
Passive Optical Coupler
Single optical fiber
BaseBand (8) 2-4 GHz Bands
L-9L-6L-5
RF
UX Converter
IF A IF B IF C IF D
DownConverter
DownConverter
DownConverter
DownConverter
Two 3-bitOne 8-bit
Samplers A
De-multiplexer3/16 bits wide
Two 3-bitOne 8-bit
Samplers C
De-multiplexer3/16 bits wide
Two 3-bitOne 8-bit
Samplers D
De-multiplexer3/16 bits wide
Two 3-bitOne 8-bit
Samplers B
De-multiplexer3/16 bits wide
• Simplified electronics system.
• Each antenna contains four 8-bit 2Gsamp/sec, and eight 3-bit 4Gsamp/sec samplers.
• Total traffic ~120 Gb/sec.
• 10 Gigabit/s hardware
Basic Digital Design

16 Oct 2006 CORF MeetingRick Perley
15
DTS Enclosure # 2
Designed ByMichelle Jenkins - NRAO
• Spira Inc.1” Filter
• 140 dB@ 1.0 GHz• 120 dB@ 10 MHz• Module located
within an RFI-tight Tempest rack.

16 Oct 2006 CORF MeetingRick Perley
16
FC Fiber Connector as a Waveguide
• Wavelengthbelow cutoff
69 GHz
216 dB @ 5 GHz
207 dB@ 20 GHz

16 Oct 2006 CORF MeetingRick Perley
17
G-Rack – Enclosure #3

16 Oct 2006 CORF MeetingRick Perley
18
RF Absorber

16 Oct 2006 CORF MeetingRick Perley
19
Sampler Box & H-RackShielding
-150
-130
-110
-90
-70
-50
-30
5001500250035004500550065007500850095001050011500125001350014500155001650017500
Frequency MHz
Shie
ldin
g dB
Sampler Box
Sampler Box & H-Rack
H-Rack

16 Oct 2006 CORF MeetingRick Perley
20
Measured Harmful EIRP from Vertex Room
-180
-150
-120
-90
-60
-30
0
500
1500
2500
3500
4500
5500
6500
7500
8500
9500
10500
11500
12500
13500
14500
15500
16500
17500
Frequency MHz
dBW
EIR
P
VLA Measured: Maximum PCB EIRP
Calculated: ITU Standard
Dr. Ylva Pihlstroem EVLA Memo 47
Robert RidgewayEVLA Memo 59

16 Oct 2006 CORF MeetingRick Perley
21
Estimated Effect of Shielding
-180
-150
-120
-90
-60
-30
0
500
1500
2500
3500
4500
5500
6500
7500
8500
9500
10500
11500
12500
13500
14500
15500
16500
17500
Frequency MHz
dBW
EIR
P
VLA Measured: Maximum PCB EIRP
Allowable EIRP in Sampler Box, G-rack, & Vertex Room
16 Oct 2006 CORF MeetingRick Perley
22
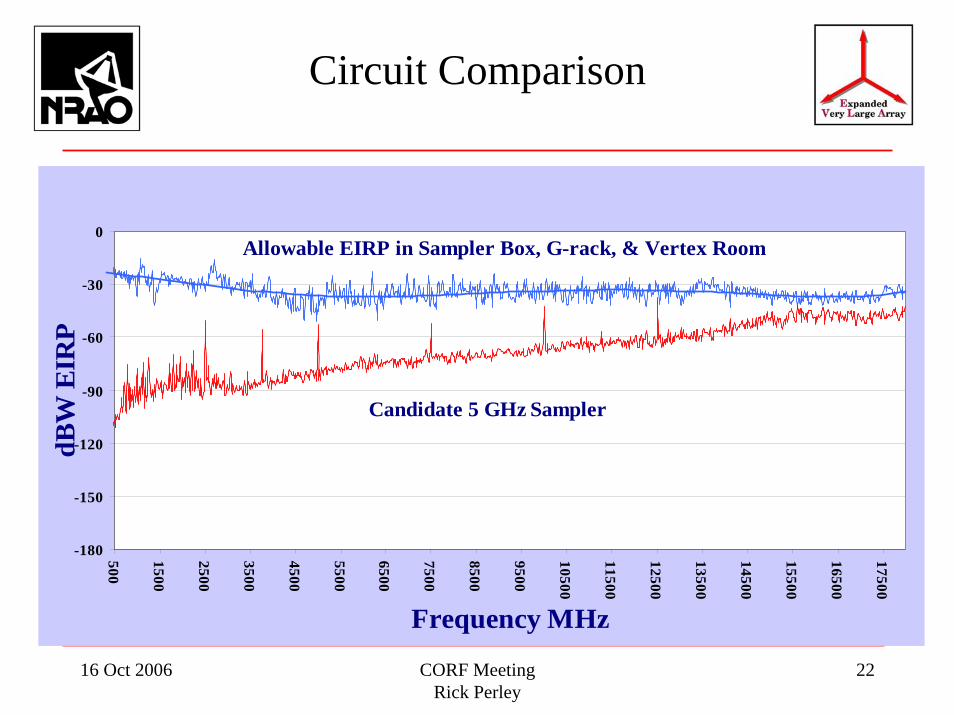
Circuit Comparison
-180
-150
-120
-90
-60
-30
0
500
1500
2500
3500
4500
5500
6500
7500
8500
9500
10500
11500
12500
13500
14500
15500
16500
17500
Frequency MHz
dBW
EIR
P
Allowable EIRP in Sampler Box, G-rack, & Vertex Room
Candidate 5 GHz Sampler

16 Oct 2006 CORF MeetingRick Perley
23
Final Defense – RFI Subtraction
• Two methodologies being explored (mostly elsewhere):– Real-time subtraction on antenna-basis (using a directed element,
and some knowledge of characteristics of interfering signals). – Post-correlation excision of interference, utilizing different phase
rotation rate of interfering signal. • Latter method attractive for large-N interferometers, as:
– No reference antenna is required– The coherence information is automatically generated by the
correlator. – Well-known methods can be easily employed.
• However, very fast sampling generally required to prevent partial decorrelation of the RFI signal we are seeking to remove.

16 Oct 2006 CORF MeetingRick Perley
24
Suggested Procedure
• Sample fast! (And preferably with narrow channelwidth).– N.B. This is an expensive combination!
• Phase rotate affected data to ‘stop’ fringe-winding of RFI.– Easy if the RFI is stationary (same rate as NCP).
• Use ‘CALIB-like’ program to solve for RFI phase and gain for every affected frequency channel. – Better: Solve for source and RFI at same time, allowing different
gains for each.
• Subtract RFI from each affected channel, using gains. • De-rotate data back to phase center, and integrate to reduce
volume.

16 Oct 2006 CORF MeetingRick Perley
25
How Fast, How Big?
• For the VLA, with SNR = 100, we find, in milliseconds:
• These are very short times, leading to very large databases.– At 100 msec, the total rate > 1 GB/second for 16384 channels.– The red zone lies beyond the WIDAR correlator – but natural fringe
winding provides 25 dB attenuation in 1 second!
Config. 90cm 20cm 6cm 2cm 0.7cm
E 3860 860 260 85 30
D 960 210 65 20 7.5
C 300 70 20 6.8 2.4
B 95 20 6.5 2.2 .75
A 30 6.8 2.0 .70 .25
NMA 3.0 .70 .20 .070 .025

16 Oct 2006 CORF MeetingRick Perley
26
Summary
• EVLA will be very susceptible to RFI.• RF/IF Electronics design emphasizes high linearity• Correlator design employs RFI-avoidance capability and
high linearity.• All digital components designed for low emissions.• High level of shielding designed in and tested. • Correlator will permit post-correlation excision techniques
for most cases where natural fringe-winding will not be effective.
• Full effect of L-band interference environment will soon be known – wide-band OMTs almost ready for implementation.