Embed Size (px)
Citation preview
RHB MUDHARABAH FUND
ANNUAL REPORT 2018
For the financial year ended 28 February 2018
RHB Asset Management Sdn Bhd (174588-X)
Head OfficeLevel 8, Tower 2 & 3, RHB Centre Jalan Tun Razak50400 Kuala Lumpur, Malaysia
Tel : +603 9205 8000
Fax : +603 9205 8100
www.rhbgroup.com
1
GENERAL INFORMATION ABOUT THE FUND
Name, Category and Type
Fund Name - RHB Mudharabah Fund
Fund Category - Balanced (Shariah-compliant) fund
Fund Type - Capital growth and income fund
Investment Objective, Policy and Strategy
Objective of the Fund
To provide a balanced mix of income and potential for capital growth by investing in stocks listed on the Bursa Malaysia Securities Berhad (“Bursa Malaysia”) or on any other stock exchanges, unlisted stocks and Islamic debt securities and other non-interest bearing assets acceptable under principles of Shariah. The Fund’s activities shall be conducted strictly in accordance with the requirement of the Shariah principles and shall be monitored by the Shariah adviser of the Fund.
Strategy
The Fund is geared towards investors who look for Shariah based investments that provide a mixture of safety, income, and capital appreciation. The Fund’s objective is to achieve returns from the sukuk and Shariah-compliant fixed income securitiesinstrument’s income stream, the dividend income stream, as well as capital appreciation. The adjustments of asset allocation between equity and sukuk are formulated based on the economic analysis and valuations of securities.
Equity investments of the Fund are limited to those in the list of Shariah-compliant securities as determined by the Shariah Advisory Council of the Securities Commission Malaysia which is updated and published twice a year. These investments generally focus on companies that have healthy prospective earnings growth, reasonable valuations and preferably yielding dividend that are superior to the fixed deposit rates.
For sukuk, the Fund seeks investments amongst the Shariah principled sukuk that are of investment grade. The investments will be a duration led strategy depending on the yield curve movement.
1
2
The asset allocation of the Fund will be as follows:-
Up to 60% of Net Asset Value
- Investments in Shariah-compliant equities
Minimum of 40% of Net Asset Value
- Investments in Islamic debt securities (“sukuk”), Islamic money market instruments and/or liquid assets acceptable under Shariah principles
The strategy adopted by the Fund for the financial year under review is in line with the strategy above.
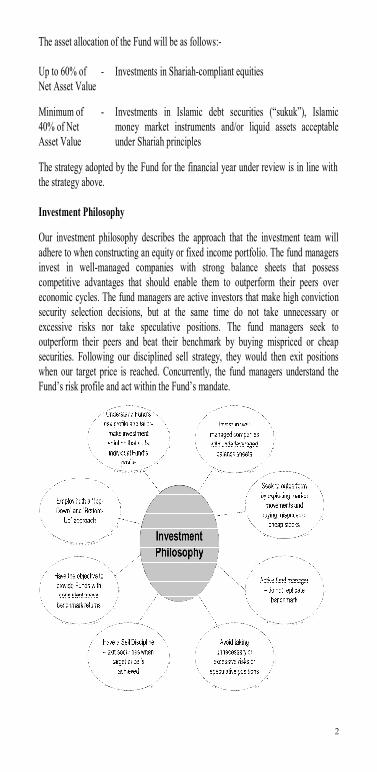
Investment Philosophy
Our investment philosophy describes the approach that the investment team will adhere to when constructing an equity or fixed income portfolio. The fund managers invest in well-managed companies with strong balance sheets that possess competitive advantages that should enable them to outperform their peers over economic cycles. The fund managers are active investors that make high conviction security selection decisions, but at the same time do not take unnecessary or excessive risks nor take speculative positions. The fund managers seek to outperform their peers and beat their benchmark by buying mispriced or cheap securities. Following our disciplined sell strategy, they would then exit positions when our target price is reached. Concurrently, the fund managers understand the Fund’s risk profile and act within the Fund’s mandate.
2
3
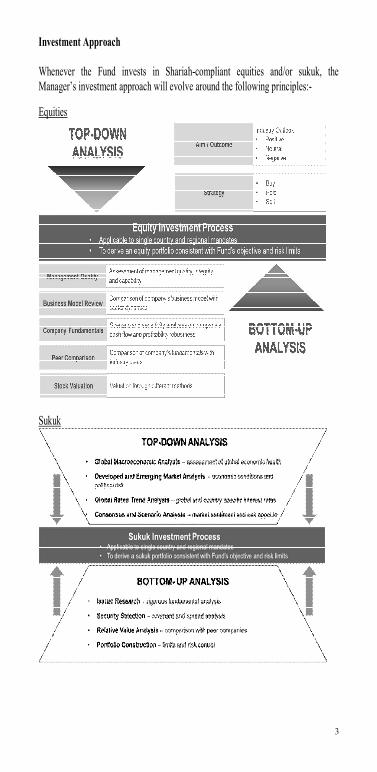
Investment Approach
Whenever the Fund invests in Shariah-compliant equities and/or sukuk, the Manager’s investment approach will evolve around the following principles:-
Equities
Sukuk
3
4
Performance Benchmark
Weighted average of FTSE Bursa Malaysia Emas Shariah Index (“FBMS”) (50%) and Maybank Islamic Berhad’s 12 months Islamic Fixed Deposit-i (“IFD-i”) rate (50%).
Permitted Investments and Restrictions
The Fund may invest or participate in Shariah-compliant securities traded oneligible markets and/or which are listed on Bursa Malaysia; Shariah-compliant warrants that carry the right in respect of a security traded in or under the rules of an eligible market; Shariah-compliant unlisted securities including securities not listed or quoted on a stock exchange but have been approved by the relevant regulatory authority for such listing or quotation and are offered directly to the Fund by the issuer; Shariah-compliant derivatives; Islamic collective investment schemes; Islamic structured products; Government Investment Issue (GII); Malaysian currency balances in hand, Malaysian currency Islamic deposits with Bank Islam Malaysia Berhad including investment certificates; Shariah-compliant securities listed on foreign exchanges; Islamic accepted bills, bond mudharabah cagamas, sukuk; and any other investment permitted by the Securities Commission Malaysia from time to time.
Distribution Policy
Income, if any, will be distributed during the financial year.
4
5
MANAGER’S REPORT
EQUITIES MARKET REVIEW
It was a good period for Malaysian equities market with all local main indices registered positive returns. The FTSE Bursa Malaysia Kuala Lumpur Composite Index (“FBM KLCI”) which is the main index for Malaysia closed the period with +9.59% return. Throughout the period, KLCI reached its lowest point of 1,693.77 on the first day of trading and closed its highest point of 1,871.46 on 27th February 2018. Other main local indices that registered a good run was FTSE Bursa Malaysia Emas Shariah Index with 8.39% whilst FTSE Bursa Malaysia Small Cap Index and FTSE Bursa Malaysia Small Cap Shariah Index registered 6.07% and 2.81% respectively. The strong rally was driven mainly by cyclical upturn in global growth, aggressive buying by foreign funds and stronger corporate earnings. Bulk of the return happened in the first quarter 2018 as uncertainties lingers on implementation on Trump new tax policies, slowing down of earnings revision by consensus and diminishing anticipation of the 14th General Election happening in second half of 2017.
Malaysia continues to lag behind its regional peers as the KLCI return of +9.59% was weaker against other regional markets like Vietnam which chalked up the highest return of +57.78%, followed by Hong Kong with +29.93%. Sectors that outperformed for the period for local equity market are; broad-based technology via Vitrox Corporation Berhad (+209.03%), Inari Amertron Berhad (+83.82%) and Globetronics Technology Berhad (+47.94%); financial sector via Malayan Banking Berhad (+28.55%) and CIMB Group Holdings Berhad (+51.80%). Property counters are mostly the underperformers as they suffered from weak consumer sentiment on big ticket items as well as abundant of supply of unsold inventories.
2017 calendar year saw a sizeable foreign fund inflow for Malaysian equities market with MYR10.6 billion net buying versus net selling of MYR29.7 billion by foreigners in 2014 to 2016 period. This is the highest value of foreign net buy within the emerging ASEAN, followed by Vietnam and Philippines. This pushes the foreign holdings in Malaysia equities to 23.1% at end November 2017 from 22.3% in December 2016. However, this is lower compared to 25.2% at the end of May 2013.
BOND MARKET REVIEW
U.S. Market
Developed market bond yields mostly moved lower led by the Eurozone countries, but United States Treasury (“UST”) yields rose. The UST curve bear-flattened as the rise in 2 years yield continued to outpace the 10 years on prospect of further rate increases by the United States (“US”) Federal Reserve (“Fed”). Geopolitical risk has receded and market realigns their focus to underlying economic data and the tax reform bills. 10 years UST yields rose significantly in December 2017 as US law makers went on a tax overhaul. Yields shot to a high of 2.50% before retreating to
5
6
end the year at 2.41%. The sell-off was driven by increased risk premium being demanded triggered by a change in bond market sentiment, prospect of higher UST issuance to fund the deficit and positioning. In addition, there were also higher inflation expectations with this tax reform hence the demand for higher yield. In summary US Treasuries 2-, 5-, 10- and 30- year closed 2017 at 1.88% (December 2016: 1.19%), 2.21% (1.93%), 2.41% (2.44%) and 2.74% (3.07%) respectively. The long term USTs were supported by haven demand amid the sustained political drama and uncertainties surrounding the much watched passage of the US tax reform bill. With the conclusion of the third rate hike at the December 2017 Federal Open Market Committee (“FOMC”) meeting (+25bps to 1.50%) and the approval and implementation of Trump’s tax overhaul bill, the US Treasury is expected to fund the deficit via further issuances amid the easing of geopolitical tensions with North Korea.
Both European Central Bank (“ECB”) and Bank of England (“BOE”) have become more hawkish in 2017. The ECB, after its hawkish tilt sparked a bond rout in June 2017 has been careful in managing market expectations regarding policy normalisation. In October 2017, it signalled a plan to gradually exit from the quantitative easing programme by halving its monthly bond purchases to EUR30 billion from EUR60 billion (from January until September 2018). Meanwhile, forward guidance continued to reiterate the ECB’s view that historically low interest rates will stay for a prolonged period, obviously to sustain growth and lift inflation to a healthy 2% level. BoE delivered its first interest rate hike in more than a decade, raising the Official Bank Rate to 0.50% from 0.25%.
Following December 2017 rate hike, US economy continued to March on despite policy uncertainties and two major hurricanes. Industrial production and capacity utilisation have continued to rise and in December 2017, the jobless rate fell to 4.1% the lowest since 2001. Persistently robust consumer sentiment and a stronger household balance sheet have pushed up asset prices and raised private consumption.
Global markets head on to a good start in 2018. US government passed a budget deal to increase spending by USD300 billion over two years, which ended the short lived shutdown but raised worries of increasing government debt and spending. This has lifted bond yields which closed weaker across the curve. UST 2-, 5-, 10- and 30-year closed the month at 2.25% (January 2018: 2.14%), 2.64% (2.51%), 2.86% (2.71%) and 3.12% (2.93%) respectively. New Fed Chair Jerome Powell in his testimony debut has reignited the expectations of a more aggressive Fed policy given his upbeat view of the economy as he played down concerns on meeting inflation targets. Fed fund futures pricing for a fourth rate hike rose with a probability for a hike in December 2018 FOMC rose from 22.0% to 25.2% in response to Powell’s remarks. The equities market on the other hand plummeted once again on heightening trade tension after Trump administration announced plan to impose tariffs on aluminium and steel for national security reasons.
6

7
Malaysian Market
Boost in Malaysian Ringgit (“MYR”) sentiment supported the currency’s strength throughout 2017. USDMYR stayed above 4.40 for the early part of 2017 and broke below this support after Bank Negara Malaysia (“BNM”) adjusted the FX administration rules implemented late-2016. Prospect of Overnight Policy Rate (“OPR”) normalisation have infused positive vibes for Malaysian Ringgit supporting USDMYR to move below 4.20 after BNM’s November 2017 Monetary Policy Committee (“MPC”) meeting reinforced views of a possible OPR hike in 2018. Sanguine sentiment across most Asian markets, an improving economic story and the weak USD contributed to MYR’s stellar performance over 2017, the best among major Asian currencies on a total return basis closing the year at 4.0465 (December 2016: 4.4862).
Malaysia economy has been strong in the whole year of 2017 recorded a stellar Gross Domestic Product (“GDP”) growth of 5.9%, the fastest in three years, mainly due to a surge in exports and subsequent pick-up in domestic demand. The Consumer Price Index (“CPI”) on the other hand moderated to 2.7% Year-on-Year (“YoY”) (December 2017:+3.5%) on the back of a slower rise in Food and Beverages (“F&B”) and transportation costs, bringing the full year 2017 inflation number at 3.7%, within BNM’s target range. BNM has raised OPR by 25bps to 3.25% in January 2018 as part of normalisation plan and is consistent with global central bank moves since global growth picked up. The reason cited for this increase was a pre-emptive move to prevent the build-up of risk that could arise from low interest rates for a prolonged period of time.
Malaysia’s net export has improved further in the fourth quarter 2017 compared with the third quarter 2017 data. Malaysia Producer Price Index (“PPI”) has been improving whilst the inflation has been decelerating which would result in better corporate margins going forward. Malaysia government’s revenue is also expected to increase due to the increase in oil price. Oil prices sustained steady recovery for the fifth consecutive month in December 2017 reaching USD66.9/bbl given the decision by Organization of Petroleum Exporting Countries (“OPEC”) and non-OPEC allies to extend oil supply cuts until the end of 2018 with the option to reassess the agreement in Jun-18 should the market overheat. This will help government to roll out more spending to improve the economy in the election year. Hence, domestic consumption is also expected to recover in view of higher government spending.
Although there were greater flows of foreign funds into local govvies in second half of 2017, for the whole year of 2017, foreign investors were net sellers of local govvies. This was partly due to the pace of recovery was not sufficient to reverse the outflows that had occurred especially in first quarter 2017, which were triggered by BNM’s measures to curb Malaysian Ringgit speculation. In addition, outflows had also been partly driven by a higher volume of maturity of Malaysian Government Securities (“MGS”)/ Government Investment Issue (“GII”) papers. As at end 2017, net total foreign flows into local govvies amounted to minus MYR7.1 billion (2016:
7
8
MYR16.2 billion). This brought total foreign holdings to MYR182.9 billion (2016: MYR190.0 billion), equivalent to 28.9% of the total outstanding (MGS: 45.1%, GII: 6.9%). At close of December 2017, Malaysia govvies level of 3-, 5-, 7-, 10-,15-, 20-and 30-years MGS last traded at 3.32% (December 2016: 3.57%), 3.53% (3.72%), 3.88% (4.13%), 3.91% (4.22%), 4.39% (4.65%), 4.54% (4.67%) and 4.86% (4.63%) respectively. Government Investment Issue (“GII”) also improved in performance mirroring MGS levels with the 3-, 5-, 7-, 10-, 15-, 20- and 30 years closed at 3.43% (December 2016: 3.66%), 3.79% (3.83%), 4.10% (4.10%), 4.19% (4.37%), 4.65% (4.65%), 4.77% (4.69%) and 4.98% (-) respectively.
The government issued MYR113.9 billion worth of MGS/GII papers in 2017 (MYR54.0 billion MGS, MYR59.9 billion GII), compared with MYR86.0 billion in 2016. Demand for local govvies in the primary market was robust in 2017 with all papers oversubscribed. A majority of the bidding interest was slanted towards GII papers which recorded an average BTC of 2.2 times versus MGS average BTC of 2.1 times.
ECONOMIC REVIEW AND OUTLOOK
In the January 2018 update of the World Economic Outlook, International Monetary Fund (“IMF”) had raised global economic growth forecast to 3.7% for 2017 and 3.9% for 2018, compared to 3.6% for 2017 and 3.7% for 2018 in the October 2017 report. The positive revision mainly from the broad-based upward revision in Asia and Europe which reflects global growth momentum and the expected impact of the recently approved U.S. tax policy changes.
The latest update also showed that about 120 economies which accounts for three quarters of world GDP have seen a pickup in growth compared to previous year. This has been the broadest synchronized global growth since 2010. World trade has shown strong growth in recent months on the back of increased manufacturing output particularly in Asia.
Global Purchasing Managers’ Index (“PMI”) numbers continued to strengthen, with February 2018 reading stood at 54.2 points, which is the best since early 2011. Despite a drop in February’s Eurozone’s manufacturing PMI of 58.6 points (from 59.6 in January), it still points to robust growth in businesses as it stayed above its long run average of 51.8 points. Similarly, Japan’s PMI edged down to 54.1 in February 2018 (from 54.8 in January) slightly above consensus expectations of 54.0. In the U.S., business environment continues to remain sanguine given the February 2018 Institute for Supply Management (ISM) PMI rose to 60.8 points, which is the highest achieved in last 14 years. This signifies a strong expansion phase of manufacturing sector since May 2004, mainly boosted by new business and employment.
On the local front, Malaysia economy continued to generate good macroeconomic numbers that forms a strong fundamental base going forward. GDP growth gained stronger momentum in fourth quarter 2017 to record a reading of +5.9% y-o-y(fourth quarter: +6.2% y-o-y), higher than market estimate of +5.7% on the back of
8
9
private sector demand as well as support from external sectors. 2017, the economy grew 5.9%, which is the strongest growth in three years.
For 2018, growth is expected to continue to remain favourable with domestic demand continue to be the key driver of growth. The synchronized uptick in global growth will continue to benefit Malaysia’s exports, with positive spill over to the domestic economic activity. Headline inflation is expected to moderate in 2018, on the back of rising commodity prices offset by stronger Malaysian Ringgit compared to previous year.
MARKET OUTLOOK AND STRATEGY GOING FORWARD
EQUITY
We expect the general elections to be held soon between April to May 2018 (after Chinese New Year and before Ramadan fasting month). In view of this, political stocks may steal the lime light in the first quarter 2018. While the Malaysian market was among the worst performing emerging markets last year in 2017, it is worth pointing out that there have been a series of positive developments lately that would increase investors’ sentiments.
Investors excitement will increase as Malaysian Ringgit expected to stabilize around the current level and fourth quarter 2017 GDP that beat street estimates again. Commodities prices in particular oil prices has recovered and stabilized above USD60 per barrel. We remain invested in equity market to take advantage of the strong macroeconomic numbers which will eventually translate into better consumption demand. We do not expect any drastic sell down in the market given that current valuation are not that expensive.
Portfolio wise, we will continue to focus in value investing. Though there are many investing thoughts such as value-oriented, growth-oriented, etc, our value approach is all-encompassing. Investors should pay attention on the ability of a company that can generate earnings growth from new products, new capacity and new markets. We will continue to focus on good quality stocks that have resilient earnings, strong balance sheet and cash flows; and ability to demonstrate clear growth strategy that will benefit the fund in the longer term.
SUKUK
We believe the 25bps OPR hike for 2018’s first MPC meeting was a part of a normalisation of interest rates and is still accommodative rather than a start of a tightening cycle. Our base case is for OPR to remain at the current level of 3.25% for the year unless growth significantly surprises on the upside. The official GDP forecast for Malaysia in 2018 is estimated at 5.0-5.5% (slightly lower than 2017) while inflation is circa 2.5% to 3.5%. Fiscal consolidation is on track to meet 3.0% in 2017 and most likely to achieve 2.8% in 2018. In addition, the supply of domestic government debt would likely be kept manageable with gross supply at MYR107 billion and net supply of MYR40 billion (gross supply in 2017: MYR107.5 billion,net supply MYR40.8 billion) since the government aspires to tighten fiscal deficit.
9
10
We believe that given the above reasons, demand for MYR bonds would likely be healthy, much attributed to ample liquidity within the domestic banking system and investors are still in search of yields.
With relatively stronger economic fundamentals built in 2017 and likely to continue in 2018, we remain comfortable in tactically adding duration to the portfolio. We will also remain overweight in corporate bond on healthy credit spreads and yield premium. Any sell-off in the local market may present buying/ trading opportunities.
REVIEW OF FUND PERFORMANCE DURING THE YEAR
For the financial period under review, the Fund registered a total return of 4.85%*underperforming the 5.78%* return of the benchmark; hence the Fund has not met its investment objective. The strong performance by the benchmark was due to outperformance on big capitalization stocks like Tenaga Nasional Berhad (+15.95%), Press Metal Aluminium Holdings (+133.87%) and the run up within the rubber gloves sector via Hartalega Holdings (+140.33) and Top Glove Corporation (+93.04%). Moving forward, the management has decided to rebalance the current holdings in smaller capitalization stocks and channelled it into fundamentally sound big capitalization stocks as a way to reduce the volatility of the Fund and ensure the fund performs better than its designated benchmark.
* Source: Lipper Investment Management (“Lipper IM”), 16 March 2018
10
11
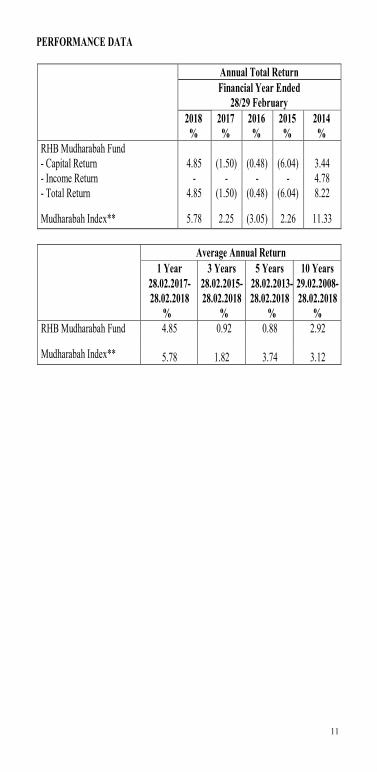
PERFORMANCE DATA
Annual Total ReturnFinancial Year Ended
28/29 February2018
%2017%
2016%
2015%
2014%
RHB Mudharabah Fund- Capital Return 4.85 (1.50) (0.48) (6.04) 3.44- Income Return - - - - 4.78- Total Return 4.85 (1.50) (0.48) (6.04) 8.22
Mudharabah Index** 5.78 2.25 (3.05) 2.26 11.33
Average Annual Return1 Year
28.02.2017-28.02.2018
%
3 Years28.02.2015-28.02.2018
%
5 Years28.02.2013-28.02.2018
%
10 Years29.02.2008-28.02.2018
%RHB Mudharabah Fund 4.85 0.92 0.88 2.92
Mudharabah Index** 5.78 1.82 3.74 3.12
11
12
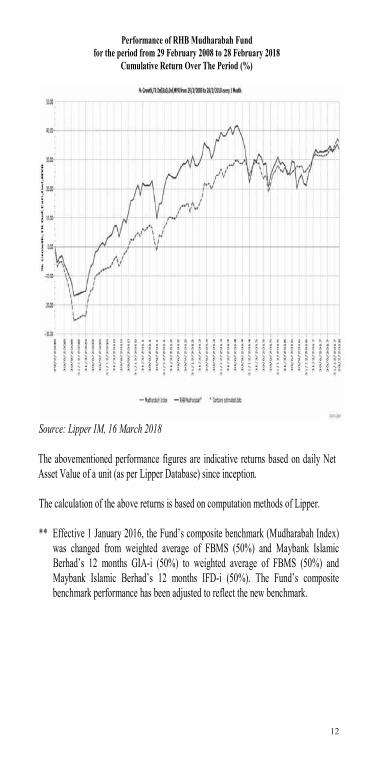
Performance of RHB Mudharabah Fundfor the period from 29 February 2008 to 28 February 2018
Cumulative Return Over The Period (%)
Source: Lipper IM, 16 March 2018
The abovementioned performance figures are indicative returns based on daily Net Asset Value of a unit (as per Lipper Database) since inception.
The calculation of the above returns is based on computation methods of Lipper.
** Effective 1 January 2016, the Fund’s composite benchmark (Mudharabah Index) was changed from weighted average of FBMS (50%) and Maybank Islamic Berhad’s 12 months GIA-i (50%) to weighted average of FBMS (50%) and Maybank Islamic Berhad’s 12 months IFD-i (50%). The Fund’s composite benchmark performance has been adjusted to reflect the new benchmark.
12
13
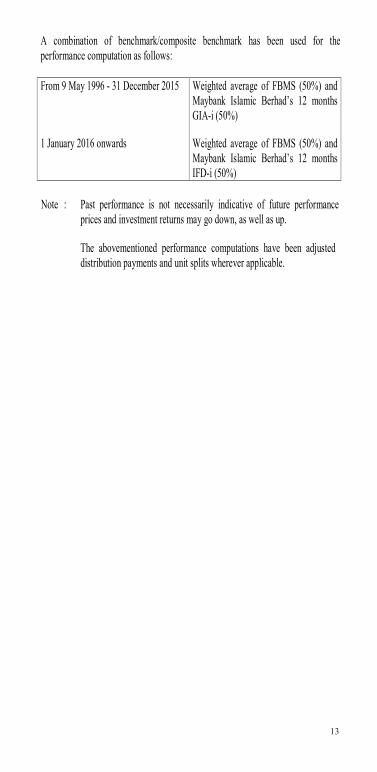
A combination of benchmark/composite benchmark has been used for the performance computation as follows:
From 9 May 1996 - 31 December 2015 Weighted average of FBMS (50%) and Maybank Islamic Berhad’s 12 months GIA-i (50%)
1 January 2016 onwards Weighted average of FBMS (50%) and Maybank Islamic Berhad’s 12 months IFD-i (50%)
Note : Past performance is not necessarily indicative of future performance and unit prices and investment returns may go down, as well as up.
The abovementioned performance computations have been adjusted to reflect distribution payments and unit splits wherever applicable.
13
14
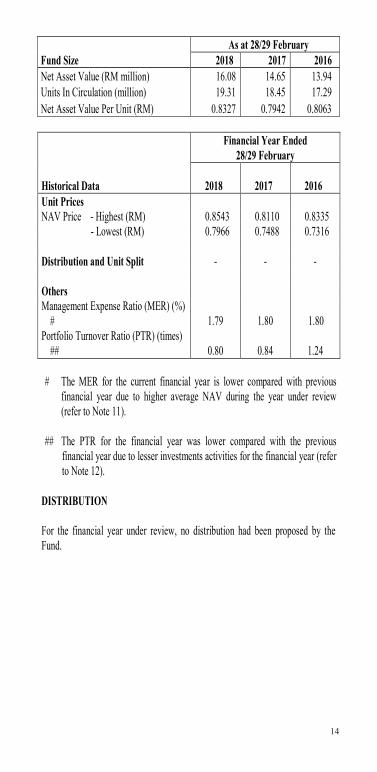
As at 28/29 FebruaryFund Size 2018 2017 2016Net Asset Value (RM million) 16.08 14.65 13.94Units In Circulation (million) 19.31 18.45 17.29Net Asset Value Per Unit (RM) 0.8327 0.7942 0.8063
Financial Year Ended 28/29 February
Historical Data 2018 2017 2016Unit PricesNAV Price - Highest (RM) 0.8543 0.8110 0.8335 - Lowest (RM) 0.7966 0.7488 0.7316
Distribution and Unit Split - - -
OthersManagement Expense Ratio (MER) (%)
# 1.79 1.80 1.80Portfolio Turnover Ratio (PTR) (times)
## 0.80 0.84 1.24
# The MER for the current financial year is lower compared with previous financial year due to higher average NAV during the year under review (refer to Note 11).
## The PTR for the financial year was lower compared with the previous financial year due to lesser investments activities for the financial year (refer to Note 12).
DISTRIBUTION
For the financial year under review, no distribution had been proposed by the Fund.
14
15
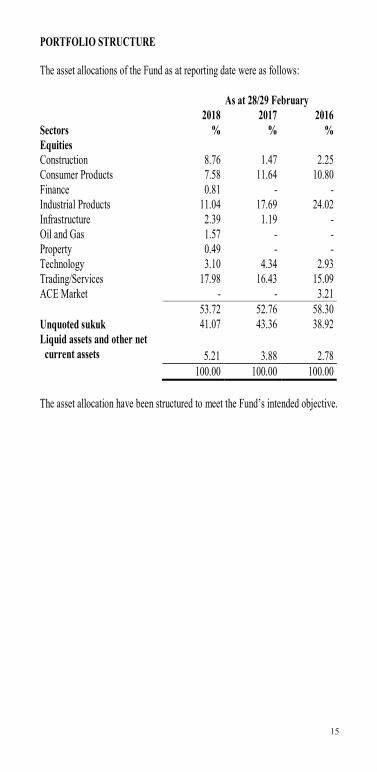
PORTFOLIO STRUCTURE
The asset allocations of the Fund as at reporting date were as follows:
As at 28/29 February2018 2017 2016
Sectors % % %EquitiesConstruction 8.76 1.47 2.25Consumer Products 7.58 11.64 10.80Finance 0.81 - -Industrial Products 11.04 17.69 24.02Infrastructure 2.39 1.19 -Oil and Gas 1.57 - -Property 0.49 - -Technology 3.10 4.34 2.93Trading/Services 17.98 16.43 15.09ACE Market - - 3.21
53.72 52.76 58.30Unquoted sukuk 41.07 43.36 38.92Liquid assets and other net
current assets 5.21 3.88 2.78100.00 100.00 100.00
The asset allocation have been structured to meet the Fund’s intended objective.
15
16
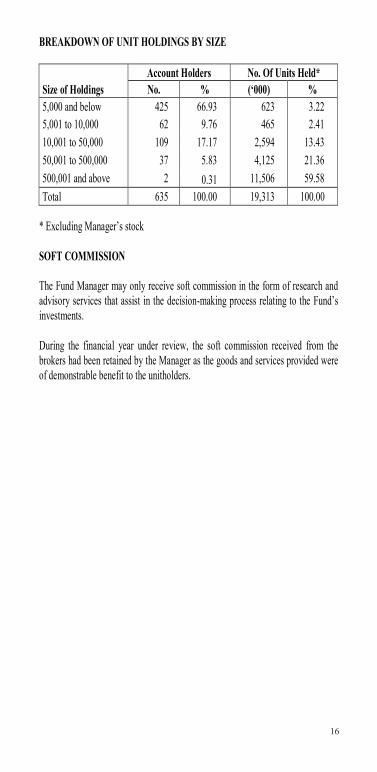
BREAKDOWN OF UNIT HOLDINGS BY SIZE
Account Holders No. Of Units Held*Size of Holdings No. % (‘000) %5,000 and below 425 66.93 623 3.225,001 to 10,000 62 9.76 465 2.4110,001 to 50,000 109 17.17 2,594 13.4350,001 to 500,000 37 5.83 4,125 21.36500,001 and above 2 0.31 11,506 59.58Total 635 100.00 19,313 100.00
* Excluding Manager’s stock
SOFT COMMISSION
The Fund Manager may only receive soft commission in the form of research and advisory services that assist in the decision-making process relating to the Fund’s investments.
During the financial year under review, the soft commission received from the brokers had been retained by the Manager as the goods and services provided wereof demonstrable benefit to the unitholders.
16
17
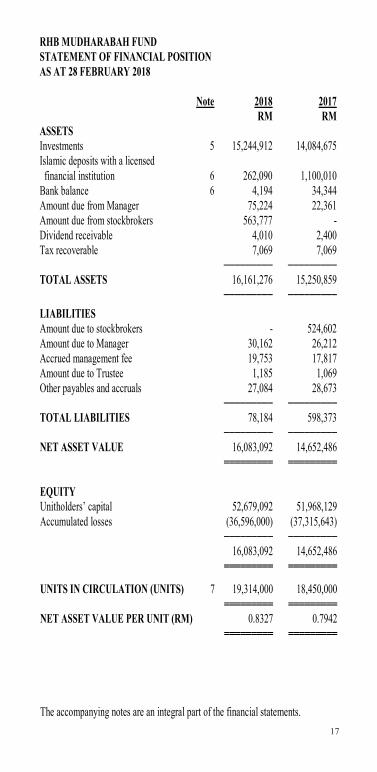
RHB MUDHARABAH FUNDSTATEMENT OF FINANCIAL POSITIONAS AT 28 FEBRUARY 2018
Note 2018 2017RM RM
ASSETSInvestments 5 15,244,912 14,084,675Islamic deposits with a licensed financial institution 6 262,090 1,100,010Bank balance 6 4,194 34,344Amount due from Manager 75,224 22,361Amount due from stockbrokers 563,777 -Dividend receivable 4,010 2,400Tax recoverable 7,069 7,069
───────── ─────────TOTAL ASSETS 16,161,276 15,250,859
───────── ─────────
LIABILITIESAmount due to stockbrokers - 524,602Amount due to Manager 30,162 26,212Accrued management fee 19,753 17,817Amount due to Trustee 1,185 1,069Other payables and accruals 27,084 28,673
───────── ─────────TOTAL LIABILITIES 78,184 598,373
───────── ─────────NET ASSET VALUE 16,083,092 14,652,486
═════════ ═════════
EQUITYUnitholders’ capital 52,679,092 51,968,129Accumulated losses (36,596,000) (37,315,643)
───────── ─────────16,083,092 14,652,486
═════════ ═════════
UNITS IN CIRCULATION (UNITS) 7 19,314,000 18,450,000═════════ ═════════
NET ASSET VALUE PER UNIT (RM) 0.8327 0.7942═════════ ═════════
The accompanying notes are an integral part of the financial statements.
17
RHB MUDHARABAH FUNDSTATEMENT OF FINANCIAL POSITIONAS AT 28 FEBRUARY 2018
Note 2018 2017RM RM
ASSETSInvestments 5 15,244,912 14,084,675Islamic deposits with a licensed financial institution 6 262,090 1,100,010Bank balance 6 4,194 34,344Amount due from Manager 75,224 22,361Amount due from stockbrokers 563,777 -Dividend receivable 4,010 2,400Tax recoverable 7,069 7,069
───────── ─────────TOTAL ASSETS 16,161,276 15,250,859
───────── ─────────
LIABILITIESAmount due to stockbrokers - 524,602Amount due to Manager 30,162 26,212Accrued management fee 19,753 17,817Amount due to Trustee 1,185 1,069Other payables and accruals 27,084 28,673
───────── ─────────TOTAL LIABILITIES 78,184 598,373
───────── ─────────NET ASSET VALUE 16,083,092 14,652,486
═════════ ═════════
EQUITYUnitholders’ capital 52,679,092 51,968,129Accumulated losses (36,596,000) (37,315,643)
───────── ─────────16,083,092 14,652,486
═════════ ═════════
UNITS IN CIRCULATION (UNITS) 7 19,314,000 18,450,000═════════ ═════════
NET ASSET VALUE PER UNIT (RM) 0.8327 0.7942═════════ ═════════
The accompanying notes are an integral part of the financial statements.17
18
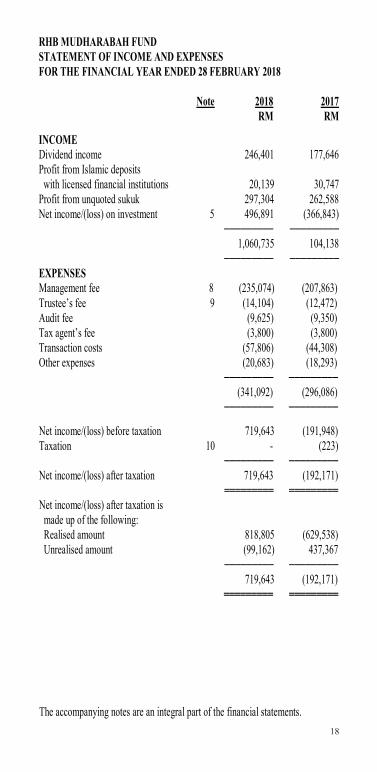
RHB MUDHARABAH FUNDSTATEMENT OF INCOME AND EXPENSESFOR THE FINANCIAL YEAR ENDED 28 FEBRUARY 2018
Note 2018 2017
RM RM
INCOMEDividend income 246,401 177,646Profit from Islamic deposits with licensed financial institutions 20,139 30,747Profit from unquoted sukuk 297,304 262,588Net income/(loss) on investment 5 496,891 (366,843)
───────── ─────────1,060,735 104,138
───────── ─────────EXPENSESManagement fee 8 (235,074) (207,863)Trustee’s fee 9 (14,104) (12,472)Audit fee (9,625) (9,350)Tax agent’s fee (3,800) (3,800)Transaction costs (57,806) (44,308)Other expenses (20,683) (18,293)
───────── ─────────(341,092) (296,086)
───────── ─────────
Net income/(loss) before taxation 719,643 (191,948)Taxation 10 - (223)
───────── ─────────Net income/(loss) after taxation 719,643 (192,171)
═════════ ═════════Net income/(loss) after taxation is
made up of the following: Realised amount 818,805 (629,538) Unrealised amount (99,162) 437,367
───────── ───────── 719,643 (192,171)═════════ ═════════
The accompanying notes are an integral part of the financial statements.
18
RHB MUDHARABAH FUNDSTATEMENT OF INCOME AND EXPENSESFOR THE FINANCIAL YEAR ENDED 28 FEBRUARY 2018
Note 2018 2017
RM RM
INCOMEDividend income 246,401 177,646Profit from Islamic deposits with licensed financial institutions 20,139 30,747Profit from unquoted sukuk 297,304 262,588Net income/(loss) on investment 5 496,891 (366,843)
───────── ─────────1,060,735 104,138
───────── ─────────EXPENSESManagement fee 8 (235,074) (207,863)Trustee’s fee 9 (14,104) (12,472)Audit fee (9,625) (9,350)Tax agent’s fee (3,800) (3,800)Transaction costs (57,806) (44,308)Other expenses (20,683) (18,293)
───────── ─────────(341,092) (296,086)
───────── ─────────
Net income/(loss) before taxation 719,643 (191,948)Taxation 10 - (223)
───────── ─────────Net income/(loss) after taxation 719,643 (192,171)
═════════ ═════════Net income/(loss) after taxation is
made up of the following: Realised amount 818,805 (629,538) Unrealised amount (99,162) 437,367
───────── ───────── 719,643 (192,171)═════════ ═════════
The accompanying notes are an integral part of the financial statements.18
19
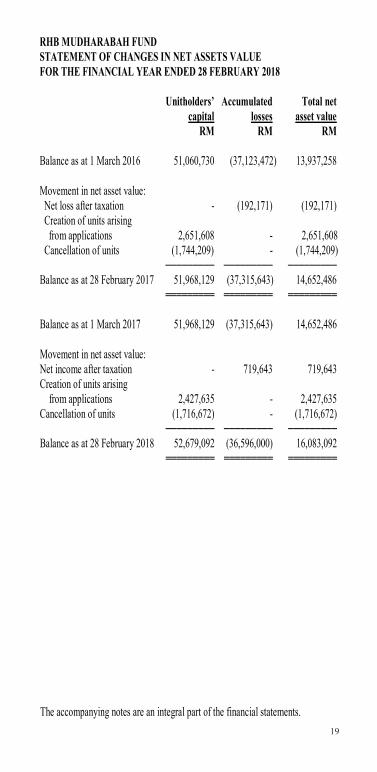
RHB MUDHARABAH FUNDSTATEMENT OF CHANGES IN NET ASSETS VALUEFOR THE FINANCIAL YEAR ENDED 28 FEBRUARY 2018
Unitholders’ Accumulated Total netcapital losses asset value
RM RM RM
Balance as at 1 March 2016 51,060,730 (37,123,472) 13,937,258
Movement in net asset value: Net loss after taxation - (192,171) (192,171) Creation of units arising from applications 2,651,608 - 2,651,608 Cancellation of units (1,744,209) - (1,744,209) ───────── ───────── ─────────Balance as at 28 February 2017 51,968,129 (37,315,643) 14,652,486
═════════ ═════════ ═════════
Balance as at 1 March 2017 51,968,129 (37,315,643) 14,652,486
Movement in net asset value:Net income after taxation - 719,643 719,643Creation of units arising from applications 2,427,635 - 2,427,635Cancellation of units (1,716,672) - (1,716,672) ───────── ───────── ─────────Balance as at 28 February 2018 52,679,092 (36,596,000) 16,083,092
═════════ ═════════ ═════════
The accompanying notes are an integral part of the financial statements.
17
RHB MUDHARABAH FUNDSTATEMENT OF FINANCIAL POSITIONAS AT 28 FEBRUARY 2018
Note 2018 2017RM RM
ASSETSInvestments 5 15,244,912 14,084,675Islamic deposits with a licensed financial institution 6 262,090 1,100,010Bank balance 6 4,194 34,344Amount due from Manager 75,224 22,361Amount due from stockbrokers 563,777 -Dividend receivable 4,010 2,400Tax recoverable 7,069 7,069
───────── ─────────TOTAL ASSETS 16,161,276 15,250,859
───────── ─────────
LIABILITIESAmount due to stockbrokers - 524,602Amount due to Manager 30,162 26,212Accrued management fee 19,753 17,817Amount due to Trustee 1,185 1,069Other payables and accruals 27,084 28,673
───────── ─────────TOTAL LIABILITIES 78,184 598,373
───────── ─────────NET ASSET VALUE 16,083,092 14,652,486
═════════ ═════════
EQUITYUnitholders’ capital 52,679,092 51,968,129Accumulated losses (36,596,000) (37,315,643)
───────── ─────────16,083,092 14,652,486
═════════ ═════════
UNITS IN CIRCULATION (UNITS) 7 19,314,000 18,450,000═════════ ═════════
NET ASSET VALUE PER UNIT (RM) 0.8327 0.7942═════════ ═════════
The accompanying notes are an integral part of the financial statements.19
20
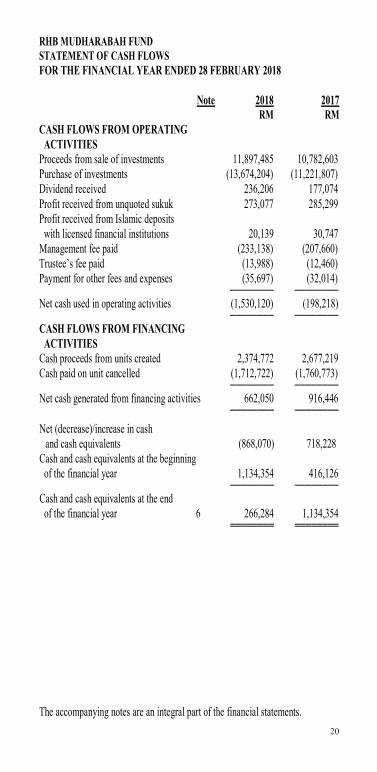
RHB MUDHARABAH FUNDSTATEMENT OF CASH FLOWSFOR THE FINANCIAL YEAR ENDED 28 FEBRUARY 2018
Note 2018 2017
RM RMCASH FLOWS FROM OPERATING ACTIVITIESProceeds from sale of investments 11,897,485 10,782,603Purchase of investments (13,674,204) (11,221,807)Dividend received 236,206 177,074Profit received from unquoted sukuk 273,077 285,299Profit received from Islamic deposits with licensed financial institutions 20,139 30,747Management fee paid (233,138) (207,660)Trustee’s fee paid (13,988) (12,460)Payment for other fees and expenses (35,697) (32,014)
──────── ────────Net cash used in operating activities (1,530,120) (198,218)
──────── ────────CASH FLOWS FROM FINANCING ACTIVITIESCash proceeds from units created 2,374,772 2,677,219Cash paid on unit cancelled (1,712,722) (1,760,773)
──────── ────────Net cash generated from financing activities 662,050 916,446
──────── ────────
Net (decrease)/increase in cash and cash equivalents (868,070) 718,228
Cash and cash equivalents at the beginning of the financial year 1,134,354 416,126
──────── ────────Cash and cash equivalents at the end of the financial year 6 266,284 1,134,354
════════ ════════
The accompanying notes are an integral part of the financial statements.
18
RHB MUDHARABAH FUNDSTATEMENT OF INCOME AND EXPENSESFOR THE FINANCIAL YEAR ENDED 28 FEBRUARY 2018
Note 2018 2017
RM RM
INCOMEDividend income 246,401 177,646Profit from Islamic deposits with licensed financial institutions 20,139 30,747Profit from unquoted sukuk 297,304 262,588Net income/(loss) on investment 5 496,891 (366,843)
───────── ─────────1,060,735 104,138
───────── ─────────EXPENSESManagement fee 8 (235,074) (207,863)Trustee’s fee 9 (14,104) (12,472)Audit fee (9,625) (9,350)Tax agent’s fee (3,800) (3,800)Transaction costs (57,806) (44,308)Other expenses (20,683) (18,293)
───────── ─────────(341,092) (296,086)
───────── ─────────
Net income/(loss) before taxation 719,643 (191,948)Taxation 10 - (223)
───────── ─────────Net income/(loss) after taxation 719,643 (192,171)
═════════ ═════════Net income/(loss) after taxation is
made up of the following: Realised amount 818,805 (629,538) Unrealised amount (99,162) 437,367
───────── ───────── 719,643 (192,171)═════════ ═════════
The accompanying notes are an integral part of the financial statements.20
21
RHB MUDHARABAH FUNDNOTES TO THE FINANCIAL STATEMENTSFOR THE FINANCIAL YEAR ENDED 28 FEBRUARY 2018
1 THE FUND, THE MANAGER AND THEIR PRINCIPAL ACTIVITIES
The RHB Mudharabah Fund (hereinafter referred to as “the Fund”) was constituted pursuant to the execution of a Master deed (Shariah funds) dated 12 June 2008 as amended via its first supplemental master deed (Shariah funds) dated 19 June 2009, second supplemental master deed (Shariah funds) dated 18 November 2009, third supplemental master deed (Shariah funds) dated 23 November 2009, fourth supplemental master deed (Shariah funds) dated 13 April 2012, fifth supplemental master deed (Shariah funds) dated 28 May 2012, seventh supplemental master deed (Shariah funds) dated 30 April 2013, eighth supplemental master deed (Shariah funds) dated 24 September 2013, ninth supplemental master deed (Shariah funds) dated 2 March 2015 and tenth supplemental master deed (Shariah funds) dated 20 May 2015 (collectively referred to as “the Deeds”) between RHB Asset Management Sdn Bhd (“the Manager”) and CIMB Islamic Trustee Berhad (“the Trustee”).
The Fund was launched on 9 May 1996 and will continue its operations until terminated according to the conditions provided in the Deeds.
The principal activity of the Fund is to invest in ‘Permitted Investments’ as defined in the Deeds, which includes Shariah-compliant stocks and shares of companies listed on the Bursa Malaysia Securities Berhad (“Bursa Malaysia”), sukuk, Shariah-compliant collective investment schemes, Islamic money market instruments and any other form of investments as may be approved by the relevant authorities from time to time and acceptable under the Shariah principles.
The Fund’s activities shall be conducted strictly in accordance with the requirement of the Shariah principles and shall be monitored by the Shariah Adviser of the Fund.
All investments will be subject to the Securities Commission Malaysia’s (“SC”) Guidelines on Unit Trust Funds, SC requirements, the Deeds, except where exemptions or variations have been approved by the SC, internal policies and procedures and objective of the Fund.
21
22
1 THE FUND, THE MANAGER AND THEIR PRINCIPAL ACTIVITIES (CONTINUED)
The main objective of the Fund is to provide a balanced mix of income and potential for capital growth by investing in stocks listed on the Bursa Malaysia or on any other stock exchanges, unlisted stocks and Islamic debt securities and other non-interest bearing assets acceptable under principles of Shariah. The Fund’s activities shall be conducted strictly in accordance with the requirement of the Shariah principles and shall be monitored by the Shariah Adviser of the Fund.
The Manager, a company incorporated in Malaysia, is a wholly-owned subsidiary of RHB Investment Bank Berhad, effective 6 January 2003. Its principal activities include rendering of investment management services, management of unit trust funds and private retirement schemes and provision of investment advisory services.
These financial statements were authorised for issue by the Manager on 25 April2018.
2 SUMMARY OF SIGNIFICANT ACCOUNTING POLICIES
2.1 Basis of preparation of the financial statements
The financial statements have been prepared under the historical cost convention, as modified by financial assets and financial liabilities (including derivative instruments) at fair value through profit or loss, except as disclosed in this summary of significant accounting policies, and in accordance with Malaysian Financial Reporting Standards (“MFRS”) and International Financial Reporting Standards (“IFRS”).
The preparation of financial statements in conformity with MFRS and IFRS requires the use of certain critical accounting estimates and assumptions that affect the reported amounts of assets and liabilities and disclosure of contingent assets and liabilities at the date of the financial statements, and the reported amounts of revenues and expenses during the financial year. It also requires the Manager to exercise its judgement in the process of applying the Fund’s accounting policies. Although these estimates and judgement are based on the Manager’s best knowledge of current events and actions, actual results may differ.
22
23
2 SUMMARY OF SIGNIFICANT ACCOUNTING POLICIES (CONTINUED)
2.1 Basis of preparation of the financial statements (continued)
(a) The Fund has applied the following amendments for the first time for the financial year beginning on 1 March 2017:
Amendments to MFRS 107 “Statement of Cash Flows – Disclosure Initiative” (effective from 1 January 2017) introduce an additional disclosure on changes in liabilities arising from financing activities.
The adoption of these amendments did not have any impact on the current year or any prior period and is not likely to affect future periods.
(b) The new standards and amendments to published standards which are relevant to the Fund but not yet effective and have not been early adopted are as follows:
(i) Financial year beginning on/after 1 March 2018
MFRS 9 “Financial Instruments” (effective from 1 January 2018) will replace MFRS 139 “Financial Instruments: Recognition and Measurement”.
MFRS 9 retains but simplifies the mixed measurement model in MFRS 139 and establishes three primary measurement categories for financial assets: amortised cost, fair value through profit or loss and fair value through other comprehensive income (“OCI”). The basis of classification depends on the entity’s business model and the cash flow characteristics of the financial asset. Investments in equity instruments are always measured at fair value through profit or loss with an irrevocable option at inception to present changes in fair value in OCI (provided the instrument is not held for trading). A debt instrument is measured at amortised cost only if the entity is holding it to collect contractual cash flows and the cash flows represent principal and profit.
23
24
2 SUMMARY OF SIGNIFICANT ACCOUNTING POLICIES (CONTINUED)
2.1 Basis of preparation of the financial statements (continued)
(b) The new standards and amendments to published standards which are relevant to the Fund but not yet effective and have not been early adopted are as follows: (continued)
(i) Financial year beginning on/after 1 March 2018 (continued)
For liabilities, the standard retains most of the MFRS 139 requirements. These include amortised cost accounting for most financial liabilities, with bifurcation of embedded derivatives. The main change is that, in cases where the fair value option is taken for financial liabilities, the part of a fair value change due to an entity’s own credit risk is recorded in other comprehensive income rather than the income statement, unless this creates an accounting mismatch.
MFRS 9 introduces an expected credit loss model on impairment that replaces the incurred loss impairment model used in MFRS 139. The expected credit loss model is forward-looking and eliminates the need for a trigger event to have occurred before credit losses are recognised.
The above standards and amendments to published standards are not expected to have a significant impact on the Fund’s financial statements.
24

25
2 SUMMARY OF SIGNIFICANT ACCOUNTING POLICIES (CONTINUED)
2.2 Financial assets
Classification
Financial assets are designated as fair value through profit or loss when they are managed and their performance evaluated on a fair value basis.
The Fund designates its investments in quoted Shariah-compliant investments and unquoted sukuk as financial assets at fair value through profit or loss at inception.
Financing and receivables are non-derivative financial assets with fixed or determinable payments that are not quoted in an active market and have been included in current assets. The Fund’s financing and receivables comprise cash and cash equivalents, amount due from Manager, amount due from stockbrokers and dividend receivable which are all due within 12 months.
Recognition and measurement
Regular purchases and sales of financial assets are recognised on the trade date, the date on which the Fund commits to purchase or sell the asset. Investments are initially recognised at fair value. Subsequent to initial recognition, financial assets at fair value through profit or loss are measured at fair value.
Transaction costs are costs incurred to acquire or dispose financial assets or liabilities at fair value through profit or loss. They include fees and commissions paid to agents, advisors, brokers and dealers. Transaction costs, when incurred, are immediately recognised in profit or loss as expenses.
Financial assets are de-recognised when the rights to receive cash flows from the investments have expired or have been transferred and the Fund has transferred substantially all risks and rewards of ownership.
Unrealised gains or losses arising from changes in the fair value of the ‘financial assets at fair value through profit or loss’ category are presented in profit or loss in the financial year in which they arise.
25
26
2 SUMMARY OF SIGNIFICANT ACCOUNTING POLICIES (CONTINUED)
2.2 Financial assets (continued)
Recognition and measurement (continued)
Quoted Shariah-compliant investments that are initially recognised at fair value and subsequently re-measured at fair value based on the market price quoted on the relevant stock exchanges at the close of the business on the valuation day, where the close price falls within the bid-ask spread. In circumstances where the close price is not within the bid-ask spread, the Manager will determine the point within the bid-ask spread that is most representative of the fair value.
If a valuation based on the market price does not represent the fair value of the securities, for example during abnormal market conditions or when no market price is available, including in the event of a suspension in the quotation of the securities for a period exceeding 14 days, or such shorter period as agreed by the Trustee, then the securities are valued as determined in good faith by the Manager, based on the methods or bases approved by the Trustee after appropriate technical consultation.
Unquoted sukuk denominated in Ringgit Malaysia are valued based on a fair value prices quoted by a bond pricing agency (“BPA”) registered with the SC as per the SC Guidelines on Unit Trust Funds. Where such quotations are not available or where the Manager is of the view that the price quoted by the BPA for a specific unquoted sukuk differs from the market price by more than 20 basis points, the Manager may use the market price, provided that the Manager:
(i) Records its basis for using a non-BPA price;(ii) Obtains necessary internal approvals to use the non-BPA price; and(iii) Keeps an audit trail of all decisions and basis for adopting the market price.
Deposits with a licensed financial institution are stated at cost plus accrued profit calculated on the effective profit method over the period from the date of placement to the date of maturity of the respective deposits, which is reasonable estimate of fair value due to the short-term nature of the deposits.
Financing and receivables are subsequently carried at amortised cost using the effective profit method.
26

27
2 SUMMARY OF SIGNIFICANT ACCOUNTING POLICIES (CONTINUED)
2.2 Financial assets (continued)
Impairment of financial assets
For assets carried at amortised cost, the Fund assesses at the end of the financial year whether there is objective evidence that a financial asset or group of financial assets is impaired. A financial asset or a group of financial assets is impaired and impairment losses are incurred only if there is objective evidence of impairment as a result of one or more events that occurred after the initial recognition of the asset (a ‘loss event’) and that loss event (or events) has an impact on the estimated future cash flows of the financial asset or group of financial assets that can be reliably estimated.
2.3 Financial liabilities
Financial liabilities are classified according to the substance of the contractual arrangements entered into and the definitions of a financial liability.
Financial liabilities, within the scope of MFRS 139 “Financial Instruments: Recognition and Measurement”, are recognised in the statement of financial position when, and only when, the Fund becomes a party to the contractual provisions of the financial instrument.
The Fund’s financial liabilities which include amount due to stockbrokers, amount due to Manager, accrued management fee, amount due to Trustee, other payables and accruals are recognised initially at fair value and subsequently measured at amortised cost using the effective profit method.
A financial liability is de-recognised when the obligation under the liability is extinguished. Gains and losses are recognised in profit or loss when the liabilities are de-recognised, and through the amortisation process.
27
28
2 SUMMARY OF SIGNIFICANT ACCOUNTING POLICIES (CONTINUED)
2.4 Unitholder’s capital
The unitholders’ contributions to the Fund meet the criteria of the definition of puttable instruments under MFRS 132 “Financial Instruments: Presentation”. Those criteria include:
the units entitle the holder to a proportionate share of the Fund’s net assets value; the units are the most subordinated class and class features are identical; there is no contractual obligations to deliver cash or another financial asset other
than the obligation on the Fund to repurchase; and the total expected cash flows from the units over its life are based substantially
on the profit or loss of the Fund.
The outstanding units are carried at the redemption amount that is payable at each financial year if unitholder exercises the right to put the unit back to the Fund.
Units are created and cancelled at prices based on the Fund’s net asset value per unit at the time of creation or cancellation. The Fund’s net asset value per unit is calculated by dividing the net assets attributable to unitholders with the total number of outstanding units.
28
29
2 SUMMARY OF SIGNIFICANT ACCOUNTING POLICIES (CONTINUED)
2.5 Income recognition
Dividend income from quoted Shariah-compliant investments is recognised when the Fund’s right to receive payment is established.
Profit from Islamic deposits with licensed financial institutions and unquoted sukuk are recognised on an accrual basis using the effective profit method.
Realised gain or loss on sale of quoted Shariah-compliant investments is arrived at after accounting for cost of investments, determined on the weighted average cost method.
Realised gain and loss on sale of unquoted sukuk is accounted for as the difference between the net disposal proceeds and the carrying amount of investments, determined on cost adjusted for accretion of discount or amortisation of premium.
Net income or loss is the total of income less expenses.
2.6 Taxation
Current tax expense is determined according to Malaysian tax laws and includes all taxes based upon the taxable income earned during the financial year.
2.7 Cash and cash equivalents
For the purpose of the statement of cash flows, cash and cash equivalents comprise bank balances and Islamic deposits with a licensed financial institution which aresubject to an insignificant risk of changes in value.
2.8 Amount due from/to stockbrokers
Amounts due from and due to brokers represent receivables for securities sold and payables for securities purchased that have been contracted for but not yet settled or delivered on the date of the statement of financial position respectively.
These amounts are recognised initially at fair value and subsequently measured at amortised cost using the effective profit method, less impairment for amounts due from brokers. See Note 2.2 on impairment of financial assets.
29
30
2 SUMMARY OF SIGNIFICANT ACCOUNTING POLICIES (CONTINUED)
2.9 Presentation and functional currency
Items included in the financial statements of the Fund are measured using the currency of the primary economic environment in which the Fund operates (the “functional currency”). The financial statements are presented in Ringgit Malaysia, which is the Fund’s presentation and functional currency.
2.10 Segmental information
Operating segments are reported in a manner consistent with the internal reporting used by the chief operating decision-maker. The operating results are regularly reviewed by the Manager and the Investment Committee. The Investment Committee assumes the role of chief operating decision maker, for performance assessment purposes and to make decisions about resources allocated to the investment segment based on the recommendation by the Investment & Security Selection Committee.
3 FINANCIAL RISK MANAGEMENT OBJECTIVES AND POLICIES
The Fund is exposed to a variety of risks, which include market risk, price risk, profit rate risk, liquidity risk, credit/default risk, Shariah specific risk and capital risk.
Financial risk management is carried out through internal control processes adopted by the Manager and adherence to the investment restrictions as stipulated in the Information Memorandum or Securities Commission Guidelines on Unit Trust.
30
31
3 FINANCIAL RISK MANAGEMENT OBJECTIVES AND POLICIES(CONTINUED)
Market risk
Securities may decline in value due to factors affecting securities markets generally or particular industries represented in the securities markets. The value of a security may decline due to general market conditions which are not specifically related to a particular company, such as real or perceived adverse economic conditions, changes in the general outlook for corporate earnings, changes in profit or currency rates or adverse investors’ sentiment generally. They may also decline due to factors that affect a particular industry or industries, such as labour shortages or increased production costs and competitive conditions within an industry. Equity securities generally have greater price volatility than sukuk. The market price of securities owned by a unit trust fund might go down or up, sometimes rapidly or unpredictably.
Price risk
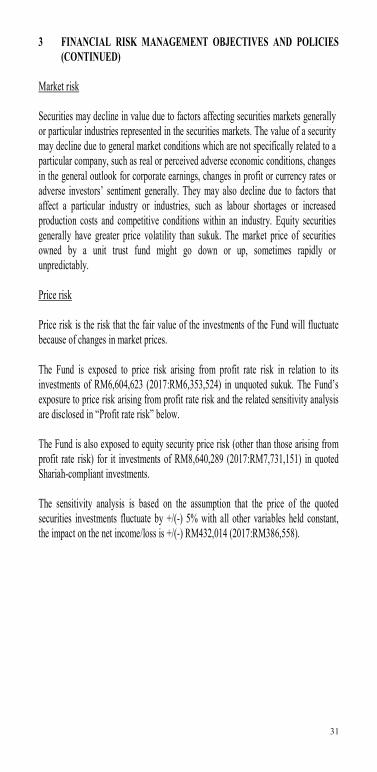
Price risk is the risk that the fair value of the investments of the Fund will fluctuate because of changes in market prices.
The Fund is exposed to price risk arising from profit rate risk in relation to its investments of RM6,604,623 (2017:RM6,353,524) in unquoted sukuk. The Fund’s exposure to price risk arising from profit rate risk and the related sensitivity analysis are disclosed in “Profit rate risk” below.
The Fund is also exposed to equity security price risk (other than those arising from profit rate risk) for it investments of RM8,640,289 (2017:RM7,731,151) in quoted Shariah-compliant investments.
The sensitivity analysis is based on the assumption that the price of the quoted securities investments fluctuate by +/(-) 5% with all other variables held constant, the impact on the net income/loss is +/(-) RM432,014 (2017:RM386,558).
31

32
3 FINANCIAL RISK MANAGEMENT OBJECTIVES AND POLICIES (CONTINUED)
Profit rate risk
In general, when profit rates rise, unquoted sukuk prices will tend to fall and vice versa. Therefore, the net asset value of the Fund may also tend to fall when profit rates rise or are expected to rise. In order to mitigate profit rates exposure of the Fund, the Manager will manage the duration of the portfolio via shorter or longer tenured assets depending on the view of the future profit rate trend of the Manager, which is based on its continuous fundamental research and analysis.
This risk is crucial since unquoted sukuk portfolio management depends on forecasting profit rate movements. Unquoted sukuk with longer maturity and lower yield coupon rates are more susceptible to profit rate movements.
The table below summarises the sensitivity of the Fund’s net income/(loss) after taxation and net asset value as at reporting date to movements in prices of unquoted fixed income securities held by the Fund as a result of movement in interest rate. The analysis is based on the assumptions that the interest rate fluctuates by +/(-) 1% with all other variables held constant.
Impact on income or loss and net asset value2018 2017
RM RM% Change in interest rate+1% (20,110) (20,765)-1% 20,197 20,876
32
33
3 FINANCIAL RISK MANAGEMENT OBJECTIVES AND POLICIES (CONTINUED)
Liquidity risk
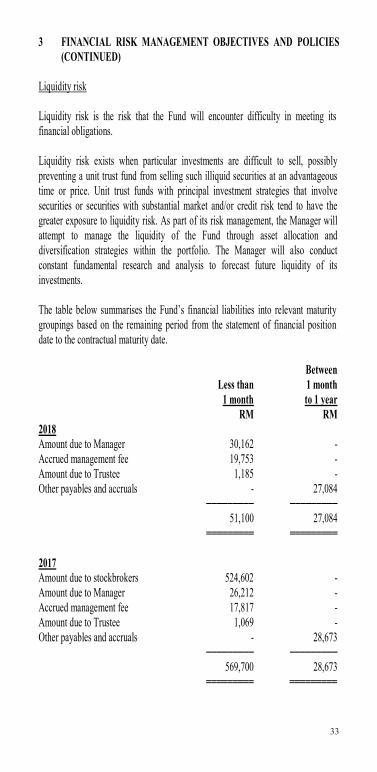
Liquidity risk is the risk that the Fund will encounter difficulty in meeting its financial obligations.
Liquidity risk exists when particular investments are difficult to sell, possibly preventing a unit trust fund from selling such illiquid securities at an advantageous time or price. Unit trust funds with principal investment strategies that involve securities or securities with substantial market and/or credit risk tend to have the greater exposure to liquidity risk. As part of its risk management, the Manager will attempt to manage the liquidity of the Fund through asset allocation and diversification strategies within the portfolio. The Manager will also conduct constant fundamental research and analysis to forecast future liquidity of its investments.
The table below summarises the Fund’s financial liabilities into relevant maturity groupings based on the remaining period from the statement of financial position date to the contractual maturity date.
BetweenLess than 1 month
1 month to 1 yearRM RM
2018Amount due to Manager 30,162 -Accrued management fee 19,753 -Amount due to Trustee 1,185 -Other payables and accruals - 27,084
───────── ─────────51,100 27,084
═════════ ═════════
2017Amount due to stockbrokers 524,602 -Amount due to Manager 26,212 -Accrued management fee 17,817 -Amount due to Trustee 1,069 -Other payables and accruals - 28,673
───────── ─────────569,700 28,673
═════════ ═════════
33
34
3 FINANCIAL RISK MANAGEMENT OBJECTIVES AND POLICIES (CONTINUED)
Credit/default risk
Credit risk refers to the possibility that the issuer of a particular investment will not be able to make timely or full payments of principal or income due on that investment. Credit risk arising from unquoted sukuk can be managed by performing continuous fundamental credit research and analysis to ascertain the creditworthiness of its issuer. In addition, the Manager imposes a minimum rating requirement as rated by either local and/or foreign rating agencies and manages the duration of the investment in accordance with the objective of the Fund. The risk arising from placements of Islamic deposits in licensed financial institutions is managed by ensuring that the Fund will only place deposits in reputable licensed financial institutions. The settlement terms of the proceeds from the creation of units receivable from the Manager are governed by the Information Memorandum or Securities Commission Guidelines on Unit Trust Fund.
34
35
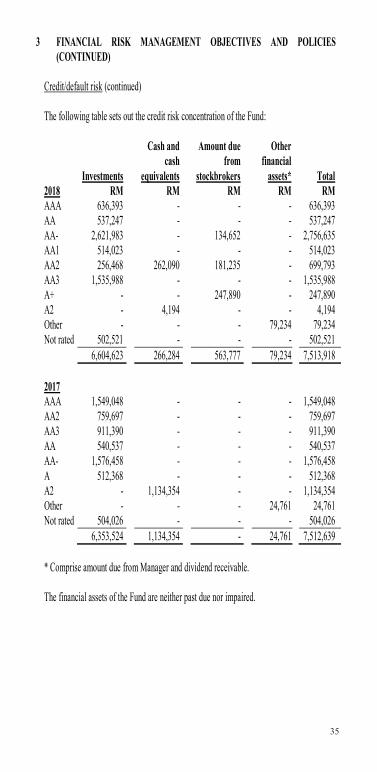
3 FINANCIAL RISK MANAGEMENT OBJECTIVES AND POLICIES (CONTINUED)
Credit/default risk (continued)
The following table sets out the credit risk concentration of the Fund:
Investments
Cash andcash
equivalents
Amount due from
stockbrokers
Otherfinancial
assets* Total2018 RM RM RM RM RMAAA 636,393 - - - 636,393AA 537,247 - - - 537,247AA- 2,621,983 - 134,652 - 2,756,635AA1 514,023 - - - 514,023AA2 256,468 262,090 181,235 - 699,793AA3 1,535,988 - - - 1,535,988A+ - - 247,890 - 247,890A2 - 4,194 - - 4,194Other - - - 79,234 79,234Not rated 502,521 - - - 502,521
6,604,623 266,284 563,777 79,234 7,513,918
2017AAA 1,549,048 - - - 1,549,048AA2 759,697 - - - 759,697AA3 911,390 - - - 911,390AA 540,537 - - - 540,537AA- 1,576,458 - - - 1,576,458A 512,368 - - - 512,368A2 - 1,134,354 - - 1,134,354Other - - - 24,761 24,761Not rated 504,026 - - - 504,026
6,353,524 1,134,354 - 24,761 7,512,639
* Comprise amount due from Manager and dividend receivable.
The financial assets of the Fund are neither past due nor impaired.
35
36
3 FINANCIAL RISK MANAGEMENT OBJECTIVES AND POLICIES (CONTINUED)
Shariah specific risk
The risk that the investments do not conform to the principle of Shariah may result in those investments being not Shariah-compliant. Should the situation arise, necessary steps shall be taken to liquidate of such investments in accordance with the rules of divestment of non Shariah-compliant investments. If this occurs, the Fund could suffer losses from the liquidation and thus, adversely affecting the value of the Fund.
Capital risk
The capital of the Fund is represented by equity consisting of unitholders’ capital of RM52,679,092 (2017: RM51,968,129) and accumulated losses of RM36,596,000 (2017: RM37,315,643). The amount of equity can change significantly on a daily basis as the Fund is subject to daily subscriptions and redemptions at the discretion of unitholders. The Fund’s objective when managing capital is to safeguard the Fund’s ability to continue as a going concern in order to provide returns for unitholders and benefits for other stakeholders and to maintain a strong capital base to support the development of the investment activities of the Fund.
4 FAIR VALUE ESTIMATION
Fair value is defined as the price that would be received to sell an asset or paid to transfer a liability in an orderly transaction between market participants at the measurement date (i.e. an exit price).
The fair value of financial assets traded in active market (such as publicly traded derivatives and trading securities) are based on quoted market prices at the close of trading on the financial year end date.
An active market is a market in which transactions for the asset or liability take place with sufficient frequency and volume to provide pricing information on an ongoing basis.
The fair value of financial assets that are not traded in an active market is determined by using valuation techniques. The Fund uses a variety of methods and makes assumptions that are based on market conditions existing at each financial year end date. Valuation techniques used for non-standardised financial instruments such as options, currency swaps and other over-the-counter derivatives, include the use of comparable recent transactions, reference to other instruments that are substantially the same, discounted cash flow analysis, option pricing models and other valuation techniques commonly used by market participants making the maximum use of market inputs and relying as little as possible on entity-specific inputs.
36
37
4 FAIR VALUE ESTIMATION (CONTINUED)
The fair values are based on the following methodologies and assumptions:
(i) For bank balances, deposits with licensed financial institution with maturities less than 1 year, the carrying value is a reasonable estimate of fair value.
(ii) The carrying value of receivables and payables are assumed to approximate their fair values due to their short term nature.
Fair value hierarchy
The Fund adopted MFRS 13 “Fair Value Measurement” in respect of disclosures about the degree of reliability of fair value measurement. This requires the Fund to classify fair value measurements using a fair value hierarchy that reflects the significance of the inputs used in making the measurements. The fair value hierarchy has the following levels:
Level 1: Quoted prices (unadjusted) in active market for identical assets or liabilities
Level 2: Inputs other than quoted prices included within level 1 that are observable for the asset or liability, either directly (that is, as prices) or indirectly (that is, derived from prices)
Level 3: Inputs for the asset and liability that are not based on observable market data (that is, unobservable inputs)
37

38
4 FAIR VALUE ESTIMATION (CONTINUED)
Fair value hierarchy (continued)
The following table analyses within the fair value hierarchy the Fund’s financial assets (by class) measured at fair value:
Level 1 Level 2 Level 3 TotalRM RM RM RM
2018Investments:- Quoted Shariah-compliant
investments 8,640,289 - - 8,640,289- Unquoted sukuk - 6,604,623 - 6,604,623
──────── ──────── ─────── ────────8,640,289 6,604,623 - 15,244,912
════════ ════════ ═══════ ════════2017Investments:- Quoted Shariah-compliant
investments 7,731,151 - - 7,731,151- Unquoted sukuk - 6,353,524 - 6,353,524
──────── ──────── ─────── ────────7,731,151 6,353,524 - 14,084,675
════════ ════════ ═══════ ════════
Investments in active listed equities, i.e. quoted Shariah-compliant investments whose value is based on quoted market prices in active markets are classified within Level 1. The Fund does not adjust the quoted prices for these instruments. The Fund’s policies on valuation of these financial assets are stated in Note 2.2.
Financial instruments that trade in markets that are considered to be active but are valued based on quoted market prices, dealer quotations or alternative pricing sources supported by observable inputs are classified within Level 2. Level 2 instruments include unquoted sukuk. As Level 2 instruments include positions that are not traded in active markets and/or are subject to transfer restrictions, valuations may be adjusted to reflect illiquidity and/or non-transferability, which are generally based on available market information. The Fund’s policies on valuation of these financial assets are stated in Note 2.2.
38
39
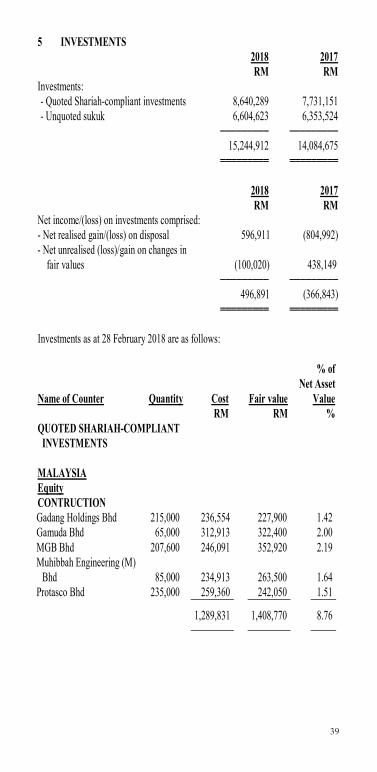
5 INVESTMENTS2018 2017RM RM
Investments:- Quoted Shariah-compliant investments 8,640,289 7,731,151- Unquoted sukuk 6,604,623 6,353,524
───────── ─────────15,244,912 14,084,675
═════════ ═════════
2018 2017RM RM
Net income/(loss) on investments comprised:- Net realised gain/(loss) on disposal 596,911 (804,992)- Net unrealised (loss)/gain on changes in
fair values (100,020) 438,149───────── ─────────
496,891 (366,843)═════════ ═════════
Investments as at 28 February 2018 are as follows:
% ofNet Asset
Name of Counter Quantity Cost Fair value ValueRM RM %
QUOTED SHARIAH-COMPLIANT INVESTMENTS
MALAYSIAEquityCONTRUCTIONGadang Holdings Bhd 215,000 236,554 227,900 1.42 Gamuda Bhd 65,000 312,913 322,400 2.00 MGB Bhd 207,600 246,091 352,920 2.19 Muhibbah Engineering (M)
Bhd 85,000 234,913 263,500 1.64 Protasco Bhd 235,000 259,360 242,050 1.51
1,289,831 1,408,770 8.76
39
40
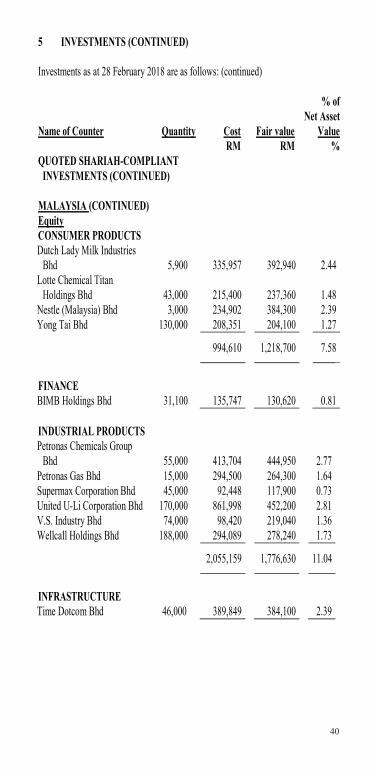
5 INVESTMENTS (CONTINUED)
Investments as at 28 February 2018 are as follows: (continued)
% ofNet Asset
Name of Counter Quantity Cost Fair value ValueRM RM %
QUOTED SHARIAH-COMPLIANT INVESTMENTS (CONTINUED)
MALAYSIA (CONTINUED)EquityCONSUMER PRODUCTSDutch Lady Milk Industries
Bhd 5,900 335,957 392,940 2.44 Lotte Chemical Titan
Holdings Bhd 43,000 215,400 237,360 1.48 Nestle (Malaysia) Bhd 3,000 234,902 384,300 2.39 Yong Tai Bhd 130,000 208,351 204,100 1.27
994,610 1,218,700 7.58
FINANCEBIMB Holdings Bhd 31,100 135,747 130,620 0.81
INDUSTRIAL PRODUCTSPetronas Chemicals Group
Bhd 55,000 413,704 444,950 2.77 Petronas Gas Bhd 15,000 294,500 264,300 1.64 Supermax Corporation Bhd 45,000 92,448 117,900 0.73 United U-Li Corporation Bhd 170,000 861,998 452,200 2.81 V.S. Industry Bhd 74,000 98,420 219,040 1.36 Wellcall Holdings Bhd 188,000 294,089 278,240 1.73
2,055,159 1,776,630 11.04
INFRASTRUCTURETime Dotcom Bhd 46,000 389,849 384,100 2.39
40
41
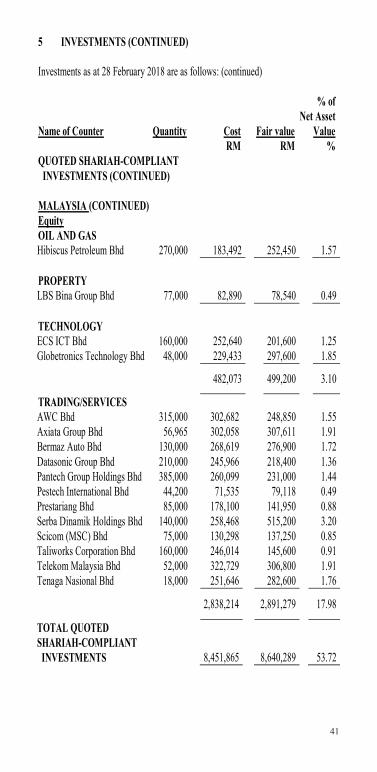
5 INVESTMENTS (CONTINUED)
Investments as at 28 February 2018 are as follows: (continued)
% ofNet Asset
Name of Counter Quantity Cost Fair value ValueRM RM %
QUOTED SHARIAH-COMPLIANT INVESTMENTS (CONTINUED)
MALAYSIA (CONTINUED)EquityOIL AND GASHibiscus Petroleum Bhd 270,000 183,492 252,450 1.57
PROPERTYLBS Bina Group Bhd 77,000 82,890 78,540 0.49
TECHNOLOGYECS ICT Bhd 160,000 252,640 201,600 1.25 Globetronics Technology Bhd 48,000 229,433 297,600 1.85
482,073 499,200 3.10
TRADING/SERVICESAWC Bhd 315,000 302,682 248,850 1.55 Axiata Group Bhd 56,965 302,058 307,611 1.91 Bermaz Auto Bhd 130,000 268,619 276,900 1.72 Datasonic Group Bhd 210,000 245,966 218,400 1.36 Pantech Group Holdings Bhd 385,000 260,099 231,000 1.44 Pestech International Bhd 44,200 71,535 79,118 0.49 Prestariang Bhd 85,000 178,100 141,950 0.88 Serba Dinamik Holdings Bhd 140,000 258,468 515,200 3.20 Scicom (MSC) Bhd 75,000 130,298 137,250 0.85 Taliworks Corporation Bhd 160,000 246,014 145,600 0.91 Telekom Malaysia Bhd 52,000 322,729 306,800 1.91 Tenaga Nasional Bhd 18,000 251,646 282,600 1.76
2,838,214 2,891,279 17.98
TOTAL QUOTED SHARIAH-COMPLIANT INVESTMENTS 8,451,865 8,640,289 53.72
41
42
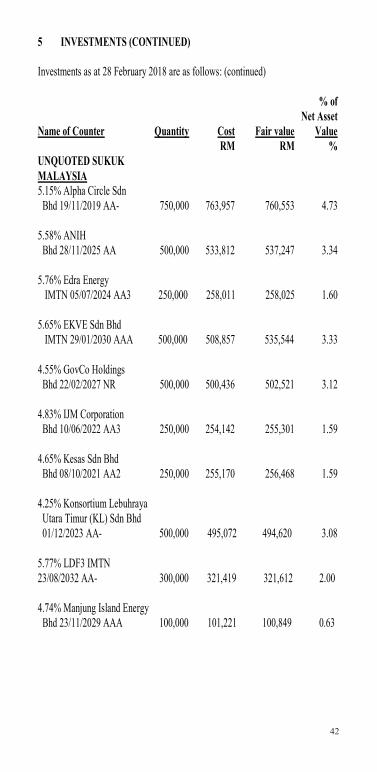
5 INVESTMENTS (CONTINUED)
Investments as at 28 February 2018 are as follows: (continued)
% ofNet Asset
Name of Counter Quantity Cost Fair value ValueRM RM %
UNQUOTED SUKUKMALAYSIA5.15% Alpha Circle Sdn Bhd 19/11/2019 AA- 750,000 763,957 760,553 4.73
5.58% ANIH Bhd 28/11/2025 AA 500,000 533,812 537,247 3.34
5.76% Edra Energy IMTN 05/07/2024 AA3 250,000 258,011 258,025 1.60
5.65% EKVE Sdn Bhd IMTN 29/01/2030 AAA 500,000 508,857 535,544 3.33
4.55% GovCo Holdings Bhd 22/02/2027 NR 500,000 500,436 502,521 3.12
4.83% IJM Corporation Bhd 10/06/2022 AA3 250,000 254,142 255,301 1.59
4.65% Kesas Sdn Bhd Bhd 08/10/2021 AA2 250,000 255,170 256,468 1.59
4.25% Konsortium Lebuhraya Utara Timur (KL) Sdn Bhd 01/12/2023 AA- 500,000 495,072 494,620 3.08
5.77% LDF3 IMTN23/08/2032 AA- 300,000 321,419 321,612 2.00
4.74% Manjung Island Energy Bhd 23/11/2029 AAA 100,000 101,221 100,849 0.63
42
43
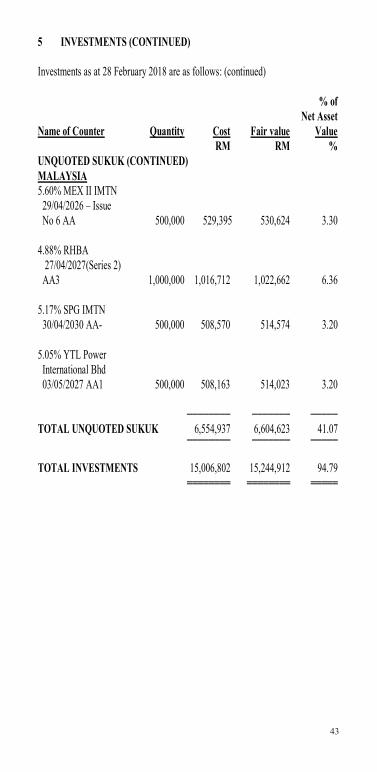
5 INVESTMENTS (CONTINUED)
Investments as at 28 February 2018 are as follows: (continued)
% ofNet Asset
Name of Counter Quantity Cost Fair value ValueRM RM %
UNQUOTED SUKUK (CONTINUED)MALAYSIA5.60% MEX II IMTN
29/04/2026 – Issue No 6 AA 500,000 529,395 530,624 3.30
4.88% RHBA27/04/2027(Series 2)
AA3 1,000,000 1,016,712 1,022,662 6.36
5.17% SPG IMTN30/04/2030 AA- 500,000 508,570 514,574 3.20
5.05% YTL Power International Bhd 03/05/2027 AA1 500,000 508,163 514,023 3.20
──────── ─────── ─────TOTAL UNQUOTED SUKUK 6,554,937 6,604,623 41.07
──────── ─────── ─────
TOTAL INVESTMENTS 15,006,802 15,244,912 94.79════════ ════════ ═════
43
44
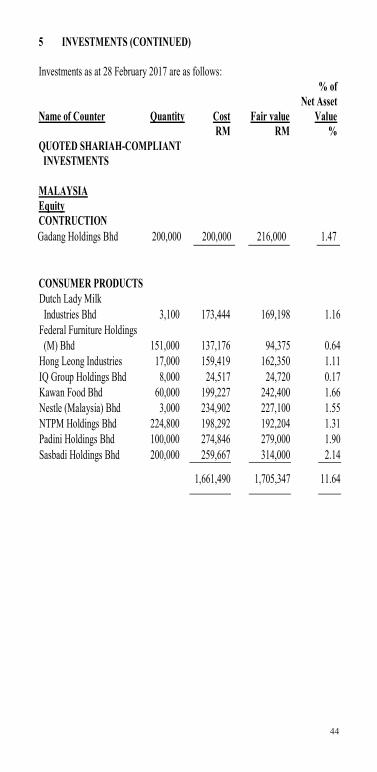
5 INVESTMENTS (CONTINUED)
Investments as at 28 February 2017 are as follows:% of
Net AssetName of Counter Quantity Cost Fair value Value
RM RM %QUOTED SHARIAH-COMPLIANT INVESTMENTS
MALAYSIAEquityCONTRUCTIONGadang Holdings Bhd 200,000 200,000 216,000 1.47
CONSUMER PRODUCTSDutch Lady Milk Industries Bhd 3,100 173,444 169,198 1.16Federal Furniture Holdings (M) Bhd 151,000 137,176 94,375 0.64Hong Leong Industries 17,000 159,419 162,350 1.11IQ Group Holdings Bhd 8,000 24,517 24,720 0.17Kawan Food Bhd 60,000 199,227 242,400 1.66Nestle (Malaysia) Bhd 3,000 234,902 227,100 1.55NTPM Holdings Bhd 224,800 198,292 192,204 1.31Padini Holdings Bhd 100,000 274,846 279,000 1.90Sasbadi Holdings Bhd 200,000 259,667 314,000 2.14
1,661,490 1,705,347 11.64
44
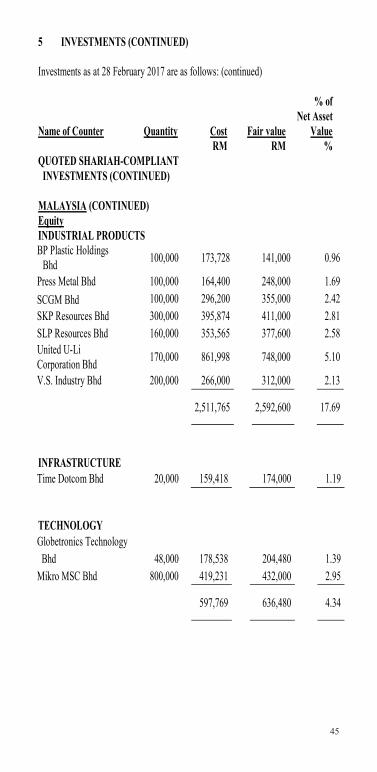
45
5 INVESTMENTS (CONTINUED)
Investments as at 28 February 2017 are as follows: (continued)
% ofNet Asset
Name of Counter Quantity Cost Fair value ValueRM RM %
QUOTED SHARIAH-COMPLIANT INVESTMENTS (CONTINUED)
MALAYSIA (CONTINUED)EquityINDUSTRIAL PRODUCTSBP Plastic Holdings
Bhd 100,000 173,728 141,000 0.96
Press Metal Bhd 100,000 164,400 248,000 1.69SCGM Bhd 100,000 296,200 355,000 2.42SKP Resources Bhd 300,000 395,874 411,000 2.81SLP Resources Bhd 160,000 353,565 377,600 2.58United U-Li Corporation Bhd 170,000 861,998 748,000 5.10
V.S. Industry Bhd 200,000 266,000 312,000 2.13
2,511,765 2,592,600 17.69
INFRASTRUCTURETime Dotcom Bhd 20,000 159,418 174,000 1.19
TECHNOLOGYGlobetronics Technology Bhd 48,000 178,538 204,480 1.39Mikro MSC Bhd 800,000 419,231 432,000 2.95
597,769 636,480 4.34
45
46
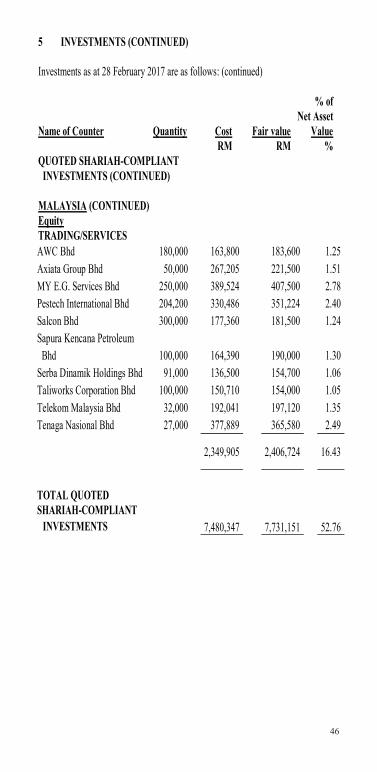
5 INVESTMENTS (CONTINUED)
Investments as at 28 February 2017 are as follows: (continued)
% ofNet Asset
Name of Counter Quantity Cost Fair value ValueRM RM %
QUOTED SHARIAH-COMPLIANT INVESTMENTS (CONTINUED)
MALAYSIA (CONTINUED)EquityTRADING/SERVICESAWC Bhd 180,000 163,800 183,600 1.25Axiata Group Bhd 50,000 267,205 221,500 1.51MY E.G. Services Bhd 250,000 389,524 407,500 2.78Pestech International Bhd 204,200 330,486 351,224 2.40Salcon Bhd 300,000 177,360 181,500 1.24Sapura Kencana Petroleum Bhd 100,000 164,390 190,000 1.30Serba Dinamik Holdings Bhd 91,000 136,500 154,700 1.06Taliworks Corporation Bhd 100,000 150,710 154,000 1.05Telekom Malaysia Bhd 32,000 192,041 197,120 1.35Tenaga Nasional Bhd 27,000 377,889 365,580 2.49
2,349,905 2,406,724 16.43
TOTAL QUOTED SHARIAH-COMPLIANT
INVESTMENTS 7,480,347 7,731,151 52.76
46
47
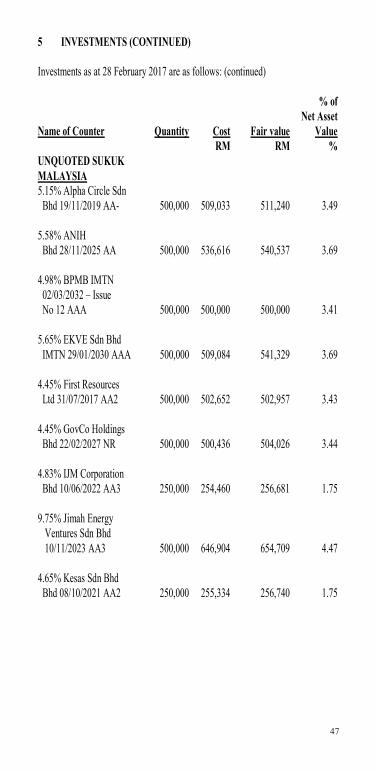
5 INVESTMENTS (CONTINUED)
Investments as at 28 February 2017 are as follows: (continued)
% ofNet Asset
Name of Counter Quantity Cost Fair value ValueRM RM %
UNQUOTED SUKUKMALAYSIA5.15% Alpha Circle Sdn Bhd 19/11/2019 AA- 500,000 509,033 511,240 3.49
5.58% ANIH Bhd 28/11/2025 AA 500,000 536,616 540,537 3.69
4.98% BPMB IMTN02/03/2032 – Issue No 12 AAA 500,000 500,000 500,000 3.41
5.65% EKVE Sdn Bhd IMTN 29/01/2030 AAA 500,000 509,084 541,329 3.69
4.45% First Resources Ltd 31/07/2017 AA2 500,000 502,652 502,957 3.43
4.45% GovCo Holdings Bhd 22/02/2027 NR 500,000 500,436 504,026 3.44
4.83% IJM Corporation Bhd 10/06/2022 AA3 250,000 254,460 256,681 1.75
9.75% Jimah Energy Ventures Sdn Bhd10/11/2023 AA3 500,000 646,904 654,709 4.47
4.65% Kesas Sdn Bhd Bhd 08/10/2021 AA2 250,000 255,334 256,740 1.75
47
48
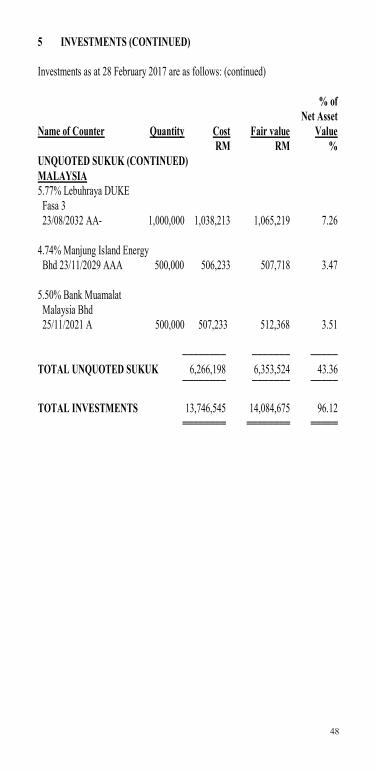
5 INVESTMENTS (CONTINUED)
Investments as at 28 February 2017 are as follows: (continued)
% ofNet Asset
Name of Counter Quantity Cost Fair value ValueRM RM %
UNQUOTED SUKUK (CONTINUED)MALAYSIA5.77% Lebuhraya DUKE Fasa 3 23/08/2032 AA- 1,000,000 1,038,213 1,065,219 7.26
4.74% Manjung Island Energy Bhd 23/11/2029 AAA 500,000 506,233 507,718 3.47
5.50% Bank Muamalat Malaysia Bhd 25/11/2021 A 500,000 507,233 512,368 3.51
──────── ─────── ─────TOTAL UNQUOTED SUKUK 6,266,198 6,353,524 43.36
──────── ─────── ─────
TOTAL INVESTMENTS 13,746,545 14,084,675 96.12════════ ════════ ═════
48
49
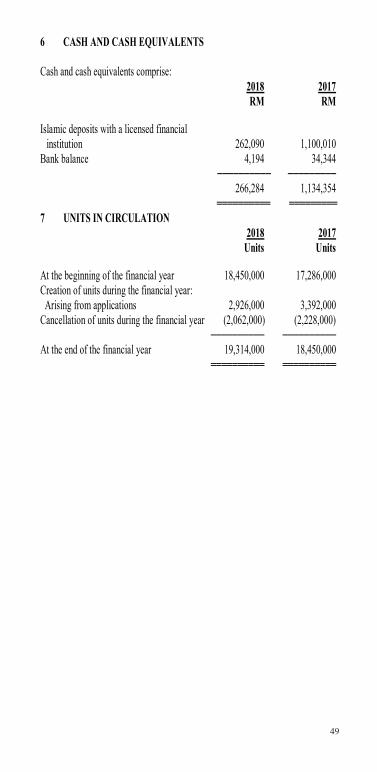
6 CASH AND CASH EQUIVALENTS
Cash and cash equivalents comprise:2018 2017RM RM
Islamic deposits with a licensed financial institution 262,090 1,100,010
Bank balance 4,194 34,344────────── ─────────
266,284 1,134,354 ══════════ ═════════
7 UNITS IN CIRCULATION 2018 2017
Units Units
At the beginning of the financial year 18,450,000 17,286,000Creation of units during the financial year: Arising from applications 2,926,000 3,392,000Cancellation of units during the financial year (2,062,000) (2,228,000)
────────── ──────────At the end of the financial year 19,314,000 18,450,000
══════════ ══════════
49
50
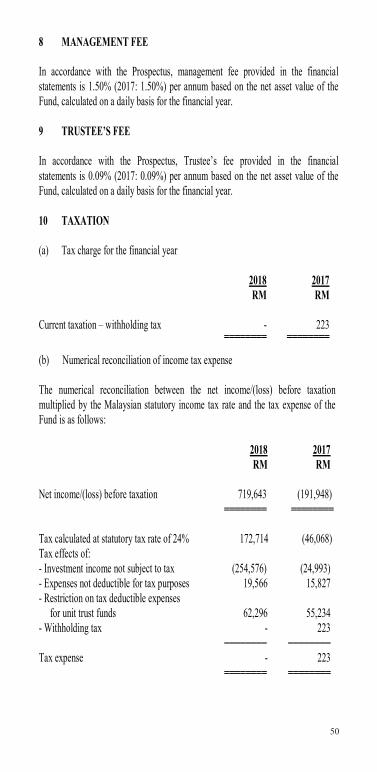
8 MANAGEMENT FEE
In accordance with the Prospectus, management fee provided in the financial statements is 1.50% (2017: 1.50%) per annum based on the net asset value of the Fund, calculated on a daily basis for the financial year.
9 TRUSTEE’S FEE
In accordance with the Prospectus, Trustee’s fee provided in the financial statements is 0.09% (2017: 0.09%) per annum based on the net asset value of the Fund, calculated on a daily basis for the financial year.
10 TAXATION
(a) Tax charge for the financial year
2018 2017RM RM
Current taxation – withholding tax - 223════════ ════════
(b) Numerical reconciliation of income tax expense
The numerical reconciliation between the net income/(loss) before taxation multiplied by the Malaysian statutory income tax rate and the tax expense of the Fund is as follows:
2018 2017RM RM
Net income/(loss) before taxation 719,643 (191,948)════════ ════════
Tax calculated at statutory tax rate of 24% 172,714 (46,068)Tax effects of:- Investment income not subject to tax (254,576) (24,993)- Expenses not deductible for tax purposes 19,566 15,827- Restriction on tax deductible expenses for unit trust funds 62,296 55,234- Withholding tax - 223
──────── ────────Tax expense - 223
════════ ════════
50
51
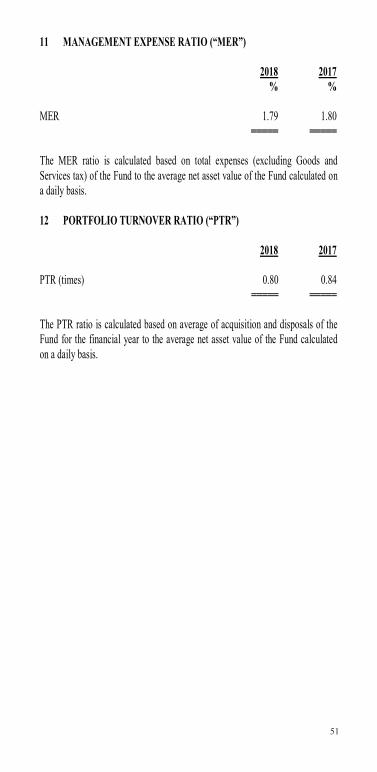
11 MANAGEMENT EXPENSE RATIO (“MER”)
2018 2017% %
MER 1.79 1.80═════ ═════
The MER ratio is calculated based on total expenses (excluding Goods and Services tax) of the Fund to the average net asset value of the Fund calculated on a daily basis.
12 PORTFOLIO TURNOVER RATIO (“PTR”)
2018 2017
PTR (times) 0.80 0.84═════ ═════
The PTR ratio is calculated based on average of acquisition and disposals of the Fund for the financial year to the average net asset value of the Fund calculated on a daily basis.
51
52
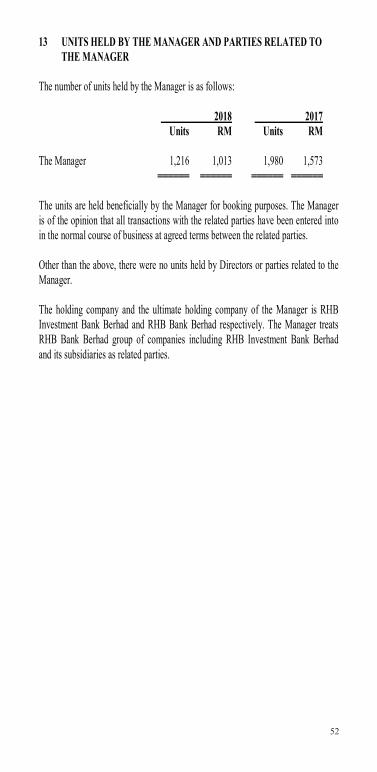
13 UNITS HELD BY THE MANAGER AND PARTIES RELATED TO THE MANAGER
The number of units held by the Manager is as follows:
2018 2017Units RM Units RM
The Manager 1,216 1,013 1,980 1,573══════ ══════ ══════ ══════
The units are held beneficially by the Manager for booking purposes. The Manager is of the opinion that all transactions with the related parties have been entered into in the normal course of business at agreed terms between the related parties.
Other than the above, there were no units held by Directors or parties related to the Manager.
The holding company and the ultimate holding company of the Manager is RHB Investment Bank Berhad and RHB Bank Berhad respectively. The Manager treats RHB Bank Berhad group of companies including RHB Investment Bank Berhad and its subsidiaries as related parties.
52

53
14 TRANSACTIONS BY THE FUND
Details of transactions by the Fund for the financial year ended 28 February 2018 are as follows:
PercentagePercentage of total
Value of of total Brokerage brokerageBroker/financial institution trades trades fees fees
RM % RM %RHB Investment Bank Bhd* 10,483,447 40.84 9,759 26.42Maybank Investment Bank Bhd 1,985,807 7.74 3,972 10.75Alliance Investment Bank Bhd 1,512,946 5.89 3,026 8.19TA Securities Holdings Bhd 1,279,396 4.98 2,559 6.93CIMB Investment Bank Bhd 1,139,799 4.44 2,825 7.65Kenanga Investment Bank
Bhd 1,057,740 4.12 2,054 5.56CLSA Securities Malaysia Sdn Bhd 1,054,262 4.11 2,108 5.71Malayan Bank Bhd 1,009,020 3.93 - -CIMB Bank Bhd 1,000,000 3.90 - -MIDF Amanah Investment Bank Bhd 933,126 3.63 1,866 5.05Others 4,215,164 16.42 8,773 23.74
───────── ───── ──────── ─────25,670,707 100.00 36,942 100.00
═════════ ═════ ════════ ═════
53

54
14 TRANSACTIONS BY THE FUND (CONTINUED)
Details of transactions (including money money market placements) by the Fund for the financial year ended 28 February 2017 are as follows:
PercentagePercentage of total
Value of of total Brokerage brokerageBroker/financial institution trades trades fees fees
RM % RM %Bank Muamalat Malaysia Bhd 11,001,689 33.40 - -RHB Investment Bank Bhd* 8,308,605 25.22 7,019 24.10Public Investment Bank Bhd 2,781,610 8.44 6,157 21.14Affin Hwang Investment Bank Bhd 1,511,958 4.59 3,042 10.45OCBC Bank (Malaysia) Bhd 1,500,000 4.55 - -Maybank Investment Bank Bhd 1,336,628 4.06 1,673 5.74Alliance Investment Bank Bhd 967,213 2.94 1,934 6.64M&A Security Sdn Bhd 929,389 2.82 1,869 6.42MIDF Amanah Investment Bank Bhd 873,107 2.65 1,758 6.03Hong Leong Investment Bank Bhd 723,083 2.20 430 1.47Others 3,006,809 9.13 5,247 18.01
───────── ───── ──────── ─────32,940,091 100.00 29,129 100.00
═════════ ═════ ════════ ═════
* Included in transactions by the Fund are trades with the holding company of the Manager, RHB Investment Bank. The Manager is of the opinion that all transactions with the related companies have been entered into in the normal course of business at agreed terms between the related parties.
54
55
15 SEGMENT INFORMATION
The Investment & Security Selection Committee of the Manager recommends strategic resource allocations of the Fund to the Investment Committee of the Manager (collectively referred to as “Committee”).
The internal reporting provided to the Committee for the Fund’s assets, liabilities and performance is prepared on a consistent basis with the measurement and recognition principles of MFRS and IFRS. The Committee considers the business from both a geographic and investment perspective. Geographically, the Committee considers the performance of investments in overall basis.
The reportable operating segments derive their income by seeking investments to achieve investment objectives commensurate with an acceptable level of risk within each portfolio. These returns consist of profit, dividends and gains on the appreciation in the value of investments which are derived from Malaysia.
There were no changes in the reportable segments during the financial year.
55
56
STATEMENT BY MANAGER
We, Patrick Chin Yoke Chung and Abdul Aziz Peru Mohamed, two of the Directors of RHB Asset Management Sdn Bhd, do hereby state that in the opinion of the Directors of the Manager, the accompanying statement of financial position, statement of income and expenses, statement of changes in net asset value, statement of cash flows and the accompanying notes are drawn up in accordance with Malaysian Financial Reporting Standards and International Financial Reporting Standards so as to give a true and fair view of the financial position of the Fund as of 28 February 2018 and of its financial performance and cash flows for the financial year then ended and comply with provisions of the Deeds.
On behalf of the Manager
PATRICK CHIN YOKE CHUNG ABDUL AZIZ PERU MOHAMEDDIRECTOR DIRECTOR
Kuala Lumpur25 April 2018
56
57
TRUSTEE’S REPORTTO THE UNITHOLDERS OF RHB MUDHARABAH FUND
We, CIMB Islamic Trustee Berhad (“the Trustee”), being the Trustee for RHB Mudharabah Fund (“the Fund”), are of the opinion that RHB Asset Management Sdn Bhd (“the Manager”), acting in the capacity as Manager of the Fund, has fulfilled its duties in the following manner for the financial year ended 28 February 2018.
a) The Fund has been managed in accordance with the limitations imposed on the investment powers of the management company under the Deeds, the Securities Commission Malaysia’s Guidelines on Unit Trust Funds, the Capital Markets and Services Act 2007 (as amended from time to time) and other applicable laws;
b) Valuation and pricing of units of the Fund has been carried out in accordance with the Deeds and relevant regulatory requirements; and
c) Creation and cancellation of units have been carried out in accordance with the Deeds and relevant regulatory requirements.
For and on behalf ofCIMB Islamic Trustee Berhad
Lee Kooi YokeChief Operating Officer
Kuala Lumpur25 April 2018
57
58
REPORT OF THE SHARIAH ADVISER
We have acted as the Shariah Adviser of RHB Mudharabah Fund (“the Fund”). Our responsibility is to ensure that the procedures and processes employed by RHB Asset Management Sdn Bhd (“the Manager”) and that the provisions of the Deeds are in accordance with Shariah principles.
In our opinion, the Manager has managed and administered the Fund in accordance with Shariah principles and complied with the applicable guidelines, rulings and decisions issued by the Securities Commission Malaysia pertaining to Shariah matters for the financial year ended 28 February 2018.
In addition, we also confirm that the investment portfolio of the Fund comprises securities which have been classified as Shariah-compliant by the Shariah Advisory Council of the Securities Commission Malaysia (“SACSC”). As for the securities which are not certified by the SACSC, we have reviewed the said securities and opine that these securities are designated as Shariah-compliant.
I, Dr. Ghazali Jaapar, hereby confirm that all members of the Shariah Committee have been consulted and made aware of all the Shariah issues in relation to this report.
For and on behalf of RHB Islamic Bank Berhad
Dr. Ghazali JaaparChairmanShariah Committee of RHB Islamic Bank Berhad
Kuala Lumpur25 April 2018
58

59
INDEPENDENT AUDITORS’ REPORT TO THE UNITHOLDERS OFRHB MUDHARABAH FUND
REPORT ON THE FINANCIAL STATEMENTS
Our opinion
In our opinion, the financial statements of RHB Mudharabah Fund (“the Fund”) give a true and fair view of the financial position of the Fund as at 28 February 2018 and of its financial performance and cash flows for the financial year then ended in accordance with Malaysian Financial Reporting Standards and International Financial Reporting Standards.
What we have audited
We have audited the financial statements of the Fund, which comprise the statement of financial position as at 28 February 2018, and the statement of income and expenses, statement of changes in nets asset value and statement of cash flows for the financial year then ended, and notes to the financial statements, including a summary of significant accounting policies, as set out on pages 17 to 55.
Basis for opinion
We conducted our audit in accordance with approved standards on auditing in Malaysia and International Standards on Auditing. Our responsibilities under those standards are further described in the “Auditors’ responsibilities for the audit of the financial statements” section of our report.
We believe that the audit evidence we have obtained is sufficient and appropriate to provide a basis for our opinion.
Independence and other ethical responsibilities
We are independent of the Fund in accordance with the By-Laws (on Professional Ethics, Conduct and Practice) of the Malaysian Institute of Accountants (“By-Laws”) and the International Ethics Standards Board for Accountants’ Code of Ethics for Professional Accountants (“IESBA Code”), and we have fulfilled our other ethical responsibilities in accordance with the By-Laws and the IESBA Code.
59
60
INDEPENDENT AUDITORS’ REPORT TO THE UNITHOLDERS OFRHB MUDHARABAH FUND (CONTINUED)
REPORT ON THE FINANCIAL STATEMENTS (CONTINUED)
Information other than the financial statements and auditors’ report thereon
The Manager of the Fund is responsible for the other information. The other information comprises Manager’s report, but does not include the financial statements of the Fund and our auditors’ report thereon.
Our opinion on the financial statements of the Fund does not cover the other information and we do not express any form of assurance conclusion thereon.
In connection with our audit of the financial statements of the Fund, our responsibility is to read the other information and, in doing so, consider whether the other information is materially inconsistent with the financial statements of the Fund or our knowledge obtained in the audit or otherwise appears to be materially misstated.
If, based on the work we have performed, we conclude that there is a material misstatement of this other information, we are required to report that fact. We have nothing to report in this regard.
Responsibilities of the Manager for the Financial Statements
The Manager of the Fund is responsible for the preparation of the financial statements of the Fund that give a true and fair view in accordance with Malaysian Financial Reporting Standards and International Financial Reporting Standards. The Manager is also responsible for such internal control as the Manager determines is necessary to enable the preparation of financial statements of the Fund that are free from material misstatement, whether due to fraud or error.
In preparing the financial statements of the Fund, the Manager is responsible for assessing the Fund’s ability to continue as a going concern, disclosing, as applicable, matters related to going concern and using the going concern basis of accounting unless the Manager either intends to liquidate the Fund or to terminate the Fund, or has no realistic alternative but to do so.
60
61
INDEPENDENT AUDITORS’ REPORT TO THE UNITHOLDERS OFRHB MUDHARABAH FUND (CONTINUED)
NDEPENDENT AUDITORS’ REPORT TO THE UNITHOLDERS OFREPORT ON THE FINANCIAL STATEMENTS (CONTINUED)
Auditors’ responsibilities for the audit of the financial statements
Our objectives are to obtain reasonable assurance about whether the financial statements of the Fund as a whole are free from material misstatement, whether due to fraud or error, and to issue an auditors’ report that includes our opinion. Reasonable assurance is a high level of assurance, but is not a guarantee that an audit conducted in accordance with approved standards on auditing in Malaysia and International Standards on Auditing will always detect a material misstatement when it exists. Misstatements can arise from fraud or error and are considered material if, individually or in the aggregate, they could reasonably be expected to influence the economic decisions of users taken on the basis of these financial statements.
As part of an audit in accordance with approved standards on auditing in Malaysia and International Standards on Auditing, we exercise professional judgement and maintain professional scepticism throughout the audit. We also:
(a) Identify and assess the risks of material misstatement of the financial statements of the Fund, whether due to fraud or error, design and perform audit procedures responsive to those risks, and obtain audit evidence that is sufficient and appropriate to provide a basis for our opinion. The risk of not detecting a material misstatement resulting from fraud is higher than for one resulting from error, as fraud may involve collusion, forgery, intentional omissions, misrepresentations, or the override of internal control.
(b) Obtain an understanding of internal control relevant to the audit in order to design audit procedures that are appropriate in the circumstances, but not for the purpose of expressing an opinion on the effectiveness of Fund’s internal control.
(b) Evaluate the appropriateness of accounting policies used and the reasonableness of accounting estimates and related disclosures made by the Manager.
61
62
INDEPENDENT AUDITORS’ REPORT TO THE UNITHOLDERS OFRHB MUDHARABAH FUND (CONTINUED)
REPORT ON THE FINANCIAL STATEMENTS (CONTINUED)
Auditors’ responsibilities for the audit of the financial statements (continued)
(d) Conclude on the appropriateness of the Manager’s use of the going concern basis of accounting and, based on the audit evidence obtained, whether a material uncertainty exists related to events or conditions that may cast significant doubt on the Fund’s ability to continue as a going concern. If we conclude that a material uncertainty exists, we are required to draw attention in our auditors’ report to the related disclosures in the financial statements of the Fund or, if such disclosures are inadequate, to modify our opinion. Our conclusions are based on the audit evidence obtained up to the date of our auditors’ report. However, future events or conditions may cause the Fund to cease to continue as a going concern.
(e) Evaluate the overall presentation, structure and content of the financial statements of the Fund, including the disclosures, and whether the financial statements represent the underlying transactions and events in a manner that achieves fair presentation.
We communicate with the Manager regarding, among other matters, the planned scope and timing of the audit and significant audit findings, including any significant deficiencies in internal control that we identify during our audit. OTHER MATTERS
This report is made solely to the unitholders of the Fund and for no other purpose. We do not assume responsibility to any other person for the content of this report.
PRICEWATERHOUSECOOPERS PLT(LLP0014401-LCA & AF 1146)Chartered Accountants
Kuala Lumpur25 April 2018HB DYNAMIC FUND (CONTINUED)
62
63
CORPORATE INFORMATION
MANAGERRHB Asset Management Sdn Bhd
PRINCIPAL AND REGISTERED OFFICELevel 8, Tower 2 & 3, RHB Centre, Jalan Tun Razak, 50400 Kuala Lumpur
BUSINESS OFFICELevel 8, Tower 2 & 3, RHB Centre, Jalan Tun Razak, 50400 Kuala Lumpur
Email address: [email protected]: 03-9205 8000Fax: 03-9205 8100Website: http://www.rhbgroup.com
BOARD OF DIRECTORSMr Patrick Chin Yoke Chung (Non-Independent Non-Executive Chairman)Encik Abdul Aziz Peru Mohamed (Senior Independent Non-Executive Director)Mr Chin Yoong Kheong (Independent Non-Executive Director)Ms Ong Yin Suen (Managing Director)Dr. Ngo Get Ping (Independent Non-Executive Director)Ms Choo Shan (Independent Non-Executive Director) (Appointed on 3 July 2017)
INVESTMENT COMMITTEE MEMBERS Mr Patrick Chin Yoke Chung (Chairman) (Re-designated on 1 November 2017)Encik Abdul Aziz Peru Mohamed (Appointed on 1 November 2017)Ms Choo Shan (Appointed on 1 November 2017)YBhg Dato’ Darawati Hussain (Appointed on 1 December 2017)YBhg Dato’ Khairussaleh Ramli (Chairman) (Resigned on 1 November 2017)Mr Ong Seng Pheow (Resigned on 1 November 2017)YBhg Datuk Haji Faisal Siraj (Resigned on 1 December 2017)
CHIEF EXECUTIVE OFFICERMs Ong Yin Suen (Appointed on 28 February 2018)Mr Ho Seng Yee (Retired on 1 January 2018)
SHARIAH ADVISORSRHB Islamic Bank Berhad
SECRETARYEncik Azman Shah Md Yaman (LS No. 0006901)
63
64
BRANCH OFFICE
Kuala Lumpur Office B-9-6, Megan Avenue 1No. 189, Jalan Tun Razak50400 Kuala LumpurTel: 03-2171 2755 Fax: 03-2770 0022
Sri Petaling Office No. 53-1 & 53-2 Jalan Radin TengahBandar Baru Sri Petaling57000 Kuala LumpurTel: 03-9054 2470 Fax: 03-9054 0934
Penang Office 64-D, Level 5, Lebuh Bishop10200 PenangTel: 04-264 5639 / 04-263 4848Fax: 04-264 5640 / 04-262 8844
Butterworth Office 2677, Jalan Chain FerryTaman Inderawasih13600 Prai, PenangTel: 04-390 0022 Fax: 04-390 0023
Ipoh Office 4th Floor, 21-25Jalan Seenivasagam, Greentown30450 Ipoh, PerakTel: 05-242 4311 Fax: 05-242 4312
Johor Bahru Office 2nd Floor, 21 & 23Jalan Molek 1/30, Taman Molek81100 Johor Bahru, JohorTel: 07-358 3587 Fax: 07-358 3581
Kuantan Office B 32-34, 2nd Floor, Lorong Tun Ismail 8Sri Dagangan II25000 Kuantan, PahangTel: 09-517 3611 Fax: 09-517 3612
Kota Bharu Office No 3953-H, 1st FloorJalan Kebun Sultan15350 Kota Bharu, KelantanTel: 09-741 8539 Fax: 09-741 8540
64
65
Kota Kinabalu Office
Melaka Office
Lot No. C-02-04, 2nd FloorBlock C, Warisan SquareJalan Tun Fuad Stephens88000 Kota Kinabalu, SabahTel: 088-528 686/692 Fax: 088-528 685
581B, Taman Melaka Raya75000 MelakaTel: 06-284 4211 Fax: 06-292 2212
Batu Pahat Office 53, 53-A and 53-B Jalan Sultanah83000 Batu Pahat, JohorTel: 07-438 0271 Fax: 07-438 0277
Miri Office Lot 1268, First FloorCentre Point Commercial CentreJalan Melayu98000 Miri, SarawakTel: 085-422 788 Fax: 085-415 243
Kuching Office Lot 172, Section 49, K.T.L.DJalan Chan Chin Ann93100 Kuching, SarawakTel: 082-245 611 Fax: 082-242 712
EXTERNAL INVESTMENT MANAGER
RHB Islamic International Asset Management Berhad
TRUSTEE CIMB Islamic Trustee Berhad
BANKER RHB Bank Berhad
AUDITORS PricewaterhouseCoopers PLT
TAX ADVISER PricewaterhouseCoopers Taxation Services Sdn Bhd
65
66
DISTRIBUTORS CIMB Bank BerhadCIMB Islamic Bank BerhadCIMB Investment Bank BerhadCUTA- Standard Financial AdviseriFast Capital Sdn BhdOCBC Al-Amin Bank Malaysia BerhadOCBC Bank Malaysia BerhadHSBC Amanah Malaysia BerhadHSBC Bank Malaysia BerhadPhillip Mutual BerhadRHB Bank BerhadRHB Islamic Bank BerhadRHB Investment Bank BerhadStandard Chartered Bank Malaysia BerhadUnited Overseas Bank Malaysia Berhad
66