Embed Size (px)
Citation preview
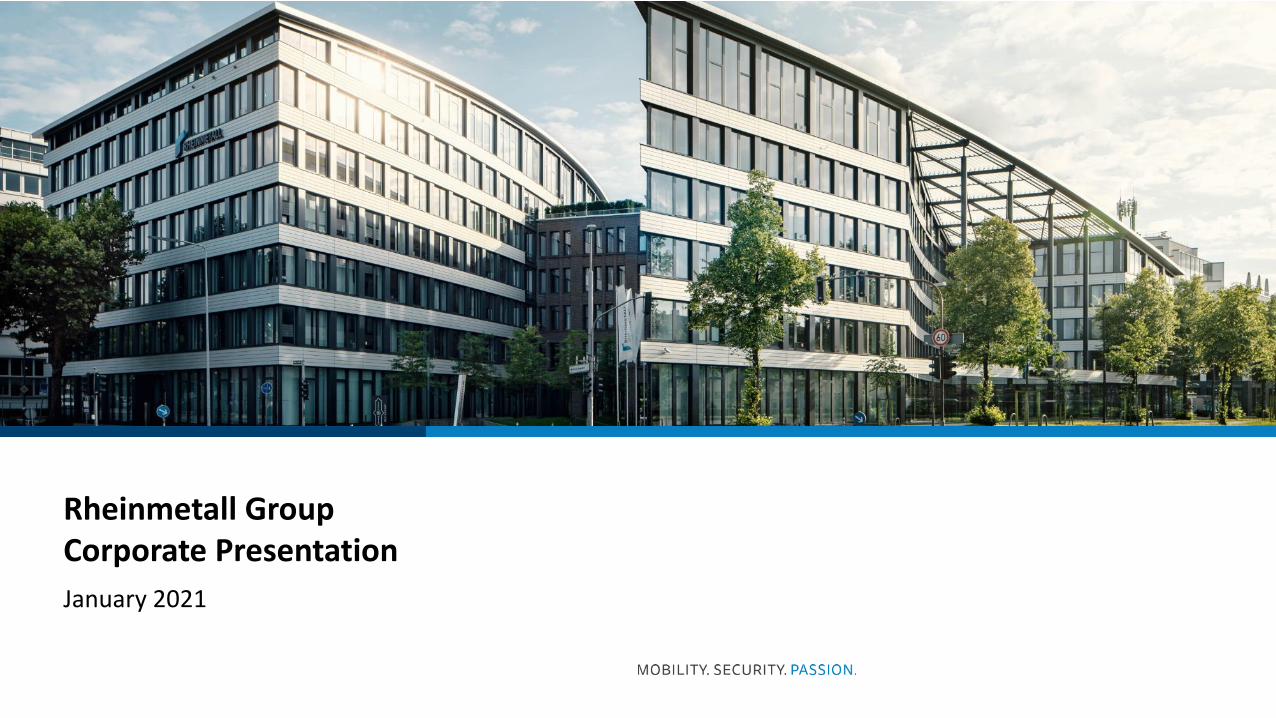
Rheinmetall GroupCorporate Presentation
January 2021

RHEINMETALL GROUPINTEGRATED TECHNOLOGY GROUP FOR SECURITY AND MOBILITY
Defence Force protection is our missionAutomotive Our heart beats for your engine
Bu
sin
ess
M
od
el
Mar
ket
dri
ver
Increasing demand for security Geostrategical powershifts Constantly changing conflict situations Rising defence/security budgets
Megatrend mobility Growing demand for clean mobility Global LV production with growth Increased regulation
Tier 1 supplier High-tech products for global markets Gaining powertrain neutrality
System house for land based operations Leading provider of innovative solutions Internationalization focused on home
markets
Rheinmetall GroupMobility and security form the DNA of the business model
Corporate Presentation January 2021 2

2019
Group performance indicator
* Short-term; **Headcount at capacities;
€3,522m€343m
€10,399m12,100
AUTOMOTIVE Our heart beats for your engine DEFENCE Force protection is our mission
SalesOper. Result
Order backlogHeadcount**
44%35%
49%
56%65%
51%
Organic growth
Leading by innovations
Targeted acquisitions
International expansion
Strategy roadmap
Op. margin9.8%
Op. margin
6.7%
RHEINMETALL GROUP
Grow sales around 8%
~8% op. margin
Targeted 2-4% Cash on sales
30-35% payout ratio
Rheinmetall GroupHighlights
3Corporate Presentation January 2021
€2,736m€184m
*€447m11,405
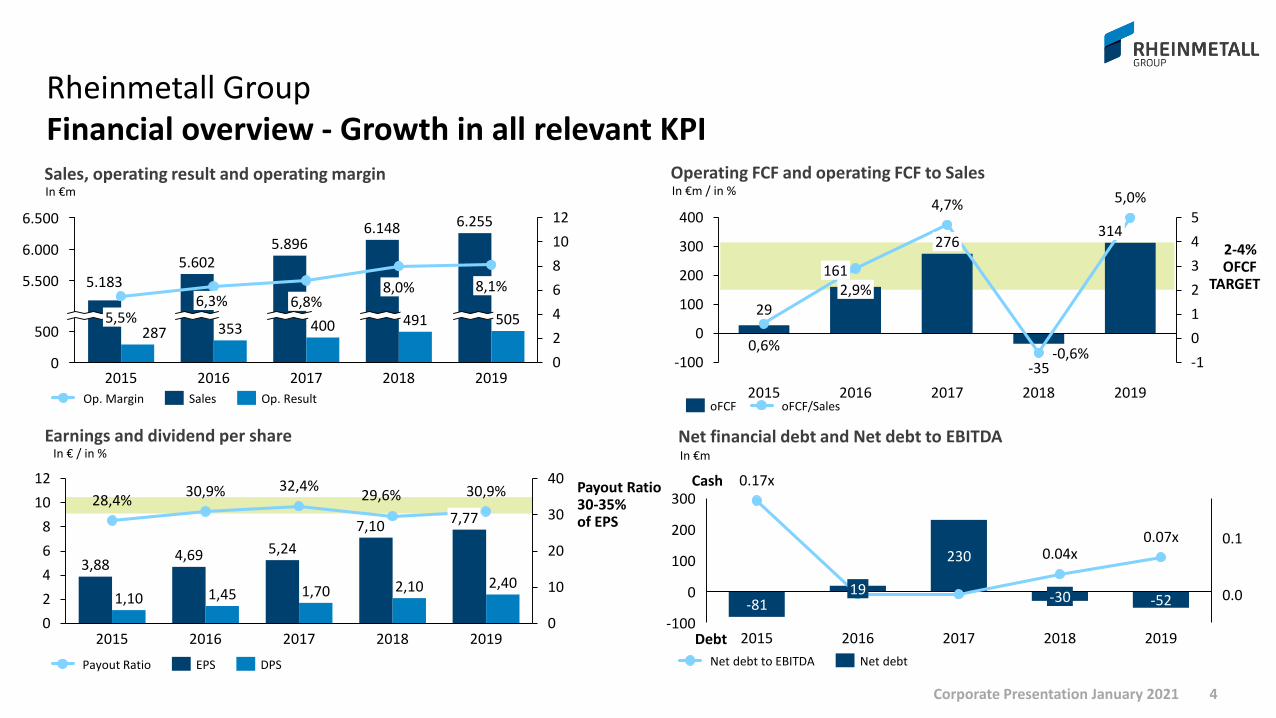
Rheinmetall GroupFinancial overview - Growth in all relevant KPI
4Corporate Presentation January 2021
2-4% OFCF
TARGET
Payout Ratio30-35% of EPS
Net financial debt and Net debt to EBITDA
Operating FCF and operating FCF to Sales
Earnings and dividend per share
Sales, operating result and operating marginIn €m In €m / in %
In €m
287 353
0
2
4
6
8
10
12
5.500
500
6.000
0
6.500
5055,5%
2015
6,3%
2016
6,8%491
8,0%
5.896
2018
8,1%
5.602
2019
400
6.148
2017
5.183
6.255
3,884,69 5,24
7,10
1,10 1,45 1,70 2,10 2,40
0
10
20
30
40
0
2
4
6
8
10
12
20172015
28,4%30,9%
2016
29,6%32,4%
2018
30,9%
2019
7,77
29
-35 -1
0
1
2
3
4
5
-100
0
100
200
300
400
2,9%
0,6%
2015 2016 2018
-0,6%
5,0%
2017
4,7%
2019
161
276314
Op. Margin Op. ResultSalesoFCF oFCF/Sales
Payout Ratio EPS DPS
In € / in %
-81
230
-52
-100
200
0 0.0
100
300
0.1
2015
19
2016 2017
-30
2018 2019
0.17x
0.04x0.07x
Cash
Debt
Net debt to EBITDA Net debt

PUMP TECHNOLOGY
AUTOMOTOVE EMISSIONSYSTEMS
MECHATRONICS
ACTUATORS
CASTINGS
BEARINGS
HARDPARTS
MECHATRONICS
HARDPARTS
AFTERMARKET
Rheinmetall AutomotiveProducts per division
5Corporate Presentation January 2021
SMALL BORE PISTONS
SOLENOID VALVES
COMMERCIAL DIESELSYSTEMS
LARGE BORE PISTONS

WEAPON AND AMMUNITION
MID & LARGE CALIBER AMMO
MID & LARGE CALIBER WEAPONS
PROTECTION SYSTEMS
ELECTRONIC SOLUTIONSINTEGRATED ELECTRONIC SYSTEMS
VEHICLE SYSTEMS
LOGISTIC VEHICLES
TACTICAL VEHICLES
- ACTIVE- PASSIVE
- SOFTKILL
Medium trackedMedium wheeled
Heavy tracked
HX-FAMILY
Rheinmetall DefenceProducts per division
6Corporate Presentation January 2021
AIR DEFENCE & RADAR SYSTEMS
TECHNICAL PUBLICATIONS

One RheinmetallRealization of growth in changing market conditions
7Corporate Presentation January 2021
Positioning as integrated technology group for Mobility and Security Realization of growth potentials in changing market environments Leveraging strengths by bundling and channeling our expertise and
competencies, e.g. different technologies Change perception and increase attractiveness as an employer
ONERHEINMETALL
One Rheinmetall Phase I
Initiatives addressing cultureand cooperation
2016-2018
One Rheinmetall Phase II
Focus on technologies
2018 ff.
One Rheinmetall Phase III
Commercialization
starting 2021
Automotive – A changing world
Corporate Presentation January 2021 8

Sales: €2.7bn
Op. result: €184m
Op. margin: 6.7%
Op. FCF: €73m
R&D: €143m
Capex: €163m
Headcount:11.405
AutomotiveLeading technology and market positions
Corporate Presentation January 2021
Key Figures 2019 Sales Total Management View
Global set upOperating result by division*
26%
64%
19%
Mechatronics
HardpartsAftermarket
Sales by division*
33%
54%
13%
Mechatronics Consolidated Sales
China JV-Sales in €bn
Sites per continent
44%
23%
16%
17%
43%
19%
16%
18%4%
Sales by region
Europe w/o
GermanyGermany
USMCA
AsiaRoW
Sales by customer
>10% Ford, VW
Other
5-10% Renault/
Nissan, GM, FCA
2-5% Daimler, DAF, Volvo, PSA, BMW, CAT/Perkins
2.7
1.1
HardpartsAftermarket
*unconsolidated
9
122712
34

AutomotiveLeading technology and market positions
Key Competitor
HardpartsMahle, Nemak, GGB, Tenneco (Federal Mogul), Dong Yang
Segment Structure
Mechatronics Pump Technology Auto. Emission Systems Commercial Diesel Systems Solenoid Valves Actuators
Hardparts Pistons Castings Bearings
Aftermarket Hardparts Mechatronics
Differentiator
Strong brand
Global footprint
Strong partnerships
(Hasco, Shriram, Riken, ZYNP)
Wide technology portfolio
Extensive product Know-How
Sales driver
Megatrend mobility
Growing demand for
clean mobility
Global LV production
with further growth
Increased regulation
MechatronicsMagna, Bosch, Denso, Valeo, Schaeffler
AftermarketTenneco (Federal Mogul), Mahle,Bosch, Valeo
Corporate Presentation January 2021 10

Automotive overviewProduct portfolio by division and engine type
11Corporate Presentation January 2021
MECHATRONICS
HARDPARTS ENGINE BLOCKS
E-Motor HOUSING
BATTERY BOXES
EGR MODULE
TURBO ACTUATOR VTG THERMO MODULE
eCC E-MOTOR COOLING
FUEL CELL CONTROL VALVE
HRB eCATHODE VALVE
HIGH-VOLTAGECOOLANT PUMP
CONTACTORSELECTRICAL OIL PUMPS
VACUUM PUMPS
MULTI PURPOSE VALVE
STRUCTURAL PARTS
ICE EV / FUEL CELL
EVAP ELEC. BYPASS VALVE
EXHAUST CONTROL VALVE GEN. 3
SC AIR SYSTEM eWastegateActuator
ELECTRICAL COOLANT PUMP
GASOLINE EGR
FUEL TANK ISOLATION VALVE
THERMAL MANAGEMENT
25% Share Carbon TT
ALU PISTONS NON-ENGINEPOLYMER BEARINGS

2019 2020 2025 2030
Fuel Cell
Electric
Plug-in hybrid
Full hybrid
Gasoline mildhybridGasoline
Diesel mildhybridDiesel
Drivers for growthRising global fleet and regulatory restrictions are supporting our growth
* IHS 07/2020 and company estimates** Rheinmetall Automotive sales FY 2019*** 95g = 4.1l Gasoline or 3.6l Diesel, 2030 estimates based on Regulation (EU) 2019/631
AP
ICE
8993
101
74%
17% 16% 9% 7%
15%10%
71%
47% 33%
18%25%
70180
80
EU5 EU6
-56%
NOxin mg/km
CO2in g/km
125
95
59
2015 2020 2030
-24%
-37%
Next regulation deadline approaching in 2020
Real driving emission(RDE) testing will create further pressure to reduce emissions by hardware installation
First city ban for diesel engines announced in Germany
7%
16%
15%
3%37%
22%
Core Diesel
Fuel independent products
Truck
Large-Bore PistonsGasoline
Others
Automotive sales distribution by engine type**
LV production forecast* [mUnits]
Further regulatory pressure***
Corporate Presentation January 2021 12
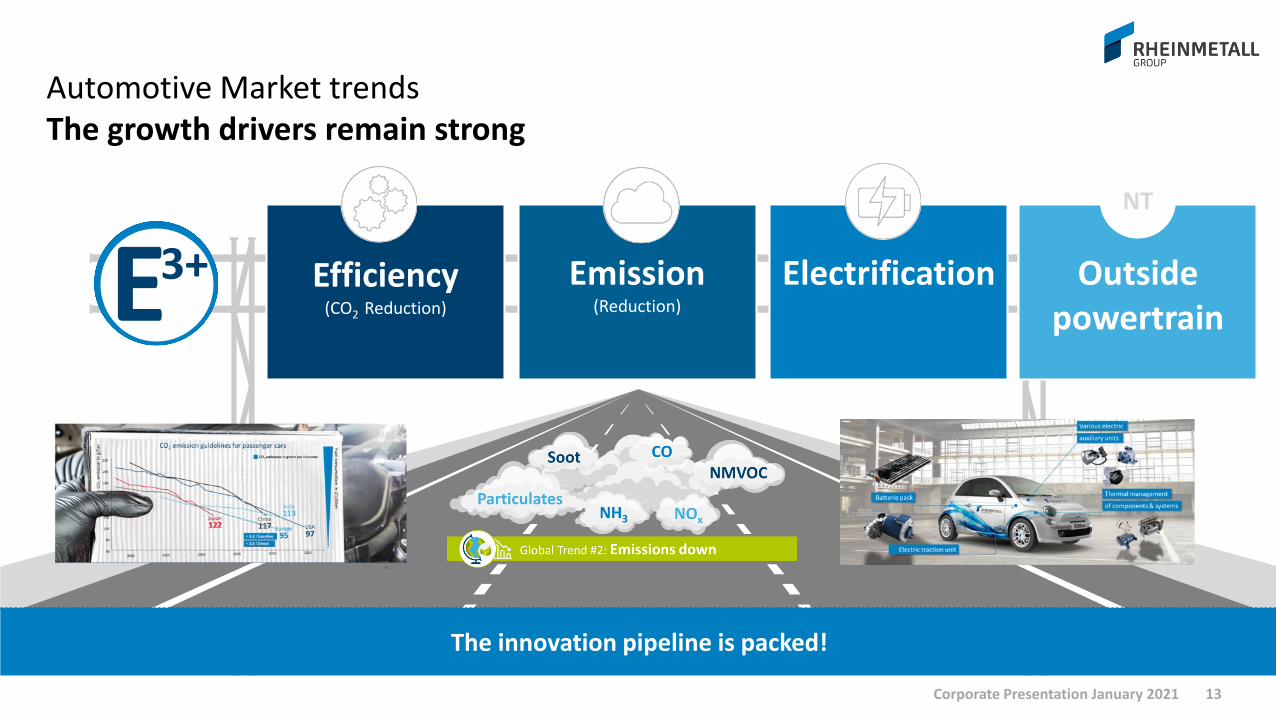
Efficiency(CO2 Reduction)
Emission(Reduction)
The innovation pipeline is packed!
3+E Electrification Outside powertrain
NT
Automotive Market trendsThe growth drivers remain strong
13Corporate Presentation January 2021
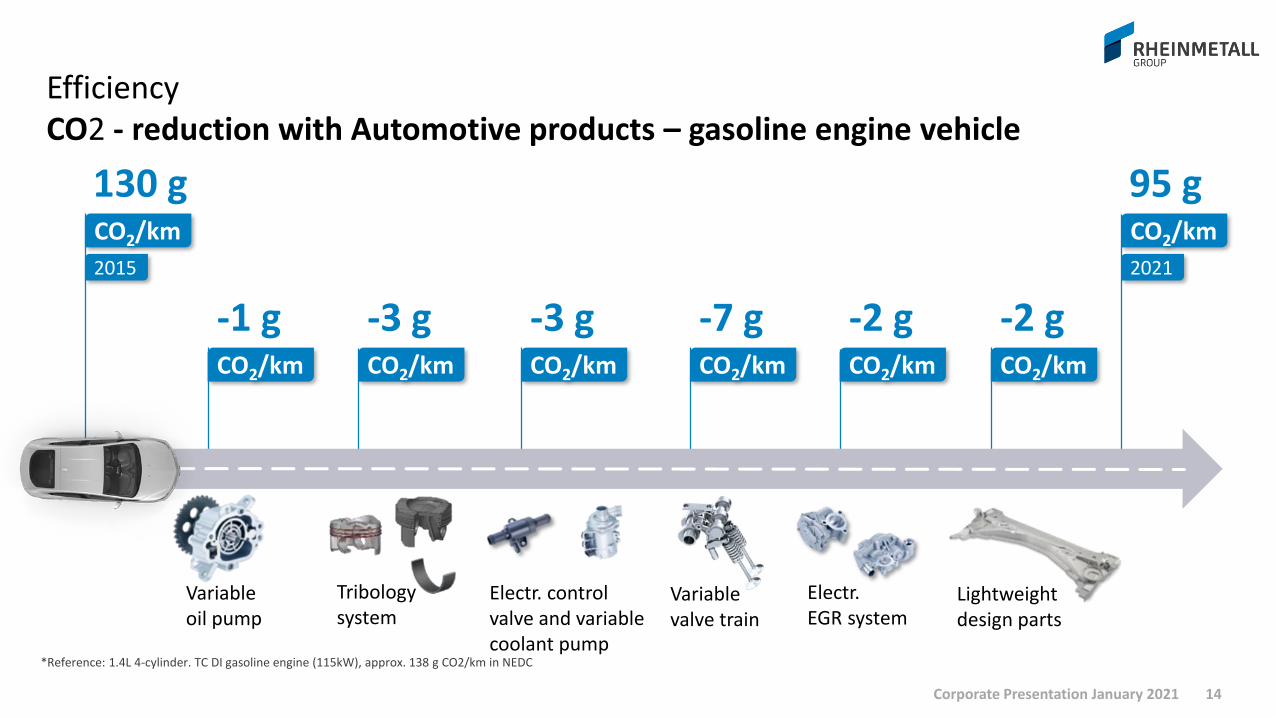
CO2/km
130 g
2015
*Reference: 1.4L 4-cylinder. TC DI gasoline engine (115kW), approx. 138 g CO2/km in NEDC
CO2/km
95 g
2021
CO2/km
-1 g
Variableoil pump
CO2/km
-3 g
Tribologysystem
CO2/km
-3 g
Electr. control valve and variable coolant pump
CO2/km
-7 g
Variablevalve train
CO2/km
-2 g
Electr.EGR system
CO2/km
-2 g
Lightweightdesign parts
EfficiencyCO2 - reduction with Automotive products – gasoline engine vehicle
14Corporate Presentation January 2021
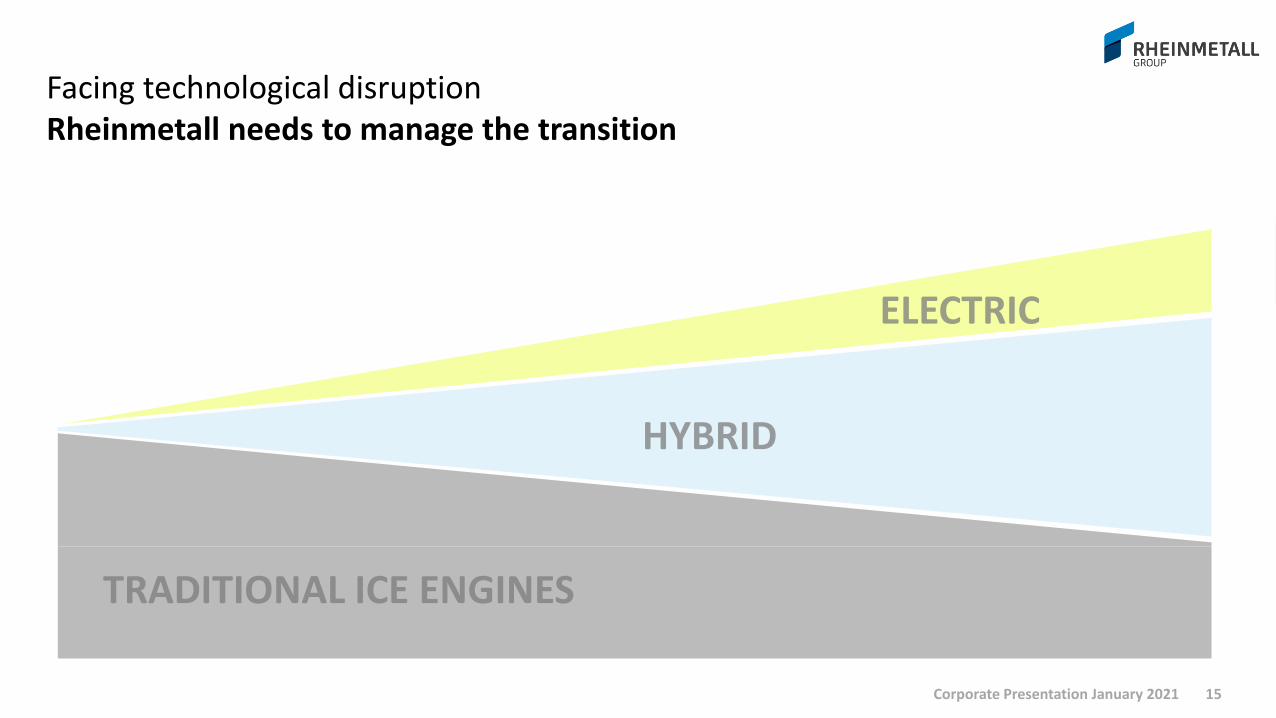
Facing technological disruptionRheinmetall needs to manage the transition
15Corporate Presentation January 2021
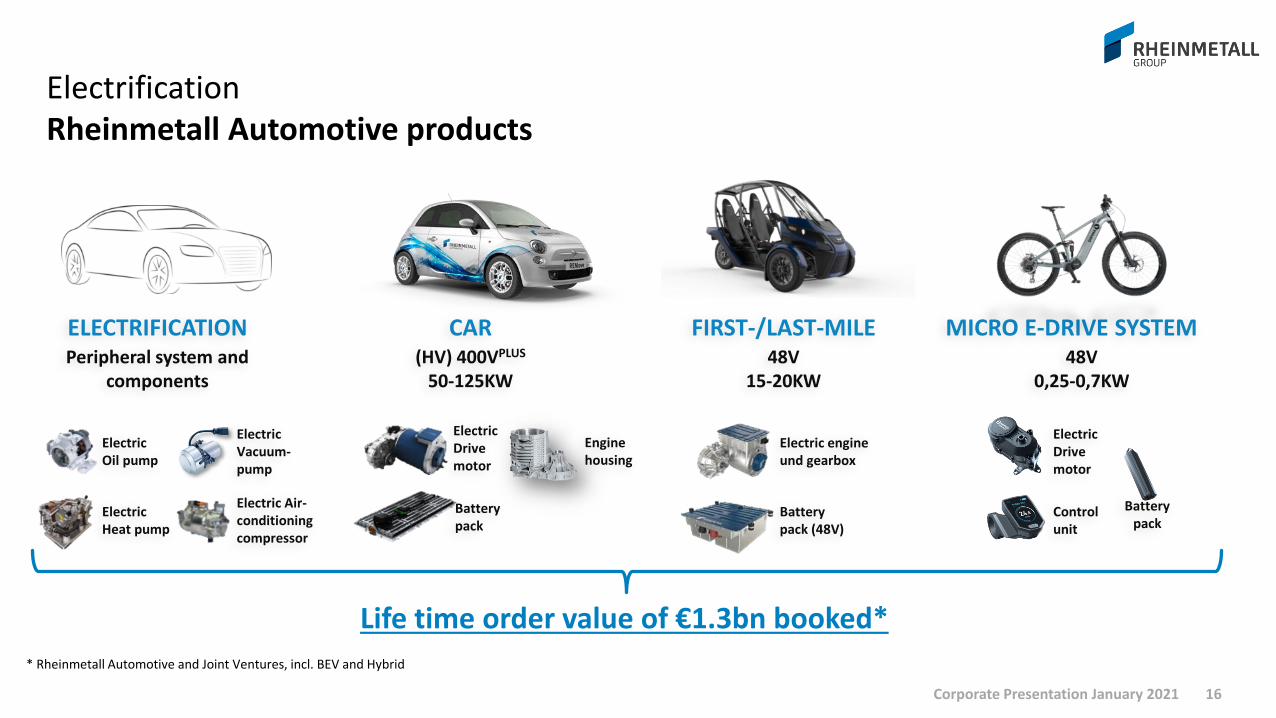
ElectrificationRheinmetall Automotive products
16Corporate Presentation January 2021
Life time order value of €1.3bn booked*
* Rheinmetall Automotive and Joint Ventures, incl. BEV and Hybrid
>50% of order intake for
new business0
1.000
2.000
3.000
4.000
201720162015 2018 2019
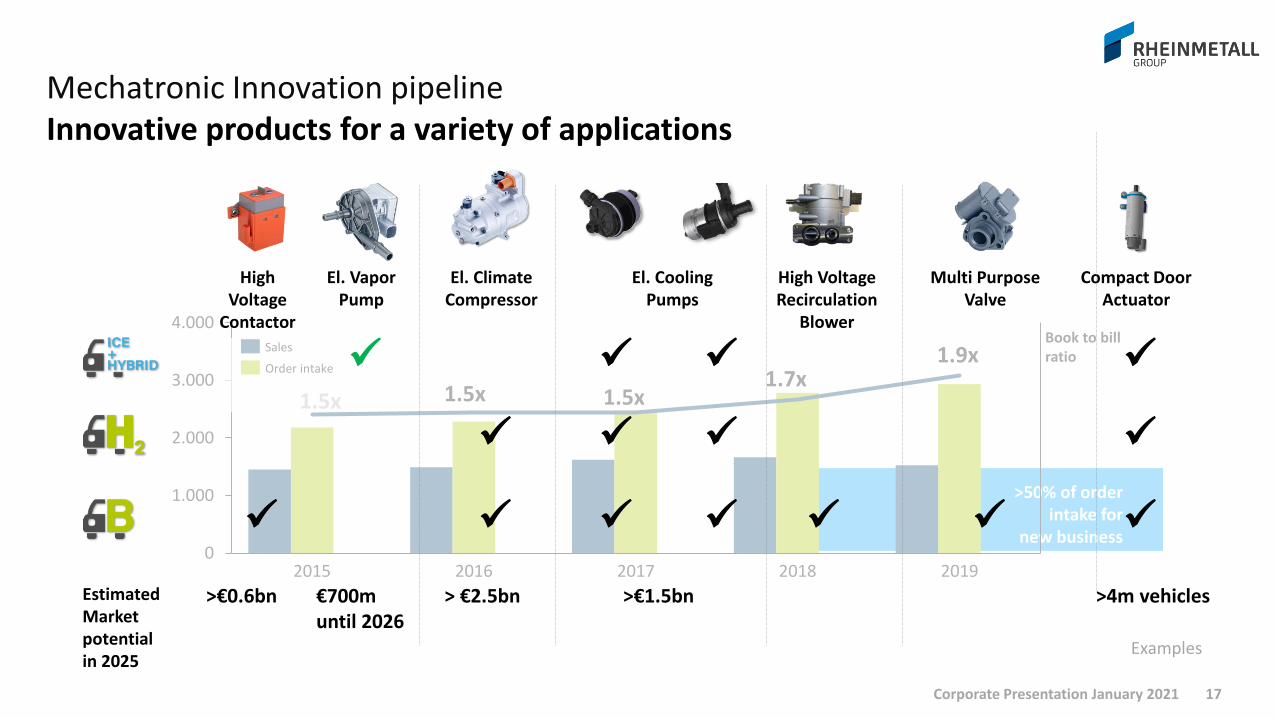
Innovative products for a variety of applications
Corporate Presentation January 2021
1.5x 1.5x1.7x
1.9x
1.5x
Book to bill ratio
Compact Door Actuator
High Voltage
Contactor
El. Vapor Pump
El. Climate Compressor
El. Cooling Pumps
High Voltage Recirculation
Blower
Multi Purpose Valve
>€0.6bn €700m until 2026
> €2.5bn >€1.5bn >4m vehiclesEstimatedMarket potentialin 2025
Examples
17
Sales
Order intake

Micro MobilityStarting with competitive product into a booming market
18Corporate Presentation January 2021
2,93,3
3,84,4
4,95,4
5,96,4
6,97,4
8,08,5
9,0
2018 2019 2020 2021 2022 2023 2024 2025 2026 2027 2028 2029 2030
Unique selling proposition
Smooth phasing of engine support Excellent freewheeling Low weight and compact build Low noise emission High thermic stability Interesting connectivity features Speedy service concept
High growth market
European market with 10% CAGR between 2018 and 2030
High market concentration with Bosch representing almost 50% of market share
E-bike market price averaged at €3.000 last 3 years
Start ofProduction
European e-Bike sales forecast [mUnits]
Development cost of € ~30m
until 2022

Trucks Bearings & continuous casting
Large bore pistons Aftermarket
DiversificationIncreasing portfolio for non-LV applications
19Corporate Presentation January 2021
E.g. ship and locomotive pistons Sanitary application Global supply of spare parts
Diverse portfolio for truck applications

Auxiliary coolant pumps
Main coolant pumps
Steel pistons
Aluminum pistons
Piston ringsCooperation withRiken
Exhaust gas flaps
HydraulicvalvesEGR reed valves
Electricalbypassvalves
High performance actuators
EGR cooler modules and mixer modules
Dual poppet valves
Coolantvalves
Pressure regulating valves
Main-bearings
Connecting rod bearings
Bearings for seat adjustments and doors
Electrical oil pumps
Permaglide bearings for truck compressors and truck hydraulics
Cylinderbore coating
Bushings for injection pumps
TrucksDiverse portfolio for truck applications
Corporate Presentation January 2021 20
351 338386
436 404
201720162015 2018 2019
CAGR +4%Salesin €m
Variable valve Control
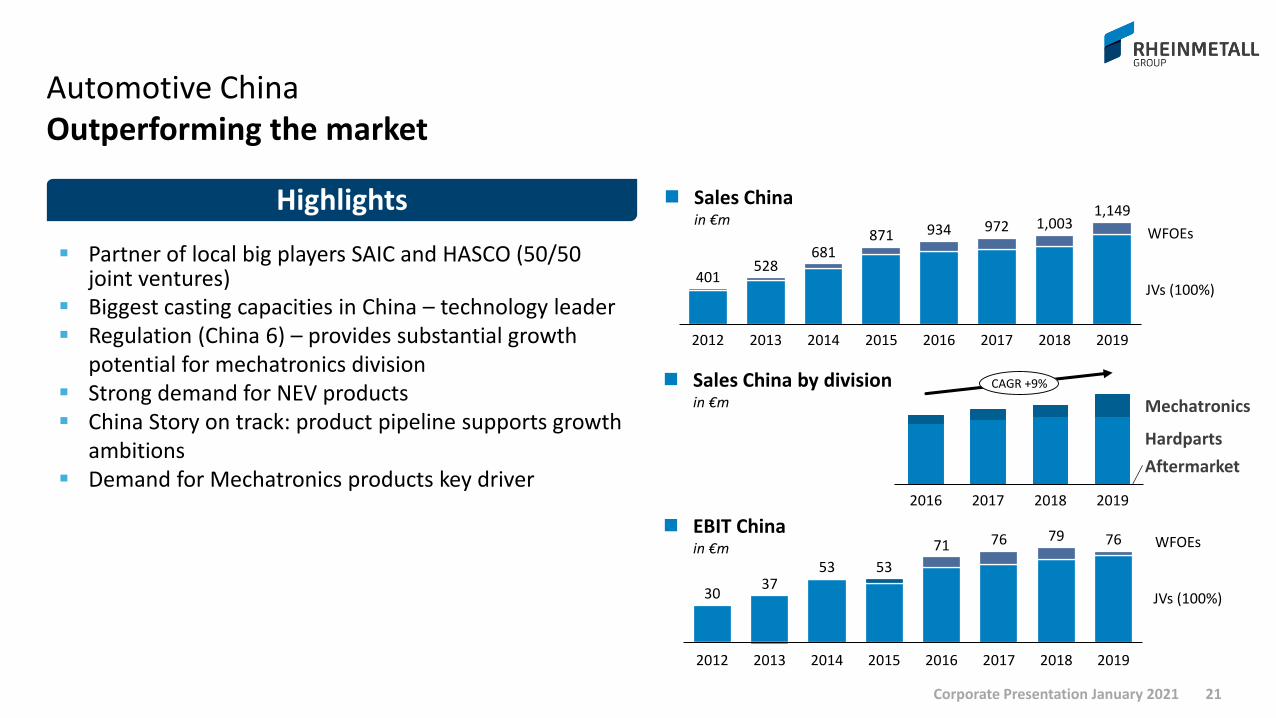
Automotive ChinaOutperforming the market
21Corporate Presentation January 2021
Partner of local big players SAIC and HASCO (50/50 joint ventures)
Biggest casting capacities in China – technology leader Regulation (China 6) – provides substantial growth
potential for mechatronics division Strong demand for NEV products China Story on track: product pipeline supports growth
ambitions Demand for Mechatronics products key driver
Highlights
20162012 2013 2014 2015 2017 20192018
401528
681871 934 972 1,003
1,149
20162013 20142012 2015 2017
79
2018 2019
30
76
3753 53
71 76 WFOEs
JVs (100%)
WFOEs
JVs (100%)
Aftermarket
201920182016 2017
Mechatronics
Hardparts
CAGR +9%
Sales China in €m
Sales China by division in €m
EBIT China in €m
Defence – Managing the “super cycle”
Corporate Presentation January 2021 22

Sales: €3.5bn
Op. result: €343m
Op. margin: 9.8%
Op. FCF: €266m
R&D: €75m
Capex: €166m
Headcount: 12,100
Key Figures 2019 Sales by region
Order backlog by division
*unconsolidated
41%
20%
23%
3%
13%1% Germany
Europe
Asia / Middle East
USMCA
RoW
21%
19%60%
Weapon andAmmunition
Electronic Solutions
Vehicle Systems
35%
22%
43%
Weapon andAmmunition
Electronic Solutions
Vehicle Systems
Other
Operating result by division* Global set up
Sites per continent
Sales by division*
Vehicle Systems
Weapon andAmmunition
Electronic Solutions
27%
25%
48%
Order backlog by region
22%
28%19%
3%
27%1%
Germany
EuropeAsia / Middle East
USMCA
RoW
Aus/NZ
Corporate Presentation January 2021 23
1809
105
5
Aus/NZ
Defence Leading supplier with an increasing international presence
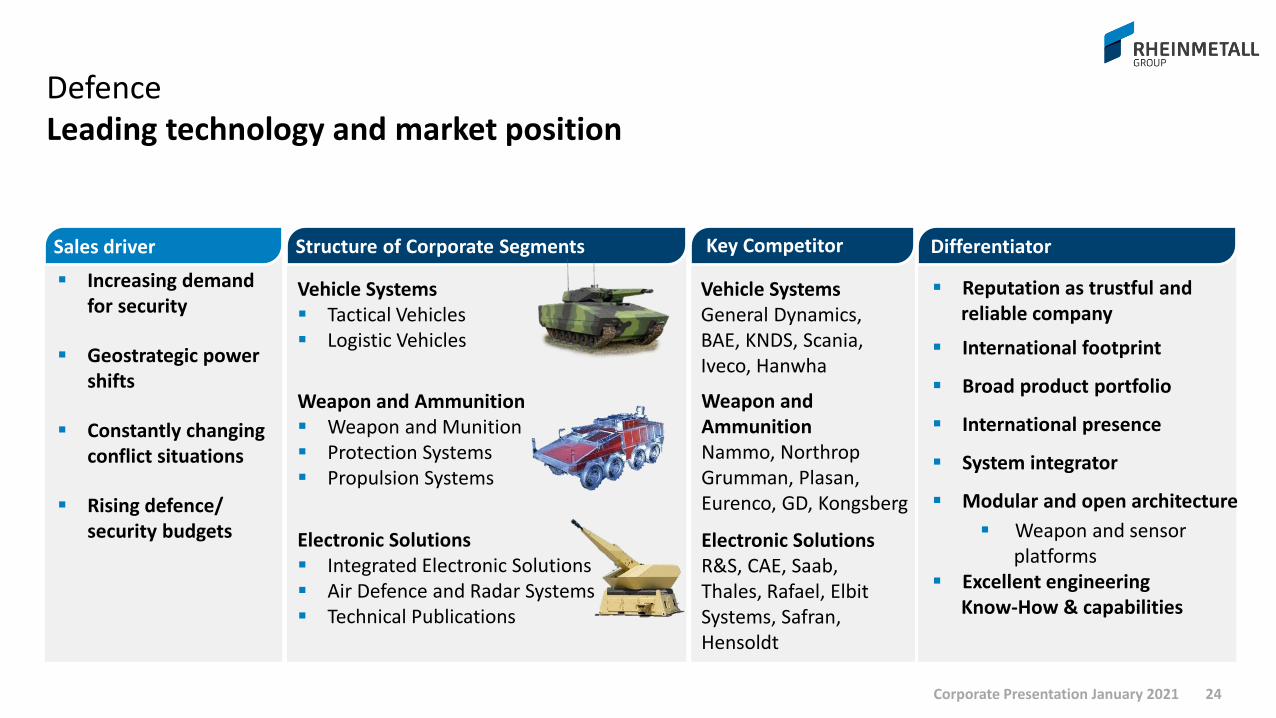
Key Competitor
Vehicle SystemsGeneral Dynamics, BAE, KNDS, Scania, Iveco, Hanwha
Structure of Corporate Segments
Weapon and Ammunition Weapon and Munition Protection Systems Propulsion Systems
Vehicle Systems Tactical Vehicles Logistic Vehicles
Electronic Solutions Integrated Electronic Solutions Air Defence and Radar Systems Technical Publications
Differentiator
Reputation as trustful and reliable company
International footprint
Broad product portfolio
International presence
System integrator
Modular and open architecture
Weapon and sensor platforms
Excellent engineering Know-How & capabilities
Weapon and AmmunitionNammo, Northrop Grumman, Plasan, Eurenco, GD, Kongsberg
Electronic SolutionsR&S, CAE, Saab, Thales, Rafael, ElbitSystems, Safran, Hensoldt
Increasing demand for security
Geostrategic power shifts
Constantly changing conflict situations
Rising defence/ security budgets
Sales driver
Corporate Presentation January 2021 24
Defence Leading technology and market position

Annexation Crimea
2014
25Corporate Presentation January 2021
1990
Inflection point
Downscaling of forces and
armamentOut of area
missions
Upscaling of forces and modernization
Return to treaty and territorial defenceNATO
2% target committment
Demand for next generation systems
Defence Managing the super cycle

Australia
Established „homemarket“
Land 400 programas demand driver
Ammunitionframeworkcontract
Defence super cycleSuccessful internationalization provides diverse sources of growth
26Corporate Presentation January 2021
Germany
Largest customer Budget increase:
Commitment to 1.5% in 2024
100% Equipment level
More personnel
United Kingdom
JV with BAE serves„home market“
MIV andChallenger LEP program
Ammunitionframeworkcontract
Eastern Europe
Modernization toNATO standards
VJTF participation IFV tender pipeline
Our home markets

Green: booked business / black: potential
Defence tender overviewHigh demand could lead to promising super cycle
27Corporate Presentation January 2021
GermanyTrucksIDZVJTF PumaLoad Handling SystemLeopardsHeavy transport helicopter2. Puma lot2. IDZ lotBoxer variantsAmmunitionFoxTEN (D-LBO)Indirect fireMGCS
USAAmmunitionFuzesOMFV
UKMIV BoxerChallenger
Eastern EuropeLithuania: BoxerPoland: Leopard IIHungary: Leopard, Howitzer,
Lynx, IFV(wheeled)
Czech Rep: IFV (tracked)Slovakia: IFVBulgaria: IFV (wheeled)Romania: IFV (wheeled)Slovenia: APC (wheeled)
AustraliaLand 17 1 C.2 AmmoLand 121 3a, 5b TrucksLand 400 II Boxer CRVLand 400 III LynxSimulation M1
International CustomersMENASouth-East AsiaAlgeria
FranceTrucksMGCS

German defenceNATO commitment key driver for German demand
28Corporate Presentation January 2021
Lead role in Very High Readiness Joint Task Force ( VJTF)
‘23 ‘27 ‘31 ’32+‘192016White paper
04/2018ConceptBundeswehr
09/2018Capabilityprofile
~30.000 vehicles
~9.000 vehicles
~2.200 vehicles
VJTF´19
Bundeswehr
VJTF´23(1 Brigade)
1x Division(3x Brigade)
3x Division(8x Brigade)
3x Division(10x Brigade)
100% equipment and digitization
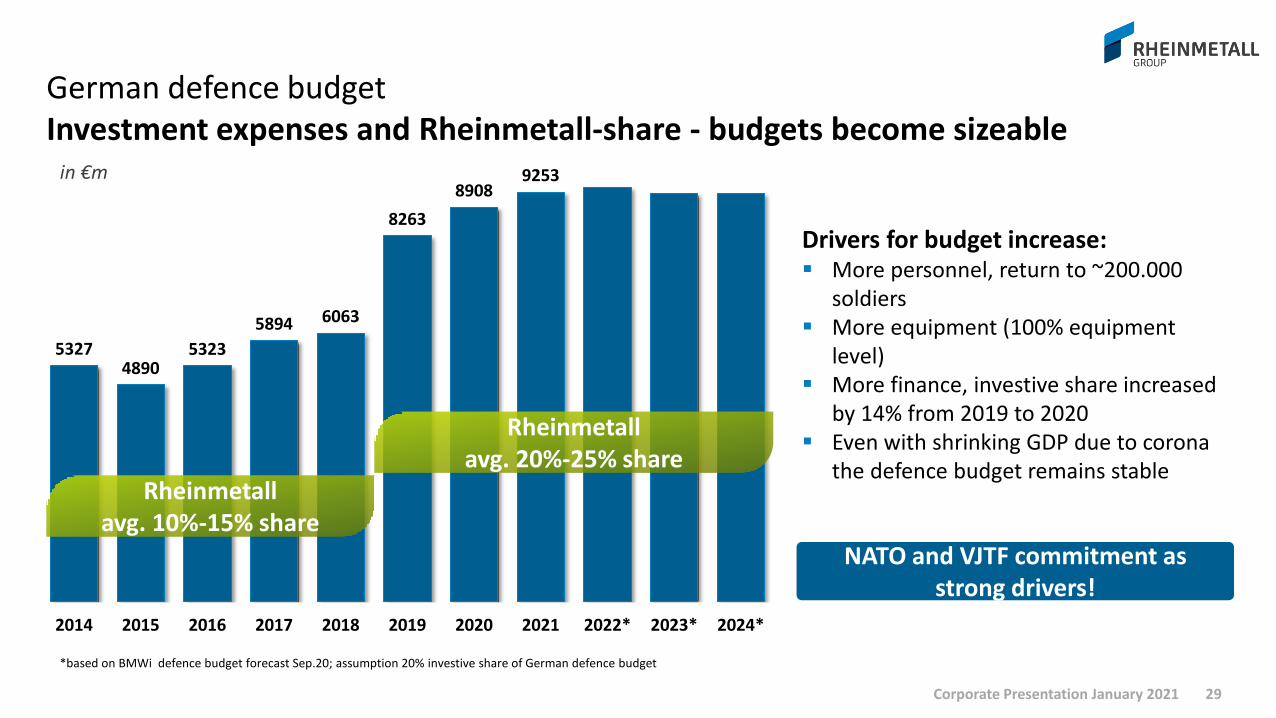
German defence budgetInvestment expenses and Rheinmetall-share - budgets become sizeable
29Corporate Presentation January 2021
53274890
5323
5894 6063
8263
89089253
2014 2015 2016 2017 2018 2019 2020 2021 2022* 2023* 2024*
in €m
Rheinmetall avg. 10%-15% share
Rheinmetall avg. 20%-25% share
Drivers for budget increase: More personnel, return to ~200.000
soldiers More equipment (100% equipment
level) More finance, investive share increased
by 14% from 2019 to 2020 Even with shrinking GDP due to corona
the defence budget remains stable
NATO and VJTF commitment as strong drivers!
*based on BMWi defence budget forecast Sep.20; assumption 20% investive share of German defence budget
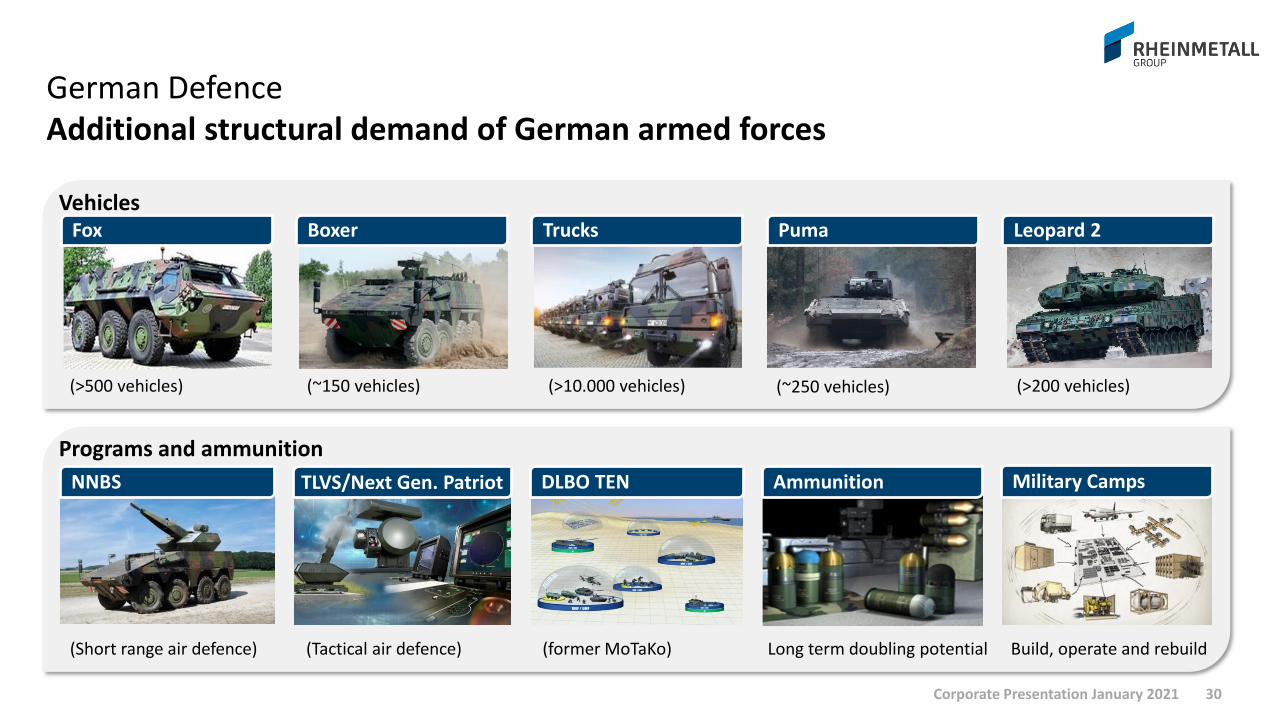
Programs and ammunition
Vehicles
(>500 vehicles) (~150 vehicles) (>10.000 vehicles) (~250 vehicles) (>200 vehicles)
Fox Boxer Puma
(Short range air defence) (Tactical air defence) (former MoTaKo) Long term doubling potential
AmmunitionNNBS DLBO TEN
Leopard 2Trucks
Build, operate and rebuild
TLVS/Next Gen. Patriot Military Camps
German DefenceAdditional structural demand of German armed forces
30Corporate Presentation January 2021
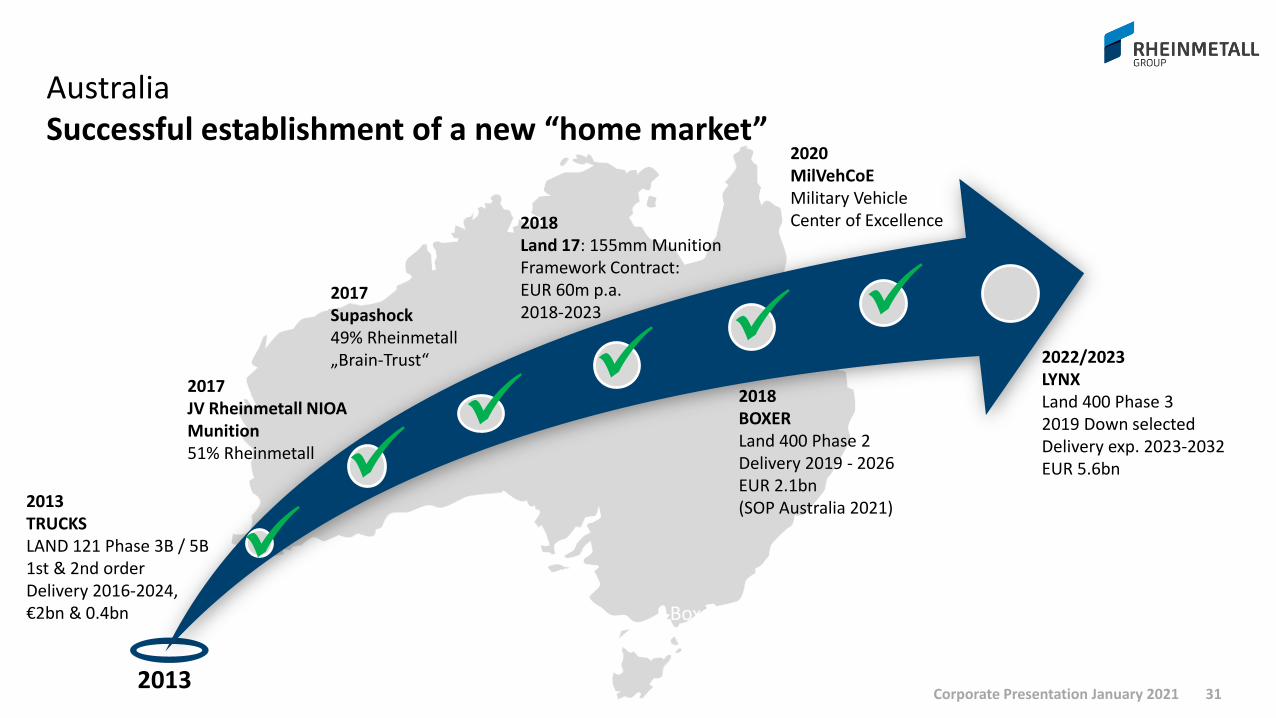
AustraliaSuccessful establishment of a new “home market”
31Corporate Presentation January 2021
T
2018Land 17: 155mm MunitionFramework Contract: EUR 60m p.a. 2018-2023
2013TRUCKS LAND 121 Phase 3B / 5B1st & 2nd orderDelivery 2016-2024, €2bn & 0.4bn
2017Supashock49% Rheinmetall „Brain-Trust“
2020MilVehCoEMilitary VehicleCenter of Excellence
2018BOXER Land 400 Phase 2Delivery 2019 - 2026EUR 2.1bn(SOP Australia 2021)
2013
2017JV Rheinmetall NIOA Munition51% Rheinmetall
2022/2023LYNXLand 400 Phase 3 2019 Down selectedDelivery exp. 2023-2032EUR 5.6bn
BoxerTrucks
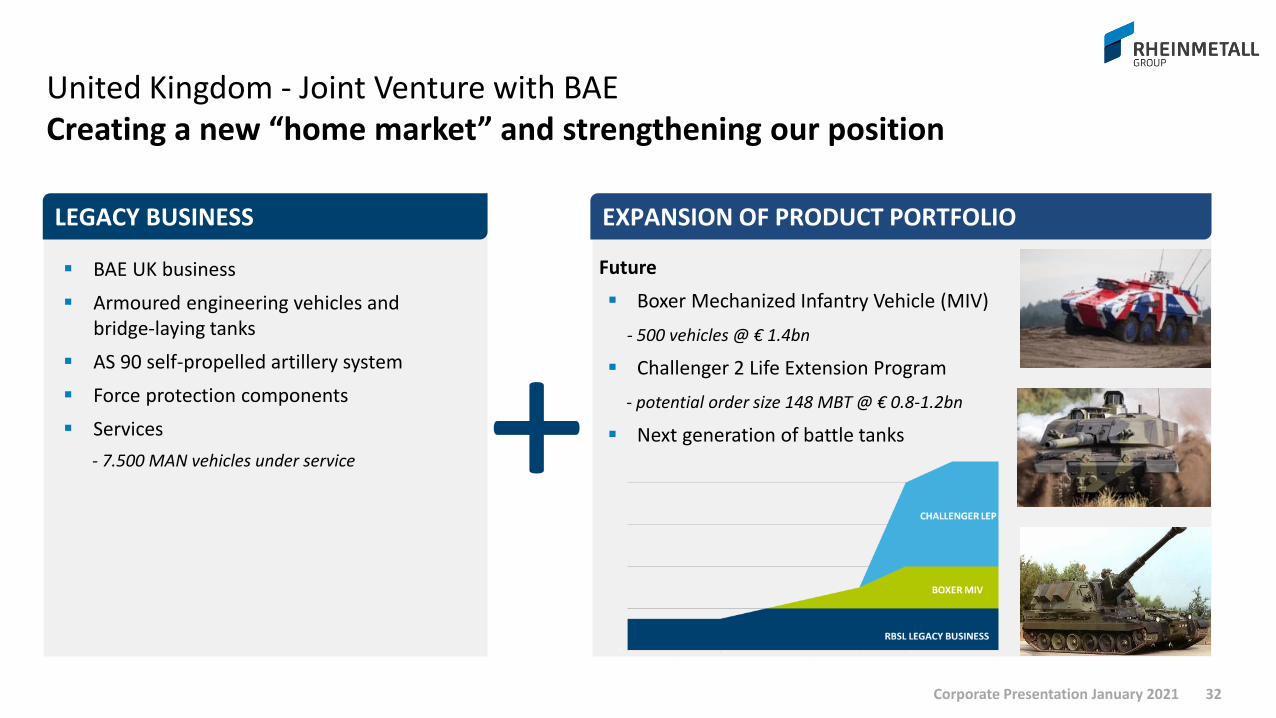
BAE UK business
Armoured engineering vehicles and bridge-laying tanks
AS 90 self-propelled artillery system
Force protection components
Services
- 7.500 MAN vehicles under service
Future
Boxer Mechanized Infantry Vehicle (MIV)
- 500 vehicles @ € 1.4bn
Challenger 2 Life Extension Program
- potential order size 148 MBT @ € 0.8-1.2bn
Next generation of battle tanks
EXPANSION OF PRODUCT PORTFOLIO
+
United Kingdom - Joint Venture with BAECreating a new “home market” and strengthening our position
32Corporate Presentation January 2021
LEGACY BUSINESS

System house for land based operations Integrating components to systems
33Corporate Presentation January 2021
AmmunitionProtection Laser opto-sensoricLance turret
GladiusPuma
System house Armored Infantryman
System-of-Systems
Systems
Platforms
Key Components
VJTF

Total life cycle potential Platform sales are just the tip of the iceberg – success creates opportunities
Rheinmetall creates additional business opportunities over the entire life cycle of 50 years
Ammunition Spare parts Service & Maintenance Training & Simulation Technical Documentation Upgrades (Life time extension)
1X SALES OF PLATFORM
2X LIFECYCLE SPENDINGS
Corporate Presentation January 2021 34

FINANCIALS
Corporate Presentation January 2021 35
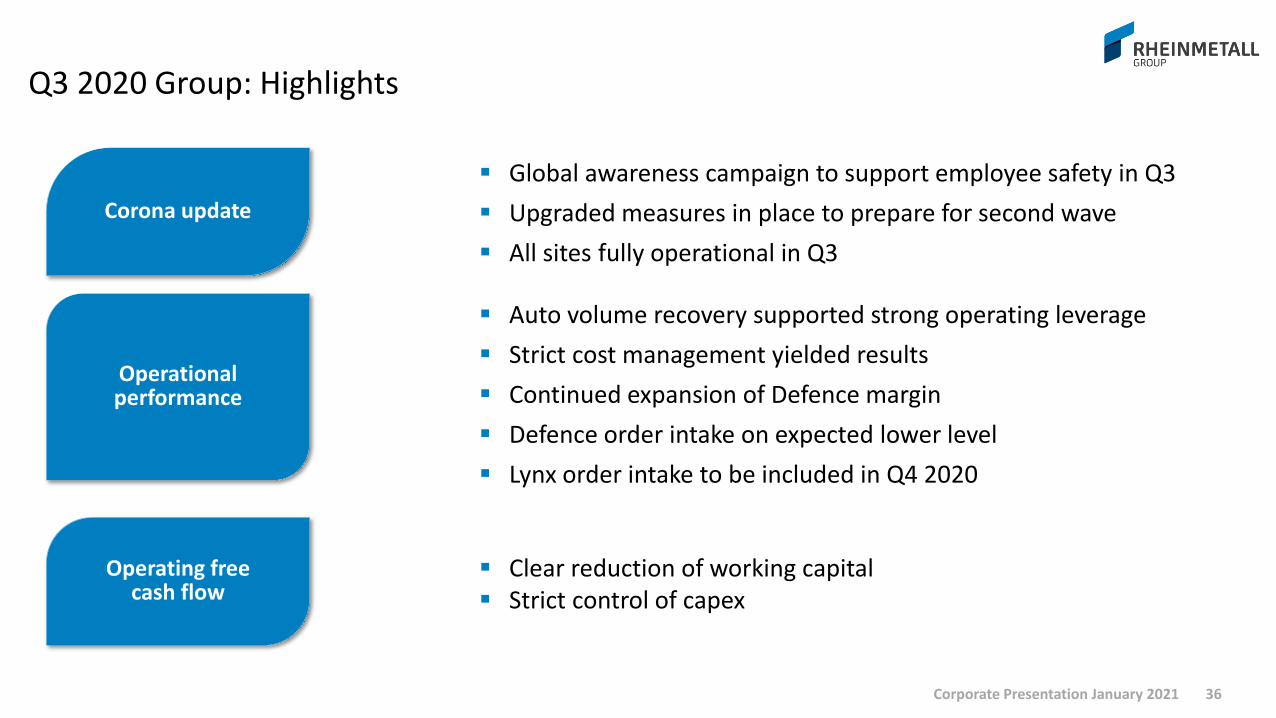
Q3 2020 Group: Highlights
Corona update
Operational performance
Operating freecash flow
36Corporate Presentation January 2021
Global awareness campaign to support employee safety in Q3
Upgraded measures in place to prepare for second wave
All sites fully operational in Q3
Auto volume recovery supported strong operating leverage
Strict cost management yielded results
Continued expansion of Defence margin
Defence order intake on expected lower level
Lynx order intake to be included in Q4 2020
Clear reduction of working capital Strict control of capex

99 101
66
-3 4
-35
+1.4%
Q3 2020 Group: Key financial dataStrong profitability in a recovering market and effective cost management
37
Salesin €m
Earnings per sharein €
1.481-72 -27
1,382
-6.6%
-4.8% -1.8%
-2.6%
Operating result and EBIT in €m
Operating margin in %
6.7%
7.3%
+3.9%
Oper-ational
Special items
Q32020
Oper-ational
FX Q32020
Q32019
FXQ32019
Q32019
EBITQ3
2020
Operatingresult
Q3 ’20
1,33
1,03
1,33-23%
reported EPS
adjusted EPS
Corporate Presentation January 2021
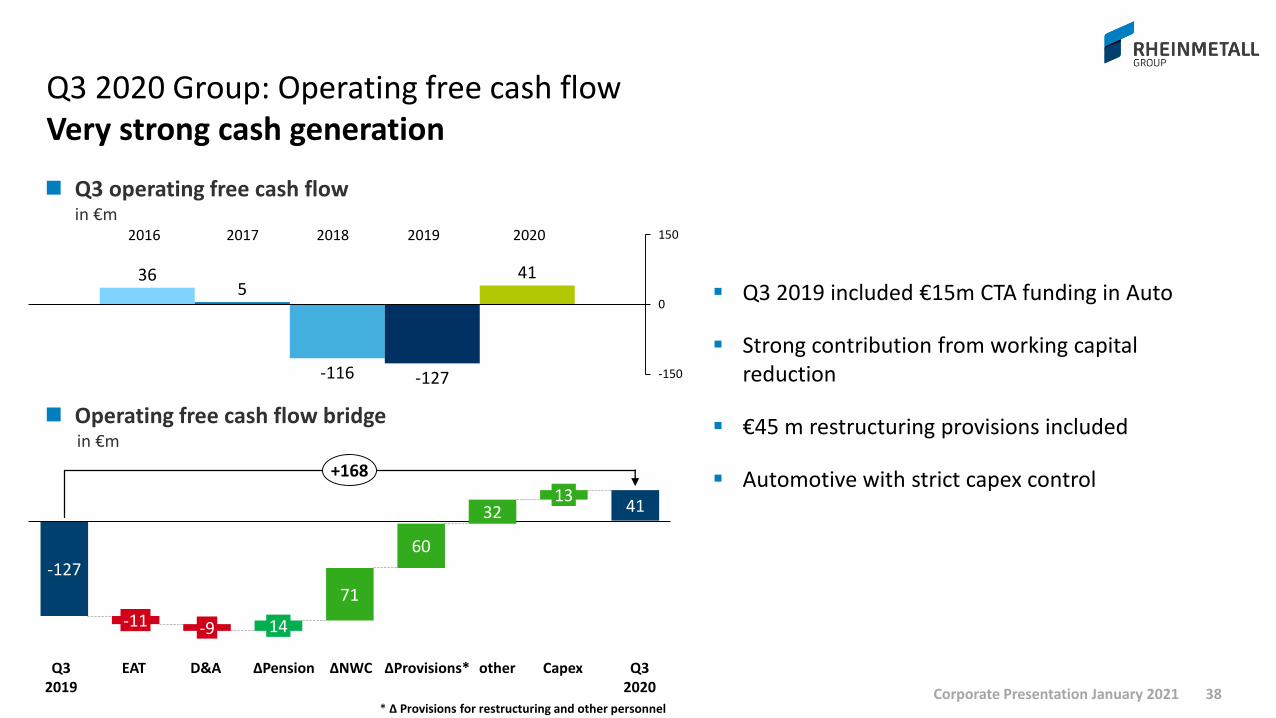
Q3 2020 Group: Operating free cash flowVery strong cash generation
38
Q3 2019 included €15m CTA funding in Auto
Strong contribution from working capital reduction
€45 m restructuring provisions included
Automotive with strict capex control
Q3 operating free cash flowin €m
365
-116 -127
41
-150
0
1502017 2018 2019 20202016
Operating free cash flow bridgein €m
-127
41
-11 -9
13
71
14
32
60
+168
EAT D&A Capex Q32020
Q32019
ΔProvisions*ΔNWCΔPension other
* Δ Provisions for restructuring and other personnelCorporate Presentation January 2021
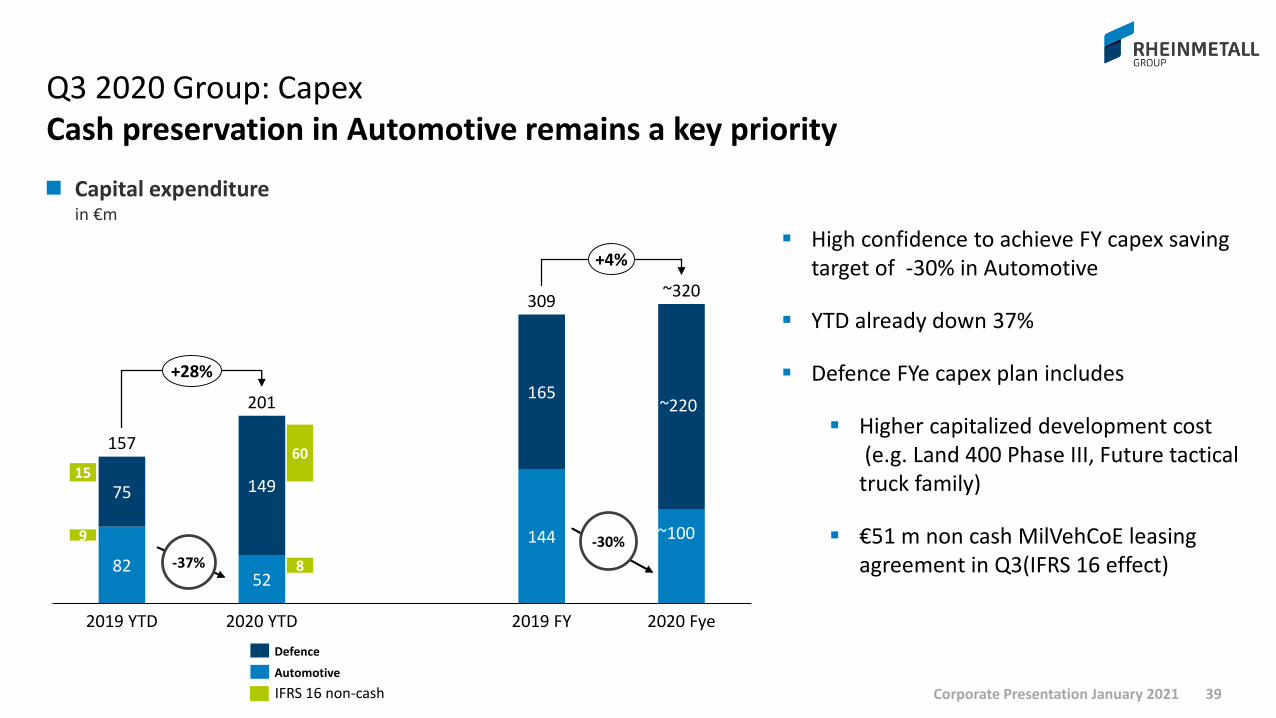
Q3 2020 Group: CapexCash preservation in Automotive remains a key priority
39
8252
144
75 149
165
157
2019 YTD 2020 Fye2020 YTD 2019 FY
~320
201
309
+28%
+4%
Capital expenditurein €m
-30%
-37%
High confidence to achieve FY capex saving target of -30% in Automotive
YTD already down 37%
Defence FYe capex plan includes
Higher capitalized development cost(e.g. Land 400 Phase III, Future tactical
truck family)
€51 m non cash MilVehCoE leasing agreement in Q3(IFRS 16 effect)
Defence
Automotive
15
9
8
60
IFRS 16 non-cash
~220
~100
Corporate Presentation January 2021
40
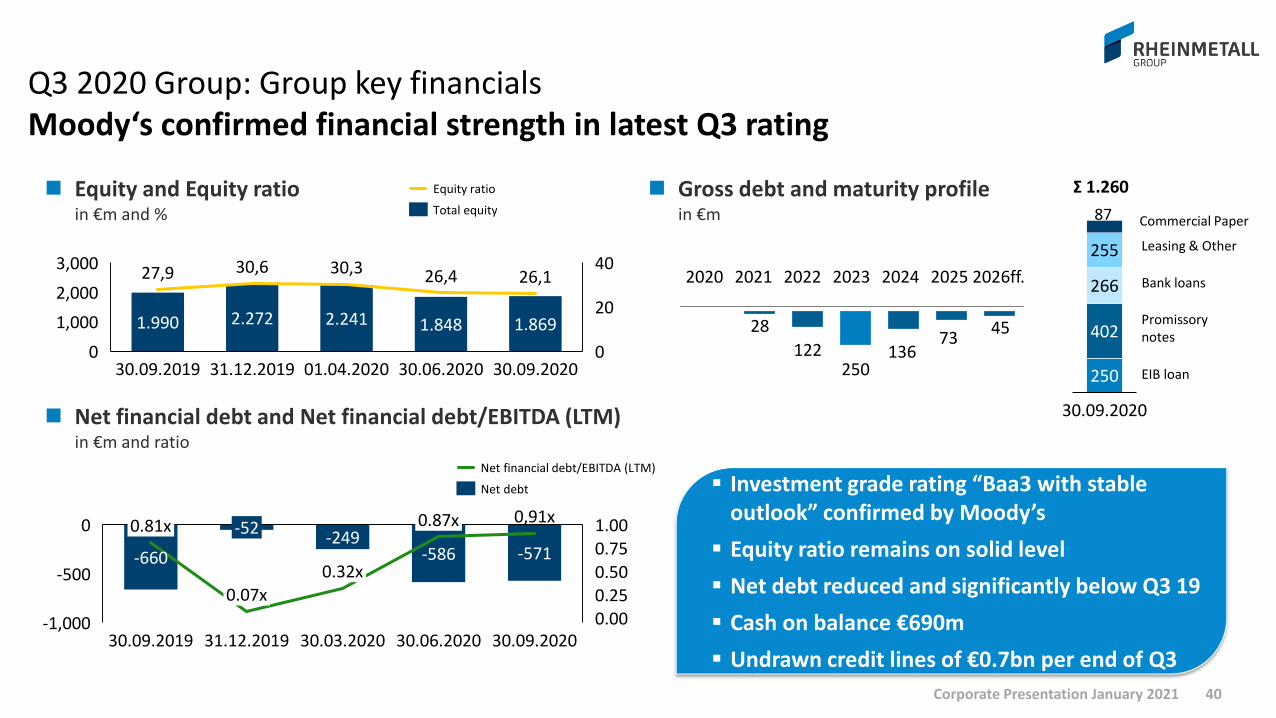
Equity and Equity ratioin €m and %
Q3 2020 Group: Group key financialsMoody‘s confirmed financial strength in latest Q3 rating
Net financial debt and Net financial debt/EBITDA (LTM)in €m and ratio
1.990 2.272 2.241 1.848 1.869
27,9 30,6 30,3 26,4 26,1
0
201,000
0
40
2,000
3,000
01.04.202030.09.2019 31.12.2019 30.06.2020 30.09.2020
-660-249
-586 -571
0,91x
0.75
0.500.250.00
0
-1,000
-500
1.000.87x-520.81x
30.09.2019
0.07x
31.12.2019 30.06.2020
0.32x
30.03.2020 30.09.2020
Net financial debt/EBITDA (LTM)
Net debt
Equity ratio
Total equity
Investment grade rating “Baa3 with stable outlook” confirmed by Moody’s
Equity ratio remains on solid level
Net debt reduced and significantly below Q3 19
Cash on balance €690m
Undrawn credit lines of €0.7bn per end of Q3
Gross debt and maturity profilein €m
2020 20222021 2023 2024 2025
28
122250
13673
45
2026ff.
Commercial Paper
250402
266
255
250
30.09.2020
Ʃ 1.260
Promissory notes
EIB loan
Leasing & Other
Bank loans
87
Corporate Presentation January 2021
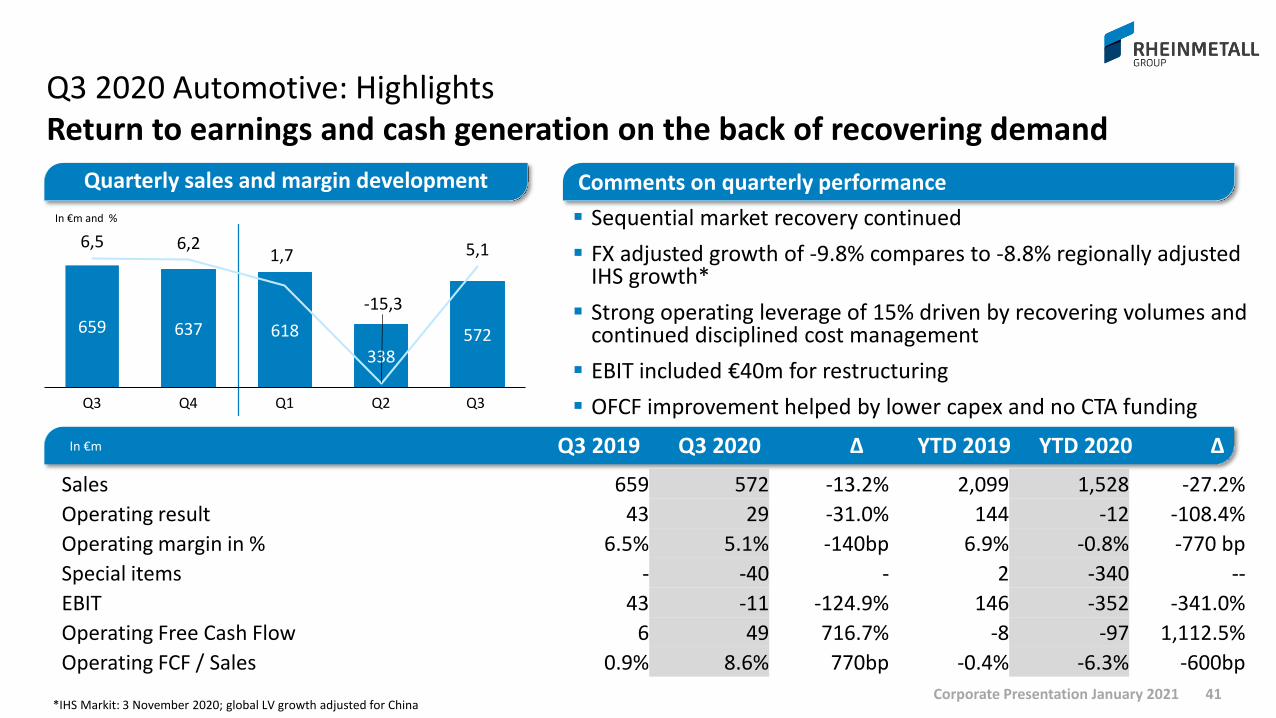
Q3 2020 Automotive: HighlightsReturn to earnings and cash generation on the back of recovering demand
41
Sequential market recovery continued
FX adjusted growth of -9.8% compares to -8.8% regionally adjusted IHS growth*
Strong operating leverage of 15% driven by recovering volumes and continued disciplined cost management
EBIT included €40m for restructuring
OFCF improvement helped by lower capex and no CTA funding
Quarterly sales and margin development Comments on quarterly performance
In €m
In €m and %
*IHS Markit: 3 November 2020; global LV growth adjusted for China
659 637 618
338572
6,5 6,21,7
-15,3
5,1
Q4Q3 Q1 Q2 Q3
∆YTD 2019 YTD 2020∆Q3 2019 Q3 2020
Sales 659 572 -13.2% 2,099 1,528 -27.2%
Operating result 43 29 -31.0% 144 -12 -108.4%
Operating margin in % 6.5% 5.1% -140bp 6.9% -0.8% -770 bp
Special items - -40 - 2 -340 --
EBIT 43 -11 -124.9% 146 -352 -341.0%
Operating Free Cash Flow 6 49 716.7% -8 -97 1,112.5%
Operating FCF / Sales 0.9% 8.6% 770bp -0.4% -6.3% -600bp
Corporate Presentation January 2021
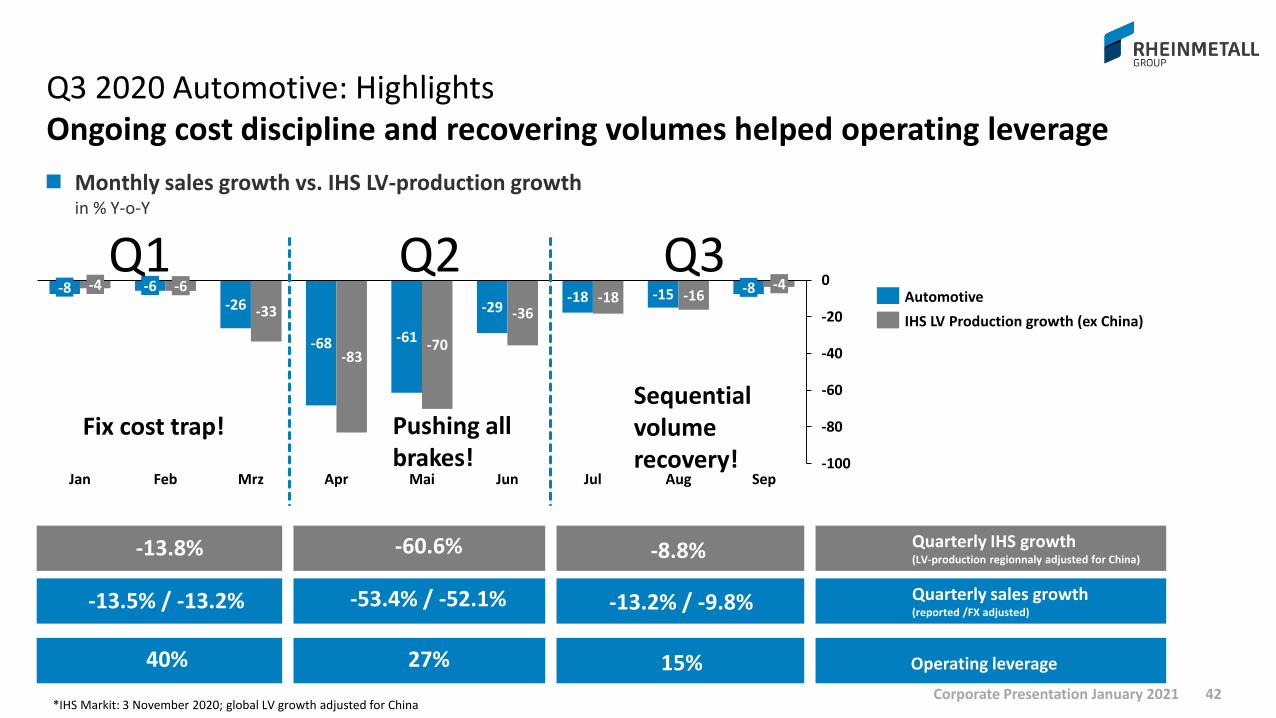
Q3 2020 Automotive: HighlightsOngoing cost discipline and recovering volumes helped operating leverage
42
-26
-68 -61
-29-18 -15
-33
-83-70
-36-18 -16
-100
-80
-60
-40
-20
0-6
MaiJan Sep
-8 -4 -4
Mrz
-6
Feb Apr Jun Jul Aug
-8
Monthly sales growth vs. IHS LV-production growthin % Y-o-Y
-60.6% -8.8%-13.8%
Q2Q1
Pushing all brakes!
Operating leverage
Q3
Sequentialvolumerecovery!
Fix cost trap!
Quarterly IHS growth(LV-production regionnaly adjusted for China)
27% 15% 40%
IHS LV Production growth (ex China)
Automotive
-53.4% / -52.1% -13.2% / -9.8% -13.5% / -13.2% Quarterly sales growth(reported /FX adjusted)
*IHS Markit: 3 November 2020; global LV growth adjusted for ChinaCorporate Presentation January 2021

2
29
6
27
1
21
9
-3
9
43
-31%
358
-20
92
175228
318
98
-19
659
572
-13%
Q3 2020 Automotive: Divisional highlightsDivisional business environment on different recovery levels
43
Sales Automotivein €m
Operating result Automotive in €m
-11%
-23%
6%
-20%
-146%
6%
2.8%
9.2%
6.5%
7.4%
MarginQ3 2019
6.7%
9.1%
5.1%
-1.7%
MarginQ3 2020
Mechatronics• Market in recovery mode, but
strain from FX-effects• Strict cost management
Hardparts• Very weak pistons business
• Result gained on strict cost cutting
• At equity almost back to PY level
Aftermarket• Strong sales recovery in Europe• Favorable customer mix and cost
cutting held back by expenses for micro mobility
Q32020
Q32019
Q32020
Q32019
Corporate Presentation January 2021

LV Business -52 -12.3%
237 202
239208
154
127
659
2934
572
-13%
Deltaabsolute in %
Diesel
Gasoline
other LV
-35 -14.7%92 98
28 2121
9672
202
12
237-15%
Truck
other
Large Bore
Aftermarket
Non-LV Business
LV: 65%
LV: 64%
Sales split LV/ Non-LV in €m / in %
Q3 2020 Automotive: HighlightsNon-LV still a drag, but trucks with sequential improvement
44
-25 -25.7%
-10 -45.5%
-7 -25.0%
+6 +6.3%
-27 -17.2%
-31 -12.9%
+6 +19.3%
Sales split Non-LV in €m / in %
Q32020
Q32019
Q32020
Q32019
Corporate Presentation January 2021

Q3 2020 Automotive: China performanceStrong results, but sales burdened by adverse FX effects
45*Including 100% figures of 50/50 JV, consolidated at equity
Sales*in €m
EBIT* in €m
Operational sales increase of +2.4% compares to very strong PY Q3 (first ramp-up quarter of electric vapor and vacuum pumps), but held back by adverse FX effects
Chinese market recovery of 10.3% (IHS Markit 3rd Nov 2020)
benefitted from low base effect (Q3 19 -7.1%)
All plants operational, business activity approaching 100% pre corona level
34
262
33
265-117
298 295
-1%
20 23
0
5
1
-12024
+20%
Comments on the quarter
Joint Venture
Wholly owned foreign enterprise
Oper-ational
FX Q32020
Q32019
Q32019
EBIT improved by 20% to €24m
JV EBIT margin increased from 7.5% to 8.7%
Oper-ational
FX Q32020
Corporate Presentation January 2021
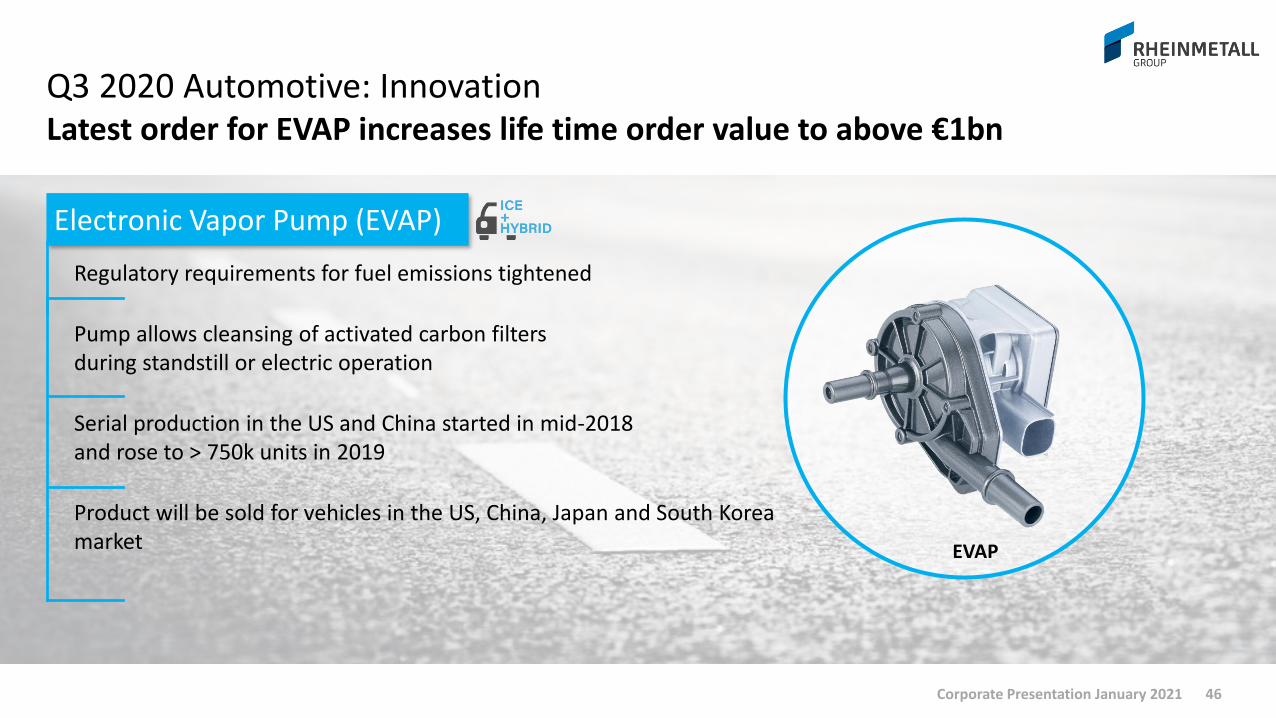
Q3 2020 Automotive: InnovationLatest order for EVAP increases life time order value to above €1bn
46Corporate Presentation January 2021
Electronic Vapor Pump (EVAP)
Regulatory requirements for fuel emissions tightened
Pump allows cleansing of activated carbon filters during standstill or electric operation
Serial production in the US and China started in mid-2018 and rose to > 750k units in 2019
Product will be sold for vehicles in the US, China, Japan and South Korea market EVAP

Q3 2020 Defence: HighlightsFurther improvement of operating margin and cash generation
47
Sales better than expected including slightly negative FX effect
Good execution supported margin development
EBIT included site closure cost and positive one-off income
OFCF was largely driven by higher earnings and improved working capital
Quarterly sales and margin development Comments on quarterly performance
∆YTD 2019 YTD 2020In €m
In €m and %
823 740901 809
7,8
15,8
3,9 10,3 9,4
Q4Q3 Q1 Q2 Q3
1,324
*Order intake is reported on the basis of booked business
∆Q3 2019 Q3 2020
Order intake* 1.136 477 -58.0% 2.201 1.960 -11.0%Sales 823 809 -1.7% 2.198 2.450 11.5%Operating result 64 76 17.7% 134 197 47.6%Operating margin in % 7.8% 9.4% 160bp 6.1% 8.1% 200bpSpecial item - 5 - -2 3 -258.8%EBIT 64 81 25.5% 132 200 52.2%Operating Free Cash Flow -104 -7 93.3% -328 -300 8.5%Operating FCF / Sales -12.7% -0.8% 1.190bp -14.9% -12.2% 270bp
Corporate Presentation January 2021

Q3 2020 Defence: Divisional highlightsAll divisions were able to expand margins and absolute results
48
421
196
206216
-50
461
224
-42
823 809
-2%
14%
-4%
-9%
0
24
10
35
20
-1
37
1564
76
+18%
9.3%
Margin Q3 2020
7.6%
5.3%
9.4%
Sales Defencein €m
Operating result Defencein €m
42%
18%
6%
6.6%
11.5%
8.8%
Margin Q3 2019
7.8%
Weapon & Ammunition• Stronger ammunition sales• Additional personnel protective
equipment sales
Electronic Systems• Favorable product mix and good
execution
Vehicle Systems• Expiring Puma sales partially
compensated by better margin programmes
Q32020
Q32019
Q32020
Q32019
Corporate Presentation January 2021

„Shadow backlog“ from truckframework agreements
€3.1bn (2021-26)
Q3 2020 Defence: Order overviewOrder intake on expected level
49
Order intake by division in €m
Order backlog profilein €bn
€1,134m
€2,3bn
€6,3bn
Q32020
Q32019
774
180
345
142
252
242
-235
477
-87
1,136
-58%
2020e 2021e 2022e ff.30.09.2020
30.09.2019
Weapon and Ammunition
Electronic Solutions
Vehicle Systems
Consolidation
Key orders:-VJTF ~€197m-Hungary~€286m
-Leo-PzH 2000
8,79,8
+12%
Corporate Presentation January 2021

Q3 2020 Defence: Launch of new IFV platformHungary is the first NATO member to select the Lynx
50
Details
Establishment of JV with the Hungarian MOD with a 51% Rheinmetall share
Order Size Quantity: 218 Lynx and 9 armored recovery vehicles “Büffel”
Order volume: clearly above €2bn
2 phase delivery model:
Phase 1 (22-23): Delivery of 46 Lynx produced in Germany
Phase 2 (24-29): Delivery of the remaining vehicles from Hungarian JV
Order intake expected in Q4 2020
Additional aftermarket potential for maintenance, spare parts, ammunition and future upgrades
The IFV is more than just a new, highly advanced vehicle: it is a future-proof platform, blending protection with firepower and mobility in a uniquely modular concept.Deal enables the Hungarian Army to meet its NATO commitments through continued modernization
Corporate Presentation January 2021

2020OUTLOOK
Corporate Presentation January 2021 51
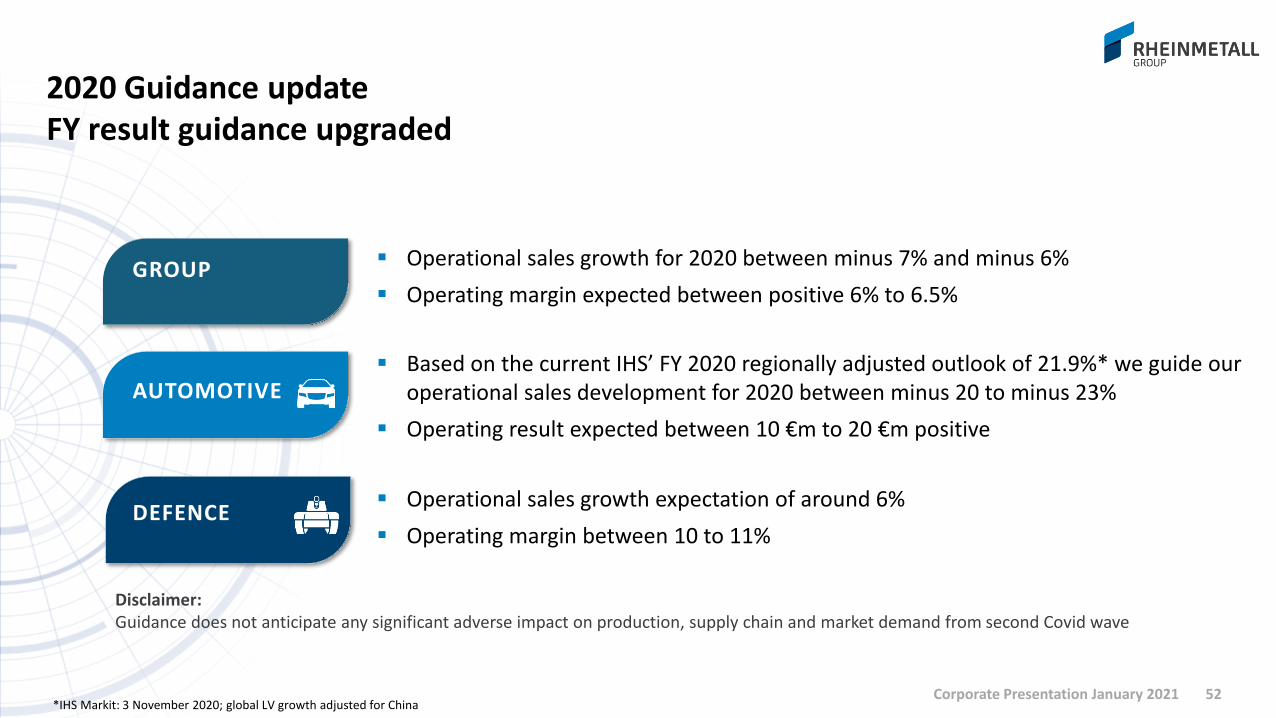
2020 Guidance updateFY result guidance upgraded
52
AUTOMOTIVE
DEFENCE Operational sales growth expectation of around 6%
Operating margin between 10 to 11%
Based on the current IHS’ FY 2020 regionally adjusted outlook of 21.9%* we guide our operational sales development for 2020 between minus 20 to minus 23%
Operating result expected between 10 €m to 20 €m positive
GROUP Operational sales growth for 2020 between minus 7% and minus 6%
Operating margin expected between positive 6% to 6.5%
Disclaimer:Guidance does not anticipate any significant adverse impact on production, supply chain and market demand from second Covid wave
*IHS Markit: 3 November 2020; global LV growth adjusted for ChinaCorporate Presentation January 2021

Appendix
Corporate Presentation January 2021 53

Corporate Presentation January 2021
SustainabilityPath to CO2 neutrality already started
CO² neutral
2017First CSR Report
2040
2015First non financial data
2020Triple Bottom Line
2020Report on contribution toSustainable Development Goals
54
2014Global complianceorganisation
2009Statement on clustermunition and anti-personnel landmines
2018Statement on whitephosphorousammunition
2019Updated CSR ratings selectionMSCI: AAISS-oekom: D+Sustainalytics: 60
2017First CSR ratings selectionMSCI: BBBISS-oekom: DSustainalytics: 51
2020GRI-Report
2020 - 2040Milestone plan reCO2 neutrality3 years increments
2022TCFD (Task Force on Climate-related Financial Disclosures)
2023CDP
2021Reporting analogous toUN Global Compact
2020Updated CSR ratings selectionMSCI: AA (confirmed)ISS-oekom: C (improving two levels)Sustainalytics: 32 (22nd out of 87 peer group)
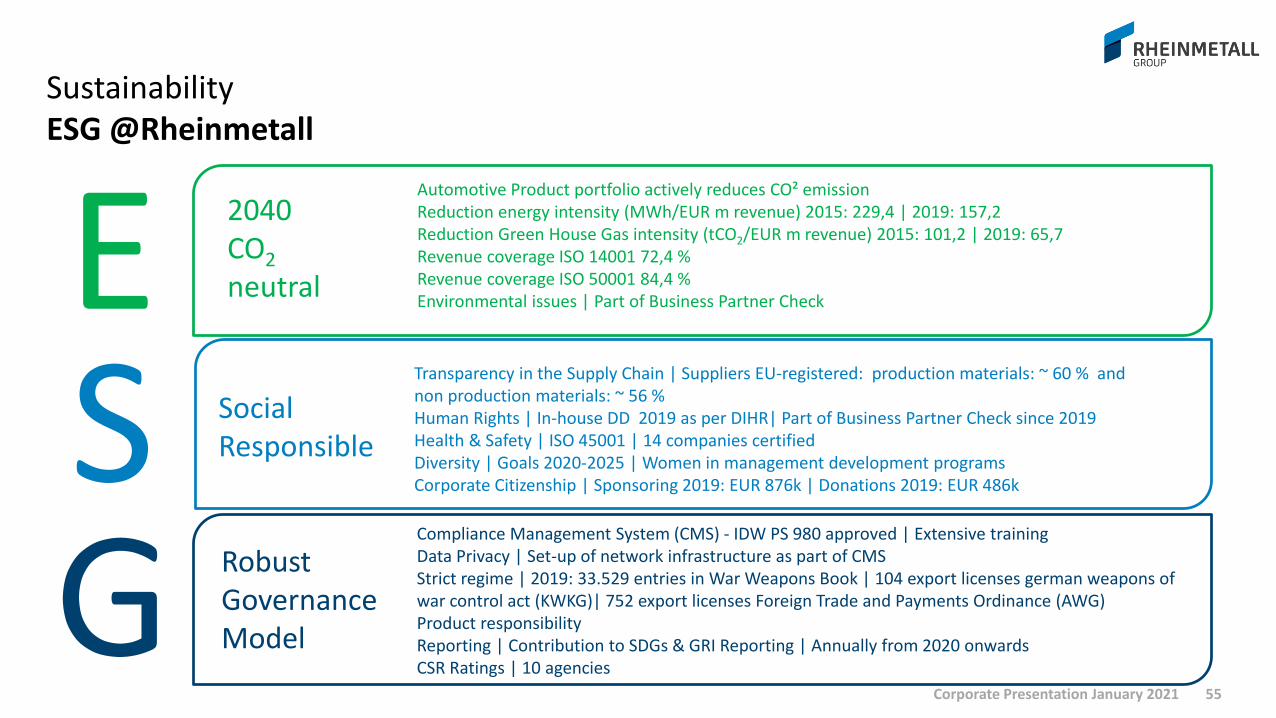
SustainabilityESG @Rheinmetall
Transparency in the Supply Chain | Suppliers EU-registered: production materials: ~ 60 % and non production materials: ~ 56 % Human Rights | In-house DD 2019 as per DIHR| Part of Business Partner Check since 2019Health & Safety | ISO 45001 | 14 companies certifiedDiversity | Goals 2020-2025 | Women in management development programsCorporate Citizenship | Sponsoring 2019: EUR 876k | Donations 2019: EUR 486k
Automotive Product portfolio actively reduces CO² emission Reduction energy intensity (MWh/EUR m revenue) 2015: 229,4 | 2019: 157,2Reduction Green House Gas intensity (tCO2/EUR m revenue) 2015: 101,2 | 2019: 65,7Revenue coverage ISO 14001 72,4 %Revenue coverage ISO 50001 84,4 %Environmental issues | Part of Business Partner Check
SocialResponsible
2040 CO2
neutral
SE
Compliance Management System (CMS) - IDW PS 980 approved | Extensive trainingData Privacy | Set-up of network infrastructure as part of CMSStrict regime | 2019: 33.529 entries in War Weapons Book | 104 export licenses german weapons ofwar control act (KWKG)| 752 export licenses Foreign Trade and Payments Ordinance (AWG)Product responsibilityReporting | Contribution to SDGs & GRI Reporting | Annually from 2020 onwardsCSR Ratings | 10 agencies
Robust GovernanceModelG
55Corporate Presentation January 2021
LTI
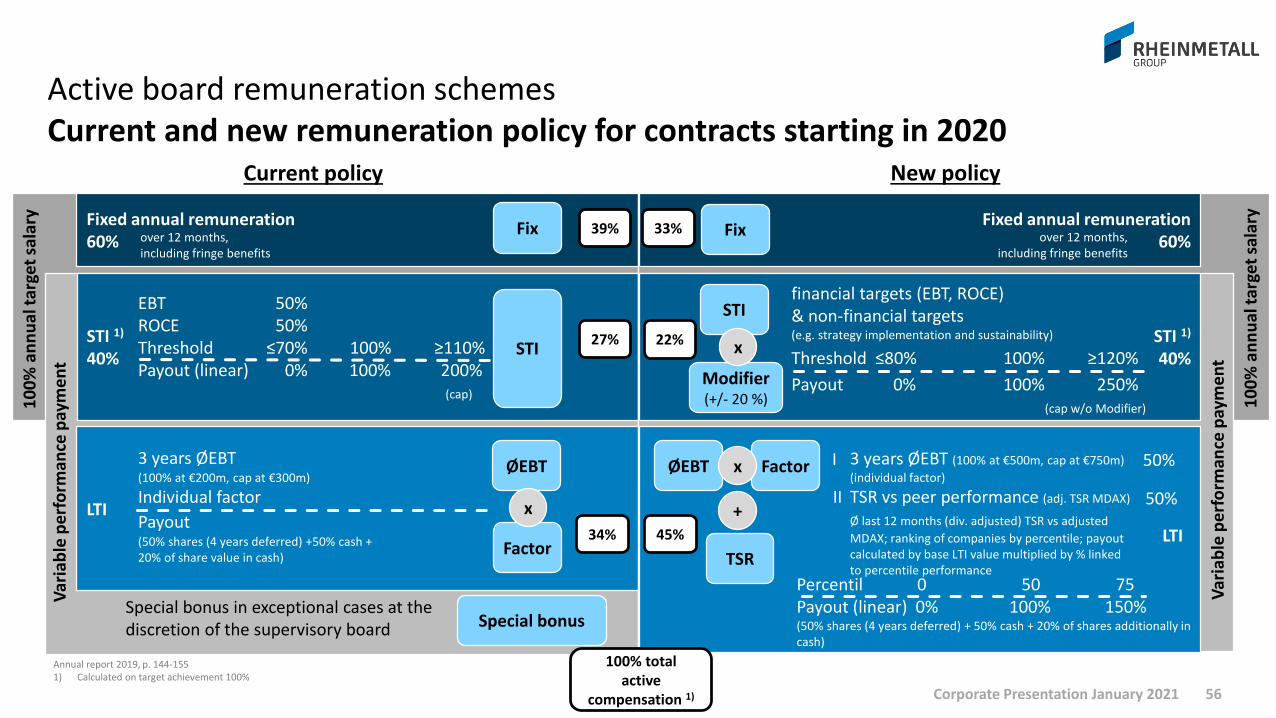
Fixed annual remuneration60%
Active board remuneration schemesCurrent and new remuneration policy for contracts starting in 2020
STI 1)
40%
over 12 months, including fringe benefits
3 years ØEBT (100% at €200m, cap at €300m)
Individual factor
Payout(50% shares (4 years deferred) +50% cash + 20% of share value in cash)
EBT 50%ROCE 50%Threshold ≤70% 100% ≥110%Payout (linear) 0% 100% 200%
(cap)
10
0%
an
nu
alta
rget
sala
ry
ØEBT
Factor
Special bonus in exceptional cases at the discretion of the supervisory board
Var
iab
le p
erf
orm
ance
pay
me
nt
STI
x
Special bonus
39%
27%
34%
Annual report 2019, p. 144-1551) Calculated on target achievement 100%
Fix Fixed annual remuneration60%
STI 1)
40%
STI
Modifier(+/- 20 %)
ØEBT
TSR
+
Fix
Factor
x
x
over 12 months, including fringe benefits
financial targets (EBT, ROCE)& non-financial targets (e.g. strategy implementation and sustainability)
Threshold ≤80% 100% ≥120%
Payout 0% 100% 250% (cap w/o Modifier)
3 years ØEBT (100% at €500m, cap at €750m)
(individual factor)
TSR vs peer performance (adj. TSR MDAX)
Ø last 12 months (div. adjusted) TSR vs adjusted
MDAX; ranking of companies by percentile; payout calculated by base LTI value multiplied by % linked to percentile performance
Percentil 0 50 75Payout (linear) 0% 100% 150% (50% shares (4 years deferred) + 50% cash + 20% of shares additionally in cash)
33%
22%
45%
100% total active
compensation 1)
Var
iab
le p
erf
orm
ance
pay
me
nt
10
0%
an
nu
alta
rget
sala
ry
50%
50%
LTI
I
II
Current policy New policy
Corporate Presentation January 2021 56

KMW/Nexter
European DefenceConsolidation landscape
57Corporate Presentation January 2021
Governmental shareholding restricts room
for cross-border consolidation
Big common armament programs could be
catalysts for further consolidation
Rheinmetall’s approach:
JV partnerships with companies in different
nations instead of “putting all eggs in one
basket”
Sufficient organic growth potential, but
suitable M&A transactions are possible
Cobham
<25% or not state-owned
Saab
Chemring
>25% state-owned
AselsanOto Melara
RUAGThales
PatriaNammo
Kongsberg49.9%
50%
Rheinmetall
KMW/Nexter
R B S L Rheinmetall
BAE Systems
RO HU CZPL50%50%

Our capital allocation policy is geared towards further growth
58Corporate Presentation January 2021
9.4%
Q3
‘19
leve
l
Funding of growth (organic and M&A)
Dividend to shareholders (Payout ratio 30-35%)
Improvement of pension funding via CTA (target level 50-60%)

Group 2015 – 2019Key figures (as reported)
Total assets 5.730 6.150 6.101 6.759 7.415
Shareholder's equity 1.562 1.781 1.870 2.173 2.272
Equity ratio (in %) 27,3 29,0 30,7 32,1 30,6
Pension liabilities 1.128 1.186 1.080 972 1.169
Net financial debt -81 19 230 -30 -52
Net financial debt / EBITDA 0,17 -0,03 -0,37 0,04 0,07
Net gearing (in %) 5,2 -1,1 -12,3 1,4 2,3
Sales 5.183 5.602 5.896 6.148 6.255
Operating result 287 353 400 491 505
Operating margin (in %) 5,5 6,3 6,8 8,0 8,1
EBITDA 490 581 626 836 792
EBIT 287 353 385 518 512
EBIT margin (in %) 5,5 6,3 6,5 8,4 8,2
EBT 221 299 346 485 477
Net income 160 215 252 354 354
Earnings per share (in EUR) 3,88 4,69 5,24 7,10 7,77
Dividend per share (in EUR) 1,10 1,45 1,70 2,10 2,40
ROCE (in %) 10,6 12,3 13,8 17,1 15,4
CF statement Free cashflow from operations 29 161 276 -35 314
Headcount Employees (Dec. 31) according to capacity 20676 20993 21610 22899 23780
Income
statement
2015 2016 2017 2018 2019in €m
Balance Sheet
Corporate Presentation January 2021 59

Segments 2015 – 2019 Key figures
2015 2016 2017 2018 2019 2015 2016 2017 2018 2019
2.621 2.670 2.922 2.888 2.705 2.693 3.050 2.963 5.565 5.186
445 458 520 478 447 6.422 6.656 6.416 8.577 10.399
2.592 2.656 2.861 2.930 2.736 2.591 2.946 3.036 3.221 3.522
216 223 249 262 184 90 147 174 254 343
8,3 8,4 8,7 8,9 6,7 3,5 5,0 5,7 7,9 9,8
335 356 367 421 348 175 239 268 403 450
216 223 227 266 186 90 147 172 247 341
8,3 8,4 7,9 9,1 6,8 3,5 5,0 5,7 7,7 9,7
167 149 154 161 143 96 95 89 101 166
96 105 106 26 73 -38 103 238 -29 266
10.934 10.820 11.166 11.710 11.405 9.581 10.002 10.251 10.948 12.100
1.450 1.499 1.621 1.664 1.525 Sales 881 1.111 1.175 1.056 1.018
118 140 176 171 118 Operating Result 73 108 117 121 123
8,1% 9,3% 10,9% 10,3% 7,7% Margin 8,3% 9,7% 10,0% 11,5% 12,1%
952 921 968 988 937 Sales 759 745 691 839 948
73 62 60 65 28 Operating Result 12 25 20 46 75
7,7% 6,7% 6,2% 6,5% 3,0% Margin 1,5% 3,4% 2,9% 5,5% 7,9%
285 319 358 367 361 Sales 1.195 1.392 1.480 1.568 1.787
27 29 33 36 35 Operating Result -9 29 53 108 150
9,5% 9,1% 9,2% 9,7% 9,8% Margin -0,8% 2,1% 3,6% 6,9% 8,4%
AftermarketVehicle
Systems
Electronic
Solutions
Automotive
Weapon &
AmmunitionMechatronics
Hardparts
Operating result
Operating margin (in %)
EBITDA
EBIT
EBIT margin (in %)
Employees (Dec. 31) according to capacity
Capex
OFCF
Defence
Order intake
Order backlog (Dec. 31)
Sales
in €m
Corporate Presentation January 2021 60
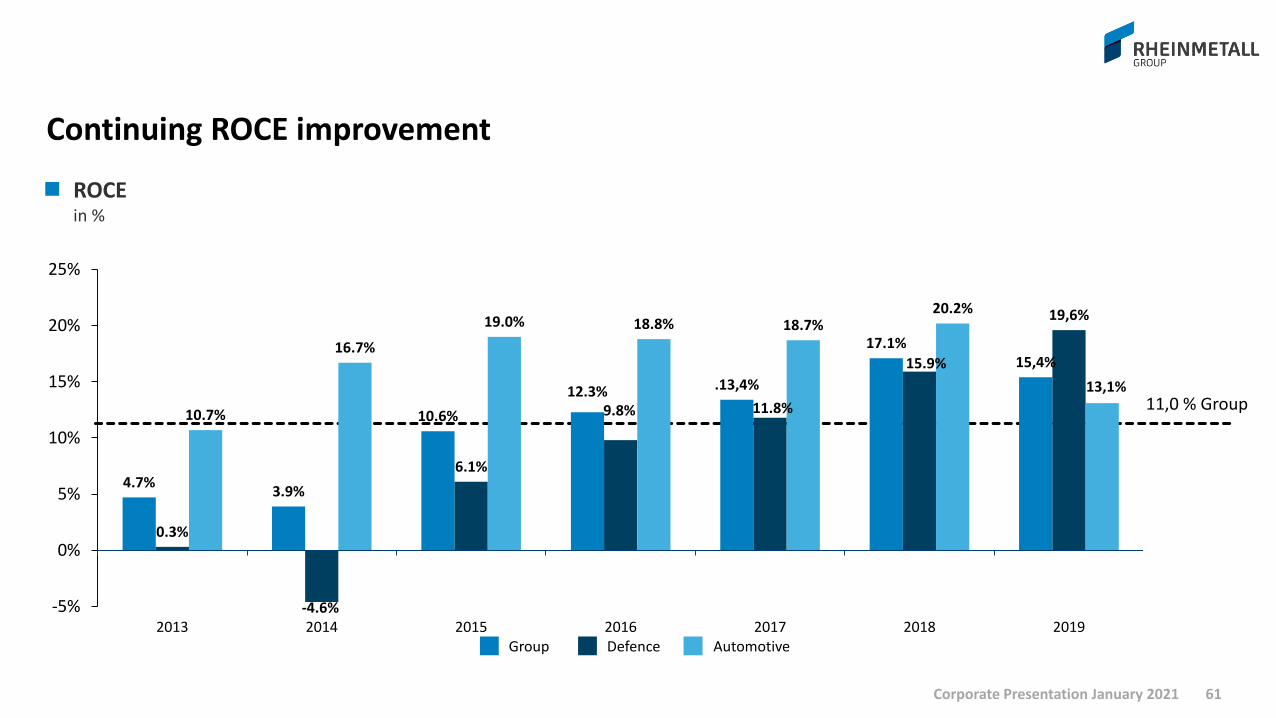
Continuing ROCE improvement
61Corporate Presentation January 2021
4.7%3.9%
10.6%
12.3% .13,4%
17.1%15,4%
0.3%
-4.6%
6.1%
9.8% 11.8%
15.9%
19,6%
10.7%
16.7%
19.0% 18.8% 18.7%20.2%
13,1%
-5%
0%
5%
10%
15%
20%
25%
2013 2014 2015 2016 2017 2018 2019
ROCEin %
11,0 % Group
AutomotiveGroup Defence
Next events and IR contacts
Next Events*
Quick link to documents
Dirk WinkelsHead of IRTel: +49-211 473-4749Email: [email protected]
René WeinbergSenior Investor Relations ManagerTel: +49-211 473-4759Email: [email protected]
Rosalinde SchulteInvestor Relations AssistantTel: +49-211 473-4718Email: [email protected]
IR Contacts
Corporate Presentation Annual ReportsInterim Reports
Commerzbank, German Investment Seminar 11/12 January 2021Bank of America SMID Cap Conference 13 January 2021Kepler Cheuvreux UniCredit, German Investment Seminar 18/19 January 2021
FY Earnings release 18 March 2021
*All events will be conducted as virtual conferences
62Corporate Presentation January 2021
Disclaimer
63Corporate Presentation January 2021
This presentation contains “forward-looking statements” within the meaning of the US Private Securities Litigation Reform Act of 1995 with respect to Rheinmetall’sfinancial condition, results of operations and businesses and certain of Rheinmetall’s plans and objectives. These forward-looking statements reflect the current views of Rheinmetall’s management with respect to future events. In particular, such forward-looking statements include the financial guidance contained in the outlook for 2020.
Forward-looking statements are sometimes, but not always, identified by their use of a date in the future or such words as “will”, “anticipates”, “aims”, “could”, “may”, “should”, “expects”, “believes”, “intends”, “plans” or “targets”. By their nature, forward-looking statements are inherently predictive, speculative and involve risk and uncertainty because they relate to events and depend on circumstances that will occur in the future. There are a number of factors that could cause actual results and developments to differ materially from those expressed or implied by these forward-looking statements. In particular, such factors may have a material adverse effect on the costs and revenue development of Rheinmetall. Further, the economic downturn in Rheinmetall’s markets, and changes in interest and currency exchange rates, may also have an impact on Rheinmetall’s business development and the availability of financing on favorable conditions. The factors that could affect Rheinmetall’s future financial results are discussed more fully in Rheinmetall’s most recent annual and quarterly reports which can be found on its website at www.rheinmetall.com.
All written or oral forward-looking statements attributable to Rheinmetall or any group company of Rheinmetall or any persons acting on their behalf contained in or made in connection with this presentation are expressly qualified in their entirety by factors of the kind referred to above. No assurances can be given that the forward-looking statements in this presentation will be realized. Except as otherwise stated herein and as may be required to comply with applicable law and regulations, Rheinmetall does not intend to update these forward-looking statements and does not undertake any obligation to do so.This presentation does not constitute an offering of securities or otherwise constitute an invitation or inducement to any person to underwrite, subscribe for or otherwise acquire or dispose of securities in Rheinmetall AG or any of its direct or indirect subsidiaries.
Rheinmetall AG and its affiliates are neither associated with nor provide any support to American Depository Receipts programmes (ADR) or comparable offerings or investment schemes related to shares in Rheinmetall AG in the United States of America or any other jurisdiction. Therefore, neither Rheinmetall AG nor any of its affiliates has and or will accept any responsibility or liability whatsoever in relation to such ADR programmes or comparable investment schemes.