Embed Size (px)
Citation preview
ANNUAL TRANSACTIONS OF THE NORDIC RHEOLOGY SOCIETY, VOL. 13, 2005
Rheological hydrate detection and characterization
Reidar Barfod Schüller1, Morten Tande2, and Harald-Knut Kvandal3
1 Norwegian University of Life Sciences, 1432 Ås, Norway.
2 Hydro Corporate Research Centre, 3908 Porsgrunn, Norway 3 Hydro Oil and Energy Research Centre, 3908 Porsgrunn, Norway
ABSTRACT Measurements have been undertaken on
pressurised saturated hydrocarbon/water mixtures from the North Sea.
Hydrate formation and dissociation was detected, the hydrate dispersion was characterized, and the yield stress of the dispersion was measured.
Laboratory rheometers fitted with suitable pressure and temperature control facilities can be used to characterize many of the important parameters associated with the presence of hydrates in production systems.
INTRODUCTION
Clathrate hydrates1, 2 may form in oil production facilities when the pressure and temperature favour the growth of hydrate crystals. Typically, at a pressure of 50 bar hydrates may form when the temperature falls below 20 °C. The presence of hydrate crystals in the fluid may cause a significant increase in viscosity. From a production point of view this poses a threat to both production capacity and possible blocking of the production pipeline. The strength of pure clathrate hydrates can be 20 times stronger than ice3, but this may not be comparable with the strength of solidified dispersions containing hydrate particles.
The flow of hydrate dispersions in pipelines has been investigated by several authors4, 5. Hydrate growth is often inhibited
by the addition of Methanol or Glycols affecting the thermodynamic equilibrium. Kinetic hydrate inhibitors, slowing down the rate of hydrate growth or delaying hydrate formation, have been investigated by several authors2, 4. Some oils also seem to contain components that act as natural inhibitors6, 7 that prevent the formation of hydrates. Published information on the rheology of hydrate dispersions include characterization of hydrate suspensions8, investigations on the flow properties of hydrate in water systems9 and viscosity measurements on crude oil systems10, 11.
The focus in this work was placed on the use of laboratory rheometers for determination of rheological behaviour of dispersions containing hydrates. MATERIALS AND METHODS
Measurements were done on pressurised systems containing hydrocarbon liquid from the North Sea, mixed with water and saturated with hydrocarbon gas.
The tests were performed in Physica UDS200 and Physica MCR 500 rheometers, fitted with controlled pressure bob/cup measuring systems positioned in a Peltier temperature controlling element, TEZ150P/-UDS, mounted in a 1-150 bar pressure cell, Paar Physica, TEZ150P-C+Pr150.
The test pressure was typically 50 bars, and the temperature during hydrate formation was typically 4 °C.
83

Table 1: Bob/cup measuring systems
Measuring system Volume
[ml]
Maximum Speed
[rpm]
Maximum Shear rate
[s-1]
Gap size
[mm]
CC23/Pr 25 3000 1928 2.05 CC26.61Pr 12-16 3000 16869 0.25 CC26.61Pr/profiled 12-16 3000 16869 0.25 CC26.61Pr/Ti (profiled /flat bottom)
6-12 3000 16869 0.25
DG23 Pr (double gap) 5 3000 3860 O= 0.98 I= 0.83 DG23.04 Pr (double gap) 5 3000 9136 O= 0.41 I= 0.36
O= outer gap I= inner gap
Measuring geometries Several, both standard and specially
designed measuring systems, can be applied depending on the sample properties and the characteristics to be studied. The systems are all cylinders, but range from double-gap systems for accurate measurements on low viscous fluids to grooved cylinders with small sample volumes to achieve good dispersion.
The sample volume can be changed, as long as the surface of the sample is above the measuring cylinder, without affecting the rheological measurements.
The results presented in this work were mainly obtained from a CC26.61Pr/Ti with gap size of 0.25 mm. This cell also has a flat bottom keeping the sample volume below the bob to a minimum.
The employed principle of the bob/cup measuring system is shown in Fig. 1, and an overview of the systems employed in this study is shown in Table 1. High pressure cell
The measuring systems were mounted in a high pressure cell that can go up to 150
Figure 1: Measuring principle of bob/cup
measuring system.
bars, and the temperature can be varied from – 20 °C to 150 °C. The cell is completely sealed off from the environment, which avoids sample degradation due to contact with oxygen and evaporation. The measuring system inside the cell is attached through a low friction mechanical bearing. The torque from the instrument motor is transferred to the measuring system through a magnetic coupling. With Physica’s Direct Strain Oscillation method the UDS 200 allow oscillatory measurements at very low torques (> 5 µNm) and small deformations even with the pressure cell connected to the drive-unit.
84

Table 2: Gas composition
Component Mole fractions CO2 0.010 N2 0.012
CH4 0.778 C2H6 0.131 C3H8 0.069 C4H10 0.001
The pressure level was controlled by
means of a gas bottle connected to the high-pressure cell via pressure regulating valves. The bottle contained a gas mixture with composition shown in Table 2. The majority is Methane (CH4), but the gas mixture contained sufficient Propane, (C3H8), to produce Type II structure hydrates2, which is the type that forms in real gas & oil production systems. It is possible to keep the pressure constant in the bob/cup measuring system during hydrate formation by the addition of the gas that the hydrate formation consumes.
The resulting hydrate curve for this mixture is shown in Fig. 2. The hydrate formation temperature at 50 bar pressure is approximately 16 °C.
Sample preparation
The high-pressure sample chamber is equipped with an inlet at the bottom and an outlet at the top for sample loading. The way the sample is applied in the rheometer depends on the type of sample or hydrate to be studied. For gas hydrates, water is added first, then the oil and thereafter the sample is pressurized. The sample volume is between 5 and 25 ml depending on the measuring system in use.
Which temperature gradient, shear rate, shear stress and measuring system to use depend on the viscosity of the sample.
The fluid used in the tests was stabilized oil from the North Sea, a hydrocarbon gas mixture (Table 2) and salt water (3.5% salinity). The three phases were in thermodynamic equilibrium during testing.
Hydrate Curve
0102030405060708090
100
0 5 10 15 20
Temperature (°C)
Pre
ssur
e (b
ara)
Figure 2: Hydrate curve for the gas composition used in this study.
Test procedures
Hydrate formation: The sample was pressurized to 50 bars by the hydrocarbon gas mixture, and the temperature of the sample was reduced at a rate of –0.5 °C/minute below 15 °C maintaining a constant shear rate of 6000 s-1.
Hydrate dissociation: The temperature was increased at a rate of 0.2 °C/minute maintaining a constant shear rate of 100 s-1.
Characterization: Shear rate sweeps from 10 s-1 to 1000 s-1 maintaining constant temperature and pressure. Frequency sweeps and oscillation tests with increasing strain at a frequency of 1 Hz.
Yield stress determination: Gradually increasing the strain until the sample yields.
RESULTS AND DISCUSSION Hydrate formation
The oil and water may not be dispersed at low shear rates, and it is difficult to form hydrates. When the shear rate is increased, the oil water mixture is better dispersed, and it is easier to form hydrates.
85

100
101
102
103
mPa·s
η
0
10
20
30
40
50
60
70
80°C
T
0 20 40 60 80 100 120minTime t
η Viscosity
T Temperature
Figure 3: Temperature and viscosity during hydrate formation in a constant pressure test,
CC26.61Pr/Ti.
100
101
102
103
104
mPa·s
η
0 5 10 15 20°CTemperature T
η Viscosity
Figure 4: Diagram showing a typical viscosity versus temperature curve during hydrate
dissociation, CC26.61Pr/Ti.
Hydrates were detected by a sudden increase in the measured viscosity of the dispersion. A typical plot showing hydrate formation at constant pressure is shown in Fig. 3 where the viscosity increases as the temperature is decreased at a constant shear rate of 6000 s-1. A significant viscosity rise indicates the presence of hydrates in the dispersion at time 84 minutes when the temperature reached 5.5 °C. A temperature
rise is also observed at the same time since the formation process is exothermic. The sudden appearance of hydrates in the fluid exhibited similar behaviour to that observed by Camargo et al8. The viscosity passes through a maximum before it stabilizes at a level approximately twice as high as the initial steady state value. The viscosity of the dispersion stabilized in this case at approximately 80 mPas. The maximum
86

point may be due to the initial presence of wet/sticky hydrate particles that eventually become dry when the steady state value is reached.
A profiled measuring system with 2 mm gap and flat bottom will give a better-dispersed sample than the standard measuring system used in many of the tests.
Hydrates seem to form at higher temperature at lower cooling rates.
Hydrate dissociation
The hydrate equilibrium temperature is defined by the melting (or dissociation) of the hydrate crystals (Fig. 2).
An example showing the effects of hydrate dissociation (or melting) is seen in Fig. 4 where the temperature was increased at a rate of 0.2 °C/minute at a shear rate of 100 s-1. The hydrate melting temperature is found to be close to 16 °C for this system, which is comparable with the calculated graph in Fig. 2. A significant increase in viscosity is observed before the viscosity
decreases by several magnitudes as the hydrates disappear.
It is believed that this increase in viscosity is caused by changes in hydrate surface behaviour, e.g. increased stickiness when the hydrates approach the melting temperature. The hydrate dissociation (or melting) temperature is easily detected.
Characterization
The behaviour of the dispersion containing hydrate particles can be characterized by normal rheological methods in both rotation and oscillation.
The dispersions are normally of a shear thinning nature.
An example of a shear rate sweep is shown in Fig. 5 where the shear rate is varied from 10 s-1 to 1000 s-1 at 1 °C. The sample is shear thinning and has a clear hysteresis indicating that the dispersion exhibits thixotropic behaviour.
Figure 5: Viscosity versus shear rate at 1 °C. Viscosity is 2500 mPas at 10 s-1 and 364 mPas
at 1000 s-1 (increasing shear rate shown by circles). Viscosity is 350 mPas at 1000 s-1 and 2788 mPas at 10 s-1 (decreasing shear rate shown by triangles), CC26.61Pr/Ti.
87

Figure 6: Complex viscosity, G’ and G’’ versus frequency for solidified sample,
CC26.61Pr/Ti.
0,1
1
10
100
1 000
10 000
%
γ
1 10 100 1 000PaShear Stress τ
I6...I6
yield stress 200 Pa
γ Strain
Figure 7: Diagram of strain versus shear stress showing yield at 200 Pa, CC26.61Pr/Ti.
88
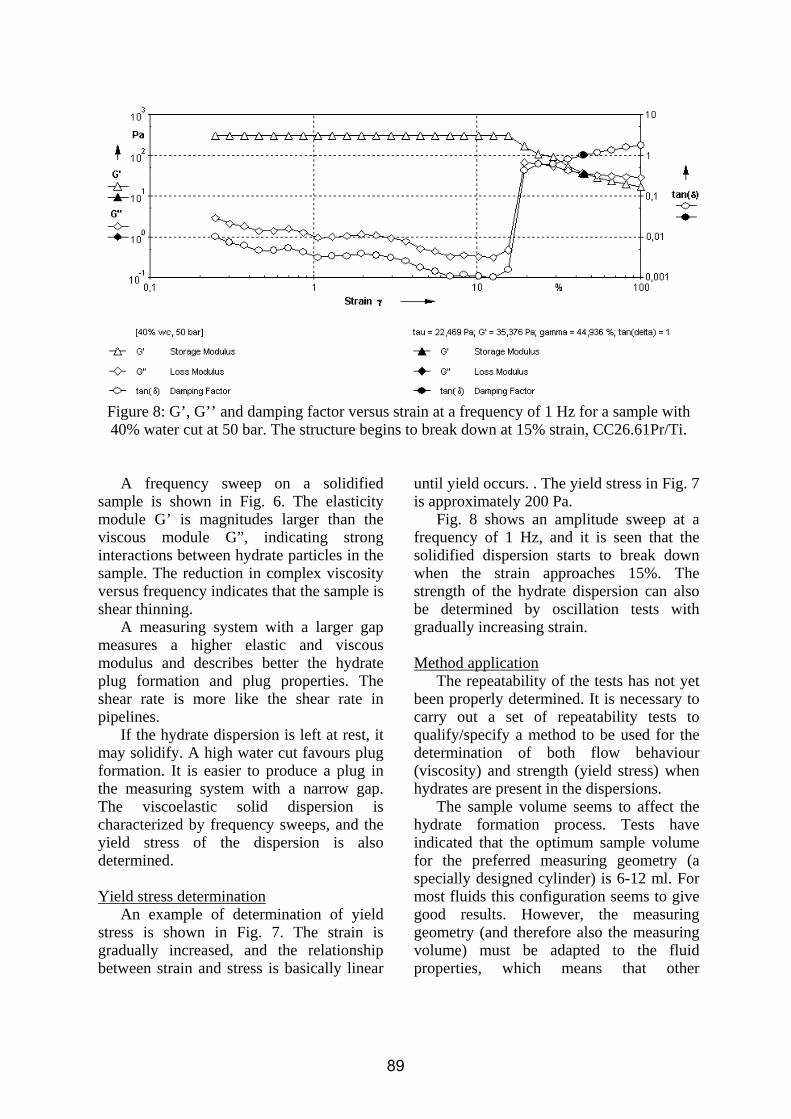
Figure 8: G’, G’’ and damping factor versus strain at a frequency of 1 Hz for a sample with 40% water cut at 50 bar. The structure begins to break down at 15% strain, CC26.61Pr/Ti.
A frequency sweep on a solidified
sample is shown in Fig. 6. The elasticity module G’ is magnitudes larger than the viscous module G”, indicating strong interactions between hydrate particles in the sample. The reduction in complex viscosity versus frequency indicates that the sample is shear thinning.
A measuring system with a larger gap measures a higher elastic and viscous modulus and describes better the hydrate plug formation and plug properties. The shear rate is more like the shear rate in pipelines.
If the hydrate dispersion is left at rest, it may solidify. A high water cut favours plug formation. It is easier to produce a plug in the measuring system with a narrow gap. The viscoelastic solid dispersion is characterized by frequency sweeps, and the yield stress of the dispersion is also determined.
Yield stress determination
An example of determination of yield stress is shown in Fig. 7. The strain is gradually increased, and the relationship between strain and stress is basically linear
until yield occurs. . The yield stress in Fig. 7 is approximately 200 Pa.
Fig. 8 shows an amplitude sweep at a frequency of 1 Hz, and it is seen that the solidified dispersion starts to break down when the strain approaches 15%. The strength of the hydrate dispersion can also be determined by oscillation tests with gradually increasing strain.
Method application
The repeatability of the tests has not yet been properly determined. It is necessary to carry out a set of repeatability tests to qualify/specify a method to be used for the determination of both flow behaviour (viscosity) and strength (yield stress) when hydrates are present in the dispersions.
The sample volume seems to affect the hydrate formation process. Tests have indicated that the optimum sample volume for the preferred measuring geometry (a specially designed cylinder) is 6-12 ml. For most fluids this configuration seems to give good results. However, the measuring geometry (and therefore also the measuring volume) must be adapted to the fluid properties, which means that other
89

geometries like the double-gap system may have to be used, especially for very low viscous samples. The sample volume is however still very small. CONCLUSIONS
Hydrates were repeatedly formed in the rheometers, and the viscosity of the resulting dispersions was determined. The viscosity increase was significant and readily measured.
A marked increase in viscosity was seen when the hydrate dispersions approached the melting point. It was possible to determine the yield stress of the resulting solidified dispersion in the rheometer.
The measured yield stress depends on the type of measuring system used.
Laboratory rheometers fitted with suitable pressure and temperature control facilities can be used to characterize many of the important parameters coupled to the presence of hydrates in production systems.
ACKNOWLEDGMENTS
The authors appreciate the permission from Norsk Hydro ASA to publish these results.
REFERENCES 1. Sloan, E.D., Clathrate Hydrates of Natural Gases, ed. H. Heinemann. 1990, New York and basel: Marcel Dekker, Inc. 0-8247-8296-8 2. Sloan, E.D.J., Hydrate Engineering, ed. J.B. Bloys. 2000, Richardson, Texas: Society of Petroleum Engineers 3. Durham, W.B., S.H. Kirby, L.A. Stern, and W. Zhang, The strength and rheology of methane clathrate hydrates. Journal of Geophysical Research - Solid Earth 108 (B4), 2003(Article number: 2182). 4. Mitchell, G.F. and L.D. Talley. Application of Kinetic Hydrate Inhibitor in Black-Oil Flowlines, SPE 56770. in SPE Annual Technical Conference and Exhibition. 1999. Houston, Texas: Society of Petroleum Engineers Inc.
5. Nuland, S. and R. Vilagines. Gas hydrate slurry flow - A flow modeller looks at the state of slurry rheology modelling. in BHRG Multiphase International Conference. 2001. Cannes, France. 6. Leporcher, E., J.I. Peytavy, Y. Mollier, and J. Sjöblom. Multiphase transportation: hydrate plugging prevention through crude oil natural surfactants, SPE 49172. in SPE Annual Technical Conference and Exhibition. 1998. New Orelans, Louisiana: Society of Petroleum Engineers Inc. 7. Fadnes, F.H., Natural hydrate inhibiting components in crude oils. Fluid Phase Equilibria, 1996. 117: p. 186-192. 8. Camargo, R., T. Palermo, A. Sinquin, and P. Glenat, Rheological Characterization of Hydrate Suspensions in Oil Dominated Systems. Ann NY Acad Sci, 2000. 912(1): p. 906-916. 9. Andersson, V. and J.S. Gudmundsson, Flow Properties of Hydrate-in-Water Slurries. Ann NY Acad Sci, 2000. 912(1): p. 322-329. 10. Christenson, H.K. and J.N. Israelachvili, Direct measurements of interactions and viscosity of crude oils in thin films between model clay surfaces. Journal of Colloid and Interface Science, 1987. 119: p. 194-201. 11. Gunal, O.G. and M.R. Islam, Alteration of asphaltic crude rheology with electromagnetic and ultrasonic irradiation. Journal of Petroleum Science and Engineering, 2000. 26: p. 263-272.
90