Embed Size (px)
Citation preview

Rheology of Polymers Near Liquid-SolidTransitions
Horst Henning Winter and Marian MoursUniversity of Massachusetts, Department of Chemical Engineering andDepartment of Polymer Science and Engineering, Amherst, MA 01003, USA
Polymeric materials near the liquid-solid transition (LST) exhibit a very distinct relaxation pattern.The reference point for analyzing these patterns is the instant of LST at which relaxation becomesself-similar over wide ranges of the relaxation time. The universality of this transition and itsconsequences have been explored extensively during the past decade. This study will present anoverview of rheological implications inherent in liquid-solid transitions of polymers. The LST can bemost reliably detected in a dynamic mechanical experiment in which the frequency independence ofthe loss tangent marks the LST. A wide variety of rheological observations of materials in thevicinity of an LST are discussed with respect to their universality. It is shown that polymerchemistry, molecular weight, stoichiometry, temperature, inhomogeneities, etc. greatly influence thematerial behavior near the LST. However, the characteristic self-similar relaxation is shown by allinvestigated materials, independent of the nature of the LST (e.g., both, physically and chemicallycrosslinking polymers). Several theories predict chemical and rheological properties in the vicinity ofan LST. They are briefly discussed and compared with experimental results. A variety of applica-tions for polymers near LST are presented that either already exist or can be envisioned. Theself-similar relaxation behavior which results in a power law relaxation spectrum and modulus is notrestricted to materials near LST. Different classes of polymers are described that also show powerlaw relaxation behavior. What makes the self-similar relaxation specific for materials at LST is itsoccurrence at long times with the longest relaxation time diverging to infinity.
List of Abbreviations . . . . . . . . . . . . . . . . . . . . . . . . . . . . . . 167
List of Symbols . . . . . . . . . . . . . . . . . . . . . . . . . . . . . . . . . 167
1 Patterns of Relaxation Near the Liquid-Solid Transition . . . . . . . 1701.1 Rheological Observations of a Liquid-Solid Transition . . . . . 1721.2 Relaxation Time Spectrum . . . . . . . . . . . . . . . . . . . . . 1741.3 Divergence of Longest Relaxation Time . . . . . . . . . . . . . . 1751.4 Interrelation Between Critical Exponents . . . . . . . . . . . . . 177
2 Theory of Gelation . . . . . . . . . . . . . . . . . . . . . . . . . . . . . 1792.1 Branching Theories . . . . . . . . . . . . . . . . . . . . . . . . . . 1792.2 Percolation Theory . . . . . . . . . . . . . . . . . . . . . . . . . . 1812.3 Scaling Near the LST . . . . . . . . . . . . . . . . . . . . . . . . 1822.4 Critical Gel as Fractal Structure . . . . . . . . . . . . . . . . . . 1842.5 The Notion of Topology . . . . . . . . . . . . . . . . . . . . . . . 1862.6 Kinetic Theory (Smoluchowski Equation) . . . . . . . . . . . . . 1872.7 Computer Simulations . . . . . . . . . . . . . . . . . . . . . . . . 189
6 7
Advances in Polymer Science, Vol. 134( Springer-Verlag Berlin Heidelberg 1997

3 Viscoelastic Properties at and Around the Liquid-Solid Transition . . 1893.1 Linear Viscoelasticity of Liquids and Solids . . . . . . . . . . . 1893.2 Viscoelastic Material Functions of Critical Gels . . . . . . . . . 1903.3 Viscoelastic Material Functions Near LST . . . . . . . . . . . . 193
4 Constitutive Modeling with the Critical Gel Equation . . . . . . . . . 1944.1 The Critical Gel Equation . . . . . . . . . . . . . . . . . . . . . . 1944.2 Linear Viscoelastic Modeling of Critical Gels . . . . . . . . . . 195
5 Physical Gelation . . . . . . . . . . . . . . . . . . . . . . . . . . . . . . 2005.1 Physical Network Systems . . . . . . . . . . . . . . . . . . . . . . 2025.2 Dynamic Glass Transition . . . . . . . . . . . . . . . . . . . . . . 2055.3 Liquid Crystalline Polymers at their Nematic-Smectic Transition 2065.4 Suspensions . . . . . . . . . . . . . . . . . . . . . . . . . . . . . . 206
6 Rheometry Near the Gel Point . . . . . . . . . . . . . . . . . . . . . . 2076.1 Oscillatory Shear . . . . . . . . . . . . . . . . . . . . . . . . . . . 2086.2 Sample Mutation . . . . . . . . . . . . . . . . . . . . . . . . . . . 2116.3 Time-Temperature Superposition . . . . . . . . . . . . . . . . . . 2136.4 Time-Cure Superposition . . . . . . . . . . . . . . . . . . . . . . 2146.5 Growth Rate of Moduli . . . . . . . . . . . . . . . . . . . . . . . 2146.6 Inhomogeneities . . . . . . . . . . . . . . . . . . . . . . . . . . . . 216
7 Detection of the Liquid-Solid Transition . . . . . . . . . . . . . . . . 2187.1 Diverging Rheological Properties . . . . . . . . . . . . . . . . . . 2197.2 Monotonously Changing Properties . . . . . . . . . . . . . . . . 2197.3 Uniqueness of tan d Method . . . . . . . . . . . . . . . . . . . . . 2207.4 Determination of S and n . . . . . . . . . . . . . . . . . . . . . . 221
8 Other Observations of Power Law Relaxation . . . . . . . . . . . . . 2228.1 Self-Similar Relaxation with Negative Exponent Value . . . . . 2238.2 Self-Similar Relaxation with Positive Exponent Value . . . . . 2248.3 Observations of Self-Similar Relaxation Spectra . . . . . . . . . 224
9 Applications . . . . . . . . . . . . . . . . . . . . . . . . . . . . . . . . . 2259.1 Avoiding the Gel Point . . . . . . . . . . . . . . . . . . . . . . . 2259.2 Materials Near the Gel Point . . . . . . . . . . . . . . . . . . . . 2269.3 Damping Materials . . . . . . . . . . . . . . . . . . . . . . . . . . 2269.4 Pressure-Sensitive Adhesives . . . . . . . . . . . . . . . . . . . . . 2279.5 Processing Near the Physical Gel Point . . . . . . . . . . . . . . 2289.6 Processing Near the Chemical Gel Point . . . . . . . . . . . . . 229
10 Conclusions . . . . . . . . . . . . . . . . . . . . . . . . . . . . . . . . . 229
11 References . . . . . . . . . . . . . . . . . . . . . . . . . . . . . . . . . . 230
166 H.H. Winter and M. Mours

List of Abbreviations
BSW Baumgartel, Schausberger, Winter (spectrum for linear flexiblechains of uniform length) [61]
CW Chambon-Winter (spectrum for critical gel)FS Flory-StockmayerLCP liquid crystalline polymerLST liquid/solid transitionODT order/disorder transitionPBD polybutadienePDMS polydimethylsiloxaneUV ultraviolet
List of Symbols
A constantaT
horizontal shift factora~
critical exponent for longest relaxation time before LSTa`
critical exponent for longest relaxation time after LSTbT
vertical shift factorb scaling exponent for gel fractionC(t; t@) Cauchy strain tensorC~1(t; t@) Finger strain tensorc concentrationd space dimensiond&
fractal dimensiondM&
fractal dimension with excluded volume screeningd phase angled#
phase angle at LSTE/R activation energy divided by universal gas constantFij
fragmentation kernel, probability of cluster of size i#j to breakup into cluster of size i and cluster of size j
f functionality, frequencyfM2
average number of crosslinking sites along a chainf'
gel fractionG relaxation modulusG
0plateau modulus of fully crosslinked material
G%
equilibrium modulusG* complex modulusG@ storage modulusG@@ loss modulus
Rheology of Polymers Near Liquid-Solid Transitions 167
G@#
storage modulus at LSTG@@
#loss modulus at LST
gN2
average number of crosslinking sites along a chaing measured property in definition of mutation numberC Gamma functionc shear strain, critical exponent for molecular weightc0
step shear strain, shear strain amplitudecR shear ratecR0
constant shear rateH relaxation spectrumH
0front factor of power law spectrum
h Heaviside step functiong@ real part of complex viscosity, g@"G@@/ug@@ imaginary part of complex viscosity, g@@"G@/ug0
zero-shear viscosityJ creep complianceJ0%
equilibrium complianceJ@ storage complianceJ@@ loss complianceK
ijreaction kernel, probability of cluster of size i to react with clusterof size j
i scaling exponent of rates of change of dynamic moduliK exponent for certain reaction kernel K
ij, K"k#l
j relaxation timej0
lower bound of CW relaxation spectrum, characteristic relaxationtime of liquid state, characteristic material time
j"
lifetime of physical bondj#)!3
characteristic relaxation timej-
lower cutoff relaxation time of power law spectrumj.!9
longest relaxation timej1'
lifetime of physical clusterj6
upper cutoff relaxation time of power law spectrumM cluster massM
%entanglement molecular weight
MGAUSS
molecular weight above which chains behave GaussianM
.!9molecular weight of largest cluster
M/
number average molecular weightM
8weight average molecular weight
m power law exponent (for spectrum with positive exponent)k exponent for homogeneous reaction kernel K
ijN number of bonds in a molecular clusterN(M) cluster mass distributionN
1first normal stress difference
N'
gel numberN
.!9maximum number of bonds in a molecular cluster
168 H.H. Winter and M. Mours
N.6
mutation numbern relaxation exponentnAf
number of molecules of A of functionality fnBg
number of molecules of B of functionality gnf
number of molecules of functionality fl critical exponent for typical cluster sizep measure of connectivity, e.g. extent of reaction in case of chemical
gelationp#
critical extent of reactionpA
extent of reaction of species ApB
extent of reaction of species Bn osmotic pressureR radius of gyrationR
#)!3typical cluster size
r molar ratior1
lower molar ratior6
upper molar ratioo cluster density, mass densityS gel stiffnesss critical exponent for zero-shear viscosityp critical exponent for maximum molecular weight¹ temperature*¹ degree of supercooling¹
0reference temperature
¹#
temperature at critical point¹
'glass transition temperature
¹.
melt temperaturet time*t sampling timet@ time (integration variable)t@@ time between t@ and tt1
creep timet1
process timeq critical exponent for cluster mass distribution, stressq stress tensorqR rate of change of shear stressq0
constant applied shear stress in creep experimentq1
stress under static load at infinite timeq11
—q22
first normal stress differenceq21"q
12shear stress
t exponent for homogeneous reaction kernel Kij
u angular frequencym correlation lengtht1
coefficient of first normal stress differencez critical exponent for equilibrium modulus
Rheology of Polymers Near Liquid-Solid Transitions 169

1 Patterns of Relaxation Near the Liquid-Solid Transition
Polymeric materials relax with a broad spectrum of relaxation modes. Magni-tude and shape of the spectrum reflect the material structure in some complic-ated way. The longer modes belong to the motion of entire molecules or of largechain segments while the shorter modes characterize small scale details of themolecules. Extra long relaxation modes arise from large scale structures whichsome polymers are able to form due to phase separation or associations on themolecular or particulate level. The formation of such extensive clusters is theorigin of many liquid-solid transitions. Most intriguing is the behavior near suchtransitions, when molecular motions slow down while they correlate withmotions of other molecules over longer and longer distances. The relaxationmodes are not independent any more, but they are somehow coupled overa wide range of time scales. This leads to a universal pattern of the relaxationtime spectrum at liquid-solid transitions. The universality of the rheologicalbehavior and its consequences have been explored extensively during the pastdecade, and this study will attempt to give an overview of the current state of thefield.
There are many reasons for studying the liquid-solid transition (LST). Thephysicist might be interested in gelation as a critical phenomenon. The LST ofpolymers is also technically important since it occurs in nearly all of thecommon fabrication processes. Examples are injection molding of semi-crystal-line polymers (where the surface quality of the finished parts may be affected bygelation) and processing of crosslinking polymers. The instant of LST has to beknown for the design and operation of such polymer processing. The polymerprocessing engineer may like to anticipate the instant of gelation, often for themere reason of avoiding or postponing it. Beyond that, processing near the gelpoint promises interesting texture development for ultimate material properties.The materials scientist might like to know the possible range of materialproperties close to the gel point. Conservation of the material state near an LSThas the potential for novel properties which combine liquid and solid character-istics. Industrial applications are just beginning to explore such advantageousproperties in adhesives, super absorbers, dampers, sealants, membranes, tonermatrices, catalyst supports, etc. Gels are good adhesives since they combine thesurface wetting property of liquids with the cohesive strength of solids. Strongadhesion and damping properties recommend gels as binder material in com-posite materials. Widespread technical applications have not yet materialized,since, until recently, it has been difficult to measure and control the LST. Thishas changed, and, as a consequence, one is able now to control processing nearLST or to manufacture gels with reproducible properties.
The chemical gel point defines the instant of LST of chemically crosslinkingpolymers. Before the crosslinking polymer has reached its gel point it consists ofa distribution of finite clusters. It is called a ‘sol’ since it is soluble in goodsolvents. Beyond the gel point, it is called a ‘gel’. The gel is an infinitely large
170 H.H. Winter and M. Mours
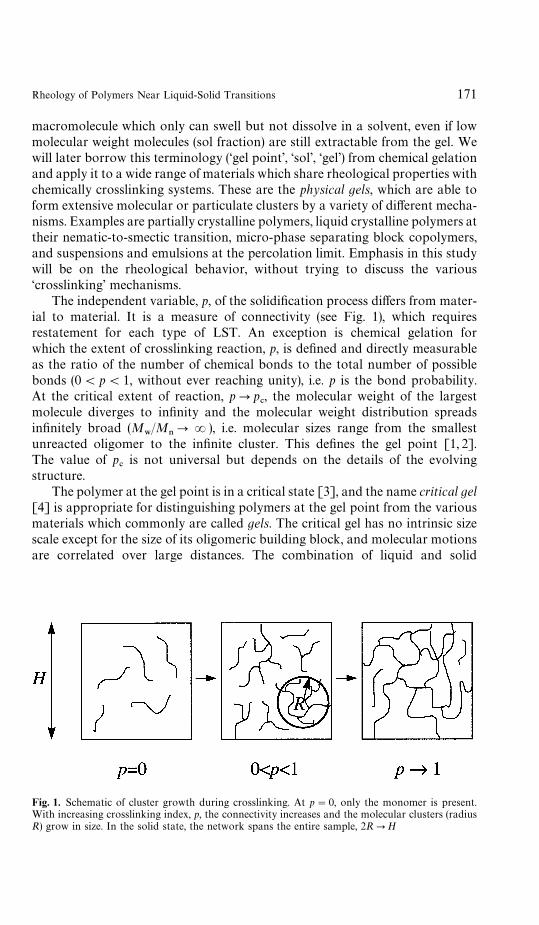
Fig. 1. Schematic of cluster growth during crosslinking. At p"0, only the monomer is present.With increasing crosslinking index, p, the connectivity increases and the molecular clusters (radiusR) grow in size. In the solid state, the network spans the entire sample, 2RPH
macromolecule which only can swell but not dissolve in a solvent, even if lowmolecular weight molecules (sol fraction) are still extractable from the gel. Wewill later borrow this terminology (‘gel point’, ‘sol’, ‘gel’) from chemical gelationand apply it to a wide range of materials which share rheological properties withchemically crosslinking systems. These are the physical gels, which are able toform extensive molecular or particulate clusters by a variety of different mecha-nisms. Examples are partially crystalline polymers, liquid crystalline polymers attheir nematic-to-smectic transition, micro-phase separating block copolymers,and suspensions and emulsions at the percolation limit. Emphasis in this studywill be on the rheological behavior, without trying to discuss the various‘crosslinking’ mechanisms.
The independent variable, p, of the solidification process differs from mater-ial to material. It is a measure of connectivity (see Fig. 1), which requiresrestatement for each type of LST. An exception is chemical gelation forwhich the extent of crosslinking reaction, p, is defined and directly measurableas the ratio of the number of chemical bonds to the total number of possiblebonds (0(p(1, without ever reaching unity), i.e. p is the bond probability.At the critical extent of reaction, pPp
#, the molecular weight of the largest
molecule diverges to infinity and the molecular weight distribution spreadsinfinitely broad (M
8/M
/PR), i.e. molecular sizes range from the smallest
unreacted oligomer to the infinite cluster. This defines the gel point [1, 2].The value of p
#is not universal but depends on the details of the evolving
structure.The polymer at the gel point is in a critical state [3], and the name critical gel
[4] is appropriate for distinguishing polymers at the gel point from the variousmaterials which commonly are called gels. The critical gel has no intrinsic sizescale except for the size of its oligomeric building block, and molecular motionsare correlated over large distances. The combination of liquid and solid
Rheology of Polymers Near Liquid-Solid Transitions 171
behavior at the gel point requires unusual simplicity and regularity in therelaxation pattern.
Very important are materials in the vicinity of the gel point. For such nearlycritical gels, p!p
#is a measure of the distance from the gel point, and all
properties can be expanded in powers of Dp!p#D. This is permitted within the
critical region at small distance at both sides of the gel point [3]. Materialproperties of nearly critical gels are still governed by the simplicity of the criticalstate. This changes at increased Dp!p
#D , where the behavior loses its simplicity.
It will be interesting to study the rheological properties which gradually breakfree from that pattern as the distance from the gel point increases.
Material properties at a critical point were believed to be independentof the structural details of the materials. Such universality has yet to beconfirmed for gelation. In fact, experiments show that the dynamic mechanicalproperties of a polymer are intimately related to its structural characteristicsand forming conditions. A direct relation between structure and relaxationbehavior of critical gels is still unknown since their structure has yet evadeddetailed investigation. Most structural information relies on extrapolation ontothe LST.
1.1 Rheological Observations of a Liquid-Solid Transition
The transition strongly affects the molecular mobility, which leads to largechanges in rheology. For a direct observation of the relaxation pattern, one may,for instance, impose a small step shear strain c
0on samples near LST while
measuring the shear stress response q12
(t) as a function of time. The result is theshear stress relaxation function G (t)"q
12(t)/c
0, also called relaxation modulus.
Since the concept of a relaxation modulus applies to liquids as well as to solids,it is well suited for describing the LST.
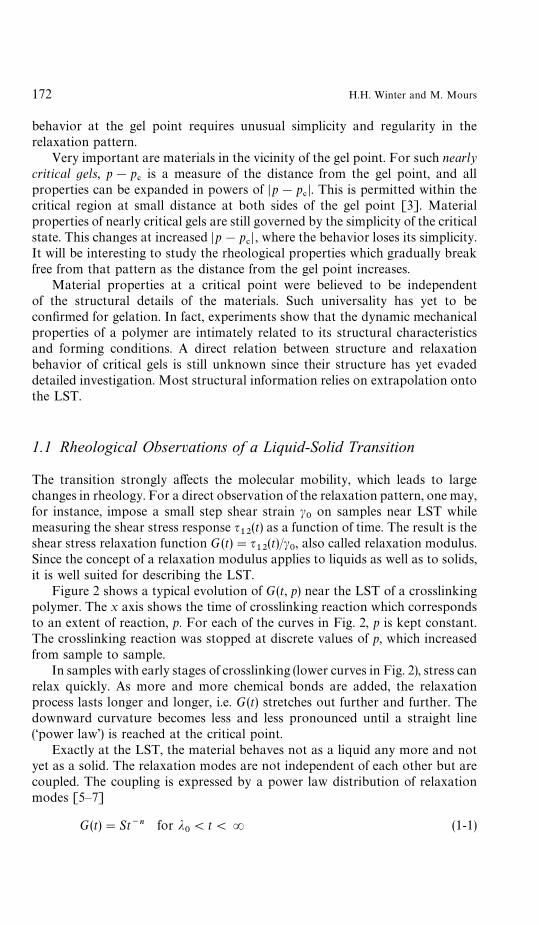
Figure 2 shows a typical evolution of G(t, p) near the LST of a crosslinkingpolymer. The x axis shows the time of crosslinking reaction which correspondsto an extent of reaction, p. For each of the curves in Fig. 2, p is kept constant.The crosslinking reaction was stopped at discrete values of p, which increasedfrom sample to sample.
In samples with early stages of crosslinking (lower curves in Fig. 2), stress canrelax quickly. As more and more chemical bonds are added, the relaxationprocess lasts longer and longer, i.e. G(t) stretches out further and further. Thedownward curvature becomes less and less pronounced until a straight line(‘power law’) is reached at the critical point.
Exactly at the LST, the material behaves not as a liquid any more and notyet as a solid. The relaxation modes are not independent of each other but arecoupled. The coupling is expressed by a power law distribution of relaxationmodes [5—7]
G(t)"St~n for j0(t(R (1-1)
172 H.H. Winter and M. Mours

Fig. 2. Relaxation modulus G(t) of a set of polydimethylsiloxane samples with increasing extent ofcrosslinking plotted against time of crosslinking. The linear PDMS chains (M
/+10 000, polydis-
persity index+2) were endlinked with a four-functional silane crosslinker catalyzed by a platinumcompound. Samples with different extent of reaction were prepared by poisoning the reaction atdifferent times. The actual extent of reaction was not determined. Two of the samples are clearlybefore the gel point (LST) and two beyond. The third sample is very close to the gel point. Data ofChambon and Winter [5] evaluated by Baumgartel and Winter [8]
S being the gel stiffness as indicated by the straight line in the log/log plot, Fig. 2.This marks the intermediate state between curving down and curving to theright, and we assume that the power law behavior extends to infinite times. Thepower law may be explained by the hypothesis that one probes self-similarregions of the critical gel by varying the times of observations [4]. The uppercut-off is infinite since the longest relaxation time diverges to infinity at the LST.Parameters S, n, and the lower cross-over, j
0, depend on the material structure
at the transition.Beyond the LST, p'p
#, the material is a solid. The solid state manifests
itself in a finite value of the relaxation modulus at long times, the so-calledequilibrium modulus
G%"lim
t?=G(t) . (1-2)
Stresses cannot relax completely any more. The upper curves in Fig. 2 show thiscurving to the right, where at long times an equilibrium stress level willeventually be reached. More data at longer times would be required in order toclearly identify the value of G
%. However, G
%can be estimated from the curves,
Rheology of Polymers Near Liquid-Solid Transitions 173
and it can be seen that G%is zero at the gel point and grows with the extent of
reaction, p.Rubbery materials beyond the gel point have been studied extensively.
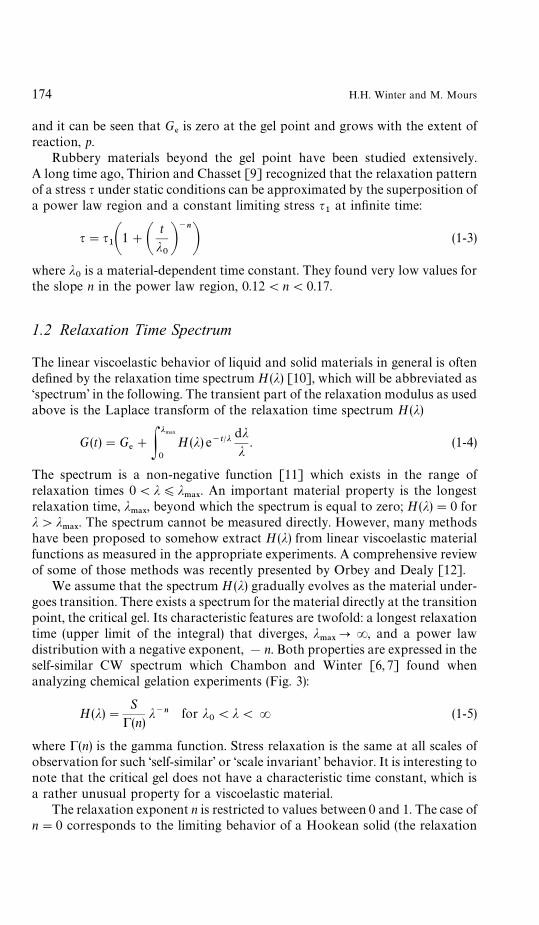
A long time ago, Thirion and Chasset [9] recognized that the relaxation patternof a stress q under static conditions can be approximated by the superposition ofa power law region and a constant limiting stress q
1at infinite time:
q"q1A1#A
t
j0B~n
B (1-3)
where j0
is a material-dependent time constant. They found very low values forthe slope n in the power law region, 0.12(n(0.17.
1.2 Relaxation Time Spectrum
The linear viscoelastic behavior of liquid and solid materials in general is oftendefined by the relaxation time spectrum H(j) [10], which will be abbreviated as‘spectrum’ in the following. The transient part of the relaxation modulus as usedabove is the Laplace transform of the relaxation time spectrum H(j)
G(t)"G%#P
j.!9
0
H (j) e~t@jdjj
. (1-4)
The spectrum is a non-negative function [11] which exists in the range ofrelaxation times 0(j)j
.!9. An important material property is the longest
relaxation time, j.!9
, beyond which the spectrum is equal to zero; H(j)"0 forj'j
.!9. The spectrum cannot be measured directly. However, many methods
have been proposed to somehow extract H(j) from linear viscoelastic materialfunctions as measured in the appropriate experiments. A comprehensive reviewof some of those methods was recently presented by Orbey and Dealy [12].
We assume that the spectrum H (j) gradually evolves as the material under-goes transition. There exists a spectrum for the material directly at the transitionpoint, the critical gel. Its characteristic features are twofold: a longest relaxationtime (upper limit of the integral) that diverges, j
.!9PR, and a power law
distribution with a negative exponent, !n. Both properties are expressed in theself-similar CW spectrum which Chambon and Winter [6, 7] found whenanalyzing chemical gelation experiments (Fig. 3):
H(j)"S
!(n)j~n for j
0(j(R (1-5)
where !(n) is the gamma function. Stress relaxation is the same at all scales ofobservation for such ‘self-similar’ or ‘scale invariant’ behavior. It is interesting tonote that the critical gel does not have a characteristic time constant, which isa rather unusual property for a viscoelastic material.
The relaxation exponent n is restricted to values between 0 and 1. The case ofn"0 corresponds to the limiting behavior of a Hookean solid (the relaxation
174 H.H. Winter and M. Mours

Fig. 3. Schematic of Chambon-Winter gel spectrum. The longest relaxation time diverges toinfinity. The relaxation time j
0marks the crossover to the short-time behavior, which depends on
the material. The depicted case corresponds to a low-molecular-weight precursor (crossover to glasstransition region)
modulus is a constant). The restriction of n to values less than unity is necessaryto assure a diverging zero-shear viscosity at the gel point.
The self-similar spectrum is not valid at short times, j(j0, where the details
of chemical structure become important (glass transition, entanglements, etc.).The cross-over to the glass transition at short times is typical for all polymericmaterials, for both liquids and solids. The critical gel is no exception in thatrespect. j
0could be used as a characteristic time in the CW spectrum since it
somehow characterizes the molecular building block of the critical gel; however,it has no direct relation to the LST. At times shorter than j
0, the LST has no
immediate effect on the rheology. Indirect effects might be seen as a shift in theglass transition, for instance, but these will not be studied here.
1.3 Divergence of Longest Relaxation Time
In the close vicinity of the gel point, Dp#!p D;1, the longest relaxation time
diverges in a power law on both sides of the gel point (Fig. 4)
j.!9
JG(p
#!p)!a
~ for sol, p(p#
(p!p#)!a
` for gel, p'p#.
(1-6)
Rheology of Polymers Near Liquid-Solid Transitions 175

Fig. 4. Schematic of the divergence of the longest relaxation time as the liquid-solid transition isapproached from either side
a~
and a`
are the critical exponents for the sol and the gel. In the sol,j.!9
belongs to the largest cluster. The largest cluster reaches infinite size at thegel point, but it still can relax, and the corresponding j
.!9has become infinitely
large. Beyond the gel point, the relaxable components (for chemical gelation thiswould be the sol fraction, unattached chain ends, long loops, etc.) graduallyincorporate into the permanent network, and j
.!9decays again.
With increasing distance from the gel point, the simplicity of the critical statewill be lost gradually. However, there is a region near the gel point in which thespectrum still is very closely related to the spectrum at the gel point itself,H(j, p
#). The most important difference is the finite longest relaxation time
which cuts off the spectrum. Specific cut-off functions have been proposedby Martin et al. [13] for the spectrum and by Martin et al. [13], Friedrichet al. [14], and Adolf and Martin [15] for the relaxation function G(t, p
#).
Sufficiently close to the gel point, Dp!p#D;1, the specific cut-off function
of the spectrum is of minor importance. The problem becomes interestingfurther away from the gel point. More experimental data are needed for testingthese relations.
It was a most interesting discovery that not only the longest relaxation timediverges at LST, but that all the shorter relaxation modes show a very distinctpattern. The longest mode escapes the measurement near LST while the spec-trum of the shorter modes is still accessible. The intent of this study is to explorethe occurrence of this relaxation time spectrum in a broad range of solidifyingmaterials and in a time or frequency window which is as wide as possible. Theproperties of the self-similar CW spectrum, Eq. 1—5, will be mapped out inSect. 3. The behavior at LST then will serve as a reference state for the analysisof rheological phenomena in the vicinity of LST. This will set the stage forreviewing experimental data from several laboratories. Observations on chem-ical gelation will guide the analysis of various types of LST. The possibility will
176 H.H. Winter and M. Mours
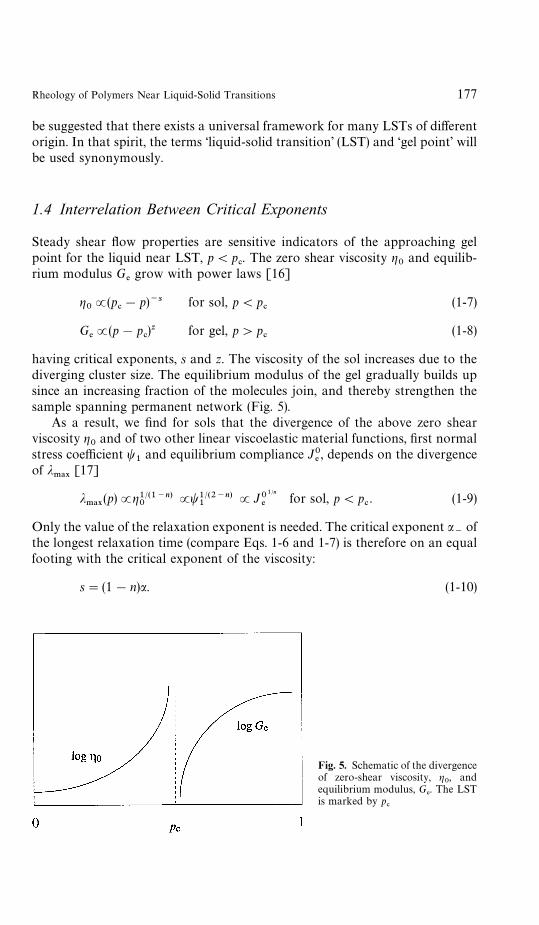
Fig. 5. Schematic of the divergenceof zero-shear viscosity, g
0, and
equilibrium modulus, G%. The LST
is marked by p#
be suggested that there exists a universal framework for many LSTs of differentorigin. In that spirit, the terms ‘liquid-solid transition’ (LST) and ‘gel point’ willbe used synonymously.
1.4 Interrelation Between Critical Exponents
Steady shear flow properties are sensitive indicators of the approaching gelpoint for the liquid near LST, p(p
#. The zero shear viscosity g
0and equilib-
rium modulus G%grow with power laws [16]
g0J(p
#!p)~s for sol, p(p
#(1-7)
G%J(p!p
#)z for gel, p'p
#(1-8)
having critical exponents, s and z. The viscosity of the sol increases due to thediverging cluster size. The equilibrium modulus of the gel gradually builds upsince an increasing fraction of the molecules join, and thereby strengthen thesample spanning permanent network (Fig. 5).
As a result, we find for sols that the divergence of the above zero shearviscosity g
0and of two other linear viscoelastic material functions, first normal
stress coefficient t1
and equilibrium compliance J0%, depends on the divergence
of j.!9
[17]
j.!9
(p)Jg1@(1~n)0
Jt1@(2~n)1
JJ01@n
%for sol, p(p
#. (1-9)
Only the value of the relaxation exponent is needed. The critical exponent a~
ofthe longest relaxation time (compare Eqs. 1-6 and 1-7) is therefore on an equalfooting with the critical exponent of the viscosity:
s"(1!n)a. (1-10)
Rheology of Polymers Near Liquid-Solid Transitions 177

Fig. 6. Evaluation of the longest relaxation time for a sample beyond the gel point, p'p#: intersect
of horizontal line for G%
with the power law of the critical gel, St~n
For the relaxation of the solid near the gel point, the critical gel may serve asa reference state. The long time asymptote of G (t) of the nearly critical gel, theequilibrium modulus G
%, intersects the G(t)"St~n of the critical gel at a charac-
teristic time (Fig. 6) which we will define as the longest relaxation time of thenearly critical gel [18]
G%"(St~n)
t/j.!9Pj
.!9"A
G%(p)
S B~1@n
for gel, p'p#. (1-11)
It obeys the typical characteristics, namely the divergence to infinity as G%goes
to zero (gel point) and the approach of a zero value as G%becomes large. Again,
only the relaxation exponent n is needed for relating the divergence of j.!9
withthat of G
%; compare Eqs. 1-8 and 1-11:
z"na`
for gel, p'p#. (1-12)
The exponents a~
and a`
depend not only on the relaxation exponent n, butalso on the dynamic exponents s and z for the steady shear viscosity of the soland the equilibrium modulus of the gel.
The analysis may be simplified by postulating symmetry of the divergingj.!9
on both sides of the gel point [18]. A power law exponent (see Eq. 1-6)which is the same on both sides,
a"a~"a
`(1-13)
178 H.H. Winter and M. Mours
leads to the interesting relations between critical exponents [13, 18, 19]
n"z/(z#s). (1-14)
a"s#z, (1-15)
s"(1!n)a ; z"na. (1-16)
Only two of the exponents (a and n, for instance) are sufficient to describe therheology of nearly critical gels. The front factor is more difficult to estimate, butit most likely differs on both sides.
These relations will be useful for testing theories, since, except for thesymmetry hypothesis, no specific assumptions were introduced in the derivation.Theory might give an answer about the validity of the above symmetry hypothe-sis. In fact, the theory of Goldbart and Goldenfeld [20] that is based onstatistical mechanics yields Eq. 1-14. However, there does not seem to be an easyway of proving or disproving this hypothesis at this time. The wide range ofvalues for the relaxation exponent, 0(n(1, lets us expect that the dynamicexponents s and z are non-universal as well.
2 Theory of Gelation
This study is mostly concerned with experimental aspects, especially sincea quantitative prediction of the self-similar spectrum (value of critical exponentand prefactor) from first principles seems to be still lacking, although severaltheories predict the evolution of cluster growth during gelation. Excellentreviews of theory have been given by Stauffer et al. [3, 16] and Vilgis [21]. Werefer to these for a deeper study and only highlight several of the theoreticalpredictions in the following.
2.1 Branching Theories
Branching models are based on multifunctional molecules of different typesbetween which covalent bonds are formed to yield a network structure. One ofthe multifunctional molecules is required to carry at least three functionalgroups, while the other one can have two functional groups. The overall extentof reaction, p, equals the a priori probability that any given functional group hascondensed. The earliest of these branching theories was developed by Flory[1, 22] and Stockmayer [2]. Using combinatorial approaches, they derived anexpression for the molecular weight distribution, and subsequently the criticalextent of reaction, p
#, at which the molecular weight diverges, M
8PR (gel
point). Their approach includes several simplifying assumptions which are
Rheology of Polymers Near Liquid-Solid Transitions 179

usually not valid in real systems, i.e. (1) the reactivities of all functional groups ofthe same type are equal and independent of each other, (2) no intramolecularreactions between functional groups on the same cluster (‘loop formation’) areallowed, (3) the crosslinks are randomly formed between any pair of functionalgroups that can form a bond, and (4) point-like monomers are assumed (nosteric hindrance and excluded volume effects). More advanced branchingmodels were developed later. The two most widely used of these are the so-calledrecursive theory [23, 24] and the cascade theory [25—28]. These later models candeal approximately with nonidealities such as cyclization and long-range substi-tution effects. All branching theories are mean field theories and yield the samesimple expression for the critical extent of reaction (for the same chemicalmodel) depending on the geometry of the network. Special cases are:
Case 1. Homopolymerization of similar f-functional molecules:
p#"
1
fM2!1
(2-1)
The same relation is found for the end-linking of molecules of low functionality( f"3 or 4) and for the vulcanization of long molecular chains. The second-moment average number of cross-linking sites along the chain, fM
2, is defined as
fM2"
+f
f 2nf
+f
f nf
(2-2)
with nf"number of molecules of functionality f.
Case 2. Cross-linking of f-functional molecules Af
with g-functional molecu-les B
g, which are mixed at a molar ratio r"+
ffn
Af/+
ggn
Bg
pA,c
"
1
Jr ( fM2!1) (gN
2!1)
(2-3)
with pB"rp
A. The stoichiometric ratio of a sample must be chosen between
a lower and upper critical value
r1"
1
( fM2!1) (gN
2!1)
; r6"
1
r1
(2-4)
otherwise the reaction stops before reaching the gel point. The relations inEq. 2-4 follow from Eq. 2-3 when considering species A
for species B
gfully
reacted, respectively.Experimental results of p
#, r
1, and r
6were found to agree reasonably well
with these predictions despite the inherent assumptions [29—31].
180 H.H. Winter and M. Mours
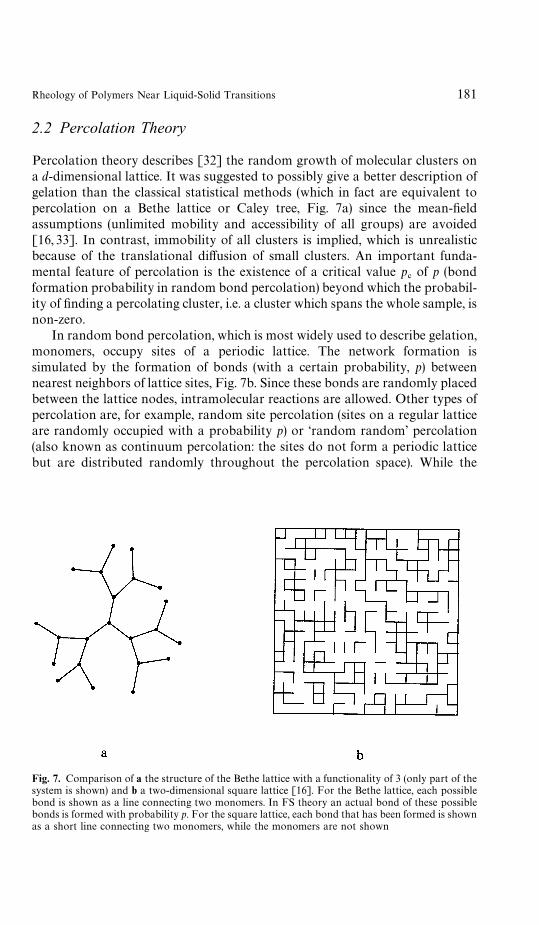
Fig. 7. Comparison of a the structure of the Bethe lattice with a functionality of 3 (only part of thesystem is shown) and b a two-dimensional square lattice [16]. For the Bethe lattice, each possiblebond is shown as a line connecting two monomers. In FS theory an actual bond of these possiblebonds is formed with probability p. For the square lattice, each bond that has been formed is shownas a short line connecting two monomers, while the monomers are not shown
2.2 Percolation Theory
Percolation theory describes [32] the random growth of molecular clusters ona d-dimensional lattice. It was suggested to possibly give a better description ofgelation than the classical statistical methods (which in fact are equivalent topercolation on a Bethe lattice or Caley tree, Fig. 7a) since the mean-fieldassumptions (unlimited mobility and accessibility of all groups) are avoided[16, 33]. In contrast, immobility of all clusters is implied, which is unrealisticbecause of the translational diffusion of small clusters. An important funda-mental feature of percolation is the existence of a critical value p
#of p (bond
formation probability in random bond percolation) beyond which the probabil-ity of finding a percolating cluster, i.e. a cluster which spans the whole sample, isnon-zero.
In random bond percolation, which is most widely used to describe gelation,monomers, occupy sites of a periodic lattice. The network formation issimulated by the formation of bonds (with a certain probability, p) betweennearest neighbors of lattice sites, Fig. 7b. Since these bonds are randomly placedbetween the lattice nodes, intramolecular reactions are allowed. Other types ofpercolation are, for example, random site percolation (sites on a regular latticeare randomly occupied with a probability p) or ‘random random’ percolation(also known as continuum percolation: the sites do not form a periodic latticebut are distributed randomly throughout the percolation space). While the
Rheology of Polymers Near Liquid-Solid Transitions 181

random site percolation is not directly relevant to gelation [16], continuumpercolation is of particular value, since in real systems the cluster-formingmolecules are not distributed regularly in space.
In general, percolation is one of the principal tools to analyze disorderedmedia. It has been used extensively to study, for example, random electricalnetworks, diffusion in disordered media, or phase transitions. Percolationmodels usually require approximate solution methods such as Monte Carlosimulations, series expansions, and phenomenological renormalization [16].While some exact results are known (for the Bethe lattice, for instance), they arevery rare because of the complexity of the problem. Monte Carlo simulationsare very versatile but lack the accuracy of the other methods. The above solutionmethods were employed in determining the critical exponents given in thefollowing section.
2.3 Scaling Near the LST
All theories yield unique scaling relationships for molecular (e.g. mean clustersize, size distribution) and bulk properties (e.g. equilibrium modulus) near thecritical point, but critical exponent values and relations between different criticalexponents are different. This scaling is common for material behavior near anycritical point, i.e. the polymeric material near the gel point exhibits a behavioranalogous, for example, to a fluid near its vapor-liquid critical point. For thecritical gel, weight average molecular weight M
8, typical cluster size R
#)!3, and
gel fraction f'
scale similarly with Dp!p#D as the inverse of the derivative of
osmotic pressure with respect to concentration (Ln/Lc) ~1, correlation length m,and concentration fluctuations *c, respectively, scale with ¹!¹
#in case of
a fluid at the vapor-liquid critical point [3, 34]. The following scaling relation-ships for these static properties are commonly found in the literature [16, 35]:
M8JDp!p
#D~c p(p
#(2-5)
R#)!3
JDp!p#D~l p(p
#(2-6)
f'JDp!p
#Db p'p
#(2-7)
The cluster mass distribution at the gel point scales with the molecular weight ofthose clusters
N(M)JM~q p"p#
(2-8)
To describe the cluster mass distribution in the vicinity of the gel point, a cut-offfunction f (M/M
.!9) is introduced [36] (Fig. 8)
N(M)JM~q f AM
M.!9B (2-9)
182 H.H. Winter and M. Mours
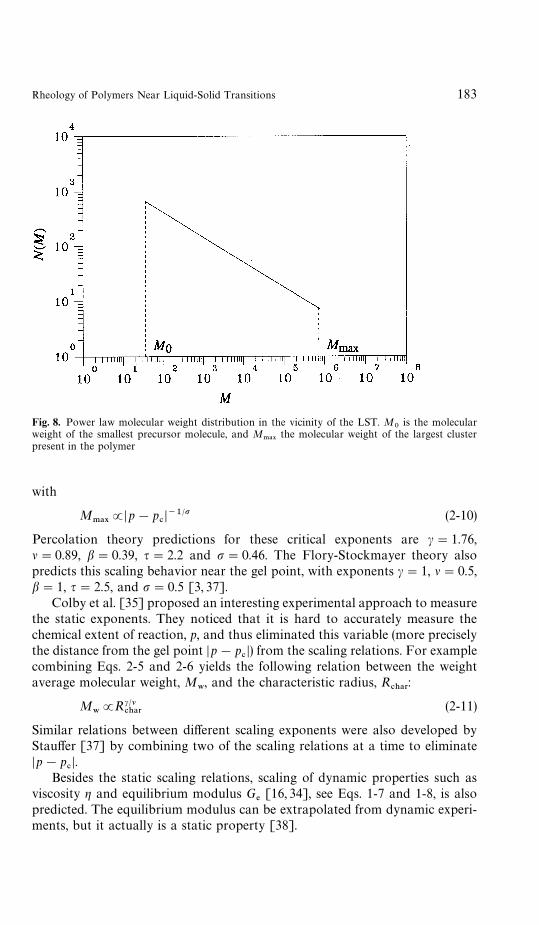
Fig. 8. Power law molecular weight distribution in the vicinity of the LST. M0
is the molecularweight of the smallest precursor molecule, and M
.!9the molecular weight of the largest cluster
present in the polymer
with
M.!9
JDp!p#D~1@p (2-10)
Percolation theory predictions for these critical exponents are c"1.76,l"0.89, b"0.39, q"2.2 and p"0.46. The Flory-Stockmayer theory alsopredicts this scaling behavior near the gel point, with exponents c"1, l"0.5,b"1, q"2.5, and p"0.5 [3, 37].
Colby et al. [35] proposed an interesting experimental approach to measurethe static exponents. They noticed that it is hard to accurately measure thechemical extent of reaction, p, and thus eliminated this variable (more preciselythe distance from the gel point Dp!p
#D) from the scaling relations. For example
combining Eqs. 2-5 and 2-6 yields the following relation between the weightaverage molecular weight, M
8, and the characteristic radius, R
#)!3:
M8JRc@l
#)!3(2-11)
Similar relations between different scaling exponents were also developed byStauffer [37] by combining two of the scaling relations at a time to eliminateDp!p
#D.
Besides the static scaling relations, scaling of dynamic properties such asviscosity g and equilibrium modulus G
%[16, 34], see Eqs. 1-7 and 1-8, is also
predicted. The equilibrium modulus can be extrapolated from dynamic experi-ments, but it actually is a static property [38].
Rheology of Polymers Near Liquid-Solid Transitions 183

The scaling of the relaxation modulus G(t) with time (Eq. 1-1) at the LST wasfirst detected experimentally [5—7]. Subsequently, dynamic scaling based onpercolation theory used the relation between diffusion coefficient and longestrelaxation time of a single cluster to calculate a relaxation time spectrum for thesum of all clusters [39]. This resulted in the same scaling relation for G(t) with anexponent n following Eq. 1-14.
It is interesting to note here that the cluster mass distribution and therelaxation modulus G (t) at the LST scale with cluster mass and with time,respectively, while all other variables (dynamic and static) scale with the distancefrom p
#in the vicinity of the gel point.
The classical theory predicts values for the dynamic exponents of s"0 andz"3. Since s"0, the viscosity diverges at most logarithmically at the gel point.Using Eq. 1-14, a relaxation exponent of n"1 can be attributed to classicaltheory [34]. Dynamic scaling based on percolation theory [34, 40] does notyield unique results for the dynamic exponents as it does for the static expo-nents. Several models can be found that result in different values for n, s and z.These models use either Rouse and Zimm limits of hydrodynamic interactionsor Electrical Network analogies. The following values were reported [34, 39]:(Rouse, no hydrodynamic interactions) n"0.66, s"1.35, and z"2.7, (Zimm,hydrodynamic interactions accounted for) n"1, s"0, and z"2.7, and (Elec-trical Network) n"0.71, s"0.75 and z"1.94.
De Gennes [41] predicted that percolation theory should hold for crosslink-ing of small molecule precursors. However, he argued that for vulcanizingpolymers (high M
8), only a very narrow regime near the gel point exists for
which percolation is valid, i.e. these polymers should exhibit more mean field-like behavior.
2.4 Critical Gel as Fractal Structure
Based on the fractal behavior of the critical gel, which expresses itself in theself-similar relaxation, several different relationships between the critical expo-nent n and the fractal dimension d
&have been proposed recently. The fractal
dimension d&of the polymer cluster is commonly defined by [16, 42]
RJM1@d& (2-12)
where R is the radius of gyration. Assuming hyperscaling d&can be related to the
critical exponents by (not valid for mean field theories) [16, 34]
d&"d!
bv
(2-13)
This results in a value of d&"2.5 for bond percolation on a 3-dimensional
lattice. The fractal dimension of the Bethe lattice (Flory-Stockmayer theory) is
184 H.H. Winter and M. Mours

d&"4 [16], which leads to a physical discrepancy, since any value higher than
3 (dimensionality of the sample) results in the cluster density increasing withcluster size (oJRd&~d) . For d"6 the hyperscaling assumption and mean fieldtheories are compatible, i.e. Eq. 2-13 gives the correct fractal dimension for theclassical theory.
Muthukumar and Winter [42] investigated the behavior of monodispersepolymeric fractals following Rouse chain dynamics, i.e. Gaussian chains (ex-cluded volume fully screened) with fully screened hydrodynamic interactions.They predicted that n and dM
&(the fractal dimension of the polymer if the excluded
volume effect is fully screened) are related by
n"dM&
dM
(2-14)
Hess et al. [43] extended this approach to monodisperse chains with excludedvolume effects (swollen clusters). They realized that, although the linkage pro-cess can be described by percolation, bond percolation does not give a correctpicture of crosslinking between long chains because these chains are flexible,whereas bond percolation theory is based on stiff bonds. Thus, even though theconnectivity of the critical gel may be prescribed by bond percolation theory, thedynamic properties of the object are drastically affected by the replacement ofrigid bonds by flexible chains. Their investigation resulted in the same functionaldependence of n and d
&(the fractal dimension when excluded volume effects are
taken into account):
n"d&
d
(2-15)
where d&and dM
&are related by
dM&"
2d&
d#2!2d&
(2-16)
Muthukumar [44] further investigated the effects of polydispersity, which areimportant for crosslinking systems. He used a hyperscaling relation from per-colation theory to obtain his results. If the excluded volume is not screened, n isrelated to d
&by
n"d&
d
(2-17)
In the case of full screening of excluded volume he obtained
n"d
dM
"
d(d#2!2d&)
2(d#2!d&)
(2-18)
Especially in the latter case, a small change in the fractal dimension can lead toa significant change in n, and he therefore concluded that n can take valuesbetween 0 and 1 (for d
&ranging from 2.5 to 1.25, see Fig. 9).
Rheology of Polymers Near Liquid-Solid Transitions 185

Fig. 9. Relation between relaxation exponent n and fractal dimension d&for a three-dimensional
network. In case of complete screening of excluded volume, values of 0(n(1 are possible if d&is
chosen between 1.25 and 2.5
If only partial screening is present, the fractal dimension takes a valuesomewhere between d
&and dM
&. According to this model, a crosslinker deficiency,
which leads to a more open structure and therefore a lower value of d&, increases
the value of n. Dilution of the precursor with a non-reactive species has the sameeffect on the relaxation exponent.
2.5 The Notion of Topology
Goldbart and Goldenfeld [20] challenged the notion that gelation could bedescribed in terms of the purely geometrical description of percolation theory.They developed a theory based on statistical mechanics arguments. The cross-linking system cannot be uniquely specified by the positions of crosslinks only,as is done in percolation theory. Topology needs to be considered as well. Theyargue that the condition for the liquid-solid transition is a sufficiently complextopology rather than a sufficient degree of connectivity, in contrast to percola-tion, which does not take the contribution of trapped entanglements intoaccount. They define the solid state in terms of a non-vanishing shear modulus(as tPR) and in terms of breaking of the translational invariance of theHamiltonian. This implies that rigidity of the solid state is due to the preferenceof atoms to localize close to certain neighbors in order to minimize the freeenergy of the system rather than due to long range forces, i.e. rigidity is
186 H.H. Winter and M. Mours
a consequence of thermodynamics. Percolation models do not address the ques-tion of how rigidity emerges. The new model is a microscopic theory of theliquid-solid transition based on a physical model of flexible chains and solvent.The transition to the solid state as the crosslink density increases beyond thecritical density is a continuous one, and hence is a second order transition. This israther unusual for liquid-solid transitions, which are usually first order. Thesecond order transition is accompanied by scale invariance, and therefore impliesscaling behavior of the shear modulus as detected by Chambon and Winter [5],but it does so only at the critical point. Goldenfeld and Goldbart [20] developedrelations between scaling exponents z, s, and n for the equilibrium modulus G
%, the
zero-shear viscosity g0, and the complex modulus G(t), respectively, and predict
Eq. 1-14, n"z/(s#z) , from some general arguments. The exponent of theequilibrium modulus is predicted to equal the scaling exponent for the correla-tion length m. However, the theory does not predict any values for these scalingexponents, which makes comparison with experimental data difficult.
2.6 Kinetic Theory (Smoluchowski Equation)
All models described up to here belong to the class of equilibrium theories. Theyhave the advantage of providing structural information on the material duringthe liquid-solid transition. Kinetic theories based on Smoluchowski’s coagula-tion equation [45] have recently been applied more and more to describe thekinetics of gelation. The Smoluchowski equation describes the time evolution ofthe cluster size distribution N(k):
dN(k)
dt"
1
2+
i`j/k
KijN (i)N ( j)!N (k)
=+j/1
Kkj
N ( j) (2-19)
N(k) denotes the number of clusters of size k (i.e. k-mers), and Kij
is the reactionkernel that gives the probability of a cluster of size i reacting with one of size j.The first sum accounts for coalescence of clusters of size i and (k!i) to givea cluster of size k, while the second sum accounts for the loss of clusters of sizek due to binary collisions with other clusters. The Smoluchowski equation isable to describe and distinguish between gelling and non-gelling systems. In theformer, the mean cluster size diverges as t approaches the gel point t
#; in the
latter it keeps increasing with time. Although the equation was originallydeveloped only for irreversible coagulation, it can be easily extended to revers-ible coagulation by adding fragmentation kernels F
ijto describe the unimolecu-
lar fragmentation process [46]:
dN(k)
dt"
1
2+
i`j/k
MKijN (i)N ( j)!F
ijN (k)N
!
=+j/1
MKkj
N(k)N ( j)!Fkj
N (k#j)N (2-20)
Rheology of Polymers Near Liquid-Solid Transitions 187

where Fij
describes the probability of a (i#j) -mer to break up and form andi-mer and a j-mer. Both Equations 2-19 and 2-20 constitute infinite sets ofcoupled non-linear equations which have to be solved for a given initial clustersize distribution N (k, t
0) .
The difficulty is now to determine the functional form of the reaction andfragmentation kernels, K
ijand F
ij. The specific form is determined by the
coagulation mechanism. For gelation processes, usually only the reaction kernelK
ijis considered, i.e. the process is viewed as being irreversible. A variety of
kernels for coagulation processes can be found in the literature [47]. Most ofthese kernels are homogeneous functions of i and j, at least for large i and j. Ernst[47] and Van Dongen and Ernst [48] used two exponents k and l to describethe i and j dependence of K
ij"K(i, j):
K(ai, aj)"a"K (i, j)"a"K(j, i) (2-21a)
K(i, j)Jik jl (2-21b)
with j<1 and j"k#l. Two physical restrictions exist on the exponents k andl, because the reaction rate cannot increase faster than the cluster size:""k#l)2 and l)1. " characterizes the reaction rate of two large inter-penetrable clusters, i.e. K( j, j )Jjk`l, and l describes the reaction of a largecluster with a very small cluster, i.e. K (1, j)Jjl. Furthermore, " also decideswhether the Smoluchowski equation describes aggregation or gelation, i.e. theformation of an infinite cluster in finite time only occurs if "'1.
Three growth classes are usually distinguished. These are class I with k'0,class II with k"0 and class III with k(0. In the case of class I, growthinteractions between two large clusters are dominant. Class I growth candescribe both aggregating and gelling systems. For gelation, l)1(")2. Thecluster distribution decays as N (k)Jk~q with q"1
2("#3)'2. Also, near the
gel point, the weight average mass defined as M8"+k2N(k)/+ kN(k) diverges
as M8JDt!t
#D~c with c"(3!")/("!1), the typical cluster mass (the
z-average mass, M;"+k3N(k)/+ k2N (k)) diverges as M
;JDt!t
#D~1@p with
p"("!1)/2, and the gel fraction diverges as f'JDt!t
#Db with b"1 [49].
These scaling equations correspond to Eqs. 2-8, 2-5, 2-10, and 2-7, respectively,as presented earlier in this Section. If one uses the Flory-Stockmayer gelationtheory, the reaction kernel equals K
ij"ij, since all sites on a cluster are assumed
to be equally reactive [50]. This is a typical example of a homogeneous kernelwhich gives class I growth. The exponents are therefore k"1 and l"1,resulting in ""2. This results in scaling exponents q"2.5, c"1, p"0.5, andb"1, which are also predicted by the FS-theory (see section 2.1.).
In class II growth, the large-large (class I) and small-large (class III) interac-tions are equal. Since k"0, it follows that l"". Because of the restriction onl(l)1) and the requirement of "'1 for gelation this class can only describenon-gelling growth. Interactions between small and large clusters govern classIII growth. From k(0, it follows that l'", i.e. class III growth is defined by"(l)1. Like class II growth, it can only describe aggregation.
188 H.H. Winter and M. Mours
2.7 Computer Simulations
Alternatively, Leung and Eichinger [51] proposed a computer simulation ap-proach which does not assume any lattice as the classical and percolationtheory. Their simulations are more realistic than lattice percolation, sincespatially closer groups form bonds first and more distant groups at later stagesof network formation. However, the implicitly introduced diffusion control issomewhat obscure. The effects of intramolecular reactions were more realisti-cally quantified, and the results agree quite well with experimental observations[52, 53].
3 Viscoelastic Properties at and around the Liquid-Solid Transition
3.1 Linear Viscoelasticity of Liquids and Solids
The time-dependent rheological behavior of liquids and solids in general isdescribed by the classical framework of linear viscoelasticity [10, 54]. The stresstensor q may be expressed in terms of the relaxation modulus G(t) and the strainhistory:
q(t)"Pt
~=
LG(t!t@)Lt@
C~1 (t; t@) dt@ (3-1)
or, alternatively:
q(t)"!Pt
~=
G (t!t@)LC~1 (t; t@)
Lt@dt@ . (3-2)
The relaxation modulus is often expressed with the relaxation time spectrum,Eq. 1-4:
q(t)"G%C~1(t; t
0)#P
t
~=P
j.!9
0
H(j) e~(t~t{)@jdjj2
C~1(t; t@) dt@ (3-3)
Here we describe the strain history with the Finger strain tensor C~1(t;t@) asproposed by Lodge [55] in his rubber-like liquid theory. This equation wasfound to describe the stress in deforming polymer melts as long as the strains aresmall (second strain invariant below about 3 [56] ). The permanent contributionG
%C~1(t; t
0) has to be added for a linear viscoelastic solid only. C~1(t; t
0) is the
strain between the stress free state t0
and the instantaneous state t. Other strainmeasures or a combination of strain tensors, as discussed in detail by Larson[57], might also be appropriate and will be considered in future studies.A combination of Finger C~1(t; t@) and Cauchy C(t; t@) strain tensors is known toexpress the finite second normal stress difference in shear, for instance.
Rheology of Polymers Near Liquid-Solid Transitions 189

1Our first two critical gels had an exponent value of n+0.5, which made us believe initially that thiswould be the only possible value
The stress q is more difficult to model for a material which is deforming whilesolidifying. A crosslinking polymer, for instance, constantly introduces newcrosslinks even during relaxation processes. Molecules or segments of moleculesgradually lose their mobility, since the crosslinking locks them into their relativepositions with neighboring molecules. As a starting point, we consider materialsfor which the crosslinking reaction has been stopped or slowed down so severelythat they may be treated as chemically stable during a rheological experiment.This quasi-stability will be explained further in Sect. 6.2.
3.2 Viscoelastic Material Functions of Critical Gels
We expect that the classical framework of linear viscoelasticity also applies atthe gel point. The relaxation spectrum for the critical gel is known and can beinserted into Eq. 3-3. The resulting constitutive equation will be explored ina separate section (Sect. 4). Here we are mostly concerned about the materialparameters which govern the wide variety of critical gels.
The linear viscoelastic behavior of the critical gel, as defined in Eqs. 1-1 and1-5, depends on two material parameters, the relaxation exponent n and thefront factor S. Depending on their values, the critical gel is more soft or morestiff. The relaxation exponent strongly depends on molecular and structuraldetails which affect the development of long range connectivity. These aremolecular weight of the precursor, stoichiometric ratio, amount and molecularweight of inert diluent in the material, and bulkiness of the crosslinks (fillereffect). The relaxation exponent does not have a universal value, as one mightexpect for a property at a critical point.1 The critical gel is generally very softand fragile when the relaxation exponent is large, nP1, and the front factor S issmall. Stiff critical gels have a small n value (nP0) and a large S. For manysystems, the front factor is not independent, but depends on the relaxationexponent
S"G0jn0, (3-4)
where G0
and j0
are the plateau modulus of the fully crosslinked material andthe characteristic time of the precursor molecule (building block of the gel),respectively [58, 59]. This ensures a soft gel for nP1 and a stiff gel for nP0.Figure 10 shows data of S and n measured by Izuka et al. [59] on polycaprolac-tone critical gels with different stoichiometric ratios. The dashed line connectsthe modulus of the fully crosslinked material and the zero-shear viscosity of theprecursor, which is in the order of G
0j0.
The gel stiffness, S, was also found to depend on the molecular weight of thepolymer precursor. For end-linking PDMS, S decreases with increasing
190 H.H. Winter and M. Mours
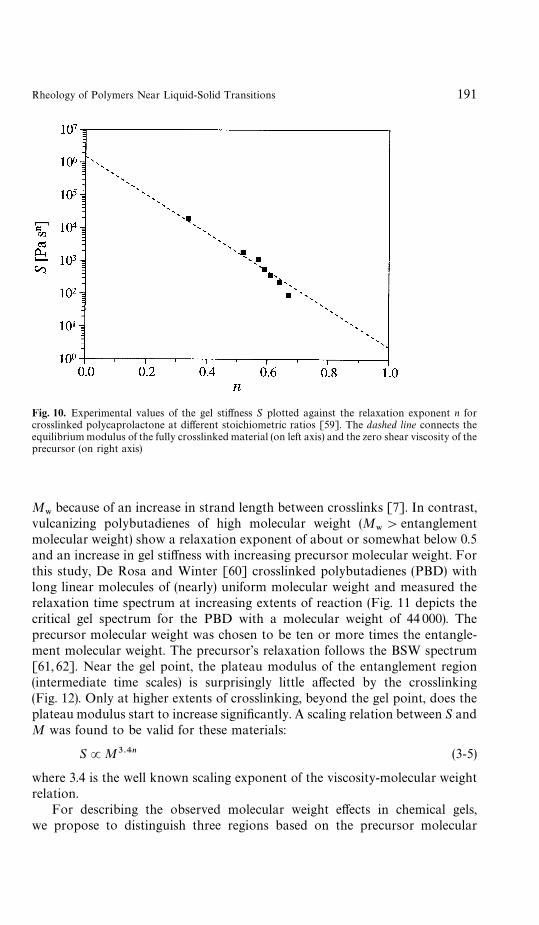
Fig. 10. Experimental values of the gel stiffness S plotted against the relaxation exponent n forcrosslinked polycaprolactone at different stoichiometric ratios [59]. The dashed line connects theequilibrium modulus of the fully crosslinked material (on left axis) and the zero shear viscosity of theprecursor (on right axis)
M8
because of an increase in strand length between crosslinks [7]. In contrast,vulcanizing polybutadienes of high molecular weight (M
8'entanglement
molecular weight) show a relaxation exponent of about or somewhat below 0.5and an increase in gel stiffness with increasing precursor molecular weight. Forthis study, De Rosa and Winter [60] crosslinked polybutadienes (PBD) withlong linear molecules of (nearly) uniform molecular weight and measured therelaxation time spectrum at increasing extents of reaction (Fig. 11 depicts thecritical gel spectrum for the PBD with a molecular weight of 44 000). Theprecursor molecular weight was chosen to be ten or more times the entangle-ment molecular weight. The precursor’s relaxation follows the BSW spectrum[61, 62]. Near the gel point, the plateau modulus of the entanglement region(intermediate time scales) is surprisingly little affected by the crosslinking(Fig. 12). Only at higher extents of crosslinking, beyond the gel point, does theplateau modulus start to increase significantly. A scaling relation between S andM was found to be valid for these materials:
SJM3.4n (3-5)
where 3.4 is the well known scaling exponent of the viscosity-molecular weightrelation.
For describing the observed molecular weight effects in chemical gels,we propose to distinguish three regions based on the precursor molecular
Rheology of Polymers Near Liquid-Solid Transitions 191
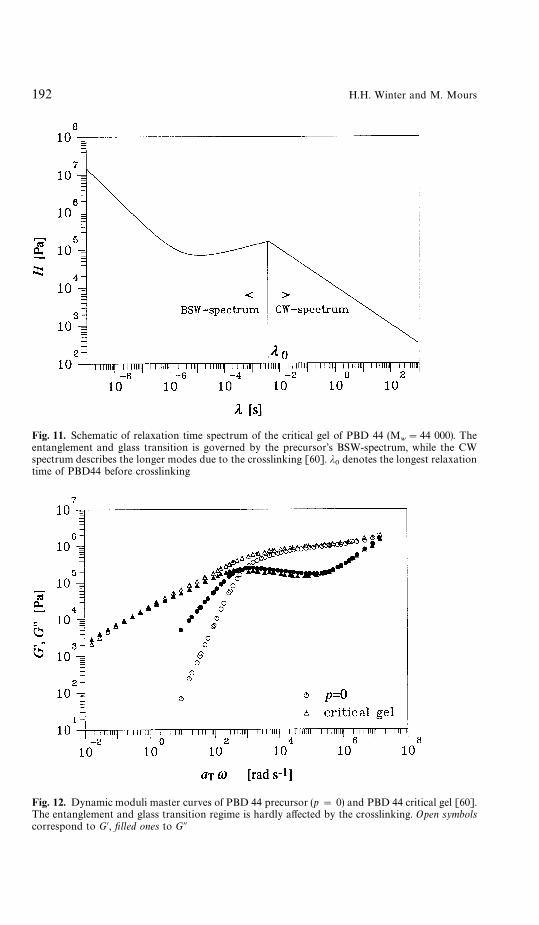
Fig. 11. Schematic of relaxation time spectrum of the critical gel of PBD 44 (Mw"44 000). The
entanglement and glass transition is governed by the precursor’s BSW-spectrum, while the CWspectrum describes the longer modes due to the crosslinking [60]. j
0denotes the longest relaxation
time of PBD44 before crosslinking
Fig. 12. Dynamic moduli master curves of PBD 44 precursor (p" 0) and PBD 44 critical gel [60].The entanglement and glass transition regime is hardly affected by the crosslinking. Open symbolscorrespond to G@, filled ones to GA
192 H.H. Winter and M. Mours

weight M:
1. Low molecular weight M: M(MGAUSS
: n+0.7—0.82. Intermediate molecular weight: M
GAUSS(M(M
%: n+0.4—0.7
3. High molecular weight: M'M%: n+0.4—0.5.
MGAUSS
is the molecular weight above which chains show Gaussian behavior.Very short chains, M(M
GAUSS, associate into molecular clusters with non-
Gaussian building blocks, and the resulting critical gel is very stiff. Extensivedata have been reported in the literature on these systems [38, 39, 63, 64].Intermediate molecular weight precursors, M
GAUSS(M(M
%, already give
much lower relaxation exponents [5—7, 18, 58, 65]. The lowering of the relax-ation exponent has been attributed to screening of excluded volume andhydrodynamic interaction [44].
Deficiency of cross-linker molecules (off-balancing of stoichoimetry) wasfound to increase the relaxation exponent value [7, 65, 66]. The gel becomesmore ‘lossy’, and stress relaxation is accelerated. Adding of a non-reacting lowmolecular weight solvent also increases the relaxation exponent [58, 65], even inphysical gels [67]. Both effects have been attributed to screening [44, 65].
On the other hand, ‘bulky’ crosslinks as developed during the crystallizationof polymer melts (no solvent) lower the relaxation exponent. The lowest valuesof n which we have been able to generate so far occurred with physical gels inwhich the crosslinks consisted of large crystalline regions [68, 69].
This regular pattern in the relaxation exponent has been recognized fora wide range of chemically and physically gelling systems. The full range of gelproperties should be explored further and should be utilized technically. Themolecular or structural origin of these variations is not yet known to the extentwhere quantitative predictions could be derived from first principles. Froma practical point of view, it is advantageous that the relaxation exponent isnon-universal, since it allows us to prepare nearly critical gels with a wide rangeof properties as needed for specific applications.
3.3 Viscoelastic Material Functions Near LST
The simplest expression incorporating the basic features of self-similarity andcut-off for nearly critical gels has the spectrum of the critical gel altered bya cut-off at the longest time [19]:
H(j, p)"GS
!(n)j~n for j
0(j(j
.!9(p)
0 for j'j.!9
(p)
, (3-6)
The same form of self-similar spectrum will be applied to the sol and thetransient part of the gel. The consequences of this most simple spectrum will be
Rheology of Polymers Near Liquid-Solid Transitions 193

explored in the following. Introducing Eq. 3-6 into the equation for the relax-ation modulus, Eq. 1-4, gives
G(t)"G%(p)#
S
!(n) Pj.!9(p)
0
j~ne~t@jdjj
(3-7)
The diverging longest relaxation time, Eq. 1-6, sets the upper limit of theintegral. The solid (gel) contribution is represented by G
%. The crossover to any
specific short-time behavior for j(j0
is neglected here, since we are mostlyconcerned with the long-time behavior.
We can also calculate other viscoelastic properties in the limit of low shearrate (linear viscoelastic limit) near the LST. The above simple spectrum can beintegrated to obtain the zero shear viscosity g
0, the first normal stress coefficient
t1
at vanishing shear rate, and the equilibrium compliance J0%:
g0(p)"P
j.!9
0
H(j) dj"Sj1~n
.!9(1!n)!(n)
, (3-8)
t1(p)"2P
j.!9
0
H (j)jdj"2Sj2~n
.!9(2!n)!(n)
, (3-9)
J0%"
t1
2g20
"
!(n)
S
(n!1)2
2!njn.!9
. (3-10)
This most simple model for the relaxation time spectrum of materials near theliquid-solid transition is good for relating critical exponents (see Eq. 1-9), but itcannot be considered quantitatively correct. A detailed study of the evolution ofthe relaxation time spectrum from liquid to solid state is in progress [70].Preliminary results on vulcanizing polybutadienes indicate that the relaxationspectrum near the gel point is more complex than the simple spectrum presentedin Eq. 3-6. In particular, the relation exponent n is not independent of the extentof reaction but decreases with increasing p.
4 Constitutive Modeling with the Critical Gel Equation
4.1 The Critical Gel Equation
Predictions using the observed relaxation time spectrum at the gel point areconsistent with further experimental observations. Such predictions requirea constitutive equation, which now is available. Insertion of the CW spectrum,Eq. 1-5, into the equation for the stress, Eq. 3-1, results in the linear viscoelasticconstitutive equation of critical gels, called the ‘critical gel equation’
s(t)"nSPt
~=
(t!t@)~(n`1) C~1(t; t@ ) dt@ at p"p#. (4-1)
194 H.H. Winter and M. Mours
It may alternatively be expressed with the rate of strain tensor LC~1t
(t; t@)/Lt@
s(t)"!SPt
~=
(t!t@)~nLLt@
C~1 (t; t@) dt@ at p"p#. (4-2)
The cross-over to the glass at short times (or to other short-time behavior) isneglected here, which is justified as long as we only try to predict the long-timebehavior, which is most affected by the solidification process.
The critical gel equation is expected to predict material functions in anysmall-strain viscoelastic experiment. The definition of ‘small’ varies from mater-ial to material. Venkataraman and Winter [71] explored the strain limit forcrosslinking polydimethylsiloxanes and found an upper shear strain of about 2,beyond which the gel started to rupture. For percolating suspensions andphysical gels which form a stiff skeleton structure, this strain limit would beorders of magnitude smaller.
4.2 Linear Viscoelastic Modeling of Critical Gels
With the gel equation, we can conveniently compute the consequences of theself-similar spectrum and later compare to experimental observations. Thematerial behaves somehow in between a liquid and a solid. It does not qualify assolid since it cannot sustain a constant stress in the absence of motion. However,it is not acceptable as a liquid either, since it cannot reach a constant stress inshear flow at constant rate. We will examine the properties of the gel equationby modeling two selected shear flow examples. In shear flow, the Finger straintensor reduces to a simple matrix with a shear component
(C~1)12"c(t; t@) (4-3)
and a difference on the diagonal
(C~1)11!(C~1)
22"(c(t; t@))2 , (4-4)
where
c(t; t@)"Pt
t{
cR (t@@) dt@@ (4-5)
is the shear strain between times t@ and t. These components are inserted intoEq. 4-1 for calculating the shear stress and the first normal stress difference:
(a) Startup of shear flow at constant rate. An experiment is considered inwhich the material is initially kept at rest, cR"0, so that it can equilibratecompletely. Starting at time t"0, a constant shear rate cR
0is imposed. The
resulting shear stress and normal stresses depend on the time of shearing. Theshear stress response q
21(t) of the critical gel is predicted as
q21
(t)"cR0SP
t
0
(t!t@ )~n dt@"1
1!ncR0St1~n . (4-6)
Rheology of Polymers Near Liquid-Solid Transitions 195

Fig. 13. Shear stress q12
and first normal stress difference N1
during start-up of shear flow atconstant rate, cR
0"0.5 s~1, for PDMS near the gel point [71]. The broken line with a slope of one is
predicted by the gel equation for finite strain. The critical strain for network rupture is reached at thepoint at which the shear stress attains its maximum value
The transient viscosity g"q21
(t)/cR0
diverges gradually without ever reachingsteady shear flow conditions. This clarifies the type of singularity which theviscosity exhibits at the LST: The steady shear viscosity is undefined at LST,since the infinitely long relaxation time of the critical gel would require aninfinitely long start-up time.
The corresponding first normal stress difference N1(t)"q
11(t)!q
22(t) as
predicted from Eq. 4-2
N1(t)"nSP
t
~=
(t!t@)~(n`1) c (t; t@)2 dt@"2
2!nScR 2
0t2~n (4-7)
also grows with time without ever reaching a steady value. The ratio of firstnormal stress coefficient and viscosity
N1
cR 20
cR0
q21
"
2(1!n)
2!nt (4-8)
grows linearly with time. The relaxation exponent n solely determines the slopewhile the front factor cancels out. In experimental studies, the linear growth canbe used as a convenient reference for finding the limits of linear response in thistransient shear experiment (Fig. 13).
196 H.H. Winter and M. Mours

(b) Oscillatory shear. In a frequently used experiment, the sample is sub-jected to oscillatory shear at small amplitude c
0. Prescribing a sinusoidal shear
strain c(t) with an angular frequency, u"2nf [rad/s], which is defined by thenumber of cycles per time given by the frequency f [Hz],
c(t)"c0
sin(ut) (4-9)
in Eq. 4-2 and determining the resulting shear stress
q21
(t)"G@(u) c0sin(ut)#GA (u)c
0cos(ut) (4-10)
results in the following functional form of the dynamic moduli [10], the storagemodulus G@ and the loss modulus GA, at the gel point
G@#(u)"
GA#(u)
tan(nn/2)"S!(1!n) cos(nn/2)un
for 0(u(1/j0, p"p
#. (4-11)
Since G@ and GA are proportional to each other, the famous Cole—Cole plots [72]in which gA(u) is plotted vs. g@(u) [or G@(u) is plotted vs. GA(u)] reduce to straightlines at the gel point.
The ratio of the two moduli is independent of frequency (Fig. 14)
tan d#"
GA#
G@#
"tannn2
for 0(u(1/j0, p"p
#. (4-12)
which means that the ‘flat’ phase angle is a direct measure of the relaxationexponent [7]:
n"2d
#n
for 0(u(1/j0, p"p
#. (4-13)
Related material functions are the complex modulus
G*(u)"S!(1!n)un (4-14)
and the storage and loss compliance, J@(u) and J@@(u)
J@(u)"G@
G@2#G@@2"
cos nn/2
S!(1!n)u~n (4-15)
J@@(u)"G@@
G@2#G@@2"
sin nn/2
S!(1!n)u~n (4-16)
(c) Creep and recovery behavior. Similar is the modeling procedure for thestrain in a creep experiment. The most simple creep recovery experiment
Rheology of Polymers Near Liquid-Solid Transitions 197
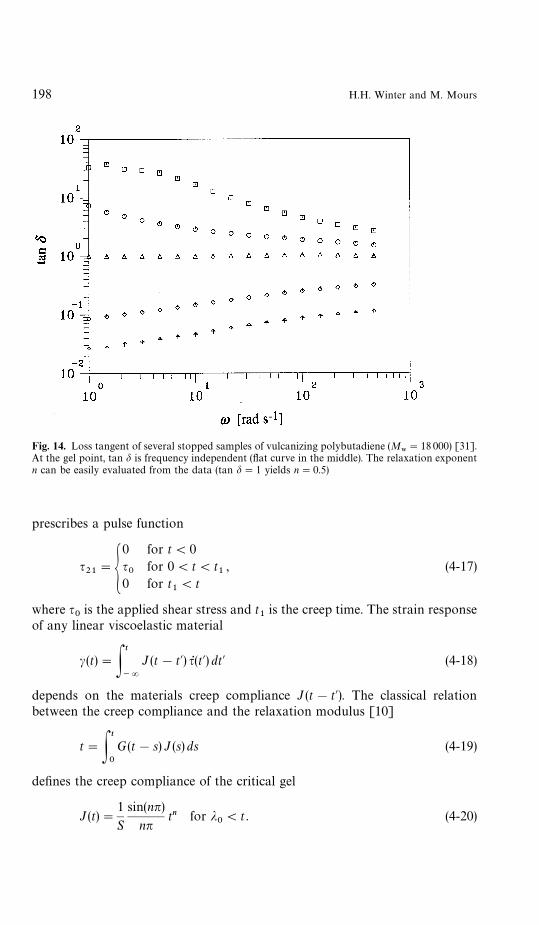
Fig. 14. Loss tangent of several stopped samples of vulcanizing polybutadiene (M8"18 000) [31].
At the gel point, tan d is frequency independent (flat curve in the middle). The relaxation exponentn can be easily evaluated from the data (tan d"1 yields n"0.5)
prescribes a pulse function
q21"G
0 for t(0q0
for 0(t(t1
0 for t1(t
, (4-17)
where q0
is the applied shear stress and t1
is the creep time. The strain responseof any linear viscoelastic material
c(t)"Pt
~=
J (t!t@) qR (t@) dt@ (4-18)
depends on the materials creep compliance J (t!t@). The classical relationbetween the creep compliance and the relaxation modulus [10]
t"Pt
0
G(t!s)J (s) ds (4-19)
defines the creep compliance of the critical gel
J(t)"1
S
sin(nn)
nntn for j
0(t . (4-20)
198 H.H. Winter and M. Mours

Fig. 15. Measured shear strain during creep under a constant shear stress and viscoelastic recoveryafter cessation of shear for PDMS near the gel point [71] plotted against the time. The solid lines arepredicted by the gel equation for finite strain
The shear strain response has an analytical solution
c(t)"q0S
sin(nn)
nn(tn!(t!t
1)n h(1!t/t
1)) for t'0. (4-21)
h(x) is the Heaviside step function. It can be seen that neither the creep strain northe strain rate will ever reach a steady value in finite times. When removing thestress, a complete recovery (c
="0) is predicted for infinite times. This again is
an example for the intermediate behavior between that of a liquid and a solid(Fig. 15).
(d) Retardation ¹ime Spectrum. The relaxation behavior of critical gels canbe represented equally well by the retardation time spectrum ¸(j) [73]. Both arerelated by
¸(j)H(j)"AA1
H (j) P=
0
H(u)
j/u!1
du
u B2#n2B
~1(4-22)
We determine the long time end of the retardation spectrum by approximatingEq. 1-5 with
H(j)"S
! (n)j~n for 0(j(R (4-23)
Rheology of Polymers Near Liquid-Solid Transitions 199
due to lack of better information in the time range 0(j(j0. Inserting Eq. 4-23
into Gross’s relation, Eq. 4-22, leads to
¸(j)"!(n)
S
sin2(nn)
n2jn for j
0(j(R (4-24)
We assume that the above solution is valid in about the same time range as theself-similar relaxation time spectrum, Eq. 1-5. The retardation time spectrum isalso self-similar. It is characterized by its positive exponent n which takes on thesame value as in the relaxation time spectrum.
5 Physical Gelation
The long range connectivity in the solidifying material may arise from physicalphenomena instead of from chemical bonds. This process has been termedphysical gelation. The large scale connectivity is meant in the sense that themotion of one molecule requires the motion of another molecule at considerabledistance. This distance, called correlation length, increases with the advance-ment of the physical gelation process. The state at which the correlation lengthdiverges defines the physical gel point. It is more difficult to define this gel pointsince in comparison with chemically crosslinking systems two of the mostdistinct criteria are missing: the molecular weight does not diverge and thesystem may be dissolved even after having passed the gel point.
At the beginning of the gelation process, more bonds are formed than arebroken or dissolved. As a consequence, connectivity and correlation length growin the material. However, this process cannot continue for long since the clustersize has a natural upper limit. This can be visualized by a simple argument. Letus consider a molecular cluster of N physical bonds with characteristic lifetime,j". The average lifetime of this cluster is then j
"/N and the survival probability is
exp(!tN/j"). As the cluster grows (increasing N), its survival probability
decreases. The limit is reached at a maximum average cluster size, N.!9
, at whichthe rate of bond breakage reaches the rate of bond formation. The characteristictime constant is then
j1'"
j"
N.!9
(5-1)
where the subscript pg stands for physical gel. The material has a correspondinglongest relaxation time, j
.!9. Early stages of cluster growth are governed by
relaxation processes with a longest relaxation time which grows with theincreasing connectivity. If j
.!9exceeds j
1', then the cluster does not survive the
relaxation process; stress is released by breakage of clusters. This type ofrelaxation process has been studied by Cates [74, 75].
200 H.H. Winter and M. Mours
We define a physical gel as a material which shows the gelation transitionand has a j
.!9after gelation which is orders of magnitude larger than before
gelation. The characteristic equations at the gel point, Eqs. 1-1 and 1-5, need tobe rewritten for a range of applicability j
0(j(j
1'. The critical gel equation,
Eq. 4-1, also needs to be rewritten to accommodate this upper limit. The mostsimple way to do this is by inserting Eq. 1-5 with modified upper limit (Rchanged to j
1') into Eq. 3-3:
q(t)"nSPt
~=G!(n#1, (t!t@)/j
1')
!(n#1) H (t!t@)~(n`1) C~1(t; t@) dt@ (5-2)
where !(n#1, (t!t@)/j1'
) is an incomplete gamma function which is defined as
!(n#1, x)"P=
x
ezzn dz (5-3)
Strictly speaking, the physical gel at the gel point is still a liquid when observedat experimental times t
1which exceeds j
1'. We therefore define a new dimen-
sionless group, the gel number N'
N'"
j1't1
"
lifetime of physical cluster
process time(5-4)
The gelation transition is observable for N''10. Otherwise, the material
behaves as a liquid (N'(1). Little is known about materials near N
'"1. For
the following, we consider only materials with N'<1 and treat them just like
chemical gels. The expression !(n#1, (t!t@)/j1'
)/!(n#1) in Eq. 5-2 ap-proaches a value of one in this case of N
'<1, and the critical gel equation,
Eq. 4-1, is recovered. However, much work is needed to understand the roleof non-permanent physical clusters on network formation and rheologicalproperties.
The closest relation to chemical gelation is found with physical networksystems in which the network junctions originate from some physical mecha-nism such as crystallization, phase separation, ionic bonds, or specific geometriccomplexes. Such systems have been reviewed recently by the Nijenhuis [76] andKeller [77]. Physical networks have the potential advantage that the junctionsopen or close when altering the environment (temperature, pressure, pH), i.e. thegelation process is reversible. The junctions, however, are less well-defined sincetheir size and functionality (number of network strands which form a junction)varies throughout a sample. Their finite lifetime makes physical gels fluid-like inlong-time applications, but it also allows them to heal if they get broken. Thereversibility of junctions (and therefore connectivity) upon change of the envi-ronment in a physical gel is a characteristic feature which distinguishes it, forinstance, from a highly entangled polymer melt or solution.
Beyond the notion of physical networks in which flexible strands are connec-ted by junctions, we will use the term ‘physical gelation’ in the widest possiblesense for polymeric systems which undergo liquid-solid transition due to any
Rheology of Polymers Near Liquid-Solid Transitions 201

type of physical mechanism which is able to connect the polymer into large scalestructures. These are quite manifold:(a) Polymers lose their chain flexibility near their glass transition temperature
and molecular motion correlates over longer and longer distances.(b) Liquid crystalline polymers at their transition from nematic to smectic state
gradually lose their molecular mobility.(c) Suspensions in which the filler particles aggregate into sample spanning
complexes.The liquid-solid transition for these systems seems to have the same features
as for chemical gelation, namely divergence of the longest relaxation time andpower law spectrum with negative exponent.
Physical gelation responds strongly to stress or strain. The rate of bondformation, and therefore the growth rate of the correlation length, increases forsome systems (increased rate of crystallization in semi-crystalline polymers;stress induced phase separation in block copolymers), but it also might decreaseif the survival time of physical bonds is reduced by stress. Beyond the gel point,i.e. if the material is able to form sample spanning clusters which are character-ized by multiple connectivity, physical gels are prone to creep under stress sincebonds dissociate at a material-characteristic rate. This allows local relaxation ofstress and reformation of physical bonds at reduced stress. In this case, breakageof a bond does not necessarily result in a reduction of the size of a cluster. Also, ifstress is applied, the average lifetime of a bond, j
", decreases because of the
energy input. This results in a reduction of j1'
, which causes a reduction of theassociated longest relaxation time, j
.!9.
5.1 Physical Network Systems
Physical network systems, especially crystallizing polymers, represent the mostwidely investigated physically crosslinking macromolecular systems [68, 69,78—81]. These systems comprise polymer melts and solutions in which networkjunctions are formed by small crystalline regions during the liquid-solidtransition after cooling below the relevant melting temperature. The kinetics ofthis crystallization process depend on the degree of supercooling, *¹, andrheological properties are also influenced by *¹. A typical temperature profilefor a crystallization experiment and the resulting evolution of fraction ofcrystalline polymer and dynamic moduli with time are shown schematically inFig. 16. Although most crystallizing polymers exhibit the self-similar relaxationbehavior at an intermediate state (Fig. 17 shows tan d at different times aftercooling below ¹
.for a crystallizing polypropylene [68]), as commonly found in
chemically crosslinking systems at the gel point, some systems showed no suchpower law relaxation at certain degrees of supercooling. This was attributed tonon-uniform crystallization, which does not result in self-similar relaxation [69].Also, the presence of melt state phase separation and residual high meltingcrystals can mask this characteristic relaxation pattern [68]. One of the
202 H.H. Winter and M. Mours

Fig. 16. Schematic of a typical temperature profile in a crystallization experiment and the resultingevolution of the fraction of crystalline polymer and dynamic moduli with time. The preheatingtemperature ¹
1is above the melting temperature ¹
.
Fig. 17. Loss tangent of a crystallizing polypropylene at different times after cooling from¹"100 °C to ¹"40 °C (below ¹
.%-5). Data from Lin et al. [68].
Rheology of Polymers Near Liquid-Solid Transitions 203
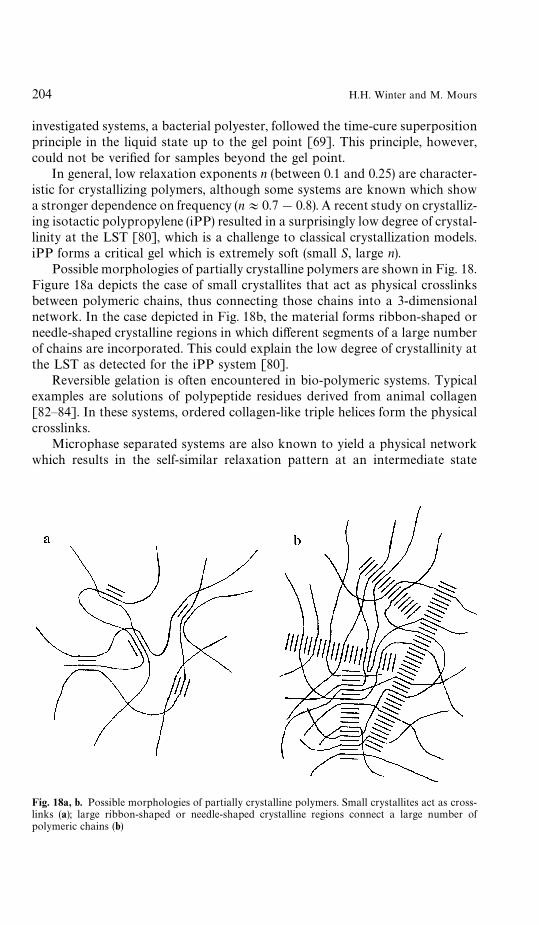
Fig. 18a, b. Possible morphologies of partially crystalline polymers. Small crystallites act as cross-links (a); large ribbon-shaped or needle-shaped crystalline regions connect a large number ofpolymeric chains (b)
investigated systems, a bacterial polyester, followed the time-cure superpositionprinciple in the liquid state up to the gel point [69]. This principle, however,could not be verified for samples beyond the gel point.
In general, low relaxation exponents n (between 0.1 and 0.25) are character-istic for crystallizing polymers, although some systems are known which showa stronger dependence on frequency (n+0.7!0.8). A recent study on crystalliz-ing isotactic polypropylene (iPP) resulted in a surprisingly low degree of crystal-linity at the LST [80], which is a challenge to classical crystallization models.iPP forms a critical gel which is extremely soft (small S, large n).
Possible morphologies of partially crystalline polymers are shown in Fig. 18.Figure 18a depicts the case of small crystallites that act as physical crosslinksbetween polymeric chains, thus connecting those chains into a 3-dimensionalnetwork. In the case depicted in Fig. 18b, the material forms ribbon-shaped orneedle-shaped crystalline regions in which different segments of a large numberof chains are incorporated. This could explain the low degree of crystallinity atthe LST as detected for the iPP system [80].
Reversible gelation is often encountered in bio-polymeric systems. Typicalexamples are solutions of polypeptide residues derived from animal collagen[82—84]. In these systems, ordered collagen-like triple helices form the physicalcrosslinks.
Microphase separated systems are also known to yield a physical networkwhich results in the self-similar relaxation pattern at an intermediate state
204 H.H. Winter and M. Mours

corresponding to the LST. Examples in which such behavior was observed area segmented polyurethane elastomer with liquid crystalline hard segments (inwhich the phase-separated submicron mesophase acts as a provider of crosslinksbelow the isotropization temperature of the mesophase [85]) and several dib-lock and triblock copolymers with microphase separation below the ODTtemperature [86, 87]. A styrene-isoprene-styrene triblock copolymer system,for example, showed rapid microphase separation after cooling below theODT temperature, while the large scale spatial order, resulting in a physicalnetwork, needed long annealing times. It was recently suggested that thedisappearance of a terminal zone behavior, as encountered in block copolymersbelow the ODT temperature, is generally true for any polymer with layeredstructure [87].
Recently, it was shown that polydimethylcarbosiloxanes with a small con-tent of side carbonyl groups (PDMS-C) exhibit increasing viscosity and forma-tion of a physical network at elevated temperatures [88, 89]. This was attributedto a rearrangement of intramolecular hydrogen bonds, which formed betweenthe carboxyls during the synthesis and isolation of the polymers, formingintermolecular hydrogen bonds.
5.2 Dynamic Glass Transition
A glass transition is introduced dynamically when probing polymer moleculeson such short time scales (in a high frequency dynamic experiment, for instance)that conformational rearrangements have no time to develop. The spectrum ofpolymers in this dynamic glass transition region is given by a power law withnegative exponent. This has already been realized by Tobolsky [90], whointroduced a wedge-box spectrum to describe entangled polymer melts wherethe ‘wedge’ (power law with negative slope) represented the relaxation behaviorin the glass transition region. At long times this behavior is masked by the onsetof the entanglement and/or flow regime. The glass transition spectrum looks likethe CW spectrum for the critical gel except that it is cut off at a characteristicrelaxation time, j
#)!3, i.e. the longest relaxation time is finite. This suggests that
a polymer at the glass transition might be considered in the physical gelframework.
The amorphous solid state may be viewed as an extension of the liquid phasebelow a characteristic temperature. For low molecular weight materials, theatoms are frozen into their relative position at low temperatures [91]; this iscalled configurational freezing. For high molecular weight materials such aspolymers, the molecular conformations freeze in and arrest molecular motion(conformational freezing); the temperature of conformational freezing is calledglass transition temperature. ¹
'. ¹
'is above the temperature of configurational
freezing. The conformational freezing results in an increase of the correlationlength for molecular motion. The divergence of the correlation length denotesthe instant of solidification; thus the relaxation of the material is similar to that
Rheology of Polymers Near Liquid-Solid Transitions 205

of a physical gel. The cut-off time j#)!3
(¹ ) of the relaxation spectrum depends ontemperature and becomes very long when the temperature is lowered towardsthe glass transition temperature, ¹
', but it remains finite at ¹
'. Dynamic
mechanical experiments near ¹'are needed for exploring the applicability of the
gelation framework here. A very comprehensive study of dynamic mechanicalbehavior near ¹
'has been given by Zorn et al. [92].
The glass transition involves additional phenomena which strongly affectthe rheology: (1) Short-time and long-time relaxation modes were found toshift with different temperature shift factors [93]. (2) The thermally introducedglass transition leads to a non-equilibrium state of the polymer [10]. Because ofthese, the gelation framework might be too simple to describe the transitionbehavior.
5.3 Liquid Crystalline Polymers at their Nematic-SmecticTransition
Viscoelastic response of liquid crystalline polymers (LCP) is very sensitive tosmectic-nematic and smectic-isotropic phase transitions. Typical side chainLCPs with mesogenic groups pendant to flexible backbones show liquid-likerelaxation behavior at low frequencies in the nematic state, i.e. the storagemodulus, G@, is proportional to frequency, u, and the loss modulus, G@@, isproportional to u2. At intermediate frequencies, a power law dependence bestdescribes the dynamic moduli [94, 95]. Chemically crosslinking polymersbelow the gel point show the same behavior, which is followed by a transitionto entanglement and/or glass transition regime at higher frequencies. LCPs inthe smectic phase do not exhibit a low frequency drop-off to liquid-like behav-ior, at least not in the experimentally observable frequency regime. G@ and G@@seem to level off at low frequency, suggesting a more solid-type relaxationbehavior. No real power-law dependence is observed in the smectic mesophase;however, at intermediate frequencies indications of self-similar relaxation can beobserved.
5.4 Suspensions
Transition from liquid behavior to solid behavior has been reported with fineparticle suspensions with increased filler content in both Newtonian and non-Newtonian liquids. Industrially important classes are rubber-modified polymermelts (small rubber particles embedded in a polymer melt), e.g. ABS (acrylo-nitrile-butadiene-styrene) or HIPS (high-impact polystyrene) and fiber-reinforced polymers. Another interesting suspension is present in plasticizedpolyvinylchloride (PVC) at low temperatures, when suspended PVC particlesare formed in the melt [96]. The transition becomes evident in the following
206 H.H. Winter and M. Mours

experimental observations:z The limiting storage modulus (at low frequencies) and relaxation modulus (at
long times) become finite at high concentration, while they are zero at lowconcentration [97—102].
z The zero-shear viscosity and the dynamic viscosity (at low frequencies) divergeat high concentration, while they are constant at low concentration[99, 100, 102—105].Liquid-solid transitions in suspensions are especially complicated to study
since they are accompanied by additional phenomena such as order-disordertransition of particulates [98, 106, 107], anisotropy [108], particle-particle inter-actions [109], Brownian motion, and sedimentation-particle convection [109].Furthermore, the size, size distribution, and shape of the filler particles stronglyinfluence the rheological properties [108, 110]. More comprehensive reviews onthe rheology of suspensions and rubber modified polymer melts were presentedby Metzner [111] and Masuda et al. [112], respectively.
Oscillatory shear experiments are the preferred method to study therheological behavior due to particle interactions because they directly probethese interactions without the influence of the external flow field as encounteredin steady shear experiments. However, phenomena that arise due to the externalflow, such as shear thickening, can only be investigated in steady shear experi-ments. Additionally, the analysis is complicated by the different response of thematerial to shear and extensional flow. For example, very strong deviationsfrom Trouton’s ratio (extensional viscosity is three times the shear viscosity)were found for suspensions [113].
We expect the liquid/solid transition to express itself in the same generalrelaxation patterns as chemical gelation, with a self-similar relaxation timespectrum at the gel point. A starting point for this hypothesis is the work ofCastellani and Lomellini [102, 114], who compared the rheology of rubber-modified thermoplastics with increasing rubber content to the behavior duringphysical gelation. The relaxation spectra of ABS with different PBD contentpresented by Masuda et al. [112] also suggest this approach, since they seem tocontain a power law at long times.
6 Rheometry Near the Gel Point
Viscoelastic properties on intermediate time scales are most appropriate forstudying gelation. The stretching of the spectrum in the approach of the gelpoint (from either side), and the self-similarity of the spectrum at the gel pointcan best be observed by forcing the material through the transition whilesimultaneously measuring its continuously evolving linear viscoelastic proper-ties. Small strain tests are preferable, since they avoid rupturing the fragilenetwork structure. No specific equipment is required beyond what one would
Rheology of Polymers Near Liquid-Solid Transitions 207
use for characterizing viscoelasticity in liquids or solids. Most common arerotational rheometers with concentric disk fixtures, cone and plate fixtures, orCouette geometry. Samples have to be prepared in the rheometer fixtures sincethey are too fragile and too sticky to be transferred later.
6.1 Oscillatory Shear
Small amplitude oscillatory shear is the method of choice for materials with verybroad distributions of relaxation modes, such as materials near LST, and formaterials which undergo change during the measurement. The dynamic moduliin Eq. 4—10 are defined by [10]
G@(u)"G%#uP
=
0
[G(t)!G%] sin(ut) dt"storage modulus, (6-1)
GA(u)"uP=
0
G(t) cos(ut)dt "loss modulus. (6-2)
The above equations are generally valid for any isotropic material, includingcritical gels, as long as the strain amplitude c
0is sufficiently small. The material
is completely characterized by the relaxation function G (t) and, in case of a solid,an additional equilibrium modulus G
%.
The basic advantages of small amplitude oscillatory strain (shear or exten-sion) come through its spectroscopic character, the experimental time for takinga single data point being roughly equal to the period of the strain wave, 2n/u.This allows to measure specific relaxation modes with time constants in theorder of 1/u independently of any longer or shorter modes which might bepresent in the polymer, i.e. only a small fraction of the spectrum is actuallysampled. This is shown in Fig. 19, where a single power law spectrum withnegative exponent (n"0.7) was used to calculate the integral kernels of thefollowing equations at u"j/j
0.
G@(u)"Pj.!9
0
H (j)(uj)2
1#(uj)2djj
(6-3)
GA(u)"Pj.!9
0
H (j)uj
1#(uj)2djj
(6-4)
The divergence of the longest relaxation time does not perturb the measurement.In comparison, steady state properties (the steady shear viscosity, for instance)would probe an integral over all relaxation modes and, hence, fail near the gelpoint.
208 H.H. Winter and M. Mours
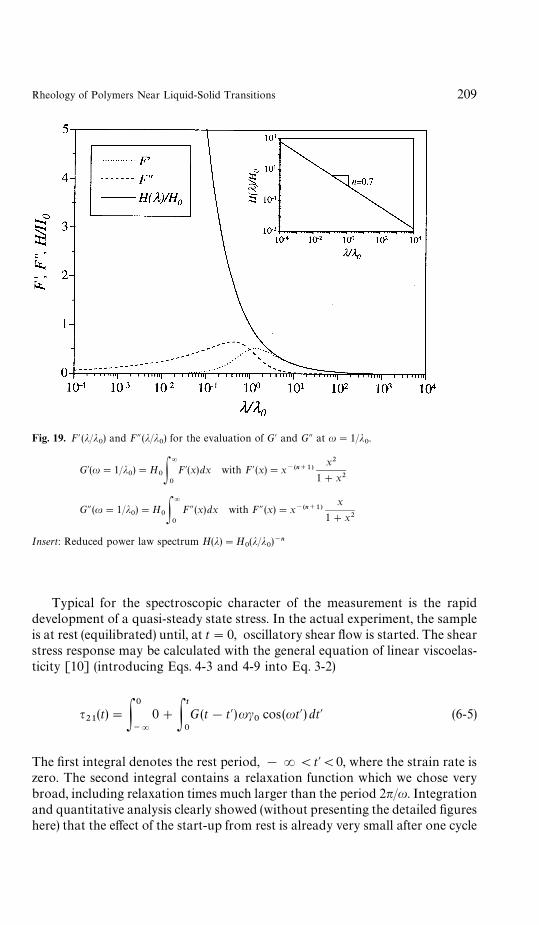
Fig. 19. F@ (j/j0) and FA (j/j
0) for the evaluation of G@ and GA at u"1/j
0.
G@(u"1/j0)"H
0P=
0
F@(x)dx with F@(x)"x~(n`1)x2
1#x2
GA(u"1/j0)"H
0P=
0
FA(x)dx with FA (x)"x~(n`1)x
1#x2
Insert: Reduced power law spectrum H(j)"H0(j/j
0)~n
Typical for the spectroscopic character of the measurement is the rapiddevelopment of a quasi-steady state stress. In the actual experiment, the sampleis at rest (equilibrated) until, at t"0, oscillatory shear flow is started. The shearstress response may be calculated with the general equation of linear viscoelas-ticity [10] (introducing Eqs. 4-3 and 4-9 into Eq. 3-2)
q21
(t)"P0
~=
0#Pt
0
G(t!t@)uc0
cos(ut@) dt@ (6-5)
The first integral denotes the rest period, !R(t@(0, where the strain rate iszero. The second integral contains a relaxation function which we chose verybroad, including relaxation times much larger than the period 2n/u. Integrationand quantitative analysis clearly showed (without presenting the detailed figureshere) that the effect of the start-up from rest is already very small after one cycle
Rheology of Polymers Near Liquid-Solid Transitions 209

Fig. 20. Dynamic moduli, G@ (open symbols) and G@@ ( filled symbols), for five partially crosslinkedPDMS samples at different extents of reactions (same data as Fig. 2). G@ curves downward for theliquid and curves to the left for the solid. The straight lines belong to the sample which is very close tothe gel point. t!t
#is given in minutes
and definitely is negligible after two cycles. Eq. 6-5 simplifies to
q21
(t)+Pt
~=
G(t!t@)uc0cos(ut@) dt@ (6-6)
The start-up time does not depend on the longest relaxation time of the materialeven if it is orders of magnitude larger than the period 2n/u [115]. This is animportant prerequisite for an experiment near LST.
The dynamic mechanical experiment has another advantage which wasrecognized a long time ago [10]: each of the moduli G@ and GA independentlycontains all the information about the relaxation time distribution. However,the information is weighted differently in the two moduli. This helps in detectingsystematic errors in dynamic mechanical data (by means of the Kramers-Kronigrelation [54]) and allows an easy conversion from the frequency to the timedomain [8, 116].
Figures 20 and 21 show typical dynamic moduli and loss tangent distribu-tions. These were measured by Chambon and Winter [5] on several partiallycrosslinked samples of PDMS.
Limitations of the experiment at low frequencies come from the long experi-mental times, during which the sample structure may change so much thatthe entire experiment becomes meaningless. At high frequencies, limitations
210 H.H. Winter and M. Mours
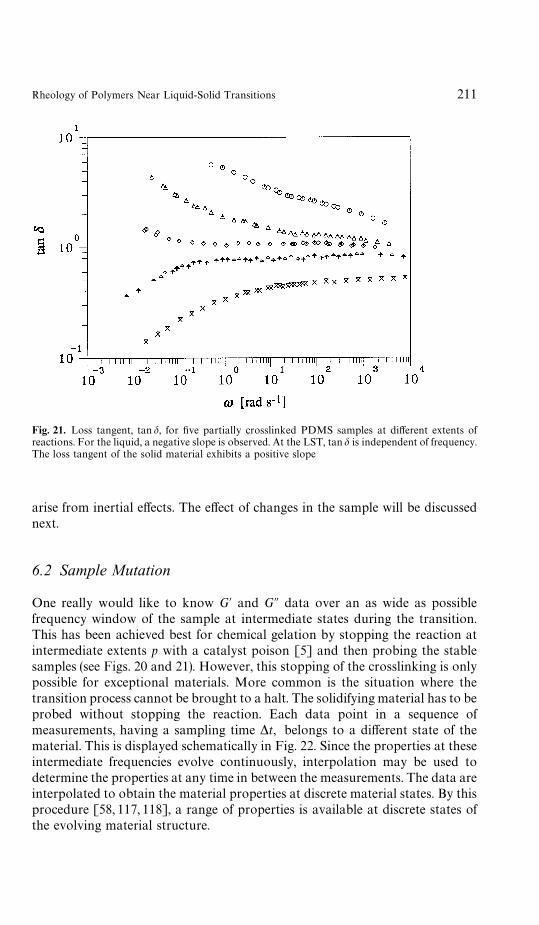
Fig. 21. Loss tangent, tan d, for five partially crosslinked PDMS samples at different extents ofreactions. For the liquid, a negative slope is observed. At the LST, tan d is independent of frequency.The loss tangent of the solid material exhibits a positive slope
arise from inertial effects. The effect of changes in the sample will be discussednext.
6.2 Sample Mutation
One really would like to know G@ and GA data over an as wide as possiblefrequency window of the sample at intermediate states during the transition.This has been achieved best for chemical gelation by stopping the reaction atintermediate extents p with a catalyst poison [5] and then probing the stablesamples (see Figs. 20 and 21). However, this stopping of the crosslinking is onlypossible for exceptional materials. More common is the situation where thetransition process cannot be brought to a halt. The solidifying material has to beprobed without stopping the reaction. Each data point in a sequence ofmeasurements, having a sampling time *t, belongs to a different state of thematerial. This is displayed schematically in Fig. 22. Since the properties at theseintermediate frequencies evolve continuously, interpolation may be used todetermine the properties at any time in between the measurements. The data areinterpolated to obtain the material properties at discrete material states. By thisprocedure [58, 117, 118], a range of properties is available at discrete states ofthe evolving material structure.
Rheology of Polymers Near Liquid-Solid Transitions 211

Fig. 22. Schematic evolution of dynamic moduli during crosslinking. The time period *t corre-sponds to the time necessary for a rheological measurement in case of a reacting sample. If thereaction is stopped, *t corresponds to the time in which the poison diffuses into the sample.The reaction is still carried on until the entire sample is poisoned. Then, the moduli remainconstant
The effect of mutation is different in case of stopped samples, but thephenomenon cannot be completely avoided. Here, the experimental time period*t is determined by the poison diffusion. The catalyst poison solution is sprayedon top of a reacting sample and then diffuses into the core of the sample where itstops the reaction sequentially layer by layer. This leads to small inhomogeneityin the sample, since the reaction near the upper surface is stopped earlier thanthe reaction near the bottom of the mold.
Sample changes during the measurement might cause severe problems. Theshear stress response of a crosslinking system exemplifies this nicely:
q21
(t)"Pt
~=
G tA/ttA/t{
[t, t@, p(tA)]uc0cos(ut@)dt@ (6-7)
The stress depends on the extent of reaction, p(t@), which progresses with time.However, it is not enough to enter the instantaneous value of p (t@). Needed issome integral over the crosslinking history. The solution of the mutationproblem would require a constitutive model for the fading memory functionalG tA/t
tA/t{[t, t@, p(tA)], which is not yet available. This restricts the applicability of
dynamic mechanical experiments to slowly crosslinking systems.
212 H.H. Winter and M. Mours
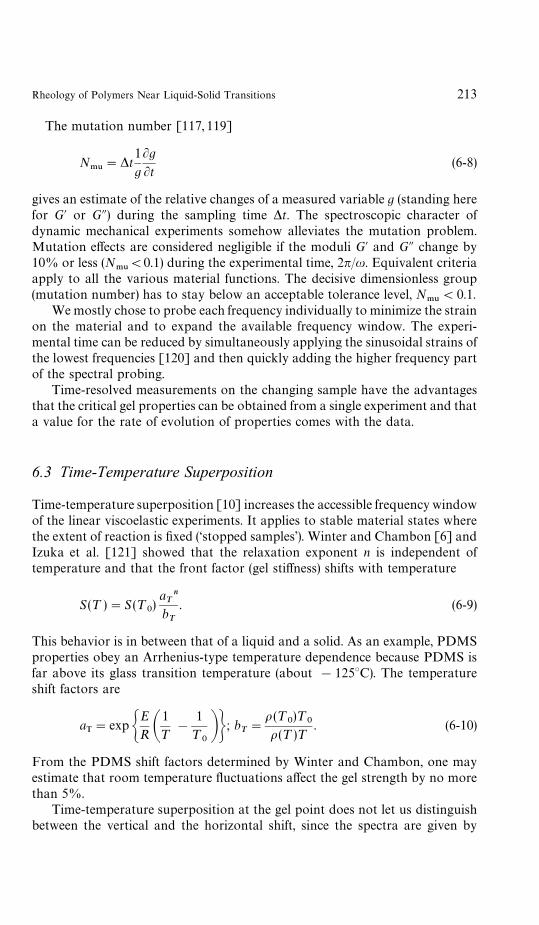
The mutation number [117, 119]
N.6
"*t1
g
Lg
Lt(6-8)
gives an estimate of the relative changes of a measured variable g (standing herefor G@ or GA) during the sampling time *t. The spectroscopic character ofdynamic mechanical experiments somehow alleviates the mutation problem.Mutation effects are considered negligible if the moduli G@ and GA change by10% or less (N
.6(0.1) during the experimental time, 2n/u. Equivalent criteria
apply to all the various material functions. The decisive dimensionless group(mutation number) has to stay below an acceptable tolerance level, N
.6(0.1.
We mostly chose to probe each frequency individually to minimize the strainon the material and to expand the available frequency window. The experi-mental time can be reduced by simultaneously applying the sinusoidal strains ofthe lowest frequencies [120] and then quickly adding the higher frequency partof the spectral probing.
Time-resolved measurements on the changing sample have the advantagesthat the critical gel properties can be obtained from a single experiment and thata value for the rate of evolution of properties comes with the data.
6.3 Time-Temperature Superposition
Time-temperature superposition [10] increases the accessible frequency windowof the linear viscoelastic experiments. It applies to stable material states wherethe extent of reaction is fixed (‘stopped samples’). Winter and Chambon [6] andIzuka et al. [121] showed that the relaxation exponent n is independent oftemperature and that the front factor (gel stiffness) shifts with temperature
S(¹ )"S (¹0)a nTbT
. (6-9)
This behavior is in between that of a liquid and a solid. As an example, PDMSproperties obey an Arrhenius-type temperature dependence because PDMS isfar above its glass transition temperature (about !125°C). The temperatureshift factors are
aT"expG
E
R A1
¹
!
1
¹0BH ; b
T"
o (¹0)¹
0o(¹ )¹
. (6-10)
From the PDMS shift factors determined by Winter and Chambon, one mayestimate that room temperature fluctuations affect the gel strength by no morethan 5%.
Time-temperature superposition at the gel point does not let us distinguishbetween the vertical and the horizontal shift, since the spectra are given by
Rheology of Polymers Near Liquid-Solid Transitions 213

straight lines in a log/log plot. We can only determine the total product anT/b
T[121] without being able to break it down into separate values a
Tand b
T. For
polymers at temperatures far above the glass transition temperature ¹g, how-
ever, the crosslinking does not seem to affect the shift factors in any major wayand a
Tand b
Tvalues may approximately be taken from the temperature
dependence of the precursor viscosity and the modulus of the fully crosslinkedsystem, respectively. This has been found for crosslinking polycaprolactones farabove the glass transition temperature [121]. More experiments are needed toconfirm this very simple relation. It is expected to loose its validity for samplesfor which crosslinking strongly increases ¹
g.
6.4 Time-Cure Superposition
Measurement of the equilibrium properties near the LST is difficult because longrelaxation times make it impossible to reach equilibrium flow conditions withoutdisruption of the network structure. The fact that some of those properties diverge(e.g. zero-shear viscosity or equilibrium compliance) or equal zero (equilibriummodulus) complicates their determination even more. More promising are time-cure superposition techniques [15] which determine the exponents from theentire relaxation spectrum and not only from the diverging longest mode.
Adolf and Martin [15] postulated, since the near critical gels are self-similar,that a change in the extent of cure results in a mere change in scale, but thefunctional form of the relaxation modulus remains the same. They accounted forthis change in scale by redefinition of time and by a suitable redefinition of theequilibrium modulus. The data were rescaled as G@/G
%(p) and GA/G
%(p) over
uj.!9
(p). The result is a set of master curves, one for the sol (Fig. 23a) and one forthe gel (Fig. 23b).
Time-cure superposition is valid for materials which do not change theirrelaxation exponent during the transition. This might be satisfied for chemicalgelation of small and intermediate size molecules. However, it does not apply tomacromolecular systems as Mours and Winter [70] showed on vulcanizingpolybutadienes.
6.5 Growth Rate of Moduli
The rate of change through the transition has not been studied widely. However,the growth of G@ and GA due to the increasing network connectivity seems tofollow a regular pattern. For all our experiments of that type which wererestricted by the accessible frequency range of the rheometer, the growth rate ofG@ at the gel point was typically twice as high as that of GA:
A1
G@LG@Lp Bu:2A
1
G@@LGALp Bu for finite u . (6-11)
214 H.H. Winter and M. Mours
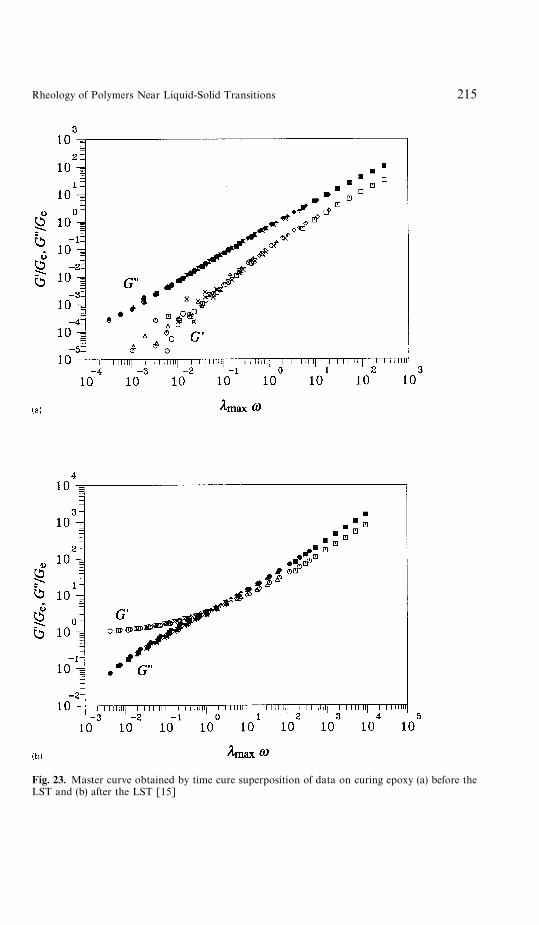
Fig. 23. Master curve obtained by time cure superposition of data on curing epoxy (a) before theLST and (b) after the LST [15]
Rheology of Polymers Near Liquid-Solid Transitions 215

Fig. 24. Schematic of the evolution of the dynamic storage modulus, G@, with extent of reaction, p, atfour different frequencies
The growth rate decreases with frequency. Figure 24 shows this schematicallyfor the storage modulus. The frequency dependence is the same for both G@ andGA, and it also follows a power law (Fig. 25).
A1
G@LG@Lp BuJA
1
GALGALp BuJu~i for p near p
#. (6-12)
Precise knowledge of the critical point is not required to determine i by thismethod because the scaling relation holds over a finite range of p at intermediatefrequency. The exponent i has been evaluated for each of the experiments ofScanlan and Winter [122]. Within the limits of experimental error, the experi-ments indicate that i takes on a universal value. The average value from 30experiments on the PDMS system with various stoichiometry, chain length, andconcentration is i"0.214$0.017. Exponent i has a value of about 0.2 for allthe systems which we have studied so far. Colby et al. [38] reported a value of0.24 for their polyester system. It seems to be insensitive to molecular detail. Weexpect the dynamic critical exponent i to be related to the other criticalexponents. The frequency range of the above observations has to be exploredfurther.
6.6 Inhomogeneities
The crosslinking process should not be considered to be completely homogene-ous. Several phenomena might cause inhomogeneities. On a molecular scale, we
216 H.H. Winter and M. Mours
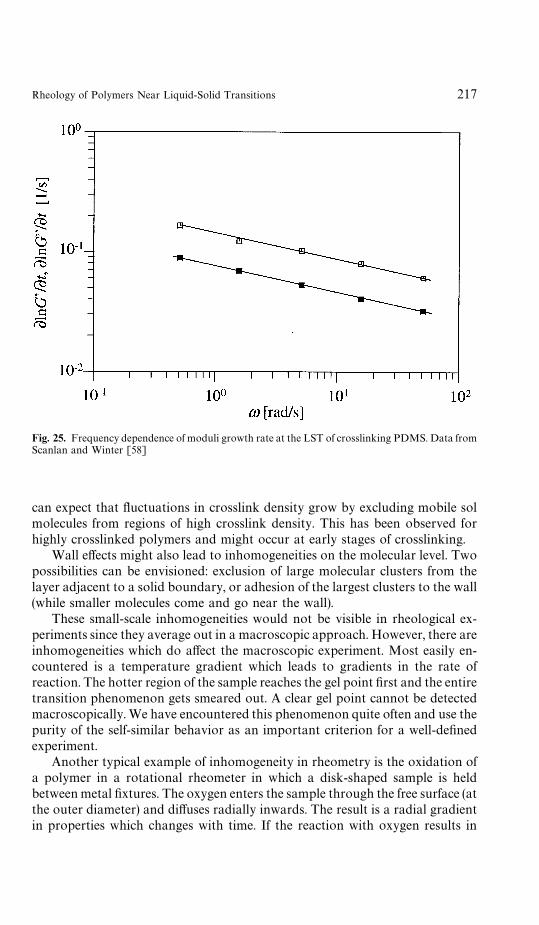
Fig. 25. Frequency dependence of moduli growth rate at the LST of crosslinking PDMS. Data fromScanlan and Winter [58]
can expect that fluctuations in crosslink density grow by excluding mobile solmolecules from regions of high crosslink density. This has been observed forhighly crosslinked polymers and might occur at early stages of crosslinking.
Wall effects might also lead to inhomogeneities on the molecular level. Twopossibilities can be envisioned: exclusion of large molecular clusters from thelayer adjacent to a solid boundary, or adhesion of the largest clusters to the wall(while smaller molecules come and go near the wall).
These small-scale inhomogeneities would not be visible in rheological ex-periments since they average out in a macroscopic approach. However, there areinhomogeneities which do affect the macroscopic experiment. Most easily en-countered is a temperature gradient which leads to gradients in the rate ofreaction. The hotter region of the sample reaches the gel point first and the entiretransition phenomenon gets smeared out. A clear gel point cannot be detectedmacroscopically. We have encountered this phenomenon quite often and use thepurity of the self-similar behavior as an important criterion for a well-definedexperiment.
Another typical example of inhomogeneity in rheometry is the oxidation ofa polymer in a rotational rheometer in which a disk-shaped sample is heldbetween metal fixtures. The oxygen enters the sample through the free surface (atthe outer diameter) and diffuses radially inwards. The result is a radial gradientin properties which changes with time. If the reaction with oxygen results in
Rheology of Polymers Near Liquid-Solid Transitions 217

a solidification, then the outer edge of the sample solidifies much before theinner regions, thus leading to an experiment-inherent inhomogeneity of thesample.
7 Detection of the Liquid-Solid Transition
The gel point is reached when the largest molecular or supermolecular clusterdiverges to infinity [123]. This cannot be measured directly, but the conse-quences are so dramatic that they can be seen in a wide range of phenomena.Detection methods involve static light scattering on diverging clusters anddynamic light scattering with diverging correlation time [124—128], dissolvingin a good solvent and extraction of a sol fraction [129], permeability [130],nuclear magnetic resonance spectroscopy [131], differential scanningcalorimetry [132—134], and infrared [29, 135] and Raman spectroscopy[136, 137]. Very sensitive indicators are rheological properties. Viscosity, firstnormal stress difference coefficient, equilibrium compliance, and longest relax-ation time diverge at the gel point and the distribution of relaxation modesadopts a power law. These rheological features have been used extensively fordetecting the gel point, and the following discussion will focus on rheologicalmethods.
During our early experiments on chemical gels, when first observing theintermediate state with the self-similar spectrum, Eq. 1—5, we simply called it‘viscoelastic transition’. Then, numerous solvent extraction and swelling experi-ments on crosslinking samples showed that the ‘viscoelastic transition’ marksthe transition from a completely soluble state to an insoluble state. The sol-geltransition and the ‘viscoelastic transition’ were found to be indistinguishablewithin the detection limit of our experiments. The most simple explanation forthis observation was that both phenomena coincide, and that Eqs. 1-1 and 1-5are indeed expressions of the LST. Modeling calculations of Winter and Cham-bon [6] also showed that Eq. 1-1 predicts an infinite viscosity (see Sect. 4) anda zero equilibrium modulus. This is consistent with what one would expect fora material at the gel point.
Physical solidification processes have no criterion for the gel point whichwould be as decisive as the molecular weight divergence of the sol-gel transition.LST measurements involve elaborate observations of flow to non-flowtransition, and they rely on subjective judgement. The broadening of thespectrum into a power law distribution seems to coincide with such cessation offlow observations. We have therefore suggested that it should be valid togeneralize from the behavior of chemical gels and identify LSTs of physical gelsalso by the CW spectrum [67]. In this way we can clearly identify both theapproach to gelation and the transition of materials which otherwise would lacka clear definition.
218 H.H. Winter and M. Mours

7.1 Diverging Rheological Properties
The diverging rheological properties are an unambiguous sign of the approach-ing gel point even if the measurement breaks down in its immediate vicinity (seeFig. 5). Macosko [138] gave a well-balanced overview of the methods up to1985. The most common rheological tests for detecting LST measure thedivergence of the steady shear viscosity [139—147] or the appearance of anequilibrium modulus [143, 146—148]. The equilibrium modulus evades accuratemeasurement near LST since its value is zero at LST and remains below thedetection limit for a considerable time. It appears in a stress relaxation experi-ment as the long time limit of the relaxation function or in oscillatory strain asthe low frequency asymptote of G@.
Measurement of the diverging steady shear viscosity is an appealing experi-ment because of its simplicity. Even the torque on a processing machine mightserve as an estimate of the diverging viscosity. It has, however, severe disadvan-tages that need to be considered [149]:1. Near LST, the relaxation times become very long, and steady shear flow
cannot be reached in the relatively short transient experiment. Large strainsare the consequence for most reported data.
2. At large strain, the liquid shows shear thinning in some poorly understoodfashion. Shearing causes breakage of the fragile network structure near LST,which has been observed as an apparent delay in gelation.
3. LST is found by extrapolation. The actual experiment may also end prema-turely some time before LST if the developing structure in the material is verystiff and the rising stress overloads the rheometer.The diverging viscosity, therefore, does not show the real gel point. The
transition may appear early because of torque overload or it may be delayed bychain scission due to large strain. This apparent gel point, however, is stillimportant since it relates to processing applications in which either the machinewould clog or the newly formed network structure would break (or both).
7.2 Monotonously Changing Properties
The relaxation modulus evolves gradually during gelation. A set of data alongthe lines of Fig. 2 gives a good estimate of where the gel point occurs. Theproblem with it is that one cannot decide very well when exactly G(t) hasstraightened out into a power law.
Dynamic mechanical properties also evolve gradually during the LST ofpolymeric systems. The gel point is reached when tan d becomes independent offrequency [58, 63, 65, 120, 149, 150] (see Eq. 4-12). Lines of tan d(t) at severalfrequencies u
1, u
2, u
3, u
4, u
5, etc. decay gradually and intersect at the gel point
(see Fig. 26). The method is very effective. The instant of gelation can bemeasured as precisely as the accuracy of the rheometer permits — a significant
Rheology of Polymers Near Liquid-Solid Transitions 219
advantage over extrapolation methods. An additional advantage is that thestrain is kept small and shear modification of the molecular structure is avoided.The experiment not only tags the instant of gelation but also provides the valueof the relaxation exponent n (see Eq. 4-12).
Even before reaching the gel point, the converging lines can be extrapolatedtowards the expected gel point. The LST can be anticipated. This is convenientfor preparing materials somewhere before the gel point but very close to it. Thecross-linking can be stopped at a defined distance before LST, (p
#!p).
There are also some far-fetched proposals for the LST: a maximum in tan d[151] or a maximum in GA [152] at LST. However, these expectations are notconsistent with the observed behavior. The GA maximum seems to occur muchbeyond the gel point. It also has been proposed that the gel point may bereached when the storage modulus equals the loss modulus, G@"GA [153, 154],but this is contradicted by the observation that the G@!GA crossover dependson the specific choice of frequency [154]. Obviously, the gel point cannotdepend on the probing frequency. Chambon and Winter [5, 6], however,showed that there is one exception: for the special group of materials witha relaxation exponent value n"0.5, the loss tangent becomes unity, tan d
#"1,
and the G@!GA crossover coincides with the gel point. This shows that thecrossover G@"GA does not in general coincide with the LST.
7.3 Uniqueness of tan d Method
A self-similar relaxation spectrum with a negative exponent (-n) has the propertythat tan d is independent of frequency. This is convenient for detecting theinstant of gelation. However, it is not evident that the claim can be reversed.There might be other functions which result in a constant tan d. This will beanalyzed in the following.
A constant loss tangent, tan dOf (u), requires dynamic moduli
G@"h (u), GA"Ah(u)Ptan d"GA/G@"A"const. (7-1)
where h(u) may be an arbitrary function. The question is whether h(u) has to bea power law h (u)Jun or whether other functions are permitted. If otherfunctions are permitted, then tan dOf (u) (for 1/j
0(u(R ) is not a unique
criterion for the LST. For the following derivation, the short time behavior canbe neglected since it has no effect on the ensuing argument. For simplicity weassume that the above condition applies over the entire frequency range,0(u(R. The Kramers-Kronig relation
G@(u)"2
n P=
0
GA(x)
1!(x/u)2dx
x(7-2)
220 H.H. Winter and M. Mours

can be evaluated for the above function
h(u)"2
n P=
0
Ah(x)
1!(x/u)2
dx
x(7-3)
Substitution of y"x/u gives
1"A2
n P=
0
h (yu)
h (u)
1
1!y2dy
y(7-4)
Any function of yu with the factorization property
h(yu)"k (y)h(u), (7-5)
where k (y) may be an arbitrary function, is solution since it reduces the integralto some constant which defines A:
1"2A
n P=
0
k (y)
1!y2
dy
y(7-6)
A power law h(u)Jun satisfies this condition, Eq. 7-5, but any number of otherfunctions with that property might be invented. The tan d criterion, therefore,might be not unique. However, no other material has yet been found which alsoobeys tan d"constant in the terminal frequency region, and we suggest thecontinued use of the tan d method for detecting LST until a counter example canbe found.
7.4 Determination of S and n
Dynamic mechanical data near the gel point allow easy determination of theparameters of the critical gel, Eq. 1-1. Tan d, as shown in Fig. 26, gives therelaxation exponent n
n"2
ntan~1A
GAG@B (7-7)
GA/G@"(GA/G@)#
is the value where the curves intersect in a single point. Thesame data can be rearranged into
S"G@(u)
uncos(nn/2)!(1!n)(7-8)
S has to be evaluated at the gel point (with G@"G@#(u) at low frequencies). This
completely characterizes the critical gel. The critical gel behavior is valid abovea material characteristic time constant j
0. The relation between S and n given by
Eq. 3-4 holds only at the LST.The above two equations are generally valid for viscoelastic liquids and
solids. In this case, n and S would depend on frequency. In this sense, the above
Rheology of Polymers Near Liquid-Solid Transitions 221

Fig. 26. Tan d of a crosslinking PBD (M8"18 000) as a function of reaction time [31]. Parameter is
the frequency u. The polymer is vulcanized at the pendant vinyl units with a bifunctional silanecrosslinker using a platinum compound as catalyst. The curves intersect at the gel point resulting intan dOf (u)
definitions are also valid in the vicinity of the gel point. However, n and S areonly independent of frequency at the gel point where self-similar relaxationgoverns the rheological behavior.
8 Other Observations of Power Law Relaxation
Power law relaxation is no guarantee for a gel point. It should be noted that,besides materials near LST, there exist materials which show the very simplepower law relaxation behavior over quite extended time windows. Such behav-ior has been termed ‘self-similar’ or ‘scale invariant’ since it is the same at anytime scale of observation (within the given time window). Self-similar relaxationhas been associated with self-similar structures on the molecular and super-molecular level and, for suspensions and emulsions, on particulate level. Suchself-similar relaxation is only found over a finite range of relaxation times,i.e. between a lower and an upper cut-off, j
1and j
6. The exponent may
adopt negative or positive values, however, with different consequences and
222 H.H. Winter and M. Mours
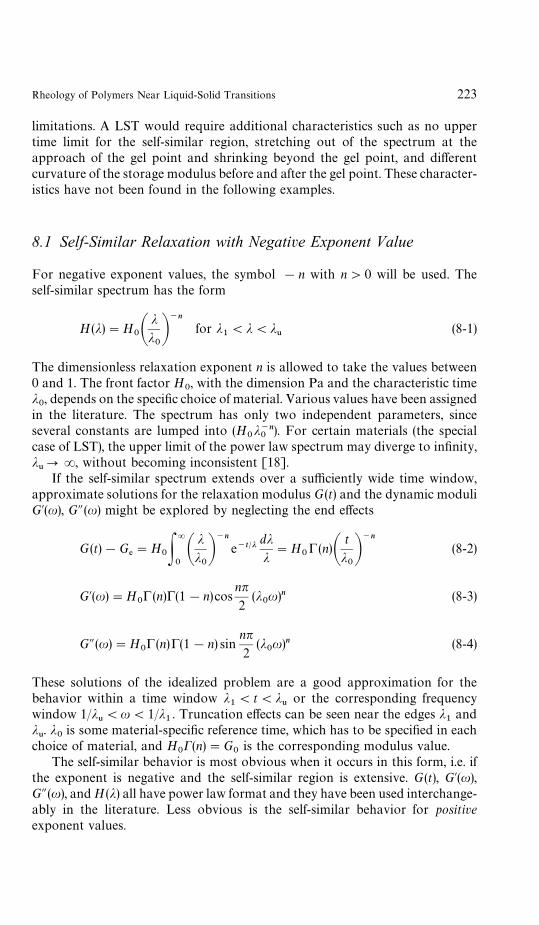
limitations. A LST would require additional characteristics such as no uppertime limit for the self-similar region, stretching out of the spectrum at theapproach of the gel point and shrinking beyond the gel point, and differentcurvature of the storage modulus before and after the gel point. These character-istics have not been found in the following examples.
8.1 Self-Similar Relaxation with Negative Exponent Value
For negative exponent values, the symbol !n with n'0 will be used. Theself-similar spectrum has the form
H(j)"H0A
jj0B~n
for j1(j(j
6(8-1)
The dimensionless relaxation exponent n is allowed to take the values between0 and 1. The front factor H
0, with the dimension Pa and the characteristic time
j0, depends on the specific choice of material. Various values have been assigned
in the literature. The spectrum has only two independent parameters, sinceseveral constants are lumped into (H
0j~n0
). For certain materials (the specialcase of LST), the upper limit of the power law spectrum may diverge to infinity,j6PR, without becoming inconsistent [18].If the self-similar spectrum extends over a sufficiently wide time window,
approximate solutions for the relaxation modulus G(t) and the dynamic moduliG@(u), GA(u) might be explored by neglecting the end effects
G(t)!G%"H
0P=
0A
jj0B~n
e~t@jdjj"H
0! (n)A
t
j0B~n
(8-2)
G@(u)"H0! (n)!(1!n)cos
nn2
(j0u)n (8-3)
GA(u)"H0!(n)!(1!n) sin
nn2
(j0u)n (8-4)
These solutions of the idealized problem are a good approximation for thebehavior within a time window j
1(t(j
6or the corresponding frequency
window 1/j6(u(1/j
1. Truncation effects can be seen near the edges j
1and
j6. j
0is some material-specific reference time, which has to be specified in each
choice of material, and H0C(n)"G
0is the corresponding modulus value.
The self-similar behavior is most obvious when it occurs in this form, i.e. ifthe exponent is negative and the self-similar region is extensive. G(t), G@(u),GA(u), and H(j) all have power law format and they have been used interchange-ably in the literature. Less obvious is the self-similar behavior for positiveexponent values.
Rheology of Polymers Near Liquid-Solid Transitions 223
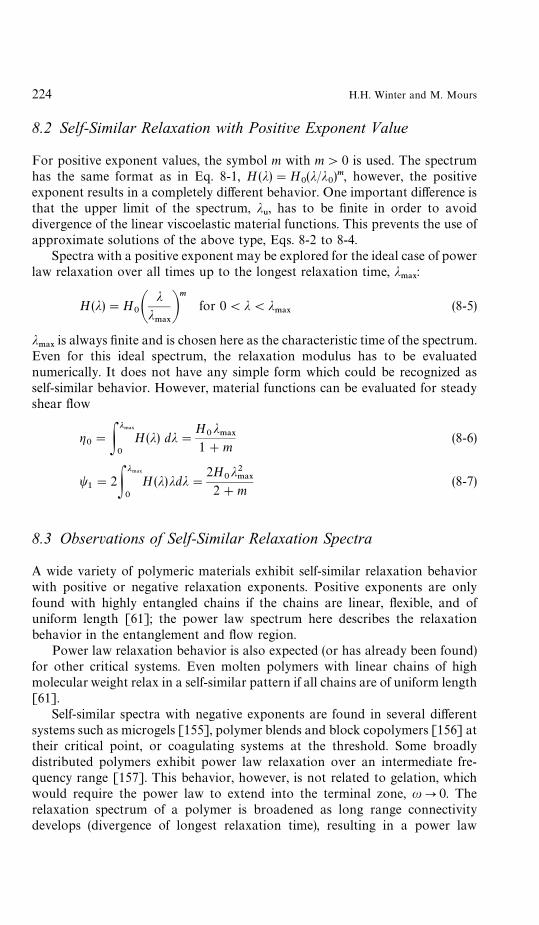
8.2 Self-Similar Relaxation with Positive Exponent Value
For positive exponent values, the symbol m with m'0 is used. The spectrumhas the same format as in Eq. 8-1, H (j)"H
0(j/j
0)m, however, the positive
exponent results in a completely different behavior. One important difference isthat the upper limit of the spectrum, j
6, has to be finite in order to avoid
divergence of the linear viscoelastic material functions. This prevents the use ofapproximate solutions of the above type, Eqs. 8-2 to 8-4.
Spectra with a positive exponent may be explored for the ideal case of powerlaw relaxation over all times up to the longest relaxation time, j
.!9:
H(j)"H0A
jj.!9Bm
for 0(j(j.!9
(8-5)
j.!9
is always finite and is chosen here as the characteristic time of the spectrum.Even for this ideal spectrum, the relaxation modulus has to be evaluatednumerically. It does not have any simple form which could be recognized asself-similar behavior. However, material functions can be evaluated for steadyshear flow
g0"P
j.!9
0
H(j) dj"H
0j.!9
1#m(8-6)
t1"2P
j.!9
0
H(j)jdj"2H
0j2.!9
2#m(8-7)
8.3 Observations of Self-Similar Relaxation Spectra
A wide variety of polymeric materials exhibit self-similar relaxation behaviorwith positive or negative relaxation exponents. Positive exponents are onlyfound with highly entangled chains if the chains are linear, flexible, and ofuniform length [61]; the power law spectrum here describes the relaxationbehavior in the entanglement and flow region.
Power law relaxation behavior is also expected (or has already been found)for other critical systems. Even molten polymers with linear chains of highmolecular weight relax in a self-similar pattern if all chains are of uniform length[61].
Self-similar spectra with negative exponents are found in several differentsystems such as microgels [155], polymer blends and block copolymers [156] attheir critical point, or coagulating systems at the threshold. Some broadlydistributed polymers exhibit power law relaxation over an intermediate fre-quency range [157]. This behavior, however, is not related to gelation, whichwould require the power law to extend into the terminal zone, uP0. Therelaxation spectrum of a polymer is broadened as long range connectivitydevelops (divergence of longest relaxation time), resulting in a power law
224 H.H. Winter and M. Mours

behavior with negative exponent. Indications can also be seen in branchedpolymers [158] and in solutions containing polymeric fractals (e.g. flexiblechain macromolecules of arbitrary self-similar connectivity [159] or naturalobjects with non-integer dimension such as aggregates or percolation clusters[160]).
Various types of power law relaxation have been observed experimentally orpredicted from models of molecular motion. Each of them is defined in itsspecific time window and for specific molecular structure and composition.Examples are dynamically induced glass transition [90, 161], phase separatedblock copolymers [162, 163], polymer melts with highly entangled linear mol-ecules of uniform length [61, 62], and many others. A comprehensive review onpower law relaxation has been recently given by Winter [164].
9 Applications
Processing of polymeric materials almost always involves a liquid-solidtransition, and applications are often limited by solid-liquid transitions. Prop-erty changes are most dramatic near the transition. It is important to knowwhere the transition occurs, how extensive the property changes are, and howfast they occur. Avoiding these transitions might often be the simplest solution,but that is not always an option. Some materials have to be produced, pro-cessed, or used near the gel point or up to the gel point. That is whererheological experiments permit the exact determination of the instant of gelationand the ‘distance’ from the gel point. We now can produce materials at control-led distances from the gel point and also process materials near the gel point.The critical gel properties serve as reference for expressing property changes inthe vicinity of the gel point.
9.1 Avoiding the Gel Point
Mixing and shaping operations in polymer processing require sufficient molecu-lar mobility which vanishes when the motion slows down near the gel point.Some materials only have small processing windows near the gel point (becauseof their limited chemical stability above their melting point, for instance, orbecause of their rapid crosslinking). Processing will become reasonably easy ifsuch a narrow processing window can be targeted. This requires sufficientlyaccurate measurement of the material status relative to the location of the gelpoint. Instead of processing in the material characteristic window, one mayconsider shifting of the processing window by alteration of the material. Thisagain requires detailed knowledge of the transition behavior and accuratemethods for detecting the transition.
Rheology of Polymers Near Liquid-Solid Transitions 225

9.2 Materials Near the Gel Point
Controlled sample preparation is difficult near the gel point where the rate ofproperty change is largest. Physical gelation usually proceeds too rapidly so thatthe material near the gel point eludes the experiment or the application.However, chemical gelation is most suitable for controlling the evolving net-work structure. Several approaches have been explored in industrial applica-tions and in research laboratories:1. Polymerization chemistry was developed which allows the stopping of the
crosslinking reaction in the vicinity of the gel point [5, 29].2. Thermal quenching of the crosslinking reaction: In an actual reactive extru-
sion process, the degree of crosslinking can be controlled by adjusting theresidence time at elevated temperature.
3. Off-balancing of stoichiometry by the right amount (depending oncrosslinking system) allows preparation of materials near the gel point[66].
4. Crosslinking by controlled amounts of radiation. Examples are c-irradiatedpolyethylenes [165] and UV-irradiated polyurethane [166]. Best contestantsare endothermic reactions which require energy for the formation of eachchemical bond and which cease crosslinking when the energy supply is turnedoff. The extent of reaction directly depends on the amount of absorbedenergy. Radiation can be used to enter energy into transparent materials. Theradiation intensity decreases along the path of the radiation in the materials.This potentially leads to samples with a large gradient in extent of reaction,the exposed side of the sample being further crosslinked than the backside.Not suitable for preparing polymers near the gel point are chemical reactionsin which radiation only initiates the crosslinking reaction so that it continueseven after the radiation has been turned off.
9.3 Damping Materials
Critical gels have a damping plateau instead of the commonly observed damp-ing peak. The loss tangent, Eq. 4-12, is uniformly high over a wide frequencyrange, 0(u(1/j
0. At higher frequencies, u'1/j
0, the usual glassy behavior
sets in, or, if the critical gels are made from precursors of high molecular weight,the entanglement behavior dominates before glassy modes take over. Thedamping behavior is independent of temperature [nOf (¹)], which seems to beunique among polymeric materials.
The damping material does not have to be a critical gel. Many applicationsdo not require extra low damping frequencies. The lowest vibration dampingfrequency u
.*/determines the longest relaxation time, j
.!9. A suitable damping
material would be crosslinked beyond the gel point, with a j.!9
of about1/u
.*/.
226 H.H. Winter and M. Mours
9.4 Pressure-Sensitive Adhesives
Polymers at the gel point are extremely powerful adhesives. They combine thesurface-wetting property of liquids with the cohensive strength of solids. Themechanical strength of an adhesive bond in composite materials (with crosslink-ing matrix) develops during the sol-gel transition, and the strength of pressure-sensitive adhesives can be tailored through their degree of crosslinking. While themechanical strength against adhesive failure is maximum at the gel point, themechanical strength against cohesive failure is still relatively low since thepolymer at the gel point is only slightly crosslinked. As the crosslink density isincreased beyond the gel point, the strength of the network increases (strongercohesion) while the adhesive strength decreases. The distance of a polymer fromthe gel point therefore is expected to define the ratio of adhesive to cohesivestrength. This general behavior was confirmed by Zosel [167] in his study oftack and peel behavior of radiation-crosslinked PDMS. He found the maximumtack (corresponding to adhesive strength) slightly after the gel point.
The knowledge of gelation leads to an unconventional but systematicapproach to the development of pressure-sensitive adhesives. Based on the factthat gelation is a critical phenomenon, we hypothesize that there exists a univer-sal ‘law’ which relates the adhesive to the cohesive properties at the gel point andin its vicinity. More research is needed for verifying this hypothesis and explor-ing its limits. For that purpose, polymer gels with well-defined chemical com-position should be prepared at known distance from the gel point and theiradhesive and rheological properties measured. The main parameters are: solidsurface properties (chemical composition, homogeneity, regularity, roughness,curvature), chemical composition, wetting (phase diagram), and layer thickness.
The molecular weight is one of the most important parameters of polymeradhesion. Molecules of low molecular weight are able to wet a surface withoutadhering there for a longer period of time. There exists a chemistry-specificmolecular weight beyond which molecules adhere to a surface. The transitionfrom non-adhering to adhering may be described as a critical phenomenon. Thissame phenomenon has important implications for gelation near a surface: Themolecular weight increases during gelation, and, at a certain extent of crosslink-ing, the largest cluster exceeds the critical molecular weight and adheres to thesurface. This may have interesting consequences which should be exploredfurther. The largest clusters may separate from the bulk, and the gel point willthen be postponed in a very thin film while a solid layer is formed near thesurface. Beyond the gel point, large molecules will not be able to move to thesurface and the system will gradually feel ‘dry’, i.e. will not be able to stick toa surface.
Molecular orientation at the surface may also be important. A moleculeorients planarly when deposited on a solid surface. Molecular strands prefer tobe parallel to the surface; their probability of being oriented normal to thesurface is very low. Several mechanisms can cause this orientation: (1) Surface-active sites may favor entire chain segments to interact with the surface. (2) The
Rheology of Polymers Near Liquid-Solid Transitions 227

Fig. 27. Schematic of molten polymer flow during injection molding into a cold mold
orientation is generated during the drying of the solution at the surface. A vol-ume element of solution at the surface may initially contain isotropic polymerchains. Extraction of the solvent results in a shrinkage of the volume elementinto a thin film at the surface. Motion of the chain segments during this‘deformation’ results in planar orientation.
9.5 Processing Near the Physical Gel Point
Many polymers solidify into a semi-crystalline morphology. Their crystalliza-tion process, driven by thermodynamic forces, is hindered due to entanglementsof the macromolecules, and the crystallization kinetics is restricted by thepolymer’s molecular diffusion. Therefore, crystalline lamellae and amorphousregions coexist in semi-crystalline polymers. The formation of crystals duringthe crystallization process results in a decrease of molecular mobility, since thecrystalline regions act as crosslinks which connect the molecules into a samplespanning network.
Injection molding of semi-crystalline polymers is an example of a processwhich is dominated by crystallization. Particularly the rate of crystallization isimportant. During injection of the molten polymer into the mold, a layer ofpolymer gets deposited at the cold walls of the mold where it starts solidifyingwhile exposed to high shear stress due to ongoing injection (Fig. 27). This is animportant part of the process, since the wall region later forms the surface of themanufactured product. A high shear stress during this crystallization mightrupture the already solidified surface layers, resulting in surface defects (Y.G.Lin, personal communication). This could be avoided if the crystallizationbehavior were known together with its effect on the developing strength of thematerial. The polymer could to be modified to adjust its crystallization behavior
228 H.H. Winter and M. Mours

or a different polymer could be used or developed. A suitable tool to monitor thetime dependence of crystallization processes and thus to select the best materialand processing conditions is rheology. The characteristic crystallization time foreach material can be tailored to the given molding circumstances.
9.6 Processing Near the Chemical Gel Point
Novel materials can be produced by crosslinking a polymer while shearing it atthe same time. This process is known as dynamic vulcanization and is alreadyused in the manufacture of certain rubbers and elastomers. At low degrees ofcrosslinking, the molecular structure is still very soft, so that the rate ofmolecular breaking can be of the same order as the rate of forming new chemicalbonds. The result is a highly branched molecular structure with molecules ofbroadly distributed size. The materials have advantageous properties for ap-plications as adhesives, damping materials with extremely broad dampingmaxima, toner for copy machines, superabsorbers, and sealants. The processgives access to materials with a wide range of properties through well-definedprocessing but to uniform chemical composition (mono-material, easy to recycle).
10 Conclusions
Polymers during their liquid-solid transitions develop a universal rheologicalbehavior which is distinct from that of liquids or solids. It seems that this isa new, general phenomenon of nature. The phenomenological picture of thisrelaxation pattern is fairly complete. This allows the direct measurement of theliquid-solid transition during the manufacturing of gels and suggests a frame-work for presenting experimental data on gels. However, much too little isknown yet about the molecular origin of the observed phenomena. Suchmolecular understanding would be desirable from a fundamental point of view,and it would be good to have when designing gels for specific applications.
We have further evidence that, in the absence of competing phase transitions,the material at the liquid-solid transition exhibits self-similar rheological behav-ior. The self-similarity expresses itself in power law relaxation and retardationspectra in the terminal zone. This very distinct relaxation pattern was firstdetected for chemically gelling systems. For these systems, a three-dimensionalnetwork structure is built by permanently connecting molecules throughcovalent bonds, and the longest relaxation time diverges at the gel point.However, the power law relaxation behavior seems to also govern physicalgelation as long as the gel number is large, N
'<1, i.e. the lifetime of the
junctions (which are reversible in contrast to chemical gelation) is long com-pared to the experimental observation time. This can be clearly seen at early
Rheology of Polymers Near Liquid-Solid Transitions 229
stages of crystallization where a molecular network is formed with crystallinejunctions. Furthermore, other physical mechanisms which lead to increasingcorrelation length seem to result in the same general relaxation patterns near theliquid/solid transition point.
The dynamic properties depend strongly on the material composition andstructure. This is not included in current theories, which seem much too ideal inview of the complexity of the experimentally found relaxation patterns. Experi-mental studies involving concurrent determination of the static exponents,d&and q, and the dynamic exponent, n, are required to find limiting situations to
which one of the theories might apply.The criticality of the liquid-solid transition does not necessarily imply
universality for all investigated properties. Prefactors of different propertiesalways depend on the details of the underlying structure, e.g. the critical gelstiffness is seen to vary by five orders of magnitude. Scaling of different staticproperties around a critical point is only universal if the structure growthprocess belongs to the same class (universality class). Dynamic scaling proper-ties such as the power law relaxation exponent are much more complex and notexpected to be universal. Values of n as reported in this study, 0.19(n(0.92,have been established over almost the entire possible range (0(n(1).Stoichiometry, molecular weight, and concentration were all shown to have animpact on the critical gel properties. These critical gel properties are alsocoupled for the polymers studied here.
From a practical point of view, it is advantageous that critical gel propertiesdepend on molecular parameters. It allows us to prepare materials near the gelpoint with a wide range of properties for applications such as adhesives,absorbents, vibration dampers, sealants, membranes, and others. By propermolecular design, it will be possible to tailor network structures, relaxationcharacter, and the stiffness of gels to one’s requirements.
Acknowledgements We gratefully acknowledge financial support from CUMIRP, MRSEC, and theNational Science Foundation under grants NSF-MSM-86-01595 and NSF-DMR-88-06556. One ofus, M.M., is indebted to the German Academic Exchange Service for financial support (DAAD-Doktorandenstipendium aus Mitteln des zweiten Hochschulsonderprogramms). We would also liketo thank K. Dus\ ek and K. te Nijenhuis for critically reading this text and for their helpful commentsand suggestions.
11 References
1. Flory PJ (1941) J Am Chem Soc 63: 30832. Stockmayer WH (1943) J Chem Phys 11: 453. Stauffer D (1985) Introduction to percolation theory. Taylor and Francis, Philadelphia, USA4. Vilgis TA, Winter HH (1988) Coll Polym Sci 266: 4945. Chambon F, Winter HH (1985) Polym Bull 13: 4996. Winter HH, Chambon F (1986) J Rheol 30: 3677. Chambon F, Winter HH (1987) J Rheol 31: 683
230 H.H. Winter and M. Mours

8. Baumgartel M, Winter HH (1989) Rheol Acta 28: 5119. Chasset R, Thirion P (1965) In: JA Prins (ed) Physics of non-crystalline solids. North-Holland,
Amsterdam10. Ferry JD (1980) Viscoelastic properties of polymers. Wiley, New York11. Pipkin AC (1986) Lectures on viscoelasticity theory, 2nd edn. Springer, Berlin Heidelberg, New
York12. Orbey N, Dealy JM (1991) J Rheol 35: 103513. Martin JE, Adolf D, Wilcoxon JP (1989) Phys Rev A 39: 132514. Friedrich C, Heymann L (1988) J Rheol 32: 235; Friedrich C, Heymann L, Berger HR (1989)
Rheol Acta 28: 53515. Adolf D, Martin JE (1990) Macromolecules 23: 370016. Stauffer D, Coniglio A, Adam A (1982) Adv Polym Sci 44: 10317. Winter HH, Izuka A, De Rosa ME (1994) Polym Gels Networks 2: 23918. Winter HH (1987) Progr Colloid Polym Sci 75: 10419. Winter HH (1991) MRS Bulletin 16(8): 4420. Goldbart P, Goldenfeld N (1992) Phys Rev A 45: R534321. Vilgis TA (1992) Polymer Networks - Crosslinking, Rubbers, Microgels Ch. 3322. Flory PJ (1953) Principles of polymer chemistry. Cornell University Press, Ithaca, New York23. Miller DR, Macosko CW (1976) Macromolecules 9: 20624. Miller DR, Valles EM, Macosko CW (1979) Polym Eng Sci 19: 27225. Dusek K, Ilavsky M (1974) J Polym Sci C 53: 5726. Stanford JL, Stepto RFT, Waywell DR (1975) Faraday Disc 71: 130827. Gordon M, Scantlebury GR (1996) Proc Roy Soc London A292: 38028. Gordon M, Templ WB (1972) Makromol Chem 160: 26329. Valles EM, Macosko CW (1979) Macromolecules 12: 52130. Venkataraman SK, Coyne L, Chambon F, Gottlieb M, Winter HH (1989) Polymer 30: 222231. De Rosa ME (1994) Dissertation. University of Massachusetts at Amherst32. Broadbent SR, Hammersley JM (1957) Proc Cambridge Phil Soc 53: 62933. de Gennes PG (1979) Scaling concepts in polymer physics. Cornell, Ithaca, New York34. Martin JE, Adolf D (1991) Annu Rev Phys Chem 42: 31135. Colby RH, Rubinstein M, Gillmor JR, Mourey TH (1992) Macromolecules 25: 718036. Schosseler S, Leibler L (1984) Physique Lett 45: 50137. Stauffer D (1981) Pure Appl Chem 53: 147938. Colby RH, Gillmor JR, Rubinstein M (1993) Phys Rev E 48: 371239. Martin JE, Adolf D, Wilcoxon JP (1988) Phys Rev Lett 61: 262040. Daoud M (1988) J Phys A 21: L23741. de Gennes PG (1977) J Physique Lett 38: L-35542. Muthukumar M, Winter HH (1986) Macromolecules 19: 128443. Hess W, Vilgis TA, Winter HH (1988) Macromolecules 21: 253644. Muthukumar M (1989) Macromolecules 22: 465645. Smoluchowski MV (1916) Phys Z 17: 58546. Drake RL (1972) In: GM Hidy, JR Brock (ed) Topics in current aerosol research, vol 3.
Pergamon, New York47. Ernst MH (1984) In: EGD Cohen (ed) Fundamental problems in statistical mechanisms, vol. VI
North-Holland, Amsterdam48. van Dongen PGJ, Ernst MH (1985) Phys Rev Lett 54: 139649. Hendricks EM, Ernst MH, Ziff RM (1983) J Stat Phys 31: 51950. Ziff RM, Ernst MH, Hendricks EM (1983) J Phys A 16: 229351. Leung YK, Eichinger BE (1984) J Chem Phys 80: 3877; (1984) J Chem Phys 80: 388552. Shy LY, Eichinger BE (1985) Brit Polym J 17: 20053. Shy LY, Leung YK, Eichinger BE (1985) Macromolecules 18: 98354. Bird RB, Armstrong RW, Hassager O (1987) Dynamics of Polymerics Liquids, vol 1. Wiley,
New York55. Lodge AS (1964) Elastic liquids: an introductory vector treatment of finite-strain polymer
rheology. Academic, London56. Chang H, Lodge AS (1972) Rheol Acta 11: 12757. Larson R (1987) Constitutive equations for polymer melts and solutions. Butterworth, London58. Scanlan JC, Winter HH (1991) Makrom Chem, Makrom Symp 45: 1159. Izuka A, Winter HH, Hashimoto T (1992) Macromolecules 25: 2422
Rheology of Polymers Near Liquid-Solid Transitions 231
60. De Rosa ME, Winter HH (1994) Rheol Acta 33: 22061. Baumgartel M, Schausberger A, Winter HH (1990) Rheol Acta 29: 40062. Baumgartel M, De Rosa ME, Machado J, Masse M, Winter HH (1992) Rheol Acta 31: 7563. Hogdson DF, Amis EJ (1990) Macromolecules 23: 251264. Lairez D, Adam M, Emery JR, Durand D (1992) Macromolecules 25: 28665. Muller R, Gerard E, Dugand P, Rempp P, Gnanou Y (1991) Macromolecules 24: 132166. Durand D, Delsanti M, Adam M, Luck JM (1987) Europhys Lett 3: 29767. te Nijenhuis K, Winter HH (1989) Macromolecules 22: 41168. Lin YG, Mallin DT, Chien JCW, Winter HH (1991) Macromolecules 24: 85069. Richtering HW, Gagnon KD, Lenz RW, Fuller RC, Winter HH (1992) Macromolecules 25:
242970. Mours M, Winter HH (1996) Macromolecules 29: 722171. Venkataraman SK, Winter HH (1990) Rheol Acta 29: 42372. Cole KS, Cole RH (1941) J Chem Phys 9: 34173. Gross B (1953) Mathematical structures of the theory of viscoelasticity. Hermann, Paris74. Cates ME (1987) Macromolecules 20: 228975. Cates ME, Candau SJ (1990) J Phys: Condens Matter 2: 686976. te Nijenhuis K (1995) Viscoelastic properties of thermoreversible gels, submitted to Adv Polym
Sci77. Keller A (1995) Faraday Disc 101: 178. Lehsaini N, Muller R, Weill G, Franc,ois J (1994) Polymer 35: 218079. Yu Q, Amis EJ (1993) Makromol Chem, Makromol Symp 76: 19380. Schwittay C, Mours M, Winter HH (1995) Faraday Disc 101: 9381. Guenet JM (1992) Thermoreversible gelation of polymers and biopolymers. Academic, London82. Reid DS, Bryce TA, Clark AH, Rees DA (1974) Faraday Disc 57: 23083. Ross-Murphy SB (1991) Rheol Acta 30: 40184. Michon C, Cuvelier G, Launay B (1993) Rheol Acta 32: 9485. Wedler W, Tang W, Winter HH, MacKnight WJ, Farris RJ (1995) Macromolecules 28: 51286. Winter HH, Scott DB, Gronski W, Okamoto S, Hashimoto T (1993) Macromolecules 26: 723687. Larson RG, Winey KI, Patel SS, Watanabe H, Bruinsma R (1993) Rheol Acta 32: 24588. Vasilev VG, Rogovina LZ, Slonimskii GL, Papkov VS, Shchegolikhina OI, Zhdanov AA
(1995) Polym Sci, Ser A 37: 17489. Rogovina LZ, Vasilev VG, Papkov VS, Shchegolikhina OI, Slonimskii GL, Zhdanov AA
(1995) Macromol Symp 93: 13590. Tobolsky AV, McLouhglin JR (1952) J Polym Sci 8: 54391. Cheng YT, Johnson WL (1987) Science 235: 99792. Zorn R, McKenna GB, Willner L, Richter D (1995) Macromolecules 28: 855293. Osaki K, Inoue T, Hwang EJ, Okamoto H, Takiguchi O (1994) J Non-cryst Solids 172—174:
83894. Colby RH, Gillmor JR, Galli G, Laus M, Ober CK, Hall E (1993) Liquid Cryst 13: 23395. Rubin SF, Kannan RM, Kornfield JA, Boeffel C (1994) Proc ACS Polym Mater Sci Eng 71:
330, 48696. Munstedt H (1975) Angew Makrom Chem 47: 22997. Zosel A (1972) Rheol Acta 11: 22998. Laun HM (1984a) Angew Makromol Chem 123/124: 33599. White JL (1979) J Non-Newt Fluid Mech 5: 177
100. Buscall R, Goodwin JW, Hawkins MW, Ottewill RH (1982) J Chem Soc Faraday Trans I 78:2873, 2889
101. Munstedt H (1981) Polym Eng Sci 21: 259102. Castellani L, Lomellini P (1991) Plastics, Rubber and Composites Processing and Applications
16: 25103. Minagawa N, White JL (1975) Polym Eng Sci 15: 825104. Krieger IM (1972) Adv Colloid Interface Sci 3: 111105. Krieger IM, Eguiluz M (1976) Trans Soc Rheol 20: 29106. Hoffmann RL (1972) Trans Soc Rheol 16: 155107. Hoffmann RL (1974) J Colloid Interface Sci 46: 491108. Jeffrey DJ, Acrivos A (1976) AIChE J 22: 417109. Russel WB, Saville DA, Schowalter WR (1989) Colloidal Dispersions. Cambridge University
Press, Cambridge
232 H.H. Winter and M. Mours
110. Laun HM (1984) Colloid Polym Sci 262: 257111. Metzner AB (1985) J Rheol 29: 739112. Masuda T, Nakajima A, Kitamura M, Aoki Y, Yamauchi N, Yoshioka A (1984) Pure Appl
Chem 56: 1457113. Weinberger CB, Goddard JD (1974) Intern J Multiphase Flow 1: 465114. Castellani L, Lomellini P (1994) Rheol Acta 33: 446116. Baumgartel M, Winter HH (1992) J Non-Newt Fluid Mech 44: 15115. Venkataraman SK (unpublished results)117. Mours M, Winter HH (1994) Rheol Acta 33: 385118. te Nijenhuis K, Dijkstra D (1975) Rheol Acta 14: 71119. Winter HH, Morganelli P, Chambon F (1988) Macromolecules 21: 532120. Holly EE, Venkataraman SK, Chambon F, Winter HH (1988) J Non-Newt Fluid Mech
27: 17121. Izuka A, Winter HH, Hashimoto T (1994) Macromolecules 27: 6883122. Scanlan JC, Winter HH (1991) Macromolecules 24: 47123. Flory PJ (1974) Faraday Disc 57: 7124. Schmidt M, Burchard W (1981) Macromolecules 14: 370125. Martin JE, Wilcoxon JP, Adolf D (1987) Phys Rev A 36: 1803126. Martin JE, Wilcoxon JP (1988) Phys Rev Lett 61: 373127. Martin JE, Keefer KD (1986) Phys Rev A 34: 4988128. Kajiwara K, Burchard W, Kowalski M, Nerger D, Dusek K, Mateijka L, Tuzar Z (1984)
Makromol Chem 185: 2543129. Valles EM, Macosko CW (1979) Macromolecules 12: 673130. Allain C, Amiel C (1986) Phys Rev Lett 56: 1501131. Barton JM, Buist GJ, Hamerton I, Howlin BJ, Jones RJ, Lin S (1994) Polym Bull 33: 215132. Mijovic J, Kim J, Slaby J (1984) J Appl Polym Sci 29: 1449133. Muzumdar SV, Lee LJ (1991) Polym Eng Sci 31: 1647134. Lee JH, Lee JW (1994) Polym Eng Sci 34: 742135. Soltero J, Gonzalez-Romero V (1988) Proc Ann Techn Meet Soc Plast Eng, ANTEC,
pp 1057—1061136. Walton JR, Williams KPJ (1991) Vibr Spectr 1: 339137. Lyon RE, Chike KE, Angel SM (1994) J Appl Polym Sci 53: 1805138. Macosko CW (1985) Brit Polym J 17: 239139. Lipshitz S, Macosko CW (1976) Polym Eng Sci 16: 803140. Valles EM, Macosko CW (1976) Rubber Chem Tech 49: 1232141. Castro JM, Macosko CW, Perry SJ (1984) Polym Commun 25: 82142. Apicella A, Masi P, Nicolais L (1984) Rheol Acta 23: 291143. Adam M, Delsanti M, Durand D (1985) Macromolecules 18: 2285144. Malkin AY (1985) Plaste Kautschuk 32: 281145. Bidstrup SA (1986) Dissertation University of Minnesota146. Allain C, Salome L (1987) Polym Commun 28: 109147. Axelos MAV, Kolb M (1990) Phys Rev Lett 64: 1457148. Farris RJ, Lee C (1983) Polym Eng Sci 23: 586149. Winter HH (1987) Polym Eng Sci 27: 1698150. Cuvellier G, Peighy-Nourry C, Launay B (1990) In: S Phillips (ed) Gums and stabilizers for the
food industry. IRL, Oxford, UK, pp 549—552151. Malkin AY, Kulichikhin SG (1991) Adv Polym Sci 101: 217152. Gillham JK (1976) Adv Polym Sci 19: 319; (1976) Adv Polym Sci 19: 676153. ASTM Standard (1985) D4473—85154. Tung CYM, Dynes PJ (1982) J Appl Polym Sci 27: 569155. Antonietti M, Folsch KF, Sillescu H, Pakula T (1989) Macromolecules 22: 2812156. Bates FS (1984) Macromolecules 17: 2607157. Larson R (1985) Rheol Acta 24: 327158. Roovers J, Graessley WW (1981) Macromolecules 14: 766159. Cates ME (1985) J Physique 46: 1059160. Muthukumar M (1985) J Chem Phys 83: 3161161. Andrews RD, Tobolsky AV (1951) J Polym Sci 7: 221162. Gouinlock EV, Porter RS (1977) Polym Eng Sci 17: 535163. Chung CI, Lin MI (1978) J Polym Sci, Polym Phys Ed 16: 545
Rheology of Polymers Near Liquid-Solid Transitions 233

164. Winter HH (1994) J Non-cryst solids 172—174: 1158165. Valles EM, Carella JM, Winter HH, Baumgartel M (1990) Rheol Acta 29: 535166. Khan SA, Plitz IM, Frank RA (1992) Rheol Acta 31: 151167. Zosel A (1991) J Adhesion 34: 201
Editor: Prof. K. DusekReceived: October 1996
234 Rheology of Polymers Near Liquid-Solid Transitions:H.H. Winter and M. Mours