Embed Size (px)
Citation preview
Review
Rheumatoid arthritis: direct and indirect costs
Anne-Christine Rat a,b, Marie-Christophe Boissier a,b,*a Rheumatology Department, Avicenne Teaching Hospital (AP-HP), 125, route de Stalingrad, CHU Avicenne, 93009 Bobigny cedex, France
b UPRES EA-3408, UFR Léonard de Vinci, Paris North University, Bobigny, France
Received 22 April 2003; accepted 8 January 2004
Available online 27 February 2004
Abstract
Rheumatoid arthritis (RA) causes disability, deformities, progressive radiological joint damage often with a need for joint replacementsurgery, premature death, and alterations in quality of life. The economic burden created by RA is enormous. Direct costs per patient have beenestimated at 1812–11 792 Q annually and indirect costs at 1260–37 994 Q annually. These mean values are approximations, as variations occuracross countries, healthcare system organizations, and geographic locations. Direct costs account for one-fourth to slightly over a half of thetotal cost. Costs associated with inpatient care contribute up to 75% of direct costs, as compared to only about 20% for medications, althoughwide variations occur in costs related to drug monitoring and side-effect management. Physician visits account for about 20% of direct costs.As compared to indirect health costs for individuals from the general population, those for RA patients are increasing at a rapid rate. Indirectcosts account for 80% of the excess cost related to RA. Cost estimates may change over time and show huge variations across individuals, witha small minority of patients accounting for most of the costs. Disability as measured by the Health Assessment Questionnaire (HAQ) has amajor impact on costs. Early effective treatment may not only postpone and slow disease progression, thereby improving quality of life, butalso decrease costs by preserving productivity and reducing the need for surgery, admission to acute-care and extended-care hospitals, andsocial service utilization. Data are beginning to accumulate on the excess costs associated with biotherapies and other new second-line drugs.They indicate acceptable excess costs relative to the additional medical benefits and to the cost-effectiveness of other healthcare programs.Nevertheless, the threshold that defines an acceptable excess cost is arbitrary and varies with local economic conditions.© 2004 Elsevier SAS. All rights reserved.
Keywords: Rheumatoid arthritis; Health economics; Costs
1. Introduction
Rheumatoid arthritis (RA) is the leading inflammatoryjoint disease, with an estimated prevalence in the 0.1–0.62%range [1,2] and a prevalence peak between 40 and 60 years ofage. The chronic course with progressive joint destructionand flares of inflammation often lead to major disabilityresponsible for severe limitations in quality of life, workcapacity, family involvement, and social activities [3]. RAexacts a huge economic toll. In 1994, the cost of RA ac-counted for 0.3% of the gross domestic product in the US [4].
Cost-analysis studies have become indispensable tools foroptimizing both the finite resources allocated by health au-
thorities and RA management strategies. Interpreting theirresults is challenging, however, because of the marked het-erogeneity in study methods. Costs were calculated from theperspective of society in most studies, although a few groupsfocused on the perspective of patients or health insuranceagencies. Data were usually obtained by self-questionnairesadministered every 6–12 months [4–6]; a small number ofstudies used registries, administrative health data [7,8], ormedical records. Retrospective [9], prospective [5,10–18],and cross-sectional [7,8] designs have been used. Further-more, cost calculation methods and variables selected forevaluation varied substantially across studies. In an effort topromote standardization, a list for collecting and classifyingcost domains to be evaluated in cost-of-illness studies for RAwas published recently (Table 1) [19,20]. Some studiesevaluated hospital patients recruited on a volunteer basis,
* Corresponding author.E-mail address: [email protected]
(M.-C. Boissier).
Joint Bone Spine 71 (2004) 518–524
http://france.elsevier.com/direct/BONSOI/
© 2004 Elsevier SAS. All rights reserved.doi:10.1016/j.jbspin.2004.01.003
others cohorts from the general population [12,21–23], andyet others patients seen at outpatient clinics, registered with ahealth maintenance organization, or enrolled in clinical tri-als. Variations in disease duration introduce further heteroge-neity: some studies selected patients with recent-onset RA[6,11,14,15,24], whereas others did not. Most studies inves-tigated prevalent cases [7] but a few selected incident cases[6,11,14,24]. Differences in healthcare system organization[25,26] may exist across regions of a given country [25,27],and changes occur over time. Indirect costs are difficult toestimate because they include many components, such assick-leave days, work disability, the impact of mortality, andlost contributions to national health insurance and welfareagencies. Some published studies used lost income and oth-ers lost human capital. In addition, methods used to evaluatethe cost of days off work varied across studies. Many indirectcosts were frequently overlooked, including lost days ofunpaid work (students, homemakers, and retirees), lost daysof family work, and lost opportunities such as absence ofpromotion at work. Few studies compare costs to those inpopulations without RA or without musculoskeletal disease[4,23,28].
2. Healthcare resource utilization
Mean numbers of physician visits per patient with RAranged from 7 to 20 each year [4,5,17,29,30]. Yelin [4,12]
found 10–12 visits for RA and four visits for other reasonsper year. Numbers of rheumatologist visits per patient rangedfrom 2 to 6.5 each year [4–7,12,17,21,30] and numbers ofvisits to primary care physicians from 2.7 to 9.6 per year[6,7,17,29]. Visits to physical therapists or occupationaltherapists occurred about twice a year [5,7,17], with a maxi-mum of 12 per year in one study [6]. Numbers per patientwere about 2.3 per year for alternative therapies and 13 peryear for investigations [5,17,29]. As compared to a controlgroup of patients free of chronic disease, the proportion ofpatients with RA who reported at least one encounter with ahealthcare professional was increased 1.1–4.2-fold [29].
Mean number of hospital admissions varied from 0.13 to0.34 per year [4,5,12]. In one cohort, 39% of patients hadbeen admitted within the last 12 months, a proportion threetimes higher than that in a control group [29]. Hospitaladmission was noted within the last 24 months in 35% ofpatients in a cross-sectional study in France [21] and withinthe last 12 months in 19% of patients in a study from the US[17]. Yelin and Wanke [12] found that fewer than 10% ofpatients were admitted at least once because of their RA, butthat hospitalizations for other reasons were twice as commonand lasted twice as long as those for RA. Conversely, Laneset al. [30] noted that 81% of admissions were for jointreplacement surgery related to RA. Mean stay durations inacute-care hospitals varied from 7.8 to 16.3 days[5,17,21,29]. Few patients required admission to extended-care facilities (0.03–0.05%), where mean stay durationranged from 100 to 189 days [5,17]. In a prospective multi-center study conducted in 816 RA patients in the US andCanada, factors associated with hospital admission includedthe degree of disability, age, disease duration, pain severity,glucocorticoid therapy, number of previous second-linedrugs, years of education, type of health insurance, andcenter. Hospital stay duration varied across centers and washigher in patients with more years of education. Hospitalcosts were associated with the center and stay duration butnot with RA duration or severity [25].
Among RA patients in the population at large, 90% (357)had used healthcare services, as compared to 82% of indi-viduals without musculoskeletal disease (nonsignificant dif-ference) [22]. In contrast, in a 1996 population-based study,primary care physician and rheumatologist visits were re-ported by 90% and 93% of 223 RA patients, respectively, ascompared to 70% and 71% of 446 controls free of chronicdisease; here, the differences were statistically significant[29]. Overall, resource utilization varied with sex, geo-graphic location, and whether the patient was employed[25,29]. In addition, a significant association was found be-tween healthcare resource utilization and Health AssessmentQuestionnaire (HAQ) scores in 642 RA patients monitoredover a 2-year period. Utilization was significantly greater inthe upper quartile of HAQ and SF-36 scores: for instance, ascompared to the lower quartile, rheumatologist visits wereincreased by 48% and hospital admissions by 200% [31].
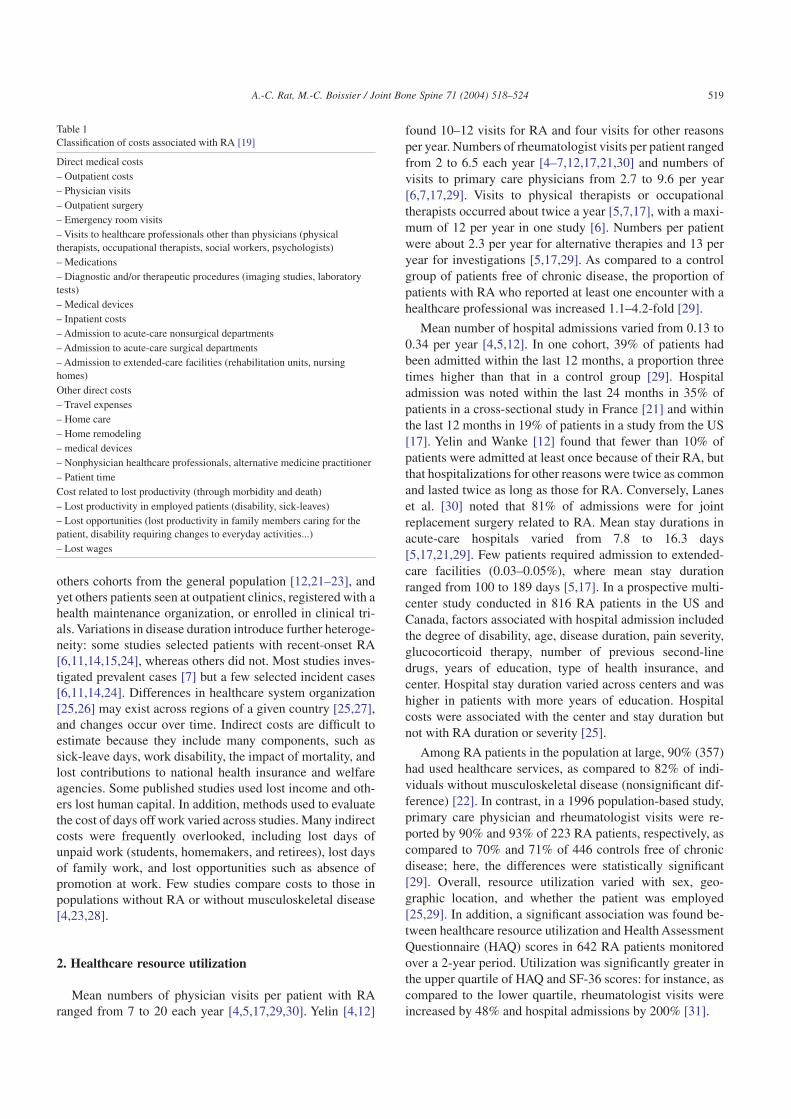
Table 1Classification of costs associated with RA [19]
Direct medical costs– Outpatient costs– Physician visits– Outpatient surgery– Emergency room visits– Visits to healthcare professionals other than physicians (physicaltherapists, occupational therapists, social workers, psychologists)– Medications– Diagnostic and/or therapeutic procedures (imaging studies, laboratorytests)– Medical devices– Inpatient costs– Admission to acute-care nonsurgical departments– Admission to acute-care surgical departments– Admission to extended-care facilities (rehabilitation units, nursinghomes)Other direct costs– Travel expenses– Home care– Home remodeling– medical devices– Nonphysician healthcare professionals, alternative medicine practitioner– Patient timeCost related to lost productivity (through morbidity and death)– Lost productivity in employed patients (disability, sick-leaves)– Lost opportunities (lost productivity in family members caring for thepatient, disability requiring changes to everyday activities...)– Lost wages
519A.-C. Rat, M.-C. Boissier / Joint Bone Spine 71 (2004) 518–524
3. The cost of rheumatoid arthritis
3.1. Cost components
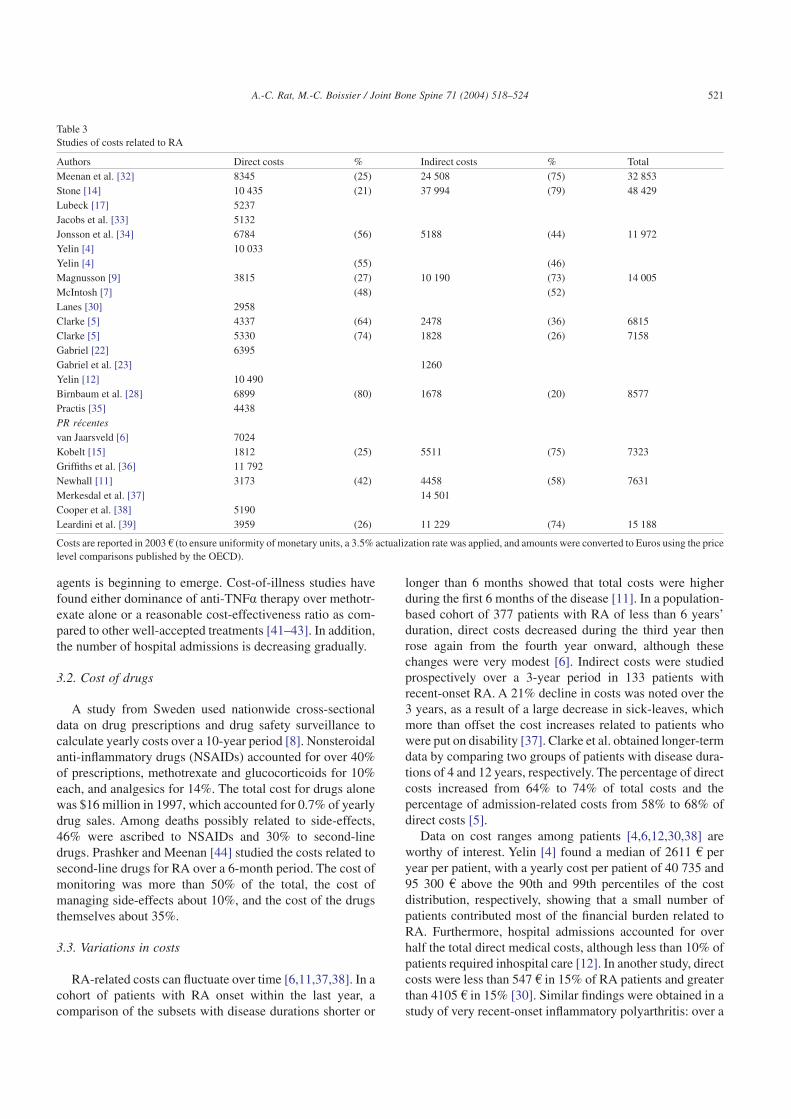
Although a rough sketch of the relative importance of costcategories can be drawn from available data, the variationsacross methods and countries are too great too allow com-parisons or calculations of means (Tables 2 and 3[4–7,9,11,12,14,15,17,22,23,28,30,32–40]). In most studies,results are reported as means, which mask major interindi-vidual differences because costs are markedly skewed to theleft, with a small minority of patients accounting for a largeproportion of the costs. This results in a large differencebetween means and medians; for instance, in the study byYelin and Wanke [12], direct costs had a mean of 10 490 Q perpatient per year and a median of only 3332 Q. Similarly,Cooper et al. [38] reported a mean of 5190 Q and a median of2107 Q.
Direct costs account for one-fourth to slightly more thanhalf the total costs, ranging from 1812 to 11 792 Q per patientper year. Indirect costs range from 1260 to 37 994 Q, account-ing for 26–75% of total costs. Indirect costs were lowest incohorts with larger proportions of retirees and in studies that
disregarded loss of unpaid activities. Inhospital care contrib-utes up to 75% of direct costs and institutionalization about17%. Drug therapy accounts for only about 20% of directcosts, but costs of drug monitoring, side-effect management,and the drugs themselves vary widely across second-linedrugs. Physician visits account for 20% of direct costs (4–9%of total costs) [5,7,11], visits to other healthcare profession-als for 5%, and investigations for 12%. Alternative treat-ments, outpatient surgery, medical equipment, and homeremodeling each account for a few percentage points. Theseproportions can be expected to change in the near future withthe introduction of new drugs and therapeutic strategies thatare far more costly but also considerably more effective thancurrent second-line treatments. For instance, in one study, theproportion of direct costs attributable to drugs was 33% withthe hydroxychloroquine–sulfasalazine–methotrexate combi-nation and 78% with the etanercept–methotrexate combina-tion. In addition, a number of factors influence the efficiencyof these new treatments, including the cost of the drugs anddrug monitoring and the savings related to delayed diseaseprogression. The place given to these new treatments relativeto other second-line drugs also has an economic impact. Apicture of the clinical and economic impact of anti-TNFa
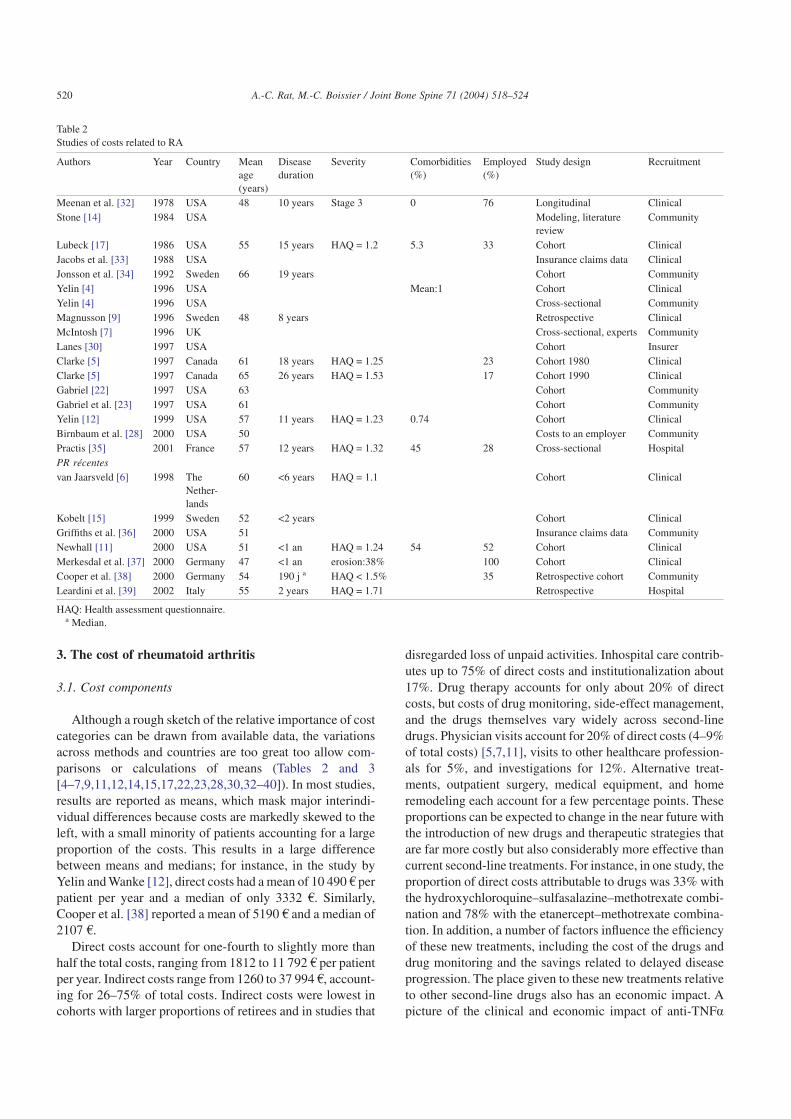
Table 2Studies of costs related to RA
Authors Year Country Meanage(years)
Diseaseduration
Severity Comorbidities(%)
Employed(%)
Study design Recruitment
Meenan et al. [32] 1978 USA 48 10 years Stage 3 0 76 Longitudinal ClinicalStone [14] 1984 USA Modeling, literature
reviewCommunity
Lubeck [17] 1986 USA 55 15 years HAQ = 1.2 5.3 33 Cohort ClinicalJacobs et al. [33] 1988 USA Insurance claims data ClinicalJonsson et al. [34] 1992 Sweden 66 19 years Cohort CommunityYelin [4] 1996 USA Mean:1 Cohort ClinicalYelin [4] 1996 USA Cross-sectional CommunityMagnusson [9] 1996 Sweden 48 8 years Retrospective ClinicalMcIntosh [7] 1996 UK Cross-sectional, experts CommunityLanes [30] 1997 USA Cohort InsurerClarke [5] 1997 Canada 61 18 years HAQ = 1.25 23 Cohort 1980 ClinicalClarke [5] 1997 Canada 65 26 years HAQ = 1.53 17 Cohort 1990 ClinicalGabriel [22] 1997 USA 63 Cohort CommunityGabriel et al. [23] 1997 USA 61 Cohort CommunityYelin [12] 1999 USA 57 11 years HAQ = 1.23 0.74 Cohort ClinicalBirnbaum et al. [28] 2000 USA 50 Costs to an employer CommunityPractis [35] 2001 France 57 12 years HAQ = 1.32 45 28 Cross-sectional HospitalPR récentesvan Jaarsveld [6] 1998 The
Nether-lands
60 <6 years HAQ = 1.1 Cohort Clinical
Kobelt [15] 1999 Sweden 52 <2 years Cohort ClinicalGriffiths et al. [36] 2000 USA 51 Insurance claims data CommunityNewhall [11] 2000 USA 51 <1 an HAQ = 1.24 54 52 Cohort ClinicalMerkesdal et al. [37] 2000 Germany 47 <1 an erosion:38% 100 Cohort ClinicalCooper et al. [38] 2000 Germany 54 190 j a HAQ < 1.5% 35 Retrospective cohort CommunityLeardini et al. [39] 2002 Italy 55 2 years HAQ = 1.71 Retrospective Hospital
HAQ: Health assessment questionnaire.a Median.
520 A.-C. Rat, M.-C. Boissier / Joint Bone Spine 71 (2004) 518–524
agents is beginning to emerge. Cost-of-illness studies havefound either dominance of anti-TNFa therapy over methotr-exate alone or a reasonable cost-effectiveness ratio as com-pared to other well-accepted treatments [41–43]. In addition,the number of hospital admissions is decreasing gradually.
3.2. Cost of drugs
A study from Sweden used nationwide cross-sectionaldata on drug prescriptions and drug safety surveillance tocalculate yearly costs over a 10-year period [8]. Nonsteroidalanti-inflammatory drugs (NSAIDs) accounted for over 40%of prescriptions, methotrexate and glucocorticoids for 10%each, and analgesics for 14%. The total cost for drugs alonewas $16 million in 1997, which accounted for 0.7% of yearlydrug sales. Among deaths possibly related to side-effects,46% were ascribed to NSAIDs and 30% to second-linedrugs. Prashker and Meenan [44] studied the costs related tosecond-line drugs for RA over a 6-month period. The cost ofmonitoring was more than 50% of the total, the cost ofmanaging side-effects about 10%, and the cost of the drugsthemselves about 35%.
3.3. Variations in costs
RA-related costs can fluctuate over time [6,11,37,38]. In acohort of patients with RA onset within the last year, acomparison of the subsets with disease durations shorter or
longer than 6 months showed that total costs were higherduring the first 6 months of the disease [11]. In a population-based cohort of 377 patients with RA of less than 6 years’duration, direct costs decreased during the third year thenrose again from the fourth year onward, although thesechanges were very modest [6]. Indirect costs were studiedprospectively over a 3-year period in 133 patients withrecent-onset RA. A 21% decline in costs was noted over the3 years, as a result of a large decrease in sick-leaves, whichmore than offset the cost increases related to patients whowere put on disability [37]. Clarke et al. obtained longer-termdata by comparing two groups of patients with disease dura-tions of 4 and 12 years, respectively. The percentage of directcosts increased from 64% to 74% of total costs and thepercentage of admission-related costs from 58% to 68% ofdirect costs [5].
Data on cost ranges among patients [4,6,12,30,38] areworthy of interest. Yelin [4] found a median of 2611 Q peryear per patient, with a yearly cost per patient of 40 735 and95 300 Q above the 90th and 99th percentiles of the costdistribution, respectively, showing that a small number ofpatients contributed most of the financial burden related toRA. Furthermore, hospital admissions accounted for overhalf the total direct medical costs, although less than 10% ofpatients required inhospital care [12]. In another study, directcosts were less than 547 Q in 15% of RA patients and greaterthan 4105 Q in 15% [30]. Similar findings were obtained in astudy of very recent-onset inflammatory polyarthritis: over a
Table 3Studies of costs related to RA
Authors Direct costs % Indirect costs % TotalMeenan et al. [32] 8345 (25) 24 508 (75) 32 853Stone [14] 10 435 (21) 37 994 (79) 48 429Lubeck [17] 5237Jacobs et al. [33] 5132Jonsson et al. [34] 6784 (56) 5188 (44) 11 972Yelin [4] 10 033Yelin [4] (55) (46)Magnusson [9] 3815 (27) 10 190 (73) 14 005McIntosh [7] (48) (52)Lanes [30] 2958Clarke [5] 4337 (64) 2478 (36) 6815Clarke [5] 5330 (74) 1828 (26) 7158Gabriel [22] 6395Gabriel et al. [23] 1260Yelin [12] 10 490Birnbaum et al. [28] 6899 (80) 1678 (20) 8577Practis [35] 4438PR récentesvan Jaarsveld [6] 7024Kobelt [15] 1812 (25) 5511 (75) 7323Griffiths et al. [36] 11 792Newhall [11] 3173 (42) 4458 (58) 7631Merkesdal et al. [37] 14 501Cooper et al. [38] 5190Leardini et al. [39] 3959 (26) 11 229 (74) 15 188
Costs are reported in 2003 Q (to ensure uniformity of monetary units, a 3.5% actualization rate was applied, and amounts were converted to Euros using the pricelevel comparisons published by the OECD).
521A.-C. Rat, M.-C. Boissier / Joint Bone Spine 71 (2004) 518–524
5-year period, about one-fifth of the patients generated nocosts (for treatment, hospitalization, or specialist manage-ment) and 21% of patients generated 80% of the costs [38].
Studies of factors that predict costs have produced fairlyconsistent results. Lubeck et al. used multivariate analysis toadjust costs according to characteristics known to influencehealthcare resource utilization. HAQ scores were stronglycorrelated with total costs [17]. Similarly,Yelin et al. found aclose correlation between HAQ scores and RA-related costs.None of the other variables influenced the costs to a similarextent. The cost was 4592 Q for patients in the lowest HAQquartile and 11 696 Q for those in the highest quartile. Theimpact of disability as assessed by the HAQ score was great-est between the second and third quartiles and between thethird and fourth quartiles, suggesting that preventing HAQscore increases from the second quartile to higher quartilesmay be associated with substantial cost savings. In the 10-year study, baseline functional status and HAQ change influ-enced costs [12]. In a cohort of 858 Canadian patients moni-tored for 12 years using questionnaires completed at 6-monthintervals, factors that strongly predicted higher costs andgreater resource utilization included well-being, pain, dis-ease duration, and functional status. Female gender, youngerage, shorter disease duration, more years of education, andbeing on disability also predicted higher costs. Older age wasassociated with increased costs related to inhospital care butalso with a decrease in indirect costs (entirely ascribable tothe cost evaluation method used in this study). A 1-pointincrease in the HAQ score was associated with a 41% costincrease over the next 6 months. Patients whose HAQ scorewas greater than 1.5 had a fourfold increase in inpatient carecosts, and the increase was 50-fold for admissions toextended-care facilities [5,13]. Functional status and painscore also predicted indirect medical costs and nonmedicalcosts (traveling, housework help, medical equipment) in acohort study from the US [23]. Similarly, in patients withrecent-onset RA, disability was the strongest predictor ofhigh costs and age was associated with lower costs [6].
In addition to disability, the morbidity associated with RAencompasses the many conditions produced by medicationsand chronic inflammation, including diabetes mellitus, hy-pertension, premature atheroma, and osteoporosis. Severalstudies separated costs related directly to RA from costsrelated to comorbidities. In a database study of 1025 RApatients with follow-ups of up to 14 years, comorbiditiesaccounted for twice as many admissions as did RA, and thecost of managing comorbidities contributed 43% of directmedical costs [4]. In an estimation of the costs of RA to anemployer, 68% of direct costs were related to comorbidities[28], whereas another study found that comorbidities con-tributed 34% of direct costs, with 10% being related toside-effects of drugs [36]. In patients with early RA, themean direct cost due to comorbidities was $166 per month, asubstantial proportion of the $200 total monthly direct cost[11].
3.4. Comparisons of costs in patients with and withoutrheumatoid arthritis
Gabriel et al. compared costs generated by RA patientswith patients from the general population who had no mus-culoskeletal disease recorded in a population-based countydatabase. Mean direct medical costs were 6395 Q for PR and2333 Q for the other patients, and the corresponding medianswere 1766 and 390 Q. In the RA cohort, the costs of medicalmanagement were 6.4-times the costs in patients withoutmusculoskeletal disease. In addition, in the RA patients,costs were higher for the management of nonmusculoskeletalconditions, diagnostic and therapeutic procedures, inpatientcare, imaging studies, laboratory tests, and physician visits.Anti-rheumatic drugs, gastroprotective agents, glucocorti-coids, diuretics, and insulin were more likely to be used byRA patients than by patients without musculoskeletal disease[22]. The number of days of healthcare was increased three-fold in the patients with RA as compared to the controls. RApatients were more likely to have lost their job, retired pre-maturely, shortened their work hours, or stopped workingbecause of their disease. Loss of family income was threetimes more common in the RA patients, and 15% of RApatients as compared to 5% of controls were unable to workbecause of their disease. Functional status and pain scorepredicted both costs and healthcare resource utilization [23].In a study of costs to an employer in the US, costs were twiceas high in the RA group than in the control group. Costsrelated to lost work were increased 1.6-fold in the RA pa-tients as compared to the controls [28]. In another study,mean direct costs in patients with RA were four times higherthan in patients with osteoarthritis [30]. In a sample represen-tative of noninstitutionalized individuals living in the US,0.7% of respondents had RA, and in this subset, the propor-tion of individuals with paid jobs was 16% lower than in agroup without RA matched on age, sex, and ethnic group.Comparing RA patients to the general population showedthat direct medical costs were mainly ascribable to hospitaladmissions. Indirect costs were far greater among the RApatients and contributed 80% of the cost increase as com-pared to the population at large [4].
4. Estimates for France
The first study done in France was a nationwide cross-sectional survey conducted in 1996 among office-based rheu-matologists [21], each of whom was to complete a form forthe first four RA patients seen. Of the 1629 patients withpolyarthritis included in the study, 29% were employed, 21%were homemakers, and 38% were retirees. Of the employedpatients, 44% were on sick-leave and 36% were on sick-leavebecause of their RA; 19% were work-disabled because oftheir RA, the mean time from RA onset to work disabilitybeing 6 years. The disease was quiescent in 9% of cases,minimally active in 32%, active in 46%, and very active in
522 A.-C. Rat, M.-C. Boissier / Joint Bone Spine 71 (2004) 518–524
13%. A need for partial or intermittent help was noted in 22%of patients, and 2% of patients were completely dependent.The treatment included second-line drugs in 84% of patients,glucocorticoids in 52%, NSAIDs and analgesics in 61%,gastroprotective agents in 45%, and anxiety-relieving agentsin 10%. Methotrexate was the most commonly used second-line drug (45% of second-line drugs), and 6% of patientswere taking more than one second-line drug. Follow-up wasby a rheumatologist in 59% of patients and both a rheuma-tologist and a primary care physician in an additional 39%. Ahistory of one or more surgical procedures was noted in 24%of patients. A hospital-based study was conducted among20 incident cases of RA managed prospectively by a multi-disciplinary team. Costs and quality of life were evaluatedover a 6-month period. The female-to-male ratio was 4:1,mean age was 56 years, mean disease duration was60 months, and six of the 20 patients were on second-linetherapy at study inclusion. Improvements in clinical andlaboratory test criteria were noted after 3 and 6 months. Atthe first hospital admission, laboratory tests contributed 38%of costs and medical activity 18.8%. Costs declined betweenthe first admission and the 3-month evaluation. The total costof management over the 6-month study period was3423 ± 880 Q, including 39% for laboratory tests, 16% forrheumatologist visits, and about 10% for each of the othercost categories. It should be borne in mind that the costs werethose of the specific management program used in the studycenter and may not apply to other centers; in addition, only20 patients were studied [18]. A recent cross-sectional surveyof RA patients receiving follow-up in hospitals evaluatedcosts of management from the perspective of the nationalhealth insurance agency [35,45–47]. The median direct costwas 2021 Q (mean, 4003 Q) per year and per patient, whereastransfer payments (disability benefits, housework help, andsick-leave benefits) were 2742 Q per patient per year. Admis-sions contributed 60% of costs, outpatient treatments 13%,outpatient visits 7%, and medical supplies and professionalhealthcare by nonphysicians 9%. The most recent estimate ofmedical resource utilization by RA patients in France comesfrom a prospective comparison of 223 RA patients and446 controls. Drug treatments, number of physician visits,number of visits to other healthcare professionals and tosocial services, and number of admissions were significantlygreater in the RA group. Functional status, employmentstatus, age, and geographic region were significantly associ-ated with medical resource utilization [29].
5. Conclusions
RA creates a huge burden of physical, emotional, social,and economic costs. Costs related to RA may vary over thecourse of the disease, being highest in the first 6 monthsbecause of the initial evaluation and stabilizing at a lowerlevel in the next few years. Increases are occurring not only incosts directly related to RA, but also in those related to
comorbidities. In addition, considerable heterogeneity existsacross patients, as clinical consequences and disease severityvary widely. Thus, a small proportion of the patients generatemost of the costs.
Early and effective treatment may not only postpone andslow disease progression, thereby improving quality of life,but also reduce costs by decreasing lost productivity, surgicalprocedures, and requirements for extended-care facility ad-mission and social service utilization. Preliminary informa-tion suggests that excess costs associated with new second-line treatments, most notably biotherapies, are notunreasonable as compared to the medical benefits providedand to other health programs. The introduction of biothera-pies will radically change the characteristics of the hugeeconomic burden imposed by RA. Economic studies areneeded, as well as evaluations of the various available treat-ment strategies, particularly in France. The results of ongo-ing nationwide studies are impatiently awaited.
References
[1] Gabriel SE, Crowson CS, O’Fallon WM. The epidemiology of rheu-matoid arthritis in Rochester, Minnesota, 1955–1985. ArthritisRheum 1999;42:415–20.
[2] Saraux A, Guedes C, Allain J, Devauchelle V, Valls I, Lamour A, et al.Prevalence of rheumatoid arthritis and spondyloarthropathy in Brit-tany, France. Societe de Rhumatologie de l’Ouest. J Rheumatol 1999;26:2622–7.
[3] Pincus T, Sokka T, Wolfe F. Premature mortality in patients withrheumatoid arthritis: evolving concepts. Arthritis Rheum 2001;44:1234–6.
[4] Yelin E. The costs of rheumatoid arthritis: absolute, incremental, andmarginal estimates. J Rheumatol Suppl 1996;44:47–51.
[5] Clarke AE, Zowall H, Levinton C, Assimakopoulos H, Sibley JT,Haga M, et al. Direct and indirect medical costs incurred by Canadianpatients with rheumatoid arthritis: a 12 year study. J Rheumatol1997;24:1051–60.
[6] van Jaarsveld CH, Jacobs JW, Schrijvers AJ, Heurkens AH,Haanen HC, Bijlsma JW. Direct cost of rheumatoid arthritis during thefirst 6 years: a cost-of-illness study. Br J Rheumatol 1998;37:837–47.
[7] McIntosh E. The cost of rheumatoid arthritis. Br J Rheumatol 1996;35:781–90.
[8] Blomqvist P, Feltelius N, Ekbom A, Klareskog L. Rheumatoid arthri-tis in Sweden. Drug prescriptions, costs, and adverse drug reactions. JRheumatol 2000;27:1171–7.
[9] Magnusson S. Treatment of rheumatoid arthritis; does it affect soci-ety’s cost for the disease? Br J Rheumatol 1996;35:791–5.
[10] Wolfe F, Hawley DJ. The long-term outcomes of rheumatoid arthritis:work disability: a prospective 18 year study of 823 patients. J Rheu-matol 1998;25:2108–17.
[11] Newhall-Perry K, Law NJ, Ramos B, Sterz M, Wong WK, Bul-pitt KJ, et al. Direct and indirect costs associated with the onset ofseropositive rheumatoid arthritis. Western Consortium of PracticingRheumatologists. J Rheumatol 2000;27:1156–63.
[12] Yelin E, Wanke LA. An assessment of the annual and long-term directcosts of rheumatoid arthritis: the impact of poor function and func-tional decline. Arthritis Rheum 1999;42:1209–18.
[13] Clarke AE, Levinton C, Joseph L, Penrod J, Zowall H, Sibley JT, et al.Predicting the short term direct medical costs incurred by patientswith rheumatoid arthritis. J Rheumatol 1999;26:1068–75.
[14] Stone CE. The lifetime economic costs of rheumatoid arthritis. JRheumatol 1984;11:819–27.
523A.-C. Rat, M.-C. Boissier / Joint Bone Spine 71 (2004) 518–524
[15] Kobelt G, Eberhardt K, Jonsson L, Jonsson B. Economic conse-quences of the progression of rheumatoid arthritis in Sweden. Arthri-tis Rheum 1999;42:347–56.
[16] Kobelt G, Jonsson L, Lindgren P,Young A, Eberhardt K. Modeling theprogression of rheumatoid arthritis: a two-country model to estimatecosts and consequences of rheumatoid arthritis. Arthritis Rheum2002;46:2310–9.
[17] Lubeck DP, Spitz PW, Fries JF, Wolfe F, Mitchell DM, Roth SH. Amulticenter study of annual health service utilization and costs inrheumatoid arthritis. Arthritis Rheum 1986;29:488–93.
[18] Maravic M, Bozonnat MC, Sevezan A, Gasqueres D, Pastor J,Pere M, et al. Preliminary evaluation of medical outcomes (includingquality of life) and costs in incident RA cases receiving hospital-basedmultidisciplinary management. Jt Bone Spine 2000;67:425–33.
[19] Merkesdal S, Ruof J, Huelsemann JL, Schoeffski O, Maetzel A,Mau W, et al. Development of a matrix of cost domains in economicevaluation of rheumatoid arthritis. J Rheumatol 2001;28:657–61.
[20] Ruof J, Merkesdal S, Huelsemann JL, Schoeffski O, Maetzel A,Mau W, et al. Cost assessment instrument in rheumatology: evaluationof applied instrument characteristics. J Rheumatol 2001;28:662–5.
[21] Sany J, Dropsy R, Daures JP. Cross-sectional epidemiological surveyof rheumatoid arthritis patients seen in private practice in France.Descriptive results (1629 cases). Rev Rhum Engl Ed 1998;65:462–70.
[22] Gabriel SE, Crowson CS, Campion ME, O’Fallon WM. Direct medi-cal costs unique to people with arthritis. J Rheumatol 1997;24:719–25.
[23] Gabriel SE, Crowson CS, Campion ME, O’Fallon WM. Indirect andnonmedical costs among people with rheumatoid arthritis andosteoarthritis compared with nonarthritic controls. J Rheumatol 1997;24:43–8.
[24] Sokka T, Pincus T. Markers for work disability in rheumatoid arthritis.J Rheumatol 2001;28:1718–22.
[25] Wolfe F, Kleinheksel SM, Spitz PW, Lubeck DP, Fries JF,Young DY, et al. A multicenter study of hospitalization in rheumatoidarthritis. Frequency, medical–surgical admissions, and charges.Arthritis Rheum 1986;29:614–9.
[26] Ariza-Ariza R, Mestanza-Peralta M, Cardiel MH. Direct costs ofmedical attention to Mexican patients with rheumatoid arthritis in atertiary care center. Clin Exp Rheumatol 1997;15:75–8.
[27] Ferraz MB, Maetzel A, Bombardier C. A summary of economicevaluations published in the field of rheumatology and related disci-plines. Arthritis Rheum 1997;40:1587–93.
[28] Birnbaum HG, Barton M, Greenberg PE, Sisitsky T, Auerbach R,Wanke LA, et al. Direct and indirect costs of rheumatoid arthritis to anemployer. J Occup Environ Med 2000;42:588–96.
[29] Girard F, Guillemin F, Novella JL, Valckenaere I, Krzanowska K,Vitry F, et al. Health-care use by rheumatoid arthritis patients com-pared with non-arthritic subjects. Rheumatology (Oxford) 2002;41:167–75.
[30] Lanes SF, Lanza LL, Radensky PW, Yood RA, Meenan RF,Walker AM, et al. Resource utilization and cost of care for rheumatoidarthritis and osteoarthritis in a managed care setting: the importance ofdrug and surgery costs. Arthritis Rheum 1997;40:1475–81.
[31] Ethgen O, Kahler KH, Kong SX, Reginster JY, Wolfe F. The effect ofhealth related quality of life on reported use of health care resources inpatients with osteoarthritis and rheumatoid arthritis: a longitudinalanalysis. J Rheumatol 2002;29:1147–55.
[32] Meenan RF, Anderson JJ, Kazis LE, Egger MJ, Altz-Smith M, Sam-uelson Jr CO, et al. Outcome assessment in clinical trials. Evidencefor the sensitivity of a health status measure. Arthritis Rheum 1984;27:1344–52.
[33] Jacobs J, Keyserling JA, Britton M, Morgan Jr GJ, Wilkenfeld J,Hutchings HC. The total cost of care and the use of pharmaceuticals inthe management of rheumatoid arthritis: the Medi-Cal program. J ClinEpidemiol 1988;41:215–23.
[34] Jonsson B, Rehnberg C, Borgquist L, Larsson SE. Locomotion statusand costs in destructive rheumatoid arthritis. A comprehensive studyof 82 patients from a population of 13 000. Acta Orthop Scand1992;63:207–12.
[35] Guillemin F, Sibilia J, Daurès JP, Durieux S, Lafuma A, Fag-nani F, et al. Practis. Étude médico-économique des caractéristiques etde la prise en charge de la PR à l’hôpital en France: Coûts de lapolyarthrite rhumatoide en France. SFR abstract. Rev Rhum 2001;68:C01.
[36] Griffiths RI, Bar-Din M, MacLean C, Sullivan EM, Herbert RJ,Yelin EH. Patterns of disease-modifying antirheumatic drug use,medical resource consumption, and cost among rheumatoid arthritispatients. Ther Apher 2001;5:92–104.
[37] Merkesdal S, Ruof J, Schoffski O, Bernitt K, Zeidler H, Mau W.Indirect medical costs in early rheumatoid arthritis: composition ofand changes in indirect costs within the first 3 years of disease.Arthritis Rheum 2001;44:528–34.
[38] Cooper NJ, Mugford M, Scott DG, Barrett EM, Symmons DP. Sec-ondary health service care and second line drug costs of early inflam-matory polyarthritis in Norfolk, UK. J Rheumatol 2000;27:2115–22.
[39] Leardini G, Salaffi F, Montanelli R, Gerzeli S, Canesi B.A multicentercost-of-illness study on rheumatoid arthritis in Italy. Clin Exp Rheu-matol 2002;20:505–15.
[40] Pugner KM, Scott DI, Holmes JW, Hieke K. The costs of rheumatoidarthritis: an international long-term view. Semin Arthritis Rheum2000;29:305–20.
[41] Wong JB, Singh G, Kavanaugh A. Estimating the cost-effectiveness of54 weeks of infliximab for rheumatoid arthritis. Am J Med 2002;113:400–8.
[42] Kobelt G, Jonsson L,Young A, Eberhardt K. The cost-effectiveness ofinfliximab (Remicade) in the treatment of rheumatoid arthritis inSweden and the United Kingdom based on the ATTRACT study.Rheumatology (Oxford) 2003;42:326–35.
[43] Brennan A, Bansback N, Reynolds A, Conway P. Modeling the cost-effectiveness of etanercept in adults with rheumatoid arthritis in theUK. Rheumatology 2004;43:62–71.
[44] Prashker MJ, Meenan RF. The total costs of drug therapy for rheuma-toid arthritis. A model based on costs of drug, monitoring, and toxic-ity. Arthritis Rheum 1995;38:318–25.
[45] Daurès JP, Sibilia J, Guillemin F, Durieux S, Lafuma A, Fag-nani F, et al. Practis. Étude médico-économique des caractéristiques etde la prise en charge de la PR à l’hôpital en France: description de laméthodologie générale. SFR abstract. Rev Rhum 2001;68:C01[abstract].
[46] Sany J, Bourgeois P, Saraux A, Durieux S, Lafuma A, Fagnani F, et al.Practis. étude médico-économique des caractéristiques et de la priseen charge de la PR à l’hôpital en France: aspects actuels de lapolyarthrite rhumatoide en France. SFR abstract. Rev Rhum 2001;68:C01.
[47] Saraux A, Daurès JP, Sany J, Durieux S, Lafuma A, Fagnani F, et al.Practis. étude médico-économique des caractéristiques et de la priseen charge de la PR à l’hôpital en France: qualité de vie et caractéris-tiques socio-professionnelles de patients atteints de PR en France.SFR abstract. Rev Rhum 2001;68:C01.
524 A.-C. Rat, M.-C. Boissier / Joint Bone Spine 71 (2004) 518–524