Embed Size (px)
Citation preview

Rhode Island and US Tourism:
Finally, Some Good News
November 8, 2011

Copyright © 2010 IHS Global Insight, Inc. 2
• Quick Introduction to IHS Global Insight
• What is Tourism Satellite Accounting?
• 2010 Rhode Island Tourism Results
• What Do Visitors Mean to RI?
• Outlook for Travel
Agenda

Copyright © 2010 IHS Global Insight, Inc. 3
About IHS Global Insight:
Premier economic analysis, forecasting, & consulting organization
Formed in 2001 by combining WEFA and DRI
Provides the most comprehensive coverage of countries, regions and industries available from any single source
Brings a common analytical framework and a consistent set of assumptions to diverse capabilities and products
Significant Travel & Tourism practice, with major public and private clients
We are now part of IHS, an $900B publicly traded information company
• Provides a broad range of consulting capabilities covering:
• Strong reputation and experience within the travel & tourism sector
• Provides a broad range of consulting capabilities covering:
• Strong reputation and experience within the travel & tourism sector
Market Analysis Business Planning Investment Strategy Risk Assessment
Infrastructure Analysis Policy Evaluation Economic Development Economic Impact

Copyright © 2010 IHS Global Insight, Inc. 4
Travel and Tourism Expertise
• Visitation & Spending Forecasts –by category and by country, region, state, or U.S. city. Market size, growth, and share.
• Market Feasibility & Investment Facilitation market analysis & research, demand/supply review, policy evaluation, development cost analysis.
• Destination Impact & Concession Support economic impact of the construction and operations of individual facilities –resort, convention center, entertainment venue, event…
• Tourism Economic Impact & Tourism Satellite Accounting conforming to the UN/WTO standards. What does travel & tourism contribute in jobs, wages, spending, and taxes to a national or local economy?
• Tourism Policy Analysis travel & tourism policy evaluation and rationalization.

Copyright © 2010 IHS Global Insight, Inc. 5
Tourism Satellite Accounting
• The Tourism Satellite Account is the international (UN/WTO, OECD) standard for measuring the contribution of tourism to an economy
• Measuring the industry “tourism” is difficult: Tourism is not measured in standard economic accounting terms. Most industries are accounted via the supply-side:
firms are categorized into NAICS codes and asked about jobs, revenues, costs.
But tourism is a demand-side activity: the focus is on what the traveler buys before and during a trip( hotel, food, transportation, retail…).
As a result, tourism touches many industries
• Why a TSA? -the 4”Cs”: Credibility, Comprehensiveness, Comparability, Consistency
5

Copyright © 2010 IHS Global Insight, Inc. 6
Benefits of a TSA
6
Are we spending enough on tourism promotion and infrastructure? Compares government support of the tourism sector with government revenue generated by tourism.
Which are our best economic development targets and are candidate-requested concessions worth it? Allows policy-makers to compare the size & growth of tourism to other industrial sectors.
What is the ROI of public tourism investment? Enables analysts to assess long-term health of the tourism sector vis-a-vis capital investment and govt. support.
How can we benchmark ourselves against our destination competition? Provides an accepted international standard for benchmarking.
How can we communicate the full value of tourism to policy makers, businesses, and citizens? Quantifies how other industries benefit from tourism.

Copyright © 2010 IHS Global Insight, Inc. 7
Tourism Satellite Account
RHODE ISLAND North Dakota New Jersey Bahamas Delaware Maryland Israel Dubai Abu Dhabi South Dakota Kansas Guam North Carolina Alaska South Carolina Virginia Utah
Economic Impact Idaho Pennsylvania Indiana
City Tourism Impact• Washington, DC• NYC• Dallas• Boston• Arlington, TX• Sacramento• Baltimore• Philadelphia• Orlando• Meadowlands
• Tulsa• St. Louis• Kansas City• Battle Creek• Durham, NC• Savannah• Pittsburgh• Austin• Indianapolis• Omaha
TSA and Tourism Economic Impact Client Examples

Copyright © 2010 IHS Global Insight, Inc. 8
Tourism Economic Impact: Definitions• Visitor: GT 50 miles, non-commuting; All overnight trips• Resident Tourism: Outbound purchases made in advance of a trip only. Resident
usage of RI tourism assets are not included.
• Tourism Expenditures: A TSA concept, includes all spending by all constituents on travel made in the state (RI), including tourism related investments
• Visitor Spending: Spending in the jurisdiction by visitors (see above) (on accommodations, food & beverage, shopping, transportation, entertainment,…
• Economic Impact: “GDP” definition…spending less value of supply chain purchases made outside RI. The amount retained in the RI economy.
• Import Leakages: The value of supply chain purchases made outside of RI.
• Direct Spending/Jobs/Wages/Taxes: Industries that “touch” the visitor (e.g. hotels, restaurants, museums,…)
• Indirect Spending/Jobs/Wages/Taxes: Industries that supply those that touch the visitor
• Induced Spending/Jobs/Wages/Taxes: Workers of industries that touch or supply spend their wages locally
• Core Impact: Impact results based purely off of visitor expenditures• Total Impact: Impact results Include investment, government support, and expenditures

Copyright © 2010 IHS Global Insight, Inc. 9
Travel & Tourism Economy
T&T Industry and Economy
The TSA provides both a narrow & a broad understanding of the Tourism “Industry”
Travel & Tourism EconomyThe flow-through effect of travel demand across the economy
Travel & Tourism IndustryThe direct effect of travel demand

Copyright © 2010 IHS Global Insight, Inc. 10
Rhode Island Tourism Economic Impact - Definitions
• TSA: Results (spending, economic impact, jobs,…) conform strictly to the TSA definition (e.g. 50mile+overnight visitor definition).
• TSA + Under 50 Mile: TSA results, plus those coming from visitors traveling less than the 50 mile threshold. This classification is both historically consistent with previous studies and arguably more applicable to Rhode Island.
• Total Impact: Total economic contribution of tourism to Rhode Island. Sum of core and non-core.
• Core Impact: Economic contribution of from industries directly providing goods and services to the visitor.
• Non-core Impact: Economic contribution from industries providing goods and services to core tourism providers. Also includes tourism investment.
Ap
pro
ach
Imp
act
So
urc
es

Copyright © 2010 IHS Global Insight, Inc. 11
2010 Rhode Island Tourism Results

Copyright © 2010 IHS Global Insight, Inc. 12
State Overview: 2010 Totals At A Glance
Source: IHS Global Insight
Tourism Concept TSA + Under 50 Mile Visitors TSA
TSA’09 – ’10 Growth
Visits 17.49 M 7.83 M 13.9%
Expenditures $5.22 B $3.56 B 2.8%
Total Economic Impact $3.36 B $2.37 B 2.3%
Core Economic Impact (GSP) $2.32 $1.64 B 1.2%
Total Jobs 65,925 41,932 -0.7%
Wages $1.95 B $1.32 B 2.1%
Taxes $1,447 M $930 M 0.0%

Copyright © 2010 IHS Global Insight, Inc. 13
Industry Structure: Definitions
Source: IHS Global Insight 13
$5.22 billion
$3.56 billion
$2.37 billion $1.19 billion
$1.64 billion $724 million

Copyright © 2010 IHS Global Insight, Inc. 14
State Overview: Tourism and Under 50Mile Visitors – 2010 vs. 2009
Measurement 2010 2009 Definition
Tourism (TSA) + Under 50Mile Visitor Spending $5.22B $5.07B • Spending from all tourism factors
Tourism Expenditures (TSA) $3.56B $3.47B • TSA Definition of State Tourism
Under 50Mile Visitors $1.66B $1.61B• Spending by visitors from less than 50 miles that utilize RI tourism assets
Tourism + Under 50Mile Visitors Total Employment* 65,925 66,303
• Employment required to support core RI tourism activity
Core Tourism (TSA) Employment* 32,986 33,181
• TSA Definition of Tourism “Industry”
Source: IHS Global Insight• Employment figures taken from a top down review of the total spending, creating a resultant number of jobs, both full-time and part-time required to support that spending.
Copyright © 2010 IHS Global Insight, Inc. 15
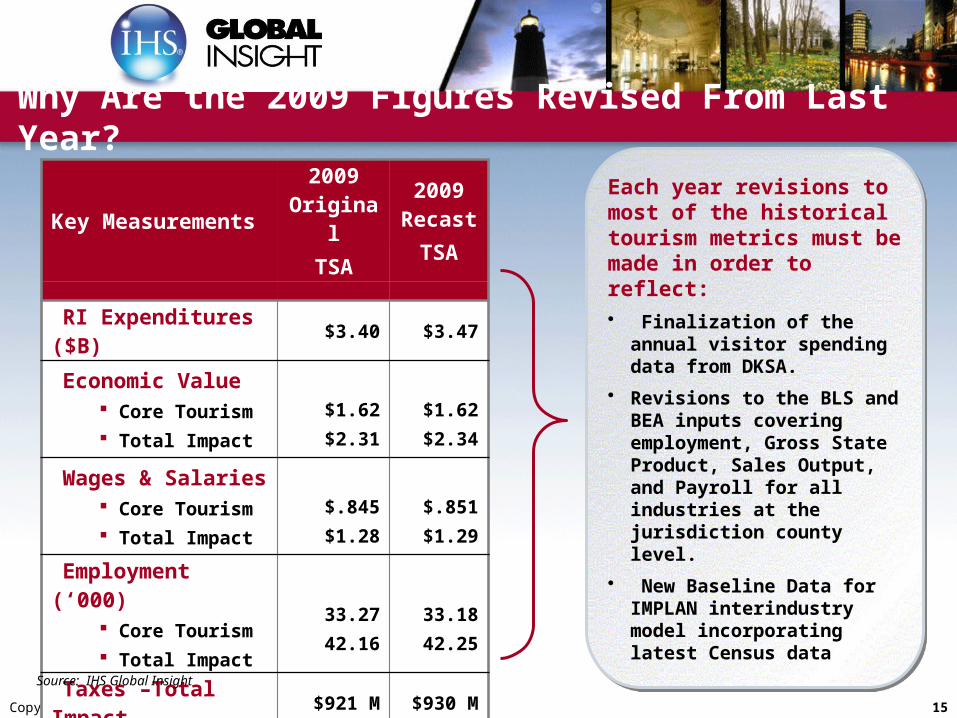
Key Measurements2009
OriginalTSA
2009Recast
TSA
RI Expenditures ($B) $3.40 $3.47
Economic Value Core Tourism Total Impact
$1.62$2.31
$1.62$2.34
Wages & Salaries Core Tourism Total Impact
$.845$1.28
$.851$1.29
Employment (‘000) Core Tourism Total Impact
33.2742.16
33.1842.25
Taxes –Total Impact $921 M $930 M
Why Are the 2009 Figures Revised From Last Year?
Source: IHS Global Insight
Each year revisions to most of the historical tourism metrics must be made in order to reflect:• Finalization of the annual
visitor spending data from DKSA.
• Revisions to the BLS and BEA inputs covering employment, Gross State Product, Sales Output, and Payroll for all industries at the jurisdiction county level.
• New Baseline Data for IMPLAN interindustry model incorporating latest Census data

Copyright © 2010 IHS Global Insight, Inc. 16
-13.2%
2.8%
$0
$500
$1,000
$1,500
$2,000
$2,500
$3,000
$3,500
$4,000
2008 2009 2010
$ M
illi
on
Core Tourism Total Impact TourismExpenditures
-5.6%-11.9%
-4.3%-3.8%
1.3%
1.2%
-3.8% 2.8%
Total Tourism (TSA) Expenditures
• RI visitation increased by 13.9% in ‘10• Spending per visit fell by 9.5% in ‘10
• Visitor spending grew 2.8% ’10• Investment spending fell 7.6% in ‘10
Tourism expenditures tallied $3.6 billion in 2010
Tourism expenditures tallied $3.6 billion in 2010
Source: IHS Global Insight

Copyright © 2010 IHS Global Insight, Inc. 17
-6.8%-6.3%
13.9%
0.0
2.0
4.0
6.0
8.0
10.0
2008 2009 2010
Vis
ito
rs (M
illi
on)
Business
Leisure
Total
-2.2%-4.3%
-27.0%-17.8%
13.2%
19.1%
Visitors to Rhode Island*
Total visitors increased 13.9% in 2010; total visitors now just 0.5% off 2007 peak.Total visitors increased 13.9% in 2010;
total visitors now just 0.5% off 2007 peak.
* Visitors from GT 50 miles or overnight only, provided by DK Shifflet & Associates, Ltd. Leisure and Business travel results were estimated by IGI.

Copyright © 2010 IHS Global Insight, Inc. 18
Tourism Expenditures experienced
positive growth for the first time
since 2008, driving its
economic impact up to the positive
ground.
Tourism Expenditures experienced
positive growth for the first time
since 2008, driving its
economic impact up to the positive
ground.
Finally, Some Positive Numbers
Measurement 2009(billions)
2010(billions)
2009-2010 growth
Tourism (TSA) + Under 50Mile Visitor Expenditures $5.072 $5.224 3.0%
Tourism (TSA) Expenditures $3.465 $3.562 2.8%
Total Economic Impact $2.336 $2.367 1.3%
Core Tourism (direct) $1.623 $1.643 1.2%
Non-Core Tourism $0.757 $0.767 1.2%
Import Leakage $1.129 $1.194 5.8%
Source: IHS Global Insight
Copyright © 2010 IHS Global Insight, Inc. 19
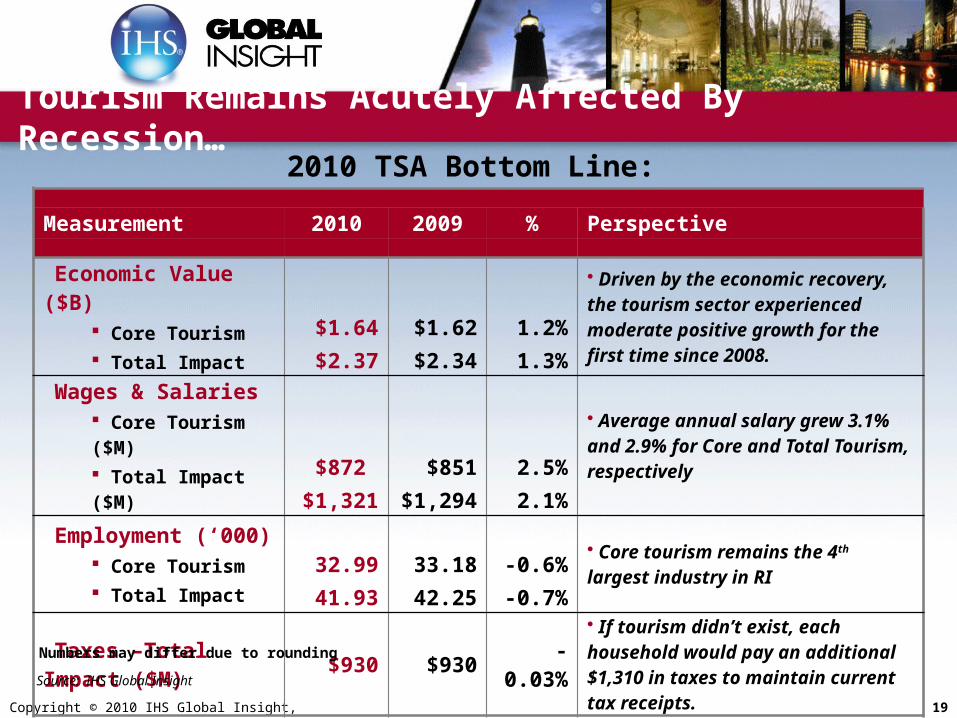
Measurement 2010 2009 % Perspective
Economic Value ($B) Core Tourism Total Impact
$1.64$2.37
$1.62$2.34
1.2%1.3%
• Driven by the economic recovery, the tourism sector experienced moderate positive growth for the first time since 2008.
Wages & Salaries Core Tourism ($M) Total Impact ($M)
$872 $1,321
$851$1,294
2.5%2.1%
• Average annual salary grew 3.1% and 2.9% for Core and Total Tourism, respectively
Employment (‘000) Core Tourism Total Impact
32.9941.93
33.1842.25
-0.6%-0.7%
• Core tourism remains the 4th largest industry in RI
Taxes –Total Impact ($M) $930 $930 -0.03%
• If tourism didn’t exist, each household would pay an additional $1,310 in taxes to maintain current tax receipts.
Numbers may differ due to rounding
2010 TSA Bottom Line:
Tourism Remains Acutely Affected By Recession…
Source: IHS Global Insight

Copyright © 2010 IHS Global Insight, Inc. 20
Total Impact of Tourism
• In 2010, the total economic impact of travel & tourism (direct and indirect) was
$2.37 billion. This represents 5.0% of RI Gross State Product
• The ratio of the total impact to total expenditures reveals that 67¢ of each tourism dollar spent in Rhode Island is retained in the state. The remainder
represents import leakages. This share is fairly typical for a diversified state
like Rhode Island and higher than many other states.
• Over 41,900 jobs – direct and indirect – were created by travel & tourism
(TSA) economic activity. This accounts for 9.3% of total employment in RI.
• $1.32 billion in wages & salaries were generated by travel & tourism (TSA) in
2010.
• Tourism (TSA) generated $930 million in federal, state, and local government taxes in 2010, with the state and local tax contribution making up
8.4% of all RI state gov. revenue.

Copyright © 2010 IHS Global Insight, Inc. 21
Sources of Tourism Expenditures
• Visitor Spending – Expenditures by visitors who have come from greater
than 50 miles or stayed overnight
• Business Travel – Businesses’ spending within the state economy on travel
• Resident Outbound – Resident spending preparing for an out-of-state trip
• Government Spending – Tourism Office Budgets, transportation functions
related to tourism, publicly funded attractions and funding for security in tourism-
intensive areas
• Investment – Construction of hotels, attractions, tourism infrastructure,
operating and transportation equipment
• International – Spending of international visitors within the state
• Under 50Mile Visitors – Spending by residents or non-residents who have
come from under 50 miles. No commuters or local utilization. Not included in TSA
definition.

Copyright © 2010 IHS Global Insight, Inc. 22
Breaking Down Tourism Expenditures – $3.56 Billion
Only 8% of TSA Expenditures in Rhode Island come from outside of visitor spending, while in 2007 that share was 16%. The primary
source of that change is the 3 year collapse in investment spending.
Million$
ShareOf
Total
’09 – ’10Growth
Investment 89 2.5% -7.6%
Visitors 3,284 92.2% 2.3%
Other 188 5.3% 19.2%
Total 3,562 100% 2.8%
Source: IHS Global Insight
Others5%
Visitors92%
Investment3%

Copyright © 2010 IHS Global Insight, Inc. 23
Category Distribution of Expenditures
In 2010, all categories except entertainment saw a growth in visitor spending, with retail spending growth of 6.7% leading the way. Visitor spending has now
surpassed 2008’s total, and is just 4.3% below 2007’s historical peak.
2010<50MileMillion $
2010TSA
Million $
TSA‘09 – ‘10 Growth
Entertainment** 1,268 780 -1.1%
Accommodation 684 684 0.1%
Transportation 833 815 6.7%
Food 1,484 693 4.2%
Shopping 865 501 6.7%
Total * 5,134 3,473 3.1%
* Direct and Indirect Tourism Expenditures (w/o construction & investment)
Source: IHS Global Insight** Entertainment category includes all marina and boating activity
TSA Shares
Entertainment
23%
Accommodation
21%Transportation
23%
Food20%
Shopping14%

Copyright © 2010 IHS Global Insight, Inc. 24
Entertainment Spending Detail - TSA + Under 50Mile
The Entertainment category includes a wide array of industries, from gaming to recreation sports to movies. Total Entertainment spending grew 0.6% in 2010.
2010 ($000) 2009 ($000)
Amusement Parks & Arcades 4,522 4,479Gambling Industries 477,100 461,200 Independent Artists. Writers, & Performers 11,195 10,063 Motion Picture & Video Industries 136,023 133,163 Museums & Historical Sites 63,960 67,731 Other Amusement & Rec. Services** 393,922 402,092 Performing Arts Companies 75,307 73,440 Spectator Sports 106,282 108,716
Total Entertainment Spending 1,268,315 1,260,888
Source: IHS Global Insight** NAICS 7139 – Other Amusement & Rec. Services – includes both golf and marina activity

Copyright © 2010 IHS Global Insight, Inc. 25
Transportation Detail - TSA + Under 50Mile
Total Transportation spending grew 2.9% in 2010.
Source: IHS Global Insight* Transportation figures here exclude resident outbound spending
2010($000) 2009($000)
Automotive Equipment Rental and Leasing 408,809 357,335Charter Bus Industry 12,364 12,358 Nonscheduled Air Transportation 260 231 Rail Transportation 1,444 1,109 Scenic & Sightseeing Transportation 13,725 13,368 Scheduled Air Transportation 27,854 25,909 Taxi & limousine Service 10,784 10,443 Travel Arrangement & Reservation Ser. 306,436 306,019 Other Transportation 16,247 14,784 Transportation Total* 797,926 741,559

Copyright © 2010 IHS Global Insight, Inc. 26
Core Tourism
• Answers the question “How does tourism compare with other industries?”
• Core Tourism measures the size of the industry
directly providing goods & services to the visitor.
• Indirect effects are excluded – these are part of other supplier industries such as wholesalers. The impact of capital investment is also excluded.
• Core Tourism generated $1.6 billion in economic value in 2010. This ranks core tourism as the 10th largest private industry in RI in terms of Gross State Product.

Copyright © 2010 IHS Global Insight, Inc. 28
Core Tourism Impact – CompositionTransportation-related Sectors---namely Automotive Rental, and Gasoline Stations---have climbed on the back of the recovering number of visitation, and experienced significant
growth in 2010.
Composition of Core TourismRank Industry $ Value ’09-’10 % of
(Millions) Growth Total1 Food services and drinking places 346 3.4% 20.4%2 Other amusement and recreation industries 266 -2.0% 15.7%3 Real estate establishments 251 -10.9% 14.8%4 Hotels and motels, including casino hotels 217 10.7% 12.8%5 Automotive equipment rental and leasing 190 13.2% 11.2%6 Travel arrangement and reservation services 177 -1.4% 10.4%7 Performing arts companies 83 2.1% 4.9%8 Retail Stores - Food and beverage 28 2.9% 1.7%9 Retail Stores - Clothing and clothing accessories 28 2.9% 1.6%
10 Spectator sports companies 23 -3.3% 1.4%11 Transport by air 20 -2.0% 1.2%12 Retail Stores - Gasoline stations 17 16.5% 1.0%13 Scenic and sightseeing transportation 12 1.8% 0.7%14 Retail Stores - Miscellaneous 11 2.9% 0.7%15 Transit and ground passenger transportation 11 -0.9% 0.6% Other Industries 17 -0.9% 1.0% Total 1,643 1.2% 100.0%
Source: IHS Global Insight

Copyright © 2010 IHS Global Insight, Inc. 29
Core Tourism – Employment
• Core Tourism is the 4th largest private sector employer in Rhode Island with nearly 33,000 tourism supported jobs in 2010.
• Core Tourism generated 8.3% of private employment in 2010.
• Core Tourism jobs provided $872 million in wages & salaries in 2010.
• Core Tourism’s average annual wage has grown from 25,400/year in 2009 to 26,400/year in 2010.

Copyright © 2010 IHS Global Insight, Inc. 30
Travel & Tourism 33.0 -0.6% 8.3% 33.0
Ranking Core Tourism – EmploymentTravel & tourism is RI’s 4th largest private sector employer.
Rank
IndustryReported
Employment(Thousands)
2009-2010Growth
% of State
Tourism-Extracted
Employment (Thousands)
1 Health Care and Social Assistance 78.1 1.5% 19.7% 78.12 Retail Trade 47.0 -0.2% 11.9% 44.93 Accommodation and Food Services 42.2 2.1% 10.6% 26.74 Manufacturing, Durables 25.7 -4.2% 6.5% 25.75 Finance and Insurance 24.9 -1.5% 6.3% 24.96 Educational Services 23.8 -0.8% 6.0% 23.87 Administrative and Waste Services 23.1 3.8% 5.8% 22.28 Other Services 22.2 -0.1% 5.6% 21.09 Professional, Scientific, and Tech. Services 20.7 -1.6% 5.2% 20.7
10 Wholesale Trade 16.1 0.2% 4.0% 15.911 Construction 15.9 -7.8% 4.0% 16.112 Manufacturing, Nondurables 14.6 -1.9% 3.7% 14.613 Transportation and Warehousing 10.2 0.0% 2.6% 10.114 Information 10.1 -0.6% 2.5% 9.415 Management of Companies and Enterprises 9.3 0.8% 2.3% 9.3
Other Industries 13.3 -3.9% 3.3% 0.9
Total Nonfarm 397.0 -0.3% 100% 364.0Government 61.8 -0.5% 61.8
Core Tourism represented
32,986 jobs in 2010.
Core Tourism represented
32,986 jobs in 2010.
Source: Bureau of Labor Statistics and IHS Global Insight

Copyright © 2010 IHS Global Insight, Inc. 31
Total Rhode Island Tourism Employment fell marginally by 0.7% in 2010
CoreTourism
TotalImpact
Source: IHS Global Insight
Core Tourism jobs comprise 79% of total tourism-generated employment.Core Tourism jobs comprise 79% of
total tourism-generated employment.
2008 2009 20100
5,000
10,000
15,000
20,000
25,000
30,000
35,000
40,000
45,000
50,000
Nu
mb
er
of
Jo
bs

Copyright © 2010 IHS Global Insight, Inc. 32
Non-Core Tourism – Indirect BenefitsExcluding Investment, non-core tourism grew 2.4% in 2010
Indirect Benefits of TourismRank Industry $ Value ’09-’10 % of
(Millions) Growth Total1 Real estate establishments 99 0.4% 13.0%2 Management of companies and enterprises 51 5.2% 6.7%3 Wholesale trade businesses 38 3.5% 5.0%4 Monetary authorities and depository credit firms 33 1.2% 4.4%5 Electric power generation, transmission, and distribution 34 4.6% 4.5%6 Telecommunications 27 2.2% 3.5%7 Insurance carriers 27 2.5% 3.5%8 Employment services 21 1.3% 2.8%9 Food services and drinking places 21 3.1% 2.8%
10 Services to buildings and dwellings 18 2.3% 2.4%11 Accounting, tax preparation and bookkeeping services 18 1.9% 2.3%12 Legal services 15 1.3% 2.0%13 US Postal Service 12 4.4% 1.6%14 Other state and local government enterprises 12 2.5% 1.5%15 Radio and television broadcasting 11 3.3% 1.5%
Other Industries 238 2.4% 31.0%Investment 89 -6.7% 11.7%Total 767 1.2% 100.0%
Source: IHS Global Insight

Copyright © 2010 IHS Global Insight, Inc. 33
Non-Core Tourism – Construction BenefitsThe increase in private investment was more than offset
by a decline in stimulus driven public spending
Source: FW Dodge
Data is “Value of Construction Contracts”, measuring the value of government and private construction at the time when work begins, encompassing total value for entire projects which start or break ground in a given year, excluding ancillary costs such as land acquisition.
22.7%
-28.0%
-9.8%-6.0%
0
100
200
300
400
500
600
700
800
900
2007 2008 2009 2010
($ M
illi
on
)

Copyright © 2010 IHS Global Insight, Inc. 34
Tourism Generated $930M in Total Tax Revenue in 2010
• Tourism activity generated $541 million in state and local government revenue in 2010, a 0.3% decrease over 2009.
• In 2010, $374 million in state tax revenue was generated by the travel & tourism sector in Rhode Island. Indirect business tax (sales tax) and the gaming taxes are the two largest contributors.
• Tourism contributes disproportionately to state & local tax revenue. While Total Tourism is responsible for 5.0% of total RI GSP, it contributed 8.4% of state government revenue in 2010.
• If tourism didn’t exist, each RI household would pay $1,310 more in taxes to maintain the current level of state and local tax receipts.

Copyright © 2010 IHS Global Insight, Inc. 35
State and Local Government Revenue
Tax Revenues from Tourism (TSA) 2010 (Million) ’09-’10 GrowthFederal Government
Corporate Profits Tax 79.4 -1.4%Personal Income 117.1 -0.3%Social Security & Other Taxes 191.7 -0.2%Federal Total 388.2 -0.5%
State GovernmentCorporate Profits Tax 12.8 -1.9%Personal Income 37.3 -0.3%Sales 115.4 -0.4%Licenses & Fees 9.7 -0.3%Gaming Tax 145.7 1.6%Other Taxes 45.0 -1.3%State Share of Occupancy Tax* 8.4 10.1%State Total 374.3 0.4%
Local GovernmentLocal Share of Occupancy Taxes 7.4 10.1%Property Taxes 159.8 -0.4%Local Total 167.2 0.0%
Total 929.7 0.0%
* Remainder of Room Tax not distributed back to local towns and cities.
Source: IHS Global Insight

Copyright © 2010 IHS Global Insight, Inc. 36
Gross State Product: $3.36 billion 7.0 % of GSP
Total Employment: 65,925 jobs 14.6% of Employment
Gross State Product: $2.37 billion
5.0% of GSP
Total Employment: 41,932 jobs 9.3% of Employment
Core GSP: $1.64 billion 3.4% of GSP
Core Employment: 32,986 jobs7.3% of Employment
How Important?
Total Tourism-related
spending of $5.22 billion
% shown are for total state GSP, including Government

Copyright © 2010 IHS Global Insight, Inc. 37
2010 Rhode Island TourismRegional Analysis

Copyright © 2010 IHS Global Insight, Inc. 38
Regional Distribution of Tourism
Blackstone Valley• Burrillville• Central Falls• Cumberland• Glocester• Lincoln• North Smithfield• Pawtucket• Smithfield• Woonsocket
Providence • Providence
Warwick • Warwick
Block Island• Block Island
Balance of State• Cranston• Foster• Johnston• North Providence• Scituate• West Warwick
Rhode Island is divided into eight regions in the analysis: Newport County
• Little Compton• Middletown• Newport• Portsmouth• Tiverton• Jamestown
South County • Charlestown• Coventry• East Greenwich• Exeter• Hopkinton• Narragansett• North Kingstown• Richmond• South Kingstown• Westerly• West Greenwich
East Bay• Barrington• Bristol• East Providence• Warren

Copyright © 2010 IHS Global Insight, Inc. 39
Regional TSA + Under 50Mile Expenditures
Regional Share of State Expenditures by Category ($M)
AccommodationsEntertainmen
tFood Retail Transportation Total
Balance of State 9.50 43.57 194.04 69.41 84.13 400.86 Blackstone Valley 21.96 472.43 227.12 56.44 84.75 862.70 Block Island 76.34 53.65 21.83 44.58 18.32 214.72 East Bay 5.09 37.33 104.34 44.80 46.90 238.53 Newport 204.67 172.32 216.98 74.17 43.79 711.67 Providence 127.05 341.00 313.09 343.19 272.11 1,396.45 South County 182.57 82.35 238.14 147.53 47.56 698.16 Warwick 57.25 65.66 168.52 84.55 235.39 611.36
Total 684.44 1,268.32
1,484.06 864.67 832.96 5,134.44
Entertainment data includes gaming, spectator sports boating and marina activity and other categories.
Entertainment data includes gaming, spectator sports boating and marina activity and other categories.

Copyright © 2010 IHS Global Insight, Inc. 40
Regional TSA Tourism Expenditures
Regional Share of State Expenditures by Category ($M)Accomodation
sEntertainmen
tFood Retail Transportation Total
Balance of State 9.50 30.10 81.34 38.03 88.26 247.22 Blackstone Valley 21.96 201.67 103.93 33.65 84.92 446.13 Block Island 76.34 49.96 22.18 25.34 14.10 187.91 East Bay 5.09 34.39 51.49 30.63 38.12 159.72 Newport 204.67 112.09 95.55 43.05 28.95 484.31 Providence 127.05 237.60 161.37 190.38 271.87 988.27 South County 182.57 76.79 103.33 83.46 40.07 486.22 Warwick 57.25 37.04 73.51 56.14 249.01 472.95
Total 684.44 779.63
692.70
500.67 815.30 3,472.73
Accomodation data includes seasonal second home rentals, which creates significant differences in share
from state room tax data. As the TSA definition of tourism includes any overnight stay, accomodations
results are the same for TSA and TSA + Under 50Mile.
Accomodation data includes seasonal second home rentals, which creates significant differences in share
from state room tax data. As the TSA definition of tourism includes any overnight stay, accomodations
results are the same for TSA and TSA + Under 50Mile.

Copyright © 2010 IHS Global Insight, Inc. 41
Regional Share of Statewide TSA + Under 50Mile Expenditures
Regional Share of State Expenditures by Category
AccommodationEntertainmen
tFood Shopping Transportation Total
Providence 18.6% 26.9% 21.1% 39.7% 32.7% 27.2%Blackstone Valley 3.2% 37.2% 15.3% 6.5% 10.2% 16.8%Newport Country 29.9% 13.6% 14.6% 8.6% 5.3% 13.9%South County 26.7% 6.5% 16.0% 17.1% 5.7% 13.6%Warwick 8.4% 5.2% 11.4% 9.8% 28.3% 11.9%Balance of State 1.4% 3.4% 13.1% 8.0% 10.1% 7.8%East Bay 0.7% 2.9% 7.0% 5.2% 5.6% 4.6%Block Island 11.2% 4.2% 1.5% 5.2% 2.2% 4.2%
Total 100.0% 100.0%100.0
%100.0% 100.0% 100.0%
Entertainment data includes gaming, spectator sports boating and marina activity and other categories.
Entertainment data includes gaming, spectator sports boating and marina activity and other categories.

Copyright © 2010 IHS Global Insight, Inc. 42
Expenditure Category Share of Regional Tourism Spending
AccommodationEntertainmen
tFood Shopping Transportation Total
Providence 9.1% 24.4% 22.4% 24.6% 19.5% 100.0%Blackstone Valley 2.5% 54.8% 26.3% 6.5% 9.8% 100.0%Newport Country 28.7% 24.2% 30.5% 10.4% 6.2% 100.0%South County 26.2% 11.8% 34.1% 21.1% 6.8% 100.0%Warwick 9.4% 10.7% 27.6% 13.8% 38.5% 100.0%Balance of State 2.4% 10.9% 48.4% 17.3% 21.0% 100.0%East Bay 2.1% 15.7% 43.8% 18.8% 19.7% 100.0%Block Island 35.6% 25.0% 10.2% 20.8% 8.5% 100.0%Grand Total 13.3% 24.7% 28.9% 16.8% 16.2% 100.0%
Regional Share of Statewide TSA + Under 50Mile Expenditures
Warwick’s Transportation share is very high as TF Green Airport revenue is counted here.
Warwick’s Transportation share is very high as TF Green Airport revenue is counted here.

Copyright © 2010 IHS Global Insight, Inc. 43
Regional Share of Statewide TSA Tourism
Regional Share of State Expenditures by Category
AccommodationEntertainmen
tFood Shopping Transportation Total
Providence 18.6% 30.5% 23.3% 38.0% 33.3% 28.5%South County 26.7% 9.8% 14.9% 16.7% 4.9% 14.0%Newport Country 29.9% 14.4% 13.8% 8.6% 3.6% 13.9%Warwick 8.4% 4.8% 10.6% 11.2% 30.5% 13.6%Blackstone Valley 3.2% 25.9% 15.0% 6.7% 10.4% 12.8%Balance of State 1.4% 3.9% 11.7% 7.6% 10.8% 7.1%Block Island 11.2% 6.4% 3.2% 5.1% 1.7% 5.4%East Bay 0.7% 4.4% 7.4% 6.1% 4.7% 4.6%Total 100% 100% 100% 100% 100% 100%
Accomodation data includes seasonal second home rentals, which creates significant differences in share
from state room tax data. As the TSA definition of tourism includes any overnight stay, accomodations
results are the same for TSA and TSA + Under 50Mile.
Accomodation data includes seasonal second home rentals, which creates significant differences in share
from state room tax data. As the TSA definition of tourism includes any overnight stay, accomodations
results are the same for TSA and TSA + Under 50Mile.

Copyright © 2010 IHS Global Insight, Inc. 44
Regional Share of Statewide TSA Tourism
Expenditure Category Share of Regional Tourism Spending
AccommodationEntertainmen
tFood Shopping Transportation Total
Providence 12.9% 24.0% 16.3% 19.3% 27.5% 100.0%South County 37.5% 15.8% 21.3% 17.2% 8.2% 100.0%Newport Country 42.3% 23.1% 19.7% 8.9% 6.0% 100.0%Warwick 12.1% 7.8% 15.5% 11.9% 52.7% 100.0%Blackstone Valley 4.9% 45.2% 23.3% 7.5% 19.0% 100.0%Balance of State 3.8% 12.2% 32.9% 15.4% 35.7% 100.0%Block Island 40.6% 26.6% 11.8% 13.5% 7.5% 100.0%East Bay 3.2% 21.5% 32.2% 19.2% 23.9% 100.0%Grand Total 19.7% 22.4% 19.9% 14.4% 23.5% 100.0%
Warwick’s Transportation share is very high as TF Green Airport revenue is counted here.
Warwick’s Transportation share is very high as TF Green Airport revenue is counted here.

Copyright © 2010 IHS Global Insight, Inc. 45
TSA + Under 50Mile Growth Rates by Region for 2010
Regional Growth Rates by Category 2010 vs 2009
Accomodation Entertainment Food Retail Transportation Grand Total
Balance of State -10.3% -2.2% 2.2% 2.1% 6.3% 2.2%Blackstone Valley -7.1% 3.4% 3.3% 3.6% 5.7% 3.3%Block Island -8.1% -4.0% 1.0% 4.2% 4.4% -2.8%East Bay -6.2% 2.3% 4.2% 4.2% 1.4% 3.1%Newport -3.2% -4.0% 7.5% 3.3% 8.7% 1.0%Providence 0.1% 0.2% 5.3% 5.7% 6.4% 3.9%South County 8.7% -0.9% 4.1% 7.1% 8.7% 5.6%Warwick 5.2% 2.6% -1.1% 6.3% 8.3% 4.4%Grand Total 0.1% 0.6% 3.8% 5.2% 6.8% 3.2%
Entertainment and Accommodations saw only modest gains in spending during 2010.
Entertainment and Accommodations saw only modest gains in spending during 2010.

Copyright © 2010 IHS Global Insight, Inc. 49
Regional Growth in Expenditures 2009 - 2010
TSA + <50MileTSA Only
Statewide rebound in visitor spending touched nearly all regions, with only Block Island, due primarily to weakness
in Lodgings, seeing growth with TSA + <50 Mile.
Statewide rebound in visitor spending touched nearly all regions, with only Block Island, due primarily to weakness
in Lodgings, seeing growth with TSA + <50 Mile.
2.2%
-3.5%
3.2%
3.0%
5.6%
-0.7%
6.5%
3.6%
-5% 0% 5% 10%
East Bay
Block Island
Balance of State
Blackstone Valley
Warwick
Newport
South County
Providence
'09-'10 Growth in Expenditure
3.1%
-2.8%
2.2%
3.3%
4.4%
1.0%
5.6%
3.9%
-4% -2% 0% 2% 4% 6%
East Bay
Block Island
Balance of State
Blackstone Valley
Warwick
Newport
South County
Providence
'09-'10 Growth in Expenditure

Copyright © 2010 IHS Global Insight, Inc. 50
New England and Rhode Island Economic Overview
Copyright © 2010 IHS Global Insight, Inc. 51
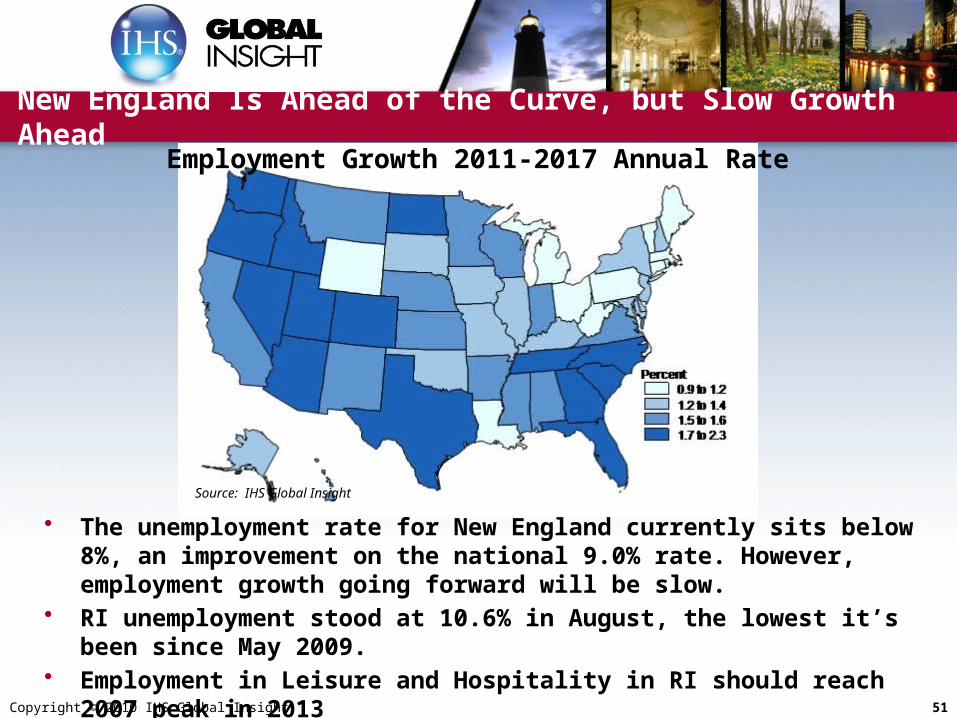
New England Is Ahead of the Curve, but Slow Growth Ahead
• The unemployment rate for New England currently sits below 8%, an improvement on the national 9.0% rate. However, employment growth going forward will be slow.
• RI unemployment stood at 10.6% in August, the lowest it’s been since May 2009.
• Employment in Leisure and Hospitality in RI should reach 2007 peak in 2013
Employment Growth 2011-2017 Annual Rate
Source: IHS Global Insight

Copyright © 2010 IHS Global Insight, Inc. 52
Economic Recovery Will Pick Up Steam Going Forward
• The economic recovery has been slow to get started, but should top 4% annually after 2014.
• Rhode Island’s L&H industry will surpass the 2007 peak this year, but growth after 2012 will be muted.
Annual Economic Growth for NE and RI
Source: IHS Global Insight; based on nominal dollars
-6.0%
-4.0%
-2.0%
0.0%
2.0%
4.0%
6.0%
2007 2009 2011 2013 2015 2017
NE GSP RI GSP RI L&H

Copyright © 2010 IHS Global Insight, Inc. 53
Talking Points: What Do Visitors Mean to RI?
If tourism didn’t exist, each household would pay $1,310 more in taxes to maintain the current level of state and local tax receipts
Each visitor creates about $119 in tax receipts, $69 of which goes to state & local authorities
It takes only 198 visitors to pay for one Rhode Island public school student for one year
Each RI visitor/traveler generates about $444 in expenditures, $88 of which goes to RI businesses that do not directly “touch” that visitor
Every 187 visitors creates a new RI job
Each visitor adds about $210 to RI Gross State Product