Embed Size (px)
Citation preview

N.º 29 • Special Issue 2014ISSN: 1695-7253
E-ISSN: 2340-2717
Rhomolo and The European Cohesion Policy
IntroductIon: 5 López-Rodríguez, J., and Faíña, A. Introduction to this special issue
ArtIcles: 17 Brandsma, A.; Di Comite, F.; Diukanova, O.; Kants, A.;
López-Rodríguez, J.; Persyn, D., and Potters, L. Assessing policy options for the EU Cohesion Policy 2014-2020
47 Di Comite, F., and Potters, L. Modelling knowledge creation, investment decisions and
economic growth in a spatial CGE setting
77 Persyn, D.; Torfs, W., and Kants, A. Modelling regional labour market dynamics: Participation,
employment and migration decisions in a spatial CGE model for the EU
91 Diukanova, O., and López-Rodríguez, J. Regional Impacts of non-R&D Innovation Expenditures across
the EU Regions: Simulation Results Using the Rhomolo CGE Model
113 Ramajo Hernández, J.; Márquez Paniagua, M. Á., and De Miguel Vélez, F. J.
Economic impact of the European Funds in Extremadura during the period 2007-2013
129 Álvarez-Martínez, M. T. The Effects of European Structural Funds in the Spanish
Regions Using CGE Models: a review
139 Maza, A.; Villaverde, J., and Hierro, M.ª Should cohesion policy focus on fostering R&D? Evidence from
Spain
165 Fratesi, U., and Perucca, G. Territorial Capital and the Effectiveness of Cohesion Policies:
an Assessment for CEE Regions
193 Dogaru, T.; Burger, M.; van Oort, F., and Karreman, B. The Geography of Multinational Corporations in CEE
Countries: Perspectives for Second-Tier City Regions and European Cohesion Policy
215 Romero, I., and Fernández-Serrano, J. The European Cohesion policy and the promotion of
entrepreneurship. The case of Andalusia

Investigaciones Regionales is included in the following Bibliometrics Indexes:
• Sciverse Scopus• IN-RECS• RESH
Investigaciones Regionales is stored in the following bibliographic databases:
• Cabell’s• CARHUS Plus+ (Agency for Management of University and Research Grants - AGAUR)• Cindoc• Dialnet• DOAJ (Directory of Open Access Journals)• EBSCO Publishing• EconLit (American Economic Association)• Latindex (Networks of Scientific Journals from Latin America and The Caribbean, Spain and
Portugal)• ProQuest• Recyt (Spanish Science & Technology Ministry)• Redalyc• RePEc (Research Papers in Economics)

IntroductIon


© Investigaciones Regionales, 29 (2014) – Pages 5 to 13Section Articles
Rhomolo and other methodologies to assess The European Cohesion Policy
Jesús López-Rodríguez *, Andrés Faíña **
ABSTRACT: The funds committed to cohesion policy are the second highest category of expenditure in the European Union budget and this policy is among the most evaluated. There are different tools and methodologies to carry out the evaluation each of them with their own merits and also their flaws and biases. This special issue explores the three main types of approaches, theory-based evaluation, counterfactual (econometrics) and macroeconomic models, to assess cohesion policy by presenting a set of contributions within these methodologies. The first set of contributions focus on the assessment of cohesion policy by means of macro models putting a special emphasis on the European Commission newly developed model RHOMOLO. The second set of contributions is linked to the econometric evaluations of different aspects of cohesion policy and finally a theory-based evaluation exercise closes this special issue.
JEL Classification: R11; R13; C54; C68.
Keywords: European Union; Cohesion Policy; regional development; macroeco-nomic models.
5
Received: 1 july 2014 / Acepted: 1 septembre 2014.
* European Commission, Joint Research Centre (JRC), Institute for Prospective Technological Studies (IPTS), Knowledge for Growth Unit, Edificio Expo. C/ Inca Garcilaso 3, 41092 Seville, Spain. [email protected]
** Grupo Jean Monnet de Competencia e Desenvolvemento na UE, Departamento de Analise Economica e ADE, Facultade de Economia e Empresa, Universidade da Coruña, Campus de Elviña s/n, 15071 A Coruña, Spain.
Guest editors Jesús López-Rodríguez and Andrés Faiña acknowledge the funding received from the Institute for Prospective Technological Studies (IPTS), Knowledge for Growth Unit to support the publi-cation of this special issue. We are particularly grateful to Xabier Goenaga (Knowledge for Growth Head of Unit) and Andries Brandsma, (REMO project leader) for their specific support to produce this special issue. The first author also acknowledges the support received from the Spanish Ministry of Science and Innovation through the project ECO2011-28632 and Xunta de Galicia through the project EM2014/051. We also thank the organizers of the XXXIX annual meeting of the Spanish Regional Science Association which took place in Oviedo on 21-22 November 2013 and very specially Fernando Rubiera Morollón and Esteban Fernandez Vazquez for granting us with two special sessions to present and discuss some of the papers which end up contributing to this special issue. The inestimable collaboration, valuable comments and contributions of the reviewers is also gratefully acknowledged. The first author also wants to thank his IPTS colleague Wouter Torfs for the exchange of ideas and fruitful discussions we had while drafting this introduction. Finally, we would like to express our gratitude to Juan Ramon Cuadrado, the editor-in-chief of the journal, who has offered his support since the very first instances we started to draft and work on this special issue. The views expressed here are purely those of the authors and may not in any circumstances be regarded as stating an official position of the European Commission.

6 López-Rodríguez, J. and Faíña, A.
Investigaciones Regionales, 29 (2014) – Pages 5 to 13
Rhomolo y otras metodologías para evaluar la Política de Cohesión Europea
RESUMEn: La política de cohesión es la segunda más importante en el presupuesto de la Unión Europea y es una de las políticas más evaluadas. Existen diferentes herramientas y metodologías para realizar esta evaluación, cada una de ellas con sus propios méritos pero también con sus sesgos y fallos. Este número especial explora las tres aproximaciones más importantes para evaluar la política de cohesión, evaluación fundamentada en la teoría, análisis counterfactual (econometría) y modelos macroeconómicos, presentando un conjunto de contribuciones dentro de cada una de estas metodologías. El primer conjunto de contribuciones se centra en la evaluación de la política de cohesión a través de modelos macroeconómicos con una dedicación especial al nuevo modelo desarrollado por la Comisión Europea llamado RHOMOLO. El segundo conjunto de contribuciones se basa en evaluaciones econométricas de diferentes aspectos de la política de cohesión, y finalmente el monográfico se cierra con un ejercicio de evaluación fundamenta en la teoría.
Clasificación JEL: R11; R13; C54; C68.
Palabras clave: Unión Europea; política de cohesión; desarrollo regional; modelos macroeconómicos.
1. Introduction
The European Cohesion Policy (ECP) is one of the major investment tools in the European Union (EU). Roughly a third of the EU budget is assigned to this policy domain with the objective of supporting job creation, enhancing competitiveness and economic growth and improving quality of life and sustainable development (EU Commission, 2010). The cohesion policy is one of the most evaluated policies, however capturing both ex-ante and ex-post macroeconomic impacts of ECP is intrinsically a very complex exercise.
A variety of different tools and methodologies have been developed and used by scholars and institutions to carry out such evaluations, each of them with their own merits but also with their flaws and biases. The three main approaches to assess the effect of EU financial transfers on the key magnitudes of growth, investment and employment are the theory-based evaluation (see for recent contributions Bachtler et al., 2013; Faíña et al., 2013a, 2013b), the counterfactual analysis including the econometric exercises (Cancelo et al., 2009; Dall’erba et al., 2009, Rodríguez-Pose and Fratesi, 2004 and Villaverde and Maza, 2010) and the use of macroeconomic models (Bradley et al., 1995; Cardenete et al., 2013, Márquez et al., 2010; Sosvilla, 2009, Varga and in ‘t Veld, 2011).
This special issue brings together the three main approaches to the analysis of the impact assessment of European cohesion policy by presenting some of the most recent contributions within these methodologies. The first set of contributions focus

Rhomolo and other methodologies to assess The European Cohesion Policy 7
Investigaciones Regionales, 29 (2014) – Pages 5 to 13
on the assessment of cohesion policy by means of macro models putting a special emphasis on the European Commission newly developed model RHOMOLO. The second set of contributions is linked to the econometric evaluations of different aspects of cohesion policy and finally a theory-based evaluation exercise closes this special issue. The interest of this issue is to prompt new reflections and debate among the academic community and public policy makers on the techniques used for measuring the economic impact of EU funds. Taking into account that this evaluation is a complex process a particular attention to the techniques used to carry out the evaluation should be taken. The need to ensure the existence of enough available data to carry out the exercises and prompting the collaboration with research institutes and universities should also be considered among the top priorities for achieving the success in this important task.
The rest of the paper is structured as follows: section 2 briefly summarizes the main contributions to the monograph which are based on the use of the RHOMOLO model, section 3 does the same for the contributions based on other macro models, and econometric exercises and finally section 4 comments on the theory-based evaluation exercise.
2. The Rhomolo model as a tool to assess the impact of the European Cohesion Policy
The evaluation of the Cohesion Policy by the European Commission (DG Regio) has been largely based on two macroeconomic models: HERMIN (Bradley et al., 1995) and QUEST (Varga et al., 2011, Varga and in ‘t Veld, 2011 ). These models have different theoretical underpinnings and sector coverage. QUEST belongs to the class of Dynamic Stochastic General Equilibrium (DSGE) models and has only one sector producing intermediate inputs, whereas HERMIN is a system of macroeconomic models which offer much higher level of disaggregation. However, these models are applied at the level of EU Member States (MS) and cannot be employed to analyse economic developments at regional level, according to the European Nomenclature of Territorial Units for Statistics (Eurostat, 2006). One important shortcoming when using these macroeconomic models for the evaluation of cohesion policy is that they lack the ability to produce results at regional level. This shortcoming was pointed out in a special report made by the European Commission Court of Auditors in 2006 (Special Report No 10/2006) on the ex post evaluations of the former objectives 1 and 3 programmes 1994 to 1999. It became even more pressing with the Barca 2009 report emphasizing the place-based nature of European cohesion policy. The RHOMOLO model developed by the DG REGIO with the collaboration of JRC-IPTS fulfils the shortcoming previously mentioned since it is a general equilibrium model which produces results at the level of EU NUTS2 regions.
The lead article of this special issue by Brandsma et al. uses the RHOMOLO model to estimate the ex-ante impact of the cohesion policy over the period 2014-2020 on GDP in the 267 NUTS 2 regions of EU27. After a brief overview of the

8 López-Rodríguez, J. and Faíña, A.
Investigaciones Regionales, 29 (2014) – Pages 5 to 13
2014-2020 ECP financial envelope, the paper outlines the main building blocks of the RHOMOLO model. Then it describes the four scenarios which represent the main channels over which the structural funds flow: increase human capital through investment in training and other related policies, provide public funding assistance to the private and public sectors via R&D and Non-R&D subsidies thus increasing factor productivity and increase investment in order to improve the physical infrastructure as a basis for stimulating private sector productive activity. These financial expenditures are assumed to affect a set of parameters including factor productivity and transport costs that determine the model outcomes. The results of the simulations show that the overall effect of the four set of investments can clearly be expected to be positive, especially for most of the regions in the Member States which joined in the past decade. This fact is correlated with the distribution of Cohesion Policy support which is much higher for less developed regions.
Di Comite and Potter’s investigation proposes one extension of the RHOMOLO model devoted to the study of knowledge creation, investment decisions and economic growth by capturing the interactions between researchers, investors and final good producers. The starting point for the design of their knowledge production block and its integration with the rest of the economy comes from the formulation in Romer (1990). This formulation was later implemented in QUEST III a macroeconomic DSGE model for the Eurozone (Varga and in ’t Veld 2010). The future updates of RHOMOLO and its simulation results will greatly benefit from this theoretical piece of research since full endogenous knowledge production and investment decisions at the regional level could be incorporated to the current model’s structure. However as the authors clearly point out, some challenges could arise at the implementation phases due to data constraints and the model’s large dimensions (267 EU regions and 6 sectors).
RHOMOLO would fall short of a full-fledged equilibrium model without a well-modelled labour market. Regional labour markets serve as important adjustment channels to macro-economic shocks. In the third contribution of this special issue, Persyn et al. address this concern by describing the functioning of RHOMOLO’s labour market. In a standard labour market setting, regional demand shocks are translated into changes in local employment. Local employment changes can in turn be decomposed into three components: changes in labour force participation, changes in unemployment and changes in migration. The authors elaborate on how each of these channels are modelled. First, RHOMOLO incorporates the participation decision of workers, both at the extensive and the intensive margin. Second, regional unemployment is pragmatically modelled by means of wage curve, which inversely relates wage to unemployment. Finally, interregional migration decisions are based on a discrete-choice framework, in which the migration elasticities are estimate econometrically. The paper additionally discusses possible paths for future development.
The evaluation of the macro-economic impacts of innovation activities induced by R&D is by now well established in the CGE and DSGE frameworks (Bye et

Rhomolo and other methodologies to assess The European Cohesion Policy 9
Investigaciones Regionales, 29 (2014) – Pages 5 to 13
al., 2006, Krístková, 2013, Varga et al., 2011). However innovation can take place through activities which do not require R&D senso stricto such as the purchase of licenses, patents and software. Diukanova and López-Rodríguez’s investigation deals with the analysis of the impact of the ECP 2014-2020 financial investments allotted to innovation activities other than R&D (non-R&D) in the EU regions using the RHOMOLO model. Assuming that these innovation activities increase total factor productivity and that the RHOMOLO model requires externally elasticities to be supplied from other specific studies, they use López-Rodríguez and Martínez (2014) elasticity estimations to perform their simulations. The main results show that the biggest impact of the funds is reached in the regions belonging to the Central and Eastern European countries.
3. Other macro models and econometric studies to assess the European Cohesion Policy
De Miguel et al.’s paper focus their analysis of the impact of the European cohesion policy on the specific case of the Extremadura region. Specifically the paper aims to evaluate the effects that an increase of public final demand financed with the European funds may have in the economy of Extremadura. These effects are measured using a SAM (Social Accounting Matrix) model, which is an extension of Input-Output models and uses a SAM as database. The database is the SAM for Extremadura in 2000 (SAMEXT2000) elaborated by de Ramajo et al. (2009). After presenting an overview of two macro variables, GDP (Gross Domestic Product) and employment, and the evolution of population in the region in 2000-13, they evaluate the effects of raising investment demand. The main conclusions are that agriculture and market services are the most affected sectors, especially the former, in line with the main source of European funding. Regarding employment, Market services capture the biggest effects. According to their results, every million euros invested in Extremadura with European funds in the period 2007-13 generated around 67 new jobs in the region.
Álvarez-Martínez manuscript reviews a rather small set of literature that has examined the response of Spanish regions to European Structural Funds. It does so by first laying out the priority objectives of the funds and then pointing to regions in Spain that have received them (and how much). In doing the latter, it discusses why some regions have phased into and out of receiving the funds over time.
From this base, the paper moves to a discussion of the general equilibrium effects of the Structural Funds and immediately identifies the four papers that have used regional CGE models. The analyses are all recent and are limited to Madrid and Andalusia. Interestingly the author finds that the existing studies strictly examine the short-run effects of the investment spending of the Structural Funds. That is, all four papers fail to examine the true purpose of the structural funds, which is to improve long-run productivity by investing in human capital and key elements of public infrastructure. As the present author notes «we do not build roads... for their impacts

10 López-Rodríguez, J. and Faíña, A.
Investigaciones Regionales, 29 (2014) – Pages 5 to 13
on construction jobs but rather because they enable the delivery of products and people at lower cost... we do not fund [education and training] programs to enhance universities and schools, but rather to improve the capabilities... of workers».
Subsequently, the author cleverly uses the misguided analysis of the reviewed studies as a springboard to discuss new official Spanish databases on gross fixed capital formation.
The Maza et al.’s paper studies the impact of R&D investment, measured by the number of patents per million inhabitants, in Spanish growth and convergence at the level of NUTS3 regions (Spanish provinces). After a review of the theoretical and empirical literature on the topic, the authors started their econometric exercise by estimating an absolute beta-convergence equation for the Spanish provinces over the period 1996-2009 which was used as a benchmark for the subsequent estimations. Then, this equation is modified in subsequent stages to incorporate the effect of patents on the income growth in the Spanish provinces and also several control variables in order to test for the robustness of the results. The authors also report results using spatial econometric techniques to control for the existence of spatial dependence in their beta-convergence estimations. The results of this investigation show that first, patents have acted as a growth driver in the Spanish economy over the period 1996-2009. Second, no presence of spatial spillovers for the period under analysis is found. And, third, the effect of patents on growth seems to be higher for developed than for less developed provinces. These results can be used as a lesson for the design of future cohesion policy programmes since a big share of the ECP financial investments go to finance innovation related activities in the European regions. In view of the authors’ findings, major efforts should be devoted to promote a cohesion policy focused on R&D investment in the less developed territories.
It is well known that a great heterogeneity exists regarding the endowment of public and private, material and immaterial assets across EU regions. Within this context, Fratessi and Perucca’s paper assesses the role of these specific territorial endowments labelled as «territorial capital» 1 on the efficient implementation of Cohesion policies in Central and Eastern European NUTS3 regions. The authors overall results postulate that regions more endowed with territorial capital are more able to benefit from the policy support of structural funds investment and that for a substantial number of territorial capital assets, increasing returns are present and therefore regions more endowed with specific types of territorial capital are more able to gain from policy investment in related fields. These results, as the authors state, pose a trade-off between the effectiveness of the European cohesion policy and the convergence and catching up stimulus they can achieve, i.e., investing cohesion funds in regions with more «territorial capital» leads to greater returns than investing them in poorer regions. The authors’ suggested way out of this dilemma is to use the structural funds to build this type of capital which eventually will end up in enhancing the long run growth of the poorest regions.
1 See Camagni (2008) for a taxonomy on the types of territorial capital.

Rhomolo and other methodologies to assess The European Cohesion Policy 11
Investigaciones Regionales, 29 (2014) – Pages 5 to 13
Disparities in the levels of regional development are a well-established feature of the European economies. These disparities are largest within Central and Eastern European countries when comparing capital and non-capital city regions. Foreign direct investment could be an off-setting factor for regional disparities if it is channelled towards second tier city regions. The Dogaru et al.’s paper analyses the locational choices of multinational corporations (MNCs) in Central and Eastern Europe (CEE) between 2003 and 2010 focusing particularly on the location choices of capital city regions versus second tier city regions in the networks of foreign direct investments. The econometric exercise carried out by the authors (conditional logit regression) found that the most important location factors for FDI are market accessibility, strategic assets, institutional quality and agglomeration. These factors, at the present stage, cannot be offered simultaneously in CEE second-tier city regions and consequently competitiveness opportunities are difficult to obtain. The paper emphasizes the need for more European involvement in redirecting financing towards secondary city regions. According to the authors’ view cohesion policy should partly shift its support from offsetting deficient regional growth to encouraging secondary growth centres. EU guidelines should recognize the importance of more decentralized regional development.
4. Theory-based evaluations on the European Cohesion Policy: The case of Andalucía
Romero and Fernández-Serrano’s investigation closes this special issue by discussing the significance, trends and achievements of entrepreneurship promotion in Andalusia within the framework of the European cohesion policy financial investments carried out in the regions since the launching of the first programming period, the Delors I package (1989-1993) until the recently finished one (2007-2013). After a thorough discussion of the European Union cohesion policy and ERDF initiatives regarding to entrepreneurship in Andalucía in sections two and three, the authors move on to present an evaluation of the impact of these initiatives. This evaluation is made using several regional indicators such as business density, demography and total entrepreneurship activity, among others. The analysis of the experience of Andalusia allows the authors to draw some lessons and make recommendations for a more effective and efficient design of cohesion policy in support of entrepreneurship, which go beyond the particular case under study. Some of these recommendations are already incorporated in the current design of the ECP programmes. Among them it is important to underline a) the need of having a productive system with enough absorption capacity for an efficient use of the European Structural and Cohesion instruments, b) the need of a long run view for this type of policy actions since it is not possible to substantially change the entrepreneurial culture in a region with structural deficiencies in the short or medium run, c) the need of taking demand considerations into account and to apply a bottom-up approach granting an important role to private and intermediate agents, a) the need of moving away from a «subsidy» culture and potential rent-seeking behaviour by using other type of instruments such as reimbursable funds, credit guaranties or loans.
12 López-Rodríguez, J. and Faíña, A.
Investigaciones Regionales, 29 (2014) – Pages 5 to 13
5. Conclusions
The interest of this issue was to prompt new reflections and debate among the academic community and public policy makers on the techniques used for measuring the economic impact of EU funds. The evaluation of the European Cohesion policy is a complex process and we believe that this special issue of Investigaciones Regionales contributes to its general understanding. It provides an overview of the progress that has been accomplished over the past decades, and highlights present day state-of-the-art techniques that are currently used in the evaluation process. The different contributions stress the need to keep the academic debate alive, since many hurdles are still to be overcome. It is our hope that this special issue paves the way for new collaborations between research institutes and universities, which should be considered to be a top priority for future progress on the subject.
6. References
Bachtler, J.; Begg, I.; Polverari, L., and Charles, D. (2013): «Evaluation of the Main Achievements of Cohesion Policy Programmes and Projects over the Longer Term in 15 Selected Regions (from 1989-1993 Programme Period to the Present (2011.CE.16.B.AT.015), Final Report to the European Commission (DG Regio)», European Policies Research Centre, University of Strathclyde (Glasgow) and London School of Economics.
Barca, F. (2009): An Agenda for A Reformed Cohesion Policy: A Place-Based Approach to Meeting European Union Challenges and Expectations, Independent Report, Prepared at the Request of the European Commissioner for Regional Policy, DanutaHübner, European Commission, Brussels.
Bradley, J.; Herce, J. A., and Modesto, L. (1995): «The macroeconomic effects of the CSF 1994-99 in the EU periphery: An analysis based on the HERMIN Model», Economic Modelling, 12(3), 323-333.
Brandsma, A.; Kancs, D.; Monfort, P., and Rillaers, A. (2013): RHOMOLO: «A Regional-based Spatial General Equilibrium Model for Assessing the Impact of Cohesion Policy», JRC-IPTS Working Paper Series JRC81133, European Commission, DG Joint Research Centre.
Bye, B.; Heggedal, T.-R.; Fæhn, T., and Strøm, B. (2006): A CGE model of induced technological change: A detailed model description, Statistics Norway, http://www.ssb.no/a/english/publikasjoner/pdf/doc_200611_en/doc_200611_en.pdf.
Cancelo, J. R.; Faíña, A., and López-Rodríguez, J. (2009): «Measuring the permanent impact of European structural funds on peripheral objective 1 regions: The case of Galicia», European Planning Studies, 17, pp. 1535-1558.
Camagni, R. (2008): «Regional Competitiveness: Towards a Concept of territorial capital», in Capello, R.; Camagni, R.; Chizzolini, B., and Fratesi, U. (eds.), Modelling Regional Scenarios for the Enlarged Europe: European Competitiveness and Global Strategies, 33-48, Springer Verlag, Berlin.
Cardenete, M. A.; Delgado, M. C., and Lima, C. (2013): «The Structural Funds in Andalusia for the Programming Period 2014-2020: Time for Tightening belts», European Planning Studies, DOI:10.1080/09654313.2013.771622.
Dall’Erba, S.; Guillain, R., and Le Gallo, J. (2009): «Impact Of Structural Funds On Regional Growth: How To Reconsider A 9 Year-Old Black Box», Region et Developpement, Region et Developpement, LEAD, Universite du Sud - Toulon Var, vol. 30, pages 77-100.

Rhomolo and other methodologies to assess The European Cohesion Policy 13
Investigaciones Regionales, 29 (2014) – Pages 5 to 13
De Miguel, F. J.; Cardenete, M. A., and Pérez, J. (2009): «Effects of the tax on retail sales of some fuels on a regional economy: a computable general equilibrium approach», Annals of Regional Science, 43 (3), 781-806.
European Commission (2010): Europea 2020 Strategy, http://ec.europa.eu/europe2020/indexen.htm.
— (2014): Investment for jobs and growth. Promoting development and good governance in EU regions and cities. Sixth report on economic, social and territorial cohesion, Publication Office of the European Union.
Faíña, A.; López-Rodríguez, J.; Romero, I.; Fernández-Serrano, J., and Montes-Solla, P. (2013a): Evaluation of the main achievements of cohesion policy programmes and projects over the longer term in 15 selected regions (from 1989-1993 programming period to the present). Case Study Galicia, University of A Coruña, University of Seville, London School of Economics and European Policies Research Centre of the University of Strathclyde.
— (2013b): Evaluation of the main achievements of cohesion policy programmes and projects over the longer term in 15 selected regions (from 1989-1993 programming period to the present). Case Study Andalucía, University of A Coruña, University of Seville, London School of Economics and European Policies Research Centre of the University of Strathclyde.
Krístková, Z. (2013): «Analysis of private R&D effects in a CGE model with capital varieties: the case of the Czech republic», the Czech journal of economics and finance, vol. 63, issue 3, pp: 262-287.
Márquez, M. A.; Ramajo, J., and De Miguel, F. J. (2010): «Evaluación de los efectos econó-micos de los fondos estructurales del periodo 2000-2006 sobre Extremadura», Papeles de Economía Española, 123, pp. 191-205.
Rodríguez-Pose, A., and Fratesi, U. (2004): «Between Development and Social Policies: The Impact of European Structural Funds in Objective 1 Regions», Regional Studies, 38.1, pp. 97-113.
Romer, P. (1990): Endogenous technological change. Journal of political Economy, S71-S102.Romero, I., and Fernández-Serrano, J. (2007): «Un Análisis de la Heterogeneidad Empresarial
en la Unión Europea: Implicaciones para la Política Europea de Fomento Empresarial», Ekonomiaz, 66, 350-371.
Solow, R. M. (1956): «A contribution to the theory of economic growth», The quarterly journal of economics, 70(1): 65-94.
Sosvilla, S. (2009): «El impacto de los Fondos Europeos en la economía andaluza: 1989-2013», Revista de Estudios Regionales, 85, 97-118.
Varga, J., and in ‘t Veld, J. (2011): «A model-based analysis of the impact of Cohesion Policy expenditure 2000-06: Simulations with the QUEST III endogenous R&D model», Economic Modelling, Elsevier, vol. 28(1-2), pp. 647-663, January.
Varga A.; Járosi P., and Sebestyén, T. (2011): Modeling the economic impacts of regional R&D subsidies:The GMR-Europe model and its application for EU Framework Program policy impact simulations, http://dimetic.dime-eu.org/dimetic_files/Vargaetal2011.pdf.
Villaverde, J., and Maza, A. J. (2010): «Los fondos estructurales europeos y la convergencia de las regiones españolas: 2000-2006», Papeles de Economía Española, 123, 2-15.


Investigaciones Regionales, 29 (2014) – Pages 17 to 46
ArtIcles


© Investigaciones Regionales, 29 (2014) - Pages 17 to 46Section Articles
Assessing policy options for the EU Cohesion Policy 2014-2020
Andries Brandsma *, Francesco Di Comite *, Olga Diukanova *, d’Artis Kancs *, Jesús López Rodríguez *, Damiaan Persyn * and Lesley Potters *
ABSTRACT: In this paper we analyse the possible impact of Cohesion Poli-cy 2014-2020, putting together the investments supported by EU funding in all NUTS2 regions and running a set of simulations. We make use of RHOMOLO, a spatial CGE model tailored for economic analysis at the subnational level, which is described in the paper. We do so by first considering infrastructure investment, hu-man capital development and innovation climate support, including environmental amelioration, separately and then run a combined simulation of the three catego-ries to give an impression of the pattern and time profile of the overall effect. The results of the simulation show substantial heterogeneity in the effects across the regions, which are not a mere image of the differences in input. The concentration of EU funding on the less developed regions, and on energy saving, innovation and social inclusion in the more developed regions receiving support, could be a fruitful mix for lifting the standards of living in the whole of Europe.
JEL Classification: R13; R58; H54; O32.
Keywords: RHOMOLO; multiregional spatial CGE; Cohesion Policy.
Evaluación del impacto de la Política de Cohesión de la UE 2014-2020
RESUMEn: En este trabajo analizamos el posible impacto de la Política de Co-hesión de la UE 2014-2020, teniendo en cuenta todas las inversiones financiadas con los fondos estructurales europeos en el conjunto de las regiones NUSTS2 de la UE y simulando un conjunto de perturbaciones. Para ello se usa el modelo RHO-MOLO, un modelo espacial de EGC que está diseñado para el análisis económico
17
Received: 06 january 2014 / Accepted: 16 september 2014.
* European Commission, DG JRC-IPTS.The authors acknowledge helpful comments from Philippe Monfort, participants of the XXXIX con-
ference of Regional Studies in Oviedo, as well as participants of seminars and workshops at the European Commission. The authors are solely responsible for the content of the paper. The views expressed are purely those of the authors and may not in any circumstances be regarded as stating an official position of the European Commission.

18 Brandsma, A., Di Comite, F., Diukanova, O., Kants, A., López-Rodríguez, J., Persyn, D. and Potters, L.
Investigaciones Regionales, 29 (2014) – Pages 17 to 46
a nivel subnacional. El conjunto de simulaciones considera primero y de forma separada los impactos de las inversiones en infraestructura, capital humano y el apoyo a los temas de innovación incluyendo las mejoras medioambientales. En una segunda fase se realiza una simulación conjunta de las tres categorías de gasto para tener una impresión del patrón y del perfil temporal de los efectos totales. Los resultados de la simulación muestran una sustancial heterogeneidad en cuanto a los efectos en las distintas regiones, los cuales no son una mera imagen de las diferencias en términos de inputs. La concentración de la financiación de la UE en las regiones menos desarrolladas, y en ahorro energético, innovación e inclusión social en las regiones más desarrolladas podría ser una mezcla exitosa para elevar los niveles de vida en el conjunto de Europa.
Clasificación JEL: R13; R58; H54; O32.
Palabras clave: RHOMOLO; EGC multirregional y espacial; Política de Cohe-sión.
1. Introduction
Greater scrutiny over the performance of Member States and regions benefiting from the European Structural and Investment Funds (ESIF) is part of the design of the EU cohesion policy for 2014-2020, distinguishing it from previous rounds. This goes together with concentration of funding on 11 main lines of support and, geographi-cally, on the less developed among the 271 regions. Each region is expected to have a strategy for using the funds, identifying both the starting point and the potential for economic and social development, and indicating the region-specific targets that have been set. Quantification is essential and required. In principle, funds could be with-held, or the allocation for the next period lowered, when these conditions are not met.
This paper presents the spatial computable general equilibrium (CGE) model that has been developed by the European Commission for assessing the impact of the regional policy choices, taken together rather than individually. The main purpose of the paper is to show the pattern of impacts across the regions for the two broad options of investing in the infrastructure connecting the regions and investing in the economic potential of the less developed regions. Although this can be refined to simulate the impact of the more detailed policy choices of individual regions, it will remain problematic to establish, ex post, to what extent a deviation from the targeted impacts is caused by not implementing the policies as intended and to what extent by external effects beyond the control of the region concerned, including those induced by the strategies of other regions.
The use of models in policymaking is often justified by the multitude and com-plexity of interaction between agents, and some arguments for regional modelling put forward in this paper are no exception. However, it needs to be recognised upfront that it is precisely the objective that all regions should benefit from the single mar-ket, primarily by improving the competitive position of the less developed regions,

Assessing policy options for the EU Cohesion Policy 2014-2020 19
Investigaciones Regionales, 29 (2014) – Pages 17 to 46
which makes evaluating cohesion policy so difficult. In their own right, the number of regions and the challenges to multilevel governance do not constitute convincing arguments for modelling. What needs to be captured foremost is the high degree of interdependency between the deepening of economic integration and the increased potential of the regions to benefit from integration.
From its inception in 1988, EU cohesion policy has been accompanied by a growing literature, concerned with the process and its evaluation 1. The most recent overview is in Bachtler, Méndez and Wishlade (2013). Their analysis challenges the view that cohesion funding is just another battleground for Member States fighting over EU spending. Earlier rounds of cohesion policy are covered in volumes edited by Cuadrado and Parellada (2002), Bachtler and Wren (2006), Cuadrado and Marcos (2005) and Garrido et al. (2007).
In the absence of a regional model, the Commission has had to rely on mac-roeconomic and multi-sector models for its assessment of the impact of cohesion policy. The use of the QUEST III endogenous R&D model is set out in Varga and In’t Veld (2011). This is the Commission’s in-house dynamic general equilibrium model linking the economies of the Member States and the rest of the world, but no deeper than at the national level. Economic development may be reflected by the sectoral composition of national output. In order to capture the sectoral shift induced by re-gional policy the Commission has made use of the HERMIN model for a subset of the Member States (Bradley et al., 2003). The analysis is laid out in Gakova, Grigo-nyte and Monfort (2009), also considering possible extensions to a system of models at sub-national level. In essence, after taking into account conceptual difficulties and computational limitations, this has led to the construction of the spatial CGE model at NUTS2 level presented in this paper 2.
The current version of RHOMOLO covers 267 NUTS2 regions of the EU27 3, with total production divided into six sectors. Goods and services from home and abroad, that is to say other regions within the same country and (the regions of) oth-er countries, are consumed by households, government and firms. The households in each region receive income from labour, capital and transfers. The geographic interrelations between pairs of regions are obtained through a matrix of asymmetric bilateral transport costs for trade between regions derived from the transport model TRANSTOOLS (Burgess et al., 2008; Petersen et al., 2009).
The CGE approach allows for the interaction between regions to be captured within a fully consistent framework solving for simultaneous equilibrium in the goods, services and factor markets, but may run into computational limitations if the number of regions and sectors becomes very large. It therefore needs to be imposed
1 For more information on the evaluation of past Cohesion Policy measures and on the future and on the strategies and plans for the next programming period, see the Sixth report on economic, social and territorial cohesion (European Commission, 2014).
2 Ferrara, A., Ivanova, O. and Kancs, D. (2010) provide a formal description of the prototype.3 The full inclusion of the two Croatian regions is waiting for the data to become available. The
impact on the country as a whole is simulated with the help of the QUEST model.

20 Brandsma, A., Di Comite, F., Diukanova, O., Kants, A., López-Rodríguez, J., Persyn, D. and Potters, L.
Investigaciones Regionales, 29 (2014) – Pages 17 to 46
that each sector produces just one composite good and the usual Dixit-Stiglitz and Armington assumptions are made to keep the system of equations manageable. More fundamentally, although the model is derived from optimization by representative economic agents, forward-looking expectations consistent with model outcomes can-not be handled within the current set-up. Bradley (2006) already recognised the chal-lenge of reconciling bottom-up micro-analysis with top-down macro-analysis. The approach taken in this paper is to align the RHOMOLO results with the aggregate impact generated with QUEST under model-consistent expectations. To the extent possible the two models are made to share the microeconomic foundations, whereas the rich dynamics of the QUEST III endogenous R&D model are superimposed on the sequence of solutions over time of the spatial CGE model.
The paper is organised as follows. First, Section 2 provides some further back-ground on EU cohesion policy and the changes that are envisaged. Section 3 gives a brief technical description of RHOMOLO, touching upon its structure, characteris-tics and dynamics. Section 4 describes in detail the design of the four main scenar-ios that have been simulated (Human Capital, R&D, Non-R&D and Infrastructure investments) and Section 5 presents the outcomes of these simulations as deviations from the baseline without cohesion policy interventions. Finally, Section 6 con-cludes.
2. Concentration of funding under EU cohesion policy
EU cohesion policy has its roots in the Treaty of Rome, but it was on the waves of the single market and the European Union’s enlargement that the policy got its present size and shape. All together, the ESIF are the second largest comprehensive part of the EU budget, absorbing roughly one third of the expenditure 4.
The ESIF are three different funds with their own objectives and stakeholders:
— The Cohesion Fund available to Member States with a GDP per capita of less than 90% of the EU average supports investment aimed at fulfilling the convergence objective. Its main activities are directed at improving the trans-European transport (TEN-T) networks and the environment, notably in the fields of energy or transport (e.g., supporting energy efficiency, the use of renewables, public transport, inter-modality);
— The European Social Fund (ESF) is the EU’s main financial instrument for investing in people. It increases the employment opportunities of European citizens, promotes better education and helps containing the risk of pover-ty. The ESF covers measures aimed at fostering lifelong learning schemes, reducing search and matching costs in the labour market, promoting social
4 There are two additional funds that fall under the Commission’s Common Strategic Framework: the European Maritime and Fisheries Fund (EMFF) and the European Agricultural Fund for Rural De-velopment (EAFRD). They are not taken on board in the analysis of this paper since, strictly speaking —and although they serve structural reform purposes— they are generally not considered to be part of EU cohesion policy.

Assessing policy options for the EU Cohesion Policy 2014-2020 21
Investigaciones Regionales, 29 (2014) – Pages 17 to 46
integration, combating discrimination and strengthening human capital by reforming education systems;
— The European Regional Development Fund (ERDF) aims to strengthen eco-nomic, social and territorial cohesion in the EU by correcting imbalances between regions. The ERDF supports regional and local development, in-cluding actions in the field of sustainable urban development.
The combination of the Structural Funds (ESF and ERDF) and the Cohesion Fund amounted to 347 billion euros, equivalent to roughly 0.3% of EU-27 GDP, in the programming period 2007-2013. For individual regions, the financial support can be as high as 4% to 5% of their GDP. The support is provided under the principles of additionality and partnership. Concentration and multi-annual programming are the tools for aligning the use of the funds to EU objectives and priorities. Additionality refers to the requirement that contributions from the structural and cohesion funds are not simply substituted for national expenditures already planned. Partnership re-quires a collective process involving authorities at European, regional and local level, social partners and organisations from civil society 5.
The funds are the EU’s instruments for channelling the contributions of the Member States into investments in infrastructure, people and the environment, pri-marily through financial support provided at the regional level. In the words of the Treaty of Lisbon, in order to promote its overall harmonious development, the Union shall develop and pursue its actions leading to the strengthening of its economic, so-cial and territorial cohesion. The Union aims at reducing disparities between regions with a particular focus on the backwardness of the least favoured regions.
2.1. How to model EU cohesion policy
Over the years, the emphasis of cohesion policy has shifted from an attempt to shield the countries and regions from the consequences of fiercer competition within the single market to a strategy of enhancing the potential of the regions to take greater advantage of European integration. What this means for the approach followed in this paper is that RHOMOLO should be able to capture both the lowering of barriers between regions, reflected in shifts in inter-regional and cross-border trade, and the increased potential of the regions resulting from the access to the ESIF. The model is set up to deal with the broad strokes of policies to stimulate growth, employment and competitiveness at the regional level, rather than the detailed channels of financial support of the structural and cohesion funds.
RHOMOLO as it stands has three major handles for putting in the interventions under cohesion policy:
— the reduction of transport cost resulting from the investment in infrastructure, differentiated for the bilateral connections between each pair of regions;
5 See http://ec.europa.eu/regional_policy/index_en.cfm for more detailed information about Region-al Policy.

22 Brandsma, A., Di Comite, F., Diukanova, O., Kants, A., López-Rodríguez, J., Persyn, D. and Potters, L.
Investigaciones Regionales, 29 (2014) – Pages 17 to 46
— the shifts in labour productivity resulting from the investments in human cap-ital, which have a distinct profile with highly positive effects in the long term and possibly negative in the short run; and
— the improvement in total factor productivity, outside the labour-capital bun-dle, which represents technical progress and innovation among other factors behind regional economic growth.
In addition, it would be possible to assign some interventions to sectors of economic activity and to use the cost of newly built-up physical capital as a pa-rameter. For instance, the sector of construction may benefit heavily from partic-ular investments in infrastructure. However, it is far from obvious in which region the companies benefiting from such investments would be located. The demand effects in the simulations of this paper are therefore left to the inner workings of the model, including the input-output relations embedded in the production structure.
Table 1 shows the result of grouping the lines of expenditure into macro catego-ries for the purpose of the simulations.
Table 1. Details on Cohesion Policy expenditures (in € millions). GDP values are reported for 2007 because that is the year used for the calibration
of the model due to data availability at the regional level
Region type1 # GDP 2010 RTDIAid to private sector
Infras-tructure
Human Capital
Techni-cal
Assis-tance
Total %
Less Developed Regions
65 1,199,595 25,250 27,127 129,128 38,408 12,162 232,075 68
Transition Regions 51 1,466,019 5,772 6,218 14,339 10,201 1,585 38,115 11
More Developed Regions
151 9,539,148 10,916 9,101 24,167 24,196 2,954 71,335 21
Total 2672 12,204,762 41,938 42,447 167,634 72,805 16,701 341,525 100
% of total CP 12% 12% 49% 21% 5% 100%
1 The less developed regions have a GDP per capita that is less than 75% of the EU-27 average. The GDP per capita of the transition regions is between 75% and 90% of the EU-27 average and for the more developed regions this is above 90%.2 The EU27 has a total of 271 NUTS2 regions, but 4 French regions are left out because of their very particular characteristics: Guadalupe, Martinique, Guyana and Réunion. The two Croatian regions are not included yet because of limited data availability.
Funds designated to Human Capital aim at bringing improvements to the labour markets by investing in training and education of employees. As can be seen, the vast majority (68%) of the funds is allocated to the less developed regions. The joint human capital expenditures are assumed to translate into an improvement of labour productivity in the model. The full setup of the simulation is discussed in section 4.1.

Assessing policy options for the EU Cohesion Policy 2014-2020 23
Investigaciones Regionales, 29 (2014) – Pages 17 to 46
Funding for Research, Technical Development and Innovation (RTDI) is aimed at supporting firms with the uptake of novel research findings in the actual imple-mentation of innovations. The RTDI related expenditures are assumed to affect the innovation capacity of the economy, which is translated into changes in the total factor productivity (TFP) parameter of the model. Section 4.2 discusses the set-up of the TFP simulations in greater detail.
The category Aid to Private Sector covers support to activities that are not im-mediately associated with R&D. They nevertheless can play an important role in the economic development of countries and regions that are at a considerable distance from the technology frontier by easing the way towards that frontier and raising TFP. These non-R&D innovation activities consist e.g. of technology and know-how acquisitions, such as machinery and other equipment patents, trademarks, designs, etc. In Europe, about 40-60% of the industrial value-added and 50% of all industrial employees are engaged in the non-R&D intensive sector (Som, 2012). Moreover, more than half of all innovating firms in the EU are non-R&D performers (Arundel et al., 2008). Therefore, considering the high shares of funding devoted to the non-R&D activities and the importance of these activities in the promotion of innovation and TFP growth in Europe, it is important to evaluate the ex-ante effects of the planned regional non-R&D investments across EU regions. More details are provid-ed in Section 4.3.
Funds aimed at investment in Infrastructure mainly support regions in im-proving connectivity within the region and with other regions. The main focus is on railways, motorways and airports, as well as on improving the environmental and social infrastructure of the regions. The investments can be expected to lead to a decrease in transport costs, as well as in the general cost for doing business. For instance, they may lower the cost of communication, making it easier to sell final goods or source intermediates. These investments will be modelled as a reduction of the transport costs. The setup is discussed more in detail in Sec-tion 4.4 6.
The envelope is spread over the years based on the experience of past Com-munity Support Frameworks. In addition, the N+3 rule 7 is applied, so that the ex-penditures run from 2014 to 2023. The assumed time profile is shown in Figure 1. The same profile applies to all regions and they are expected to be able to increase their absorption capacity as compared to the 2007-2013 programming period. It is assumed that by 2018 more than 50% of the allocated funds will have been spent and up to 80% by 2020.
6 Given its relatively small size in the overall budget and the difficulty to model it in a consistent way, the category Technical Assistance has not been modelled. It mostly concerns technical support pro-vided to regions or local authorities for streamlining bureaucratic procedures, public programming and auditing.
7 The Commission shall automatically «decommit» any part of a commitment which has not been settled by the payment on account or for which it has not received an acceptable payment application by the end of the third year following the year of commitment.

24 Brandsma, A., Di Comite, F., Diukanova, O., Kants, A., López-Rodríguez, J., Persyn, D. and Potters, L.
Investigaciones Regionales, 29 (2014) – Pages 17 to 46
Figure 1. Time Profile of Cohesion Policy expenditures
100908070605040302010
0
(%)
Cumulative Cohesion Policy Expenditures (% of total)
2014 2015 2016 2017 2018 2019 2020 2021 2022 2023
2.2. The main themes of EU cohesion policy for 2014-2020
The 2014-2020 round of cohesion policy is characterised by a concentration of funding, geographically as well as thematic. It mirrors closely the EU 2020 objec-tives with their focus on sustainable growth, creating jobs within an inclusive society. In comparison with the previous round, the number of lines of expenditure under which structural and cohesion funding is spent has been concatenated, partly revers-ing the proliferation of projects. The eleven thematic objectives for delivering Europe 2020 through ESIF are:
1. Strengthening research, technological development and innovation. 2. Enhancing access to, and use and quality of, information and communica-
tion technologies. 3. Enhancing the competitiveness of small and medium-sized enterprises, the
agricultural sector and the fisheries and aquaculture sector. 4. Supporting the shift towards a low-carbon economy in all sectors. 5. Promoting climate change adaptation, risk prevention and management. 6. Protecting the environment and promoting resource efficiency. 7. Promoting sustainable transport and removing bottlenecks in key network
infrastructures. 8. Promoting employment and supporting labour mobility. 9. Promoting social inclusion and combating poverty.10. Investing in education, skills and lifelong learning.11. Enhancing institutional capacity and an efficient public administration.
Looking more closely at this list, it appears that only items 9-11, and perhaps 3, are clearly related to improving the economic and social situation of the least fa-

Assessing policy options for the EU Cohesion Policy 2014-2020 25
Investigaciones Regionales, 29 (2014) – Pages 17 to 46
voured regions. Themes 4-6 are directed at making the European economy more resource efficient —less energy dependent— and contributing to climate change tar-gets. Regions may learn some lessons on best practices from one another and from light competition on environmental attractiveness between them, but air pollution and global warming are not contained within regional borders and typically need to be sorted out at the supranational level. The use of structural and cohesion funds for environmental purposes is mostly related to urban development, nature, water and waste. Other themes —focusing on research and innovation (1), ICT (2), transport (7) and mobility (8)— have as much to do with the interconnection of regions as with remedying their backwardness, and assigning them to the regions, as in Table 1, is somewhat arbitrary.
From a modelling point of view, there would be no need to have a full allocation of funds to the regions. The model itself generates the regional distribution of the returns on the investment, some of which will be tied to the region and another part to the connections between the regions. This is in fact the way it has been implemented in RHOMOLO for the purpose of the exercises in this paper. The budget for cohesion policy post-2013 amounts to 380 billion euros in total, including 40 billion euros for the Connecting Europe facility for transport, energy and ICT. The latter is clearly spent on the networks connecting the regions and is modelled through a reduction in transport costs which is estimated with the help of the TRANSTOOLS model using detailed data on the TEN-T investments in roads, rail and waterways.
For the 2014-2020 period, the Cohesion Fund is dedicated to investment in cli-mate change adaptation, energy saving and risk prevention in Bulgaria, Croatia, Cyprus, the Czech Republic, Estonia, Greece, Hungary, Latvia, Lithuania, Malta, Poland, Portugal, Romania, Slovakia and Slovenia. Some 10 of the nearly 70 billion euros reserved for the Fund are ring-fenced for the Connecting Europe facility. All in all, the broad thematic decomposition in Table 1 shows that nearly half of the ESIF can be attributed to investment in infrastructure, not counting the 40 billion for the facility itself.
The other half of the ESIF is spent on education and training, that is investing in human capital, and support to research and innovation in enterprises, including SMEs in the regions. Relatively little goes to R&D activities proper; the category Aid to the private sector consists of such things as financial support for acquiring new equip-ment and know-how and for applying for patents, trademarks and designs with local/regional content. It is envisaged that part of the ESIF may be dedicated to assisting researchers in Horizon 2020 participation and providing enterprises with easier ac-cess to the results of earlier Framework Programs, mainly to the benefit of countries that joined the EU since 2004.
The calculations in Table 1 show that in terms of geographical allocation roughly two thirds of the ESIF, including the Cohesion Fund, go to the less developed regions. The remaining third goes to the more developed regions and the regions in transition, with a GDP per capita between 75 and 90 per cent of the EU-28 average. The tran-sition arrangements apply in particular to the regions that passed the 75% threshold

26 Brandsma, A., Di Comite, F., Diukanova, O., Kants, A., López-Rodríguez, J., Persyn, D. and Potters, L.
Investigaciones Regionales, 29 (2014) – Pages 17 to 46
recently, either of their own account or because the EU average fell as a result of the recent enlargements.
2.3. The 2014-2020 allocation of funding
It is interesting to consider the matrix of thematic and geographical allocation from a political angle. Bachtler and Méndez (2007) made a careful assessment of the governance of EU cohesion policy at the start of the 2007-2013 round. They argue that the doubling of the funding in 1988 accompanying the single market initiative has been followed by largely unsuccessful attempts, at each review and renegotiation of the allocation and spending, to shift the decision power on the spending of the structural funds back to the Member States. In terms of geographical allocation, half of the funding continues to go directly to the less developed regions. The battle is mainly over the remaining part of the structural funds, and in particular the European Social Fund (ESF). On the proposal of the Commission, maximum co-financing rates have been set, which range from 50% for the most developed regions to 85% covered by the EU contribution from the Cohesion Fund. Some of these rates have been in-creased in response to the economic and financial crisis.
The Commission has raised its leverage even further by setting minimum shares for categories of spending under each Fund. For example, under the ERDF, at least 80% of the spending in the more developed and transition regions, aggregated by Member State, should be devoted to the use of natural resources, innovation and SME support. At least one quarter of this is expected to go to energy efficiency im-provements and renewables. Less developed regions have greater leeway in setting investment priorities, reflecting more diverse needs in catching up with EU average standards, but will have to spend at least 50% of ERDF resources on energy saving, innovation and SME support.
Minimum shares have also been established for the use of ESF support as a per-centage of total EU funding: 25% for the less developed regions; 40% for the regions in transition; and 52% for the more developed regions. The upshot of all this is that the bulk of the ESIF is going to the least favoured regions, with investment in infra-structure and human capital as the two biggest categories. More developed regions receiving support are very much restricted in their use of the funds, which should be spent mostly on promoting energy efficiency and innovation and enhancing job opportunities and social inclusion.
With its proposal for the 2014-2020 round, endorsed by Council and Parliament, the Commission has reinforced the conditions under which funding will be released. Ex ante, the Commission looks at whether the regulatory and institutional frame-works for making investments effective and implementing them efficiently are all in place. It can also impose requirements regarding the thematic objectives, such as submission of a smart specialisation strategy. Ex post conditionality looks at whether regional performance and the results of using the funds are in line with the EU 2020 objectives. A total of 5% of the ESIF envelope is set aside for allocation at a later

Assessing policy options for the EU Cohesion Policy 2014-2020 27
Investigaciones Regionales, 29 (2014) – Pages 17 to 46
point of time, after the mid-term review has taken place. Failure to reach the targets agreed with the Member State concerned and fulfil the requirements may lead to the suspension or cancellation of EU funding.
3. Brief description of RHOMOLO
The RHOMOLO model is calibrated to the regionalised Social Accounting Matrices (SAMs) of the EU member states that were extracted from the World In-put-Output Database (Timmer, 2012). SAMs for the NUTS2 regions were construct-ed using the data of regional production by sector, bilateral trade flows among the NUTS2 regions, and trade with the rest of the world (ROW), as described by Potters et al. (2013). The version of the model used for this paper includes 6 NACE 8 Rev. 1.1 industries: Agriculture (AB), Manufacturing (CDE), Construction (F), Transport (GHI), Financial Services (JK) and Non-market Services (LMNOP).
EU regions are modelled as small open economies that accept EU and non-EU prices as given, which is consistent with the regional scope of the model. In this perspective, EU external relations involve only one non-EU trading partner that is represented by the ROW aggregate
Interregional trade flows are estimated based on prior information derived from the Dutch PBL dataset (Thissen et al., 2013). Data on bilateral transport costs per sector are provided externally by the TRANSTOOLS model 9, a model covering freight and passenger movements around Europe. The costs of different shipments are calculated in terms of share of the value shipped, based on the time needed to reach the destination using alternative modes of transport. Transport costs thus differ by type of good and depend on the distance between the regions and the variety and characteristics of modes of transport connecting them, which also means that they can be asymmetric. The representation of trade and transport flows among the NUTS2 regions gives the model a spatial dimension, indicating that EU regions differ not only in their stocks of production factors but also in geographic location.
Mobility of capital and labour is assumed to occur within regions, but interna-tional or intra-regional migration of production factors is not considered in the core model version.
All agents of the model are assumed to have myopic expectations and do not anticipate future changes in relative prices or make choice between consumption and savings depending on the interest rate. Using a perpetual inventory method (OECD, 2001), the sum of interest rate and depreciation rate are employed to estimate the regions’ capital stocks from the value of their operating surplus, as available in the SAMs. The interest rate is set at the level of 5% and the capital depreciation rate at
8 See http://epp.eurostat.ec.europa.eu/statistics_explained/index.php/Glossary:NACE.9 See Burgess et al. (2008) or visit http://energy.jrc.ec.europa.eu/TRANS-TOOLS/TT_model.html.

28 Brandsma, A., Di Comite, F., Diukanova, O., Kants, A., López-Rodríguez, J., Persyn, D. and Potters, L.
Investigaciones Regionales, 29 (2014) – Pages 17 to 46
6% per annum 10. In order to keep the model baseline «clean» of trade spillovers that change relative prices and induce sectorial changes, we apply a uniform 2% annual growth rate to all regions.
The model solves for the sequence of equilibrium states when all time periods are connected with the equation of capital accumulation: each year in each region a portion of capital stock depreciates and gets augmented by the previous year in-vestments, so that capital stock and investments grow at the same rate with the rest of economy. Values of investments in each region are adjusted in order to achieve consistency among the observed investments, the estimated capital stock and the re-quired replenishment of the capital stock. Therefore, there are no changes in regions’ economic structures over the steady-state baseline period. All prices remain constant; only the quantities grow at the same constant rate. This enables the comparison of the after-shock results with the baseline values 11.
3.1. Composite of domestic and imported varieties
Domestically produced and imported varieties are combined with a CES func-tion. Trade and transport margins are applied to imports from other NUTS2 regions and to domestic sales (ttm). Following this specification, the structure of composite good is depicted in Figure 2.
Figure 2. Composite of domestically produced and imported varieties of the same good
Imports
Imports from the
region UKN0
… CES
Composite good
ttm ttm
Imports fromthe ROW
Imports fromthe region AT11
Domesticsales
ttm
Composite goods are consumed by industries, households, government, and the investment sector.
10 In reality, interest rates may change over time, but for modelling standard values are assumed in the literature.
11 The core model equations are specified in the calibrated share format proposed by Rutherford (1999), programmed in GAMS as a mixed complementarity problem (Mathiesen, 1985) and solved using a PATH solver.

Assessing policy options for the EU Cohesion Policy 2014-2020 29
Investigaciones Regionales, 29 (2014) – Pages 17 to 46
3.2. Industries’ nested cost function
In a core model version the CET function defines the sectors’ choice between sales on the domestic market and exports to other regions as function of relative prices on these markets. However, in order to introduce imperfect competition, the CET function has to be removed. Taking into account that sectors’ export sup-ply to the NUTS2 regions is determined by import demand of these regions (see Figure 2), we can dismiss the constant elasticity of transformation (CET) function of output transformation to regional markets. However, the aggregate of non-EU economies (ROW) cannot be treated as one of model’s regions. Even though a SAM for ROW can be constructed using a GTAP database (Badri Narayanan et al., 2012), adding the ROW region to a RHOMOLO would create computational difficulties, as model would be calibrated to the SAMS of 270 small regions that have relatively small values of economic transactions and one ROW region with large values. Hence, following the approach of Whalley and Yeung (1984), export supply to the ROW is modelled with a function of export demand from the Rest of the World.
A Leontief function is employed on the top level of the sectors’ production func-tions in order to define complementarity between the intermediate inputs and the labour-capital aggregate. The lower level of the sector’s production function features the possibilities of trade-offs between labour and capital services that were specified with the CES function; intermediate inputs are assumed to be non-substitutable. Co-efficients of factor productivity improvements are assigned to labour (fpl) and capital (fpk). With this specification, producers can maintain the same levels of output using less production factors. The same structure of nested production functions is adopted for all sectors (see Figure 3).
Figure 3. Sector’s nested production function
Exports
Exports to the ROW
Domestic sales
…
CET
tc
Lt
CESLabour
Capital
tl tk
LMNOPJKGHIFCDE
ABfpk fpl
Labour-capitalaggregate
Exports to theregion AT11
Exports to theregion UKN0

30 Brandsma, A., Di Comite, F., Diukanova, O., Kants, A., López-Rodríguez, J., Persyn, D. and Potters, L.
Investigaciones Regionales, 29 (2014) – Pages 17 to 46
3.3. Budget balance and structure of household consumption
According to the information, which was provided in the regional SAMs, re-gional households supply labour and capital services, pay income taxes, receive net transfers from the public sector, and also net transfers from abroad. Households save a fixed proportion of their income.
After deducting taxes, transfers and savings, the disposable income is used to maximize utility of households’ consumption. The final goods that are consumed by households are combined, allowing for substitutability among inputs. The structure of regional household consumption is described in Figure 4.
Figure 4. Structure of regional household expenditures and public expenditures
Household consumption
LMNOP
CD
JKGHIF
CDEAB
3.4. Budget balance and structure of Public consumption
According to the SAMs, income of regional government consists of taxes on sec-tors’ output, sectors’ consumption of labour, capital services, taxes on regional invest-ment good, income taxes, net transfers from abroad and net transfers from regional households. In the model we assume fixed tax rates and constant public consumption of final goods. Hence, public savings are determined as a residual.
The structure of regional public consumption was specified in a similar manner to that of households (Figure 4).
3.5. Savings-investment balance
Investment sector combines Armington goods in fixed proportions. Savings-in-vestment balance is achieved by household savings, public savings and also savings from the EU and ROW.

Assessing policy options for the EU Cohesion Policy 2014-2020 31
Investigaciones Regionales, 29 (2014) – Pages 17 to 46
3.6. Market clearing conditions
Since model is formulated in a calibrated share format, demand and supply of goods were defined by differentiating the profit or cost function by the price of that good (Hotelling’s and Shephard’s lemmas).
3.7. ROW closure
Following the (small open economy) SOE assumptions, any of the NUTS2 re-gions doesn’t influence prices in the non-EU market. Therefore, we formulated the EU balance of trade as net exports to the ROW. We fix the ROW savings keeping the real exchange rate flexible, so that ROW price adjusts to bring about equilibrium. Savings from the EU are set exogenously and valued using a producer price index
4. Scenario construction
4.1. Human capital related policies
The budget line Human Capital under cohesion policy covers a wide variety of expenditures. Some aim at fostering re-integration of long-run unemployed on the labour market, while others pertain to improving life-long learning or on the job training. To simulate the effects of cohesion policy on human capital in RHOMOLO, the expenditures are aggregated into a single exogenous shock by assuming that they all lead to an increase in regional labour productivity (the fpl parameter), at the cost of a temporary decrease in the local labour supply.
Next, it needs to be specified how efficient the policy is in improving regional labour productivity. For this, it is assumed that the percentage increase in the human capital stock of the region induced by cohesion policy equals cohesion expenditure on human capital relative to the total expenditure on education in the region, taken from EU KLEMS (Timmer et al., 2007). Next, in accordance with the estimates in the empirical literature, it is assumed that increasing the stock of human capital by 1% leads to an increase of 0.3% in output per worker (Sianesi and Van Reenen, 2003).
In the initial years of the policy implementation, labour supply simultaneously is assumed to decrease and remains subdued during the programming period. After the programming period, labour supply recovers to its original level.
Future work will focus on the stark assumptions made for these simulations. Firstly, the homogeneity of the labour productivity increase between countries for a given percentage increase relative to local education expenditure will be relaxed, as it seems likely that not all countries and regions would benefit equally from an increase in the human capital stock. Secondly, policies will be separated out which may be ex-pected to operate not through increasing labour productivity, but rather e.g. through improving labour market efficiency.

32 Brandsma, A., Di Comite, F., Diukanova, O., Kants, A., López-Rodríguez, J., Persyn, D. and Potters, L.
Investigaciones Regionales, 29 (2014) – Pages 17 to 46
4.2. R&D investments
For the 2014-2023 period, 42 billion euros have been allocated to lines of expen-diture related to support to RTDI. This is 12% of the grand total of Cohesion Policy funds; 60% of this goes to the less developed regions, a lower percentage than the 70% across all budget lines.
In order to depart from a framework with simplified growth dynamics à la Solow (1956), the current version of RHOMOLO introduces an endogenous growth mecha-nism à la Howitt (2000). López-Bazo and Manca (2014) use a specification in which TFP growth is determined by a combination of RTDI investment and catching up with other regions. There is considerable empirical evidence of the effect of R&D on TFP, very well elaborated in Hall et al. (2009). The investment in RTDI under cohesion policy is first expressed as an increase in the R&D intensity compared to the baseline and subsequently a TFP equation is used to model the increase in TFP re-sulting from R&D. This is the most standard formulation derived in Hall et al. (2009) which is reproduced here in a distributed lag format, reflecting that it takes time for an investment in R&D to be turned into innovation and consequently a productivity improvement. The TFP equation is as follows:
TFP TFP
b bRTDI
reg t reg t
re
, ,* ( )*
* *
= + −
+
−γ γ1
0 1
1
gg t
reg t
reg t
reg tGDPb
RTDI
GDPT, ,
,
, ,
,
* *sec sec+ 2 FFPgap b TFPreg reg t t, , * *( )
+
3
1elsewhere
where TFPreg represents the level of regional TFP at a given point of time that sub-
sequently has an impact on the total output. The term RTDI
GDPreg
reg
,sec is the R&D inten-
sity for each sector in each region. The second explanatory variable is the combined interaction between the average R&D intensity and the gap in TFP with the leading region. It should be noted that the further away is the region from the technology frontier the faster it will catch up given the same R&D intensity. This is because there is a greater potential for closing the gap by borrowing from the existing stock of knowledge and know-how.
The third term between brackets represents possible spillovers from TFP increases in other regions and sectors (TFPelsewhere). These spillovers are the key reason why the social return on R&D exceeds the private return, and thereby would justify public investment and support to R&D in the private sector. This is a topic of empirical research taken up by Belderbos and Mohnen (2013), who propose a patent citation-based indica-tor to measure the presence of intra- and inter-sectoral knowledge spillovers, nationally as well as cross-border. This could possibly at a future stage be transformed into a spatial structure for the spillovers between regions but for the moment b3 is set to zero.
Hall et al. (2009) conclude that R&D rates of return in developed economies are strongly positive and may be as high as 75%, although they are more likely to be in

Assessing policy options for the EU Cohesion Policy 2014-2020 33
Investigaciones Regionales, 29 (2014) – Pages 17 to 46
the 20% to 30% range. This estimate is introduced in the model by setting a rate of return. This is close to the estimate used in QUEST III (McMorrow and Röger, 2009).
The empirical evidence on the spillover effect and catching-up is not as strong, but it is likely that the farther away from the technology frontier the greater the po-tential for catching up, conditional on the ratio of R&D to GDP. This is introduced in the model by a multiplicative term expressing that the higher the R&D intensity the greater the part of the TFP gap that is closed every year. An increase in RTDI ex-penditure compared to the baseline will set in motion this process, which is assumed to operate with the same distributed time lag and coefficient as the R&D effect on its own. This would approximate a doubling of the rate of return on RTDI for regions which are TFP = 1 at compared to the technology frontier (TFP = 2) 12. The estimates behind this specification are confirmed by the econometric research of López-Bazo and Manca (2013).
4.3. Support to innovation other than through R&D
Innovation can take place through activities which do not require R&D such as the purchase of advanced machinery, patents and licenses, training related to the in-troduction of new products or processes, etc. These forms of acquiring knowledge and technology are referred to here as non-R&D (NR&D) innovation activities. From a policymaking point of view, it is important to analyse the impact of NR&D mea-sures since a sizable portion of the cohesion policy budget is devoted to such support. In the 2014-2020 round, some 40 billion euros are devoted to NR&D activities. The current version of RHOMOLO analyses its impact considering that the main channel of influence of these activities is through their impact on TFP. López-Rodríguez and Martínez (2014) estimate an elasticity of TFP with respect to the NR&D investments
of γ γ3 1+( )Ird 13. Mathematically, the following expressions have been used to esti-
mate the shifts on TFP due to NR&D funds:
gTFP y IrdNR D
GDPbaureg tt reg
t re,
,
,
&= +( ) −
−3 1
1
1
γgg
reg t reg t reg tTFP gTFPbau gTFP
= +
( )
, , ,
2
3)) ( )3
where gTFPreg,t is the annual regional growth rate in TFP in region reg in year due to NR&D innovation expenditures; g 3 + g 1 Ird is the elasticity of TFP improvements with respect to NR&D investments, taken from López-Rodríguez and Martínez (2014); NR&Dt–1,reg is the amount of NR&D innovation expenditures assigned in the
12 Luxembourg, Brussels and Greater London are excluded from the frontier, because they are financial centres with a very high TFP in the data
13 This expression takes values in the range [0.15-0.18].

34 Brandsma, A., Di Comite, F., Diukanova, O., Kants, A., López-Rodríguez, J., Persyn, D. and Potters, L.
Investigaciones Regionales, 29 (2014) – Pages 17 to 46
year t – 1; GDPbaut–1,reg is the forecasted GDP region in the year is the baseline an-nual regional TFP growth in the region reg during the year t; TFPreg,t; is the growth rate induced by the NR&D investments.
For the purpose of this exercise not only the values of allocated funds are in-troduced but also the planned annual absorption of non-R&D investments for each region during the compliance period of 2014-2023. It should be noted that regional NR&D investments are not distributed homogenously in the plans for the period of 2014-2023, but show fluctuations from one year to the next. Given that the model baseline was projected assuming a steady-state 2% annual growth rate, region’s val-ues of TFP growth can double or triple from one year to another.
4.4. Infrastructure investments
In a first step, an aggregate measure of the total expenditure on transport infrastruc-ture under cohesion policy is derived for each region. For this purpose, all policy instru-ments directly affecting transport infrastructure are aggregated in one category, INF 14.
In a second step, an attempt is made to impute the spatial dimension of the trans-port infrastructure funds based on region-specific expenditures as calculated in the first step by estimating how region-specific expenditure translates into region-pair-specif-ic expenditure. The spatial dimension is important, because transport infrastructure improvement affects not only the region in which the investment is made, but also all regions with which it trades goods and services. The following formula is used to impute a spatial matrix of bilateral transport investments , :,ECPreg regg
INF
ECPECP ECP
reg reggINF
reg reggregINF
eggINF
, ,=+
φ22
4
( )
where ECPregINF and ECPrerg
INF are ECP transport infrastructure expenditures in regions reg and regg, respectively, and
φ τ σ
reg regg reg regg, ,≡ −1 is the freeness of trade, which rang-es from zero, when trade is perfectly un-free (bilateral trade costs are prohibitive between reg and regg), to unity, when trade is perfectly free and bilateral trade costs are zero (Baldwin et al., 2005). φ τ σ
reg regg reg regg, ,≡ −1 denotes bilateral trade costs between pairs of regions as measured by TRANSTOOLS.
The bilateral measure of transport infrastructure investments (4) takes the ex-penditure in the regions at both ends as well as the proximity of the regions into ac-count. The second term on the right-hand side in equation (4) calculates the average transport investment for every pair of regions. The first term on the right-hand side
14 Note that no weights are applied at this stage of aggregation, although, according to the theoretical literature (European Commission, 2011), the aggregation of different policy measures should account for differences in their expected impact. This will be introduced in future simulations.

Assessing policy options for the EU Cohesion Policy 2014-2020 35
Investigaciones Regionales, 29 (2014) – Pages 17 to 46
introduces a spatial structure (economic geography) in the bilateral measure of trans-port infrastructure investment by weighting the proximity (integration) of regions. The farther away the trading regions are (trade is more costly), the less weight will be attributed to the transport infrastructure improvements between the two regions. The weighting implies that the further away are the two regions, the lower impact will have a fixed amount of expenditure (1 km of road can be improved much better than 10 km of road with the same amount of funds).
In a third step, ECPreg reggINF
, , which is a bilateral measure of expenditures, is trans-formed into changes in bilateral trade costs between regions, which are measured as a share of trade value. This is done by pre-multiplying the bilateral measure of
transport infrastructure investments ECPreg reggINF
,( ) by a coefficient measuring the ef-fectiveness of transport infrastructure investments. The elasticity of trade costs with respect to the quality of infrastructure is retrieved from studies on TEN-T infrastruc-ture (European Commission, 2009), since no comparable elasticities are available for Cohesion Policy investments in transport infrastructure. The result is a transport infrastructure scenario that can be readily implemented in the model.
5. Simulation results
Given the complexity of interactions and spillovers in RHOMOLO, regional shocks induced by cohesion policy are quickly transmitted across regional and na-tional borders. In fact, EU regions are interconnected through a dense network of trade in goods and services and technology transfers which make the model and the interpretation of its results not easily tractable. In order to fully capture the effects of each expenditure item and the role played by interconnections, the simulated impact of each measure is shown in in isolation and then combined. Following the order proposed in the scenario construction (Section 4), first human-capital related poli-cies are presented below, then R&D investments, followed by non-R&D support and infrastructure investments. Finally, the possible overall impact of cohesion policy is put together in a combined simulation illustrating the extent of spatial interrelations.
5.1. Interventions in the field of Human Capital
Cohesion policy expenditures on human capital are projected to account for about 20% of total cohesion policy expenditures for the 2014-2020 round. To sim-ulate the effects on human capital in RHOMOLO, the expenditures are assumed to lead to an increase in labour productivity, however at the cost of a temporal decrease in the regional labour supply. Formally, an expenditure on human capital of 1% rela-tive to local education expenditures is assumed to increase local labour productivity by 0.3% 15.
15 This elasticity is taken from the literature (Sianesi and Van Reenen, 2003).

36 Brandsma, A., Di Comite, F., Diukanova, O., Kants, A., López-Rodríguez, J., Persyn, D. and Potters, L.
Investigaciones Regionales, 29 (2014) – Pages 17 to 46
Increase in regional labour productivity implies an increase in regional GDP but also an increase in labour demand and wages. The following map displays the yearly average impact of investments in human resources under cohesion policy over the 2014-2023 period.
Map 1. Impact of interventions in the field of human resources on NUTS 2 regions GDP in 2023, % deviation from baseline
(.185, .546)(.023, .085)(.009, .014)(.005, .006)(.003, .004)
HR impact on GDP, yearly average 2014-2023(.085, .185)(.014, .023)(.006, .009)(.004, .005)(–.025, .003)
As Map 1 suggests, the overall effect of investment in human resources is clearly positive, especially in most of the Central and Eastern European Member States. This reflects the distribution of cohesion policy support which is much higher for the less developed regions than for the transition and more developed regions.
However, the difference in regional impact also stems from other factors. First, investment in human resources is likely to produce a larger impact on GDP in re-gions where the level of local expenditure on education is low. These are indeed places where cohesion policy support will significantly change the level of public support provided to human resources. Second, RHOMOLO includes six industri-al sectors which have varying degrees of labour intensity. Regions in which the industrial fabric has a larger proportion of labour intensive industries (such as for instance manufacturing) are likely to benefit more from an increase in labour pro-ductivity.

Assessing policy options for the EU Cohesion Policy 2014-2020 37
Investigaciones Regionales, 29 (2014) – Pages 17 to 46
Finally, investment in human resources also generates spatial spillovers. As for infrastructure investments, the increase of GDP in the regions receiving support ben-efits other regions because of the interregional trade links.
5.2. Interventions in the field of R&D
R&D is another key sector of intervention for cohesion policy and accounts for approximately 12% of the total cohesion policy budget (or some 40 billion euros) which is to be allocated to lines of expenditure associated with support to research, technological development and innovation (RTDI) during the 2014-2020 programing period. More than 60% of this is allocated to the less developed regions.
As discussed in Section 4.2, in RHOMOLO support to RTDI is assumed to in-crease TFP. An increase in R&D affects GDP in several ways. First, GDP increases due to the fact that R&D leads to an increase in total factor productivity. This implies a reduction in the prices of intermediate inputs and hence of production costs which also contributes to the increase in GDP. Finally, the price of consumption goods de-creases which encourages demand and hence the level of economic activity. As for other fields of intervention, other regions benefit from a rise in GDP due to increased demand from the regions receiving RTDI support.
The model accounts for spatial spillovers specific to R&D. Formally, it is as-sumed that the farther away a region from the technology frontier, the greater the potential for absorption and imitation of technological progress produced elsewhere. This not only implies that lagging regions are catching up on more advanced ones in terms of technology but also that an increase in R&D produces a bigger impact on factor productivity in regions where the level of technology is originally low.
The results of the simulation show positive effects in all regions, with very few exceptions due to the intensification of competition from catching-up regions (see Map 2). Czech, Hungarian, Polish and Portuguese regions benefit the most, with im-pacts on regional GDP of 1-2% above the baseline on average in the 2013-2023 period. The impact on GDP in the less developed regions on average is somewhat higher than 1.2% on average in the 2014-2023 period. A renewed/continued increase in RTDI would be needed to keep the regional economies on a higher growth path.
In general, the impact is higher in less developed regions than in transition re-gions. This is explained by the fact that less developed regions receive more support under cohesion policy than the two other groups and that R&D investment has a higher impact on TFP in lagging regions in terms of technology.
5.3. Interventions in the field of non-R&D support to innovation
As explained in Section 4.3, and described at length by Diukanova and López-Ro-dríguez (2014), non-R&D support can be another key component of EU cohesion

38 Brandsma, A., Di Comite, F., Diukanova, O., Kants, A., López-Rodríguez, J., Persyn, D. and Potters, L.
Investigaciones Regionales, 29 (2014) – Pages 17 to 46
policy. Map 3 shows the average impact of non-R&D measures on GDP across the NUTS2 regions in EU-27 in 2014-2023. The impact on non-R&D support is pos-itive in all regions although their magnitude varies considerably between regions. The most benefiting regions are those located in the Eastern parts of Europe and the Southern European periphery (Greece, Southern Italy, Spain and Portugal). Central European regions are expected to benefit only mildly. The results of the simulations are highly correlated with the amount of non-R&D funds received.
5.4. Interventions in the field of infrastructure
Finally, investments in infrastructure are planned to be nearly 170 billion euros, almost half of the total funding available.
However, there are large differences between regions concerning cohesion policy expenditure on infrastructure. Indeed, larger amounts are allocated to less developed regions. In addition, the share of infrastructure in the allocation is also higher than in more developed regions. Accordingly, cohesion policy expenditures on infrastructure
Map 2. Impact of interventions in the field of R&D on NUTS 2 regions GDP in 2023, % deviation from baseline
(.23, .788)(.024, .072)(–.002, .009)(–.004, –.003)(–.016, –.006)
R&D impact on GDP, yearly average 2014-2023(.072, .23)(.009, .024)(–.003, –.002)(–.006, –.004)
(.23, .788)(.02(((( 4, .072)(–.0(((–( 02, .009)(–.0( 04, –.003)(–.016, –.006)
R&D R impact on GDG P, yearly average 2014-2023(.07(( 2, .23)(.00(( 9, .024)(–.0(( 03, –.002)(–.0(((( 06, –.004)

Assessing policy options for the EU Cohesion Policy 2014-2020 39
Investigaciones Regionales, 29 (2014) – Pages 17 to 46
allocated to the less developed regions are considerably higher than to the transition and more developed regions.
In order to simulate the impact of cohesion policy investment in the field of in-frastructure, the corresponding expenditure needs to be «translated» into changes in some of the model’s parameters. Infrastructure investments are assumed to reduce transport costs between regions and the parameters representing transport costs are adjusted accordingly. Bilateral transport costs can be used to calculate an indicator of each region’s accessibility. There are significant differences in transport cost re-ductions between regions and the largest improvements in accessibility take place in the less developed regions which reflects the expenditure pattern of Cohesion Policy.
Improvement in transport infrastructure means that regions get better connected within the single market which increases their exports and hence boosts the level of economic activity. The lowering of transport costs also implies a reduction in the price of imported intermediate goods and of consumption which contributes to a reduction reduce in firms’ production costs and an increase in the disposable income of households. All these effects lead to an increase in regional GDP in the 2013-2023 period, as shown in Map 4.
Map 3. Impact of interventions in the field of non-R&D on NUTS 2 regions GDP in 2023, % deviation from baseline
(.06, .13)(.037, .06)(.02, .037)(.007, .02)(0, .007)(–0005, 0)
Non-R&D impact on GDP, yearly average 2014-2020

40 Brandsma, A., Di Comite, F., Diukanova, O., Kants, A., López-Rodríguez, J., Persyn, D. and Potters, L.
Investigaciones Regionales, 29 (2014) – Pages 17 to 46
Map 4. Impact of interventions in the field of infrastructure on NUTS 2 regions GDP in 2023, % deviation from baseline
(1.741, 2.643)(.289, 1.144)(.053, .117)(.027, .033)(.007, .019)
INF impact on GDP, yearly average 2014-2023
(1.144, 1.741)(.117, .289)(.033, .053)(.019, .027)(.004, .007)
The largest returns on investment in accessibility are found in the less developed regions of the EU. It is in these regions that accessibility is lacking and where trans-port infrastructure has the greatest potential for improvement.
The impact of investment in the field of infrastructure does not only materialise in the regions where the investment takes place. A region benefiting from enhanced accessibility increases its imports of goods from the other regions which in turn also experience an increase in their exports and hence their GDP. The impact of local intervention therefore has a tendency to progressively disseminate in space through the numerous trade links existing between the EU regions.
5.5. Simulating Cohesion Policy 2014-2020
The full cohesion policy package for the period 2014-2023 consists of investment in the three categories discussed above, disregarding technical assistance. RHOMO-LO has been calibrated to the results of QUEST at the national level for each year and each Member State. This means that RHOMOLO’s main use is in the disaggregation of the results obtained with QUEST to the NUTS2 level. Figure 5 shows the estimat-

Assessing policy options for the EU Cohesion Policy 2014-2020 41
Investigaciones Regionales, 29 (2014) – Pages 17 to 46
ed impact of cohesion policy for the 2014-2020 period on GDP based on simulations with the QUEST III endogenous R&D model (Varga and in ’t Veld, 2011). These results are also reported in the Sixth report on economic, social and territorial cohe-sion (European Commission, 2014). They are split into the results for the EU-13, the new Member States that joined the Union since 2004, the EU-15, the other Member States, and the entire EU.
Figure 5. Estimated impact of Cohesion Policy for the 2014-2020 period on GDP based on QUEST III endogenous R&D simulations
3.0
2.5
2.0
1.5
1.0
0.5
0.0
–0.5
% difference from baseline
2014 2015 2016 2017 2018 2019 2020 2021 2022 2023 2024 2025 2026 2027 2028 2029 2030
EU-13
EU-15
EU-28
Source: Figure 8.10 in the Sixth report on economic, social and territorial cohesion (European Commission, 2014).
The percentage deviations are obtained by adding up national impacts and ex-pressing them relative to the corresponding aggregate in the baseline.
Figure 6 shows the national deviations from the baseline in terms of GDP (purple bars on the back) confronted with the Cohesion Policy expenditures in the country (orange bars on the front). On average, the impact of the Cohesion Policy spending is estimated to be around 0.4% of GDP for the EU as a whole, with a substantially higher impact in the EU-13 (2.6% deviation from baseline GDP in 2023) than in the EU-15 (whose corresponding figure is 0.2%), much of the difference being explained by the differences in the allocation of funding.
The impact of Cohesion Policy on each individual region is then simulated us-ing RHOMOLO in the set-up described above and yielding the results illustrated in Map 5. It shows the annual impact of the 2014-2020 package over the period 2014-2023, averaged over the ten years. The impact is particularly large for regions located in Central and Eastern Europe. It is the highest in the Polish regions of Śląskie, Pod-karpackie, Małopolskie and Lubelskie as well as in Východné Slovensko (Slovakia) where, compared to the baseline scenario with no policy interventions, Cohesion Pol-icy is expected to increase GDP by more than 3% per year on average between 2014 and 2023. A number of regions in Southern Europe also benefit from a large positive impact of cohesion policy on their GDP. For instance, between 2014 and 2023 GDP

42 Brandsma, A., Di Comite, F., Diukanova, O., Kants, A., López-Rodríguez, J., Persyn, D. and Potters, L.
Investigaciones Regionales, 29 (2014) – Pages 17 to 46
is expected to increase on average by 1.7% per year in Norte (Portugal) and by 1.5% per year in Kentriki Makedonia (Greece).
These regions are all major beneficiaries of funding under cohesion policy. As resources allocated to these regions are generally high, one can expect to also observe a higher impact in terms of GDP. These regions are also generally lagging behind in terms of infrastructure and hence are in a situation where investment in this field is likely to produce a particularly large impact. In addition, cohesion policy support in the fields of human resources adds much more to the total amounts dedicated to education in these regions than in regions of more developed Member States. Finally, the less developed regions tend to be more specialised in labour intensive industries, which implies that they benefit from investment in human capital and the increase in labour productivity that is generated.
Even if regions located in the Member States with GDP per capita close to or above the EU average get much less financial support, the impact of the policy still remains significant in a number of more developed regions. For instance, GDP is expected to increase on average by 0.11% per year in Lazio (Italy) and by 0.12% per year in West Wales and The Valleys (UK) during the implementation period. The impact is obviously smaller in regions where the allocation of cohesion funds is modest and which are already well endowed with infrastructure, human capital and technology. These more developed regions not only benefit from their own cohesion policy programmes but also from those implemented in the group of less developed regions to which the greatest part of the ESIF is directed.
Figure 6. Cohesion Policy expenditure for 2014-2020 and impact on GDP in main beneficiary countries based on QUEST 3R&D simulations
2.5
2.0
1.5
1.0
0.5
0.0
% of GDP
IT ES CY SI MT EL PT RO CZ BG SK LT HU EE HR LV PL
Estimated impact on GDP
Cohesion Policy expenditure
Source: Figure 8.12 in the Sixth report on economic, social and territorial cohesion (European Commission, 2014) based on QUEST II endogenous R&D simulations, DG REGIO Cohesion spending projections and DG ECFIN Spring 2013.

Assessing policy options for the EU Cohesion Policy 2014-2020 43
Investigaciones Regionales, 29 (2014) – Pages 17 to 46
6. Conclusions
This paper presented RHOMOLO, the European Commission’s spatial CGE model used for ex-ante impact assessment at the NUTS2 level. It covers 267 (of the 271) NUTS2 regions of the EU-27 and 6 NACE Rev. 1.1 industries (sectors) through a simulation of planned cohesion support for the years 2014-2020. The cohesion pol-icy expenditures were grouped into four main categories, covering Research, Techni-cal Development and Innovation (RTDI), Infrastructure, Human Capital, and Aid to Private Sector. These expenditures are assumed to affect a set of parameters including factor productivity and transport costs that determine the model outcome.
Using a spatial CGE model at the regional level is essential for capturing the ef-fects of cohesion policy, in view of its convergence objective, but has its limitations. The main dynamics in RHOMOLO are the long-term effects of capital accumulation that continue even after the funding has ended. As inter-temporal optimisation and forward-looking expectations are not currently included, inter-temporal dynamics of the simulations are not always reliable. Therefore, RHOMOLO has been calibrated to the European Commission’s QUEST III endogenous R&D model to obtain consis-
Map 5. Impact of the 2014-2020 Cohesion Policy programmes on NUTS 2 regions GDP in 2023, % deviation from baseline
(1.842, 2.778)(.322, 1.18)(.017, .099)(.007, .011)(–.005, .003)
Impact of the 2014-2020 ECP on GDP, yearly average 2014-2023
(1.18, 1.844)(0.99, .322)(.011, .017)(.003, .007)(–.014, –.005)
(1.842, 2.778)(.322, 1.18)(.017, .099)(.0000 7, .011)(–.005, 55 .003)
Impact of the 2014-2020 ECP on GDP, yearly average 2014-2023
(1.18, 1.844)(0.99, . 322)(.011, .017)(.00( 3, .007)(–.014, –.005)

44 Brandsma, A., Di Comite, F., Diukanova, O., Kants, A., López-Rodríguez, J., Persyn, D. and Potters, L.
Investigaciones Regionales, 29 (2014) – Pages 17 to 46
tent results for each year and each Member State. What can also be done is to filter the input of the simulations through a module which incorporates more sophisticated dynamics than currently imposed upon the model.
Another possible refinement of the approach taken in this paper concerns the detail of incorporating the investments in the Connecting Europe facility and ICT networks. It is a bit of a detour to first assign the investments in infrastructure to the regions and then use a weighted average of the investments in the regions at both ends of a new or improved connection by road, railway or waterway to estimate the re-duction in interregional transport cost. In principle, a model such as TRANSTOOLS would allow for the investments to be directly tied to the piece of transport infrastruc-ture at which they are directed, but awaiting the operational programmes such detail is not yet available. What RHOMOLO does allow for is mapping the effect of all bilateral transport cost reductions between regions. In addition, the reductions in in-tra-regional transport cost, which depend only on the investment in the infrastructure of the region itself, are taken into account.
Finally, it would be useful to do more work on estimating the parameters in the total factor productivity relation, which this paper uses as the vehicle for transmitting the effects of cohesion policy on the regional potential for catching up. It accounts for R&D as well as non-R&D related support to innovation and entrepreneurship. To some extent, the catching up is pre-programmed by the specification of the estimated total factor productivity equation in that the effect of a given increase in R&D inten-sity is greater the farther away is the region from the technology frontier. There are also indications that the availability of high-skilled labour in the region can be a con-straint on the effect of R&D, as has been built into the QUEST III endogenous R&D model at the country level. Going deeper into these interrelations and dependencies could be highly relevant for the design of a smart policy mix for each type of region.
Acknowledgements
Jesús López-Rodríguez acknowledges the support received from the Spanish Ministry of Science and Innovation through the project ECO2011-28632 and Xunta de Galicia through the project EM2014/051.
References
Arundel, A.; Bordoy, C., and M. Kanerva (2008): «Neglected innovators: how do innovative firms that do not perform R&D innovate?», Results of an analysis of the Innobarometer 2007 survey, 215. INNOMetrics Thematic Paper.
Bachtler, J., and C. Wren (Eds) (2006), «Special Issue: The Evaluation of European Union Cohesion policy», Regional Studies, vol. 40, Issue 2.
Bachtler, J., and Méndez, C. (2007): «Who Governs EU Cohesion Policy? Deconstructing the Reforms of the Structural Funds», Journal of Common Market Studies, vol. 45, no. 3, 535-564.

Assessing policy options for the EU Cohesion Policy 2014-2020 45
Investigaciones Regionales, 29 (2014) – Pages 17 to 46
Bachtler, J., Méndez, C., and Wishlade, F. (2013): EU Cohesion Policy and European Integra-tion: The Dynamics of EU Budget and Regional Policy Reform. Ashgate.
Badri Narayanan, G.; Aguiar, A., and McDougall, R. (eds.) (2012): Global Trade, Assistance, and Production: The GTAP 8 Data Base, Center for Global Trade Analysis, Purdue Univer-sity, https://www.gtap.agecon.purdue.edu/databases/v8/default.asp.
Baldwin, R.; Forslid, R.; Martin, P.; Ottaviano, G., and Robert-Nicoud, F. (2005): Economic geography and public policy. Princeton University Press.
Belderbos, R., and Mohnen, P. (2013): «Intersectoral and international R&D spillovers», SIM-PATIC working paper, 2. SIMPATIC project, 7th Framework Program, European Com-mission.
Bradley, J. (2006): «Evaluating the impact of European Union Cohesion policy in less-devel-oped countries and regions», Regional Studies, Vol. 40, Issue 2, 189-200 .
Bradley, J.; Untiedt, G., and Morgenroth, E. (2003): «Macro-regional evaluation of the struc-tural funds using the HERMIN modelling framework», Italian Journal of Regional Sci-ence, 1 (3), 5-28.
Brandsma, A.; Kancs, D.; Monfort, P., and Rillaers, A. (2013): «RHOMOLO: a regional-based spatial General Equilibrium model for assessing the impact of Cohesion Policy», JRC-IPTS Working Paper Series JRC81133. European Commission, DG Joint Research Centre.
Burgess, A.; Chen, T. M.; Snelder, M.; Schneekloth, N.; Korzhenevych, A.; Szimba, E., and Christidis, P. (2008): «Final report TRANS-TOOLS (TOOLS for TRansport forecasting And Scenario testing)», Deliverable 6, funded by 6th Framework RTD Programme. TNO Inro, Delft, Netherlands.
Cuadrado-Roura, J. R., and Marcos, M. A. (2005): «Disparidades regionales en la Unión Eu-ropea: una aproximación a la cuantificación de la cohesión económica social», Investiga-ciones regionales (6), 63-90.
Cuadrado-Roura, J. R., and Parellada, M. (eds.) (2002): Regional Convergence in the European Union: Facts, Prospects and Policies, Series Advances in Spatial Science, Springer.
Diukanova O., and López-Rodríguez, J. (2014): «Regional impacts of non-R&D innovation expenditures across the EU regions: simulation results using the Rhomolo CGE model’, mimeo. European Commission, DG Joint Research Centre.
European Commission (2009): «Traffic flow: scenario, traffic forecast and analysis of traffic on the TEN-T, taking into consideration the external dimension of the Union», TENconnect: Final Report. European Commission, DG for Mobility and Transport.
— (2011): «Identifying and aggregating elasticities for spill-over effects due to linkages and externalities in the main sectors of investment co-financed by the EU Cohesion Policy», Spill-Over Elasticities: Final Report. European Commission, DG for Regional and Urban Policy.
— (2014): Sixth report on economic, social and territorial cohesion: investment for jobs and growth - Promoting development and good governance in EU regions and cities, European Commission, DG for Regional and Urban Policy and DG for Employment, Social Affairs and Inclusion.
Ferrara, A., Ivanova, O., and Kancs, D. (2010): «Modelling the Policy Instruments of the EU Cohesion Policy, 2010/2», Working papers DG Regional policy, European Commission, Brussels.
Gakova, Z.; Grigonyte, D., and Monfort, P. (2009): «A Cross-Country Impact Assessment of EU Cohesion Policy: Applying the Cohesion System of HERMIN Models», EU Regional Policy, no. 01/2009.
Garrido, R.; Mancha, T., and Cuadrado-Roura, J. R. (2007): «La Política Regional y de Co-hesión en la Unión Europea: veinte años de avance y un futuro nuevo», Investigaciones regionales (010), 239-266.
Hall, B. H.; Mairesse, J., and Mohnen, P. (2009): «Measuring the returns to R&D», NBER Paper 15622. National Bureau of Economic Research.

46 Brandsma, A., Di Comite, F., Diukanova, O., Kants, A., López-Rodríguez, J., Persyn, D. and Potters, L.
Investigaciones Regionales, 29 (2014) – Pages 17 to 46
Howitt, P. (2000): «Endogenous growth and cross-country income differences», American Economic Review, 90 (4): 829-846.
López-Bazo, E., and Manca, F. (2014), «Model-based assessment of the regional impact of R&D policies», JRC-IPTS Working Paper Series JRC80872. European Commission, DG Joint Research Centre.
López-Rodríguez, J., and Martínez, D. (2014): «Looking beyond the R&D effects on innova-tion: The contribution of non-R&D activities to total factor productivity growth in the EU», European Commission JRC Technical Reports, JRC86054.
Mathiesen, L. (1985): «Computation of economic equilibria by a sequence of linear comple-mentarity problems», in Economic equilibrium: model formulation and solution, 144-162. Springer Berlin Heidelberg.
McMorrow, K., and Röger, W. (2009): «R&D capital and economic growth: the empirical evi-dence», EIB Papers, 14(1), 94-118.
OECD (2001): Measuring capital: OECD manual - Measurement of capital stocks, consump-tion of fixed capital and capital services. Organisation for Economic Co-operation and Development.
Petersen, M. S.; Bröcker J.; Enei, R.; Gohkale, R.; Granberg, T.; Hansen, C. O.; Hansen, H. K.; Jovanovic, R.; Korchenevych, A.; Larrea, E.; Leder, P.; Merten, T.; Pearman, A.; Rich, J.; Shires, J., and Ulied, A. (2009): «Report on Scenario, Traffic Forecast and Analysis of Traffic on the TEN-T, taking into Consideration the External Dimension of the Union», funded by Directorate-General for Transport and Energy.
Potters, L.; Conte, A.; Kancs, D., and Thissen, M. (2013): «Data needs for regional modelling: a description of the data used in support of RHOMOLO», JRC-IPTS Working Paper Series JRC80845. European Commission, DG Joint Research Centre.
Rutherford, T. F. (1999): «Applied General Equilibrium modelling with MPSGE as a GAMS subsystem: an overview of the modelling framework and syntax», Computational Econom-ics, 14, 1-46.
Sianesi, B., and Van Reenen, J. (2003): «The returns to education: macroeconomics», Journal of Economic Surveys, 17(2), 157-200.
Solow, R. M. (1956): «A contribution to the theory of economic growth», Quarterly Journal of Economics, 19, 33-41.
Som, O. (2012): Innovation without R&D. Heterogeneous innovation patterns of non-R&D- performing firms in the German manufacturing industry. Springer Gabler, Wiesbaden.
Thissen, M.; Diodato, D., and van Oort, F. G. (2013): Integration and convergence in regional Europe: European regional trade flows from 2000 to 2010. PBL Netherlands Environmen-tal Assessment Agency, The Hague/Bilthoven.
Timmer, M.; O’Mahony, M., and van Ark, B. (2007): «The EU KLEMS growth and productiv-ity accounts: an overview», EU KLEMS Project report, 6th Framework Program, European Commission.
Timmer, M. T. (ed.) (2012): «The World Input-Output Database (WIOD): contents, sources and methods», WIOD Working Paper, 10.
Varga, J., and in ’t Veld, J. (2011): «A model-based analysis of the impact of cohesion policy expenditure 2000-06: Simulations with the QUEST III endogenous R&D model», Eco-nomic Modelling, 28 (1-2), 647-663.
Whalley, J., and Yeung, B. (1984): «External Sector Closing Rules in Applied General Equilib-rium Models», Journal of International Economics, 16, 123-38.

© Investigaciones Regionales, 29 (2014) – Pages 47 to 75Section Articles
Modelling knowledge creation, investment decisions and economic growth in a spatial CGE setting
Francesco Di Comite*, Lesley Potters*
ABSTRACT: The expansion of knowledge is commonly understood as a key driv-er of economic growth. Yet, while knowledge production and economic growth have been extensively studied in isolation, few studies have tried to formalise the mechanism connecting the two elements from a spatial general equilibrium per-spective. To fill this gap, in this paper we propose a model of knowledge creation building upon the multiregional spatial CGE model RHOMOLO to allow for en-dogenous knowledge production and investment decisions at the regional level. The innovation process is modelled through the interaction between researchers, investors and final good producers. Specifically, researchers in each region use their human capital together with local R&D-embedded capital and intermediates to produce ideas, enhanced by knowledge spillovers crossing regional borders. These ideas are then purchased by local investors and combined with their hu-man capital and intermediate goods to be turned into new R&D-embedded capital, which adds up to the existing stock after having replaced the obsolete one. Lastly, after having paid a fixed entry cost, in each region firms produce goods for final and intermediate consumption by renting local R&D-embedded and human capital and combining it with an interregional bundle of intermediate goods, their pro-ductivity being enhanced by the availability of local public goods and services. The model is designed to be calibrated using a regionalised version of standard Social Accounting Matrices, such as the ones provided by the World Input Output Database.
JEL Classification: R13; R58; H54; C68; D58. Keywords: multiregional spatial CGE; Endogenous R&D; Endogenous invest-ment decisions.
47
Received: 14 january 2014 / Accepted: 6 august 2014.
* European Commision, Joint Research Centre (JRC), Institute for Prospective Technological Stu-dies (IPTS).
We thank participants of the “IPTS Workshop on Spatial Computable General Equilibrium Modelling for the Assessment of Cohesion Policy” (Seville, 12/2013), the «XXXIX Reunión de Estudios Regionales» (Oviedo, 11/2013) and «Geography of Innovation conference 2014» (Utrecht, 01/2014). We are also grateful to Stefan Boeters, Mark Thissen, Martin Christensen and two anonymous reviewers for useful comments and suggestions. The authors are solely responsible for the content of the paper. The views expressed are purely those of the authors and may not in any circumstances be regarded as stating an official position of the European Commission. Corresponding author: Francesco Di Comite, [email protected].
48 Di Comite, F. and Potters, L.
Investigaciones Regionales, 29 (2014) – Pages 47 to 75
Modelización de creación de conocimiento, decisiones de inversión y crecimiento económico en un modelo espacial de equilibrio general computable
RESUMEn: La creación del conocimiento es habitualmente entendida como un vector clave de crecimiento económico. Mientras que la producción de conoci-miento y el crecimiento económico han sido estudiados extensamente por sepa-rado, pocos estudios han intentado formalizar el mecanismo conectando los dos elementos desde la perspectiva de un modelo de equilibrio general espacial. Para rellenar este vacío, proponemos un modelo de creación de conocimiento aprove-chando el modelo CGE multirregional RHOMOLO para la producción endógena de conocimientos y decisiones de inversión a nivel regional. El proceso de innova-ción se modeliza teniendo en cuenta la interacción entre investigadores, inversores y productores de bienes de consumo. Más en detalle, los investigadores en cada región usan su capital humano junto a activos que incorporan I+D y bienes inter-medios para la producción de nuevas ideas, las cuales son mejoradas por la transfe-rencia de conocimientos desde otras regiones. En la siguiente etapa, estas ideas son adquiridas por inversores locales y se combinan en el proceso de generar nuevos activos que incorporan I+D junto al capital humano y bienes intermedios, así au-mentando el stock existente después de haber reemplazado la parte obsoleta. Por último, después del pago de los costes fijos de entrada, empresas regionales produ-cen tanto bienes intermedios como bienes de consumo, alquilando capital humano y activos que incorporan I+D, combinándolos junto con un conjunto interregional de bienes intermedios en el proceso de producción, donde la disponibilidad de bie-nes y servicios públicos influye en su productividad. El modelo ha sido diseñado para ser calibrado con las versiones regionalizadas de matrices de contabilidad social, como son las que se pueden obtener de la base de datos World Input Output.
Clasificacion JEL: R13; R58; H54; C68; D58.
Palabras clave: CGE multiregional espacial; I&D endógeno; decisiones de inver-sión endógenas.
1. Introduction
What drives growth? Of the many institutional and economic factors interact-ing in bringing economic development about, including labour market participation, capital accumulation, good institutions and product market regulation, the focus in developed economies is increasingly turning to the expansion of knowledge. There is indeed a growing consensus, in both policy-oriented (Veugelers and Mrak, 2009) and academic (Bröcker and Soltwedel, 2010) literature, that the entire society is expected to benefit from the creation of marketable innovations, which foster investments, augment human capital and increase productivity and product variety. As stressed in the endogenous growth literature (as for example in Romer, 1994, or in Aghion and Howitt, 1998), the technological progress resulting from commercial innovation is the most straightforward way to endogenise the process of productivity growth, which has otherwise to be assumed exogenous. In practice, in these models one part

Modelling knowledge creation, investment decisions and economic growth in a spatial CGE... 49
Investigaciones Regionales, 29 (2014) – Pages 47 to 75
of the economy is assumed to be working on expanding the technological frontier, with the rest of the economy benefitting from the improved production capabilities (see Jones, 1995, or Romer, 1990). Economic growth then feeds back into knowledge creation by increasing its efficiency, in addition to the standard spatial spillovers capturing the positive externalities associated with neighbours’ progress (Grossman and Helpman, 1991).
The objective of this paper is to bring this mechanism into a multiregional spa-tial CGE model setting. For this exercise, we build upon RHOMOLO, the European Commission’s model used for the ex-ante impact assessment of EU Cohesion Policy at the regional level (Brandsma et al., 2014), to present the possibility of including a mechanism of endogenisation of innovation and investments based on the accumula-tion of R&D-embedded capital.
A number of CGE models have applied a similar approach to the endogenisation of the R&D investment decision. In European Commission’s QUEST III model real-ised by DG ECFIN (see Varga and In ‘t Veld, 2011, or Ratto et al., 2009, for a detailed description), for example, a part of the skilled workers is employed in a specific R&D sector where new designs (blueprints) are invented as a function of previous techno-logical stock, foreign technological stock and skilled workers in the R&D sector. In a more recent development of the model, non-liquidity constrained households buy the patents and rent it to the intermediate producing sector (see Varga and In ‘t Veld, 2011). Bye et al. (2009) describe a CGE model for measuring the implications of innovation policies in the small open economy of Norway. Here, the R&D sector produces patents to be acquired by capital firms for the production of a new capital variety. The production of new patents is a function of labour and is enhanced by the endogenous domestic spillovers from the accumulated stock of knowledge embodied in patents. However, most of the CGE models including explicitly an R&D sector lack a geographical dimension to determine spillovers and interactions between sec-tors of different economies, which are important dimensions to account for empirical validation and impact assessments (see Varga, 2015). Christensen (2013), for exam-ple, describes the development of a multi-sector dynamic general equilibrium model with R&D-driven growth with multiple nations. We also aim at merging an explicit accounting of the innovation process and the introduction of a spatial dimension of analysis, but we focus on a more disaggregated geographical unit of observation, which includes all the EU NUTS2 regions.
As for the structure of the paper, first a non-technical description is provided to describe the general framework of the model we build upon, RHOMOLO (Sec-tion 1.1), to present a preliminary explanation of the process of endogenisation of R&D (Section 1.2) and to outline the model (Section 1.3). Section 2 explains the knowledge-creation process. Section 3 focuses on how this knowledge is used in the production of R&D-embedded capital stock which is consequently used in the pro-duction of final and intermediate goods (Section 4). After that, the role of Households (Section 5) and Government (Section 6) are described. A discussion on the endoge-neity of the R&D process ensues and, finally, we present conclusions and ideas for future development.

50 Di Comite, F. and Potters, L.
Investigaciones Regionales, 29 (2014) – Pages 47 to 75
1.1. A description of RHOMOLO
The point of departure for the model presented in this paper is RHOMOLO, a spatial Computable General Equilibrium (CGE) model designed to work at the regional level (see Brandsma et al., 2013). We present the current version of RHO-MOLO in this Section and then, in the rest of the paper, we propose one possible way to include a knowledge-creation process based on R&D-embedded capital accu-mulation. RHOMOLO currently consists of 267 NUTS2 regions of the EU27 and 6 NACE Rev. 1.1 industries (agriculture, manufacturing, construction, transport, finan-cial services and public services). Each region is inhabited by households that receive income from labour (in the form of wages), capital (profits and rents) and transfers (from national and regional governments). The income is split between savings, con-sumption and taxes.
Each region contains 6 sectors that produce goods that are consumed by house-holds, government or firms (in the same sector or in the others) as an input in their production process. Transport costs for trade between and within regions are assumed to be of the iceberg type and sector and region specific. This implies a 267 x 267 asymmetric trade cost matrix derived from the transport model TRANSTOOLS (Bur-gess et al. 2008; Petersen et al., 2009).
The national government levies taxes on the income of households, firms and production factors and pays social contributions to the households. Due to its high dimensionality, the model is solved following a recursive static rather than in a full dynamic approach. It contains a sequence of short-run equilibria that are related to each other through the build-up of physical and human capital stocks.
In the current version of RHOMOLO productivity growth and R&D are currently modelled based on an empirical approach, which is explained in Lopez-Bazo and Manca (2012) 1. They follow an approach à la Solow (1956) where R&D expendi-tures at the regional level are linked to Total Factor Productivity (TFP), which can be measured as the part of productivity increases that are not explained by the main inputs to the production process, which are labour and capital in RHOMOLO. The main elements assumed to explain the growth in regional TFP levels are R&D expen-ditures, technology transfers (as a measure of absorptive capacity), distance from the technological frontier and non-R&D expenditures. The role played by regional R&D investments in the RHOMOLO specification is therefore dual. First, by investing in R&D a region is able to catch-up faster with the technological frontier (the region with highest TFP). The catching-up term is based on models of economic growth that are widely used in the literature in a leader-follower context of economic develop-ment (see e.g. Barro and Sala-i-Martín, 1997; Howitt, 2000). Second, a higher level of regional R&D implies a higher level of regional innovation, which in turn has a positive effect on TFP. Although this way of semi-endogenising R&D brings some
1 A similar approach has been taken for analysing the impact of non-R&D innovation expenditures. See Lopez-Rodriguez and Martinez (2014) for the empirical estimation of the impact of non-R&D innova-tion on TFP and Diukanova and López-Rodríguez (2014) for its implementation in RHOMOLO.
Modelling knowledge creation, investment decisions and economic growth in a spatial CGE... 51
Investigaciones Regionales, 29 (2014) – Pages 47 to 75
regional interaction dynamics in the form of productivity convergence, there are also reasons to explore alternative modelling approaches where decisions on how much to invest in capital and R&D are endogenous too 2.
1.2. Non-technical description of R&D endogenisation
This paper deviates from RHOMOLO by proposing an endogenous R&D sector and a corresponding endogenous capital investment sector. This Section gives a short overview of the main components of the model and how R&D is endogenously mod-elled. The sections hereafter describe the sectors, agents and market transactions in a more detailed and rigorous way.
The first step of the innovation process is undertaken by researchers involved in the creation of knowledge. Their output can be interpreted as ideas to develop new products or processes, which may be captured by patents when the model is taken to the data. Researchers combine their ingenuity (approximated by their human capital) with intermediates and rented R&D-embedded capital to produce ideas, this process being enhanced by the accumulated stock of available knowledge. This modelling ap-proach amounts to assuming positive spillovers in research activities, as the creative process benefits from the observation of past and present ideas produced in their own region and in the others, following a spatial decay function. Section 2 describes the creation of knowledge more in detail.
Researchers can either work in the public domain, producing ideas that only aug-ment the stock of knowledge, or sell their ideas to the private sector to investors willing to turn those ideas into productive capital. In terms of calibration, public research is determined by the level of public expenditure in R&D and the production of ideas in both the public and private domain is approximated by filings for patents. The existing stock of knowledge increases with the production of new ideas, after replacing older ideas, which are assumed to depreciate at a constant rate. The absorp-tion of ideas from other regions is discounted by a measure of distance rooted in the economic geography’s gravity literature.
Turning to investors, in order to turn ideas into productive capital they combine their own human capital with existing R&D-embedded physical capital in the region and a bundle of intermediate goods that are produced by the final goods sectors in all the regions. The new units of R&D-embedded capital generated as a result of this process are used to replace the obsolete capital and increase the regional stock, which is then rented for productive and innovative purposes. Section 3 gives a detailed ex-planation of the R&D-embedded capital price setting mechanisms, its production process and the accumulation of its stocks.
2 For example, R&D expenditures in RHOMOLO are currently exogenously given and do not feed back into the model to define future R&D intensities. Data on R&D and non-R&D expenditures come from EUROSTAT and the regional R&D intensities (R&D over GDP) are constant over time. For simu-lations on Cohesion Policy Funds committed to increasing R&D expenditures, the R&D intensities are shocked with the additional funds.

52 Di Comite, F. and Potters, L.
Investigaciones Regionales, 29 (2014) – Pages 47 to 75
Firms in the final goods sector rent the R&D-embedded capital from investors within the region and use it as an input in their production function. This non-tradable aspect of the capital stock is one of the driving forces of heterogeneity across regions in the model. In the final goods sector, the regional stock of R&D-embedded capital is combined with human capital, intermediate goods and public goods and services to produce specific varieties of a tradable differentiated good for final and intermediate consumption. The production process of the final goods sector and its consumption is described in Section 4.
Households play a key role in the model. First, they provide high-skilled labour which can be turned into researchers, investors or labour in the intermediate/final goods sector, which also employs low-skilled workers. Second, they consume final goods shipped from all the regions and, third, they put aside savings that form a stock which is used as an investment for setting up firms in the final goods sector. The savings are aggregated at the EU level and flow freely to EU firms across all the regions in the form of equity that is needed to set up a final goods firm, as described in Section 5.
The inter-temporal stocks connecting one period to the other are physical R&D-embedded capital and human capital endowments in each region plus a nation-al knowledge stock augmenting productivity in the R&D sector.
Different levels of government are assumed: regional, national and supranational (the European Union). Their role consists in taxing or subsidising certain activities; providing productivity enhancing public services; undertaking public research; and realising transfers across regions or nations. The combination of transfers across lev-els of government on one hand, and taxes and subsidies on the other, allows us to fine-tune redistributive policies in the model. For example public research can be funded at the national level by taxing ideas at the regional level, which amounts to subsidizing the production of ideas is specific regions. To maintain the model as sim-ple as possible, we abstract from inter-temporal government optimisation and assume all the agents (public and private) to have balanced budgets.
1.3. General outline of the model
Turning to the general setting of our model, we take the general structure of a multi-region, multi-sector computable general equilibrium model whose inter-tem-poral dimension is granted by the presence of stocks, such as knowledge and phys-ical capital stocks, built over time. Knowledge creation drives growth by increasing the availability of productive R&D-embedded capital in the regions, which are then rented to produce goods, knowledge and new R&D-embedded capital. The model is meant to cover all the EU regions, plus a region accounting for the rest of the world. Each region is inhabited by a representative household which consumes final goods, supplies high- and low-skilled labour and provides equity to final and intermediate goods producers through her savings. Each region is populated by final and interme-

Modelling knowledge creation, investment decisions and economic growth in a spatial CGE... 53
Investigaciones Regionales, 29 (2014) – Pages 47 to 75
diate goods producers, investors and researchers. The government in each country and region is allowed to collect taxes, pay out transfers and subsidies, fund public research and supply public goods and services (at the regional level).
Finally, turning to the geographical and sectorial dimension of the model, differ-ent industries are considered in the economy (six in the current version), each being characterised by an innovation and production process split into three parts: knowl-edge creation, R&D-embedded capital accumulation, and goods production. The ideas generated in the regional knowledge-creation process are assumed to be sold to investors only within the region, even if the accumulation of knowledge resulting from these ideas is assumed to spill over to the other regions. The R&D-embedded capital in which the local ideas are turned by regional investors are also not assumed to be traded, but they increase the knowledge stock available to firms located in the region. Final and intermediate goods are instead freely traded across regions. Finally Household savings are perfectly mobile across sectors and regions. Human and phys-ical capital are assumed region-industry specific, but can move across sectors within a region. Figure 1 provides a schematic overview of the model.
Notice that for the sake of exposition the innovation and production processes are assumed to be carried out by independent actors (researchers, investors, goods producers) in a decentralised market equilibrium, but it may well be that the different
Figure 1. Schematic representation of the economy in RHOMOLO
Public research,PR&D
Regional stock ofknowledge, R&Dr
Neighbours’ stock ofknowledge, R&D*r* Knowledge creation
(marketable ideas, Dr )
Innovation capability, φ
Government
Households
Savings, Sf
Public goods & services, PGr
Labour compositegood, Lr
Physical capitalstock, Kr
Investment in new R&Dembedded capital, Zr
Final/intermediate goodsproduction, yr = xr, cr
High-skilllabour, Hr = l
hir
Low-skilllabour, l
l or
54 Di Comite, F. and Potters, L.
Investigaciones Regionales, 29 (2014) – Pages 47 to 75
activities are undertaken by agents within the boundaries of the same organisation (for example, a large innovative firm). Indeed, as shown in the following sections, the exchanges between researchers and investors and between investors and goods producers are assumed to happen under perfect competition, which means that prices emerging from the transactions equal costs and thus the process can be equally in-terpreted as describing transfer pricing within the same company. This approach has the advantage of allowing us to abstract from the differences between innovations and investments happening within firms and accounted at the cost value or purchased from specialised firms, which is a type of information often not available in input/output tables. The incentives for researchers, investors, goods producers to create ideas, capital and final goods are depend on the remuneration of their human capital provision, which equalises in the three processes in each region.
2. The knowledge-creation process
The economy consists of R regions referred to as r or q, that are part of M countries referred to as m. In each industry ind and region r, the knowledge creation activity is carried out by researchers (part of the high-skilled workforce), producing ideas (whose empirical proxy is patents), Dr and selling them to local investors 3. The production of ideas requires the use of human capital (HR&D,r), intermediates (XR&D,r) and R&D-em-bedded capital (KR&D,r), augmented by regionally available stock of knowledge in the region, ρr, which includes locally accumulated knowledge, R&Dr, and spillovers from other regions, R&Dr*, approximated by cross-citations in patent applications, so that
ρr rd
r
R
R D r r==∑( & ) ( )**
, *
1
1
1
where the stock of knowledge from other regions is weighted by a gravity parame-ter related to a measure of the extent of knowledge spillovers between each pair of regions, dr (equal to 1 for local knowledge, i.e. r* = r) 4. The process of creating new knowledge is modelled as a production function such as the following:
D H Xr R D r r R D r R D rR D HR D HR= ∈ ∈ζ ρ ω
& , & , ) & ,( ) ( ) ( )& & &DD ( )2
where HR&D,r represent the part of regional high-skilled labour employed as research-ers, and KR&D,r and XR&D,r, respectively, the R&D-embedded capital stock rented and
3 Notice that region-level elements by the subscript r and country-level elements are signalled by the subscript m throughout the text. Activities concerning knowledge production and investment have subscripts R&D and I, respectively. For a full list of parameters, identifiers and variables used in the paper, see Annex I to IV.
4 There are different ways in which knowledge spillovers can be measured, ranging from direct knowledge exchange measures such as cross citations in patents to indirect measures such as volumes of bilateral trade or transport costs.
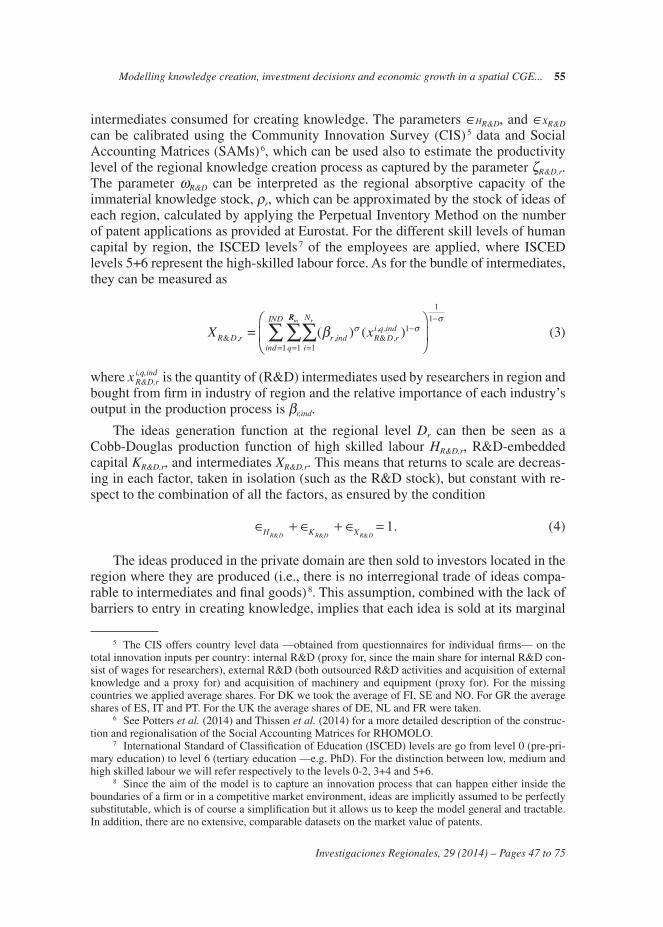
Modelling knowledge creation, investment decisions and economic growth in a spatial CGE... 55
Investigaciones Regionales, 29 (2014) – Pages 47 to 75
intermediates consumed for creating knowledge. The parameters ∈HR&D, and ∈XR&D can be calibrated using the Community Innovation Survey (CIS) 5 data and Social Accounting Matrices (SAMs) 6, which can be used also to estimate the productivity level of the regional knowledge creation process as captured by the parameter ζR&D,r. The parameter ωR&D can be interpreted as the regional absorptive capacity of the immaterial knowledge stock, ρr, which can be approximated by the stock of ideas of each region, calculated by applying the Perpetual Inventory Method on the number of patent applications as provided at Eurostat. For the different skill levels of human capital by region, the ISCED levels 7 of the employees are applied, where ISCED levels 5+6 represent the high-skilled labour force. As for the bundle of intermediates, they can be measured as
X xR D r r ind R D ri q ind
i
N
q
r
& , , & ,, ,( ) ( )= −
==∑ β σ σ1
11
RR
ind
IND m
∑∑=
−
1
1
1
3σ
( )
where x i,q,indR&D,r
is the quantity of (R&D) intermediates used by researchers in region and bought from firm in industry of region and the relative importance of each industry’s output in the production process is βr,ind.
The ideas generation function at the regional level Dr can then be seen as a Cobb-Douglas production function of high skilled labour HR&D,r, R&D-embedded capital KR&D,r, and intermediates XR&D,r. This means that returns to scale are decreas-ing in each factor, taken in isolation (such as the R&D stock), but constant with re-spect to the combination of all the factors, as ensured by the condition
∈ + ∈ + ∈ =H K XR D R D R D& & &. ( )1 4
The ideas produced in the private domain are then sold to investors located in the region where they are produced (i.e., there is no interregional trade of ideas compa-rable to intermediates and final goods) 8. This assumption, combined with the lack of barriers to entry in creating knowledge, implies that each idea is sold at its marginal
5 The CIS offers country level data —obtained from questionnaires for individual firms— on the total innovation inputs per country: internal R&D (proxy for, since the main share for internal R&D con-sist of wages for researchers), external R&D (both outsourced R&D activities and acquisition of external knowledge and a proxy for) and acquisition of machinery and equipment (proxy for). For the missing countries we applied average shares. For DK we took the average of FI, SE and NO. For GR the average shares of ES, IT and PT. For the UK the average shares of DE, NL and FR were taken.
6 See Potters et al. (2014) and Thissen et al. (2014) for a more detailed description of the construc-tion and regionalisation of the Social Accounting Matrices for RHOMOLO.
7 International Standard of Classification of Education (ISCED) levels are go from level 0 (pre-pri-mary education) to level 6 (tertiary education —e.g. PhD). For the distinction between low, medium and high skilled labour we will refer respectively to the levels 0-2, 3+4 and 5+6.
8 Since the aim of the model is to capture an innovation process that can happen either inside the boundaries of a firm or in a competitive market environment, ideas are implicitly assumed to be perfectly substitutable, which is of course a simplification but it allows us to keep the model general and tractable. In addition, there are no extensive, comparable datasets on the market value of patents.

56 Di Comite, F. and Potters, L.
Investigaciones Regionales, 29 (2014) – Pages 47 to 75
costs of production and the quantity supplied depends on the availability of research-ers, whose human capital has to be remunerated equally in the different activities in which it can be employed (i.e., as researchers, investors or employee in the final goods sector). This means that the supply of regional ideas ultimately depends on the skill level of the inhabitants of the region, on its R&D-embedded capital and access to intermediates, in addition to the available stock of knowledge.
The knowledge stocks in each region are assumed to increase with the develop-ment of marketable ideas produced in the private domain, Dr, and from ideas issued from public research, DPr, with region-time-specific efficiency ur. In addition, to capture the idea that old productive ideas may become obsolete and need to be re-placed by new ones, the stock of ideas is assumed to depreciate at a constant rate, dR&D, assumed invariant across time and countries for simplicity. Formally, adding the time dimension, t:
R D R D D u DPr t R D r t r t r r t& ( ) & . ( ), & , , ,= − + +−1 51δ
Notice that the R&D stock so computed directly enters into the flow of new knowledge generated in region and in the neighbouring regions with decreasing re-turns. Also the flow of new ideas from public research, DPr,t, is produced using the same technology as the flow of ideas in the private sector, scaled down by a re-gion-specific parameter ur capturing heterogeneities in the efficiency of public re-search as for example from the Quality of Government indicators (Charron et al., 2012) or the Regional Innovation Scoreboard (2014). As for public research, the total amount invested in each region in hiring researchers, buying intermediates and rent-ing R&D-embedded capital to produce ideas is financed by the national and regional government budgets, the former indicated as PR&Dm
r and the latter as PR&Dr. Hence, for a given level PR&D the total output of public research is
DPPR D PR D u
wr
r rm
r R D r r
R D r
R D
=+( ) ( )
(
& ,
& ,
&& & ζ ρ ω
11 1+∈
+∈
t p tr R Dw
H
R D rk
r R D
R D
HR D
, & & , , &) (
&
& kk
K
R D rx
r R Dx
XR D
KR D
R D
P t) ( )
&
&
&
& , , &
∈
+∈
∈
1
∈HR D&
( )6
, where wR&D,m and pkR&D,r are the rental price of labour and capital. In addition, t wr,R&D ,
t kr,R&D and t x
r,R&D are regional taxes or subsidies correspondingly on researchers’ wages, rented capital and consumed intermediates. Regional governments are thus allowed to tax or subsidise inputs and outputs in the R&D sector. P x
R&D,r is the price index of the bundle of intermediates:
P pR D rx
r ind R D i rx ind
i
Nind
& , , & , ,,( ) ( ),= −
=β σ σ1
1
qqm
r
R
ind
IND ∑∑∑ ==
−
( )11
1
7
σσ
( )
where βr,ind is the relative importance of each industry’s output in the production pro-cess and p x,ind
R&D,i,r the price of intermediate used by researchers in region r and bought
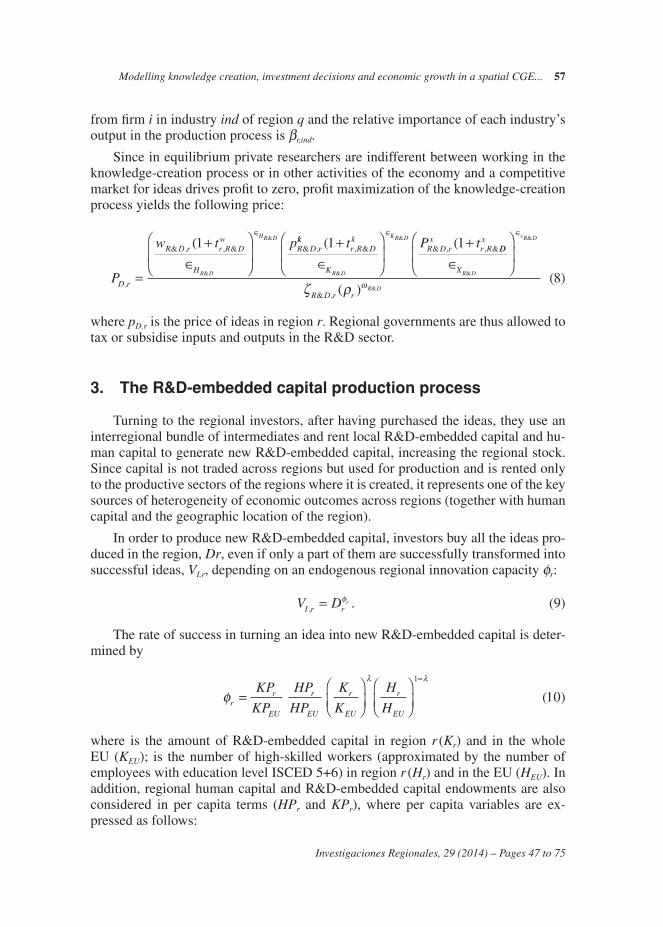
Modelling knowledge creation, investment decisions and economic growth in a spatial CGE... 57
Investigaciones Regionales, 29 (2014) – Pages 47 to 75
from firm i in industry ind of region q and the relative importance of each industry’s output in the production process is βr,ind.
Since in equilibrium private researchers are indifferent between working in the knowledge-creation process or in other activities of the economy and a competitive market for ideas drives profit to zero, profit maximization of the knowledge-creation process yields the following price:
P
w t p
D r
R D r r R Dw
H
R D r
R D
HR D
,
& , , & & ,(
&
&
=
+∈
∈1 kk
r R Dk
K
R D rx
r Rt P t
R D
KR D( (, & & , , &
&
&1 1+∈
+∈
DDx
X
R D r r
R D
xR D
R D
∈
∈
&
&
&& , ( )
( )ζ ρ ω 8
where pD,r is the price of ideas in region r. Regional governments are thus allowed to tax or subsidise inputs and outputs in the R&D sector.
3. The R&D-embedded capital production process
Turning to the regional investors, after having purchased the ideas, they use an interregional bundle of intermediates and rent local R&D-embedded capital and hu-man capital to generate new R&D-embedded capital, increasing the regional stock. Since capital is not traded across regions but used for production and is rented only to the productive sectors of the regions where it is created, it represents one of the key sources of heterogeneity of economic outcomes across regions (together with human capital and the geographic location of the region).
In order to produce new R&D-embedded capital, investors buy all the ideas pro-duced in the region, Dr, even if only a part of them are successfully transformed into successful ideas, VI,r, depending on an endogenous regional innovation capacity φr:
V DI r rr
, . ( )= φ 9
The rate of success in turning an idea into new R&D-embedded capital is deter-mined by
φλ
rr
EU
r
EU
r
EU
r
EU
KP
KP
HP
HP
K
K
H
H=
1−−λ
( )10
where is the amount of R&D-embedded capital in region r (Kr) and in the whole EU (KEU); is the number of high-skilled workers (approximated by the number of employees with education level ISCED 5+6) in region r (Hr) and in the EU (HEU). In addition, regional human capital and R&D-embedded capital endowments are also considered in per capita terms (HPr and KPr), where per capita variables are ex-pressed as follows:

58 Di Comite, F. and Potters, L.
Investigaciones Regionales, 29 (2014) – Pages 47 to 75
KPK
PopHP
H
Poprr
rr
r
r
= =; . ( )11
This specification is used to capture the key role played by the social interactions and a critical mass of investments in the innovation process by taking into account the relative endowment and absolute concentration of human and physical capital in a par-ticular country vis-à-vis the rest of the EU 9. The intuition is that absolute concentration may matter per se, as it increases the probability of productive interactions, imitation and productive complementarities, however also the relative endowment is important because richer regions (hosting a more than proportional share of capital and skilled labour vis-à-vis the rest of the EU) may still be very innovative because of factors relat-ed to the higher factor availability which are not captured in the model (as for example better education system because of a higher pool of skilled workers, or a more effective allocation of investments due to successful entrepreneurship history in the region).
Regional investors produce new R&D-embedded capital Zr,which increases the regional R&D-embedded capital stock, Kr, depreciating at rate dK
10. The stock is thus assumed to be owned by the investors, who rent it to final goods and producers. At time t, the regional capital stock owned by investors can then be computed as:
K K Zr t r t K r t, , ,( ) . ( )= − +−1 1 12δ
The investors in each region produce new capital by combining a bundle of in-puts that can be traded across regions and locally available inputs. Considering all the investors in the region, the production of new R&D-embedded capital can be written as:
Z V K H Xr I r I r I r I r I rKI HI XI= ∈ ∈ ∈
, , , , ,( ) ( ) ( ) ( )ζ 13
where KI,r, and HI,r are the amounts of local R&D-embedded and human capital rent-ed to the investors XI,r and captures the quantity of intermediate goods used by the investors in region r. The shares of each type of input are estimated based on the SAMs. The productivity level is captured by the parameter ζi,r , which can be estimat-ed based on micro-level studies such as Ortega-Argilés et al. (2011). The bundle of intermediates is computed as:
X xI r r ind I ri q ind
i
N
q
R
i
rm
, , ,, ,( ) ( )= −
==∑∑ β σ σ1
11nnd
IND
=
−
∑
1
1
1
14σ
( )
9 For detailed analyses and literature of the impact of social agglomeration and clustering on the innovation capability, see Crescenzi et al. (2007), Storper and Venables (2004), Porter (2000) and Varga (2000).
10 The initial capital stock is calculated from the regional Social Accounting Matrices by assuming that the new capital generated is exactly what is needed to keep the system on a steady state growth path.

Modelling knowledge creation, investment decisions and economic growth in a spatial CGE... 59
Investigaciones Regionales, 29 (2014) – Pages 47 to 75
where x i,q,indI,r
is the quantity of intermediates used by investors in region r and bought from firm i in industry ind of region q and the relative importance of each industry’s output in the production process is βr,ind. Constant returns to scale in the inputs are ensured by the condition:
∈ + ∈ + ∈ =K H XI I I1 15. ( )
R&D-embedded capital is assumed not to be differentiated and therefore the com-petitive market price investors are able to charge p zI,r equals their marginal costs of production plus the amortisation over the expected quantities produced in the 1/dN1
periods of the fixed cost of purchasing the idea 11. For the sake of tractability, the rental price of new R&D-embedded capital is assumed to be equal to the rental price of the existing stock, i.e. p kr = p kI,r 12. The price of the newly produced units of capital consistent with zero profits at the industry level can then be written as:
p
p t w t
I rz
I rk
I rk
K
I rhi
I
I
KI
,
, , ,( ) (
=
+∈
+∈
1 1 ,, , ,) ( )rw
K
I rx
I rx
KI
HI
I
XIp t
∈
+∈
∈ ∈1
ζζφ δ
I r rz
mD
r rD
r N
r rzt
p D t
Z tI
, ( )
( )
( )( )
1
1
116
++
+
+
where the first terms accounts for the marginal costs of production and the second term for the fixed costs of buying Dr ideas, at p Dr price, with a probability of turning them into R&D-embedded capital of φr. These fixed costs are then distributed over Zr new units of R&D-embedded capital produced for 1/dNI periods, net of taxes and subsidies. Concerning the first term, p zI,r is the price of renting the R&D-embedded capital (KI,r) used in the production process, w hi
I,r is the wage of investors in region r and P xI,r is the price index of the bundle of intermediates (X I,r) bought as inputs from the different industries. The price index of the intermediates reflects the factory pric-es of individual intermediate goods, p x,q,ind
i,I , their trade costs incurred to ship goods from region q to r, tq,r,ind, and the relative importance of each industry’s output in the R&D-embedded capital production process, βq,r,ind:
P pI rx
r ind i Ix q ind
q r indi
Ni
, , ,, ,
, ,( ) ( )β τσ σ1
1
−=
nnd q
q
R
ind
IND , . ( )∑∑∑ ==
−( )11
1
117
σ
The regional government can tax or subsidise inputs and outputs used in process. The new R&D-embedded capital can be taxed or subsidised at rate tZ,r, investors’ labour at rate tw,I,r, R&D-embedded capital rental at rate tk,l,r, intermediates’ purchase at rate tx,I,r and ideas at rate tR&D,r.
11 Implicitly, this amounts to assuming that the investors can use the operating profits on ideas bought in previous periods to buy the new ones.
12 In order to keep the model tractable, it is assumed that agents are myopic and expect prices and output to be stable over time, even after temporary shocks.

60 Di Comite, F. and Potters, L.
Investigaciones Regionales, 29 (2014) – Pages 47 to 75
4. Regional final and intermediate goods production
Firms in each region produce goods for final consumption (for consumers and gov-ernments) and intermediate consumption (for other firms, investors and researchers) by employing local labour, R&D-embedded capital and intermediates, the latter being also imported from other regions’ producers. Firms producing goods are indicated as ir, jr ∈ Nr. Their output (yi,r) is defined as ci,r when used for final consumption, when used to produce ideas, xI,r, when used to produce R&D-embedded capital, xi,r when used to produce other goods and xG,r when used to produce regional public goods.
The production process is represented by a Cobb-Douglas combination of an aggregate CES bundle of low- and high-skilled regional labour 13, Li,r; a bundle of imperfectly substitutable intermediates Xi,r from producer j ≠ i from within the same region r and other regions q from each industry ind ∈ IND, weighted by an indus-try-region-specific preference parameter, βr,ind; and a stock of undifferentiated region-al R&D-embedded capital Ki,r. In addition, each region is associated with a specific manufacturing productivity level, ζi,r, and has access to different public goods and services provided by the regional government (PGr) and by the national government (PGm
r ) by combining available intermediates with a region-specific efficiency level. Finally, a fixed amount of financial capital, FCi,r is needed to set up firms. This is financed by the households’ savings stock in the EU, which is rented from regional entrepreneurs. The production function for the regional final and intermediate good firms can then be written as follows:
y GS GS X K Li r i r m r r i r i r i rGm Gr Xi Ki L
, , , , , ,= ∈ ∈ ∈ ∈ ∈ζ ii FCi r− , ( )18
where:
L li r e i re
e lo hi, ,
,
( ) ( )=
=∑ γ σ
σ1
19
where l ei,r is the amount of labour of skill level e = lo, hi (respectively, low and high)
used in the final goods sector of region r. The term ge represents the relative contribu-tion of each skill level in the overall bundle of labour used in the final goods sector;
X xi r r ind i rj q ind
j
N
q
ind q
, , ,, ,,= ( ) ( ) −
== ∑ βσ σ1
11
RR
ind
IND m∑∑ =
−
1
1
120
σ( )
where x i,q,indi,r is the quantity of intermediates bought in the final goods sector of re-
gion r from firm j in industry of region q and β r,ind the relative importance of each in-dustry’s intermediate in the production process of regional public goods and services:
13 Data on low skilled (ISCED level 0-2) and medium skilled (ISCED levels 3-4) come —just as high skilled labour— from the EUROSTAT database.

Modelling knowledge creation, investment decisions and economic growth in a spatial CGE... 61
Investigaciones Regionales, 29 (2014) – Pages 47 to 75
GS xr G r r ind G ri q ind
i
N
q
R r
= ( ) ( ) −
==∑ζ β
σ σ
, , ,, ,
1
11
mm
ind
IND
∑∑=
−
1
1
1
21σ
( )
where x i,q,indG,r is the quantity of intermediates bought from firm i in industry ind of
region q to produce public goods and services, GS, in region r. The term ζG,r captures the efficiency of public expenditures at the regional level and is approximated by the Quality of Government indicator as developed by Charron et al. (2012) 14. Public goods and services are non-rival and are freely provided to private companies. Their supply depends on an exogenously given amount of resources, EG,r, financed by the regional government budget, which is calibrated using government spending as re-ported in the regional Social Accounting Matrices. The amount of regional public goods and services provided can be computed as
GSE
P tr
G r G r
G rx
i rx
=+( )
, ,
, ,
; ( )ζ
122
where
P pG rx
r ind G ri q ind
q r indi
N
, , ,, ,
, ,= ( ) ( ) −
=β τ
σ σ1
1
gg r
ind
IND
q
R ,. ( )∑∑∑ ==
−
11
1
123
σ
As for the provision of goods and services at the national level, a similar logic applies, with
GS xm G m r ind G mi q ind
i
N
q
R r
= ( ) ( ) −
==∑ζ β
σ σ
, , ,, ,
1
11
mm
ind
IND
∑∑=
−
1
1
1
24σ
( )
And, an exogenously given amount of national resources devoted to the provision of public goods and services, EG,r, the total amount produced in country m is
GSE
PmG r G m
G mx
= , ,
,
, ( )ζ
25
where
P pG mx
r ind G mi q ind
i
Ng r
ind, , ,, ,,
= ( ) ( ) −
== ∑ βσ σ1
1111
1
126
IND
q
R ∑∑ =
−
σ. ( )
14 This QoG indicator has been constructed by combining national indicators on corruption, rule of law, government effectiveness and accountability from the World Bank’s World Governance Indicators data with regional indicators obtained from a EU wide survey of 34 000 inhabitants in 172 NUTS1 and NUTS2 regions.

62 Di Comite, F. and Potters, L.
Investigaciones Regionales, 29 (2014) – Pages 47 to 75
The amount of national public goods allocated to region can thus be measured as
GS GSPop
Popm r mr
m, , ( )= 27
Again, to ensure constant returns to scale in the inputs, the following condition should hold:
∈ + ∈ + ∈ + ∈ + ∈ =G G X K Lm r i i i1 28. ( )
The preferences of final goods consumers U(Cr) are expressed by a standard CES utility function. For the sake of tractability, the substitutability between varieties is equal to the substitutability between intermediate inputs in the different sectors of the economy:
U C cr r ind ri q ind
i
N
q
R
ind
s q( ) ,, ,,= ( ) −
=== ∑∑ βσ1
1111
1
129
IND∑
−σ( )
where the representative consumer in region r ∈ R buys i ∈ Nr varieties from all the EU regions and the rest of the world, q ∈ R, of each ind ∈ IND industry, each weight-ed by an industry-region-specific preference parameter, βr,ind
15. The budget constraint for household in region r is
p t c lc rq i ind
c r q r ind ri q ind
h,, ,
, , ,, ,( )1+ =τ ,, ( )r
c
i
N
q
R
ind
IND r
=== ∑∑∑ 11130
where I ch,r is the part of income used for consumption, measured as a constant share
of total income (1 – sr) the rest going to savings:
l s Ih rc
r h r, ,( ) ( )= −1 31
The resulting price index in region r for final consumption goods (indexed by c), given iceberg bilateral trade costs tq,r,ind > 1 is:
P prc
r ind c ri q ind
q r indi
Ns= ( ) ( ) −
=β τ
σ σ
, ,, ,
, ,,
1
1
q
R
ind
IND ∑∑∑ ==
−
11
1
132
σ( )
where tr,ind are consumption taxes or subsidies for industry ind in region r. The result-ing consumption of variety i produced in region q and sold in region r for industry ind is equal to:
15 Notice that the same parameter is used to capture the relative importance of each industry's output in the production process and the industry-region-specific preference parameter. While a simplification, it makes the model more tractable, easier to calibrate and is a standard assumption in the literature with vertical linkages.

Modelling knowledge creation, investment decisions and economic growth in a spatial CGE... 63
Investigaciones Regionales, 29 (2014) – Pages 47 to 75
c
p t
ri q ind r ind
c rq i ind
c r q r in
, , ,,, ,
, , ,( )
=+1
1β
τ dd
rc
rc
rCP
I
P
−σ
. ( )33
The profit function associated with final and intermediate goods firms in each industry can be written in compact form as:
Πri
c ri
c r ri
ri
ri
mfp t MC y f t t, ,( ) ( )(1 1 1+ − − + + rr
f ) ( )34
where —given the functional forms of intermediate and final demand— prices are determined applying a constant mark-up on costs that depends on the level of substi-tutability (1 – s),
pMC
c ri i r,
, ( )=−1
35σ
Marginal costs can be computed as:
MC
W t p t
i r
i r i rw
w
i rk
i
i
wi
,
, , , ,
=
+( )∈
+∈
1 1 rrk
K
i rx
i rx
Xi
Ki
i
P t( )∈
+( )∈
∈
, ,1
∈
∈
Xi
KGi r rPGζ , ( )
( )36
where
P pi rx
r ind i v indx q
q r indi
N
, , , ,,
, ,= ( ) ( ) −
=β τ
σ σ1
1
gg r
ind
IND
q
R , ; ( )∑∑∑ ==
−
11
1
137
σ
W wi r e i re
e lo hi, ,
,
[ ] . ( )=
−
=
−
∑ γσ
σ
σσ
1
1
38
Therefore, the price equation can be rewritten as:
p
W t p t
i rc
i r i rw
w
i rk
i
i
wi
,
, , , ,
=
+( )∈
+∈
1 1 rrk
K
i rx
i rx
Xi
Ki
i
P t( )∈
+( )∈
∈
, ,1
+ −
∈
∈
Xi
KGt PGrc
i r r( ) ( ) ( ). ( )
,1 139
σ ζ
Finally, the remuneration of equity fi,r (which can be seen as an annual fixed costs paid for setting up a firm) is equal to the endogenously determined returns on finan-
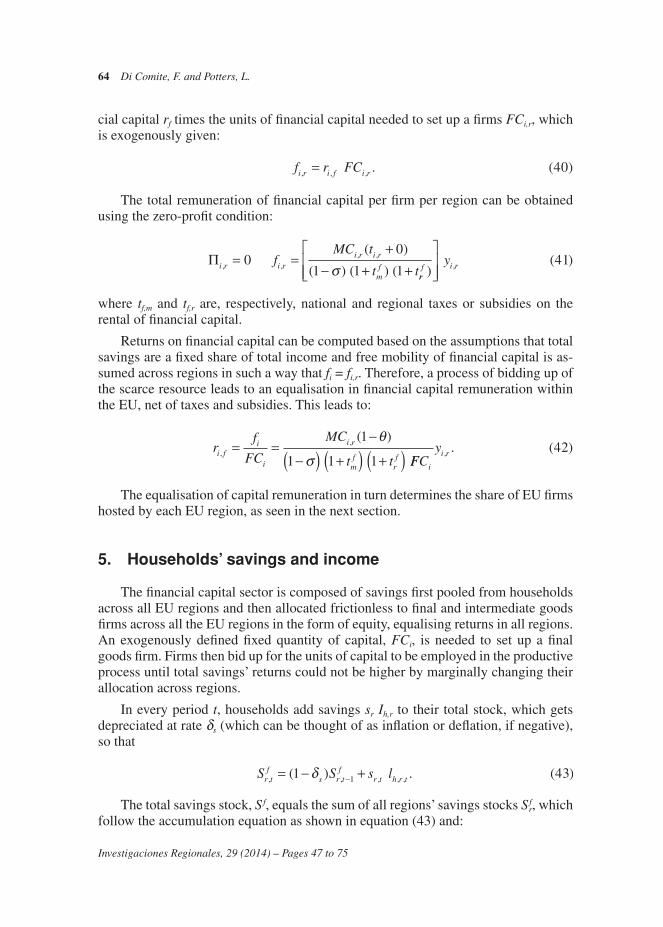
64 Di Comite, F. and Potters, L.
Investigaciones Regionales, 29 (2014) – Pages 47 to 75
cial capital rf times the units of financial capital needed to set up a firms FCi,r, which is exogenously given:
f r FCi r i f i r, , , . ( )= 40
The total remuneration of financial capital per firm per region can be obtained using the zero-profit condition:
Πi r i ri r i r
mf
fMC t
t t, ,, ,( )
( ) ( ) (= =
+− + +
00
1 1 1σ rrf i ry)
( ),
41
where tf,m and tf,r are, respectively, national and regional taxes or subsidies on the rental of financial capital.
Returns on financial capital can be computed based on the assumptions that total savings are a fixed share of total income and free mobility of financial capital is as-sumed across regions in such a way that fi = fi,r. Therefore, a process of bidding up of the scarce resource leads to an equalisation in financial capital remuneration within the EU, net of taxes and subsidies. This leads to:
rf
FC
MC
t ti f
i
i
i r
mf
rf,
, ( )= =
−
−( ) +( ) +( )1
1 1 1
θ
σ FFCy
i
i r, . ( )42
The equalisation of capital remuneration in turn determines the share of EU firms hosted by each EU region, as seen in the next section.
5. Households’ savings and income
The financial capital sector is composed of savings first pooled from households across all EU regions and then allocated frictionless to final and intermediate goods firms across all the EU regions in the form of equity, equalising returns in all regions. An exogenously defined fixed quantity of capital, FCi, is needed to set up a final goods firm. Firms then bid up for the units of capital to be employed in the productive process until total savings’ returns could not be higher by marginally changing their allocation across regions.
In every period t, households add savings sr Ih,r to their total stock, which gets depreciated at rate ds (which can be thought of as inflation or deflation, if negative), so that
S S s lr tf
s r tf
r t h r t, , , , ,( ) . ( )= − +−1 431δ
The total savings stock, Sf, equals the sum of all regions’ savings stocks Sfr, which
follow the accumulation equation as shown in equation (43) and:

Modelling knowledge creation, investment decisions and economic growth in a spatial CGE... 65
Investigaciones Regionales, 29 (2014) – Pages 47 to 75
S Sfrf
r
R= ∑ . ( )44
It can be assumed that not all the savings are turned efficiently into equity, but that a transformation parameter φFC accounts for compliance costs, search costs or any other source of inefficiency, so that:
F SFCf= φ . ( )45
Whereas the total number of firms in the whole EU can then be easily set as
NF
FCi
= , ( )46
the number of firms in each region will depend on the equalisation of financial capital remuneration seen in the previous section. So it will be local characteristics such as the availability of R&D-embedded capital, local public goods and services, firms’ productivity and so on to determine the patterns of economic agglomeration and dispersion across regions.
Household income is the sum of wages of researchers, investors and employees in the goods sectors, plus the remuneration received from the rental of financial cap-ital across regions. In addition, regional and national governments can deliver social transfers. Total household income at the regional level can then be computed as:
L w H w Hh r R D r R D r indind
IND
I rhi
I r i, & , & , , , , ,= +=∑ 1 nndind
IND
i r i r indind
IND
FC rfW L S
+
+ +
=
=
∑∑
1
1 , , , φ ++ +TR TRh rr
h rm
, ,
( )47
where TRmh are transfers from the national government to households and TRr
h are transfers from the regional government to households.
6. Government
Finally, we sum up all the leverages of policy intervention observed in the differ-ent sectors of the economy analysed so far and thus define the national and regional governments’ budget, which is assumed to be balanced.
6.1. National government budget
The national government can tax or subsidise financial capital rental. It is also allowed to transfer resources directly to regions or households. Its budget can then be written as follows:

66 Di Comite, F. and Potters, L.
Investigaciones Regionales, 29 (2014) – Pages 47 to 75
t f TR TR TRmf
i r mr
mEU
r
R
i
N
r
R
rmmmm
, + +( ) −=== ∑∑∑ 111++ +( ) −
− − =
TR TR
PR D E
hm
EUm
m G m& , ,( )
048
where t fm S Rm
r=1S Nri=1
fi,r are subsidies or taxes on rental of financial capital of firms i in regions r ∈ Rm; TR m
r are transfers from the national government to regional gov-
ernments; TR mh are transfers from the national government to households; TR r
m are
transfers from the regions to the national governments; TR EUm are the ECP funds trans-
ferred to each country; PR&Dm is the national funding of public research, PR&Dm
Sr=Rm PR&D m
r ; EG,m is the budget allocated to the provision of the national public good.
6.2. Regional government budget
The regional government can provide productivity-enhancing public goods and services and tax or subsidise wages, intermediates and financial and physical capital rental. It is also allowed to transfer resources directly to households or to the national government. The regional government budget can then be written as:
w H p t KR D rhi
R D rw
R D r R D rk
R D rk
R D r& , & , & , & , & , & ,τ + + pp t X p D t
w H
R D rx
R D rx
R D r mD
r rD
I rhi
I
& , & , & ,
,
+( ) ++ ,, , , , , , , ,r I r
wI rk
I r I rk
I rx
I r I rxt p K t P X t TR+ +( ) + rr
mrEU
hr
mr
I r i r i r
TR TR TR
Wi L t
+( ) − +( ) ++
( )
, , ,
49
wwi rk
i r I rk
i rx
i r i rx
rf
i rip K t P X t t f+ + +
=, , , , , , ,1
NN
r
R
G r rrm E PR D∑∑ =( )− − =
10, &
Here:
— w hiR&D,rt w
R&D,rH R&D,r are subsidies or taxes on wages of researchers;
— p kR&D,r t k
R&D,rKR&D,r are subsidies or taxes on R&D-embedded capital rental by
researchers;— p x
R&D,r t xR&D,rXR&D,r
are subsidies or taxes on intermediates purchased by re-searchers;
— w hiI,r H
kI,r t
hiI,r
are subsidies or taxes on wages of investors;— p k
I,r K I,r tkI,r
are subsidies or taxes on R&D-embedded capital rental by inves-tors;
— P xI,r X I,r t
xI,r
are subsidies or taxes on intermediate goods purchased by inves-tors;
— p Dm D r t
Dr
are subsidies or taxes on the purchase of ideas (bought by investors);— W i,r L i,r t w
i,r are subsidies or taxes on wages of employees in the goods sector;
— p ki,r K i,r t k
i,r are subsidies or taxes on R&D-embedded capital rental by goods
firms;— P x
i,r X I,r txi,r
are subsidies or taxes on intermediate goods purchased by goods firms;
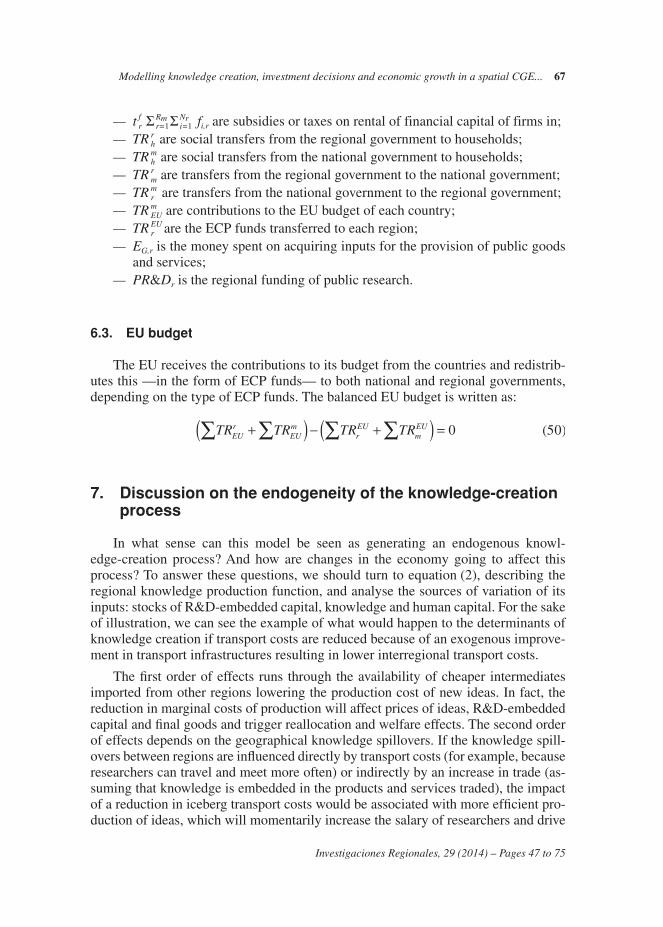
Modelling knowledge creation, investment decisions and economic growth in a spatial CGE... 67
Investigaciones Regionales, 29 (2014) – Pages 47 to 75
— t fr S Rm
r=1S Nri=1 fi,r are subsidies or taxes on rental of financial capital of firms in;
— TR rh are social transfers from the regional government to households;
— TR mh are social transfers from the national government to households;
— TR rm are transfers from the regional government to the national government;
— TR mr are transfers from the national government to the regional government;
— TR mEU are contributions to the EU budget of each country;
— TR EUr are the ECP funds transferred to each region;
— EG,r is the money spent on acquiring inputs for the provision of public goods and services;
— PR&Dr is the regional funding of public research.
6.3. EU budget
The EU receives the contributions to its budget from the countries and redistrib-utes this —in the form of ECP funds— to both national and regional governments, depending on the type of ECP funds. The balanced EU budget is written as:
TR TR TR TREUr
EUm
rEU
mEU+( ) − +( ) =∑∑ ∑∑ 0 50( )
7. Discussion on the endogeneity of the knowledge-creation process
In what sense can this model be seen as generating an endogenous knowl-edge-creation process? And how are changes in the economy going to affect this process? To answer these questions, we should turn to equation (2), describing the regional knowledge production function, and analyse the sources of variation of its inputs: stocks of R&D-embedded capital, knowledge and human capital. For the sake of illustration, we can see the example of what would happen to the determinants of knowledge creation if transport costs are reduced because of an exogenous improve-ment in transport infrastructures resulting in lower interregional transport costs.
The first order of effects runs through the availability of cheaper intermediates imported from other regions lowering the production cost of new ideas. In fact, the reduction in marginal costs of production will affect prices of ideas, R&D-embedded capital and final goods and trigger reallocation and welfare effects. The second order of effects depends on the geographical knowledge spillovers. If the knowledge spill-overs between regions are influenced directly by transport costs (for example, because researchers can travel and meet more often) or indirectly by an increase in trade (as-suming that knowledge is embedded in the products and services traded), the impact of a reduction in iceberg transport costs would be associated with more efficient pro-duction of ideas, which will momentarily increase the salary of researchers and drive

68 Di Comite, F. and Potters, L.
Investigaciones Regionales, 29 (2014) – Pages 47 to 75
new researchers in the knowledge-creation activities to re-equilibrate high-skilled wages. This would result in more knowledge produced and lower prices for ideas.
A third order of effects runs through the availability of R&D-embedded capital to rent for producing new ideas. Lower transport costs of intermediate goods imported from other regions make the R&D-embedded capital production process in equa-tion (13) more efficient and thus increase its stock [equation (12)], which is assumed to be on a steady growth path before the shock and thus above the trend after the shock. The impact of an increase in this stock to rent would then lower the prices and increase the quantities rented.
Human capital input is exogenously given in the current version and would there-fore not be affected by a reduction in transport costs. However, if a production func-tion is assumed also for the provision of the education service and it uses inputs such as intermediates, then also the human capital stock (the relative number of high-skill workers) would behave similarly to the R&D-embedded capital stock and have the same impact on the knowledge-creation process. In addition, it should be noted that even a temporary increase in knowledge production enhances future productivity for the region experiencing the shock and for its neighbours because an increase in the regionally produced stock knowledge as modelled in equation (1) shifts the knowl-edge production frontier outwards by increasing the stock of ideas available to re-searchers. This means that even the temporary shocks may have long-lasting effects, reinforced by the spatial spillovers.
Summing up, conditional on the specific technological parameters of the pro-duction functions, the endogenous knowledge-creation process of the model may yield self-sustained endogenous growth and allow us to model permanent effects of temporary shocks such as European Structural Funds.
8. Conclusions
This paper has described in detail how an endogenous knowledge-creation pro-cess can be embedded in a spatial CGE model. We described how, in each region, high-skilled researchers leverage the existing stock of ideas, R&D-embedded capital and intermediates to produce ideas which are transformed by local investors into R&D-embedded capital that add up to the existing stock which sustains the economy. This stock is indeed used not only to create new idea and regenerate the stock, but also by firms for producing final goods (for consumers) and intermediate goods (for the physical capital sector and the government) by combining regional R&D-embed-ded capital with labour, intermediates and public goods and services (provided by local governments). Besides consuming local and imported final goods, households provide both the labour input (low- and high-skilled) and the savings that are used as equity for setting up firms.
The main aim of this extension is to provide an analytical tool to deal with the heterogeneous response of European regions to policy intervention. Indeed, both

Modelling knowledge creation, investment decisions and economic growth in a spatial CGE... 69
Investigaciones Regionales, 29 (2014) – Pages 47 to 75
persistence in economic disparities and convergence in income levels can be ob-served looking at the full sample of European regions. The extension proposed can rationalise economic convergence or the lack thereof though the differences in the ac-cumulation of knowledge and R&D-embedded capital stocks. We showed that even temporary policy shocks —for example due to the availability of Cohesion Policy funds— can have long-lasting effects on the regions involved. These results are in line with the innovation literature finding that the socio-economic conditions of re-gions play a key role in determining that extent of a successful knowledge-for-growth nexus (Veugelers and Mrak, 2009).
An exogenous shock in a certain region increasing the efficiency of knowledge production has indeed been shown to increase the number of marketable ideas sold to investors, who are then expected to produce more R&D-embedded capital. This in turn increases the availability of the R&D-embedded capital input in the final goods sector, whose output in terms of intermediate and final consumption goods increases and prices lower. This is as far as each region is concerned individually. However, sources of spatial spillovers have been identified in both the knowledge-creation pro-cess and the trade of intermediate goods. For example, the efficiency of knowledge creation in each region is increased by the additional stock of knowledge in neigh-bouring regions. Similarly, the production of cheaper intermediates and final goods in the regions experiencing the positive shocks in knowledge-creation process bene-fits neighbouring regions by decreasing their costs of purchasing intermediate inputs (which make researchers, investors and firms more efficient) and final goods (which increases the welfare of citizens).
There are different directions in which the model presented here can be en-riched. For example, an obvious simplification has been to take human capital stock as exogenous, but it could as well result from an endogenous accumulation process as the other stocks analysed here. Another obvious subsequent step would be to bring the model to the data and see it can indeed be used to rationalise observed growth patterns and impacts of policy intervention. Its implementation will be da-ta-intensive, partly due to the model’s large dimensions (267 EU regions and 6 sectors) and due to the detailed knowledge creation process as described in this paper. For comparison, DG ECFINs model QUEST is developed at a country level and has only one productive sector. The model presented in this paper has described the process of knowledge creation, the production of R&D-embedded capital and final and intermediate goods while keeping in mind its actual implementability and calibration at the regional level with available data, which will be done in subse-quent work.
References
Aghion, P., and Howitt, P. (1998): Endogenous Growth Theory, MIT Press.Barro, R., and Sala-i-Martin, X. (1997): «Technological Diffusion, Convergence, and Growth»,
Journal of Economic Growth, 2: 1-27.

70 Di Comite, F. and Potters, L.
Investigaciones Regionales, 29 (2014) – Pages 47 to 75
Brandsma, A.; Di Comite, F.; Diukanova, O.; Kancs, d’A.; López Rodríguez, J.; Persyn, D., and Potters, L. (2014): «Assessing policy options for the EU Cohesion Policy 2014-2020», Joint Research Centre of the European Commission Working Paper.
Brandsma, A.; Kancs, D.; Monfort, P., and Rillaers, A. (2013): «RHOMOLO: A regional-based spatial general equilibrium model for assessing the impact of cohesion policy», JRC-IPTS Working Paper Series, JRC81133, European Commission, DG Joint Research Centre.
Bröcker, J., and Soltwedel, R. (2010): «Agglomeration and growth in knowledge-based socie-ties», The Annals of Regional Science, 45: 1-4.
Burgess, A.; Chen, T. M.; Snelder, M.; Schneekloth, N.; Korzhenevych, A.; Szimba, E., and Christidis, R. (2008): Final Report on TRANS-TOOLS (TOOLS for TRansport forecasting And Scenario testing). Deliverable 6, funded by 6th Framework RTD Programme. TNO Inro, Delft, Netherlands.
Bye, B.; Fæhn, T., and Heggedal, T. R. (2009): «Welfare and growth impacts of innovation policies in a small, open economy; an applied general equilibrium analysis», Economic Modelling, 26(5): 1075-1088.
Charron, N.; Lapuente V., and Dijkstra, L. (2012): «Regional governance matters: A study on regional variation in quality of government within the EU», Directorate General for Re-gional Policy Working Paper 01/2012.
Christensen, M. A. (2013): «ICT, R&D-policies and growth: An applied general equilibrium analysis of the EU», JRC-IPTS, European Commission, DG Joint Research Centre, mimeo.
Crescenzi, R.; Rodríguez-Pose, A., and Storper, M. (2007): «The territorial dynamics of inno-vation: a Europe-United States comparative analysis», Journal of Economic Geography, 7: 673-709.
Diukanova O., and López-Rodríguez, J. (2014): «Regional impacts of non-R&D innovation expenditures across the EU regions: simulation results using the RhOMOLO CGE model», JRC-IPTS, European Commission, DG Joint Research Centre, mimeo.
European commission (2014): «Regional Innovation Scoreboard 2014», Directorate-General for Enterprise and Industry.
Grossman, G., and Helpman, E. (1991): Innovation and growth in the global economy, MIT Press.Howitt, P. (2000): «Endogenous growth and cross-country income differences», American
Economic Review, 90 (4): 829-846.Jones, C. I. (1995): «R&D-based models of economic growth», Journal of political Economy,
103(4): 759-784.López-Bazo, E., and Manca, F. (2012): «Model-based assessment of the regional impact of
R&D policies», JRC-IPTS Working Paper Series JRC80872. European Commission, DG Joint Research Centre.
López-Rodríguez, J., and Martínez, D. (2014): «Beyond the R&D effects on innovation: the contribution of non-R&D activities to TFP growth in the EU», JRC-IPTS, European Com-mission, DG Joint Research Centre, mimeo.
Ortega-Argilés, R.; Potters, L., and Vivarelli, M. (2011): «R&D and productivity: testing sec-toral peculiarities using micro data», Empirical Economics, 41(3): 817-839.
Petersen, M. S.; Bröcker J.; Enei, R.; Gohkale, R.; Granberg, T.; Hansen, C. O.; Hansen, H. K.; Jovanovic, R.; Korchenevych, A.; Larrea, E.; Leder, P.; Merten, T.; Pearman, A.; Rich, J.; Shires, J., and Ulied, A. (2009): Report on Scenario, Traffic Forecast and Analysis of Traffic on the TEN-T, taking into Consideration the External Dimension of the Union, funded by Directorate-General for Transport and Energy.
Porter, M. E. (2000): «Location, Competition, and Economic Development: Local Clusters in a Global Economy», Economic Development Quarterly, 14: 15-34.
Potters, L.; Conte, A.; Kancs, d’A., and Thissen, M. (2014): «Data Needs for Regional Model-ling», JRC-IPTS Working Paper Series, JRC80845, European Commission, DG Joint Re-search Centre.

Modelling knowledge creation, investment decisions and economic growth in a spatial CGE... 71
Investigaciones Regionales, 29 (2014) – Pages 47 to 75
Ratto, M., and Roeger, W. (2009): «QUEST III: An estimated open-economy DSGE model of the euro area with fiscal and monetary policy», Economic Modelling, 26(1): 222-233.
Romer, P. (1990): «Endogenous technological change», Journal of political Economy, S71-S102.
Romer, P. (1994): «The origins of endogenous growth», Journal of Economic Perspectives, 8: 3-22.
Solow, R. M. (1956): «A contribution to the theory of economic growth», The quarterly jour-nal of economics, 70(1): 65-94.
Storper, M., and Venables, A. J. (2004): «Buzz: face-to-face contact and the urban economy», Journal of Economic Geography 4: 351-370.
Thissen, M.; Di Comite, F.; Potters, L., and Kancs, d’A. (2014): «The construction of regional SAMs for the RHOMOLO model», JRC-IPTS, European Commission, DG Joint Research Centre, mimeo.
Varga J., and Veld, J. in ’t (2011): «A Model-based Analysis of the Impact of Cohesion Policy Expenditure 2000-06: Simulations with the QUEST III endogenous R&D model», Eco-nomic Modelling, 28: 647-63.
Varga, A. (2000): «Local academic knowledge spillovers and the concentration of economic activity», Journal of Regional Science, 40: 289-309.
Varga, A. (2015): «Place-based, spatially blind or both? Challenges in estimating the impacts of modern development policies: The case of the GMR policy impact modeling approach», International Regional Science Review (forthcoming).
Veugelers, R. and Mrak, M. (2009): Catching-up Member States and the Knowledge Economy of the European Union. Knowledge Economists Policy Brief, 5.

72 Di Comite, F. and Potters, L.
Investigaciones Regionales, 29 (2014) – Pages 47 to 75
Annex I: Identifiers (subscripts/superscripts)
r, q ∈ R Regions
m ∈ M Countries
j ∈ N Intermediate firms
ind ∈ IND Industries
R&D Knowledge-creation activities
I R&D-embedded capital creation activities
G Government
h Households
Annex II: Variables
ci Consumption of final goods
D Ideas adding up to the knowledge stock
DPr,t Ideas created using public regional funding
EG,r Regional government expenditures in intermediates to produce public goods
EG,m National government expenditures in intermediates to produce public goods
F Total effective financial investments
fi,r Remuneration of financial capital needed to set up a firm
fi Total remuneration of financial capital
FCi Fixed costs of setting up a final goods firm (in terms of units of financial capital)
HR&D Researchers’ human capital
HI Investors’ human capital
HPr Per capita levels of human capital in region
Ih,r National household income
I ch Income spent on consumption
Kr,t R&D-embedded capital stock at time
KI R&D-embedded capital rented to the investments’ sector
Ki R&D-embedded capital rented to the final goods firms
KR&D,r R&D-embedded capital stock in region
KPr Per capita levels of R&D-embedded capital in region

Modelling knowledge creation, investment decisions and economic growth in a spatial CGE... 73
Investigaciones Regionales, 29 (2014) – Pages 47 to 75
lhiR&D High-skilled labour force used in the knowledge-creation sector
Li Composite bundle of labour employed for goods firms
lei Labour force with skill level, (respectively low, high)
MCi Marginal costs of firm
Ni Number of final goods firms
pD Price of ideas
pzI,r Price of new R&D-embedded capital produced by investors
pkl R&D-embedded capital rental price in for investors
Pxl Intermediates bundle price index for investors
pxl Intermediates’ price for investors
Pxi Intermediates bundle price index for goods firms
pi Price of final goods
pki Capital rental price for goods firms
pxi Price of intermediates for goods firms
Pcr Price index of final goods in consumption bundle in region
GSr Public goods and services provided by regional governments
GSm Public goods and services provided by regional governments
PxG,r Intermediates bundle price index for producing public goods and services in region
Pcr Price index of final goods in region
Pop Population
PR&Dr Regional budget for public research
PR&Dm National budget for public research
R&Dr Stock of knowledge in region
ρr Regionally available stock of knowledge
ri Remuneration of a unit of financial capital
S f Total financial savings stock
TRmh Transfers from countries to households
TRrh Transfers from regions to households
TRrm Transfers from regions to countries
TRmr Transfers from countries to regions
TRmEU Transfers from countries to the EU (contribution to EU budget)
TRmEU Transfers from the EU to the countries (ECP funds)

74 Di Comite, F. and Potters, L.
Investigaciones Regionales, 29 (2014) – Pages 47 to 75
TRrEU Transfers from the EU to the regions (ECP funds)
U(Cr) Utility of the representative consumer in region r
ur Efficiency of public research of region
VI Number of ideas successfully turned into new R&D-embedded capital.
wei,r Wage of e-skilled labour employed in goods firms, e=lo,hi (low, high)
Wi Wage index of labour bundle for goods firms
whiI Wages (high-skill) of investors
XR&D Intermediates’ bundle consumption by researchers
xR&D Intermediates purchased by researchers to produce ideas
XI Intermediates’ bundle consumption by investors
xI Intermediates purchased by investors to produce R&D-embedded capital
Xi Intermediates’ bundle consumption used by goods firms
Xm Intermediates’ bundle consumption used by the national government
Xr Intermediates’ bundle consumption used by the regional government
xG Intermediates used by government to produce public goods
xj Intermediates used by firms to produce goods
yi Output of goods firms
Z New R&D-embedded capital produced
tq,r,ind Trade cost from q to r in industry ind
Pi Goods firm ’s profits in the sector
φFC Transformation parameter for savings into financial capital/equity
φr Rate of success in turning ideas into R&D-embedded capital
Annex III: Taxes
twr,R&D Regional subsidies or taxes on researchers’ wages
tDr Regional taxes or subsidies on ideas’ sales
twI,r Regional subsidies or taxes on investors’ wages
tkI,r Regional subsidies or taxes on R&D-embedded capital rented by investors
t xI,r Regional subsidies or taxes on intermediates purchased by investors
twi,r Regional subsidies or taxes on employees’ wages in the goods sector
tki,r Regional subsidies or taxes on R&D-embedded capital rented by goods firms
t xi,r Regional subsidies or taxes on intermediates purchased by goods firms

Modelling knowledge creation, investment decisions and economic growth in a spatial CGE... 75
Investigaciones Regionales, 29 (2014) – Pages 47 to 75
tcr Regional subsidies or taxes on goods sales
t fm National subsidies or taxes on rental of financial capital
t fr Regional subsidies or taxes on rental of financial capital
Annex IV: Parameters
dr,r* Measure of distance between region and
sr Savings rate in region r
β Preference parameter
ge Relative skill e(=lo,me,hi) weight in the labour bundle for final goods production
d Depreciation rate
dR&D Depreciation rate of knowledge stock
dK Depreciation rate of R&D-embedded capital stock
ds Depreciation rate of savings stock
∈HR&DHigh-skill human capital share in ideas’ production function
∈KR&DRented capital share in ideas’ production function
∈XR&DIntermediate consumption share in ideas’ production function
∈HIHigh-skill human capital intensity in R&D-embedded capital’s production function
∈KIR&D-embedded capital intensity in R&D-embedded capital’ production function
∈HiR&D-embedded capital intensity in final goods production function
∈GiRelative importance of public goods in goods production function
∈LiLabour intensity in goods production function
∈XIIntermediates consumption’s intensity in R&D-embedded capital production
∈XiIntermediates consumption’s intensity in goods production function
ζR&D,r Region-specific productivity parameter in the knowledge creation process
ζI,r Region-specific productivity parameter in R&D-embedded capital production
ζi,r Region-specific productivity parameter in the goods manufacturing process
ζG,r Region-specific efficiency in the production of public goods and services
θ Level of substitutability between varieties
l Relative importance of R&D-embedded capital and human capital for innovation capability
s Substitution parameter
ωR&D Knowledge absorption capacity in the knowledge-creation process


© Investigaciones Regionales, 29 (2014) - Pages 77 to 90Section Articles
Modelling regional labour market dynamics: Participation, employment and migration decisions in a spatial CGE model for the EU
Damiaan Persyn, Wouter Torfs, d’Artis Kancs*
ABSTRACT: This paper outlines how regional labour market adjustments to ma-cro-economic and policy shocks are modelled in RHOMOLO through participa-tion, employment and migration decisions of workers. RHOMOLO, being a multi-sectoral, inter-regional general equilibrium model, is complex both in terms of its dimensionality and the modelling of spatial interactions through trade flows and factor mobility. The modelling of the labour market is therefore constrained by the tractability and computational solvability of the model. The labour market module consists of individual labour participation decisions, including the extensive mar-gin (to participate or not) and the intensive margin (hours of work). Unemployment is determined through a wage curve and inter-regional labour migration decisions are modelled in a discrete-choice framework, with backward-looking expectations.
JEL Classification: C68; D58; F22; J20; J61; J64; O15.
Keywords: Participation; unemployment; labour migration; wage curve; CGE; new economic geography.
Modelización de la dinámica en mercados de trabajo regionales: participación, empleo y decisiones de migración en un modelo espacial de EGC para la UE
RESUMEn: Este paper describe cómo los ajustes en los mercados de trabajo regionales tanto a los shocks de política como macroeconómicos se modelizan en RHOMOLO a través de decisiones de los trabajadores sobre participación, em-pleo y migración. RHOMOLO, como modelo de equilibrio general multisectorial e interregional es complejo tanto en términos de dimensionalidad como de mode-lización de interacciones espaciales a través de flujos de comercio y movilidad de factores. La modelización del mercado de trabajo está por ello limitada tanto por
77
Received: 10 april 2014 / Accepted: 1 september 2014.
* IPTS, European Commission DG Joint Research Centre, E-41092 Seville, SpainThe authors gratefully acknowledge the helpful comments of two anonymous referees. The authors
are solely responsible for the content of the paper. The views expressed are purely those of the authors and may not under any circumstances be regarded as stating an official position of the European Commission.

78 Persyn, D., Torfs, W. and Kancs, D.
Investigaciones Regionales, 29 (2014) – Pages 77 to 90
la capacidad computacional como por la facilidad para obtener una solución (en forma de expresión matématica, en forma reducida) del modelo. El módulo del mercado de trabajo consiste en decisiones de participación individuales, incluyen-do el margen extensivo (participar o no) y el margen intensivo (horas de trabajo). El desempleo se determina a través de la curva de salarios y las decisiones de migración interregional se modelizan en un esquema de elección discreta basado en expectativas pasadas.
Clasificación JEL: C68; D58; F22; J20; J61; J64; O15.
Palabras clave: participación; desempleo; migración laboral; curva de salarios; CGE; nueva geografía económica.
1. Introduction
Labour markets serve as an important adjustment channel to macro-economic shocks, such as regional integration and economic crises. Changes in regional em-ployment can be accommodated in a model through changes in labour force partici-pation, changes in unemployment, or labour migration. The present paper describes the modelling approach of regional labour markets taken in the newly developed dynamic spatial general equilibrium model RHOMOLO 1. It is crucial to account for all three adjustment channels of regional labour markets in the modelling framework, as there exist important interactions between them. Failing to model them simultane-ously may result in suboptimal policy recommendations (Boeters and Savard, 2012). Therefore, in RHOMOLO, the labour market equilibrium is determined by firms’ labour demand, the participation decision of representative households, a wage curve relating wages to unemployment and inter-regional labour migration.
Inclusion of households’ participation decisions is desirable, as the empirical ev-idence has shown that in the EU changes in regional employment opportunities are predominantly absorbed through changes in participation decisions by individuals, rather than migration or changes in unemployment (Decressin and Fatás, 1995). In addition, it is important to distinguish between the intensive and extensive margin of participation. If the change in participation occurs at the intensive margin, workers simply adjust their number of hours worked and unemployment remains unaffected. For given levels of employment however, participation decisions at the extensive margin do alter unemployment. In RHOMOLO the participation decision is modelled both at the intensive and the extensive margin and closely follows the approach by Boeters and van Leeuwen (2010), describing the labour market in WORLDSCAN, a CGE model developed and used by the Dutch Central Planning bureau (CPB).
The empirical evidence suggests that unemployment is not driven by excess la-bour supply. In contrast, regions and countries with high employment rates have low
1 For a detailed description of the RHOMOLO model, see Brandsma et al. (2013), published in this issue of Investigaciones Regionales.

Modelling regional labour market dynamics: Participation, employment and migration... 79
Investigaciones Regionales, 29 (2014) – Pages 77 to 90
unemployment rates, and there is limited job creation in regions and countries with high unemployment rates, rather than large differences in labour supply. This implies that labour market imperfections must be accounted for, in order to explain the preva-lance of unemployment. The modelling of unemployment in RHOMOLO follows Blanchflower (1994) and adopts the wage curve approach —an empirical regularity describing the negative relation between wages and unemployment. This approach allows us to pragmatically introduce unemployment, while avoiding strong assump-tions on the underlying labour market imperfections causing it.
Although the importance of international migration as an adjustment channel is only of limited importance in the EU, inter-regional labour migration flows do mitigate demand shocks to a significant extent (Blanchard and Katz, 1992; Decressin and Fatás, 1995; European Commission, 2012), especially over longer time periods. Consequently, interregional migration is also modelled in RHOMOLO. The migra-tion decision of households in RHOMOLO is based on a comparison of expected regional income differences. All parameters governing the elasticity of the migration decision are estimated empirically.
The remainder of the paper is structured as follows. Section 2 introduc-es the participation decisions of workers, Section 3 describes the wage curve and estimates country-specific wage curve elasticities, and Section 4 details the modelling of inter-regional labour migration in RHOMOLO and the estimation procedure applied to uncover the elasticities determining inter-regional labour migration flows.
2. Labour market participation
The approach taken in modelling participation in RHOMOLO is based on Boet-ers and van Leeuwen (2010). We introduce participation decisions both at the inten-sive and extensive margins.
2.1. Modelling participation: intensive margin
The representative individual divides her total available time T between leisure, F, and hours worked, H. As working increases the available income for consumption, the individual faces a trade-off between consumption and leisure in utility when op-timising the following CES utility function:
VC
C
F
Fe c c= =
+ − =
− −
θ θ
γγ
γγ
1 1
1( )
−γ
γ 1
1( )
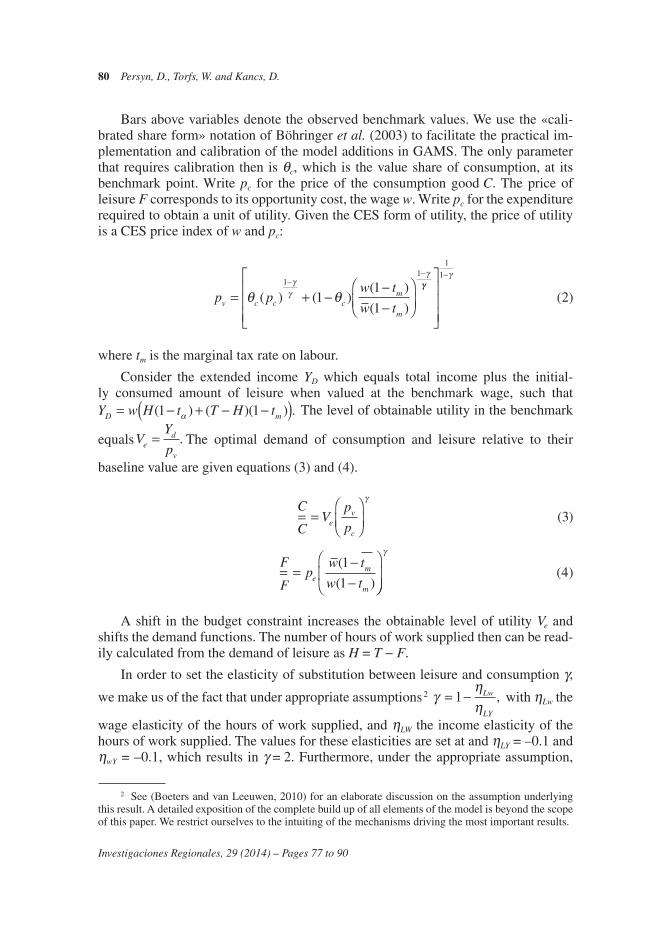
80 Persyn, D., Torfs, W. and Kancs, D.
Investigaciones Regionales, 29 (2014) – Pages 77 to 90
Bars above variables denote the observed benchmark values. We use the «cali-brated share form» notation of Böhringer et al. (2003) to facilitate the practical im-plementation and calibration of the model additions in GAMS. The only parameter that requires calibration then is θc, which is the value share of consumption, at its benchmark point. Write pc for the price of the consumption good C. The price of leisure F corresponds to its opportunity cost, the wage w. Write pc for the expenditure required to obtain a unit of utility. Given the CES form of utility, the price of utility is a CES price index of w and pc:
p pw t
w tv c c cm
m
= + −−−
−
−
θ θγ
γ
γ
( ) ( )( )
( )
11
11
1
γγγ
−1
1
2( )
where tm is the marginal tax rate on labour.
Consider the extended income YD which equals total income plus the initial-ly consumed amount of leisure when valued at the benchmark wage, such that Y w H t T H tD m= − + − −( )( ) ( )( ) .1 1α The level of obtainable utility in the benchmark
equalsVY
ped
v
= . The optimal demand of consumption and leisure relative to their
baseline value are given equations (3) and (4).
C
CV
p
p
F
Fp
w t
w t
ev
c
em
m
= =
= =−−
γ
( )
(
( )
3
1
1
γ
( )4
A shift in the budget constraint increases the obtainable level of utility Ve and shifts the demand functions. The number of hours of work supplied then can be read-ily calculated from the demand of leisure as H = T − F.
In order to set the elasticity of substitution between leisure and consumption g,
we make us of the fact that under appropriate assumptions 2 γηη
= −1 Lw
LY
, with ηLw the
wage elasticity of the hours of work supplied, and ηLW the income elasticity of the hours of work supplied. The values for these elasticities are set at and ηLY = –0.1 and ηwY = –0.1, which results in g = 2. Furthermore, under the appropriate assumption,
2 See (Boeters and van Leeuwen, 2010) for an elaborate discussion on the assumption underlying this result. A detailed exposition of the complete build up of all elements of the model is beyond the scope of this paper. We restrict ourselves to the intuiting of the mechanisms driving the most important results.

Modelling regional labour market dynamics: Participation, employment and migration... 81
Investigaciones Regionales, 29 (2014) – Pages 77 to 90
an income elasticity of labour, ηLY = –0.1 implies T/H = 1.1 (see (Boeters and van Leeuwen, 2010). Future work will consider setting the parameter values according to recent empirical work on these elasticities, such as Bargain et al. (2014).
2.2. Modelling participation: extensive margin
Next, we introduce labour supply decisions along the extensive margin. Our aim is to determine the number N of labour market participants.
Following Boeters and van Leeuwen (2010) we model the combined labour sup-ply decision (intensive and extensive) as a two-step procedure, which is solved back-wards by the individuals. Individuals first determining their optimal number of hours worked, assuming a positive participation decision. The expected utility of supplying labour Vl then is compared to a fixed (and individual specific) cost of working, V0 to determine whether to participate or not. This fixed cost of working, V0, is assumed to be uniformly distributed across individuals.
In the presence of involuntary unemployment (see Section 3), the assignment of labour market participants between the employed and unemployment is assumed to be random (the individuals are assumed to be identical apart from their idiosyncratic cost of participation V0). The unemployment rate, u, is assumed to be exogenous from the perspective of the individual, Vu is the utility of an unemployed individual (see below), and Ve is the utility of an employed individual shown above in equa-tion 1. The e1xpected utility of supplying labour for every individual therefore is given by:
V u V uVl e u= − +( ) , ( )1 5
where the utility of an unemployed individual is given by:
VC
C
T L
Fu cu
c=
+ − −
− −
θ θ δγγ
γγ
1 1
1( )
−γ
γ 1
6( )
with Cu ≡ rwL(1 – ta) the consumption level of the unemployed with a replacement income determined by the replacement rate r. It is assumed that the unemployed can enjoy only a share d of the total available time T in the form of leisure (due to, for example, time spent searching for jobs). The utility level of the unemployed contains no decision variables and hence is fully determined by model parameters.
Writing h for the value of the density function of V0’s, the number of labour mar-ket participants then can be calculated as
N N h U Ul l= + −( ) ( )7

82 Persyn, D., Torfs, W. and Kancs, D.
Investigaciones Regionales, 29 (2014) – Pages 77 to 90
Assuming the Ul remains within the upper and lower limit of this distribution, the change in the number of participants N in function of wage increases will be higher for a high value of h, the case where individuals have rather similar values of V0. The value of h therefore determines the elasticity of labour supply at the extensive margin.
More formally, the elasticity of labour supply at the extensive margin which is implied by a specific value for h equals
ηNwl
l lN
w
N
V
V
wh
V≡ ∂∂
= ∂∂
∂∂
=log
log
log
log
log
log NN
V
wh
u V
N
wL t
Yl e m
D
log
log
( ) ( ).
∂∂
=− −1 1
Note that the value of the elasticity does not only depend on h but also on N and other variables, and therefore is endogenous. We follow Boeters and van Leeuwen (2010) and fix h at the value which correponds to ηNw = 0.2 at the benchmark level of N = N. In the simulations, will vary depending on the value of N.
Alternatively, the participation module could be calibrated using country-specif-ic econometric elasticity estimatesy. Some recent empirical estimates are available from Bargain et al. (2014).
3. Unemployment
3.1. Conceptual framework of a wage curve
Following Blanchflower (1994), unemployment in RHOMOLO is modelled by means of a wage curve. The fundamental empirical regularity of the wage curve —a negative relationship between the local unemployment to local real wages— can be derived from a number of micro-founded theoretical models (Card, 1995): the implicit contract model, where the local presence of valued amenities compensate for lower wages and higher unemployment; the efficiency wage model, where em-ployers need to be paid a premium to prevent them from shirking on the job and the negative relation arises because the no-shirking premium is lower in times of high unemployment (because the penalty of getting caught shirking increases); and finally, the union bargaining model, where increasing unemployment leads to a worsening of the workers’ outside option, reducing their wage demands during negotiations with employers.
Figure 1 illustrates the equilibrium on the labour market in the presence of a wage curve. Take for example a unionised regional labour market, where unions bar-gain a higher wage during negotiations with employers, albeit at the cost of decreased job creation. The negotiations drive a wedge between the competitive wage level (A) and the bargained wage (B), leading to equilibrium unemployment, a desirable future for a spatial equilibrium model.
Now consider the effect of a regional labour demand shock: in a perfectly com-petitive labour market with an inelastic labour supply, such a shock would solely

Modelling regional labour market dynamics: Participation, employment and migration... 83
Investigaciones Regionales, 29 (2014) – Pages 77 to 90
affect the wage level and leave employment unaltered at the full-employment level. A wage curve ensures that a labour demand shock is translated into an increase in both employment (decrease in unemployment) as well as the wage level (A→B). Because in the RHOMOLO economy people can migrate between regions, this is not the end of the story. How migration mitigates the initial local wage increase in the change in the unemployment rate is illustrated in section 4.
A key parameter determining the effect of shocks on regional unemployment is the wage curve elasticity. In the current version of RHOMOLO, the slope of all regional wages curves is assumed to be equal to –0.1, a commonly recurring value in the empirical literature (Card, 1995; Blanchflower and Oswald, 1995; Janssens and Konings, 1998; Fagan et al., 2005). Since reported estimates in the empirical literature vary considerably, future research will aim to provide coun-try specific estimates of the wage curve elasticity. Our approach will be based on Baas et al. (2007) and Jimeno and Bentolila (1998). The pragmatic approach of using a reduced-form wage curve allows us to avoid explicitly modelling the exact mechanisms generating unemployment and thus circumvent making strong
Figure 1. The local labour market equilibrium in the presence of a wage curve and an illustration of the effect of a labour demand shock
on wages and (un)employment
Employment
Employment’
Unemployment
Unemployment’
A
B
C
Total workforcew
W*
Ld Ld’
W(L)

84 Persyn, D., Torfs, W. and Kancs, D.
Investigaciones Regionales, 29 (2014) – Pages 77 to 90
assumptions about parameters driving those models, which are often unobserv-able. Introducing national variation in the slope of the wage curves, allows the model to capture fundamental differences between countries’ labour market in-stitutions. With a more structural approach, this would be difficult to achieve as calibrating such modelling frameworks would place heavy demands on the data requirements.
4. Labour migration
4.1. A discrete choice model of labour migration
The equilibrating effect of migration flows in RHOMOLO is illustrated in Figure 2. Keeping everything else constant, the initial labour demand shock, il-lustrated in Figure 1, triggers in-migration which causes both wages and unem-ployment rates to return back to their pre-shock level (B→C). It is important to keep in mind that in a general equilibrium model, as in reality, everything else is not fixed. Firms will be exiting or entering the region which results in additional labour demand shifts and other regions will be affected through trade-links or knowledge spillovers, preventing complete equalisation of regional labour mar-ket outcomes.
The modelling of migration in RHOMOLO follows the approach of Sorensen et al. (2007) and Grogger and Hanson (2011) and is described in detail in Brandsma et al. (2013). It starts from the individual migration decision, where worker k from origin region o, maximises indirect utility, Vkor, across all possible destinations r. Destination d will be chosen if
V V r V Z ekod kor kod od od kod> ∀ = + +, .β ξ
The indirect utility of Vkod worker k migrating from origin region o to destination region d is determined by characteristics Vod of regions o and d. These characteristics are pair specific and contain for example bilateral distance. Term Zodβ represents the utility that workers k associates with these characteristics, so that β is a vector of marginal utilities. Error term ξod represents unobserved location characteristics. Zodβ and ξod assign the same utility level to all workers in o considering migration to d. The idiosyncratic error term ekod varies across both workers and regions and accounts for the fact that not all workers from the same region choose the same destination. The probability that location d is chosen by individual k from region o then equals:
Pr
Pr
( )
(
V V d r
e e Z Zkod kor
kod kor or od or
> ∀ ≠− > − +β β ξ −− ∀ ≠ξod d r) .

Modelling regional labour market dynamics: Participation, employment and migration... 85
Investigaciones Regionales, 29 (2014) – Pages 77 to 90
Now assume that the idiosyncratic error term follows an i.i.d. extreme value dis-tribution. McFadden (1973) shows this yields the following probability for a worker k from o to migrate to d:
Pr( )exp( )
exp( ).M
Z
Zkod
od od
od odd
R= =
+
+=∑
1
1
β ξ
β ξ(( )8
Berry (1994) in turn shows that probability (8) of migrating from o to d coincides with the share of workers from o migrating to d. Following Sorensen et al. (2007), we therefore write the share of migrants from o to d as:
S MZ
Zod kod
od od
od odd
= Pr( )exp( )
exp( )= =
+
+=
1β ξ
β ξ11
9R∑
. ( )
Figure 2. An illustration of a single shift in labour demand (A→B), and subsequent in-migration (B→C) on regional wages, employment and
unemployment in a partial equilibrium setup. The shift only has a temporary effect on the local wage level and unemployment rate, but a permanent effect on the size
of the local labour force.
Employment
Employment’
Unemployment
Unemployment’
B
C
Total workforcew
W*
Ld Ld’
W(L)
D

86 Persyn, D., Torfs, W. and Kancs, D.
Investigaciones Regionales, 29 (2014) – Pages 77 to 90
and the share of stayers in region o as:
S MZ
Zoo koo
oo oo
od odd
= Pr( )exp( )
exp( )= =
+
+=
1β ξ
β ξ11
10R∑
. ( )
Dividing equation (9) by (10) and applying a logarithmic transformation yields a simple econometrically estimable migration equation:
Lns
s
Z
Zod
oo
od od
oo oo
=
++
lnexp( )
exp(
β ξβ ξ ))
( )
= − + −Z Zod oo od ooβ β ξ ξ 11
Next, we allow ekod the to be correlated within countries, while maintaining the i.i.d. assumption between countries. Using the same index c for countries (nests) and for the country of destination, the estimable migration equation can then be written as:
Lns
sZ Z sod
oood oo od cd
= − + +( ) ln( ) (( / )β σ ξood oo−ξ ) ( )12
4.2. Econometric specification and empirical implementation
The estimation of equation (12) requires an instrumental variable approach due to the endogeneity of the conditional probability (share). Following the common ap-proach in the literature on discrete choice in the context of product demand estimation (Berry et al., 1995), we chose the number of regions in country as an instrument for the probability of choosing a specific region as the destination of choice, conditional on the destination country choice. The share of people choosing a particular region in a country will on average be inversely related to the number of regions in the country. The number of regions in a country is exogenous to the migration decision in itself, as the size of countries and the number of NUTS-2 regions contained in them are clearly unrelated to contemporary migration patterns.
In order to construct a matrix with bilateral regional migration flows, two datasets were merged: Eurostat’s data on within-country interregional migration flows and OECD’s data on international migration. Data on migration between NUTS2 regions within countries is available from Eurostat for most of the EU member states. The first step in constructing an approximate dataset of gross bilateral migration flows between NUTS2 regions consists of calculating migration probabilities between every pair of regions within each country, for each country separately. Secondly, international migration flows without any regional dimension were obtained from the OECD. These international migration flows were subsequently «regionalised», assuming that international migrants distribute themselves between the regions of the country of destination according to the same pattern as within-country migrants do. Similarly, the international migrants are assumed to originate from specific regions of

Modelling regional labour market dynamics: Participation, employment and migration... 87
Investigaciones Regionales, 29 (2014) – Pages 77 to 90
origin in the source country in the same proportions as the within-country migrants originate from different regions in the source country. Obviously, this approach is an approximation, and will introduce errors, if the true distribution of international mi-grants differs significantly from the observed distribution of within-country migrants.
Explanatory variables. In line with the underlying conceptual framework, we measure the indirect utility for living in region d for an individual from region o, Vkod = Zodβ + ξod + ekod by the expected real income in destination region d, net of migration costs for migrating between o and d. We approximate the real expected
income in region r by incomeW r l u r
P rr =⋅ −( )( ) ( )
( ), with the average local wage W(r),
the unemployment rate u(r), and the local consumer price index P(r). The migration costs are approximated by a log-linear function of the great circle distance between the geographic centre of the origin and destination NUTS-2 region. A dummy vari-able I(intlod) for international migration equals 1 in case region o and d are located in different countries. The empirical specification of the estimation equation then becomes
ln ln( ) ln( )s
sincome incomeod
ooo d
= +β β1 2 ++ +
+ +
β
β β
3
4 5
ln( )
( ) ln((
distance
int
od
od od cl s
dI )) ( ).
( )+ −ξ ξod oo
13
The data on wages, the unemployment rate and consumer price index (CPI) were taken from the Eurostat regional databases. The year 2004 was chosen to perform the analysis, as this year has the best data coverage 3. Although, according to the under-lying conceptual framework, coefficients β1 and β2 should be of opposite sign and of equal size, we follow Kancs (2011) and do not impose this restriction in our empirical application. We report the empirical results for specifications including a log-linear distance term to estimate the elasticity of migration with respect to distance. In the simulations using RHOMOLO, however, in order to obtain results which are as re-alistic as possible a fifth-order polynomial in log-distance will be used to capture non-linearities in the response of migration to distance. We omit these results here.
4.3. Empirical results
Using the imputed interregional migration flows, equations (11) and (12) were subsequently estimated.
Column (I) of Table 1 shows the results of estimating equation (11) using the OLS estimator. Column (II) reports the instrumental variables estimation described above for equation (12). The estimated effect of income in the destination region
3 Choosing a different year does not materially affect the results.
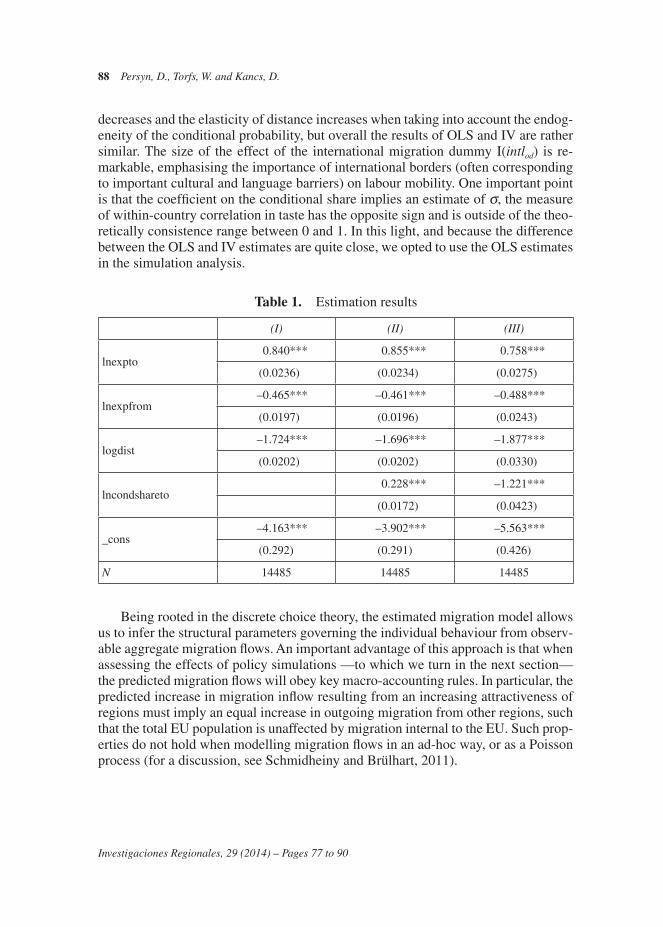
88 Persyn, D., Torfs, W. and Kancs, D.
Investigaciones Regionales, 29 (2014) – Pages 77 to 90
decreases and the elasticity of distance increases when taking into account the endog-eneity of the conditional probability, but overall the results of OLS and IV are rather similar. The size of the effect of the international migration dummy I(intlod) is re-markable, emphasising the importance of international borders (often corresponding to important cultural and language barriers) on labour mobility. One important point is that the coefficient on the conditional share implies an estimate of s, the measure of within-country correlation in taste has the opposite sign and is outside of the theo-retically consistence range between 0 and 1. In this light, and because the difference between the OLS and IV estimates are quite close, we opted to use the OLS estimates in the simulation analysis.
Table 1. Estimation results
(I) (II) (III)
lnexpto0.840*** 0.855*** 0.758***
(0.0236) (0.0234) (0.0275)
lnexpfrom–0.465*** –0.461*** –0.488***
(0.0197) (0.0196) (0.0243)
logdist–1.724*** –1.696*** –1.877***
(0.0202) (0.0202) (0.0330)
lncondshareto0.228*** –1.221***
(0.0172) (0.0423)
_cons–4.163*** –3.902*** –5.563***
(0.292) (0.291) (0.426)
N 14485 14485 14485
Being rooted in the discrete choice theory, the estimated migration model allows us to infer the structural parameters governing the individual behaviour from observ-able aggregate migration flows. An important advantage of this approach is that when assessing the effects of policy simulations —to which we turn in the next section— the predicted migration flows will obey key macro-accounting rules. In particular, the predicted increase in migration inflow resulting from an increasing attractiveness of regions must imply an equal increase in outgoing migration from other regions, such that the total EU population is unaffected by migration internal to the EU. Such prop-erties do not hold when modelling migration flows in an ad-hoc way, or as a Poisson process (for a discussion, see Schmidheiny and Brülhart, 2011).

Modelling regional labour market dynamics: Participation, employment and migration... 89
Investigaciones Regionales, 29 (2014) – Pages 77 to 90
5. Conclusions
This paper describes how regional labour market adjustments to macro-econom-ic and policy shocks through participation, employment and migration decisions of workers are modelled in RHOMOLO, a spatial CGE model. Being a multi-sectoral, inter-regional general equilibrium model, RHOMOLO is complex both in terms of its dimensionality and the modelling of spatial interactions through trade flows and factor mobility. The modelling of the labour market is therefore constrained by the tractability and computational solvability of the model. The labour market module consists of individual labour participation decisions, both at the extensive (to par-ticipate or not) and the intensive margin (hours of work). Unemployment is deter-mined through a wage curve. Inter-regional labour migration is modelled in a dis-crete-choice framework with backward-looking expectations, for which migration elasticities have been estimated econometrically.
References
Baas, T.; Brücker, H.; Hauptmann, A., and Jahn, E. J. (2007): «The macroeconomic conse-quences of labour mobility», Institute for Employment Research, Deliverable, 4.
Bargain, O.; Orsini, C., and Peichl, A. (2014): «Comparing Labor Supply Elasticities in Europe and the US: New Results», Journal of Human Resources, 49 (2), Forthcoming.
Berry, S. (1994): «Estimating discrete-choice models of product differentiation», The RAND Journal of Economics, pp. 242-262.
Berry, S.; Levinsohn, J., and Pakes, A. (1995): «Automobile prices in market equilibrium», Econometrica: Journal of the Econometric Society, pp. 841-890.
Blanchard, O. J., and Katz, L. F. (1992): «Regional evolutions», Brookings Papers on Econom-ic Activity, 23 (1), 1-76.
Blanchflower, D. G. (1994): The wage curve, MIT press.Blanchflower, D., and Oswald, A. J. (1995): «An introduction to the wage curve», Journal of
Economic Perspectives, 9 (3), 153-167.Boeters, S., and Savard, L. (2012): The Labour Market in CGE Models. CPB Discussion Paper
201, CPB Netherlands Bureau for Economic Policy Analysis.Boeters, S., and van Leeuwen, N. (2010): A labour market extension for WorldScan; modelling
labour supply, wage bargaining and unemployment in a CGE framework. Tech. rep., CPB Netherlands Bureau for Economic Policy Analysis.
Böhringer, C.; Rutherford, T. F., and Wiegard, W. (2003): «Computable general equilibrium analysis: Opening a black box», ZEW, Discussion Paper, 03-56.
Brandsma, A.; Kancs, D., and Persyn, D. (2013): Modelling Migration and Regional Labour Markets: An Application of the New Economic Geography Model RHOMOLO. IPTS Work-ing Paper Series JRC80825, European Commission, DG Joint Research Centre.
Card, D. E. (1995): «The wage curve: a review», Journal of Economic Literature, 33 (2), 285-299.
Decressin, J., and Fatás, A. (1995): «Regional labor market dynamics in Europe», European Economic Review, 39 (9), 1627-1655.
European Commission (2012): Labour Market Developments in Europe 2012. European Econ-omy 2012/05, Directorate-General for Economic and Financial Affairs, European Com-mission.

90 Persyn, D., Torfs, W. and Kancs, D.
Investigaciones Regionales, 29 (2014) – Pages 77 to 90
Fagan, G.; Henry, J., and Mestre, R. (2005): «An area-wide model for the euro area», Economic Modelling, 22 (1), 39-59.
Grogger, J., and Hanson, G. (2011): «Income maximization and the selection and sorting of international migrants», Journal of Development Economics, 95 (1), 42-57.
Janssens, S., and Konings, J. (1998): «One more wage curve: the case of belgium», Economics Letters, 60 (2), 223-227.
Jimeno, J. F., and Bentolila, S. (1998): «Regional unemployment persistence (Spain, 1976-1994)», Labour Economics, 5 (1), 25-51.
Kancs, D. (2011): «Labour migration in the enlarged EU: A new economic geography ap-proach», Journal of Economic Policy Reform, 14 (2), 171-188.
McFadden, D. (1973): «Conditional logit analysis of qualitative choice behavior», in Zaremb-ka, P. (ed.), Frontiers in Econometrics, New York: Academic Press.
Schmidheiny, K., and Brülhart, M. (2011): «On the equivalence of location choice models: Conditional logit, nested logit and poisson», Journal of Urban Economics, 69 (2), 214-222.
Sorensen, T.; Fishback, P.; Allen, S., and Kantor, S. (2007): Migration Creation, Diversion, and Retention: New Deal Grants and Migration 1935-1940. Nber working paper series, National Bureau of Economic Research.

© Investigaciones Regionales, 29 (2014) – Pages 91 to 111Section Articles
Regional Impacts of non-R&D Innovation Expenditures across the EU Regions: Simulation Results Using the Rhomolo CGE Model
Olga Diukanova, Jesús López-Rodríguez*
ABSTRACT: In the EU, a sizable part of innovation is attributed to the activities other than R&D such as purchases of advanced machinery, licenses, patents and minor modifications in products or processes. These non-R&D innovation activi-ties receive substantial funding from the European cohesion policy (ECP). In this paper we applied the dynamic spatial computable general equilibrium model RHO-MOLO to evaluate the ex-ante short and long run economic impacts of 2014-2020 non-R&D innovation subsidies allocated to the EU27 NUTS2 regions. The results of computer simulations show that the most notable welfare improvements (GDP, production and household consumption) were observed in the Eastern EU regions that receive the largest share of funding. Such outcome is in line with the goals of the European Cohesion Policy of stimulating economic convergence of the least developed regions. As was expected, the magnitude of macroeconomic impacts positively correlates with the amount of non-R&D subsidies allotted to the regions.
JEL Classification: R11; R13; C54; C68.
Keywords: Computable General Equilibrium Model; Innovation; European Union; Cohesion Policy.
Impactos en las regiones europeas de los gastos de innovación no considerados estrictamente I+D: Resultados de simulaciones realizadas con el MEGA RHOMOLO
RESUMEn: En la Unión Europea una parte importante de la innovación se atri-buye a actividades que no son estrictamente I+D como la compra de maquinaria avanzada, compra de licencias y patentes y modificaciones menores en productos
91
Received: 10 january 2014 / Accepted: 18 august 2014.
* European Commission, Joint Research Centre (JRC), Institute for Prospective Technological Studies (IPTS), Knowledge for Growth Unit, Edificio Expo. C/ Inca Garcilaso 3, 41092 Seville, Spain.
Corresponding author. Tel.: +34 9544-88226; fax: +34 954 48 84 34, E-mail address: [email protected] (J. López-Rodríguez).
The views expressed are purely those of the author and may not in any circumstances be regarded as stating an official position of the European Commission.

92 Diukanova, O. and López-Rodríguez, J.
Investigaciones Regionales, 29 (2014) – Pages 91 to 111
y procesos. Este tipo de actividades reciben una financiación importante por parte de la política de cohesión europea. En este trabajo se utiliza el modelo espacial de equilibrio general RHOMOLO para evaluar tanto a corto plazo como a medio plazo el impacto económico ex-ante de los subsidios a este tipo de actividades proporcionados por la política de cohesión europea en el período 2014-2020 a las regiones NUTS2 de la UE27. Los resultados de las simulaciones realizadas mues-tran que los mayores incrementos en los niveles de bienestar (PIB, producción, y consumo de los hogares) se observan en las regiones de los países del este de Euro-pa que son aquellas que recibieron la mayor proporción de financiación. Además, la magnitud de los impactos macroeconómicos se correlaciona positivamente con la cantidad de subsidios asignados a las regiones.
Clasificación JEL: R11; R13; C54; C68.
Palabras clave: Modelo Computable de Equilibrio General; Innovación; Unión Europea; Política de Cohesión.
1. Introduction
The EU Cohesion Policy (ECP) is one of the major investment tools in the Euro-pean Union. Roughly a third of the EU budget is assigned to this policy domain with the objective of supporting job creation, enhancing competitiveness and economic growth and improving quality of life and sustainable development (EU Commission, 2010).
Table 1 illustrates the distribution of 2014-2020 ECP funding across the three groups of regions and according to the five main categories of expenditure.
Table 1. Distribution of 2014-2020 ECP funding among the EU regions, mln €
Region type Number RTDInon-R&D
Infra-struc-ture
Human resour-
ces
Tech-nical assis-tance
Total
Share in total ECP
funding, %
Less developed 65 25,250 27,127 129,128 38,408 12,162 232,075 68%
Transition 51 5,772 6,218 14,339 10,201 1,585 38,115 11%
More developed 151 10,916 9,101 24,167 24,196 2,954 71,334 21%
Total 267 41,938 42,446 167,634 72,805 16,701 341,524
Share in total ECP funding, % 12% 12% 49% 21% 5%
Source: own elaboration based on simulations with RHOMOLO.
It can be seen that the biggest share of funding is allotted to finance infrastruc-ture projects and human capital related activities (70%). However, the promotion of
Regional Impacts of non-R&D Innovation Expenditures across the EU Regions... 93
Investigaciones Regionales, 29 (2014) – Pages 91 to 111
innovation was a central feature of the Lisbon National Reform Programmes (EU Commission, 2010) and it was very much taken into consideration in the current pro-gramming period were around a quarter of the total budget was assigned to promote innovation (RTDI and non-R&D).
There is a general consensus in the economic literature that R&D has a preemi-nent role in the economic development, being an important driver of innovation and growth (Romer, 1990, Grossman and Helpman, 1991, Aghion and Howit, 2007).
However, in addition to R&D activities, innovation can take place through ac-tivities which do not require research and development. These non-R&D activities include the acquisition of advanced machinery, computer hardware and software, patents and licenses, training related to the introduction of new products or process-es, market research, feasibility studies, design and production engineering, etc. (see Arundel et al., 2008, Hervas-Oliver and Albors-Garrigos, 2011, Khan et al., 2010 and Martin et al., 2005, among others).
In Europe about 40-60% of the industrial value-added and 50% of all in-dustry employees are engaged in the non-R&D-intensive sector (Rammer et al., 2011, Hirsch-Kreinsen, 2008, Som, 2012). Additionally, more than 50% of all innovating firms in the EU are non-R&D performers (Rammer et al., 2011, Som et al., 2010). These non-R&D performers are found to be prevailing in low tech-nology manufacturing and services sectors and among small and medium sized firms. Firm-level data studies have shown that non-R&D activities have a sig-nificant impact on firms’ productivity (see, for example Crepon et al., 1998 and Ortega-Argilés and Moreno, 2009). Departing from these firm-level data studies, López-Rodríguez and Martínez (2014) evaluated the impacts of non-R&D ac-tivities on total factor productivity (TFP) at a country level for a sample of EU countries showing also their positive contribution to TFP.
Figure 1 illustrates the allocation of cumulative non-R&D expenditures across the NUTS2 regions over the period of 2014-2020 and Figure 2 presents the share of cumulative non-R&D funding in regions’ GDP 1.
Considering the high shares of funding devoted to non-R&D activities in the EU budget and the importance of these activities in promoting innovation in Eu-rope, it is important to evaluate the ex-ante short and long run effects of the planned regional non-R&D investments contained in the European Cohesion Policy budget. In essence, EU assistance affects economies through two channels: First, transfers from the EU Structural Funds increase revenues in the recipient regions, producing a so-called Keynesian, or demand effect on output and employment, as the increased income would be spent on goods and services. Second, they are likely to increase productive potential in the region by improving infrastructure, skills of the work force and strengthening local business environment. Some of these impacts are quite difficult to evaluate ex ante, since programmes have full effect on the economy after a number of years.
1 The shares are computed based on 2009 GDP figures.

94 Diukanova, O. and López-Rodríguez, J.
Investigaciones Regionales, 29 (2014) – Pages 91 to 111
Figure 1. Non-R&D innovation expenditure allocation by CSF in 2014-2020, min E 2007
(0.664 - 46.97)(46.97 - 106.57)(106.57 - 210.18)(210.18 - 357.05)(357.05 - 503.22)(503.22 - 831.56)(831.560899 - 1369.99)
Source: own elaboration based on DG Regio data.
Figure 2. The allocated non-R&D innovation expenditures allocation (2014-2020) as % of regional GDP
(0.001934 - 0.11)(0.11 - 0.32)(0.32 - 0.80)(0.80 - 1.79)(1.79 - 3.12)(3.12 - 5.18)(5.18 - 9.2)
Source: own elaboration based on DG Regio data (allocation of non-R&D innovation expenditures for 2014-2020) and Eurostat data (regional GDP in 2009).
Regional Impacts of non-R&D Innovation Expenditures across the EU Regions... 95
Investigaciones Regionales, 29 (2014) – Pages 91 to 111
Although there is no well-established methodology to quantify the economic and social effects of the Structural Funds, there is a consensus about focusing on their long-term or supply-side effects. This task usually requires computer simulations with dynamic macroeconomic models.
The European Commission (DG Regio) has been using two type of macroeco-nomic models: HERMIN (Bradley et al., 1995) and QUEST (Varga et al., 2009, 2011) to analyse the impacts of EU cohesion programmes. These models have dif-ferent theoretical underpinnings and sector coverage. QUEST belongs to the class of Dynamic Stochastic General Equilibrium (DSGE) models and has only one sector producing intermediate inputs, whereas HERMIN is a system of macroeconomic models which offer much higher level of disaggregation. However, these models are applied at the level of EU Member States (MS).
A number of studies were devoted to the evaluation of macro-economic impacts of R&D investments within a CGE framework at the level of EU member states (see, for example Bye et al., 2006, Kr ístková, 2013, Varga et al., 2011). However, these studies did not consider the non-R&D activities and cannot be employed to analyse economic developments at the level of NUTS2 regions, according to the European Nomenclature of Territorial Units for Statistics (Eurostat, 2006).
Even though it has long been acknowledged that invention processes involving R&D is not the only method of innovating, a vast majority of theoretical and applied research focuses almost entirely on R&D partly because of inadequate and segment-ed information on non-R&D activities.
Aiming to bridge this gap, our paper uses data received from DG Regio on the regional allocation of non-R&D investments (category «Aid to Private Sectors», and on their annual planned consumption by regions during 2014-2023) to explore innovation activities that are not based on R&D. Since non-R&D activities are considered to be productivity enhancing (see, for example, Arundel et al., 2008, Khan et al., 2010, Hervas-Oliver and Albors-Garrigos, 2011), improvements in regions’ TFP were considered in RHOMOLO as the main channel through which the ECP funding of non-R&D innovation activities affect regional economies. In order to perform our analysis, we applied a spatial dynamic computable general equilibrium model RHOMOLO to estimate the ex-ante economic impacts of non-R&D innovation subsidies allotted to EU NUTS2 regions within the 2014-2020 ECP budget.
As a point of departure we use López-Rodríguez and Martínez (2014) economet-ric estimates of TFP elasticities with respect to the non-R&D investments for a sam-ple of EU countries. Using the values of the annual planned allocation of non-R&D investments to the NUTS2 regions contained in the 2014-2020 ECP budget and the computed TFP elasticities, we projected the TFP growth in the EU NUTS2 regions to perform our simulations with RHOMOLO. The results of the simulations carried out have shown that cumulative production in the NUTS2 regions would grow relative to the baseline projections achieving the highest values in the less developed regions of the new member states.

96 Diukanova, O. and López-Rodríguez, J.
Investigaciones Regionales, 29 (2014) – Pages 91 to 111
The rest of the paper is structured as follows. Section 2 describes the main build-ing blocks of the RHOMOLO model. Section 3 briefly discusses the economic ra-tionale behind the econometric estimates of the TFP elasticities with respect to the non-R&D investments and explains how TFP projections were introduced into the RHOMOLO model. Section 4 presents the discussion of the results of computer sim-ulations. Finally, Section 5 contains the main conclusions and policy implications.
2. The structure of the RHOMOLO model
RHOMOLO is a spatial dynamic general equilibrium model that was constructed under the Regional Modelling project of the JRC-IPTS on behalf of the DG REGIO with the objective to provide scientific support to the EC policymaking by evaluating the possible impacts of policy instruments available under the Cohesion Policy tool-kit (see Brandsma et al., 2013).
Following Mathiesen (1985), the model was formulated as a mixed complemen-tarity problem. The core equations of RHOMOLO were formulated using a calibrat-ed share format which is described in Rutherford (2002), programmed in GAMS and solved using PATH solver.
Since regional structure of the model follows the European Nomenclature of Ter-ritorial Units for Statistics at the level two (NUTS2, Eurostat, 2006), RHOMOLO was calibrated to the Social Accounting Matrixes (SAMs) of the NUTS2 regions of the EU. SAMs of the EU member states were built from the World Input-Output Da-tabase, WIOD 2010). Construction of SAMs for NUTS2 regions was accomplished using the data of regional production by sector, bilateral trade with the NUTS2 re-gions, and with the rest of the world. The entropy approach was employed to balance the rest of SAMs’ entries.
Transportation costs in RHOMOLO differ by type of good and depend on dis-tance between the regions of origin and destination. Inter-regional trade costs were derived from the TRANS-TOOLS database (JRC IPTS, 2005-2010). Representation of trade and transport flows among the NUTS2 regions allows accounting for region-al differences in cost of trade and transportation.
In each region, the model describes behaviour of private households, government and the producers. The latter are represented by production sectors. Because of large spatial dimension which requires much time and computer memory to perform simu-lations, the current model version included only 6 industries: Agriculture (AB), Man-ufacturing and energy (CDE), Construction (F), Transport (GHI), Financial services (JK) and Non-market services (LMNOP).
Mobility of capital and labour is assumed to occur across industries within the region but inter-regional migration of production factors is not considered in the cur-rent model version.
The EU regions were modelled as small open economies that accept non-EU prices as given. While this assumption might seem contradicting to the European

Regional Impacts of non-R&D Innovation Expenditures across the EU Regions... 97
Investigaciones Regionales, 29 (2014) – Pages 91 to 111
influence on global economy, it is consistent with the regional scope of the model. In this perspective EU’s external relations involve only one non-EU trading partner that is represented by the rest of the world aggregate (ROW).
Because of models’ large dimensionality, we have selected a rather simple approach to introduce dynamics into RHOMOLO. It rests on the assumptions of exogenous growth, which is in line with Solow’s model (Solow, 1956). This type of dynamics does not require time index in the core equations. The model solves for the sequence of equi-librium states, when all time periods are connected with the equation of capital accumu-lation. Each year in each region a portion of capital stock depreciates at a given rate, and gets augmented by the previous year investments, so that capital stock and investments grow at the same rate with the rest of economy. Using a perpetual inventory method (OECD, 2001), sectors’ capital stock was calculated from the operating surplus, as these data were provided in the SAMs. All agents of the model have myopic expectations and cannot anticipate future changes in relative prices or make choice between consumption and savings depending on the interest rate. In order to keep the model baseline «clean» of trade spill-overs that change relative prices and induce sectoral changes, we applied a uniform 2% annual growth rate to all regions. The sum of interest rate and depreciation rate was employed to estimate regions’ capital stock from the value of their operating surplus. The interest rate was set at the level of 5%. Capital depreciation rate was as-sumed to be 6% per annum. Therefore there are no changes in regions’ economic struc-ture over the steady-state baseline period. All prices remain constant; only the quantities grow at the same constant rate. In this case we can get more clear insights by comparing the after-shock model results with the baseline values.
The results were compared with the scenario when regions receive funding with-in the framework of the EU Cohesion Policy to support non-R&D activities. Taking into account the productivity enhancing nature of non-R&D investments (Arundel et al., 2008, Khan et al., 2010, Hervas-Oliver and Albors-Garrigos, 2011, López-Ro-dríguez and Martínez, 2014), improvements in regions’ TFP were considered as the main transmission channel through which the ECP funding of non-R&D innovation activities affects regional economies. To do so, elasticity estimations of the the impact of non-R&D funding on TFP were taken from López-Rodríguez and Martínez, 2014.
Calculation of regional TFP rates and the approach of their integration into the model equations are explained in the sections 3.1 and 3.2. The core model structure is explained below.
2.1. Sector’s production function
According to the structure of regional SAMs, industries’ production costs in-clude labour services, operating surplus (capital services), and intermediate inputs. Taxes (or subsidies) are levied on industries’ consumption of labour, capital services and also on sectors’ output. Proceeds from taxation accrue to the regional govern-ment. The same structure of nested production functions is adopted for all sectors, see Figure 3.

98 Diukanova, O. and López-Rodríguez, J.
Investigaciones Regionales, 29 (2014) – Pages 91 to 111
Figure 3. Sector’s nested production function
Output to
AB
CDEF GHI LMNOP JK
tfp tfp
tk tl
Labour-capitalaggregate
Capital Labour
CES
Lt
where AB-Agriculture, CDE-Manufacturing and energy, F-Construction, GHI-Transport, JK- Financial services and LMNOP-Non-market services.
On the top level of the sectors’ production functions a Leontief (Lt) function defines complementarity among the intermediate inputs and the labour-capital aggre-gate. The lower level of the sector’s production function features the possibilities of trade-offs between labour and capital services that were specified with the constant elasticity of substitution (CES) function.
The coefficients of TFP improvements were assigned to the labour-capital aggre-gate. Taking into account zero substitution between production factors and interme-diate inputs,TFP improvements let producers to decrease their consumption of both labour and capital per unit of output. It results in reduction of production costs, gives producers a competitive advantage in terms of price setting and leads to lower prices for consumers. Economy-wide effects arise because improved technologies create new production possibilities and increase economic growth.
Taking into account that sectors’ export supply to the NUTS2 regions is determined by import demand of these regions (see Figure 4), we can dismiss the constant elastic-ity of transformation (CET) function of output transformation to the regional markets. However, the non-EU aggregate cannot be treated as one of model’s regions. Even though a SAM for ROW can be constructed using a GTAP database (Badri Narayanan et al., 2012), adding the ROW region to RHOMOLO would create computational dif-ficulties, since model would be calibrated to a SAMs of 270 small regions with small numbers that represent transactions and one ROW region with large numbers. Hence, following the approach of Whalley and Yeung (1984), function of sectors’ supply to the ROW was replaced with a function of export demand from the Rest of the World.
2.2. Regional Armington good
Following Armington (1969), commodities of the same type that were produced in different origins are considered to be imperfect substitutes. Therefore, domestically pro-duced and imported goods are combined in a CES function. Trade and transport margins

Regional Impacts of non-R&D Innovation Expenditures across the EU Regions... 99
Investigaciones Regionales, 29 (2014) – Pages 91 to 111
(ttm) were applied to the domestic sales and imports from the EU regions. Following this specification, the structure of the regional Armington good is depicted in Figure 4.
Figure 4. Structure of regional Armington good
Armington good
ttm
Domesticsales
Imports from theregion AT11
Imports from theregion UKN0
Imports fromthe ROW
...
CES
ttm ttmImports
Following the information provided in the regional SAMs, a composite of do-mestically produced and imported goods is consumed by sectors, as intermediate goods, households, the government, and investment sector.
2.3. Budget balance and structure of household consumption
According to the information, which was provided in the regional SAMs, re-gional households supply labour and capital services, pay income taxes, receive net transfers from the public sector, and also net transfers from abroad. After deducting taxes, transfers and savings, the disposable income is used to maximize utility of households’ consumption. Households save a fixed proportion of their income. The final goods that are consumed by households were combined with the Cobb-Douglas (CD) function that allows substitutability among the inputs. The structure of regional household consumption is described in Figure 5.
Figure 5. Structure of regional household consumption
Household consumption
LMNOP
CD
JK
GHIF
CDE
AB
where AB-Agriculture, CDE-Manufacturing and energy, F-Construction, GHI-Transport, JK- Financial services and LMNOP-Non-market services.

2.4. Budget balance and structure of public consumption
According to the SAMs, income of regional government consists of taxes on sectors’ output, sectors’ consumption of labour, capital services, taxes on regional investment good, income taxes, net transfers from abroad and net transfers from re-gional households.
The structure of regional public disposable revenue was specified in a similar manner to that of households. In the model we assume fixed tax rates and constant public consumption of final goods. Hence, public savings are determined as a re-sidual. Final goods were combined with a Leontief (Lt) function. The structure of regional public consumption is described in Figure 6.
Figure 6. Structure of regional public consumption
Public consumption
LMNOP
Lt
JK
GHIF
CDE
AB
where AB-Agriculture, CDE-Manufacturing and energy, F-Construction, GHI-Transport, JK- Financial services and LMNOP-Non-market services.
2.5. Investment sector
Investment sector combines Armington goods in fixed proportions. Savings-in-vestment balance is achieved by household, public savings and also savings from the EU and ROW.
2.6. ROW closure
Following the (small open economy) SOE assumptions, any of the NUTS2 re-gions doesn’t influence prices in the non-EU market. Therefore, we formulated the EU balance of trade as net exports to the ROW. We fix the ROW savings keeping the real exchange rate flexible, so that ROW price adjusts to bring about equilib-rium. Savings from the EU are set exogenously and valued using a producer price index.

Regional Impacts of non-R&D Innovation Expenditures across the EU Regions... 101
Investigaciones Regionales, 29 (2014) – Pages 91 to 111
3. NR&D-TFP elasticities and their link to RHOMOLO
3.1. Econometric estimations of the influence of non-R&D innovation ex-penditures on TFP growth across EU countries
A number of studies using firm-level data to evaluate the impact of non-R&D in-novation expenditures on firms’ productivity have been carried out (see, for example Crepon et al., 1998, Janz et al., 2004, Lööf and Heshmati, 2002). From a macroeco-nomic perspective, the standard approach to evaluate the impacts of innovation on economic growth is to regress the TFP improvements on R&D endowments. How-ever, this approach does not take into consideration the influence of non-R&D activ-ities on TFP. In the EU, a sizable part of innovation, such as production engineering or design work, purchases of advanced machinery, licenses, minor modifications in products or processes, etc. is attributed to activities other than R&D (non-R&D). Non-R&D activities shift firms’ production frontiers upwards and, therefore, have similar impact on TPF compared with the R&D ones.
López-Rodríguez and Martínez (2014) envisaged a way to evaluate the impacts of non-R&D investments on total factor productivity at a country level by combining the micro and macro approaches. The main conceptual departure of López-Rodríguez and Martínez (2014) from the traditional endogenous growth theory is to consider the non-R&D innovation activities as important drivers of TFP improvements. However, the main difficulty of this approach is associated with obtaining the right empirical counterparts for non-R&D endowments in the regression equation.
Linking the Eurostat data on business expenditures on R&D, three issues of the Community Innovation Survey (CIS04, CIS06, and CIS08) for private innovation expenditures and business expenditures on non-R&D and DG Regio data on public funding for non-R&D activities, López-Rodríguez and Martínez (2014) built a proxy for non-R&D endowments at country level. Data on TFP came from the Cambridge Econometrics and EU KLEMS (2011); data for R&D investments and the set of con-trol variables were obtained from the Eurostat.
López-Rodríguez and Martínez (2014) proposed the following structural equa-tion for estimating TFP elasticities with respect to the R&D and non-R&D invest-ments:
~Ai(t) = g 0 Irdi(t – 1) + g 1 (IRDi(t – 1) IRDi (t – 1)) + g 2IRDi
2 (t – 1)Ai(t)
= g 3 IRDi(t) + g 4 IRDi(t)2 + mXi (t) + ui (t),
where:
i = index of EU member states;t = one-year time index:
~Ai(t) = TFP growth rate in the year t;Ai(t)

102 Diukanova, O. and López-Rodríguez, J.
Investigaciones Regionales, 29 (2014) – Pages 91 to 111
g 0, g 1, g 2, g 3, g 4, = the coefficients;m = row vector of coefficientsIRDi(t) = R&D intensities (R&D/GDP) in the year t;INRDi(t) = non R&D intensities (NR&D/GDP) in the year t;Xi(t) = colum vector of control variables;ui(t) = regression error.
The econometric estimates were conducted for a panel of 26 EU countries for the years 2004, 2006 and 2008 using the pooled least squares approach. The coefficients in the regression can be used to obtain the elasticities of TFP with respect to R&D and non-R&D expenditures.
With the linear specification of the previous equation (that is, without the term INRDi(t)), the non-R&D-TFP elasticity was defined as g 3 + g 1 IR
–D, where Ir–d is the
average value of the R&D intensities across the sample. The paper presents several sets of results, in terms of absorptive capacity linked to R&D, interactions between R&D and non-R&D, the effects of the distance to the technological leader, etc. The result from Lopez-Rodríguez and Martínez (2014) we use in our simulations is the estimation of g 3 + g 1 IR
–D which can be referred to as the TFP elasticity with respect
to non-R&D investments. This estimation lies in the interval (0.15-0.18). The esti-mated values of TFP elasticity with respect to R&D expenditures are almost twice as higher and lie in the interval of (0.30-0.33) 2. The estimated values of elasticities were used to project TFP improvements due to non-R&D innovation expenditures funded by ECP in the NUTS2 regions during 2014-2023. In the next subSection we present the approach to incorporate the TFP elasticities into RHOMOLO.
3.2. Incorporation of TFP elasticities with respect to non-R&D expendi-tures into RHOMOLO
Several approaches can be used to simulate productivity improvements with a CGE model. When econometric estimates are available, productivity changes can be approximated by changes in labour or capital productivity. However, this approach can produce misleading results, since CGE models assume non-zero elasticities of substitution between labour and capital. For example, decrease in the consumption of capital due to increased productivity of capital can be offset with increased consump-tion of labour, and vice versa. These effects can render rather unpredictable impacts on simulated economy.
This deficiency can be avoided by considering the measure of total factor pro-ductivity improvements which defines how efficiently all production factors are used. The term «total factor productivity» is also called the Solow residual (Solow, 1956) in the growth accounting exercises.
2 Similar numbers were obtained in other studies that evaluated the influence of R&D investments on TFP, see for instance Kancs and Siliverstovs (2012).

Regional Impacts of non-R&D Innovation Expenditures across the EU Regions... 103
Investigaciones Regionales, 29 (2014) – Pages 91 to 111
In order to simulate the shocks on sector’s TFP due to the planned European Co-hesion Policy investments on non-R&D innovation activities over the period 2014-2023 we employed the López-Rodríguez and Martínez (2014) estimations of TFP elasticity with respect to the non-R&D investments g 3 + g 1 IR
–D). The following for-
mulas were used in the model to estimate the upward shifts on TFP due to non-R&D innovation expenditures:
gTFPreg(t) = (g 3 + g 1 IRD) ( NR&Rreg(t – 1) ), GDPbaureg(t – 1)
TFPreg(t) = gTFPbaureg (t) + gTFPreg (t)
where:
reg = NUTS2 region;t = one-year time index:gTFPreg(t) = annual regional TFP growth rate due to non-R&D innovation
expenditures;TFPreg(t) = the growth rate induced by the non-R&D investments;g 3 + g 1 IR
–D = elasticity of TFP improvements with respect to non-R&D
investments;NR&Dreg(t – 1) = the amount of non-R&D innovation expenditures assigned
during the year t – 1;GDPbaureg(t – 1) = forecasted regional GDP in the year t – 1;gTFPbaureg(t) = baseline annual regional TFP growth in the region reg during
the year t.
It is important to mention that regional non-R&D funding was not distributed ho-mogenously among the regions within the period of 2014-2023, but allowed for high spikes from one year to the next. Since DG Regio allocates investments according to the N+3 rule, granting the regional authorities three additional years beyond the pro-gramming period to absorb the funds, we present simulation results until the year of 2023. Although we only had information on distribution of non-R&D funds among the regions, and not among the sectors that operate in these regions, we applied same rates of TFP growth to all sectors within each region.
4. Evaluation of 2014-2020 non-R&D innovation expenditures
Overall, the results of the simulations with the RHOMOLO model demonstrated small positive impacts on regions’ GDP (see Figure 7) and household consumption (see Figure 8).
On the whole, the magnitude of these impacts positively correlates with the amount of non-R&D investments, received by the regions; see Figure 1 and Fi-gure 2. In fact, the major recipients of ECP funds, belong to a category of less de-

104 Diukanova, O. and López-Rodríguez, J.
Investigaciones Regionales, 29 (2014) – Pages 91 to 111
Figure 7. Changes in regional GDP due to the non-R&D innovation funding in 2003, % relative to the baseline projections
(0.000 - 0.003)
(0.003 - 0.014)
(0.014 - 0.025)
(0.025 - 0.036)
Figure 8. Changes in regional cumulative household consumption due to non-R&D innovation expenditures in 2003, % relative to the baseline projections
(0.000 - 0.006)
(0.006 - 0.016)
(0.016 - 0.032)
(0.032 - 0.06)
Source (Figure 7 and Figure 8): own elaboration based on simulations with RHOMOLO.

Regional Impacts of non-R&D Innovation Expenditures across the EU Regions... 105
Investigaciones Regionales, 29 (2014) – Pages 91 to 111
veloped (i.e. regions with GDP per capita below 75% of the EU average (European Commission, 2013).
Figure 7 and 8 demonstrate that the most benefited regions are mainly located in Eastern Europe. The results suggest that by 2023, the GDP of the Eastern EU regions would grow up to 0.036% while in the EU-15 regions GDP would increase up to 0.015% relative to the baseline projections. The cumulative household consumption of the NMS regions would grow up to 0.06% by 2023 and in the old member states it will increase up to 0.02% relative to the baseline projections.
Regions with the highest growth of household consumption and GDP are the BG31, BG32, BG33, BG34 and BG42 regions of Bulgaria, HU23, HU31, HU32 and HU33 regions of Hungary, PL31, PL32, PL33, PL34, PL42, PL61 and PL62 regions of Poland, CZ04, and CZ07 regions of Czech Republic, RO21 and RO41 regions of Romania (the European Nomenclature of Territorial Units for Statistics is provided in the Eurostat, (2006)).
Although the model results did not indicate production losses relative to the baseline projections, in reality improvements in comparative advantage of some re-gions can affect competitiveness of other regions. Clearly, holding everything else equal, if a region receives meagre allocation of non-R&D investments per its GDP, the computed TFP rate would be lower, hence production cost would be higher, and sales would be less competitive compared with the regions that have higher TFP growth rates. As a result, production of a less competitive and more expensive good could decline.
Certainly, when relative prices change, to some extent regions can substitute own production with imports. However, the possibility of such substitution depends on or-igin of imports which determines trade and transport cost. Clearly, policy at the level of a single EU region may not affect prices, export demand and supply of imports from the non-EU world. Therefore, regions with high intensity of imports and exports from/to the non-EU countries (and especially those that basically re-export imported goods, with little value added) can maintain their levels of welfare even when their intra-EU trading partners lower demands for exports and increase import prices. Of course, the extent of such trade depends on transport costs and on the degree of trade protectionism.
In order to investigate the economic impacts of policy intervention on the pro-duction structure in the two groups of new and old EU member states we displayed the results of simulations with RHOMOLO at more aggregate level. The Figure 9 and Figure 10 demonstrate that all sectors in the NMS displayed much higher growth rates compared with the sectors in the EU-15.
In the NMS, the non-R&D funding stimulated the most agricultural production, manufacturing and energy, transport and financial services (the hike in sectors’ pro-duction during 2018-2021 is induced by the higher allocation of funding during this period). In the EU-15, non-R&D investments had quite smooth and insignificant impact on all industries. As we can see from the charts above, impacts on production growth rates in the NMS during 2015-2023 were within the range of 0.01%-0.6%,

106 Diukanova, O. and López-Rodríguez, J.
Investigaciones Regionales, 29 (2014) – Pages 91 to 111
while in the old member states they ranged from 0.0004% to 0.007% above the baseline.
Figure 9. Sectors’ production in the new EU member states, % relative to the baseline projections
0.07
0.06
0.05
0.04
0.03
0.02
0.01
0.002015 2016 2017 2018 2019 2020 2021 2022 2023
Agriculture
Transport
Manufacturing and energy
Financial services
Construction
Non-market services
Figure 10. Sectors’ production in the EU-15, % relative to the baseline projections
0.07
0.06
0.05
0.04
0.03
0.02
0.01
0.002015 2016 2017 2018 2019 2020 2021 2022 2023
Agriculture
Transport
Manufacturing and energy
Financial services
Construction
Non-market services
Source (Figure 9 and Figure 10): own elaboration based on computer simulations with RHOMOLO

Regional Impacts of non-R&D Innovation Expenditures across the EU Regions... 107
Investigaciones Regionales, 29 (2014) – Pages 91 to 111
Analysing the results we should consider that due to the absence of sector-spe-cific estimates, the same rates of TFP growth were applied to all sectors within each region. Such modelling exercise demonstrated improvements in the efficiency of production that were not accompanied with any noticeable structural changes in the NMS and EU-15 country blocks, see Table 2.
Table 2. Shares of sector’s output in the total production in the two groups of EU regions in 2007 and in 2023
AgricultureManufac-
turingConstruc-
tionTransport
Financial services
Non- market services
EU-15, 2007 0.02 0.32 0.08 0.20 0.23 0.16
Difference between 2007 and 2023 –3.07E-07 1.68E-06 1.13E-06 –4.84E-07 –1.73E-06 –9.03E-07
nMS, 2007 0.04 0.41 0.09 0.20 0.15 0.11
Difference between 2007 and 2023 –3.84E-06 –1.28E-05 3.05E-06 4.78E-06 3.31E-06 5.46E-06
Source: own estimates based on regional SAMs and computer simulations with RHOMOLO.
As shown in Table 2, throughout the model horizon the New Member States have much higher shares of agriculture and manufacturing, and much lower shares of fi-nancial and non-market services in the total production compared with the EU-15 countries.
Such production structure was inherited from the period of central planning, which endowed most of the NMS with the oversized and inefficient industrial sector and grossly underdeveloped financial and non-market services (Havlik, 2013).
The inter-dependency between sectoral structure and aggregate economic per-formance has been widely acknowledged in the economic theory. As postulated in the structural bonus hypothesis (Timmer and Szirmai, 2000), during the process of economic development, economies upgrade from industries with comparative-ly low value added to those with a higher contents of value added. In line with the argument of unbalanced growth introduced by Baumol (1967) and Baumol et al. (1985), labour-intensive industries that provide social, cultural and public services have limited capacity to increase labour productivity through technolog-ical progress or rise in capital intensity. That explains why services, especially non-market services (i.e. administration, education, research and health services provided by government and non-profit institutions) generally exhibit slower pro-ductivity growth compared with producing (manufacturing, construction and en-ergy) sectors.
Taking into account that allocation of labour and capital favours industries with higher productivity, TFP improvements induced by non-R&D innovation subsidies
108 Diukanova, O. and López-Rodríguez, J.
Investigaciones Regionales, 29 (2014) – Pages 91 to 111
can act as transmission channel through which the ECP policy can affect industry composition and overall economic performance in the NMS. Therefore, differenti-ated allocation of EU funding among the NUTS2 regions can be viewed as an in-strument to reduce the discrepancies in production structure and regional welfare between the NMS and EU-15.
Clearly, other categories of ECP funding have influence on the economic perfor-mance of sectors and regions, and policy impacts will also depend on the distribution of the ECP funds among the sectors. However, we don’t aim to combine all ECP pol-icies in a single model run. Although this exercise would provide insights about the impact of ECP intervention on regional production or GDP and permits to evaluate the success of ECP funding in general, it is difficult to link the impacts with a specific policy. Apart from economic priorities, allocation of ECP funds within the NUTS2 regions and the overall economic impacts of EU funding largely depend on quality of local public administration.
5. Conclusions and Policy Implications
In this paper we have carried out computer simulations with the RHOMOLO model to evaluate the ex-ante short- and long- run impacts of non-R&D innovation expenditures allotted to the NUTS2 regions of the EU27 within the 2014-2020 EU Cohesion Policy budget.
Improvements in regions’ total factor productivity were considered as the main transmission channel through which the ECP funding of non-R&D innovation acti-vities affects regional economies. This assumption was widely acknowledged in the empirical firm’s innovation literature. Very recently López-Rodríguez and Martínez (2014) contributed to the macro literature on innovation by estimating the TFP elas-ticity values with respect to the non-R&D investments. These estimations were used to translate the values of non-R&D funds allotted to the NUTS2 regions during 2014-2020 into their total factor productivity improvements and to run the simulations with the RHOMOLO model.
Model results show that cumulative production in the NUTS2 regions would grow relative to the baseline projections. The highest growth is achieved in the less developed regions of the new member states. This outcome is explained by the fact that regions that belong to Bulgaria, Poland, Check Republic, Slovakia, Slovenia, Romania, Hungary and the Baltic countries receive the largest injection of funds-both in absolute and per GDP terms, and therefore, have the highest rate of total factor productivity improvements.
All sectors in the new member States displayed much higher growth rates com-pared with the EU-15. In the old member states, non-R&D investments had quite smooth and insignificant impact on all industries. This outcome is in line with the European Cohesion Policy objective of speeding up the convergence of the least de-veloped Member States.

Regional Impacts of non-R&D Innovation Expenditures across the EU Regions... 109
Investigaciones Regionales, 29 (2014) – Pages 91 to 111
Acknowledgements
The authors are grateful to Andries Brandsma and two anonymous reviewers for their helpful comments and suggestions. The authors would also like to thank the participants of XXXIX Conference of Regional Studies (Oviedo, 2013) and the Geography of Innovation Conference (Utrecht, 2014) for their feedback. The com-ments made during the seminars and the workshops at Universidad de Granada, Ab-erystwyth University, Universidad de Las Palmas de Gran Canaria and CERDI at Auvergne University are highly appreciated. The second author also thanks for the fi-nancial support provided by the Spanish Ministry of Science and Innovation through the Grant ECO2011-28632. The usual disclaimer applies.
The second author also acknowledges the support received from the Spanish Ministry of Science and Innovation through the project ECO2011-28632 and Xunta de Galicia through the project EM2014/051.
References
Aghion, P., and Howitt, P. (2007): «Capital, Innovation and Growth accounting», Oxford Re-view of Economic Policy, 23, 1, pp. 79-93.
Arundel, A.; Bordoy, C., and Kanerva, M. (2008): «Neglected innovators: how do innovative firms that do not perform R&D innovate?», Results of an analysis of the Innobarometer 2007 survey No. 215, INNOMetrics Thematic Paper.
Badri Narayanan, G., Aguiar, A., and McDougall, R. (eds.) (2012): Global Trade, Assistance, and Production: The GTAP 8 Data Base, Center for Global Trade Analysis, Purdue Univer-sity, https://www.gtap.agecon.purdue.edu/databases/v8/default.asp.
Baumol, W. J. (1967): «Macroeconomics of Unbalanced Growth: The Anatomy of Urban Cri-sis», The American Economic Review, 57, pp. 415-426.
Baumol, W. J.; Blackman, S. A. B., and Wolff, E. N. (1985): «Unbalanced Growth Revisit-ed: Asymptotic Stagnancy and New Evidence», the American Economic Review, 75(4), pp. 806-817.
Bayar, A. (2007): Study on the Impact of Convergence Interventions 2007-2013, working pa-per, ULB/EcoMOD.
Brandsma, A.; Kancs, D.; Monfort, P., and Rillaers, A. (2013): «RHOMOLO: A Region-al-based Spatial General Equilibrium Model for Assessing the Impact of Cohesion Pol-icy», JRC-IPTS Working Paper Series JRC81133, European Commission, DG Joint Re-search Centre.
Bye, B.; Heggedal, T.-R.; Fæhn, T., and Strøm, B. (2006): «A CGE model of induced tech-nological change: A detailed model description», Statistics Norway, http://www.ssb.no/a/english/publikasjoner/pdf/doc_200611_en/doc_200611_en.pdf.
CIS: Community Innovation Survey, http://epp.eurostat.ec.europa.eu/statistics_explained/in-dex.php/Innovation_statistics.
Crepon, B.; Duguet, E., and Mairesse, J. (1998): «Research, Innovation and Productivity: An Econometric Analysis at the Firm Level», Economics of Innovation and New Technology, 7(2), pp. 115-158.
EU Commission (2009-2013): Infrastructure - TEN-T, http://ec.europa.eu/transport/themes/infrastructure/index_en.htm.
— (2010): Europe 2020 Strategy, http://ec.europa.eu/europe2020/indexen.htm.

110 Diukanova, O. and López-Rodríguez, J.
Investigaciones Regionales, 29 (2014) – Pages 91 to 111
Christodoulakis, N., and Kalyvitis, S. (2000): «The effects of the Second Community Support Framework 1994-99 on the Greek Economy», Journal of Policy Modelling, 22(5) pp. 611-624.
EU Commission (2010): The Lisbon Treaty: a comprehensive guide, http://europa.eu/legisla-tion_summaries/institutional_affairs/treaties/lisbon_treaty/index_en.htm.
— (2013): The future of the ESF: 2014-2020, http://ec.europa.eu/esf/main.jsp?catId=62& langId=en.
EU KLEMS (2011): Growth and Productivity Accounts, http://www.euklems.net/.Eurostat (2006): Regions in the European Union. Nomenclature of territorial units for statistics
NUTS 2006/EU-27, http://epp.eurostat.ec.europa.eu/cache/ITY_OFFPUB/KS-RA-07-020/EN/KS-RA-07-020-EN.PDF.
— (2012): R&D expenditure, http://epp.eurostat.ec.europa.eu/statistics_ explained/index.php/R_%26_D_expenditure.
— (2013): Concepts and Definitions. Eurostat’s Concepts and Definitions Database, http://ec.europa.eu/eurostat/ramon/index.cfm?TargetUrl=DSP_PUB_WELC.
Griliches, Z., (1995): «R&D and productivity: econometric results and measurement issues», in: Stoneman, P. (ed.), Handbook of Economics of Innovation and Technological Change, Blackwell, Oxford, pp. 52-89.
— (2000): R&D, Education and Productivity, Harvard Univ. Press.Grossman, G., and Helpman, E. (1991): «Trade, knowledge spillovers, and growth», European
Eco- nomic Review, Elsevier, vol. 35(2-3), pp. 517-526.— (1994): «Endogenous Innovation in the Theory of Growth», Journal of Economic Perspec-
tives, American Economic Association, vol. 8(1), pp. 23-44.Havlik, P. (2013): «The Structural Change and Economic Growth in the New EU Member
States», Vienna Institute for International Economic Studies, http://wiiw.ac.at/structural-change-productivity-and-employment-in-the-new-eu-member-states-p-302.html.
Hervas-Oliver, J. L., and Albors-Garrigos, J. (2011): Making sense of innovation by R&D and non-R&D innovators in low technology contexts: a forgotten lesson for policymakers, Instituto Valenciano de Investigaciones Económicas WP-EC 2011-06, http://www.ivie.es/downloads/docs/wpasec/wpasec-2011-06.pdf.
Hirsch-Kriensen, H. (2008): «Low-Tech Innovations», Industry and Innovation, 15, 1, 19-43.Janz, N.; Lööf, H., and Peters, B. (2004): «Firm Level Innovation and Productivity - Is There
a Common Story Across Countries?», Problems and Perspectives in Management, vol. 2, pp. 184-204.
JRC IPTS (2005-2010): TRANS-TOOLS Documentation, http://energy.jrc.ec.europa.eu/tran-stools/documentation.html.
— (2009-2013): Regional Economic Modelling, http://ipts.jrc.ec.europa.eu/activities/re-search-and-innovation/regional_ economic_modelling.cfm.
Kancs, d’A., and Siliverstovs, B.(2012): «R&D and Non-linear Productivity Growth of Heter-ogeneous Firms», LICOS Discussion Paper, 321.
Khan, M.; Luintel, K. B., and Theodoridis, K. (2010): «How Robust is the R&D - Productivity relationship? Evidence from OECD Countries», WIPO economic research working papers, http://www.wipo.int/export/sites/www/econ_stat/en/economics/pdf/wp1.pdf.
Krístková, Z. (2013): «Analysis of private R&D effects in a CGE model with capital varieties: the case of the Czech republic», the Czech journal of economics and finance, vol. 63, issue: 3, pp. 262-287.
Lööf, H.; Heshmati, A. (2002): «Knowledge Capital and Performance Heterogeneity: A Firm-Lev-el Innovation Study», International Journal of Production Economics, 76(1), pp. 61-85.
López-Rodríguez, J., and Martínez, D. (2014): «Looking beyond the R&D effects on innova-tion: The contribution of non-R&D activities to total factor productivity growth in the EU», European Commission JRC Technical Reports, JRC86054.

Regional Impacts of non-R&D Innovation Expenditures across the EU Regions... 111
Investigaciones Regionales, 29 (2014) – Pages 91 to 111
Mairesse, J.; and Sassenou, M. (1991): «R&D and Productivity: A Survey of Econometric Studies at the Firm Level», NBER Working Paper 3666, NBER Working Paper Series, Na-tional Bureau of Economic Research, Cambridge, MA.
Martin, C.; Mulas-Granados, C., and Sanz, I. (2005): «Spatial distribution of R & D expend-iture and patent applications across EU regions and its impact on economic cohesion», Investigaciones regionales (6), 41-62.
Mathiesen, L. (1985): «Computation of Economic Equilibrium by a Sequence of Linear Com-plementarity Problems», Mathematical Programming Study, North-Holland, pp. 144-162.
OECD (2001): Measuring Capital: Measuring of Capital Stocks, Consumption of Fixed Capi-tal and Capital Services.
Ortega-Argilés, R., and Moreno, R. (2009): «Evidence on the role of ownership structure on firms’ innovative performance», Investigaciones regionales (15), 231-250.
Rammer, C.; Czarnitzki, D., and Spielkamp, A. (2009): «Innovation Success of Non-R&D-Per-formers: Substituting Technology by Management in SMEs», Small Business Economics, vol. 33, pp. 35-58.
Rammer, C.; Koehler, C.; Schwiebacher, F.; Murmann, M.; Kinkel, S.; Kirner, E.; Schubert, T., and Som, O. (2011): Studien zum deutschen Innovationssystem, Nr. 15-2011, Experten-kommission Forschung und Innovation (EFI), TU Berlin.
Romer, P. (1990): «Endogenous Technological Change», Journal of Political Economy, vol. 98(5), pp. 71-102.
Rutherford, T. F. (2002): Lecture Notes on Constant Elasticity Functions, University of Colo-rado, www.gamsworld.eu/mpsge/debreu/ces.pdf.
Solow, R. M. (1956): «A Contribution to the Theory of Economic Growth», Quarterly Journal of Economics, 19, 33-41.
Som, O. (2012): Innovation without R&D. Heterogeneous Innovation Patterns of Non-R&D- Performing Firms in the German Manufacturing Industry, Springer Gabler, Wiesbaden.
Som, S.; Kirner, E., and Jäger, A. (2010): Absorptive capacity of non-R&D-intensive firms in the German manufacturing industry, Paper presented at the 35th DRUID Celebration Con-ference 2013, Barcelona, Spain, June 17-19.
Timmer, M. P., and Szirmai, A. (2000): «Productivity Growth in Asian Manufacturing: the Structural Bonus Hypothesis Examined», Structural Change and Economic Dynamics, 11, 371-392.
Varga, A.; Járosi, P., and Sebestyén, T. (2011): Modeling the economic impacts of regional R&D subsidies:The GMR-Europe model and its application for EU Framework Program policy impact simulations, http://dimetic.dime-eu.org/dimetic_files/Vargaetal2011.pdf.
Varga, J., in’t Veld, J. (2009): «A Model-based Analysis of the Impact of Cohesion Policy Expenditure 2000-06: Simulations with the QUEST III endogenous R&D model», DG Economic and Financial Affairs, European Commission, European Economy Economic Papers, no. 387, http://ec.europa.eu/economy_finance/research/macroeconomic_models_en.htm.
Whalley, J., and Yeung B. (1984): «External Sector Closing Rules in Applied General Equilib-rium Models», Journal of International Economics, 16, 123-38.
WIOD (2010): World Input-Output Database, http://www.wiod.org/new_site/database/wiots.htm.


© Investigaciones Regionales, 29 (2014) - Pages 113 a 128Section Articles
Economic impact of the European Funds in Extremadura during the period 2007-2013
Julián Ramajo Hernández*, Miguel Ángel Márquez Paniagua**, Francisco Javier De Miguel Vélez***
ABSTRACT: Although the evaluation of European Union regional policy is nec-essary to improve the effectiveness of the operational programmes, it is not usual to find studies comparing the efficiency of two programming periods for the case of a particular region. This could be explained by the fact that, at regional level, the study of the efficiency of the European funds during two different programming periods faces many different problems; for example, it entails the consideration of both adequate and homogeneous data, and similar methodology. The goal of this paper is twofold. The first goal is to estimate the economic impact of the European Union structural and cohesion funds received by Extremadura, a Spanish conver-gence objective NUTS II region, during the programming period 2007-2013. To this end, it is provided a multipliers analysis based on a Social Accounting Matrix (SAM) of Extremadura for the year 2000. Secondly, the paper will compare the returns obtained in terms of output and employment by the European funds re-ceived in Extremadura during the periods 2000-2006 and 2007-2013. Our results allow quantifying the effects of the EU regional policy, showing and comparing the efficiency for these two programming periods.
JEL Classification: C67; F35; H50; H54; R58.
Keywords: regional policy; European Funds; social accounting matrix; Extrema-dura.
Impacto económico de los Fondos Europeos en Extremadura en el período 2007-2013
RESUMEn: Aunque la evaluación de la política regional de la Unión Europea es necesaria para mejorar la eficiencia de los programas operativos, no es común en-contrar estudios que comparen la eficacia de dos períodos de programación para el caso de una región. Esto puede deberse a que a nivel regional el estudio de la efica-
113
Received: 27 january 2014 / Accepted: 6 august 2014.
* [email protected]. Departamento de Economía (Universidad de Extremadura).** [email protected]. Departamento de Economía (Universidad de Extremadura).*** [email protected]. Departamento de Economía (Universidad de Extremadura).

114 Ramajo Hernández, J., Márquez Paniagua, M. Á. and De Miguel Vélez, F. J.
Investigaciones Regionales, 29 (2014) – Pages 113 to 128
cia de los fondos europeos se enfrenta a problemas de diversa índole; por ejemplo, se necesita disponer de datos adecuados y homogéneos y una metodología similar. El objetivo de este trabajo es doble. El primer objetivo es estimar, para el periodo de programación 2007-2013, el impacto económico de los fondos estructurales y de cohesión recibidos por Extremadura, una región NUTS II española del tipo «convergencia». Para este fin, se utiliza un análisis de multiplicadores basado en una matriz de contabilidad social (SAM) de Extremadura para el año 2000. En segundo lugar, el artículo compara los retornos obtenidos en términos de output y empleo debido a los fondos europeos recibidos en Extremadura durante los pe-ríodos de programación 2000-2006 y 2007-2013. Nuestros resultados permiten cuantificar los efectos de la política regional europea comparando la eficiencia para esos dos períodos de programación.
Clasificación JEL: C67; F35; H50; H54; R58.
Palabras clave: política regional; Fondos Europeos; matriz de contabilidad social; Extremadura.
1. Introduction
The general objective of the European regional policy is to promote economic and social progress and to help disadvantaged regions adjust to the challenges of the single market, eliminating disparities in living standards. In accordance with these objectives, the gaps among the development levels of the various Regions have to be narrowed. This implies that poorest European regions are the main priority of European Cohesion policy. These regions share some identical economic indicators; among others, higher unemployment rate, poor basic infrastructure and lack of ser-vices for businesses and individuals. It is therefore of most critical importance to evaluate the impact of Structural Funds in order to help the European Commission in the design of future policy. Nevertheless, the evaluation of the economic effects of European funds is a complex and difficult task. It is not easy to estimate the full so-cioeconomic costs and benefits resulting from European Funds since the information needed for a cost-benefit analysis does not exists. Hence, to measure the aggregate effects or European regional policies, the range of evaluation methods uses to apply top-down approaches like econometric models, input-output models and computable general equilibrium models.
In the context of the European NUTS II regions, territories with Gross Domestic Product per capita less than 75% of the EU average were defined as «Objective 1» regions in the 2000-2006 programming period, while in the 2007-2013 programming period, this type of regions were renamed as ‘«Convergence Objective» regions (Euro-pean Commission, 2007). One of the great unresolved debates about European regional policy is the extent to which the regions that fall below the 75% of European Union Gross Domestic Product per capita is achieving higher levels of employment and eco-nomic growth. Policy makers need answer to these questions. The measure of these achievements would let us assess the effectiveness of the European funds. Nevertheless,
Economic impact of the European Funds in Extremadura during the period 2007-2013 115
Investigaciones Regionales, 29 (2014) – Pages 113 to 128
although the evaluation of European Union regional policy is necessary to improve the effectiveness of the operational programmes, it is not usual to find studies comparing the efficiency of two programming periods for the case of a particular region. This could be explained by the fact that, at regional level, the study of the efficiency of the European funds during two different programming periods face many different prob-lems; for example, it entails the consideration of both adequate and homogeneous data, similar methodology, and the difficulty to isolate the effects of the programmes.
This paper centers his focus on the analysis of the economic impact of the Europe-an Funds in Extremadura, an Autonomous Community in the southwest of Spain. The region of Extremadura was considered as one of the «Objective 1» priority areas for the European Regional Policy during the period 2000-2006, being a «Convergence Objec-tive» region for the programming period 2007-2013. The goal of this paper is twofold. The first goal is to estimate the economic impact of the European Union structural and cohesion funds received by Extremadura, a Spanish convergence objective NUTS II re-gion, during the programming period 2007-2013. Secondly, the paper will compare the returns obtained in terms of output and employment by the European funds received in Extremadura during two programming periods (2000-2006 and 2007-2013). It needs to be emphasized that it is not usual to find empirical contributions about this type of comparison in the literature (see for instance Cancelo et al., 2009). Thus, it is neces-sary to design a methodological approach that will quantify the economic impacts of European Funds in Extremadura. Concretely, a multisectoral economic model based on a Social Accounting Matrix (SAM) is used to quantify the output and employment effects derived from the structural and cohesion funds that this region received due to its ‘Convergence Region’ situation. The multipliers analysis was based on a Social Accounting Matrix (SAM) of Extremadura for the year 2000. Our results allow quan-tifying the effects of the EU regional policy, showing and comparing the efficiency for these two programming periods. For the programming period 2000-2006, and as base of comparison, the results presented in Márquez et al. (2010) will be considered. The comparison will provide an interesting information since it will be shown empirical ev-idence about the efficiency of two programming periods for the case of Extremadura: the only region in Spain considered to be less developed (with a GDP per inhabitant below 75% of the EU27 average) for the next programming period 2014-2020.
The rest of the paper is organized as follows. Section 2 tries to place the Ex-tremadurian region within the Spanish context, and the basic features of the economy of Extremadura are described. Additionally, it is shown a brief description of the EU regional policy for the program period 2007-2013. Section 3 presents the method-ological issues and discusses the main results. Finally, Section 4 concludes.
2. Extremadura in the context of the European regional policy
To properly situate Extremadura in the European context, firstly, this section describes the basic features of this regional economy. Therefore, subsection 2.1

116 Ramajo Hernández, J., Márquez Paniagua, M. Á. and De Miguel Vélez, F. J.
Investigaciones Regionales, 29 (2014) – Pages 113 to 128
analyzes the evolution of the regional economy of Extremadura in the period 2000-2013. More specifically, the evolution of production, employment and GDP per head for both the Spanish economy and the regional economy of Extremadu-ra are presented. Secondly, in subsection 2.2, the main features of the European funds received by Extremadura in the programming period 2007-2013 are briefly shown.
2.1. The economy of Extremadura in the period 2000-2013
Extremadura has an area of 41,634 km2, which accounts for 8.3% of the Spanish area. Its population in recent years has been around 1,080,000 inhabitants; thus, the population density of Extremadura approaches 26 Inhabitants/Km² (less than a third of the Spanish population density). Since the population of Extremadura is distribut-ed sparsely and irregularly along the territory, it is easy to corroborate that the demo-graphic base of Extremadura has got a great weakness. In short, it is possible to infer that domestic demand is not going to be a stimulus when conducting an increase of regional productive activities in Extremadura. Even more, this diagnosis is related to a low birth rate, high aging population and, as it will become clear later, low levels of income.
Gross Domestic Product (GDP) in constant terms (euros of year 2000) for Ex-tremadura reflects a cumulative growth for 2000-2006 of 20.77% (in average terms, Spain grew 22.19%). This increase has its translation in a lost of weight of the econ-omy of Extremadura in terms of share on the Spanish economy, decreasing from 1.62% to 1.60%. In the same way, during the period 2007-2013 Extremadura showed a negative growth of –6.79% (Spain had a negative growth of –5.88%). This fact im-plies, again, that the economy of Extremadura lost relative importance with respect to the Spanish economy (from 1.60% to 1.59%). Consequently, in terms of GDP, it is not possible to find an advance in the Extremadura economy, since Extremadura lost relative weight within the national context. In addition, Table 1 displays the growth rates of GDP (in constant terms) for Extremadura and Spain in the two programming periods.
With respect to employment, in 2000 Extremadura had about 335,100 employ-ments, and 386,400 in 2006 (an increase of 15.31% in the programming period 2000-20006). At national level, this increase was 22.5%. This way, the labor force of Extremadura lost relevance at national level (from 2.04% in 2000 to 1.92% in 2006). On the other hand, in the case of the programming period 2007-2013, Ex-tremadura had about 395,000 employments in 2007 and 332,400 in 2013 (decreas-ing –15.85%). Nevertheless, employment in Spain decreased during this period about –16.71%. Thus, employment in Extremadura was 1.91% of the total Spanish employment in 2007, being about 1.93% in 2013. From Table 2, the growth of em-ployment in Extremadura showed a best relative behavior during the programming period 2007-2013.

Economic impact of the European Funds in Extremadura during the period 2007-2013 117
Investigaciones Regionales, 29 (2014) – Pages 113 to 128
Finally, Table 3 displays the GDP per capita for both programming periods. In the first programming period, Extremadura had a GDP per capita about the 61.46% of the Spanish average in 2000 (Spanish average =100%), increasing in 2006 (66.01%). In the second programming period, Extremadura increased from 66.76% in 2007 to 68.06% in 2013. As stated before, and for the 2007-2013 period, the European Commission approved a Regional Operational Programme for Extremadura that falls within the framework laid out for the «Convergence Objective» regions.
Table 1. Growth of GDP (Constant € of the year 2000) during the period 2000-2013
Programming period 2000-2006
2001 2002 2003 2004 2005 2006
Extremadura 2.32% 3.34% 3.17% 3.07% 3.54% 3.74%
Spain 3.67% 2.71% 3.09% 3.26% 3.58% 4.08%
Net change –1.35% 0.63% 0.08% –0.19% –0.04% –0.34%
Programming period 2007-2013
2007 2008 2009 2010 2011 2012 2013
Extremadura 3.86% 1.56% –3.23% –0.02% –0.93% –2.85% –1.45%
Spain 3.48% 0.89% –3.83% –0.20% 0.05% –1.64% –1.22%
Net change 0.38% 0.67% 0.60% 0.18% –0.98% –1.21% –0.23%
Note: Net change is difference between the growth of GDP in Extremadura and the growth of GDP in Spain.
Source: Own elaboration from National Statistics Institute of Spain (2014).
Table 2. Growth of employment during the period 2000-2013
Programming period 2000-2006
2001 2002 2003 2004 2005 2006
Extremadura 1.37% 2.30% 2.62% 2.80% 3.44% 1.90%
Spain 3.23% 2.46% 3.21% 3.62% 4.15% 3.98%
Net change –1.86% –0.16% –0.59% –0.82% –0.71% –2.08%
Programming period 2007-2013
2007 2008 2009 2010 2011 2012 2013
Extremadura 2.23% 0.48% –5.62% –1.12% –2.48% –4.93% –3.20%
Spain 3.03% –0.13% –6.49% –2.21% –1.87% –4.23% –2.96%
Net change –0.80% 0.61% 0.87% 1.09% –0.61% –0.70% –0.24%
Note: Net change denotes the difference between the growth of employment in Extremadura and the growth of employment in Spain.
Source: Own elaboration from National Statistics Institute of Spain (2014).

118 Ramajo Hernández, J., Márquez Paniagua, M. Á. and De Miguel Vélez, F. J.
Investigaciones Regionales, 29 (2014) – Pages 113 to 128
2.2. The EU regional policy for Extremadura 2000-2013
This section is aimed at describing the basic features of the finished Regional Operational Programme for Extremadura for the 2007-2013 programming period, comparing it with the earlier cohesion policy program 2000-2006.
The Structural Funds and Cohesion Funds are the main budgetary items of the European Union to support economic and social cohesion in the member states. Regional and structural policies are the second largest item in the budget after the agricultural funds; they cover more than a third of the budget. They are set-up as multi-annual initiatives, and the period from 2000 to 2013 consists of two pro-gramming periods, the first running from 2000 to 2006 and the second from 2007 to 2013.
In Márquez et al. (2010) a synthesis of the general lines of the programming period 2000-2006 for Extremadura is presented. On the other hand, the Region-al Operational Programme for Extremadura in the period 2007-2013 contemplates seven priorities (see European Commission, 2014). Priority 1 is «Development of the Knowledge Economy». Under this priority, the primary objectives are «to con-tribute to increasing economic competitiveness, to increase the effectiveness of the regional system of science and technology, and to increase the level of information and communication technology as a fundamental axis of the knowledge economy.» Priority 2 is «Entrepreneurial Development and Innovation», that is, «to safeguard existing competitive enterprises and to create favourable conditions for their expan-sion as well as for business start-ups and relocations». Priority 3 is «Environment, Natural Surroundings, Water Resources and Risk Prevention», being the strategic objectives «to protect and preserve biodiversity, improve water infrastructures and waste management, prevent risks and control pollution». Priority 4: «Transport and Energy», where the specific objectives are «to improve transport infrastructure for better traffic flows through the road network and integrate Extremadura into the
Tabla 3. GDP per capita during the period 2000-2013
Programming period 2000-2006
2000 2001 2002 2003 2004 2005 2006
Spain 21.05 21.50 21.70 21.91 22.37 22.70 23.30
Extremadura 12.94 13.19 13.64 14.06 14.47 14.86 15.38
Percentage 61.46% 61.36% 62.84% 64.16% 64.68% 65.49% 66.01%
Programming period 2007-2013
Spain 23.85 23.57 22.38 22.20 22.13 21.74 21.53
Extremadura 15.92 16.06 15.47 15.40 15.23 14.81 14.65
Percentage 66.76% 68.14% 69.15% 69.38% 68.81% 68.15% 68.06%
Note: Percentage denotes the ratio between the GDP per capita in Extremadura and the GDP per capita in Spain.
Source: Own elaboration from National Statistics Institute of Spain (2014).

Economic impact of the European Funds in Extremadura during the period 2007-2013 119
Investigaciones Regionales, 29 (2014) – Pages 113 to 128
national communication network; to promote and improve the communication net-work with neighbouring territories; to promote accessibility within the region; to encourage energy efficiency and the use of renewable sources». Priority 5: «Local and Urban Sustainable Development», where the main objectives are «to implement new integrated urban projects for cities in Extremadura and to preserve its histor-ical, artistic, natural and cultural heritage.» Priority 6: «Social Infrastructures»; where the programme seeks «to guarantee access to education and health systems and to extend the welfare infrastructure and services to all members of society». Priority 7: «Technical Assistance», that is, technical assistance in implementing the Programme.
In this context, Table 4 shows a summary of the total funds received by Extremad-ura during the programming periods 2000-2006 and 2007-2013 in constant euros of 2000. From Table 4, the total amount of funds in the 2007-2013 period decreased 8.21% with respect to the 2000-2006 period (from 3,007,203 thousands of euros to 2,760,078 thousands of euros). Thus, the total funds were obtained from four funds: European Regional Development Fund (ERDF), Cohesion Fund (CF), European So-cial Fund (ESF), and European Agricultural Fund for Rural Development (EAFRD). The ERDF is the most important fund in both programming periods. It is important to highlight that the EAFRD increased its relevance with respect to the ESF during the programming period 2007-2013.
Table 4. Summary of European Funds received in 2000-2013 by Extremadura (total expenditure, including European and national co-financing;
thousands of 2000 constant euros)
ERDF CF ESF EAFRD Total Funds
Total 2000-2006 1,836,980 0 710,822 459,401 3,007,203
2007 449 0 66,686 0 67,135
2008 4,610 0 66,568 168,357 239,535
2009 232,041 0 67,560 166,947 466,548
2010 396,984 0 68,767 113,875 579,626
2011 278,884 0 70,403 138,627 487,914
2012 222,680 0 72,251 138,454 433,385
2013 183,743 27,190 138,167 136,835 485,935
Total 2007-2013 1,319,391 27,190 550,402 863,095 2,760,078
Note: ERDF = European Regional Development Fund; CF = Cohesion Fund; ESF = European Social Fund; EAFRD = European Agricultural Fund for Rural Development.
Source: Own elaboration using data from the Ministry of Economy and Finance of Spain and the Government of Extremadura.
120 Ramajo Hernández, J., Márquez Paniagua, M. Á. and De Miguel Vélez, F. J.
Investigaciones Regionales, 29 (2014) – Pages 113 to 128
3. Economic effects of the EU Funds received by Extremadura during the period 2007-2013: a SAM multiplier analysis
For the case of the Spanish regional economy of Extremadura, this section pro-vides the estimation of the economic impact in terms of output and employment induced by the EU Funds received during the programming period 2007-2013.
These effects are computed by using a multisectoral economic model that takes into account the interrelationships between the different agents in the economy. Be-sides, unlike aggregate macroeconomic models, the multisectoral models provide re-sults with a high disaggregation detail. For this purpose, one of the most used tools in the literature is the input-output analysis. However, a slightly different methodology is employed, in our opinion, more complete and suitable. Specifically, the multiplier effects are obtained from a social accounting matrix (SAM) for Extremadura (see, for example, Lima and Cardenete, 2005).
The main difference between the input-output model and the SAM multipliers model is that the latter includes a wider closure model and interdependence effects ignored by the former. In particular, while the traditional input-output demand model only considers the interdependences related to the productive sphere, i.e. the inter-dependences between production sectors, the SAM multipliers model also includes the primary factors income, its distribution among the institutions (mainly the house-holds) and other income redistribution transactions.
Therefore, the SAM multipliers model can be seen as a generalization of the input-output model, providing a more precise assessment of the effects produced by exogenous changes (as it is considered in this paper). However, the SAM multipli-ers model also has some limitations that must be considered for the results; mainly, the linear relationships among the economic agents, exogenous prices, and no sup-ply constraints in the economy. Some of these limitations are resolved in the more complex computable general equilibrium models (for some recent applications, see, among others Monrobel et al., 2013, and Cardenete et al., 2014).
3.1. The SAM for Extremadura and the SAM multipliers model
In our application, the SAM of reference comes from the work of De Miguel et al. (2009), where a social accounting matrix for Extremadura for the year 2000 (SAMEXT2000) was constructed. Due to statistical limitations, in particular the lack of updated and surveyed input-output tables, this SAM came of updating a previous SAM for Extremadura for the year 1990 by using the cross-entropy method. The orig-inal SAMEXT2000 incorporated 37 accounts, including 6 different taxes and a wide sectoral disaggregation, and showing 16 production sectors as well as 9 commodities.
In this paper, the original SAMEXT2000 was aggregated to make easier the as-signments of exogenous income injections, resulting a total of 11 accounts. So, the
Economic impact of the European Funds in Extremadura during the period 2007-2013 121
Investigaciones Regionales, 29 (2014) – Pages 113 to 128
production system was divided into 5 sectors that represent the productive activity of the Extremadurian economy: agriculture, manufacturing, construction, sales oriented services, and non-sales oriented services. Additionally, the social accounting matrix shows two primary factors (labor and capital) and a generic account containing the revenues and expenditures of the households. The aggregate capital account shows all the sources of investment and savings of all the economic agents. The govern-ment account includes their relationships with other agents, basically through taxes and transfers. Finally, it was considered an account for the foreign sector, in which relations with external agents (both from the rest of Spain and from the world) are collected. Table 5 shows the 11-accounts SAM that served as basis for the multipliers model described below.
Formally, the development of a SAM multiplier model requires distributing the accounts in the matrix between endogenous and exogenous accounts; that is, it is nec-essary to establish a closure model assumption. Traditionally, the accounts relative to the government, the capital (saving/investment) accounts, and the foreign sector ac-counts are considered exogenous. On the other hand, the remaining accounts (usually the primary factors, households and production sectors) are considered endogenous. In our case, given the importance of the public sector in the reception and generation of spending associated with the European Funds, the government account has been considered as endogenous. This way, the only exogenous accounts are those related to savings/investment accounts, and the external sector. 1
Regarding its mathematical formulation, the SAM multipliers model basically transforms the accounting constraints that have to be verified by the social account-ing matrix, expressing them in a different way (to relate exogenous injections with endogenous incomes). Thus, the basic equation of the model can be expressed as follows (Pyatt and Round, 1979):
y = (I – A)–1 x = M · x (1)
where y denotes a n-column vector of endogenous incomes, A represents a nxn ma-trix of average propensities of spending, x is a n-column vector of exogenous invest-ment injections, I is an identity matrix, and M is the multipliers nxn matrix obtained from the original SAM that is usually known as accounting multipliers matrix (see Table 6).
These multipliers can be decomposed into several values that reflect the role of the different types of interdependencies. Different methods for multipliers decompo-sition have been proposed in the literature. In our case, taking as point of departure the work of Cardenete and Sancho (2003), we propose a decomposition technique that allows differentiating between direct effects and non-direct effects. The resulting expression is as follows:
M = (I + A) + (M – I – A) = MDE + MNDE (2)
1 Alternative closure model assumptions can be found in the literature, depending on the topic con-sidered. For example, Polo, Roland-Holst and Sancho (1991) and Ferri and Uriel (2000) also include the saving/investment account into the endogenous part of the model.
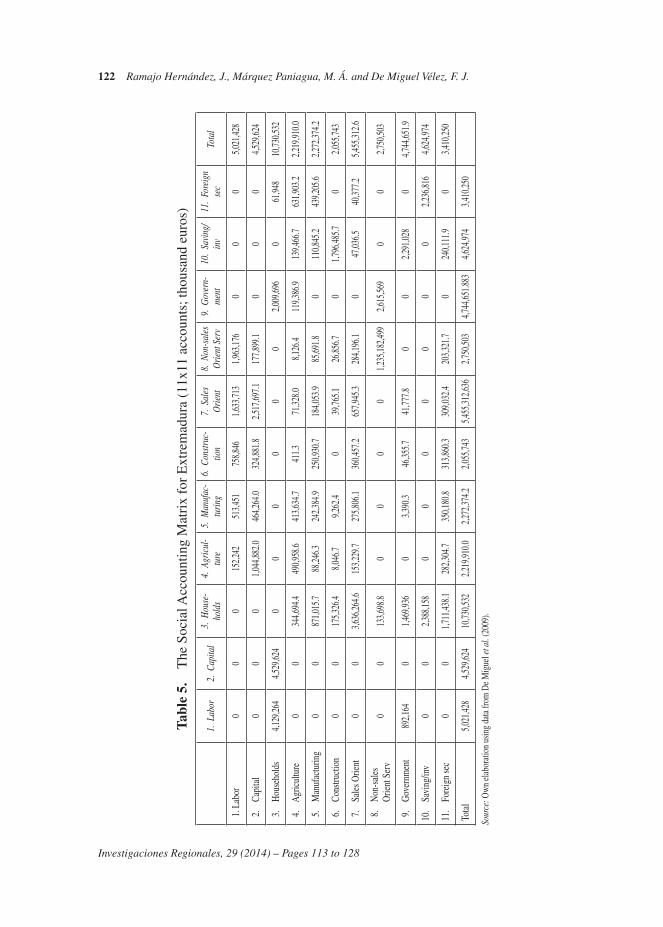
122 Ramajo Hernández, J., Márquez Paniagua, M. Á. and De Miguel Vélez, F. J.
Investigaciones Regionales, 29 (2014) – Pages 113 to 128
Tabl
e 5.
T
he S
ocia
l Acc
ount
ing
Mat
rix
for
Ext
rem
adur
a (1
1x11
acc
ount
s; th
ousa
nd e
uros
)
1. L
abor
2. C
apita
l3.
Hou
se-
hold
s4.
Agr
icul
-tu
re5.
Man
ufac
-tu
ring
6. C
onstr
uc-
tion
7. S
ales
O
rient
8. N
on-s
ales
O
rient
Ser
v9.
Gov
ern-
men
t10
. Sa
ving
/in
v11
. Fo
reig
n se
cTo
tal
1. L
abor
00
015
2,242
513,4
5175
8,846
1,633
,713
1,963
,176
00
05,0
21,42
8
2.
Capi
tal
00
01,0
44,88
2.046
4,264
.032
4,881
.82,5
17,69
7.117
7,899
.10
00
4,529
,624
3.
Hou
seho
lds
4,129
,264
4,529
,624
00
00
00
2,009
,696
061
,948
10,73
0,532
4.
Agr
icul
ture
00
344,6
94.4
490,9
58.6
413,6
34.7
411.3
71,32
8.08,1
26.4
119,3
86.9
139,4
66.7
631,9
03.2
2,219
,910.0
5.
Man
ufac
turin
g0
087
1,015
.788
,246.3
242,3
84.9
250,9
30.7
184,0
53.9
85,69
1.80
110,8
45.2
439,2
05.6
2,272
,374.2
6.
Cons
truct
ion
00
175,3
26.4
8,046
.79,2
62.4
039
,765.1
26,85
6.70
1,796
,485.7
02,0
55,74
3
7.
Sale
s Orie
nt0
03,6
36,26
4.615
3,229
.727
5,806
.136
0,457
.265
7,945
.328
4,196
.10
47,03
6.540
,377.2
5,455
,312.6
8.
Non
-sal
es
Orie
nt S
erv
00
133,6
98.8
00
00
1,235
,182,4
992,6
15,56
90
02,7
50,50
3
9.
Gov
ernm
ent
892,1
640
1,469
,936
03,3
90.3
46,35
5.741
,777.8
00
2,291
,028
04,7
44,65
1.9
10.
Savi
ng/in
v0
02,3
88,15
80
00
00
00
2,236
,816
4,624
,974
11.
Fore
ign
sec
00
1,711
,438.1
282,3
04.7
350,1
80.8
313,8
60.3
309,0
32.4
203,3
21.7
024
0,111
.90
3,410
,250
Tota
l5,0
21,42
84,5
29,62
410
,730,5
322,2
19,91
0.02,2
72,37
4.22,0
55,74
35,4
55,31
2,636
2,750
,503
4,744
,651.8
834,6
24,97
43,4
10,25
0
Sour
ce: O
wn
elab
orat
ion
usin
g da
ta fr
om D
e Mig
uel e
t al.
(200
9).

Economic impact of the European Funds in Extremadura during the period 2007-2013 123
Investigaciones Regionales, 29 (2014) – Pages 113 to 128
Tabl
e 6.
T
he a
ccou
ntin
g m
ultip
liers
mat
rix,
M
1. L
abor
2. C
apita
l3.
Hou
seho
lds
4. A
gric
ultu
re5.
Man
ufac
-tu
ring
6. C
onst
ruct
ion
7. M
arke
t Se
rvic
8. N
on M
ark
Serv
9. G
over
nmen
t
1.
Labo
r1.
630.
560.
560.
610.
790.
970.
911.
330.
99
2.
Cap
ital
0.62
1.60
0.60
1.17
0.92
0.80
1.12
0.70
0.67
3.
Hou
seho
lds
2.22
2.24
2.24
1.83
1.74
1.79
2.06
2.02
2.11
4.
Agr
icul
ture
0.19
0.18
0.18
1.45
0.41
0.19
0.20
0.19
0.22
5.
Man
ufac
turin
g0.
270.
260.
260.
281.
340.
360.
290.
280.
27
6.
Con
stru
ctio
n0.
050.
050.
050.
040.
041.
040.
050.
050.
05
7.
Mar
ket S
ervi
c0.
960.
950.
950.
890.
920.
992.
031.
000.
98
8.
Non
Mar
k Se
rv0.
360.
260.
260.
220.
240.
270.
281.
310.
84
9.
Gov
ernm
ent
0.60
0.41
0.41
0.37
0.39
0.45
0.46
0.52
1.47
Sour
ce: O
wn
elab
orat
ion
usin
g da
ta fr
om D
e Mig
uel e
t al.
(200
9).

124 Ramajo Hernández, J., Márquez Paniagua, M. Á. and De Miguel Vélez, F. J.
Investigaciones Regionales, 29 (2014) – Pages 113 to 128
MDE can be called direct effects matrix because it captures the direct interde-pendencies among the different endogenous accounts, including the intermediate in-puts. MNDE incorporates the non-direct effects, i.e. it is a residual matrix because it includes the rest of interdependencies. Therefore, MNDE captures the indirect effects among the production sectors; the induced effects arising from the feedback among the households and the production sectors through income and consumption; and the non-direct effects linked to the government through taxes, income transfers and public consumption.
3.2. The results
Once exposed the SAM multipliers model, we can use the previous equations to calculate the effects that the EU Funds had in Extremadura during the programming period 2007-2013. In our analysis, we show the following results: first, increases in the domestic production, distinguishing between direct and no direct effects; and second, increases in the volume of employment. In all cases, we adopt the closure model assumption discussed above. Thus, the primary factors labor and capital, the representative group of households, the production sectors and the public sector were considered endogenous accounts.
From the previous equation of the SAM multipliers model, it is possible to ex-press it in incremental terms as follows:
∆y = M · ∆x (3)
Then, to obtain the economic impact on domestic output (vector ∆y) associated with investments derived from the EU Funds, it is necessary to allocate these invest-ments to the different exogenous accounts (vector ∆x). The accounting multipliers matrix M acts as a «bridge» matrix to determine the corresponding effects on domes-tic production.
To compute the employment effects we consider the following equation:
∆e = E · M · ∆x (4)
where E represents a diagonal matrix whose generic term Eii represents the quantity of employed in each sector for every euro of domestic output in this sector (employ-ment coefficients).
In our application, the temporal distribution of flows that makes up the European Funds was considered, estimating the yearly effects of the investments under the programming period 2007-2013. Therefore, it was necessary to build seven 9-vectors of exogenous injections (∆x(2007), ∆x(2008),..., ∆x(2013)), which has supposed to distribute for each year the investments among the nine endogenous accounts of our model. To do this, the specific objectives of each fund were considered, assigning all the investments projects listed in the programming period to specific production sectors or to the public sector. 2
2 See Delgado (2012) and Monrobel (2010) for the assignment rules.

Economic impact of the European Funds in Extremadura during the period 2007-2013 125
Investigaciones Regionales, 29 (2014) – Pages 113 to 128
Taking the accounting multipliers matrix for Extremadura M (Table 6) and the yearly exogenous sectoral spending ∆x(2007), ∆x(2008),..., ∆x(2013), the effects on the domestic production and the employment were obtained for each of the seven years considered. These multipliers effects are shown in Table 7.
With respect to the output impact, the accumulated estimated effects (7,581 mil-lions of constant euros) should be assessed in relative terms with respect to the entire amount of European Funds received by Extremadura during the period 2007-2013
Table 7. Impact of the European Funds received in the programming period 2007-2013 on the domestic production (constant € of the year 2000) and on the
employment of Extremadura
TOTAL EFFECTS
Production Employment
2007
Direct 54,929,615
Non direct 116,871,199
Total 171,800,814 4,381
2008
Direct 283,617,186
Non direct 386,212,664
Total 669,829,850 16,402
2009
Direct 515,949,377
Non direct 772,261,987
Total 1,288,211,364 31,757
2010
Direct 615,432,951
Non direct 971,942,810
Total 1,587,375,761 39,293
2011
Direct 528,578,190
Non direct 812,670,639
Total 1,341,248,829 33,136
2012
Direct 472,178,144
Non direct 720,100,773
Total 1,192,278,917 29,442
2013
Direct 522,348,481
Non direct 808,315,485
Total 1,330,663,966 32,597
Total 2007-2013
Direct 2,993,033,944
Non direct 4,588,375,557
Total 7,581,409,501
Source: Own elaboration.
126 Ramajo Hernández, J., Márquez Paniagua, M. Á. and De Miguel Vélez, F. J.
Investigaciones Regionales, 29 (2014) – Pages 113 to 128
(over 2,760 million of constant euros). Thus, this implies an output/investment ratio of 2.75, that to say, an efficiency coefficient of output over the period 2007-2013 of 2.75 euros of domestic production for every euro of European Funds entering in the Extremadurian economy. The highest output effects values are for the years 2009 to 2013, those with the most relevant investments executed.
It is relevant to make a comparison with the European Funds received in the pre-vious programming period 2000-2006. It implied a cumulative effect of approximate-ly 6,600 million of euros constant of the year 2000, derived from a total investment of about 3,000 million of constant euros (Márquez et al., 2010). Therefore, the output/investment ratio for the period 2007-2013 (2.75) has been higher than the previous one (2.18 million of euros per million invested for the period 2000-2006).
Regarding the multipliers decomposition, the effects related to the non-direct interdependences are clearly higher than the direct effects for all years considered. In global terms (period 2007-2013), they are more than 50% greater than the direct effects (4,588 millions of euros against 2,993 millions).
As for the effects on employment in each of the years considered (last column of Table 7), it can be seen again that the greatest impact occurs during the period 2009-2013. During these years, they were created (or maintained) a number of em-ployments near or higher than 30,000 employments, with a peak impact about 39,000 employments in year 2010. If we assess the estimates obtained in terms of the vol-ume of investments received each year, the results suggest an efficiency coefficient of employment of 67, that is, for every million of constant euros invested they were generated or maintained around 67 employments in the region during the period 2007-2013.
During the previous period 2000-2006, the greatest impact occurred in the period 2003-2006, where they were generated (or maintained) near or above 24,000 employ-ments, with a peak impact of 32,000 jobs in 2006 (Márquez et al., 2010). Overall, the employment/investment ratio was 49 on average; this implied the generation or maintenance of approximately 49 employments for every million of euros invested.
In summary, and in terms of the benefits obtained from the generation or mainte-nance of production and employment, the estimates indicate the existence of a greater efficiency coefficients in the programming period 2007-2013 than during the previ-ous programming period 2000-2006.
4. Conclusions
the main purpose of this paper was to compare the returns obtained in terms of output and employment by the European funds received in the Spanish region of Ex-tremadura during the programming periods 2000-2006 and 2007-2013. Extremadura was defined as «Objective 1» regions in the 2000-2006 programming period, while in the 2007-2013 programming period, this region was a «Convergence Objective» region. The main contribution of this paper is that our analysis allows quantifying the

Economic impact of the European Funds in Extremadura during the period 2007-2013 127
Investigaciones Regionales, 29 (2014) – Pages 113 to 128
effects of the EU regional policy on a regional economy, showing and comparing the efficiency for two different programming periods.
As a first step, the paper has analyzed the impact of the European Funds in the period 2007-2013 on the Convergence Region of Extremadura by means a multi-pliers analysis based on a Social Accounting Matrix (SAM) of Extremadura for the year 2000. It is important to emphasize the reduction (–8.21%) of the total amount of European Funds in the period 2007-2013 with respect to the 2000-2006 period. Be-sides, although in both programming periods the ERDF is the most important fund, the EAFRD increased its relevance with respect to the ESF during the programming period 2007-2013.
From the estimations of the impacts of the European investments on the regional economy of Extremadura in 2007-2013, some results can be highlighted. In cumula-tive terms, the regional production of Extremadura increased above 7,580 millions of constant euros of the year 2000. This amount should be assessed in terms of the total investment, around 2,760 millions of euros constants of the year 2000. This implies an investment/total effect ratio of 2.75. The highest effects appeared in the period 2009-2013, since the main part of both the ERDF and the EAFRD were executed during this period.
Regarding employment effects caused by the European funds on the regional economy of Extremadura in 2007-2013, the greatest impact is, once again, on the period 2009-2013, where they were generated (or maintained) a number of employ-ments of around 30,000. The most important effect was in 2010, with an impact in terms of employments over 39,000. By sectors, the employment effects were gen-erated mainly in the market services sector, followed by non-market services and agriculture.
Considering the amount of investment received each year in Extremadura, the results of the programming period on the Extremadurian employment indicate that, for every million euros (in constant euros of the year 2000) invested in the period 2007-2013, they were generated or maintained on average around 67 employments in the region of Extremadura.
Finally, the main empirical contribution of this paper was to compare the re-turns obtained in terms of output and employment by the European funds received in the Spanish region of Extremadura during the programming periods 2000-2006 and 2007-2013. In this sense, it is important to remark that, in comparison with the economic impact of European funds received in the previous programming period (2000-2006), our estimations indicate higher efficiency coefficients for the 2007-2013 period. This efficiency is shown in both, in terms of the benefits obtained in generation of new production (an output/investment ratio of 2.18 in 2000-2006 vs 2.75 in 2007-2013), and in terms of maintenance or creation of new employments (employment/investment ratio of 49 for the period 2000-2006 vs 67 in 2007-2013).
To conclude, two final comments. First, it is necessary to highlight the impor-tance of the economic impact of the European Funds in Extremadura in terms of economic growth and employment in the two programming periods. Second, it needs

128 Ramajo Hernández, J., Márquez Paniagua, M. Á. and De Miguel Vélez, F. J.
Investigaciones Regionales, 29 (2014) – Pages 113 to 128
to be emphasized that the evaluation of the impacts of the two programming periods on the economy of Extremadura shows a more efficient period during the period 2007-2013.
References
Cancelo, J. R.; Faíña, J. A, and López-Rodríguez, J. (2009): «Measuring the Permanent Impact of European Structural Funds on Peripheral Objective 1 Regions: The Case of Galicia» European Planning Studies, 17, 1535-1558.
Cardenete, M. A., and Sancho, F. (2003): «Evaluación de multiplicadores contables en el mar-co de una matriz de contabilidad social regional», Investigaciones Regionales, 2, 121-140.
Cardenete, M. A.; Delgado, M. C., and Lima, M. C. (2014): «The Structural Funds in Andalu-sia for the Programming Period 2014-2020: Time for Tightening Belts», European Plan-ning Studies, vol. 22, Issue 3, 563-586.
Delgado, C. (2012): «Estimación del impacto de los fondos europeos en Andalucía a través de modelos de equilibrio general: 2007-2020», Tesis Doctoral, Universidad Pablo de Olavide, Sevilla.
De Miguel, F. J.; Cardenete, M. A., y Pérez, J. (2009): «Effects of the tax on retail sales of some fuels on a regional economy: a computable general equilibrium approach», Annals of Regional Science, 43 (3), 781-806.
European Commission (2007): «Fourth Report on Economic and Social Cohesion», Commis-sion of the European Union, Brussels.
— (2014): «Operational Programme “Extremadura”», Regional Policy, European Union, available in http://ec.europa.eu/regional_policy/index_en.htm.
Ferri, J., y Uriel, E. (2000): «Multiplicadores contables y análisis estructural en la matriz de contabilidad social. Una aplicación al caso español», Investigaciones Económicas, vol. XXIV (2), 419-453.
Lima, M. C., y Cardenete, M. A. (2005): «Análisis de impacto de los Fondos FEDER recibidos por una economía regional: un enfoque a través de Matrices de Contabilidad Social», Pre-supuesto y Gasto Público, 40, 113-131.
Márquez, M. A.; Ramajo, J., y De Miguel, F. J. (2010): «Evaluación de los efectos económ-icos de los fondos estructurales del período 2000-2006 sobre Extremadura», Papeles de Economía Española, 123, 191-205.
Monrobel, J. R. (2010): «Elaboración de un modelo de equilibrio general aplicado a la Comuni-dad de Madrid. Estimación del impacto de los fondos europeos 2007-2013 en la economía de la región», Tesis Doctoral, Universidad Rey Juan Carlos, Madrid.
Monrobel, J. R.; Cámara, A., and Marcos, M. A. (2013): «Modeling European Regional Policy 2007-2013: Applied General Equilibrium Analysis of the Economic Impact on the Madrid Region», European Planning Studies, vol. 21, No. 2, 264-280.
Polo, C.; Roland-Holst, D., y Sancho, F. (1991): «Descomposición de multiplicadores en un modelo multisectorial: una aplicación al caso español», Investigaciones Económicas, Vvol. XV (1), 53-69.
Pyatt, G., y Round, J. (1979): «Accounting and fixed price multipliers in a social accounting matrix framework», The Economic Journal, 89, 850-873.

© Investigaciones Regionales, 29 (2014) – Pages 129 to 138Section Articles
The Effects of European Structural Funds in the Spanish Regions Using CGE Models: a review
María Teresa Álvarez-Martínez *
ABSTRACT: This paper reviews the few regional studies on the impact of Eu-ropean Structural funds in Spain using Computable General Equilibrium (CGE) Models. While the models in these studies are widely used to evaluate the effects of very different public policies, they rarely have been used to quantify the impact of the Structural funds. In the pioneer papers elaborated for Madrid and Andalusia, the effects of the funds have been simulated through an exogenous change of final demand. I suggest avoiding any accounting of exogenous shocks in final demand of non-affected sectors by more-realistically splitting investment into various cap-ital goods and evaluating the short-run effects of increasing investment in them.
JEL Classification: C68; R53.
Keywords: Structural Funds; Computable General Equilibrium model; Investment goods.
Los efectos de los fondos estructurales europeos en las regiones españolas utilizando modelos CGE: una revisión
RESUMEn: Este documento revisa los escasos estudios regionales sobre el im-pacto que los fondos estructurales europeos han tenido en España utilizando mo-delos de Equilibrio General Aplicados (MEGAs). A pesar de que estos modelos se han utilizado ampliamente para evaluar el impacto de diferentes políticas públicas, raramente se han utilizado para cuantificar el impacto de los fondos estructurales. En los estudios originariamente realizados para Madrid y Andalucía, los efectos de los fondos se han simulado mediante una variación exógena en la demanda final. Mi sugerencia para evitar alterar con perturbaciones exógenas la demanda final de sectores productivos no directamente afectados es desagregar la inversión en bienes de inversión y evaluar los efectos de corto plazo de aumentar la inversión en bienes de inversión específicos.
129
Received: 24 march 2014 / Accepted: 2 july 2014.
* The views expressed are purely those of the author and may not in any circumstances be regarded as stating an official position of the European Commission.
European Commission, Joint Research Centre (JRC), Institute for Prospective Technological Studies (IPTS), and Rutgers University, New Jersey.
130 María Teresa Álvarez-Martínez
Investigaciones Regionales, 29 (2014) – Pages 129 to 138
Clasificación JEL: C68; R53.
Palabras clave: Fondos estructurales; Modelos de Equilibrio General Aplicados; Bienes de inversión.
1. Introduction
European Structural funds are composed in two groups: the European Regional Development Fund (ERDF), established in 1975, and the European Social Fund (ESF) in 1958. The latter program aims to raise labor skills and education among vulnerable populations, while the first fosters economic growth by improving public infrastruc-ture and other productive investments. They constitute the oldest regional policy in-struments in the EU, and both programs try to reduce regional disparities and to speed up economic growth. Total resources allocated to these funds have changed over time, absorbing an average of 15% of the EU budget from 1986 through 1993 to almost 33% from 2006 to 2013. In 2007-2013 Spain received around 10% of the total EU funds.
The funds have been always allocated according to priority objectives. From 1993 to 1999, European regions were classified via seven different objectives (Ob-jective 1, Objective 2, Objective 3, Objective 4, Objective 5a, Objective 5b and Ob-jective 6) ranging from those regions whose development lagged behind the EU av-erage (Objective 1) to those regions with very low population densities that needed help in promoting economic development (Objective 6). Since the 2000-2006 period, there have been only three different objectives. Objective 1 promotes development in regions with a GDP per capita below 75% of the EU-25 average GDP per capita. The areas in Objective 1 receive almost two thirds of the Structural funds budget. Objective 2 aims to help social and economic conversion in regions struggling with Structural difficulties. Finally, Objective 3 finances education and training programs in regions not included 1 in Objective 1 2.
Cumulatively, Spain has received a significant share of the funds since it joined the European Union in 1986. It is estimated to have received a total of more than 130.000 Million Euros 3 since it joined the Union (European Commission, 2006). Moreover, it ranks second country 4 in the level of funds obtained since 2007. In 2000-2006, eleven Spanish regions were classified as Objective 1: Galicia, Principado de Asturias, Castil-la y León, Castilla-La Mancha, Extremadura, Comunidad Valenciana, Andalusia, Re-gion de Murcia, Ceuta, Melilla and Canarias. Since then, however, just four of the re-gions —Galicia, Castilla-La Mancha, Extremadura and Andalusia— remained in that category in 2007-2013 and only one —Extremadura— in 2014-2020. These changes are explained by two effects: the EU’s phasing out and phasing in regions. The phas-
1 Regions classified as Objective 2 and Objective 3 are Madrid, Cataluña, Baleares, Navarra, etc.2 Recently, these Objectives have been renamed as: Convergence, Regional competitiveness and
employment and European territorial cooperation.3 Including Cohesion funds. Hübner, 2006.4 Poland is the first country. It received 19% of the funds in the time period 2007-2013.

The Effects of European Structural Funds in the Spanish Regions Using CGE Models: a review 131
Investigaciones Regionales, 29 (2014) – Pages 129 to 138
ing out effect is a statistical result of incorporating new countries into the distribution. Enlargement of the EU in 2004 and 2007 reduced the average GDP per capita, which immediately enabled several regions previously classified as Objective 1 to surpass the new GDP requirement, despite little movement in their GDP levels. This was the case for Asturias, Ceuta, Melilla and Murcia. Regions that phased in are those that actually improved their relative position and raised their GDP per capita above the average in the original EU-15. The three Spanish regions that phased in were Canarias, Castilla y León and Comunidad Valenciana. Regions that either phased in or out continued to receive transitory funds from 2007 through 2013. Regions in Spain classified as Objective 2, or Regional competitiveness and employment objective, are: Cantabria, Comunidad de Madrid, Pais Vasco, Navarra, Aragon, La Rioja, Cataluña and Baleares.
There is no doubt that Structural funds have been important in fostering econom-ic growth in Spain, especially in the regions directly receiving the funds. The resourc-es have been used to invest in public infrastructure: highways, roads, high-speed train tracks, sea ports, airports, schools, etc., but also in educational services. The effect of these funds is twofold. On the one hand, the installation and construction of the infrastructure creates a demand effect that raises production. The construction of a new highway raises labour demand for construction and related capital as well as for basic materials —such as concrete, stone, gravel, and tar— and other inputs, such as rental machinery, fuel, and communications services. On the other hand, once the infrastructure is in place, it generally enhances a productivity effect —in the case of roadways faster, more reliable transportation services— that affects all industries in the region as the time passes. Investment in social capital (hospitals, schools, etc.) and education services yield similar effects.
The impacts of final demand and productivity due to the Structural funds have been quantified in the economic literature using various different approaches, econo-metric (Mohl and Hagen 2010), input-output (Beutel, 2002) and CGE models (Gas-par and Pereira, 1992, Lolos et al., 1995). The latter have been used to evaluate not only the increase of final demand but also the supply effects on productivity and skilled labor supply. In Spain, the focus of this paper, the econometric approach has been intensively used (Sosvilla and Herce, 2003; Sosvilla and Murillo, 2005; Cancelo et al., 2009) and to a lesser extent input-output (I-O) models (Dones and Pérez, 2002) and social accounting matrix models (SAMs) (Lima and Cardenete, 2006; Cámara and Marcos, 2009; Márquez et al., 2010; Lima and Cardenete, 2009; Cardenete and Delgado, 2012).
Input-Output (I-O) models can capture direct, indirect, and induced effects that can result from shocks to final demand. They provide interesting sectoral effects but they are not as complete as those ex tolled by equivalent SAM models 5. SAMs are balanced square tables that reflect the circular flow of all income for a specific period. The incorporation of additional data on income redistribution enables fuller impact analysis of external shocks on endogenous variables. Nevertheless, I-O and SAM
5 Government income is almost always exogenous and changes in government incomes and non-res-ident income, for example, cannot recirculate in a single region I-O framework.

132 María Teresa Álvarez-Martínez
Investigaciones Regionales, 29 (2014) – Pages 129 to 138
models do not allow for substitution among inputs since they are based on a fixed, Leontief technology.
Computable general equilibrium (CGE) models are a combination of linear and nonlinear equations that optimize the behaviour of agents in an economy. Production technology is more generalized, at least allowing substitution among factor inputs. Substitution is enabled through variations in relative prices of the various inputs. To date (and to my knowledge), only four papers use CGE models to evaluate the impact of Structural funds in Spain 6: Lima and Cardenete (2008), Monrobel et al. (2013), Cardenete and Delgado (2013) and Cardenete et al. (2014). The objectives of this paper are to describe and critically review the main characteristics of the papers on Structural funds for the Spanish regions and to briefly summarize their main conclu-sions, their contributions and their main shortcomings. I also present an alternative way to evaluate part of the effects of the funds with a CGE model.
The rest of the paper is divided as follows. In Section 2, I depict the main char-acteristics of the four CGE regional papers elaborated for Madrid and Andalusia. In Section 3, I propose an alternative way to simulate the increase of public investment financed by Structural funds paying special attention to the final demand effects of infrastructures construction. Finally, some conclusions are presented in Section 4.
2. A critical review
In this section, I depict the main characteristics and conclusions derived from the pioneer papers elaborated for Madrid and Andalusia. These papers represent the first attempt to evaluate the general equilibrium effects of raising final demand due to the Structural funds in two Spanish regions.
2.1. Regional studies for Madrid and Andalusia
The paper elaborated by Monrobel et al. (2013) evaluates the impact of the struc-tural funds in Madrid for 2007-13. In the case of Andalusia, Lima and Cardenete (2008) evaluated their effects for the period spanning 2000-2006 using a static CGE model; Cardenete and Delgado (2013) repeated that effort for 2006-2013. More re-cently, Cardenete et al. (2014) enhanced the model by including dynamic relation-ships for investment, labour and capital.
Monrobel et al. (2013).The Madrid region contains the capital of Spain and has a predominantly urban population. It has never been classified as an Objective 1 region, but it does take advantage of structural funds via Objective 2. The funds are
6 RHOMOLO is a dynamic spatial CGE model developed by the European Commission to evaluate the effects of the Structural funds in 267 NUTS 2-level regions, of which 16 are in Spain. Since RHOM-OLO is not aimed to evaluate the effects of the funds in any particular region, it has not been included in the current review.

The Effects of European Structural Funds in the Spanish Regions Using CGE Models: a review 133
Investigaciones Regionales, 29 (2014) – Pages 129 to 138
aimed to transform Madrid into an attractive place to work and to spur both inno-vation and research activities. The paper elaborated by Monrobel et al., calibrates a static CGE model using a 2002 SAM for Madrid that was elaborated by the authors (SAMMD-2002, hereafter). They account for 27 productive industries, one represen-tative household, the corporate sector, one account for government and the foreign sector. There is an account for the Rest of the world and an account for taxes on products. VAT, other taxes on products and taxes on imports are not disentangled; therefore there are no price differences between imports and domestic or Spanish commodities. The production technology consist of a set of nested production func-tions wherein total supply is an «Armington combination» 7 of domestic production and imports in which there are constant returns to scale (CRS). It is a neoclassical model in which total investment 8 is determined by savings. That is, the model is a savings-driven such that the sum of households’ savings, corporate sector savings, government savings and the foreign current balance (FCB) determines the level of total investment.
According to the information in the ERDF Operational programme «Madrid» for 2007-2013, the funds are to foster knowledge, energy resources and transport services, local and urban sustainable development and technical assistance. In the simulations, these funds are distributed among the following industries included in the SAMMD-2002: Energy and mining, Transport material, Transport and communi-cations, etc. The total funds from the ESF are also aggregated and allocated to Cor-porate services, Education and Public administration. As I mentioned before, these shocks in final demand are included as an additional component that do not seem to affect market clearing conditions, Foreign/ Government savings, households con-sumption and private investment 9 prevailing investment from fictitious shocks. On the other hand, in this simulation, it is taken for granted there are exogenous final demand increases in Energy and mining products. If we look at the figure included in Spanish I-O Tables for 2002, this industry does not send any production to in-vestment. This means that in the model Structural funds cannot directly increase the amount of production used for investment from Energy and mining goods Instead the funds finance infrastructure that improves the distribution of the industry’s services/commodities. Hence, I suspect the funds to improve Energy efficiency and trans-port services sector should be allocated to the Construction sector in simulations that analyse the short-run effects of the infrastructure instead of raising final demand on Energy. On the other hand, energy efficiency has to do with prices, an aspect that can be captured with a CGE model, but which is not discussed in the paper. It is likely due to this misallocation of funds in the simulations performed by Monrobel et al.
7 The cost minimization program displays a Cobb-Douglas instead of the traditional CES function, Armington (1969).
8 Total investment includes private and public investment.9 The neoclassical closure does not seem to be the best for evaluating the impact of final demand
shocks (Polo and Valle, 2008, Alvarez-Martinez and Polo, 2010). The reason is that an exogenous shock in variables like exports will affect foreign savings and may produce a fictitious investment shock since investment is affected by total savings.

134 María Teresa Álvarez-Martínez
Investigaciones Regionales, 29 (2014) – Pages 129 to 138
(2013) that their results reveal the Construction sector is hardly affected and Real estate and leasing increase imperceptibly despite substantial funding. They therefore find in general equilibrium that regional production rises 0.64% in nominal terms and 0.48% in real terms.
Lima and Cardenete (2008). Andalusia is a large region in southern Spain with 8.4 million inhabitants that has been an Objective 1 region since Spain joined the Union. It has long relied on its agrarian economy, although more recently tourism and services have taken the lead. Lima and Cardenete (2008) evaluate the impact of the ERDF in Andalusia using a static CGE model 10 calibrated to three SAMs for 1990, 1995 and 1999. The funds received in each period —1989-1993, 1994-1999 and 2000-2006— are first annualized and then distributed among the «priority axes» and, thereby, the accounts in the SAMs. The main results reveal different effects de-pending on the database, and show a bigger impact of the funds in the latter period (2000-2006) than in the two others.
This paper for Andalusia presents the same demand perspective later used by Monrobel et al. (2013). In this case, however, investment is exogenously fixed and the simulations are performed on this exogenous variable. The effects of the Structur-al funds are evaluated by reducing total investment. There is no distinction between public and private investment and the affected sectors are not detailed. The effects on GDP after removing the annual investment using the matrices are –0.18% (SAM: 1990), –5.91% (SAM: 1995) and –7.75% (SAM: 1999). They also suggest that em-ployment increases.
Cardenete and Delgado (2013). The model in this paper draws heavily on Lima and Cardenete (2008). Here, however, investment is treated endogenously and con-sequently, it is more sensitive to changes in savings. In this case, the scenario without funds is implemented by reducing current government consumption 11. This implies the funds are used to finance public current consumption and no funds are invested in infrastructure 12. The results are presented for the components of GDP (expenditure and income), Disposable income and Total output. Investment dips steeply (32%), as do private consumption (16%) and net foreign demand (21%), even though the structural funds represent a very small share of total Public expenditures 13, which falls only 1.98%. Additionally, it is displayed what the authors call «efficiency co-efficient» that is estimated as the change in GDP for scenarios «with» and «without funds», per unit of all funds received. They conclude the paper by highlighting the relevance of the Structural funds in the context of all regional macroeconomic va-riables.
10 Production technology is a nested constant returns to scale production function with Leontief functional forms.
11 The SAM for what the model is calibrated is not mentioned in the paper.12 There is not any specific mention about the content of the account Government in the SAM, so I
am assuming the usual convention that public investment is merged with private investment in the account of Gross Fixed Capital formation.
13 Part of the effect can be also due to the changes in prices since public expenditure is usually pre-sented in nominal terms.

The Effects of European Structural Funds in the Spanish Regions Using CGE Models: a review 135
Investigaciones Regionales, 29 (2014) – Pages 129 to 138
Cardenete, Delgado and Lima (2014). This is the most recent paper published on the Structural funds effects in Andalusia. Its main objective is to evaluate the likely negative effects of Andalusia losing a substantial amount of Structural funds as it transition from being an Objective 1 region. They use a CGE model with dy-namic relationships on investment, capital and labor supply. Also in this model, total investment is endogenously determined in a savings-driven formulation and there is no distinction between public and private investment/capital. The simulations per-formed engage different sectoral capital/labor ratios, trying to capture the long run effects of the funds, which vary with the allocation of funds to these factors: 50% capital and 50% labor, 60% capital and 40% labor, 70% capital and 30% labor, etc. Two scenarios are employed —an «optimistic» scenario that assumes the funds received in 2014-2020 will be delivered at the same pace as in 2007-2013, and a «realistic» scenario that reduces the allocation of funds delivered in 2007-2013 by a third—.
The results reveal no big differences in the GDP growth rate, which is estimated to be around 6.00% in the realistic scenario and 6.15% in the optimistic one. More-over, the results are better when the investment is in labour instead of capital. In the paper, these effects are attributed to Andalusia’s labour-intensive economy. Accord-ing to the sectoral findings, only displayed for three sectors (Agriculture, Food and Other Services), Agriculture is the industry most positively affected in the scenarios. It would have been interesting to see also the effects on industries like Construction or Metal manufactures, available in the database used by the authors.
In general, the results are different depending on the region, the time period and the database used. Additionally, none of them performed a sensitivity analysis re-garding the closure rule or elasticities of substitution.
3. Further extensions
The availability of new databases published by national and regional statistical offices has improved the quality of the analysis and expands the range of studies. In Spain, national and regional statistical offices are trying to meet requirements of the European Systems of National Accounts (ESA-95) and to provide more details on macroeconomic variables. As a result, Gross Fixed Capital Formation (GFCF) matri-ces for Spanish national and regional economies from 2000 onwards are now avail-able. A GFCF matrix captures the investment by industry by type of capital goods, P6/CNAE (Agricultural products, Machinery and mechanical products, Transport equipment, Residential investment, Other constructions and Other products). The information in such a matrix differs from data included in the Investment column in Symmetric and Use Tables. The figures in the column do not capture the investment in a commodity; rather it shows the total amount of each commodity supplied for use across all sectors’ investments. Thus when simulating an increase of final demand in Energy and mining sector (Monrobel et al., 2013), they cannot be used to properly evaluate the effects of the Structural funds used to improve infrastructure related to

136 María Teresa Álvarez-Martínez
Investigaciones Regionales, 29 (2014) – Pages 129 to 138
the energy sector. According to National Accounts, households’ consumption, varia-tions in stocks and net exports compose the totality of final demand.
In my view, the effects of structural funds in investment can be readily evaluated using data from GFCF matrices. The Investment column in Supply Tables can be converted into capital goods using the correspondences between both types of goods (Álvarez-Martínez and Polo, 2014). With this information in hand, the impact of increasing investment in Machinery and mechanical products, for instance, can then be properly simulated by raising the demand for investment in final commodities needed to produce these capital goods. Thus, the effects of increasing the amount of infrastructure related to energy and mining sector could be enabled by increasing the amount of capital goods in «Other constructions», which in turn would raise final demand in Construction and not in Energy and mining products.
4. Conclusions
A significant amount of resources are allocated as Structural funds by the EU each year, which makes it an important policy instrument and an evaluation of its impacts a matter of great interest. Despite its relevance in the EU budget and, partic-ularly, its significant role in the economic growth of several Spanish regions, very few evaluations of the funds have been performed using CGE models. These models are the most appropriate to evaluate the impact of Structural funds since they capture the whole circular flow of income, the effects on prices and the possibility of productive factor substitutions. However, few authors have highlighted the relevance of these models to evaluate Structural funds. Here I review four papers that evaluate the im-pact of the funds in Spain. One focuses on Madrid, and three on Andalusia. No CGE analyses exist for Galicia, Extremadura and Castilla-La Mancha, although they were Objective 1 regions.
All papers highlight simulated increases in GDP and employment associated with the Structural Funds. The magnitude of the changes depends on the region and period of study, which are presented in more or less industry detail, depending on the paper. The literature evaluates the impact of Structural Funds from a final-demand perspective and ignores the important long-run productivity effects, which are the ap-parent focus of the funds. The shocks on productivity can be understood as the influ-ence the operation of infrastructure that is financed by Structural funds. After all we do not build roads or improve ports for their impacts on construction jobs but rather because they enable the delivery of products and people at lower cost. The same can be said of education and training programs: that is, we do not fund these programs to enhance universities and schools, but rather to improve the capabilities (and hence productivity and wages) of workers. Impacts of infrastructure evaluated as simply rise in final demand is tantamount to estimating the impact only of constructing such infrastructure. In this regard, it seems to me in evaluating infrastructure investment that CGE models should use all information of value that is available from statistical offices, in this case Gross Fixed Capital Formation (GFCF) matrices and I-O tables.

The Effects of European Structural Funds in the Spanish Regions Using CGE Models: a review 137
Investigaciones Regionales, 29 (2014) – Pages 129 to 138
With GFCF information in hand, one need only first identify the kinds of capital goods financed with the Structural funds and then identify some increase in the final commodities/services needed to produce these goods. Otherwise, the changes affect-ing industries which are not directly involved in the construction of infrastructures can yield erroneous and fictitious results.
References
Álvarez-Martínez, M. T., and Polo, C. (2012): «A general equilibrium assessment of external and domestic shocks in Spain», Economic Modelling 29, 2486-2493.
— (2014): «A new Social Accounting Matrix for Spain with Investment Disaggregated by Capital Goods», Estadística Española, 183, 5-37.
Armington, P. (1969): «A theory of demand for products distinguished by place of produc-tion», IMF Staff papers, 16, 157-178.
Beutel, J. (2002): «The economic impact of objective 1 interventions for the period 2000-2006», Final Report to the Directorate-General for Regional Policies, European Commis-sion, Konstanz, Germany.
Cámara, A., and Marcos, M. A. (2009): «Análisis del impacto de los Fondos Europeos 2000-2006 en la Comunidad de Madrid a partir de una matriz de contabilidad social del año 2000», Investigaciones Regionales, 16, 71-92.
Cancelo, J. R.; Faíña, J. A., and López-Rodríguez, J. (2009): «Measuring the Permanent Im-pact of European Structural Funds on Peripheral Objective 1 Regions: The Case of Gali-cia», European Planning Studies, 17, 1535-1558.
Cardenete, M. A., and Delgado, M. C. (2012): «Impact assessment of the European Structural Funds in Andalusia: 2000-2006», The Empirical Economics Letters, 11, 1157-1162.
— (2013),»Analysis of the Impacto f the European Funds in Andalusia in 2007-2013 Using a General Equilibrium Model», Modern Economy, 4, 448-452.
Cardenete, M. A.; Delgado, M. C., and Lima, C. (2013): «The Structural Funds in Andalusia for the Programming Period 2014-2020: Time for Tightening belts», European Planning Studies, DOI:10.1080/09654313.2013.771622.
Donés, M., and Pérez, J., (2002): «Evaluación de los efectos macroeconómicos de los Fondos Estructurales y los Fondos de Cohesión (1995-1999) mediante Tablas Input-Output regio-nales integradas», Documento de Trabajo, Cuadernos del Fondo de Investigación Richard Stone, L.R. Klein-Centro Stone.
Gaspar, V., and Pereira, A. M. (1992): «A dynamic General Equilibrium Analysis of EC Structural Funds», Working Paper 191, Facultade de Economía, Universidade Nova de Lisboa.
Hübner, D. (2006): «La economía del conocimiento en la Política de Cohesión y su relevancia en España», Speech from the Commissioner Danuta Hübner in «España-Unión Europea, trabajando juntos por la economía del conocimiento», Ministerio de Economía y Hacien-da, Madrid, 26/10/2006, http://www.dgfc.sgpg.meh.es/sitios/dgfc/es-ES/ipr/fcp0713/c/ac/aa/Documents/a%C3%B1o%202006/Discurso_Danuta_Hubner.pdf.
Lima, M. C., and Cardenete, M. A. (2006): «Análisis de impacto de los Fondos FEDER recibi-dos por una economía regional: Un enfoque a través de Matrices de Contabilidad Social», Presupuesto y Gasto Público, 40, 1-20.
— (2008): «The impact of European Structural Funds in the South of Spain», European Plan-ning Studies, 16, 1445-1457.
— (2009): «An EU price policy Model for Southern Spain», The Review of Regional Studies, 39, 23-34.

138 María Teresa Álvarez-Martínez
Investigaciones Regionales, 29 (2014) – Pages 129 to 138
Lolos, S.; Suwa-Eisenmann, A.; Zonzilos, N., and Bourgignon, F. (1995): «Evaluating the CSF with an Extended Computable General Equilibrium Model: The Case of Greece (1988-1995)», Journal of Policy Modelling, 17, 177-197.
Márquez, M. A.; Ramajo, J., and De Miguel, F. J. (2010): «Evaluación de los efectos econó-micos de los fondos estructurales del periodo 2000-2006 sobre Extremadura», Papeles de Economía Española, 123, 191-205.
Mohl, P., and Hagen, T. (2010): «Do EU structural funds promote regional growth? New evi-dence from various panel data approaches», Regional Science and Urban Economics, 40, 353–365.
Monrobel, J. R.; Cámara, A., and Marcos, M. A. (2013): «Modelling European Regional Policy 2007-2013: Applied General Equilibrium Analysis of the Economic impact on the Madrid Region», European Planning Studies, 21:2, 264-280.
Polo, C., and Valle, E. (2008): «A general equilibrium Assessment of the impact of a fall in tourism under alternative closure rules: the case of the Balearic Islands», International Regional Science Review, 31, 3-34.
Sosvilla, S., and Herce J. A. (2003): «Efectos de las ayudas europeas sobre la economía madrileña, 1990-2006: Un análisis basado en el modelo HERMIN», Technical Report No. 2003/29, Madrid, Fundacion de Estudios de Economía Aplicada (FEDEA).
Sosvilla, S., and Murillo, E. (2005): «Efectos a largo plazo sobre la economía andaluza de las ayudas procedentes de fondos estructurales destinadas a infraestructuras: el marco de apo-yo comunitario 1994-1999», Investigaciones Regionales, 6, 91-124.

© Investigaciones Regionales, 29 (2014) – Pages 139 to 164Section Articles
Should cohesion policy focus on fostering R&D? Evidence from Spain
Adolfo Maza *, José Villaverde *, María Hierro *
ABSTRACT: Over the last decades, there has been a vast amount of literature on the subject of Research and Development (R&D) expenditure as a main driver of economic growth, both at national and sub-national levels. This being so, the main purpose of this manuscript is to investigate the role played by R&D as a cohesion instrument. To accomplish this aim, the paper assesses the link between patents (as a proxy for R&D) and economic growth across the Spanish provinces (NUTS3) over the period 1995-2010. In other words, we want to evaluate whether provinces with high patent production grow at a higher rate than those with low innovative performance. In addition, we want to test for the presence of spatial spillovers, and to assess if the effect of patents on economic growth depends on the development degree of provinces. The results show, firstly, that patents act as a growth driver. Secondly, that there is no evidence of spatial spillovers. And, thirdly, that the effect of patents on growth seems to be higher for developed than for less developed provinces. In view of these findings, major efforts should be devoted to promote a cohesion policy focused on R&D investment in the less developed territories.
JEL Classification: O30; O40; O11; R11.
Keywords: patents; economic growth; Spanish provinces.
¿Debería la política de cohesión centrarse en el fomento de la I+D?: Evidencia para España
RESUMEn: Durante las últimas décadas la literatura sobre los gastos en investi-gación y desarrollo (I+D) como motor de desarrollo, tanto a nivel nacional como regional, ha crecido de forma notable. En este contexto, el objetivo de este trabajo es examinar el papel jugado por los gastos en I+D como instrumento de cohesión. Para ello, el trabajo evalúa la conexión entre patentes (como proxy de gastos en I+D) y el crecimiento económico entre las provincias españolas (NUTS3) durante
139
Received: 14 march 2014 / Accepted: 30 june 2014.
We would like to thank two anonymous referees for their helpful comments and suggestions. The usual disclaimer applies.
* Department of Economics. University of Cantabria. Av. Los Castros, s/n. 39005 Santander (SPAIN). E-mail: [email protected]; [email protected]; [email protected].
140 Maza, A., Villaverde, J. and Hierro, M.ª
Investigaciones Regionales, 29 (2014) – Pages 139 to 164
el periodo 1995-2010. En otras palabras, queremos averiguar si las provincias con mayor número de patentes crecen a un ritmo más alto que aquéllas con poco impul-so innovador. Además, el trabajo analiza la presencia de efectos desbordamiento, así como si el efecto de las patentes sobre el crecimiento depende del grado de desarrollo de cada provincia. Los resultados ponen de relieve, primero, que las patentes impulsan el crecimiento. Segundo, que no hay evidencia que apoye la existencia de efectos desbordamiento. Tercero, que el efecto de las patentes sobre el crecimiento parece ser mayor en las regiones más desarrolladas que en la menos desarrolladas. De acuerdo con estos resultados, una política de cohesión enfocada en la inversión en I+D en las regiones menos desarrolladas parece ser necesaria.
Clasificación JEL: O30; O40; O11; R11.
Palabras clave: patentes; crecimiento económico; provincias españolas.
1. Introduction
The existence of large and persistent regional disparities constitutes one of the main traits of the European Union (EU). As these disparities might pose some pro-blems to the process of European integration, their analysis and, correspondingly, the issue of how to deal with them has caught the attention of both academics and policy makers since at least the 1970’s, spawning a large theoretical and empirical research. In truth, this analysis revolves around a simple but critical question: why some terri-tories are rich and others are not? Put it other way, it discusses on the main sources of economic growth.
Among these sources, Research and Development (R&D) investment clearly stands out. There is a general consensus on the fact that disparities are mainly explai-ned by differences in productivity, and that these differences are, to a great extent, due to the development of new technologies as well as the capacity of regions to pro-fit from technology and, eventually, to harvest the benefits of investments on R&D. That is to say, there is a well-defined strand of research confirming the relevance of technological progress as a growth engine and, consequently, of R&D as a key ele-ment in not only regional but also national and European-wide growth policies 1. The-refore, remarkable efforts have been displayed by different governments to increase the expenditure on R&D as a percentage of GDP, especially in the last decades.
Bearing these considerations in mind, the aim of this paper is to assess the perti-nence of the use of R&D investments not only as a growth driver but also as an ins-trument of the cohesion policy, let’s say a potential cohesion enhancer. But, how can we accomplish these two goals together? To do that, and although we are conscious of their limitations, we employ (both standard and spatially) conditioning beta-conver-gence approaches. By using these approaches we can establish whether, or not, regions that allocate a larger share of output to R&D grow at a higher rate than those with a
1 One of the criteria of the Lisbon Strategy is, for example, that 3% of GDP is invested in R&D.
Should cohesion policy focus on fostering R&D? Evidence from Spain 141
Investigaciones Regionales, 29 (2014) – Pages 139 to 164
poor innovative performance and, by doing that, we also intend to estimate the poten-tial contribution of R&D investments to convergence or cohesion. Additionally, the paper addresses two closely related issues. Firstly, and taking into account a relatively new and important branch of the literature —the New Economic Geography (NEG) models inspired on the ground-breaking paper by Krugman (1991)—, it studies the interaction of R&D activities in one place with those in another 2. This is an extremely important topic (see e.g. Funke and Niebuhr, 2005), because this kind of intangible as-sets are specially pruned to the presence of spatial spillovers 3. Then, it also examines, by employing a spatially conditioning beta-convergence approach, whether the increa-se in R&D in a province positively affects the rate of economic growth of its neigh-bors. Secondly, and due to the fact that previous papers have shown that the effect of R&D expenditures on economic growth could depend on the development level of the areas where they are conducted, the paper also tests this hypothesis by using a set of interaction variables (combining R&D investments and the level of per capita GDP).
Regarding data, this paper takes the Spanish case as a sort of laboratory. To be precise, we use a sample of 50 Spanish provinces (excluding Ceuta and Melilla) over the period 1995-2010 and, due to R&D data unavailability at provincial level 4, we employ patent data (Patent Co-operation Treaty (PCT) patent applications per million inhabitants) as a proxy for R&D expenditure. Data about patents come from the Main Science and Technology Indicators databank provided by the OECD. Other data sources, such as Eurostat and IVIE, are also employed for the inclusion of some control variables in the study.
Bearing these considerations in mind, the rest of the paper is organized as follows. Section 2 presents a succinct review of the theoretical framework regarding the link between R&D and economic growth/convergence. Section 3 reviews the empirical literature devoted to the relationship between R&D and economic growth. Section 4 describes, in a concise way, the provincial distribution of patents in Spain. After that, Section 5 assesses the role played by patents as an engine for economic growth and convergence, the existence of spatial spillovers, and of differences according to the development level of provinces. Finally, Section 6 concludes and provides some les-sons and challenges for cohesion policy.
2 An extensive analysis of the inner connectivity of the Spanish Regional Innovation Systems has been recently published by Alberdi Pons et al. (2014).
3 This is one of the reasons why the Lisbon Strategy focuses on R&D: EU countries/regions collect well-being gains from each other’s investments on R&D.
4 It is worth noting that the analysis could be carried out at regional (NUTS2) level using R&D investment data. However, we decided to run it at provincial (NUTS3) level because not only patents are commonly used as a proxy for R&D but mainly because we consider that an analysis at regional level suffers from serious problems of aggregation (the Spanish regions are of widely different sizes and encompass different number of provinces). Furthermore, the use of data at provincial level allows us to deal with to the potential existence of spatial dependence problems in the estimation of our model (as it is well-known that models including a spatial structure need a big sample), which could crucially affect the reliability of the results. Although at the same time we are aware that there are some papers indicating that the use of patents is not suitable because they are not a good proxy for R&D (e.g. Griliches, 1990; Sánchez et al., s.d.), we perceive the pros outweigh the cons.

142 Maza, A., Villaverde, J. and Hierro, M.ª
Investigaciones Regionales, 29 (2014) – Pages 139 to 164
2. Theoretical literature review
Although the interest on R&D investments dates back to classical economists, in the modern era it was spurred by Solow’s (1956, 1957) work, that established the roots of the neoclassical growth theory. According to it, economic growth is explai-ned by factor accumulation and productivity growth, this last one being considered as an exogenous variable. The problem with this approach is that empirical literature has found, as mentioned in the Introduction, that the bulk of income differences among regions cannot be explained by differences in factor endowments, but by differences in productivity growth (Caselli, 2005). In other words, empirical evidence does not support the predictions made by Solow’s model.
Even though since Solow’s seminal papers several advances have been made, the next big step on the theory of economic growth did not take place until around mid-eighties with the endogenous growth theory (Romer, 1986, and Lucas, 1988). This theory tries to incorporate technological change, namely innovations, into eco-nomic growth models. Accordingly, productivity growth starts to be treated as an endogenous driver of growth. One of the reasons leading to this conclusion is that technological knowledge accumulated through the allocation of resources to R&D promotes productivity growth. As explained by Wei et al. (2001: 155), «the more resources allocated to R&D, the higher the incentive for firms to innovate, the grea-ter the firms’ abilities to create new technological ideas, and the higher the rate of growth a country will enjoy». Accordingly, differences in capabilities, resources and incentives to undertake innovative processes are expected to provoke large regional differences.
Following this line of research, during the last two decades there has been a surge in the literature devoted to assess the importance of investment in R&D as a source of economic growth. Among the most relevant papers, those by Romer (1990), with his product-variety model, Grossman and Helpman (1991), including spillover effects in the research sector, and Aghion and Howitt (1992), with their quality-ladder model involving creative destruction, stand out. As summarized by Barro and Sala-i-Martin (1995: 12), «in these models, technological advance results from purposive R&D activity, and this activity is rewarded by some form of ex-post monopoly power». These models conclude the existence of «scale effects» on innovation: the size of population affects long-run economic growth as any increase in population, ceteris paribus, raises the number of researchers.
Nevertheless, the prediction of «scale effects» in innovation based on the first generation of endogenous growth models was afterwards challenged, on empirical grounds, by Jones (1995), which developed a model that maintains the main featu-res of the R&D-based models but eliminates this «scale effect» prediction 5. In the
5 In this model economic growth is not endogenously determined but the result of population growth or, more specifically, the result of «the growth in the effective number of researchers» (Jones, 1995: 778).

Should cohesion policy focus on fostering R&D? Evidence from Spain 143
Investigaciones Regionales, 29 (2014) – Pages 139 to 164
same vein, many other models eliminating the «scale effect» have been proposed, among which those of Young (1998), Peretto (1998) and Howitt (1999) are probably the most prominent. These models, in short, include «horizontal» innovation as well as «vertical» innovation, so that the aggregate effect of any-one sector R&D inves-tments diminishes and, in consequence, the effect of population on resources devoted to R&D and economic growth vanishes (Garner, 2010).
In sum, from a theoretical perspective there are different approaches to assess the relationship between economic growth and R&D investments. Regarding neoclassi-cal models, and apart from the accumulation of factors, productivity gains induced by technological advances are a main source of economic growth. Therefore, the use of R&D investments as a way to boost productivity and, therefore, promote eco-nomic growth might even be considered an implicit finding from the neoclassical ap-proach. From the endogenous growth theory perspective, R&D is explicitly taken as a growth driver. Therefore, there seems to be a unanimous conclusion: there is a link between R&D expenditures and economic growth. With respect to this issue, Aghion and Howitt (2007: 93) indicate «that the contributions of capital accumulation and innovation to growth cannot be estimated without such a hybrid (neoclassical and endogenous) theory».
3. Empirical literature review
Accordingly with the theory, the empirical evidence on the impact of R&D in-vestment on economic growth has generally found that this is positive and quite sig-nificant (see Nadiri, 1993, for a review). This notwithstanding, and as reported by Griliches (1992) in his analysis of R&D externalities, the range of elasticity estimates is very large, from a minimum of 20% to a maximum of 80%, depending on the firms, industries and countries under consideration 6. Drawing on this conclusion, Jones and Williams (1998) developed an endogenous-growth model to estimate the social rate of return of R&D 7 and, after calibrating it and showing that previous results repre-sented a lower bound, found that most decentralized economies undertake too little investment in R&D. In particular, they found that optimal R&D investment is about four times greater than actual spending 8.
With a more critical approach, other authors consider that the contribution of R&D to growth is somewhat uncertain as R&D investments cause not only positive externalities but also some negative spillovers. In this vein, Pessoa (2010) stresses the fact that relying on a «linear model» to capture the impact of R&D on economic growth is somewhat restrictive because of the many factors omitted in conventional
6 For a thorough review of the empirical literature on measuring the returns to R&D, see Hall et al. (2009).
7 In this model the link between R&D and growth depends only on the production possibilities of the economy.
8 By using a different approach —calibrating and endogenous growth model— Jones and Williams (2000) confirm the conclusion that decentralized economies typically underinvest in R&D.

144 Maza, A., Villaverde, J. and Hierro, M.ª
Investigaciones Regionales, 29 (2014) – Pages 139 to 164
regressions 9. More specifically, Pessoa (2010: 152-153) states that «if such factors have a clear effect on TFP and, at the same time, induce firms to invest in R&D, R&D intensity seems rather a proxy of the level of development than a cause of it». As a (partial) consequence of this, he shows, for a sample of 28 OECD coun-tries, that the average rate of GDP growth between 1995 and 2005 was not positively correlated to R&D intensity in the business sector, therefore casting some doubts about the conventional link between both variables. Similarly, papers by Dosi et al. (2006) and Braunerhjelm et al. (2010), for EU and OECD countries respectively, conclude that R&D efforts do not lead to sufficient economic growth. Ejermo et al. (2011), analyzing the R&D-growth paradox (R&D growth being higher than eco-nomic growth) for the Swedish case, observed that this is related to different sector growth patterns, with the fast-growing industries, not the traditional ones, being those that contribute the most to the paradox.
Another strand of empirical research, pioneered by Ulku (2004) in his work for 20 OECD and 10 non-OECD countries, challenges the assumption, employed when using OLS regressions, that the elasticity of output with respect to R&D is constant. According to some of these papers (see references in Wang et al., 2013) the rate of return of R&D crucially depends on the industries in which R&D takes place, with that corresponding to high-tech industries generating the highest returns, a result that is at odds with that of Ejermo et al. (2011). In accordance with this conclusion, Wang et al. (2013) move a bit further and, by studying a sample of 23 OECD countries plus Taiwan, show that the impact of R&D investments in high-tech sectors is heteroge-neous across economies with different levels of per capita income. Similarly, a very recent research for the OECD countries (Westmore, 2013) casts some doubts about the robustness of the positive link between R&D and growth; more specifically, it states that the strength of the link depends on «well designed framework policies that allow spillovers to proliferate» (Westmore, 2013: 2), meaning that the impact may be heterogeneous across countries 10.
Apart from the type of industry or country that is undertaking the R&D inves-tment, its effect on the rate of economic growth might depend on the private or pu-blic character of the investment. Here the evidence is also mixed, and although the results are generally positive for both types of investment and as a total, there are some papers (Kealey, 1996) suggesting that public investment in R&D might de-ter growth. Sylwester (2001), in an analysis of the relationship between both public and private R&D investments and growth for a sample of 20 OECD countries, finds that albeit both coefficients are positive none of them are significant at conventional levels. When the relationship is estimated, however, just for the G-7 countries, the evidence of a positive effect is stronger, particularly regarding non-government R&D expenditures.
9 A recent paper by Strobel (2012) also stresses the different impact of R&D on growth by industry type, that is, the non-linearity of the relationship between both variables.
10 Goel and Ram (1994) also concluded that, after controlling for several variables, there is a posi-tive correlation (they do not talk about causality) between R&D investment and growth, but only for rich countries.

Should cohesion policy focus on fostering R&D? Evidence from Spain 145
Investigaciones Regionales, 29 (2014) – Pages 139 to 164
Within the bulk of papers adopting a country approach, it is important to mention a very recent and interesting one, by López-Rodríguez and Martínez (2014), which compares R&D and non-R&D innovation expenditures for a sample of 26 EU coun-tries. As these authors demonstrate, the effect of the former (R&D) is almost twice as larger as that of the latter (non-R&D). In addition, they show that the distance to the technological leader has a positive impact on growth.
From a regional perspective there are also many studies analyzing the effects of R&D on growth, particularly for the EU regions (see Sterlacchini, 2008, for some references). Among them, one of the most interesting from the point of view of this paper, as its econometric approach is roughly the same, is that by Sterlacchini (2008) for a sample of 197 NUTS2 regions over the period 1995-2002. By estimating a rather conventional beta-convergence equation in which, among others, patents are included as a control variable, two main conclusions arise. First, that R&D exerts a significant impact on GDP growth. And, second, that this effect is less significant for regions with relatively low levels of per capita income, which implicitly means that R&D works against convergence.
There are, however, much less studies about the R&D-growth link at regional level within a single country, and most of them are mainly interested in quantifying spatial spillovers. Among them, Funke and Niebuhr (2005) examine the (West) Ger-man case between 1976 and 1996 and, estimating a conventional beta-convergence model with spatial dependence, they achieve two relevant conclusions. First, that R&D has a positive impact on the rate of economic growth and, second, that inves-tment in R&D in a region positively affects income growth in other regions; this effect is, however, much stronger for geographically close regions than for the rest.
Finally, another interesting study, in between those of Sterlacchini (2008) and Funke and Niebuhr (2005) but with a somewhat different aim, is that by Bottazzi and Peri (2003). In this paper, and by means of using an innovation generating function for 86 EU regions for the period 1977-1995, the authors estimate the elasticity of innovation to R&D and find that it declines heavily with distance. From this conclusion, the impli-cation is obvious: as in Funke and Niebuhr (2005), spatial spillovers of R&D on growth only affect to the closest regions to those in which the R&D investment takes place.
4. The geographic distribution of patents across the Spanish provinces
In their attempt to measure the innovative performance of economic areas, re-searchers have commonly followed one of these two strategies: First, the use of sta-tistics on R&D expenditures over GDP, considered as input indicators; second, the use of data on patent applications per million inhabitants as output indicators. As mentioned in the introduction, in this paper we have opted for using the number of patents per million of inhabitants for reasons of data availability. In any case, due to relatively high correlation usually found between both variables (see, for instance,
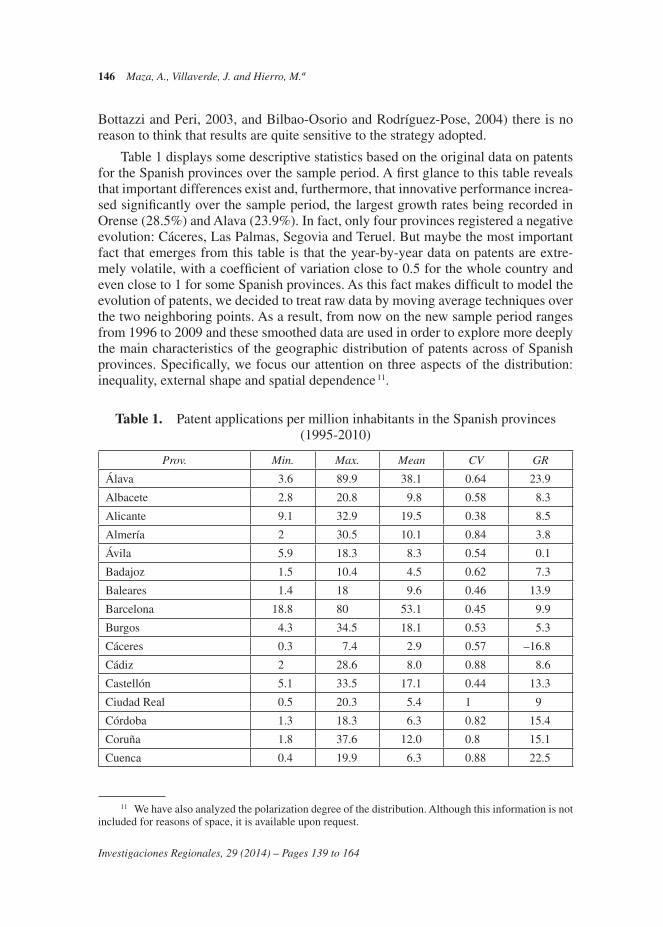
146 Maza, A., Villaverde, J. and Hierro, M.ª
Investigaciones Regionales, 29 (2014) – Pages 139 to 164
Bottazzi and Peri, 2003, and Bilbao-Osorio and Rodríguez-Pose, 2004) there is no reason to think that results are quite sensitive to the strategy adopted.
Table 1 displays some descriptive statistics based on the original data on patents for the Spanish provinces over the sample period. A first glance to this table reveals that important differences exist and, furthermore, that innovative performance increa-sed significantly over the sample period, the largest growth rates being recorded in Orense (28.5%) and Alava (23.9%). In fact, only four provinces registered a negative evolution: Cáceres, Las Palmas, Segovia and Teruel. But maybe the most important fact that emerges from this table is that the year-by-year data on patents are extre-mely volatile, with a coefficient of variation close to 0.5 for the whole country and even close to 1 for some Spanish provinces. As this fact makes difficult to model the evolution of patents, we decided to treat raw data by moving average techniques over the two neighboring points. As a result, from now on the new sample period ranges from 1996 to 2009 and these smoothed data are used in order to explore more deeply the main characteristics of the geographic distribution of patents across of Spanish provinces. Specifically, we focus our attention on three aspects of the distribution: inequality, external shape and spatial dependence 11.
Table 1. Patent applications per million inhabitants in the Spanish provinces (1995-2010)
Prov. Min. Max. Mean CV GR
Álava 3.6 89.9 38.1 0.64 23.9
Albacete 2.8 20.8 9.8 0.58 8.3
Alicante 9.1 32.9 19.5 0.38 8.5
Almería 2.0 30.5 10.1 0.84 3.8
Ávila 5.9 18.3 8.3 0.54 0.1
Badajoz 1.5 10.4 4.5 0.62 7.3
Baleares 1.4 18.0 9.6 0.46 13.9
Barcelona 18.8 80.0 53.1 0.45 9.9
Burgos 4.3 34.5 18.1 0.53 5.3
Cáceres 0.3 7.4 2.9 0.57 –16.8
Cádiz 2.0 28.6 8.0 0.88 8.6
Castellón 5.1 33.5 17.1 0.44 13.3
Ciudad Real 0.5 20.3 5.4 1.40 9.0
Córdoba 1.3 18.3 6.3 0.82 15.4
Coruña 1.8 37.6 12.0 0.80 15.1
Cuenca 0.4 19.9 6.3 0.88 22.5
11 We have also analyzed the polarization degree of the distribution. Although this information is not included for reasons of space, it is available upon request.

Should cohesion policy focus on fostering R&D? Evidence from Spain 147
Investigaciones Regionales, 29 (2014) – Pages 139 to 164
Table 1. (Continue)Prov. Min. Max. Mean CV GR
Girona 4.9 49.8 28.8 0.51 11.0
Granada 2.4 33.9 13.4 0.79 17.2
Guadalajara 1.5 23.7 11.6 0.59 2.9
Guipúzcoa 4.5 80.1 37.5 0.64 19.5
Huelva 1.1 23.2 7.5 0.71 12.5
Huesca 4.8 25.8 15.1 0.46 10.8
Jaén 0.3 13.5 4.1 1.13 15.5
León 3.3 16.3 8.8 0.44 7.0
Lleida 2.8 25.0 12.5 0.54 14.7
Rioja, La 0.9 34.8 15.3 0.69 10.4
Lugo 0.5 12.3 4.3 0.87 15.6
Madrid 13.2 67.3 36.3 0.50 11.1
Málaga 5.9 20.4 12.8 0.37 7.8
Murcia 0.3 23.0 11.9 0.59 12.4
Navarra 7.9 110.3 56.2 0.61 19.2
Orense 0.3 13.8 5.1 0.69 28.5
Asturias 2.5 23.3 10.1 0.66 12.5
Palencia 0.9 17.5 5.3 0.96 9.8
Palmas, Las 3.6 12.8 6.6 0.40 –1.4
Pontevedra 1.1 24.4 12.2 0.61 10.9
Salamanca 2.8 23.6 12.5 0.61 10.3
Tenerife 1.4 16.2 6.6 0.57 11.8
Cantabria 1.9 20.1 9.2 0.70 15.9
Segovia 1.6 19.4 7.6 0.58 –9.3
Sevilla 2.0 46.8 17.0 0.74 22.5
Soria 4.0 20.2 9.1 0.41 11.4
Tarragona 10.8 59.1 30.2 0.50 6.4
Teruel 1.4 23.7 10.1 0.58 –10.4
Toledo 0.8 27.0 12.9 0.62 9.0
Valencia 7.4 44.1 27.8 0.43 12.2
Valladolid 4.0 34.0 15.0 0.65 10.1
Vizcaya 5.6 54.7 23.3 0.66 14.2
Zamora 0.6 15.5 5.0 0.93 15.9
Zaragoza 7.1 77.7 33.2 0.73 16.1
SPAIn 7.1 38.4 22.8 0.48 11.9
Notes: GR = growth rate; CV = Coefficient of variation.Source: OECD and own elaboration.

148 Maza, A., Villaverde, J. and Hierro, M.ª
Investigaciones Regionales, 29 (2014) – Pages 139 to 164
4.1. Inequality
First we study the evolution of provincial disparities in patent applications. Since there is no accepted best measure of inequality, we consider here the most commonly used inequality indicators: the coefficient of variation (CV), the Gini index (G), two versions of the Theil index (T(0) and T(1)) and a version of the Atkinson index (A(1)). All indices are independent of both scale and population size, and each one fulfills the Pigou-Dalton transfer principle (Cowell, 1995).
Results from applying the above mentioned inequality measures are shown in Figure 1. The main conclusion is that there was a high increase of inequality during the late 1990s, followed by a downward trend that has not been intense enough to reach in 2009 lower inequality levels than in 1996. Additionally, it can be observed that, even using moving averages, the time pattern of patents is rather volatile.
Figure 1. Inequality measures (1996 = 100)
CV
T(0)
T(1)
G
A(1)
180
170
160
150
140
130
120
110
100
90
80
1996 1997 1998 1999 2000 2001 2002 2003 2004 2005 2006 2007 2008 2009
Source: OECD and own elaboration.
4.2. External Shape of the Distribution
Supplementary information of the distribution can be inferred from the construc-tion of density functions. This representation, understood as a smoothed version of a histogram, provides a very simple yet highly intuitive graphical tool to visualize some general characteristics of any distribution, as well as to study the manner its external shape evolves over time. In order to estimate a density function we use a Gaussian kernel with optimal bandwidth according to the well-known Silverman’s rule-of-thumb (Silverman, 1986).

Should cohesion policy focus on fostering R&D? Evidence from Spain 149
Investigaciones Regionales, 29 (2014) – Pages 139 to 164
Figure 2 plots Spain’s patents distribution for the initial and final years of the sample period: 1996 and 2009. In this case, data are normalized by the Spanish average (Spain = 100). The figure shows that in 1996 the distribution is bimodal; by using Salgado-Ugarte et al. (1997) technique to identify the modes, it can be said that the main mode is located at 47.2% while the second is at 229.2% of the Spanish average. As for 2009, the distribution continues to be bimodal; now the differences are that the two modes have somewhat changed to the left (40.4 and 195.5% respec-tively) and that the mass of probability is more concentrated around the main one.
Figure 2. Density plots for relative patent applications
1996
2009
0.016
0.014
0.012
0.010
0.008
0.006
0.004
0.002
00 50 100 150 200 250 300
Source: OECD and own elaboration.
4.3. Spatial dependence
A first look at Spain’s map in both 1996 and 2009 (Figures 3a, 3b) reveals that, as ex-pected, innovative performance has tended to cluster in rich areas characterized by high economic dynamism, such as those in the North-East of the country. In addition, when Figures 3a and 3b are compared, it seems that spatial concentration has decayed at the end of the period; this conclusion stems from the fact that areas with similar values (high or low) of patent applications seem to be more spatially clustered in 1996 than in 2009.
As these conclusions are tentative at best, because they lack any sound statistical basis, to examine their real strength next we estimate the most widespread statistic in spatial analysis (ESDA): the Moran’s I statistic 12. Using the inverse of the standard-
12 This is expressed as follows (Anselin, 1988):
I tn
w
w y t t y t
ijji
ijji
i j
( )
( ) ( ) ( )
*
*
=− −
∑∑∑∑ µ µ(( )
( ) ( )
t
y t tii
− ∑ µ 2

150 Maza, A., Villaverde, J. and Hierro, M.ª
Investigaciones Regionales, 29 (2014) – Pages 139 to 164
where yi and yj are patent applications per million inhabitants of provinces i and j, respectively; m is
the Spanish average; w w wij ij ijj
* = ∑ are the standardized spatial weights describing the distance between
provinces i and j; and n is the number of provinces. In order to facilitate the interpretation of the statistic, the standardized value (z-value) is obtained. Accordingly, a significant positive (negative) value for the Moran’s I statistic will imply positive (negative) spatial association, herein interpreted to imply similar (dissimilar) values of patent applications per million inhabitants being clustered together in space.
Figure 3. Relative patent applications across the Spanish provinces (Spanish average = 100)
0-4040-8080-120120-160> 160
0-4040-8080-120120-160> 160
(a) Year 1996 (b) Year 2009
Source: OECD and own elaboration.
Table 2. Moran’s I statistic
Year Value z-value Prob.
1996 0.086 4.832 0.000
1997 0.137 7.158 0.000
1998 0.092 5.083 0.000
1999 0.150 7.736 0.000
2000 0.094 5.198 0.000
2001 0.127 6.700 0.000
2002 0.124 6.546 0.000
2003 0.082 4.657 0.000
2004 0.080 4.566 0.000
2005 0.114 6.089 0.000
2006 0.098 5.391 0.000
2007 0.078 4.453 0.000
2008 0.055 3.434 0.000
2009 0.076 4.386 0.000Source: OECD and own elaboration.

Should cohesion policy focus on fostering R&D? Evidence from Spain 151
Investigaciones Regionales, 29 (2014) – Pages 139 to 164
ized distance between the corresponding provincial centroids as a distance measure, the results for the Moran’s I statistic reveal a positive statistically significant spatial dependence between provinces (see Table 2). It can also be noted that the degree of spatial dependence declined slightly over the sample period, which shows the exis-tence of a global downward tendency towards a geographical clustering of similar provinces.
5. Econometric analysis
As previously mentioned, the objective of this section is threefold. Firstly, to examine the role of patents as a factor promoting economic growth and, possibly, convergence (economic cohesion); secondly, to test the presence of spatial spillovers; and finally, to check the interaction between patens and level of development when it comes to evaluate the effect of the former on economic growth and cohesion.
5.1. Patents and economic growth
As mentioned in the introduction and summarized in the second section of the paper, there is a well-known belief that innovative activities contribute to economic growth and, depending on their territorial distribution, to economic cohesion. However, the empirical literature on this topic is not conclusive. This being so, the main aim of this section is to assess if, effectively, technological progress has fostered economic growth for the case of Spanish provinces. To accomplish this aim we make use, as in some other papers cited above, of the standard convergence approach popularized by Barro and Sala-i-Martin (1992). In this regard, we can assess not only whether innovation has promoted growth but also whether or not it has contributed to convergence, and in consequence to foster territorial cohesion. We know this approach has some limitations, as it fails to capture potentially interesting characteristics of the underlying income distribution and its evolution over time (see, e.g., Quah, 1993), but we think it is the best one to accomplish the main goals of this paper 13.
Bearing these points in mind, and taking per capita income (Eurostat) as a proxy for economic development, this section proceeds in various steps. Firstly, it estimates an absolute β-convergence equation. Secondly, an analysis of conditional β-conver-gence is carried out, in which patents (expressed in both levels and growth rates) are included as our basic conditioning variable. If, as expected, patents foster income growth their coefficients will be positive and statistically significant. Thirdly, and for the sake of robustness, additional control variables to explain the role of structural differences among the Spanish provinces are considered. To be precise, we include human capital (HC), investment (Inv), market access (MA) and the share of industry
13 An alternative to the standard convergence approach is the so-called distribution dynamics ap-proach (e.g. Maza et al., 2010, 2012), but this methodology is not especially suitable in this case.
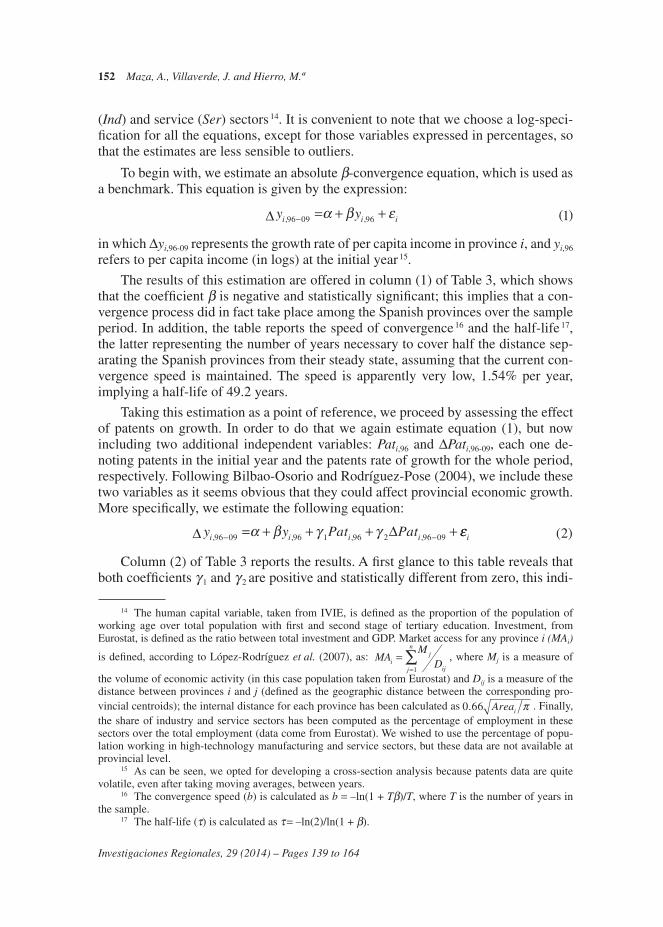
152 Maza, A., Villaverde, J. and Hierro, M.ª
Investigaciones Regionales, 29 (2014) – Pages 139 to 164
(Ind) and service (Ser) sectors 14. It is convenient to note that we choose a log-speci-fication for all the equations, except for those variables expressed in percentages, so that the estimates are less sensible to outliers.
To begin with, we estimate an absolute β-convergence equation, which is used as a benchmark. This equation is given by the expression:
y yi i i, , ( )96 09 96 1− = + +α β ε∆
in which ∆yi,96-09 represents the growth rate of per capita income in province i, and yi,96 refers to per capita income (in logs) at the initial year 15.
The results of this estimation are offered in column (1) of Table 3, which shows that the coefficient β is negative and statistically significant; this implies that a con-vergence process did in fact take place among the Spanish provinces over the sample period. In addition, the table reports the speed of convergence 16 and the half-life 17, the latter representing the number of years necessary to cover half the distance sep-arating the Spanish provinces from their steady state, assuming that the current con-vergence speed is maintained. The speed is apparently very low, 1.54% per year, implying a half-life of 49.2 years.
Taking this estimation as a point of reference, we proceed by assessing the effect of patents on growth. In order to do that we again estimate equation (1), but now including two additional independent variables: Pati,96 and ∆Pati,96-09, each one de-noting patents in the initial year and the patents rate of growth for the whole period, respectively. Following Bilbao-Osorio and Rodríguez-Pose (2004), we include these two variables as it seems obvious that they could affect provincial economic growth. More specifically, we estimate the following equation:
y y Pat Pati i i i, , , ,96 09 96 1 96 2 96 09− −= + + + +α β γ γ εεi ( )2∆ ∆
Column (2) of Table 3 reports the results. A first glance to this table reveals that both coefficients g 1 and g 2 are positive and statistically different from zero, this indi-
14 The human capital variable, taken from IVIE, is defined as the proportion of the population of working age over total population with first and second stage of tertiary education. Investment, from Eurostat, is defined as the ratio between total investment and GDP. Market access for any province i (MAi)
is defined, according to López-Rodríguez et al. (2007), as: MAM
Dij
ijj
n
==∑
1
, where Mj is a measure of
the volume of economic activity (in this case population taken from Eurostat) and Dij is a measure of the distance between provinces i and j (defined as the geographic distance between the corresponding pro-vincial centroids); the internal distance for each province has been calculated as 0 66. Areai π . Finally, the share of industry and service sectors has been computed as the percentage of employment in these sectors over the total employment (data come from Eurostat). We wished to use the percentage of popu-lation working in high-technology manufacturing and service sectors, but these data are not available at provincial level.
15 As can be seen, we opted for developing a cross-section analysis because patents data are quite volatile, even after taking moving averages, between years.
16 The convergence speed (b) is calculated as b = –ln(1 + Tβ)/T, where T is the number of years in the sample.
17 The half-life (t) is calculated as t = –ln(2)/ln(1 + β).

Should cohesion policy focus on fostering R&D? Evidence from Spain 153
Investigaciones Regionales, 29 (2014) – Pages 139 to 164
cating the importance of patents (both their initial level and growth rate) and, in sum, the role of innovation as a mechanism to foster economic growth. A closer look to these results also indicates that the coefficient linked to initial per capita income in-creases in absolute value (from 0.014 to 0.024) when these variables are considered; the same occurs, obviously, with the annual speed of convergence (it goes from 1.54 to 2.80%).
Table 3. Patents and economic growth relationship
∆yi,96–09
Independent(1) (2) (3) (4) (5) (6)
constant 0.174***(0.039)
0.252***(0.047)
0.368***(0.064)
0.142***(3.21)
0.217***(0.046)
0.319***(0.061)
yi,96–0.014***
(0.004)–0.024***
(0.005)–0.029***
(0.005)–0.013***
(0.004)–0.023***
(0.005)–0.028***
(0.004)
Pati,960.005***(0.002)
0.005**(0.002)
0.005***(0.002)
0.005***(0.002)
∆Pati,96–090.057***(0.015)
0.035**(0.016)
0.057***(0.014)
0.035**(0.014)
HCi,960.001***(0.000)
0.001***(0.000)
Invi,96–0.000(0.000)
–0.000(0.000)
MAi,96–0.004(0.004)
–0.000(0.000)
Indi,960.000
(0.000)0.000
(0.000)
Seri,960.001***(0.000)
0.001***(0.000)
W∆yi,96–090.523*(0.30)
0.683***(0.210)
0.558**(0.028)
LM-ERR 3.57**[0.06]
9.02***[0.01]
0.42[0.51]
LM-EL 8.14***[0.01]
12.88***[0.00]
1.92[0.17]
LM-LAG 1.15[0.28]
3.21*[0.07]
1.64[0.20]
LM-LE 5.72**[0.02]
7.07***[0.00]
3.13*[0.07]
R2 0.19 0.42 0.61
LIK 183.98 192.24 202.39 184.59 193.73 204.00
AIC –363.96 –376.48 –386.78 –364.18 –377.46 –387.40

154 Maza, A., Villaverde, J. and Hierro, M.ª
Investigaciones Regionales, 29 (2014) – Pages 139 to 164
Table 3. (Continue)
∆yi,96–09
Independent(1) (2) (3) (4) (5) (6)
SC –360.13 –368.82 –369.57 –367.64 –369.89 –369.67
Speed of convergence (%) 1.54 2.80 3.63 1.41 2.72 3.49
Half-life (years) 49.2 29.1 23.6 53.3 29.8 24.4
Notes: LM-ERR = Lagrange multiplier for spatial errors; LM-EL = LM-ERR associated robust; LM-LAG = Lagrange multiplier for spatial lags; LM-LE = LM-LAG associated robust; LIK = Logarithm of maximum likelihood; AIC = Akaike’s Information Criterion; SC = Schwartz’s Criterion. (***) significant at 1%; (**) significant at 5%; (*) significant at 10%. Standard errors for coefficient estimates are in parenthesis. p-Values for the statistics are in brackets.Source: OECD and own elaboration.
In order to check for the robustness of the results just discussed, we consider additional control variables to include other factors potentially explaining per capita income growth. Thus, the next equation we estimate is:
y y Pat Pati i i i, , , ,96 09 96 1 96 2 96 09− −= + + + +α β γ γ φφ εZi i, ( )96 3+∆ ∆
where Zi,96 denotes the set of control variables previously mentioned 18.
As column (3) of Table 3 shows, the results obtained reinforce the idea that pat-ents have contributed to economic growth in the Spanish provinces. Regarding the speed of convergence, the results reveal that this is a bit higher when we control for structural differences. As for the new control variables, our findings unveil the role played by human capital as an important factor fostering economic growth. For the case of investment and market access, however, the link with per capita income growth is not statistically significant. Additionally, the coefficient associated to the service sector share is positive and different from zero, this suggesting that, ceteris paribus, those provinces specialized in services have experienced higher per capita income growth than the others. On the contrary, the coefficient linked to the industry share does not result significant at conventional levels.
After this analysis, and for the sake of robustness, we test for the presence of spa-tial dependence in the equations (1)-(3) because, as it is well known, this could give rise to biased and inefficient OLS estimates (Anselin, 1988). To do that we performed a series of tests, with the Lagrange multipliers standing out, based on the principle of maximum likelihood 19. Table 3 displays the results for these diagnostic tests. On observing the robust contrasts, it can be seen that both the null hypothesis of absence
18 We tried with other control variables, such as population density, the share of the agricultural sector, alternative measures of economic activity for the computation of the market access variable, etc., being the results quite similar to those shown here.
19 The LM-ERR test, in particular, along with the associated robust LM-EL, tests for the absence of residual spatial autocorrelation, which would occur by not including a structure of spatial dependence in the error term. The LM-LAG test is also used; this test, along with the associated robust LM-LE, tests for the absence of substantive spatial autocorrelation, which would be caused by the presence of spatial dependence in the endogenous variable.

Should cohesion policy focus on fostering R&D? Evidence from Spain 155
Investigaciones Regionales, 29 (2014) – Pages 139 to 164
of residual and substantive spatial dependence can be rejected at the conventional levels in equations (1) and (2), while in equation (3) this is true only for substantive spatial dependence at 10%. This being so, and taking into account the recommenda-tions made by Fingleton and López-Bazo (2006) 20, we decided to estimate a spatial autorregresive model (SAR). For it, we included an spatial lag of the dependent vari-able, ρW∆yi,96-09, where ρ is the spatial coefficient and W the distance matrix defined, as mentioned in the previous section, as the inverse of the standardized geographical distance or, more precisely, the inverse of the great-circle distance between provincial capitals. Thus, we now estimate the following three equations:
y y W yi i i i, , , ( )96 09 96 96 09 4− −= + + +α β ρ ε∆∆
y y Pat Pati i i i, , , ,96 09 96 1 96 2 96 09− −= + + + +α β γ γ ρρ εW yi i, ( )96 09 5− +∆ ∆ ∆
y y Pat Pati i i i, , , ,96 09 96 1 96 2 96 09− −= + + + +α β γ γ φφ ρ εZ W yi i i, , ( )96 96 09 6+ +−∆ ∆ ∆
The last three columns of Table 3 display the results of the estimation of equa-tions (4)-(6) by maximum likelihood 21. Explicitly, it is worthy to highlight three points. First, that all of the measures of relative statistical quality that are compara-ble between the two models, such as the logarithm of maximum likelihood (LIK), Akaike’s Information Criterion (AIC), and Schwartz’s Criterion (SC), demonstrate that these new equations achieve a better fit. Second, that the coefficient linked to the spatial lag of the dependent variable is positive and statistically significant in all cases, confirming the results of the earlier spatial dependence tests, i.e., that the be-havior of each province is closely related to the behavior of its neighboring provinc-es. Third, that for the rest of variables the results are roughly the same, which reveals the robustness of previous estimations; in particular, we want to stress the pivotal role of patents as a growth engine. Furthermore, if we consider provincial cohesion as a desirable goal or even as a core priority, the previous results obviously imply that cohesion policy focused on R&D promotion should play a more active role in the Spanish landscape.
5.2. Patents and spatial spillovers
As stated in the third section of the paper, there is positive spatial dependence in the provincial distribution of patents in Spain; in other words, provinces with high (low) number of patents do tend to be geographically concentrated. This being so, in this subsection we take a complementary view with the purpose of discerning whether there are also spatial spillovers; that is, whether an increase in the number
20 These authors indicate that spatial dependence in empirical growth models and convergence re-gressions is mostly a substantive phenomenon caused by technology diffusion and/or other externalities with a spatial dimension.
21 Spatial dependence invalidates the traditional OLS estimation method. Likewise, according to our tests, there are no problems of heteroskedasticity in this model.

156 Maza, A., Villaverde, J. and Hierro, M.ª
Investigaciones Regionales, 29 (2014) – Pages 139 to 164
of patents in a given province may bring forth an increase of per capita income in neighboring provinces.
To start with, it is crucial to point out herein that one of the main conclusions of the (theoretical and empirical) literature on this issue is that the aforementioned relationship depends critically on the way R&D investment is measured. When we measure it as the ratio of R&D expenditures over GDP, it is generally considered that technological knowledge is partially a public good so that the existence of spill-overs seems to be granted. On the contrary, when the effort on R&D is proxied, as in this paper, by patent data, then the improvement in technological knowledge is not considered as a public good but, for the very nature of patents, as a private good (Sedgley, 1998); therefore, the new knowledge is both excludable and rival, this making spillover effects much less relevant. This being said, it is also important to note that, contrary to what conventional R&D growth models generally assume, the duration of patents is not infinite. In fact, patents have a limited life (Noda, 2012), this meaning that spillover effects that initially are very low, if any, tend to grow over time.
In order to address this issue, here we estimate an enlarged version of equa-tions (5) and (6). Specifically, in order to test for the presence of spatial spillovers the spatial lags of patents (WPati,96) and patents growth (W∆Pati,96-09) have been included as independent variables (Rey and Montouri, 1999). The new regression equations are as follows:
y y Pat Pati i i i, , , ,96 09 96 1 96 2 96 09− −= + + + +α β γ γ ρρλ λ ε
W yWPat W Pat
i
i i i
,
, ,
(96 09
1 96 2 96 09
−
−
++ + + 77)
∆ ∆ ∆∆
y y Pat Pati i i i, , , ,96 09 96 1 96 2 96 09− −= + + + +α β γ γ φφρ λ λ
ZW y WPat W Pat
i
i i i
,
, , ,
96
96 09 1 96 2 96
++ + +− −− +09
8εi
( )∆ ∆
∆ ∆
Table 4. Patents and the existence of spatial spillovers
∆yi,96–09
Independent(7) (8)
constant 0.237***(0.053)
0.315***(0.077)
yi,96–0.028***
(0.006)–0.030***
(0.006)
Pati,960.006***(0.002)
0.005***(0.002)
∆Pati,96–090.055***(0.014)
0.034**(0.014)
HCi,960.001***(0.000)

Should cohesion policy focus on fostering R&D? Evidence from Spain 157
Investigaciones Regionales, 29 (2014) – Pages 139 to 164
Table 4. (Continue)
∆yi,96–09
Independent(7) (8)
Invi,96–0.000(0.000)
MAi,96–0.003(0.004)
Indi,960.000
(0.000)
Seri,960.001***(0.000)
W∆yi,96–090.732***(0.182)
0.600**(0.265)
WPati,960.009
(0.007)0.004
(0.007)
W∆Pati,96–090.098
(0.142)0.058
(0.142)
LIK 194.55 203.36
AIC –375.10 –382.72
SC –361.72 –359.78
Speed of convergence (%) 3.47 3.74
Half-life (years) 24.5 23.1
Notes: LIK = Logarithm of maximum likelihood; AIC= Akaike’s Information Criterion; SC = Schwartz’s Criterion. (***) significant at 1%; (**) significant at 5%; (*) significant at 10%. Standard errors for coefficient estimates are in parenthesis. p-Values for the statistics are in brackets.Source: OECD and own elaboration.
Table 4 reports the estimates. Two main conclusions can be drawn. First, regard-ing the influence of the original determining factors on income growth, it is important to note that the results are not substantially different to the previous ones. The only noteworthy difference is that the value of the β coefficient rises slightly in the two convergence equations. Second, and more important, the coefficients linked to the spatial lag are not statistically significant. This reflects that there is no evidence sup-porting the existence of spatial spillovers, so an increase in the number of patents in a province does not promote economic growth in its neighbors. This is in line with that predicted by theory, namely that a patent can be considered more a private than a public good (Sedgley, 1998), and, therefore, that it is necessary quite a long time to reverse this situation.
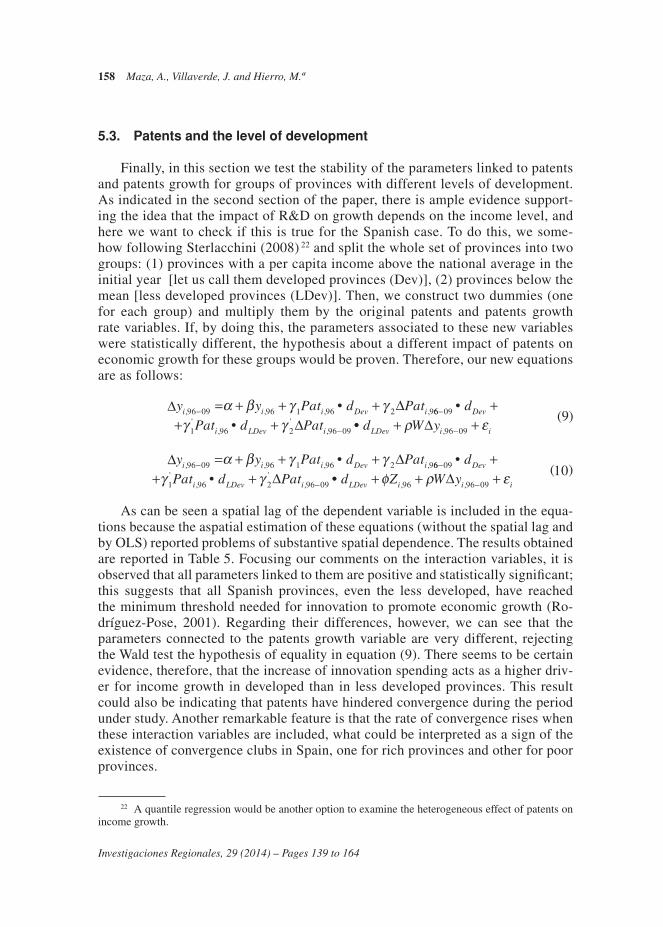
158 Maza, A., Villaverde, J. and Hierro, M.ª
Investigaciones Regionales, 29 (2014) – Pages 139 to 164
5.3. Patents and the level of development
Finally, in this section we test the stability of the parameters linked to patents and patents growth for groups of provinces with different levels of development. As indicated in the second section of the paper, there is ample evidence support-ing the idea that the impact of R&D on growth depends on the income level, and here we want to check if this is true for the Spanish case. To do this, we some-how following Sterlacchini (2008) 22 and split the whole set of provinces into two groups: (1) provinces with a per capita income above the national average in the initial year [let us call them developed provinces (Dev)], (2) provinces below the mean [less developed provinces (LDev)]. Then, we construct two dummies (one for each group) and multiply them by the original patents and patents growth rate variables. If, by doing this, the parameters associated to these new variables were statistically different, the hypothesis about a different impact of patents on economic growth for these groups would be proven. Therefore, our new equations are as follows:
y y Pat d Pati i i Dev i, , , ,•96 09 96 1 96 2 9− = + + +α β γ γ 66 09
1 96 2 96 09
−
−
++ +
••'
,'
,
d
Pat d PatDev
i LDev iγ γ ••( )
,d W yLDev i i+ +−ρ ε96 09
9∆ ∆
∆ ∆
y y Pat d Pati i i Dev i, , , ,•96 09 96 1 96 2 9− = + + +α β γ γ 66 09
1 96 2 96 09
−
−
++ +
••'
,'
,
d
Pat d PatDev
i LDev iγ γ ••( )
, ,d Z W yLDev i i i+ + +−φ ρ ε96 96 09
10∆ ∆
∆ ∆
As can be seen a spatial lag of the dependent variable is included in the equa-tions because the aspatial estimation of these equations (without the spatial lag and by OLS) reported problems of substantive spatial dependence. The results obtained are reported in Table 5. Focusing our comments on the interaction variables, it is observed that all parameters linked to them are positive and statistically significant; this suggests that all Spanish provinces, even the less developed, have reached the minimum threshold needed for innovation to promote economic growth (Ro-dríguez-Pose, 2001). Regarding their differences, however, we can see that the parameters connected to the patents growth variable are very different, rejecting the Wald test the hypothesis of equality in equation (9). There seems to be certain evidence, therefore, that the increase of innovation spending acts as a higher driv-er for income growth in developed than in less developed provinces. This result could also be indicating that patents have hindered convergence during the period under study. Another remarkable feature is that the rate of convergence rises when these interaction variables are included, what could be interpreted as a sign of the existence of convergence clubs in Spain, one for rich provinces and other for poor provinces.
22 A quantile regression would be another option to examine the heterogeneous effect of patents on income growth.

Should cohesion policy focus on fostering R&D? Evidence from Spain 159
Investigaciones Regionales, 29 (2014) – Pages 139 to 164
Table 5. Patents and differences according to the level of development
∆yi,96–09
Independent(9) (10)
constant 0.307***(0.067)
0.366***(0.067)
yi,96–0.032***
(0.007)–0.035***
(0.006)
Pati,96 • dDev0.006***(0.002)
0.006***(0.002)
∆Pati,96–09 • dDev0.084***(0.021)
0.042*(0.023)
Pati,96 • dLDev0.004***(0.002)
0.004***(0.002)
∆Pati,96–09 • dLDev0.042***(0.015)
0.031**(0.015)
HCi,960.001***(0.000)
Invi,96–0.000(0.000)
MAi,96–0.001(0.003)
Indi,960.000
(0.000)
Seri,960.001**(0.000)
W∆yi,96–090.681***(0.212)
0.597**(0.262)
LIK 195.63 204.37
AIC –377.27 –384.74
SC –363.88 –364.79
Speed of convergence (%) 4.21 4.61
Half-life (years) 21.0 19.6
Notes: LIK = Logarithm of maximum likelihood; AIC= Akaike’s Information Criterion; SC = Schwartz’s Criterion. (***) significant at 1%; (**) significant at 5%; (*) significant at 10%. Standard errors for coefficient estimates are in parenthesis. p-Values for the statistics are in brackets.Source: OECD and own elaboration.
6. Conclusions
This paper examines the relationship between R&D and economic growth and convergence across the Spanish provinces over the period 1995-2010. As its starting

160 Maza, A., Villaverde, J. and Hierro, M.ª
Investigaciones Regionales, 29 (2014) – Pages 139 to 164
point, it reviews the literature devoted to the issue, both from a theoretical and empi-rical perspective, pointing out that most papers support the idea that R&D is a driver for economic growth.
Subsequently, the analysis of the provincial distribution of R&D (proxied by the number of patents applications per million of inhabitants) offers some interesting re-sults. First, patents are characterized by a high volatility. Second, there are important differences between provinces, although they have decreased from 2000 onwards. Third, there are also clear signs of spatial dependence in the patents distribution, this meaning that provinces with high (low) values tend to be clustered; specifically, R&D is quite concentrated in the richest areas of the country.
After that, the main section of the paper evaluates the role played by patents on economic growth. To begin with, an absolute β-convergence equation is estimated as a benchmark, unveiling that a convergence process in per capita income has indeed taken place. Next, an analysis of conditional β-convergence is carried out including patents (in both levels and growth rates) as additional independent variables. The re-sults prove that innovation promotes economic growth. Then, and for the sake of ro-bustness, a group of control variables, such as human capital, the level of investment over GDP, market access and both industry and service sector shares, are included in order to better explain the performance of per capita income growth. The results regarding the positive effect of patents on economic growth do not change, this con-firming the robustness of the previous findings. With regard to the rest of variables, the coefficients linked to human capital and service sector share are positive and sta-tistically significant, which implies that educational attainment and the service sector foster economic growth.
Then, the paper checks for the presence of spatial spillovers and finds that they do not exist, a result that is probably related to the way R&D spending is measured. Finally, it also tests the possibility of the results being sensitive to the level of de-velopment of each province, finding that the impact of patents on economic growth seems to be higher in the most developed ones.
Overall, there seem to be sound reasons to keep that R&D distribution in itself increases provincial disparities. First, because innovative processes tend to cluster geographically where services and resources necessary to develop these processes are concentrated (Audretsch and Feldman, 1996); in other words, R&D tends to be concentrated in rich provinces. Second, because R&D effectively acts as a growth engine, especially in the richest provinces; this result is in line with those obtained for the European Cohesion Policy by Rodríguez-Pose and Novak (2013), whom indicate that Structural Fund investment bears higher outcomes in wealthier regions. And, third, because R&D (at least when it is proxied by patents) does not generate spatial spillovers that could benefit less developed provinces.
As stated in the introduction, some lessons related to the use of R&D as an instrument of cohesion policy at national level could be drawn from the previous conclusions. Should the Spanish case be considered as an example of what typically happens at the EU level, these lessons could also be extrapolated to the European

Should cohesion policy focus on fostering R&D? Evidence from Spain 161
Investigaciones Regionales, 29 (2014) – Pages 139 to 164
cohesion policy. Considering the trade-off that exists between efficiency and equity, the main point here refers to the specific role we want R&D policy to play in this respect. If, without forgetting the efficiency goal, we were mainly concerned with equity issues related to the increasing gap between rich and poor regions, it should be evident that the findings obtained in this paper support a cohesion policy more directly focused on fostering R&D efforts in the poorest regions, at both private and public levels. This could be done, for example, by creating more favorable condi-tions for investments in poor regions through funding R&D cooperative projects and/or improving their infrastructure endowments (Basile et al., 2008). Although the location of intensive R&D activities can distort regional specialization, it is also true that, as indicated by Mairate (2006: 171), «it can create a “snowfall effect” of new economic activities and [...] strengthen their capacity for adapting to economic change and to innovate». In addition, and also in view of the results obtained, we can state that cohesion policy should try to diffuse spillover effects more quickly and largely than up to now. By doing this, cohesion policy would achieve that R&D investments located in developed regions, more attractive than less developed ones, lead to a higher income growth not only in the richest regions but also in the others. Accordingly, helping to create joint research centers and research networks between rich and poor regions could prove very fruitful not only for boosting the role played by R&D as a cohesion enhancer but also for not hindering economic growth at the global level. In other words, it would be a good try to reconcile the trade-off between equity and efficiency.
Finally we want to stress that, while appealing, our results should be considered as furnishing only a broad picture of a much more complex phenomenon which re-quires further investigation. In particular, a clear avenue for future research would be to evaluate the robustness of these results by taking alternative estimation methodol-ogies and variables, and looking more deeply into the potential existence of endog-eneity problems in the estimations. Another possible extension of this work is, data allowing, to focus on all the European rather than only Spanish regions/provinces, as cohesion policies are usually established in Europe at the regional level. These and other questions provide new directions for future research.
7. References
Aghion, P., and Howitt, P. (1992): «A model of growth through creative destruction», Econo-metrica, 60, 323-351.
— (2007): «Capital, innovation, and growth accounting», Oxford Review of Economic Policy, 23(1), 79-93.
Alberdi Pons, X.; Gibaja Martíns, J. J., and Parrilli, M. D. (2014): «Evaluación de la fragmen-tación en los Sistemas Regionales de Innovación: Una tipología para el caso de España», Investigaciones Regionales, 28, 7-35.
Anselin, L. (1988): Spatial Econometrics: Methods and Models, Dordrecht, Kluwer Academic Publishers.
Audretsch, D., and Feldman, M. P. (1996): «R&D spillovers and the geography of innovation and production», American Economic Review, 86 (3), 630-640.

162 Maza, A., Villaverde, J. and Hierro, M.ª
Investigaciones Regionales, 29 (2014) – Pages 139 to 164
Barro, R., and Sala-i-Martin, X. (1992): «Convergence», Journal of Political Economy, 100(2), 223-251.
— (1995): Economic Growth, New York, McGraw-Hill, Inc.Basile, R.; Castellani, D., and Zanfei, A. (2008): «Location choices of multinational firms in
Europe: the role of EU cohesion policy», Journal of International Economics, 74(2), 328-340.
Bilbao-Osorio, B., and Rodríguez-Pose, A. (2004): «From R&D to innovation and economic growth in the EU», Growth and Change, 33(4), 434-455.
Bottazzi, L., and Peri, G. (2003): «Innovation and spillovers in regions: Evidence from Euro-pean patent data», European Economic Review, 47, 687-710.
Braunerhjelm, P.; Acs, Z.; Audretsch, D., and Carlsson, B. (2010): «The missing link: knowl-edge diffusion and entrepreneurship in endogenous growth», Small Business Economics, 34, 105-125.
Caselli, F. (2005): «Accounting for cross-country income differences», in Aghion, P., and Dur-lauf, S. (eds.), Handbook of Economic Growth vol. 1, chapter 9, 679-741.
Cowell, F. (1995): Measuring Inequality, 2nd edition, LSE Handbooks in Economics, London, Prentice Hall.
Dosi, G.; Llerena, P., and Labini, M. (2006): «The relationships between science, technologies and their industrial exploitation: an illustration through the myths and realities of the so-called “European Paradox”», Research Policy, 34, 1450-1464.
Ejermo, O.; Kander, A., and Svensso, M. (2011): «The R&D-growth paradox arises in fast-growing sectors», Research Policy, 40, 664-672.
Fingleton, B., and López-Bazo, E. (2006): «Empirical growth models with spatial effects», Papers in Regional Science, 85(2), 177-219.
Funke, M., and Niebuhr, A. (2005): «Regional geographic research and development spill-overs and economic growth: Evidence from West Germany», Regional Studies, 39(1), 143-153.
Garner, P. (2010): «A note on endogenous growth and scale effects», Economic Letters, 106, 98-100.
Goel, R., and Ram, R. (1994): «Research and development expenditures and economic growth: A cross-country study», Economic Development and Cultural Change, 42, 403-411.
Griliches, Z. (1990): «Patent statistics as economic indicators: A survey», Journal of Economic Literature, 28, 1661-1707.
Griliches, Z. (1992): «The search for R&D spillovers», Scandinavian Journal of Economics, 94, 29-47.
Grossman, G., and Helpman, E. (1991): Innovation and Growth in the Global Economy, Cam-bridge, MA: The MIT Press.
Hall, B. H.; Mairesse, J., and Mohnen, P. (2009): «Measuring the returns to R&D», in Hall, B. H., and Rosenberg, N. (eds.), Handbook of the Economics of Innovation vol. 2, chap-ter 24, 1034-1076.
Howitt, P. (1999): «Steady endogenous growth with population and R&D inputs growing», Journal of Political Economy, 107(4), 715-730.
Jones, C. (1995): «R&D based models of economic growth», Journal of Political Economy, 103, 759-784.
Jones, C., and Williams, J. C. (1998): «Measuring the social return to R&D», Quarterly Jour-nal of Economics, 113, 1119-1135.
— (2000): «Too much of a good thing? The economics of investment in R&D», Journal of Economic Growth, 5(1), 65-85.
Kealey, T. (1996): The Economic Laws of Scientific Research, London, Macmillan.Krugman, P. (1991): «Increasing returns and economic geography», Journal of Political
Econo my, 99, 483-499.
Should cohesion policy focus on fostering R&D? Evidence from Spain 163
Investigaciones Regionales, 29 (2014) – Pages 139 to 164
López-Rodríguez, J.; Faiña, A., and López-Rodríguez, J. L. (2007): «Human capital accumu-lation and geography: Empirical evidence from the European Union», Regional Studies, 41, 217-234.
López-Rodríguez, J., and Martínez, D. (2014): «R&D and non-R&D innovation expenditures: An analysis of their contribution to TPF growth in the EU», Mimeo.
Lucas, R. (1988): «On the mechanics of economic development», Journal of Monetary Eco-nomics, 22(1), 3-42.
Mairate, A. (2006): «The added value of European Union Cohesion policy», Regional Studies, 40(2), 167-177.
Maza, A.; Hierro, M., and Villaverde, J. (2010): «Measuring intra-distribution dynamics: An application of different approaches to the European regions», Annals of Regional Science, 45(2), 313-329.
— (2012): «Income distribution dynamics across European regions: Re-examing the role of space», Economic Modeling, 29, 2632-2640.
Nadiri, I. (1993): «Innovations and technological spillovers», NBER Working Paper No. 4423.Noda, H. (2012): «R&D-based models of economic growth reconsidered», Information, 15(2),
517-536.Peretto, P. (1998): «Technological change and population growth», Journal of Economic
Growth, 3(4), 283-311.Pessoa, A. (2010): «R&D and economic growth: How strong is the link?», Economics Letters,
107, 153-154.Quah, D. T. (1993): «Galton’s fallacy and the convergence hypothesis», Scandinavian Journal
of Economics, 95, 427-443.Rey, S., and Montouri, B. (1999): «U.S. regional income convergence: A spatial econometric
perspective», Regional Studies, 33, 143-156.Rodríguez-Pose, A. (2001): «Is R&D investment in lagging areas of Europe worthwhile? Theo-
ry and empirical evidence», Papers in Regional Science, 80, 275-295.Rodríguez-Pose, A., Novak, K. (2013): «Learning processes and economic returns in European
Cohesion policy», Investigaciones Regionales, 25, 7-26.Romer, P. (1986): «Increasing returns and long-run growth», Quarterly Journal of Economics,
94, 1002-1037.— (1990): «Endogenous technological change», Quarterly Journal of Economics, 98(supple-
mental issue), S71-S102.Salgado-Ugarte, I.; Shimizu, M., and Taniuchi, T. (1997): «Nonparametric assessment of mul-
timodality for univariate data», Stata Technical Bulletin, 27, 5-19.Sánchez, M.; Cano, V., and Esparza, E. (s.d.): «Un análisis de las patentes como indicadores.
Algunas consideraciones conceptuales», Disponible en http://www.ucm.es/info/ec/jec9/pdf/A11%20-%20S%e1nchez%20Padr%f3n,%20Miguel,%20Cano,%20Victor,%20Es-parza,%20Encarnaci%f3n,%20Los%20Arcos,%20Enrique.pdf.
Sedgley, N. (1998): «Technology gaps, economic growth and convergence across US states», Applied Economics Letters, 5, 55-59.
Silverman B. W. (1986): Density Estimation for Statistics and Data Analysis, London, Chap-man and Hall.
Solow, R. (1956): «A contribution to the theory of economic growth», Quarterly Journal of Economics, 70, 65-94.
— (1957): «Technical change and the aggregate production function», Review of Economics and Statistics, 39, 312-320.
Sterlacchini, A. (2008): «R&D, higher education and regional growth: Uneven linkages among European regions», Research Policy, 37, 1096-1107.
Strobel, T. (2012): «New evidence on the sources of EU countries’ productivity growth - indus-try growth differences from R&D and competition», Empirica, 39, 293-325.

164 Maza, A., Villaverde, J. and Hierro, M.ª
Investigaciones Regionales, 29 (2014) – Pages 139 to 164
Sylwester, K. (2001): «R&D and economic growth», Knowledge, Technology, and Policy, 13(4), 71-84.
Ulku, H. (2004): «R&D, innovation and economic growth: An empirical analysis», IMF Work-ing Paper, WO/04/185.
Wang, D.; Yu, T., and Liu, H. (2013): «Heterogeneous effect of high-tech industrial R&D spending on economic growth», Journal of Business Research, 66, 1990-1993.
Wei, Y.; Liu, X.; Song, H., and Romilly, P. (2001): «Endogenous innovation growth theory and regional income convergence in China», Journal of International Development, 13, 153-168.
Westmore, B. (2013): «R&D, patenting and growth: The role of public policy», OECD, ECO/WKP 39.
Young, A. (1998): «Growth without scale effects», Journal of Political Economy, 106, 41-63.

© Investigaciones Regionales, 29 (2014) - Pages 165 to 191Section Articles
Territorial Capital and the Effectiveness of Cohesion Policies: an Assessment for CEE Regions
Ugo Fratesi*, Giovanni Perucca**
ABSTRACT: On May 1st 2004, 10 Central and Eastern European (CEE) countries joined the EU and became fully eligible for communitarian financial support. While the conditions for eligibility are the same, at regional level CEE territories are char-acterized by very different socioeconomic settings. In particular, different regions are differently endowed with what has been labelled “territorial capital’, so that the endowment of public and private, material and immaterial assets significantly varies across regions, including infrastructure, private capital, human and social capital. This set of territorial conditions, enabling economic development to take place, is here assumed to impact the outcome of cohesion policies as well. This paper is hence aimed at assessing the role of specific territorial conditions on the efficient imple-mentation of cohesion policies in CEE NUTS3 regions. The analysis points out the mechanisms through which the endowment of specific territorial assets affects the outcome of Cohesion policies. It appears that for a large number of territorial capital assets, increasing returns are present and regions more endowed with specific types of territorial capital are more able to gain from policy investment in related fields.
JEL Classification: R10; R11; R58.
Keywords: Territorial Capital; Cohesion Policy; Central and Eastern European Countries.
Capital Territorial y efectividad de la Política de Cohesión Europea
RESUMEn: El 1 de mayo de 2004, diez países del centro y este de Europa se unieron a la UE y se convirtieron en elegibles para recibir financiación comunitaria. Aunque los criterios de elegibilidad son los mismos, a nivel regional los territorios de los países del centro y este de Europa se caracterizan por tener condiciones socioeconómicas muy distintas. En particular, las distintas regiones tienen unas do-taciones muy diferentes de lo que se ha denominado «capital territorial», de manera
165
Received: 1 february 2014 / Accepted: 5 august 2014.
* Politecnico di Milano, Department of Architecture, Built Environment and Construction Engineer-ing, Piazza Leonardo da Vinci 32, 20133 Milano. [email protected].
** Politecnico di Milano, Department of Architecture, Built Environment and Construction Engi-neering, Piazza Leonardo da Vinci 32, 20133 Milano. [email protected].

166 Fratesi, U. and Perucca, G.
Investigaciones Regionales, 29 (2014) – Pages 165 to 191
que la dotación de activos públicos y privados, materiales e inmateriales varía de forma significativa entre los distintos territorios. Este conjunto de condiciones terri-toriales, que facilita que el desarrollo económico tenga lugar, se asume en el contex-to de este trabajo que afecta también a los resultados de la política de cohesión. Este trabajo tiene por tanto como objetivo evaluar el papel y las condiciones territoriales específicas que tienen sobre la implementación eficiente de las políticas de cohesión a nivel de regiones NUTS3 en los países del CEE. El análisis señala los mecanismos a través de los cuales la dotación de activos territoriales específicos afectan a los resultados de las políticas de cohesión. Parece que una mayor dotación de activos territoriales específicos conlleva la presencia de rendimientos crecientes, y que las regiones mejor dotadas con tipos específicos de capital territorial son más capaces de obtener ganancias a partir de las inversiones realizadas en los diferentes campos.
Clasificación JEL: R10; R11; R58.
Palabras clave: Capital territorial; Política de Cohesión; Países del centro y este de Europa.
1. Introduction 1
On May 1st 2004, Central and Eastern European (CEE) countries (with the ex-ception of Romania and Bulgaria) joined the EU and became fully eligible for the Communitarian financial support. The vast majority of CEE regions shared the same macroeconomic conditions for funding eligibility, being most of them included in the Objective 1 category 2. Between 2004 and 2006 more than 21 billion euro were invested in projects and policies aimed at fostering the development and structural adjustment of CEE regions.
Despite the abovementioned homogeneity in the conditions for eligibility, how-ever, these regions were characterized by very different systems of territorial assets of economic, cultural, social and environmental nature. As pointed out by Camagni (2008) these elements, included under the comprehensive concept of territorial cap-ital, represent the development potential of places. In the words of the EU Commis-sion itself, the regional endowments of territorial capital raise relevant policy impli-cations, as «each region has a specific “territorial capital” that is distinct from that of other areas and generates a higher return for specific kinds of investments than for others, since these are better suited to the area and use its assets and potential more effectively» (European Commission, 2005, p. 1).
The aim of the present paper is to provide evidence on the relationship between the structural characteristics of the recipient regions of funds and the impact of the EU financial support on economic growth in CEE NUTS3 areas. The assumption
1 The research leading to these results has received partial funding from the European Union’s Sev-enth Framework Programme (FP7/2007-2013) under grant agreement «Growth-Innovation-Competitive-ness: Fostering Cohesion in Central and Eastern Europe» (GRINCOH).
2 All NUTS3 regions are included in the Objective 1 category apart from Prague and Bratislava.

Territorial Capital and the Effectiveness of Cohesion Policies: an Assessment for CEE Regions 167
Investigaciones Regionales, 29 (2014) – Pages 165 to 191
to be tested is that the outcome of public policies is mediated and reinforced by the presence of territorial capital. The focus on CEE regions is motivated by two reasons. First of all since, contrary to Western countries, all these regions became eligible for EU funding simultaneously; therefore there is not any asymmetry to be taken into account, such as learning effects on the capability of efficiently managing the resources. Secondly, as stated above, almost all regions are eligible for the same EU actions, i.e. those of the Objective 1 program.
This work places itself in the long stream of research focused on the outcomes of EU regional policies. To the best of our knowledge, however, almost none of these works systematically considered the role of the characteristics of receptive territories on the impact of the Cohesion policies.
The article is organized as follows. The next section is devoted to the definition of what is meant by territorial capital and to a brief review of the typologies of structural funds and of the literature on their impact on economic development. The third sec-tion is aimed at pointing out the link between territorial capital and EU funds and the mechanisms through which these two elements are expected to generate economic growth. Following some descriptive evidence on the data used in the present study, the fourth section presents the estimation methodology and the fifth one focuses on the interpretative analysis of the role of territorial capital in fostering the impact of EU funds. Finally, the last section summarizes the main conclusions and discusses which policy prescriptions stem from the analysis.
2. Territorial capital and the outcome of regional EU policies: evidence from the literature
2.1. Territorial capital
The literature on endogenous regional growth identified several factors impact-ing the macroeconomic performance of territories. Examples are provided by the intense research on social capital (Putnam, 1993), on private (Barro, 1991) and public capital (De Haan and Romp, 2007) and on human capital (Lucas, 1988).
An exhaustive classification of endogenous local assets was recently settled through the concept of territorial capital, firstly introduced by OECD (2001). Territo-rial capital is defined by the system of a variety of territorial assets having economic, cultural, social and environmental nature (Camagni, 2008). In order to succeed, re-gions and territories have to exploit the potential of this complex set of locally-based factors. Camagni (2008) provided a taxonomy for these elements, based on their degree of materiality and rivalry. Rather than a simple list of local assets, this ap-proach explicitly defines their properties, allowing to identify potential interactions and policy implication.
The graphical representation of territorial capital proposed by Camagni (2008) is reported in Figure 1.

168 Fratesi, U. and Perucca, G.
Investigaciones Regionales, 29 (2014) – Pages 165 to 191
Figure 1. Territorial capital: a taxonomy
Privategoods
Club goods,impure
public goods
Publicgoods
c
Private fixed capital stockPecuniary externalitiesToll goods
i
Relational private services operating on:— External linkages for firms— Transfer of R&D results
f
Human capitalPecuniary externalities
e
Relational capital
b
Proprietary networksCollective goods:— Landscape— Cultural heritage
a
Resources:— Natural— Cultural (punctual)Social overhead capital:Infrastructure
h
Cooperation networksGovernance on land and cultural resources
g
Agglomeration and district economiesAgencies for R&D transcodingReceptivity enhancing toolsConnectivity
d
Social capital:— Institutions— Behavioural modes, valuestrust, reputation
Tangible goods (hard) Mixed goods (hard + soft) Intangible goods
Materiality(high) (low)→
(hig
h)(lo
w)
Riv
alry
→
Source: Camagni (2008).
Recalling what suggested by the European Commission (2005), different kinds of investments are likely to have different returns based on the peculiar territorial cap-ital endowments of each region. EU Cohesion policies, a program of regional public investments in a set of diversified fields (from R&D to transport infrastructure, from SME to social inclusion) is perfectly suited for testing this assumption.
2.2. Cohesion policies (2000-2006): instruments and actions
In the period 2000-2006 the EU budget for the communitarian regional policies was about 213 billion euro. These funds were managed by three main instruments, the two Structural Funds and the Cohesion Fund. As far as the former are concerned, the European Regional Development Fund (ERDF) mainly contributed to assisting those regions whose development is lagging behind and those undergoing economic conversion or experiencing structural difficulties. The European Social Fund (ESF), on the other hand, mainly provided assistance under the EU employment strategy 3.
3 Apart from these two instruments, two other funds under the CAP involved regional development issues, even if to a more limited extent, namely the EuropeanAgriculturalGuidance and Guarantee Fund (EAGF) and the Financial Instrument for Fisheries Guidance (FIFG).

Territorial Capital and the Effectiveness of Cohesion Policies: an Assessment for CEE Regions 169
Investigaciones Regionales, 29 (2014) – Pages 165 to 191
The Cohesion Fund (CF) co-financed actions in the fields of the environment and transport infrastructure of common interest with a view to promoting economic and social cohesion and solidarity between member states. Eligibility was restricted to member states whose per capita gross national product (GNP) is less than 90% of the Community average.
The budget devoted to these funds (approximately one third of the overall EU budget) finances different types of actions and initiatives. Between 2000 and 2006 these programmes of intervention were classified into objectives and initiatives. The largest share of the resources (182.5 billion Euro) were aimed at pursuing the three communitarian objectives. Objective 1, devoted to regions with a per capita gross domestic product (GDP) lower than 75% of the community average, covered about the 69.1% of the total allocations and was financed by the ERDF and by the ESF. These funds financed also the Objective 2, covering about 11.5% of the total allo-cations. Finally, Objective 3 was financed by the ESF and covered about 12.5% of the funds.
A lower budget (10 billion euro) was available for supporting four initiatives 4.
The data set employed in the present paper covers ERDF and CF commitments in NUTS3 EU regions. Table 1 shows the amount of commitments in CEE countries between 2004 and 2006. It is worth noting that, beyond the classification of actions into objectives and initiatives, EU funds are allocated to a variety of policies and interventions, from the support to private firms to actions for enlarging women par-ticipation in the labour market, to the building of transport infrastructure. All these axes of expenditure are classified, in Table 1, into four categories, according to the disaggregation reported in Appendix A.
The largest share of funds (85%) was allocated to the realization of basic infra-structure, followed by programmes aimed at supporting the productive environment (15%). Being almost all CEE regions eligible for the Objective 1 actions, the vast majority of commitments fell in this category (43 per cent) and under the CF (53 per cent).
4 The Interreg III initiative (financed through the ERDF) was aimed at stimulating cross-border, transnational and inter-regional cooperation. Leader+ initiative (EAGGF) promoted rural development. Equal and Urban II initiatives were respectively focused on the reduction of any form of discrimination and inequality in access to the labour market (ESF) and to the pro-motion of the socio-economic regeneration of declining towns and cities (ERDF).A last family of interventions concerns the innovative measures aimed at promoting new strategies for devel-opment. About the 0.65% of the Cohesion policy budget was devoted to the promotion of such activities.

170 Fratesi, U. and Perucca, G.
Investigaciones Regionales, 29 (2014) – Pages 165 to 191
2.3. Cohesion policies and economic development: evidence from the literature
A long stream of research focused on the impact of Cohesion policies on eco-nomic growth, from both a national and regional perspective. As far as the latter is concerned 5, empirical evidence provides contrasting results.
Analysing the case of Eastern Germany between 1995 and 2004, Eggert et al. (2007) found a positive impact of Cohesion policies on regional convergence, but a negative effect on aggregate growth. Dall’erba and Le Gallo (2008) dealt with the case of 145 EU regions between 1989 and 1999. Even if processes of regional con-vergence took place in that period, the authors found no causal relationships between funds and economic growth. For the same years Esposti and Bussoletti (2008) eval-uated the effect of Cohesion policies in Objective1 regions, finding a positive overall impact of regional funds, whose magnitude is however negligible and may become, in some cases, even negative, due to country effects.
The majority of studies, however, suggested a positive impact of Cohesion pol-icies on economic growth (Ramajo et al., 2008; Dall’Erba, 2005).While the above-mentioned studies dealt with the time period pre-2000, some works assessed the wave of funding programmes 2000-2006, the first also including CEE regions. Becker et al. (2010) were able to estimate the impact of Objective 1 actions on regional GDP growth in monetary terms. According to their findings, each Euro of transfers leads to 1.20 Euro of additional GDP. Similar evidence occurred, as far as Objective 1 regions
5 Also country studies on the same issue provided mixed evidence. A negative impact of the Structur-al Funds Programme on GDP growth was found by Boldrin and Canova (2001), while the opposite holds for the evaluation by Midelfart-Knarvik and Overman (2002). Other scholars (Leonardi, 2006) claimed that the impact of Cohesion policies significantly varied across countries.
Table 1. ERDF and CF expenditure commitments in CEE regions, 2004-2006.
Productive Environment
Human Resources
Basic Infrastructure
Other Total %
ERDF Objective1 2,849 182 5,749 284 9,065 43%
ERDF Objective2 49 7 74 4 134 1%
CF 0 0 11,028 132 11,160 52%
Urban II 0 0 0 0 0 0%
Interreg III 287 56 353 50 747 4%
TOTAL 3,186 246 17,204 471 21,106 100%
% 15% 1% 82% 2% 100%
Millions of Euro.
Source: SWECO (2008).

Territorial Capital and the Effectiveness of Cohesion Policies: an Assessment for CEE Regions 171
Investigaciones Regionales, 29 (2014) – Pages 165 to 191
are concerned, in the analysis by Mohl and Hagen (2010). More recently Becker et al. (2012) suggested that in more than one third of the recipient regions the intensity of funding was above the most efficient level, and they estimated that in 18% of the regions a reduction of transfers would not lead to a slowdown in economic growth.
This divergence in the results of the literature on Cohesion policies reflects the variety of approaches and techniques employed in the studies summarized above 6.In particular, a problematic issue is represented by the classification of the funds. When investigating the relationship between investments and economic growth, almost all works did not distinguish among the axes of expenditure of Cohesion policies. As pointed out by Dall’erba et al. (2009) the expected impact of an investment in public infrastructure is likely to be very different to the outcome of policies aimed at the reduction of long-term unemployment. Based on a similar reasoning Rodríguez-Pose and Fratesi (2004) classified EU funds according to the different axes of intervention. Their results showed that only funds directed to education and human capital hada positive and significant impact on economic growth in the period 1989-1999.
The approach adopted in the present paper is similar. Our assumption is that Cohesion policy investments can be classified into two main categories. The first one includes those interventions not principally aimed at fostering economic growth but rather at reaching social and political outcomes. Measures for the reduction of inequalities and for the support of cohesion and sustainability pertain to this group. The second category of investments comprehends all the policies and programmes whose main objective is to promote economic growth and competitiveness. The pro-vision of new infrastructures, R&D incentives, support to large companies and SMEs are examples for such interventions. This classification is needed since the role of territorial capital on the outcome of Cohesion policies is assumed to differ between the two typologies of investments, as discussed in the next section.
3. Territorial capital, Cohesion policies and economic growth
3.1. The role of territorial capital on the effectiveness of Cohesion policies: ex-ante assumptions
Based on the literature and evidence summarized in the previous section, the research question which will be addressed by the present paper is what is the re-lationship between territorial capital, Cohesion policies and economic growth. The theoretical assumption to be tested is that cohesion policies and territorial capital concur in fostering economic growth through two different mechanisms, as depicted in Figure 2.
6 Among other things, the lack of counterfactual evidence represents a concern in such studies (Becker et al., 2010). Reverse causality between eligibility for funds and economic growth was discussed by Bouvet (2005) and Dall’erba and Le Gallo (2008). The issue on the territorialisation of Cohesion pol-icies and their implementation at different institutional levels was examined by Bachtler et al. (2013) and Ferry and McMaster (2013).

172 Fratesi, U. and Perucca, G.
Investigaciones Regionales, 29 (2014) – Pages 165 to 191
In the short run territorial capital is assumed to mediate the impact of the funds (lower side of Figure 2). Following a place-based approach to development strategies (Barca, 2009; OECD, 2009), any policy is implemented in a specific place, defined by peculiar cultural, social, economic characteristics or, in a nutshell, by a distinc-tive endowment of territorial capital. These territorial conditions are not neutral with respect to the policy outcomes (Pike et al., 2006). Moreover, these local factors are expected to mediate the impact of both categories of policies identified in the previ-ous section.
In the medium and long run, however, Cohesion policies are also aimed at the generation and accumulation of territorial capital, which will be the prerequisite for economic growth in the longer run (upper side of Figure 2). The building of a new highway, for instance, will lead to an increase in the infrastructural endowment of the region (box a, Figure 1). Policies supporting women participation in the labour market are likely to produce positive spillovers on the social capital of a given place (box d, Figure 1). The enriched endowment of territorial capital, in turn, is expected to promote economic growth (Capello and Perucca, 2014).
These accumulation processes require different amounts of time. Investments in infrastructure, R&D, entrepreneurship are likely to impact economic growth in the short run, while the financing of social inclusion or sustainable development policies are assumed to manifest their results in the long run.
The focus of this paper is on the medium term mechanisms highlighted by the arrows in the lower part of Figure 2. The outcome of the first years of Cohesion policy expenditure (2004-2006) on economic growth in CEE regions is measured on the regional GDP growth between 2006 and 2010. Therefore, among the 20 available axes of expenditure (reported in the Appendix A) we just considered those
Figure 2. Territorial capital, Cohesion policies and economic growth
Promote cohesion,sustainability, reduction of
inequalities and other socialand political goals
Foster economiccompetitiveness through R&D,
infrastructure, measures forSME and large companies
Territorialcapital
Territorialcapital
Funds
Short run Medium run Long run
Economic Growth
Economic Growth

Territorial Capital and the Effectiveness of Cohesion Policies: an Assessment for CEE Regions 173
Investigaciones Regionales, 29 (2014) – Pages 165 to 191
belonging to the category of investments directly aimed at fostering economic de-velopment.
The purpose of this paper is to investigate the relationship between new territorial capital (i.e. the EU funds invested in each region), the regional endowment at the beginning of the period of implementation of the Cohesion policies (2004) and the economic growth observed in the subsequent years (2006-2010).This research ques-tion was not inspected by previous literature, at least as far as Cohesion policies are concerned. Nevertheless, some works addressed this issue in other contexts. Resmini and Casi (2013) focused on the role of territorial capital in enhancing FDI. Their findings show that the impact of FDI is constrained by the regional socio-economic characteristics, in particular by the endowment of intangible elements (boxes d, e, f in Figure 1). In a recent study Dall’erba and Llamosas-Rosas (2013) analysed the rela-tionship between territorial factors and the outcome of federal spending in the USA, pointing out the interaction between public expenditure and local elements such as human capital and entrepreneurship. These findings reinforce the interest towards a similar analysis on Cohesion policies.
To reach this goal the first step consists in the definition of an empirical measure-ment of territorial capital, based on the theoretical framework discussed in section 2.
3.2. Territorial capital: an empirical measurement
The objective to provide an empirical measurement of territorial capital for CEE NUTS3 is constrained by the availability of data at a small spatial level, especially when considering the indicators of the «innovative cross», characterized by interme-diate levels of both rivalry and materiality. Nevertheless, the NUTS3 classification is the most relevant when dealing with territorial capital (Camagni, 2008). NUTS2 regions, in fact, are too large for capturing the variety of socio-economic characteris-tics of places and may include heterogeneous territories within. Moreover, the choice of this smaller territorial scale allows increasing the sample of regions. Starting from the tangible assets, those owing low levels of materiality are proxied by an index of the multimodal accessibility of a given place (Figure 3), whose role in fostering economic growth refers to the size of the regional market potential (Redding and Sturm, 2008). Based on this literature, physical accessibility is expected to reinforce the impact of policies aimed at assisting firms (axes 15 and 16, Appendix A). Keep-ing other things constant, companies able to reach a broader market are more likely to get a higher return on the investment. On the other hand, assuming a diminishing productivity of transport investments (Banister and Berechman, 2001), we expect the degree of accessibility to be negatively related to the return of the funds spent on basic infrastructures (axes 31-34).
The availability of statistics on impure public goods, such as cultural heritage and monuments, included in box b is extremely limited and not fully comparable across countries. For this reason we chose as an empirical measurement for this dimension the per capita number of bed places in tourists accommodation facilities, based on

174 Fratesi, U. and Perucca, G.
Investigaciones Regionales, 29 (2014) – Pages 165 to 191
the assumption that the supply of bed places is positively correlated with the attrac-tiveness of each place. This territorial capital element is expected to boost economic growth in regions implementing projects related to tourism (axis 17).
The stock of private capital (box c) is captured by the per capita number of com-puters with active Internet Protocol (IP) addresses. Even if the diffusion of ICT may not be constant across sectors (Becchetti and Adriani, 2005) the number of internet connections is associated to the endowment of private capital in the region. This ter-ritorial capital variable has been tested in interaction with the structural fund invest-ments in productive environment (axes 15 and 16) and labor market policies (21-24). However, the potential link between the number of IP addresses and the regional sectoral specialization prevents us from getting significant results.
The proxy for social capital (box d) is represented by the gender inequalities measured by the labor market participation of women. The relationship between traditional indicators of social capital, as for instance trust (Fukuyama, 2001), and gender unbalances was discussed in the literature (Rothstein and Stolle, 2003). This component of territorial capital is expected to reinforce the impact of policies fo-cused on the training and inclusion of the labor force (axes 21-25).
Human capital (box f) is measured in terms resident population by educational attainment. As pointed out by the long stream of research on this form of capital (Lu-
Figure 3. Territorial capital: an empirical measurement for CEE NUTS3 regions
Privategoods
Club goods,impure
public goods
Publicgoods
c
IP addresses
i
Workforce by ISCO function
f
Resident population by ISCED educational attainment
eb
Bed places in tourists accomodation facilities
a
Multimodal accessibilityNatural capital
h
g
Urban/rural typology
d
Female unemployment rate
Tangible goods (hard) Mixed goods (hard + soft) Intangible goods
Materiality(high) (low)→
(hig
h)(lo
w)
Riv
alry
→(h
igh)
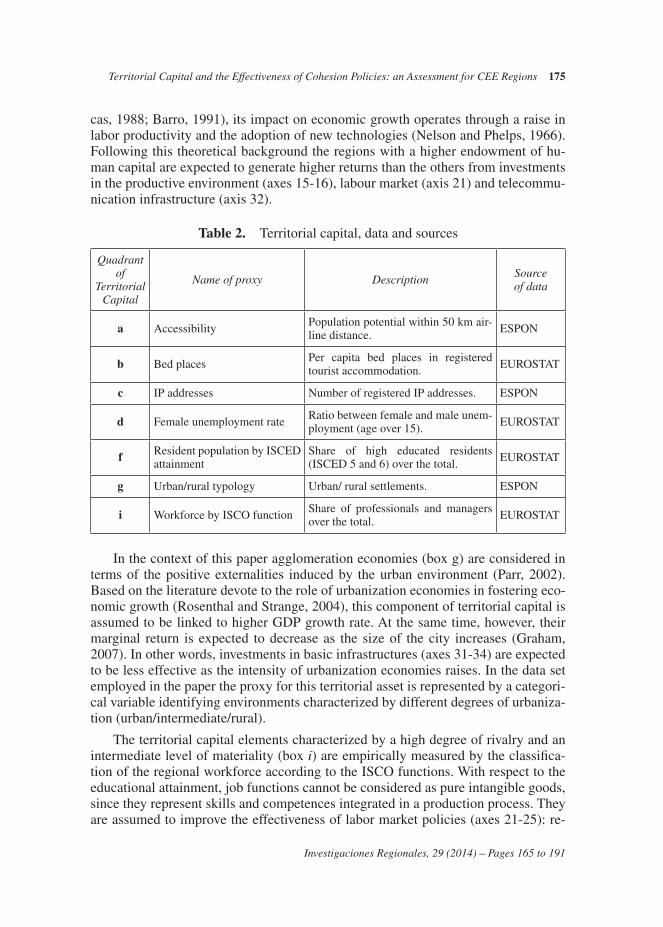
Territorial Capital and the Effectiveness of Cohesion Policies: an Assessment for CEE Regions 175
Investigaciones Regionales, 29 (2014) – Pages 165 to 191
cas, 1988; Barro, 1991), its impact on economic growth operates through a raise in labor productivity and the adoption of new technologies (Nelson and Phelps, 1966). Following this theoretical background the regions with a higher endowment of hu-man capital are expected to generate higher returns than the others from investments in the productive environment (axes 15-16), labour market (axis 21) and telecommu-nication infrastructure (axis 32).
Table 2. Territorial capital, data and sources
Quadrant of
Territorial Capital
Name of proxy DescriptionSource of data
a Accessibility Population potential within 50 km air-line distance. ESPON
b Bed places Per capita bed places in registered tourist accommodation. EUROSTAT
c IP addresses Number of registered IP addresses. ESPON
d Female unemployment rate Ratio between female and male unem-ployment (age over 15). EUROSTAT
f Resident population by ISCED attainment
Share of high educated residents (ISCED 5 and 6) over the total. EUROSTAT
g Urban/rural typology Urban/ rural settlements. ESPON
i Workforce by ISCO function Share of professionals and managers over the total. EUROSTAT
In the context of this paper agglomeration economies (box g) are considered in terms of the positive externalities induced by the urban environment (Parr, 2002). Based on the literature devote to the role of urbanization economies in fostering eco-nomic growth (Rosenthal and Strange, 2004), this component of territorial capital is assumed to be linked to higher GDP growth rate. At the same time, however, their marginal return is expected to decrease as the size of the city increases (Graham, 2007). In other words, investments in basic infrastructures (axes 31-34) are expected to be less effective as the intensity of urbanization economies raises. In the data set employed in the paper the proxy for this territorial asset is represented by a categori-cal variable identifying environments characterized by different degrees of urbaniza-tion (urban/intermediate/rural).
The territorial capital elements characterized by a high degree of rivalry and an intermediate level of materiality (box i) are empirically measured by the classifica-tion of the regional workforce according to the ISCO functions. With respect to the educational attainment, job functions cannot be considered as pure intangible goods, since they represent skills and competences integrated in a production process. They are assumed to improve the effectiveness of labor market policies (axes 21-25): re-

176 Fratesi, U. and Perucca, G.
Investigaciones Regionales, 29 (2014) – Pages 165 to 191
gional labor markets marked by low-level functions are expected to be less capable than the others to implement inclusive labor policies.
Finally, data at NUTS3 level are unfortunately not available for the components of territorial capital included in boxes e and h.
4. Methodology and general results of structural fund on growth
In order to estimate the impact of territorial capital on structural funds effec-tiveness a cross section regression model is used. Panel data, in fact, only exist for expenditure at an aggregate level (total amount), which is not relevant in this context. Since on the contrary expenditure at category level is only available for the full pro-gramming period 2000-2006, a cross section model is the only available option.
At the basis of the analysis, used as benchmark for the insertion of the other regressors, there is a traditional Barro-like regional growth model, taking the form:
ln(GDPi,2010) – ln(GDPi,2006) = lnGDPi + specializationi + reg._typologyi + ei (1)
where regions i are the 108 CEE regions of the sample, and the explained growth rate is the one between 2006 and 2010, i.e. the growth rate in the four years after the policy expenditure has taken place.
Moreover, the regression includes a number of controls, quite standard in the literature, which are inserted in order to avoid an omitted variables bias in the regres-sions:
— regional specialization (measured by the share of workers employed in the agricultural sector);
— the regional typology (measured by a dummy for those regions in industrial transition industrialization, deindustrialization and structural change, accord-ing to ESPON 2010) 7;
— regional per capita GDP at the beginning of the period, included in order to account for the degree of development of the region and all other factors correlated with it;
— finally, country dummies are inserted in order to consider the national fac-tors of regional growth, which are highly relevant since, especially in pe-riods of macroeconomic trouble, the national conditions are determinants of paramount importance, due to aspect such as public finance, de-valua-tion/re-valuation, the economic regulation setting, the legal system and the likes.
7 Regions are classified according to the on-going process of industrial restructuring in four cat-egories: regions with manufacturing branches losing importance, regions with manufacturing branches gaining importance, regions with internal (within the same sectors of specialization) industrial structural change, regions with a stable composition of their productive sector (source: ESPON, 2010).
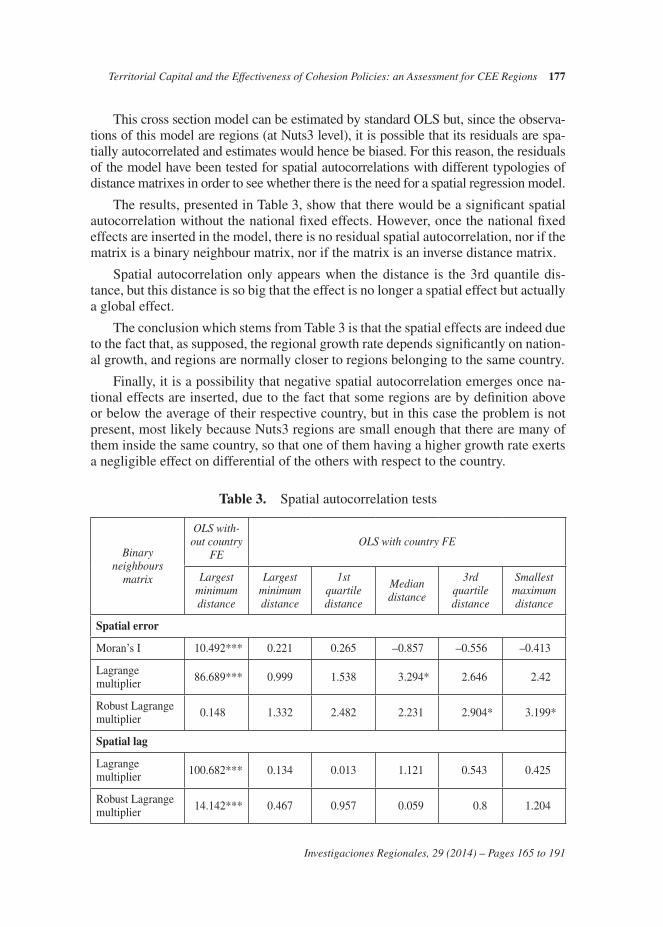
Territorial Capital and the Effectiveness of Cohesion Policies: an Assessment for CEE Regions 177
Investigaciones Regionales, 29 (2014) – Pages 165 to 191
This cross section model can be estimated by standard OLS but, since the observa-tions of this model are regions (at Nuts3 level), it is possible that its residuals are spa-tially autocorrelated and estimates would hence be biased. For this reason, the residuals of the model have been tested for spatial autocorrelations with different typologies of distance matrixes in order to see whether there is the need for a spatial regression model.
The results, presented in Table 3, show that there would be a significant spatial autocorrelation without the national fixed effects. However, once the national fixed effects are inserted in the model, there is no residual spatial autocorrelation, nor if the matrix is a binary neighbour matrix, nor if the matrix is an inverse distance matrix.
Spatial autocorrelation only appears when the distance is the 3rd quantile dis-tance, but this distance is so big that the effect is no longer a spatial effect but actually a global effect.
The conclusion which stems from Table 3 is that the spatial effects are indeed due to the fact that, as supposed, the regional growth rate depends significantly on nation-al growth, and regions are normally closer to regions belonging to the same country.
Finally, it is a possibility that negative spatial autocorrelation emerges once na-tional effects are inserted, due to the fact that some regions are by definition above or below the average of their respective country, but in this case the problem is not present, most likely because Nuts3 regions are small enough that there are many of them inside the same country, so that one of them having a higher growth rate exerts a negligible effect on differential of the others with respect to the country.
Table 3. Spatial autocorrelation tests
Binary neighbours
matrix
OLS with-out country
FEOLS with country FE
Largest minimum distance
Largest minimum distance
1st quartile distance
Median distance
3rd quartile distance
Smallest maximum distance
Spatial error
Moran’s I 10.492*** 0.221 0.265 –0.857** –0.556** –0.413**
Lagrange multiplier 86.689*** 0.999 1.538 3.294** 2.646** 2.42**
Robust Lagrange multiplier 0.148*** 1.332 2.482 2.231** 2.904** 3.199**
Spatial lag
Lagrange multiplier 100.682*** 0.134 0.013 1.121** 0.543** 0.425**
Robust Lagrange multiplier 14.142*** 0.467 0.957 0.059** 0.8** 1.204**

178 Fratesi, U. and Perucca, G.
Investigaciones Regionales, 29 (2014) – Pages 165 to 191
Inverse distance matrix
OLS without
country FEOLS with country FE
Largest minimum distance
Largest minimum distance
1st quartile distance
Median distance
3rd quartile distance
Smallest maximum distance
Spatial error
Moran’s I 11.023*** 1.009 1.094 –2.221** –2.825** –0.621**
Lagrange multiplier 92.561*** 0.172 0.517 2.563** 1.253** 0.72**
Robust Lagrange multiplier 0.518*** 0.464 1.007 0.531** 0.607** 1.385**
Spatial lag
Lagrange multiplier 106.992*** 0.003 0.033 3.097** 4.092*** 3.106**
Robust Lagrange multiplier 14.949*** 0.295 0.524 1.064** 3.446** 3.770**
*** significant at 1%, ** significant at 5%, * significant at 10%.
The basic regression model (1st column of Table 4) has a high R2, despite of the fact that not all regressors are significant. Significant regressors include the dummy for structural change regions, which is negative and the country dummies, since na-tional aspects are as expected highly relevant to regional growth. Moreover, the dum-my for deindustrialization is borderline significant, with a p-value very close to 0.1.
Although some regressors are unsignificant, the model is robust to the subtraction of some of them, therefore we chose to keep the full specification as the basis for the analysis which will follow.
Finally, also the normality of residuals have to be tested. According to the Shap-iro-Wilk W test for normality it is not possible to reject the hypothesis that the resid-uals are normally distributed.
With this standard model as benchmark, the significance of structural funds ex-penditure has been tested. The standard model of regression has been added up with the commitment of structural funds as in the following equation (2), which extends equation (1):
ln(GDPi,2010) – ln(GDPi,2006) = lnGDPi + specializationi + reg._typologyi + share_ fundsi,j + ei
(2)
where j (= 1,..,19) represents the two-digit expenditure classification, and the shares of funds include all the actions and programs covered in the database. All other vari-ables have the same notation of equation 1.
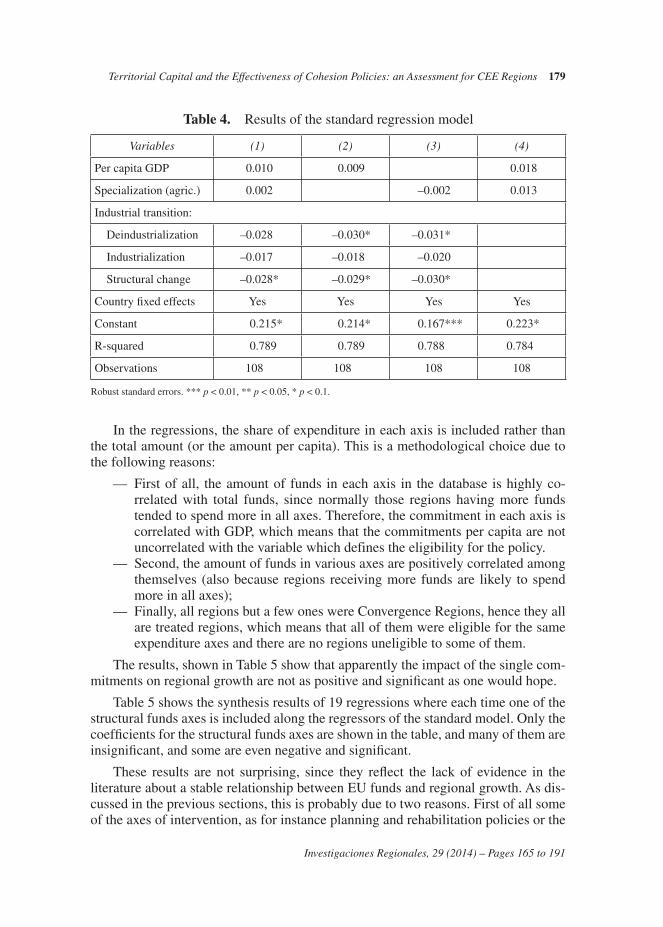
Territorial Capital and the Effectiveness of Cohesion Policies: an Assessment for CEE Regions 179
Investigaciones Regionales, 29 (2014) – Pages 165 to 191
Table 4. Results of the standard regression model
Variables (1) (2) (3) (4)
Per capita GDP 0.010* 0.009* 0.018*
Specialization (agric.) 0.002* –0.002** 0.013*
Industrial transition:
Deindustrialization –0.028* –0.030* –0.031***
Industrialization –0.017* –0.018* –0.020**
Structural change –0.028* –0.029* –0.030***
Country fixed effects Yes Yes Yes Yes
Constant 0.215* 0.214* 0.167*** 0.223*
R-squared 0.789* 0.789* 0.788*** 0.784*
Observations 108* 108* 108 108
Robust standard errors. *** p < 0.01, ** p < 0.05, * p < 0.1.
In the regressions, the share of expenditure in each axis is included rather than the total amount (or the amount per capita). This is a methodological choice due to the following reasons:
— First of all, the amount of funds in each axis in the database is highly co-rrelated with total funds, since normally those regions having more funds tended to spend more in all axes. Therefore, the commitment in each axis is correlated with GDP, which means that the commitments per capita are not uncorrelated with the variable which defines the eligibility for the policy.
— Second, the amount of funds in various axes are positively correlated among themselves (also because regions receiving more funds are likely to spend more in all axes);
— Finally, all regions but a few ones were Convergence Regions, hence they all are treated regions, which means that all of them were eligible for the same expenditure axes and there are no regions uneligible to some of them.
The results, shown in Table 5 show that apparently the impact of the single com-mitments on regional growth are not as positive and significant as one would hope.
Table 5 shows the synthesis results of 19 regressions where each time one of the structural funds axes is included along the regressors of the standard model. Only the coefficients for the structural funds axes are shown in the table, and many of them are insignificant, and some are even negative and significant.
These results are not surprising, since they reflect the lack of evidence in the literature about a stable relationship between EU funds and regional growth. As dis-cussed in the previous sections, this is probably due to two reasons. First of all some of the axes of intervention, as for instance planning and rehabilitation policies or the

180 Fratesi, U. and Perucca, G.
Investigaciones Regionales, 29 (2014) – Pages 165 to 191
interventions focused on forest, are not primarily devoted to the pursue of economic goals. Second, confirming our hypothesis, investments per se are not a guarantee for speeding up economic growth, but they gain effectiveness only in conjunction with some territorial enabling conditions.
To test the hypothesis that the impact of structural funds is mediated by the en-dowment of territorial capital of the regions, and expenditure per se is not effective if it is not activated by the prerequisite of the region having the relevant territorial
Table 5. Estimation results for the individual axes of commitments
Commitment categories Coefficient
1. PRODUCTIVE ENVIRONMENT
11 Agriculture –0.031
12 Forestry –0.106***
13 Promoting the adaptation and the development of rural areas –0.006**
14 Fisheries –3.491
15 Assisting large business organisations –0.002
16 Assisting SMEs and the craft sector –0.000
17 Tourism –0.003**
18 Research, technological development and innovation (RTDI) –0.000
2. HUMAN RESOURCES
21 Labour market policy –0.027***
22 Social inclusion –0.022***
23 Educational and vocational training not linked to a specific sector –0.001
24 Workforce flexibility, entrepreneurship, innovation, info. and comm. –0.005
25 Positive labour market actions for women –0.186
3. BASIC INFRASTRUCTURE
31 Transport infrastructure –0.000
32 Telecommunications infrastructure and information society –0.005***
33 Energy infrastructures (production, delivery) –0.001
34 Environmental infrastructure (including water) –0.000
35 Planning and rehabilitation –0.006***
36 Social and public health infrastructure –0.001
Note: only shown are the coefficients of the single axes, obtained by estimating 19 regressions where the basic model regressors are included and each time only one of the axes is included.Robust standard errors. *** p < 0.01, ** p < 0.05, * p < 0.1.

Territorial Capital and the Effectiveness of Cohesion Policies: an Assessment for CEE Regions 181
Investigaciones Regionales, 29 (2014) – Pages 165 to 191
capital assets, territorial capital is added to the previous specification of the model as in the following equation:
ln(GDPi,2010) – ln(GDPi,2006) = lnGDPi + specializationi + + reg._typologyi + share_ fundsi,j + Xi + ei
(3)
where Xi represents the set of territorial capital assets and all other variables retain the same meaning they had before.
Then, the interactions between territorial capital and EU structural funds com-mitments are added to the model:
ln(GDPi,2010) – ln(GDPi,2006) = lnGDPi + specializationi + reg._typologyi + + share_ fundsi,j + Xi + (share_ fundsi,j) + Xi+ ei
(4)
An analysis including steps 3 and 4 cannot be performed on all 19 axes but only on those expenditure axes for which it theoretically relevant and empirically feasible.
The empirical analysis, presented in the next sub-section will hence focus on a subset of axes, those where:
— There exist a sufficiently appropriate variable of territorial capital which is re-lated to the expenditure item. As it was shown in Section 3, empirical proxies of territorial capital are not always easily available. Moreover, the variable of territorial capital has to be clearly related to the policy axis, at least theo-retically, and there are policy axes for which none of the proxies outlined in Section 3 are relevant.
— Expenditure is intended or expected to impact on economic growth and not only socio-territorial assets. As known, and shown in Figure 2, not all struc-tural fund expenditure is due to impact on regional growth, while some axes are more devoted to improvements in the quality of life and wellbeing of people living in the region rather than direct economic output (e.g. sewage systems, assistance to disadvantaged categories, etc.)
5. The effect of territorial capital on the impact on structural fund expenditure
This section will show how the impact of some structural fund expenditure axes is bound to have a different impact depending on the regional endowment of territo-rial capital, with the methodological steps illustrated in Section 4.
A first example is shown in Table 6a, where analysed is the case of axis 21, «labour market policy», which normally involves measures of training of employed and unemployed workers. The regressions for the different axes reported in the table include the standard regressions variables included in model (1), whose level of sig-nificance is not affected by the inclusion of the territorial capital and regional policy variables.

182 Fratesi, U. and Perucca, G.
Investigaciones Regionales, 29 (2014) – Pages 165 to 191
Table 6. Estimation results for the expenditure axes
a] Cat. 21: Labour market policy
Variables (1) (2) (3) (4)
Standard regr. controls Included Included Included Included
Funds cat. 21 –0.023*** –0.022*** –0.027***
High-value functions 0.084 0.028 0.026
Funds * high-value funct. 0.390*
Country fixed effects Included Included Included Included
Constant 0.199* 0.161 0.181 0.181
R-squared 0.796 0.790 0.796 0.798
Observations 108 108 108 108
b] Cat. 24: Workforce flexibility, entrepreneurship, innovation, info. and communication
Variables (1) (2) (3) (4)
Standard regr. controls Included Included Included Included
Funds cat. 24 –0.000 –0.000 –0.021*
Human capital –0.002 –0.001 –0.053
Funds * human capital 0.283***
Country fixed effects Included Included Included Included
Constant 0.215* 0.216 0.216 0.202
R-squared corr. 0.789 0.789 0.789 0.795
Observations 108 108 108 108
c] Cat. 25: Positive labour market actions for women
Variables (1) (2) (3) (4)
Standard regr. controls Included Included Included Included
Funds cat. 25 (dummy) –0.013 –0.013 –0.011
Human capital –0.002 0.010 –0.031
Funds * human capital 0.631*
Country fixed effects Included Included Included Included
Constant 0.217* 0.216 0.213 0.216
R-squared 0.791 0.789 0.791 0.796
Observations 108 108 108 108

Territorial Capital and the Effectiveness of Cohesion Policies: an Assessment for CEE Regions 183
Investigaciones Regionales, 29 (2014) – Pages 165 to 191
d] Cat. 17: Tourism
Variables (1) (2) (3) (4)
Standard regr. controls Included Included Included Included
Funds cat. 17 –0.003*** –0.002** –0.004***
Bed places in accom. facil. –0.012* –0.009* –0.018**
Funds * bed places 0.002***
Country fixed effects In1cluded Included Included Included
Constant 0.207* 0.221** 0.213* 0.212*
R-squared 0.800 0.795 0.803 0.811
Observations 108 108 108 108
e] Cat. 33: Energy infrastructures (production, delivery)
Variables (1) (2) (3) (4)
Standard regr. controls Included Included Included Included
Funds cat. 33 –0.002 –0.000 –0.008
Intermediate urban region –0.050** –0.050** –0.062**
Rural region –0.069** –0.069** –0.074**
Funds * intermediate region 0.018*
Funds * rural region 0.008
Country fixed effects Included Included Included Included
Constant 0.215* 0.081 0.081 0.083
R-squared 0.789 0.808 0.808 0.812
Observations 108 108 108 108
f] Cat. 34: Environmental infrastructure (including water)
Variables (1) (2) (3) (4)
Standard regr. controls Included Included Included Included
Funds cat. 34 –0.000 –0.000 –0.000
Intermediate urban region –0.050** –0.050** –0.058**
Rural region –0.069** –0.069** –0.069**
Funds * intermediate region 0.013*
Funds * rural region 0.001
Country fixed effects Included Included Included Included
Constant 0.215* 0.081 0.081 0.081
R-squared corr. 0.789 0.808 0.808 0.811
Observations 108 108 108 108
Robust standard errors. *** p < 0.01, ** p < 0.05, * p < 0.1

184 Fratesi, U. and Perucca, G.
Investigaciones Regionales, 29 (2014) – Pages 165 to 191
By just looking at the direct correlation between commitment in this axis and their impact on growth, it appears that having a high share of funds devoted to it is associated with a negative growth rate (column 1 in the table). This is probably due to the fact that regions tend to spend more on this axis if they are plagued by problems in the labour market, and hence tend to be weaker regions. However, the impact on growth of these funds is not independent on the territorial capital of the region. In this case, one plausible relevant asset of territorial capital are the high value functions (which are private and mixed material-immaterial goods in Figure 3).
Despite of the fact that high value functions per se are unable to induce growth (in column 2 the coefficient is positive but not enough to be significant), they rep-resent a pre-requisite for regional policy related to the labour market to function. In column 4 of the table, one can see that a high share of funds for labour market policies is negative per se but positive if related to high value functions. It is hence possible to conclude that labour market policies are more effective in those regions which are specialized in high value functions, i.e. are regions whose production system is performing higher value tasks which therefore need a more specialized labour force.
Table 6b presents are the results for commitment axis 24, «workforce flexibility, entrepreneurship, innovation, information and communication». In this case, there is no significant impact of the share of funds devoted to this axis on regional growth (column 1). Measures related to this axis are expected to impact on the innovative-ness of firms, and on the likelihood to help entrepreneurs successfully building new firms in the region. The territorial capital pre-requisite for these measures to func-tion is human capital, since the possibility to hire workers with better skills should improve the success rate of new entrepreneurial initiatives and also help improve the possibility for existing firms to introduce new innovations. Human capital is an intangible and private element of territorial capital.
In this case, also the territorial capital variable per se does not have a significant impact on regional growth in this case (column 2 of Table 6b) but, as shown by the full model in column 4, it strongly affects the possibility of measures in axis 24 to successfully increase the regional growth rate. The negative coefficient for the pure commitment variable remains negative as in Table 5.
It hence appears that investing in Workforce flexibility, entrepreneurship, inno-vation, information and communication is a good way to increase the growth rate in those regions which are well endowed with human capital, whereas for those regions where human capital is not present, this development strategy is ineffective if not detrimental.
A result similar to the previous one is obtained for the commitment axis 25 «pos-itive labour market actions for women» (Table 6c). This axis involves measures able to increase the involvement of women in the labour market, which appears not to be having a significant impact on regional growth. However, also in this case, the pres-ence of human capital appears to be a territorial capital pre-requisite for the impact of the policy of regional growth, and this type of policy brings positive effects when
Territorial Capital and the Effectiveness of Cohesion Policies: an Assessment for CEE Regions 185
Investigaciones Regionales, 29 (2014) – Pages 165 to 191
crossed with the endowment of human capital. Regions more endowed with human capital, in fact, are normally more able to take advantage of the inclusion of women, while regions with lower human capital are unable to benefit from what women can bring to the labour force.
The analysis can move out of labour market related issues towards more tradi-tional support to specific sectors. In Table 6d the impact of tourism commitments is analysed and one can see that, as already seen in Table 5, the coefficient of the impact of tourism expenditure is negative. This can take place, more than from the ineffec-tiveness of the policy itself, from the fact that tourism suffered the economic crisis more than other sectors (the estimation sample is 2006-2010) and therefore regions that have invested more in this sector are those specialized in a difficult sector.
Also in this case, however, the endowment of territorial capital manages to me-diate the impact of the policy. In this case, the relevant territorial capital variable is a hard good, whose rivalry is partial (since it can be used by many and crowding out only takes place after a certain threshold), i.e. the endowment of bedplaces.
From Table 6d it is evident that the endowment of bedplaces, signalling a spe-cialization in tourism, is by itself negatively correlated to growth. However, those regions which hold a larger number of bedplaces per inhabitant are more able to take advantage from structural funds investments in the touristic sector. One can in fact expect that any policy improving the touristic attractiveness of regions is more effective when these regions already hold the facilities to accommodate increasing touristic flows.
The last two axes which are analysed in this paper are hard ones which involve the building of basic infrastructure for the regions.
As far as energy infrastructures are concerned, the regressions (Table 6e) show that this commitment axis does not have an impact per se on the regional performance of CEE regions. However, the regional settlement typology of regions is very import-ant in this case: first, it is evident that intermediate urban regions and rural regions have a disadvantage with respect to the mostly urban regions. It is a known fact that urban regions led the development of these countries before and after they joined the EU (Capello and Perucca, 2014).
The settlement structure is a measure of agglomeration and economies and con-gestion diseconomies, it is hence a mixed (hard+soft) public good in the territorial capital classification.
Table 6e shows that, although agglomeration economies are still important in CEE countries and no significant decreasing returns appear, as signalled by the high-er growth rate of the urban areas, intermediate regions, those where agglomeration economies are present but farer from reaching the congestion threshold, are those more able to take advantage of investments in energy infrastructure. Urban areas, in fact, already have a relatively good delivery infrastructure, while firms in rural areas do not have enough agglomeration economies to benefit from improvements in en-ergy delivery.

186 Fratesi, U. and Perucca, G.
Investigaciones Regionales, 29 (2014) – Pages 165 to 191
The final commitment axis presented in the paper is axis 34, Environmental in-frastructure, whose impact also depends on the degree of agglomeration economies (Table 6f).
As in the previous case, the axis per se is insignificant, but its impact becomes significant when a region is an intermediate urban one. These regions, in fact, benefit from the improved presence of water, sewage and other environmental infrastructure which allow them to grow and expand their agglomeration economies without paying costs in terms of pollution and lower quality of life. Rural areas, on the contrary, most likely hold enough environmental capital that investment in that axis is not able to change the situation.
By drawing the impact of the coefficients of model (4) of Table 6f, one can see that predominantly rural regions are ceteris paribus growing less than their predominantly urban counterparts. At the same time, also intermediate urban re-gions are growing less, even if less markedly, and, more important, the impact of the policy in these regions is clearly felt. The more the policy invests in envi-ronmental infrastructure, the lower becomes the gap between their growth rate and the one of the predominantly urban regions, which however remain more dynamic.
Figure 4. Impact of environmental infrastructure policy on the growth rate of the three typologies of regions
0
– 0.01
– 0.02
– 0.03
– 0.04
– 0.05
– 0.06
– 0.07
– 0.080 0.1 0.2 0.3 0.4 0.5 0.6 0.7 0.8 0.9 1
Predominantly urban
Predominantly rural
Intermediate

Territorial Capital and the Effectiveness of Cohesion Policies: an Assessment for CEE Regions 187
Investigaciones Regionales, 29 (2014) – Pages 165 to 191
6. Conclusions
This paper, with an empirical analysis on CEE Nuts3 regions, has shown that regional policy is not so much effective per se but its impact depends on the type and amount of territorial capital possessed by the region. Regions more endowed with territorial capital appear to be more able to take advantage from the policy support of structural funds.
Moreover, territorial capital is differentiated in terms of materiality and rivalry, and the analysis has shown that different policy axes are facilitated by different en-dowments of territorial capital.
Structural Funds, therefore, work well as economic growth activators when they complement with the regional endowment of territorial capital. Each expenditure axis is hence more fruitful in a different type of region.
In CEE regions 8, the economic impact of EU policy investments in immaterial assets appear to be characterized by increasing returns: they tend to be more effective where regions are more endowed, for example:
— labour market policies are only effective when there is in the region a pres-ence of high value functions;
— workforce flexibility, entrepreneurship, innovation, information and telecom-munication policies are only effective when the region is endowed with hu-man capital, while their impact in regions not endowed is not positive;
— also positive labour market actions for women policies work only when the regions hold a good level of human capital.
Increasing returns also exist in some cases of harder policy investments. For ex-ample, tourism policies are more effective when regions have the possibility to host the increased flows of people in their structures.
Finally, it also appears that agglomeration economies play a role in some infra-structural policies. As in the CEE countries development has been concentric for a long time, urban regions have an advantage, but the intermediate regions, having the possibility of exploiting an increased degree of agglomeration without incurring in congestion costs, are those that can take advantage of Structural Fund policies in both energy and environmental infrastructure.
It hence looks like there are some decreasing returns emerging, since it is not the largest urban areas that take advantage from these investments but the intermediate ones.
Rural areas, however, also don’t take advantage of these hard investments, which questions the whole role of Structural Funds since these regions tend to be the poorest and less developed ones.
8 These results have been obtained in the specific case of transition countries, but we are confident that the relationship between territorial capital and the effectiveness of regional policy will hold also for the EU15 regions, although it is possible that, in a different socio-economic context, this relationship might be stronger for some axes and weaker for some others.

188 Fratesi, U. and Perucca, G.
Investigaciones Regionales, 29 (2014) – Pages 165 to 191
If structural funds are more effective when there is territorial capital, it means that investing policy funds in regions already more developed pays more than in-vesting them in weaker regions. It looks like a trade-off is emerging between the effectiveness of policies and the degree of spatial equity they can achieve, which is something very likely when agglomeration economies are strong (Fratesi, 2008), which is probably the case in CEE countries where there is still the possibility of further agglomeration before congestion diseconomies become too large.
One way to sort out of this potential policy dilemma lies in the fact that, as shown in Figure 2, Structural Funds can be devoted to enhancing the competitive-ness of regions and hence create growth in the short-medium term, but can also be used as enhancers of territorial capital in the medium-long run. This enriched endowment of territorial capital will eventually enhance the long run growth of the poorest regions.
Where territorial capital is not present, therefore, structural funds could and should be used to enhance territorial capital in the region. This is a long run strategy, which does not produce growth in the short run but should put the bases for growth in the longer run.
Bibliography
Bachtler, J., Mendez, C., and Oraze, H. (2013): «From Conditionality to Europe-anization in Central and Eastern Europe: Administrative Performance and Ca-pacity in Cohesion Policy», European Planning Studies, forthcoming, DOI: 10.1080/09654313.2013.772744.
Banister, D., and Berechman, Y. (2001): «Transport investment and the promotion of economic growth», Journal of transport geography, 9, 3, 209-218.
Barca, F. (2009): «An Agenda for A Reformed Cohesion Policy: A Place-Based Approach to Meeting European Union Challenges and Expectations», Independent Report, Prepared at the Request of the European Commissioner for Regional Policy, DanutaHübner, European Commission, Brussels.
Barro, R. J. (1991): «Economic growth in a cross-section of countries», Quarterly Journal of Economics, 106, 2, 407-443.
Becchetti, L., and Adriani, F. (2005): «Does the digital divide matter? The role of information and communication technology in cross-country level and growth estimates», Economics of Innovation and New Technology, 14, 6, 435-453.
Becker, S. O.; Egger, P. H., and Von Ehrlich, M. (2010): «Going NUTS: The effect of EU Structural Funds on regional performance», Journal of Public Economics, 94, 9, 578-590.
Becker, S. O.; Egger, P. H., and von Ehrlich, M. (2012): «Too much of a good thing? On the growth effects of the EU’s regional policy», European Economic Review, 56, 4, 648-668.
Boldrin, M., and Canova, F. (2001): «Inequality and convergence in Europe’s regions: recon-sidering European regional policies», Economic Policies, 16, 32, 205-253.
Bouvet, F. (2005): «European Union regional policy: allocation determinants and effects on regional economic growth», Working Paper, Department of Economics, University of Cal-ifornia, Davis.
Camagni, R. (2008): «Regional Competitiveness: Towards a Concept of territorial capital», in Capello, R.; Camagni, R.; Chizzolini, B., and Fratesi, U. (eds.), Modelling Regional Sce-
Territorial Capital and the Effectiveness of Cohesion Policies: an Assessment for CEE Regions 189
Investigaciones Regionales, 29 (2014) – Pages 165 to 191
narios for the Enlarged Europe: European Competitiveness and Global Strategies, 33-48, Berlin, Springer Verlag.
Capello, R., and Perucca, G. (2014): «Openness to Globalization and Regional Growth Patterns in CEE Countries: From the EU Accession to the Economic Crisis», Journal of Common Market Studies, forthcoming, DOI: 10.1111/jcms.12157.
Dall’erba, S. (2005): «Distribution of regional income and regional funds in Europe 1989-1999: an exploratory spatial data analysis», The Annals of Regional Science, 39, 1, 121-148.
Dall’erba, S.; Guillain, R., and Le Gallo, J. (2009): «Impact of Structural Funds on Regional Growth: How to Reconsider a 9 Year-old Black Box», Région et Développement, 30, 77-100.
Dall’erba, S., and Le Gallo, J. (2008): «Regional convergence and the impact of European structural funds 1989-1999: A spatial econometric analysis», Papers in Regional Science, 87, 2, 219-244.
Dall’erba, S., and Llamosas-Rosas, I. (2013): «Does Federal Expenditure Promote Growth in the Recipient Countries?», Paper Presented to the NARSC Conference2013, Atlanta, November 13-16.
De Haan, J., and Romp, W. (2007): «Public capital and economic growth: A critical survey», Perspektiven der Wirtschaftspolitik, 8, 1, 6-52.
Eggert, W.; von Ehrlich, M.; Fenge, R., and König, G. (2007): «Konvergenz- und Wachstum-seffekte der europäischen Regionalpolitik in Deutschland», Perspektiven der Wirtschafts-politik, 8, 2, 130-146.
ESPON (2010): projectTC, Typology Compilation, Final Report. The Luxembourg. Available from: http://www.espon.eu/main/Menu_Projects/Menu_ScientificPlatform/typologycompi-lation.html.
Esposti, R., and Bussoletti, S. (2008): «Impact of Objective 1 funds on regional growth conver-gence in the European Union: a panel-data approach», Regional Studies, 42, 2, 159-173.
European Commission (2005): Territorial state and perspectives of the European Union, Scop-ing document and summary of political messages, Brussels, May.
Ferry, M., and McMaster, I. (2013): «Cohesion policy and the evolution of regional policy in Central and Eastern Europe», Europe-Asia Studies, 65, 8, 1502-1528.
Fratesi, U. (2008): «Regional policy from a supra-regional perspective», The Annals of Region-al Science, 42, 3, 681-703.
Fukuyama, F. (2001): «Social capital, civil society and development», Third World Quarterly, 22, 1, 7-20.
Graham, D. J. (2007): «Agglomeration, productivity and transport investment», Journal of Transport Economics and Policy, 41, 3, 317-343.
Leonardi, R. (2006): «Cohesion in the European Union», Regional Studies, 40, 2, 155-166.Lucas, R. (1988): «On the mechanics of economic development», Journal of Monetary Eco-
nomics, 22, 1, 3-42.Midelfart-Knarvik, K. H., and Overman, H. G. (2002): «Delocation and European integration
—is structural spending justified?», Economic Policy, 17, 35, 321-359.Mohl, P., and Hagen, T. (2010): «Do EU structural funds promote regional growth? New evi-
dence from various panel data approaches», Regional Science and Urban Economics, 40, 5, 353-365.
Nelson, R. R., and Phelps, E. S. (1966): «Investment in humans, technological diffusion, and economic growth», The American Economic Review, 56, 1-2, 69-75.
OECD (2001): OECD Territorial Outlook, Paris.OECD (2009): How Regions Grow, Paris.Parr, J. B. (2002): «Agglomeration economies: ambiguities and confusions», Environment and
Planning A, 34, 4, 717-732.Pike, A.; Rodríguez-Pose, A., and Tomaney, J. (2006): Local and Regional Development, Lon-
don, Routledge.

190 Fratesi, U. and Perucca, G.
Investigaciones Regionales, 29 (2014) – Pages 165 to 191
Putnam, R. D. (1993): «Making Democracy Work. Civic Traditions in Modem Italy»,, Prince-ton, NJ, Princeton University Press.
Ramajo, J.; Márquez, M. A.; Hewings, G. J. D., and Salinas, M. M. (2008): «Spatial heteroge-neity and interregional spillovers in the European Union: Do cohesion policies encourage convergence across regions?», European Economic Review, 52, 3, 551-567.
Redding, S. J., and Sturm, D. M. (2008): «The Costs of Remoteness: Evidence from German Division and Reunification», American Economic Review, 98, 5, 1766-1797.
Resmini, L., and Casi, L. (2013): «FDI and growth in Europe: the role of territorial capital», ERSA conference papers.
Rodríguez-Pose, A., and Fratesi, U. (2004): «Between development and social policies: the im-pact of European Structural Funds in Objective 1 regions», Regional Studies, 38, 1, 97-113.
Rosenthal, S. S., and Strange, W. C. (2004): «Evidence on the nature and sources of agglomer-ation economies», Handbook of regional and urban economics, 4, 2119-2171.
Rothstein, B., and Stolle, D. (2003): «Introduction: social capital in Scandinavia», Scandinavi-an Political Studies, 26, 1, 1-26.
Sweco (2008): Final Report - ERDF and CF Regional Expenditure, European Commission, Contract No 2007.CE.16.0.AT.036.

Territorial Capital and the Effectiveness of Cohesion Policies: an Assessment for CEE Regions 191
Investigaciones Regionales, 29 (2014) – Pages 165 to 191
Ap
pen
dix
A.
Reg
ion
al E
U p
olic
y in
CE
E r
egio
ns:
cla
ssifi
cati
on
of
exp
end
itu
re c
ateg
ori
es
Expe
nditu
re
cate
gori
esEx
pend
iture
axe
sPe
r ca
pita
fund
s in
axi
sSh
are
of fu
nds
in
axi
s
1.
PRO
DU
CTI
VE
ENV
IRO
NM
ENT
11.
Agr
icul
ture
Mea
n St
d. D
ev.
Min
M
ax
Mea
n St
d. D
ev.
12.
Fore
stry
0.04
0.11
0.00
0.43
0.02
0.06
13.
Prom
otin
g th
e ad
apta
tion
and
the
deve
lopm
ent o
f rur
al a
reas
0,15
0.37
0.00
3.38
0.07
0.15
14.
Fish
erie
s21
9,00
5.84
0.00
51.9
0.74
1.72
15.
Ass
istin
g la
rge
busi
ness
org
anis
atio
ns0,
000.
010.
000.
020.
00.
0
16.
Ass
istin
g SM
Es a
nd th
e cr
aft s
ecto
r3.
857.
470.
0062
.38
1.37
1.92
17.
Tour
ism
21.5
816
.70
0.89
122.
618.
756.
59
18.
Res
earc
h, te
chno
logi
cal d
evel
opm
ent a
nd in
nova
tion
(RTD
I)13
.75
16.9
40.
0090
.34.
996.
88
2.
HU
MA
N
RES
OU
RC
ES21
. La
bour
mar
ket p
olic
y6.
819.
240.
0047
.77
2.73
5.04
22.
Soci
al in
clus
ion
0.80
1.96
0.00
11.0
30.
330.
90
23.
Educ
atio
nal a
nd v
ocat
iona
l tra
inin
g no
t lin
ked
to a
spe
cific
sec
tor
0.79
1.90
0.00
11.1
50.
320.
85
24.
Wor
kfor
ce fl
exib
ility
, en
trepr
eneu
rshi
p, i
nnov
atio
n, i
nfor
mat
ion
and
com
mun
icat
ion
1.87
3.25
0.00
20.3
90.
741.
66
25.
Posi
tive
labo
ur m
arke
t act
ions
for w
omen
0.35
1.00
0.00
5.99
0.15
0.50
3.
BA
SIC
IN
FRA
STR
UC
TUR
E31
. Tr
ansp
ort i
nfra
stru
ctur
e0.
030.
050.
000.
150.
010.
03
32.
Tele
com
mun
icat
ions
infr
astru
ctur
e an
d in
form
atio
n so
ciet
y13
2.26
171.
80.
414
48.9
436
.32
21.4
6
33.
Ener
gy in
fras
truct
ures
(pro
duct
ion,
del
iver
y)6.
477.
090.
0054
.01
2.95
3.82
34.
Envi
ronm
enta
l inf
rast
ruct
ure
(incl
udin
g w
ater
)3.
265.
590.
0029
.82
0.97
1.51
35.
Plan
ning
and
reha
bilit
atio
n93
.20
71.0
21.
4934
2.83
29.8
617
.2
36.
Soci
al a
nd p
ublic
hea
lth in
fras
truct
ure
7.43
6.63
0.00
35.9
93.
243.
10
4.
OTH
ER41
. Te
chni
cal a
ssis
tanc
e an
d in
nova
tive
actio
ns12
.27
16.9
30.
0090
.57
3.94
4.36
TO
TAL
313.
9920
6.85
75.6
016
85.2
610
0


© Investigaciones Regionales, 29 (2014) - Pages 193 to 214Section Articles
The Geography of Multinational Corporations in CEE Countries: Perspectives for Second-Tier City Regions and European Cohesion Policy
Teodora Dogaru*, Martijn Burger**, Frank van Oort*** and Bas Karreman**
ABSTRACT: The largest regional disparities in CEE countries are between cap-ital and non-capital city regions. MNCs invest in these regions for various rea-sons, contributing to regional development exogenously. In this paper we analyse location decisions of FDI investments in the period 2003-2010. We find that the most important location factors for FDI are market accessibility, strategic assets, institutional quality and agglomeration, in the post-crisis era even more than be-fore. Presently, second-tier city regions are not capable of offering all these factors simultaneously. For improving their opportunities and contribution to European cohesion and convergence, more substantial and direct investments are needed. Without these, the recently suggested competitiveness opportunities of second-tier city regions are difficult to obtain.
JEL Classification: R38; R58; R12.
Keywords: Greenfield FDI; CEE regions; location factors; competitive advantage.
La geografía de las corporaciones multinacionales en los países del centro y este de Europa. Perspectivas para regiones con ciudades de segundo nivel y la política de cohesión europea
RESUMEn: Las mayores disparidades regionales en los países del centro y este de Europa se observan entre las regiones con las capitales y el resto. Las empresas multinacionales invierten en estas regiones por distintas razones, contribuyendo de manera exógena al desarrollo regional. En este artículo, analizamos las decisiones de localización de las inversiones directas extranjeras entre 2003 y 2010. Encontramos que los factores más importantes de las inversiones extranjeras son la accesibilidad del mercado, las ventajas estratégicas, la calidad institucional y aglomeración, más aún en la época después de la crisis. En la actualidad, las regiones con ciudades se-cundarias no son capaces de ofrecer todos estos factores al mismo tiempo. Para me-
193
Received: 14 february 2014 / Accepted: 5 august 2014.
* Universidad de A Coruña, Spain. [email protected].** Erasmus University Rotterdam.*** Utrecht University.

194 Dogaru, T., Burger, M., van Oort, F. and Karreman, B.
Investigaciones Regionales, 29 (2014) – Pages 193 to 214
jorar sus oportunidades y contribuciones a la cohesión y convergencia europea se re-quieren mayores inversiones. Sin éstas, las oportunidades de competir mencionadas anteriormente para las regiones con ciudades secundarias serían difíciles de obtener.
Clasificación JEL: R38; R58; R12.
Palabras clave: Inversión «Greenfield»; regiones del centro y este de Europa; fac-tores de localización; ventaja competitiva.
1. Introduction
When identifying growth opportunities for Europe, one cannot overlook the re-gional patterns of its composite member states. The difference in growth opportu-nities between Western and Central Eastern (CEE) countries and regions is obvious but complex (Dogaru et al., 2011; Maroccu et al., 2012, and Capello et al., 2008). Western European regions identify themselves through internationally competitive cities like London, München, Paris, Barcelona or Amsterdam. Such places became landmarks for their surrounding regions and function in larger-scale city-regions. They distinguish themselves through competitive advantages in innovation capaci-ty, labour market efficiency and productive economic specializations (Annoni and Dijkstra, 2013). Policy makers in these places strive for better quality of life —the ultimate goal of competitiveness (Gardiner et al., 2004). In this view, they develop strategic innovative regional and urban development plans which target continuous employment, sustainable environment and accessible housing schemes, public ame-nities, qualitative and affordable education and healthcare or cultural enhancement and harmonization. But all these objectives are generally supported by a healthy busi-ness environment, embedded in a regional knowledge economy with knowledge-in-tensive specializations and sound institutions as well as good functioning multilevel governance structures (Barca et al., 2012). Strong financial sectors support entre-preneurship. Qualitative transport infrastructure increases accessibility and supports a good position in international trade networks. Highly qualified human resources drive the development of top sectors and in combination with other factors lead to-wards a service economy.
Central Eastern European regions are part of more recent member states charac-terized by former communist regimes —such as regions in Poland, Czech Republic, Slovakia, Hungary, Romania or Bulgaria—. These countries used to be centralized economies where the capital city was the most important location of decision and de-velopment (Gorzelak et al., 2012, and Müller et al., 2005). Besides some secondary city regions that focus on industrial specialization, university capacity or touristic centers, the rest of the regions in these countries largely remained agricultural-based economies. Building on their basic industrial composition heritage, these countries and their regions developed only little beyond their former profile. However, due to their entry in the EU and its trade benefits, as well as their strategic geographic location, low levels of wages and taxes or even natural resources, they increasingly
The Geography of Multinational Corporations in CEE Countries: Perspectives for Second-Tier... 195
Investigaciones Regionales, 29 (2014) – Pages 193 to 214
become an attraction for international corporations mostly for production and medi-um-low service functions. Frequently, the major landmarks are at national level and in capital city regions.
Dogaru et al. (2014) note that there is regional convergence among Central and Eastern European countries and between CEE and Western European countries. How-ever, regional disparities within the CEE countries have yet prevailed over the past years (Ezcurra et al., 2007; Niebuhr and Schlitte, 2009; Rodríguez-Pose and Ezcurra 2010; Kallioras and Petrakos 2010, and Chapman et al., 2012). In the wake of EU enlargement, capital city regions started taking different development paths and grew with a faster rhythm than the other regions in CEE countries. Nevertheless, recent evidence by Dijkstra (2013), Dijkstra et al. (2013) and ESPON (2012) suggests that non-capital city regions or regions containing so-called secondary cities show better growth figures over the last years. Arguably, both agglomeration diseconomies in the largest cities and untapped potential and knowledge intensive specializations in cities other than the capitals (like in München in Germany, Milano in Italy, Eindhoven in The Netherlands, and Barcelona in Spain) may contribute to this finding (Camagni et al., 2014, Angoletti et al., 2014, Camagni and Capello, 2014). It is argued by Thissen et al. (2013) that besides endogenous agglomeration forces, linking up with special-ized international knowledge networks and the embedding of international knowl-edge, trade and FDI networks in local knowledge intensive environments (of firms, universities and governmental agencies) may foster growth opportunities in second tier city regions relatively more than in capital regions. Still, the applicability of these findings in CEE countries remains uncertain. Endogenous growth opportunities may be limited in CEE countries because of less knowledge-intensive specializations, less learning experiences, culturally different evolved social capital and institutional constraints (Rodríguez-Pose et al., 2013, 2014). Besides this, several studies have pointed to differences with respect to embeddedness in international networks and industrial restructuring as the reason for regional disparities in the CEE countries (Heidenreich and Wunder, 2008, and Chapman and Valentina, 2011).
The degree in which regions in CEE countries are able to attract and embed for-eign investments, and particularly what role capital and secondary city regions may play in this, has not received much attention. This is mainly due to data limitations. Concerning regional development, Malecki (2002), Frenken and Hoekman (2006) as well as Tracey and Clark (2003) have drawn attention to the potential importance of global networks as sources of goods and knowledge in shaping firm competitive-ness in a particular area. This issue becomes more prominent as regional positions in knowledge, trade and FDI networks are regarded as important attributes of smart specialization strategies of European regions, aiming at future cohesion (Thissen et al., 2013). Barca et al. (2012) argue why place-based development strategies in Eu-ropean Union in relation to international network positions may be determining for future cohesive development. In spatially blind approaches it is argued that agglom-eration in combination with encouraging people’s mobility not only allows individ-uals to live where they expect to be better off but also increases individual incomes, productivity, knowledge and aggregate growth. From this perspective, spatially blind

196 Dogaru, T., Burger, M., van Oort, F. and Karreman, B.
Investigaciones Regionales, 29 (2014) – Pages 193 to 214
policies are also seen as «people-based», representing the best approach to improving inhabitants’ lives. Consequently, development intervention should be space-neutral, and factors should be encouraged to move where they are most productive. In reality, this is primarily in large cities. In contrast, the place-based approach assumes that the interactions between institutions and geography are critical for development, and many of the clues for development policy lie in these interactions. To understand the likely impacts of a policy, the interactions between institutions and geography, there-fore, requires explicit consideration over specifics of the local and wider regional context. In Europe, all urban regions may inhabit such unique development features (Barca et al., 2012, p. 140).
This article aims at testing whether the position of CEE regions in international networks of multinational corporations (MNCs) attributes to regional development potentials and future competitiveness and cohesion. We are especially interested in the position of capital city regions versus second tier city regions in networks of foreign direct investments. Despite the suggested advantages of second tier city regions and the fact that most CEE regions experienced productivity growth in manufacturing industries, the CEE capital city regions are converging at a faster rate due to their networked, service oriented economies (Dogaru et al., 2011). Reasons for this matter may be related to international (FDI) network positions. The present analysis focuses on the location decisions of MNCs investment in the NUTS-2 regions of CEE coun-tries. Overall, the number of alternative locations is larger for MNCs than for domestic firms when making an investment decision. In addition, MNCs are expected to se-lect the foreign investment locations that best fit the characteristics of the investment project and yield the largest benefits for the firm. This applies to greenfield FDI that does not face constraints from existing capital instalments or prior investments (unlike mergers and acquisitions). Hence, the location decisions of MNCs clearly reflect the particular competitive advantage of certain regions and provide a meaningful way to compare the attractiveness of different regions for particular sectors and functions. We hypothesize that competitive advantages of regions may be in market accessibility, labour cost advantages, strategic assets, natural resources, institutional quality and ag-glomeration, in the post-crisis era even more than before. Section 2 discusses more de-tailed the motivations for location of MNCs in regions. Section 3 then introduces both the data used for empirical testing and a classification of capital and second tier city regions in CEE countries. Section 4 provides an overview of the empirical results and discusses the findings. Section 5 presents conclusions and discusses what our results suggest for competitiveness, cohesion policy and place-based development strategies.
2. Motivations for MNCs to invest in CEE regions
As Brienen et al. (2010) and Burger et al. (2013) summarize, the literature on FDI generally acknowledges that an increase in FDI is beneficial for home activities through the acquisition of skills and technology from abroad, when foreign employ-ment does not replace national employment. However, for host countries and regions,

The Geography of Multinational Corporations in CEE Countries: Perspectives for Second-Tier... 197
Investigaciones Regionales, 29 (2014) – Pages 193 to 214
the location decision of MNCs is also important, as FDI can boost a host country’s prospects for (regional) economic development through effects such as the creation of employment, growth of the capital stock, and the promotion of exports. As the FDI literature on economic geography, international business, and international econom-ics suggests, investments by MNCs are attracted by favorable economic location fac-tors. Moreover, as MNCs expanding internationally into new geographical markets encounter uncertainty, the imitation of past behavior by other MNCs can stimulate investments.
Foreign direct investments (FDI) are long-range investments in a country other than the country in which the foreign direct investor is based. Firms internationalize if the competitive advantages gained from operating abroad are high enough to cover the additional costs and risks that are associated with this action. Following Dun-ning’s OLI paradigm, Brienen et al. (2010) argue that firms decide to invest abroad when they have market power, given by the ownership (O) of products or produc-tion processes, a location advantage (L) in placing their plant in a foreign country rather than their homeland, and an advantage gained from internationalizing (I) their foreign activities in fully owned subsidiaries rather than carrying them out through market transactions (trade) or networked relationships with other firms (licensing and franchising).
From the perspective of the internal organization of the MNC, FDI can be hor-izontal and vertical (Barba Navaretti and Venables, 2004, Iammarino and McCann, 2013). Horizontal FDI are investments in which a firm duplicates a number of its own activities abroad that are carried out in the home country. The main trade-off faced by firms for this type of investment is between the increased sales (market access), stra-tegic advantage and lower transportation costs that are gained by operating abroad versus the foregone internal economies of scale and disintegration costs. Vertical FDI are investments in which a firm decides to geographically disperse its activities by function, whereby some of these functions are now carried out abroad. In this case, the main trade-off is between the lower factor costs associated with investing abroad versus the increased trade and disintegration costs. In relation to the distinction be-tween horizontal and vertical FDI, Brienen et al. (2010) and Burger et al. (2013) distinguish between four reasons of firms to internationalize the production process, which stress the location aspects of FDI.
1. Foreign-market-seeking FDI. Firms will supply their goods or services to fo-reign markets and possibly enhance third markets from this location. In most cases these markets are previously served through exports from the domestic market. This type of FDI is usually a form of horizontal investment, whereby (emerging) markets are served by a local affiliate. Except for market size, accessibility and infrastructure also play a key role.
2. Efficiency-seeking FDI. Firms are trying to reduce their costs of production related to labor, machinery and materials. Differences in the costs of produc-tion factors across regions can make a firm decide to geographically separate its tasks. These lower production costs abroad are often associated with labor market and trade circumstances —lower wages, taxes and trade costs as well

198 Dogaru, T., Burger, M., van Oort, F. and Karreman, B.
Investigaciones Regionales, 29 (2014) – Pages 193 to 214
as the availability of grants and subsidies in a host country—. This type of investment is most often vertical FDI.
3. Resource-seeking FDI. The firm invests abroad to procure certain resources at lower costs than those in their original market. In this case, the availability of natural resources, the presence of a good infrastructure (to secure physical supply), and local partners to obtain knowledge and exploit these resources are relevant reasons to place investments abroad.
4. Strategic asset-seeking FDI. The firm aims at purchasing assets of foreign firms to foster their long-term strategic objectives, sustaining and advancing the firm’s international competitiveness. This FDI category is determined by the requisite of firms to obtain assets and knowledge ranging from specific technological capabilities to management or marketing expertise. This type of investment features both horizontal and vertical FDI.
In short, it can be expected that horizontal FDI will be drawn to locations with good market access, while vertical FDI will be drawn to places with lower factor costs. A distinction in functions of investments (R&D, production, sales, etc.) will be infor-mative as well, as this is closely related to the motivations for their location choice.
Two more important explanations for regional attractiveness (for FDI) should be mentioned for CEE regions. First, good institutions, legal frameworks and trust among citizens and government may be of key importance (Rodríguez-Pose 2013). For practically all regions in CEE countries, the recently developed key indicator of «quality of government» scores particularly low (Charron et al., 2014). Still, vari-ation across regions in CEE countries may pose important attractions to firms (re)locating activities abroad. Second, agglomeration patterns are more polarized in CEE countries compared to West-European countries. CEE country regions also exhibit marked different sectoral structures compared to West-European regions (Van Oort et al., 2014) and FDI seems to foster productivity and vertical spillovers more than in Western European countries (Lipsey, 2006). It is therefore important to test for agglomeration (productivity) magnitudes and composition explicitly.
3. Data and variables
In this article, we concentrate on Greenfield FDI in 49 NUTS-2 regions in 6 CEE countries. Information on Greenfield FDI is provided by the Financial Times fDi Markets database. This project-level data was gathered primarily from publicly avail-able resources such as formal media sources, financial information databases, indus-try organisations, and publications of companies. Overall, our database comprises 7,284 investments belonging to 3,465 different MNCs in 6 CEE countries (Poland, Czech Republic, Slovakia, Hungary, Romania and Bulgaria) between January 2003 and December 2010 1. Most Greenfield investments in the CEE countries originated
1 For 52 investments (0.7%), we were unable to obtain the region in which the investment was made. Hence, these investments were omitted from the database. See Burger et al. (2013) for a more elaborate description of the European database on Greenfield investments.

The Geography of Multinational Corporations in CEE Countries: Perspectives for Second-Tier... 199
Investigaciones Regionales, 29 (2014) – Pages 193 to 214
from within the European Union, EFTA (71%) and North America (16%), aiming at low-tech manufacturing (21%), medium-tech manufacturing (19%), and commercial services (17%).
By using Eurostat’s taxonomy of metropolitan regions, the NUTS-2 regions were grouped into one of the following three categories (Dijkstra, 2009, Chapman and Valentina, 2012; see Appendix A):
• Capital city regions: NUTS-2 regions around the capital city. In the analysed CEE countries, these capital city regions are also the ones which are best em-bedded into international markets (Fratesi, 2012).
• Regions with a second-tier city: NUTS-2 regions with at least one second-tier city. Second-tier cities are the largest cities in the country, excluding the capital. In the CEE countries, there is a maximum of 5 second-tier cities per country.
• Other regions: regions with a smaller city and non-metropolitan regions. Small-er city-regions are NUTS-2 regions with at least one urban area of 250,000 inhabitants. These larger urban zones include major cities and are adjoining travel-to-work areas. Non-metropolitan regions are NUTS-2 regions without at least a 250,000 inhabitant urban zone.
Table 1 shows the number of investments in the period 2003-2010 by CEE coun-tries and these three region types. Capital city regions attract by far most investments in all CEE countries. Second tier city regions appear as particularly attractive desti-nations for foreign investors in Poland.
Table 1. Number of investments (2003-2010) by destination country and region type
Capital City RegionRegion with
Second-Tier CityOther Region
Bulgaria 436 (52.1) 197 (23.6) 203 (24.2)
Czech Republic 429 (41.6) 234 (22.7) 368 (35.7)
Hungary 534 (44.3) 176 (14.6) 495 (41.1)
Poland 528 (27.4) 1075 (55.9) 320 (16.6)
Romania 742 (47.6) 354 (22.7) 462 (29.7)
Slovakia 198 (32.9) 101 (16.8) 303 (50.3)
Total Investments 2867 (40.1) 2137 ( 29.9) 2151 (30.0)
Number of Regions 7 17 25
Row percentages in parentheses. Other regions are NUTS-2 regions with smaller city or non-metropolitan regions. A taxonomy of regions can be found in Appendix A.
In terms of functions, most investments were made in production plants (43%), business, sales and marketing offices (23%) as well as building and construction (11%). This study focuses on which functions attract FDI, using information about

200 Dogaru, T., Burger, M., van Oort, F. and Karreman, B.
Investigaciones Regionales, 29 (2014) – Pages 193 to 214
the economic activities pursued by MNCs. These functions can be linked to the qual-ity of the investment made and to the various motivations why MNCs have to invest abroad. Building on earlier research by Defever (2006) and Spies (2010), we group the economic functions into four different categories (see Appendix B): upstream activities (i.e., management, headquarters and R&D), construction and utilities, production plants, and downstream activities (i.e., business services, sales and mar-keting, support functions, and logistics). Table 2 displays the distribution of the in-vestments across region type. Both upstream activities and services and downstream functions tend to be concentrated in the capital city regions. Production facilities and resource-seeking investments (extraction & energy) are relatively more oriented towards second tier and smaller city regions. Logistics and distribution activities are more evenly spread across the three types of regions.
Table 2. Number of investments (2003-2010) by broad function and region type
Capital City RegionRegion with
Second-Tier CityOther Region
Headquarters 64 (77.1) 10 (12.1) 9 (10.8)
R&D 177 (53.2) 97 (29.1) 59 (17.7)
Construction 487 (58.3) 183 (21.9) 165 (19.8)
Extraction & Energy 67 (28.3) 86 (36.7) 83 (35.0)
Production Plants 486 (16.0) 1146 (37.7) 1410 (46.3)
Business, Sales & Marketing 1157 (70.4) 293 (17.8) 194 (11.8)
Support & Servicing 184 (51.0) 118 (32.7) 59 (16.3)
Logistics & Distribution 245 (39.5) 203 (32.8) 172 (27.7)
Total Investments 2867 (40.1) 2137 (29.9) 2151 (30.0)
Number of Regions 7 17 25
Row percentages in parentheses. Other regions are NUTS-2 regions with smaller city or non-metropolitan regions A taxonomy of regions can be found in Appendix A. A taxonomy of broad functions can be found in Appendix B.
The explanatory variables used in the analysis represent or proxy the motives of foreign firms for investment. Appendix C provides descriptive statistics of the vari-ables used. In the baseline model, only the distinction in capital city regions (refer-ence), second tier city regions and other regions will be used by introducing dummy variables. Multimodal accessibility (by road, air and rail) of regions captures the market accessibility motive of investments. This indicator is highly correlated with other indicators, like market potential and traffic indicators (compare Dogaru et al., 2011). The labour market argument is captured by the wage costs and unemploy-ment rate variables. (Long-term) unemployment may be an (additional) source of cheap labor, but may also reflect an inefficient labour market system where demand does not meet supply (Elhorst, 2003). The strategic assets argument is captured by

The Geography of Multinational Corporations in CEE Countries: Perspectives for Second-Tier... 201
Investigaciones Regionales, 29 (2014) – Pages 193 to 214
the number of patents issued in the regions and the share of the working population with a university degree. The resource seeking argument is captured by the share of mining employment in total employment. Finally, the institutional quality index for European regions is a composite measure concerning corruption, impartial public services, and rule of law. This indicator is highly correlated to sub-national levels of socio-economic development and levels of social trust. It is noted in Charron et al. (2014) that the indicator is not correlated with the degree of political decentralization (devolution). The degree of agglomeration in regions is captured by the density of capital stock. All investments in a certain year (2003-2010) are linked to time cor-responding indicators. Appendix D provides a correlation matrix of all explanatory variables used, showing that multicollinearity is a limited problem in our analyses.
4. The model
Location choices of multinational corporations are often modeled using discrete choice models (see Crozet et al., 2004; Head and Mayer, 2004; Defever, 2006; Basile et al., 2008 and Schmidheiny and Brülhart, 2011). Probably the most often discrete choice model used is the conditional logit (McFadden, 1974). In our context, this model assumes that each multinational investing in CEE countries is faced with a set of alternative investment regions for the location of its establishment abroad, with each multinational comparing relevant location attributes. Accordingly, each location decision is considered to be the outcome of a discrete choice among a set of alter-natives, where it is assumed that a utility-maximizing firm will choose to locate its subsidiary in a region if this decision maximizes the expected future profits from its investment (Long, 1997).
The conditional logit model is subject to restrictive assumptions regarding the substitution patterns across alternative investment locations. This is better known as the independence of irrelevant alternatives (IIA) and violation of this assumption is common to datasets with a large number of alternatives. Not accounting for the violation of the IIA assumption can result in inconsistent and biased estimates. Ac-cordingly, we use a mixed logit estimation, allowing for random taste variation and unrestricted substitution patterns in the discrete choice model (see Defever, 2006 and Basile et al., 2008 for similar empirical strategies in the context of location decision of multinational corporations).
Table 3 presents the outcomes of our models. Among the random terms of the coefficients, a number of variables show significant variation, indicating that the mul-tinational firms tend to value the different location characteristics not uniformly in their location decision. As indicatively suggested by the typology of functions (Ta-ble 2 and Appendix B) and the typology of motivations for investment, this is related to the functional division of labor in capital city regions versus that in other types of regions. In column (1), outcomes of a baseline model are presented, where the only explanatory variables are the division of regions containing capital cities, second-ti-er cities and other regions. The capital city region category is taken as reference.

202 Dogaru, T., Burger, M., van Oort, F. and Karreman, B.
Investigaciones Regionales, 29 (2014) – Pages 193 to 214
Tabl
e 3.
M
ixed
Log
it E
stim
ates
for
Loc
atio
n C
hoic
es o
f M
ultin
atio
nals
in C
EE
Reg
ions
(20
03-2
010)
(1)
Base
line
(2)
+ M
arke
t Ac
cess
ibili
ty
(3)
+La
bor
Cos
ts
(4)
+St
rate
gic
As
sets
(5)
+ P
rese
nce
Reso
urce
s
(6)
+ In
stitu
tiona
l Q
ualit
y an
d Ag
glom
erat
ion
(7)
Full
Spec
ifica
tion
Reg
ion
type
— C
apita
l city
regi
on•
••
••
••
— R
egio
n w
ith s
econ
d-tie
r city
–1.4
17 (0
.057
)***
–0.4
04 (0
.088
)***
–1.3
88 (0
.067
)***
–0.2
65 (0
.091
)***
–1.6
82 (0
.057
)***
–0.8
36 (0
.070
)***
0.20
4 (0
.091
)***
— O
ther
regi
on–1
.946
(0.0
64)*
**–0
.670
(0.0
82)*
**–1
.837
(0.0
73)*
**–0
.345
(0.0
91)*
**–2
.100
(0.0
62)*
**–1
.327
(0.0
83)*
**0.
009
(0.1
15)*
**
Ln m
ultim
odal
acc
essi
bilit
y1.
593
(0.0
83)*
**1.
056
(0.0
98)*
**
Ln u
nit w
age
cost
s–0
.903
(0.2
30)*
**–0
.098
(0.2
45)*
**
Long
-term
une
mpl
oym
ent r
ate
–0.0
23 (0
.012
)***
–0.0
27 (0
.012
)***
Ln n
umbe
r of p
aten
ts0.
454
(0.0
30)*
**0.
378
(0.0
33)*
**
Uni
vers
ity d
egre
e ra
te0.
044
(0.0
05)*
**0.
022
(0.0
08)*
**
Shar
e m
inin
g 0.
155
(0.0
13)*
**0.
101
(0.0
14)*
**
Inst
itutio
nal q
ualit
y–0
.075
(0.0
67)*
**0.
130
(0.0
69)*
**
Ln c
apita
l sto
ck d
ensi
ty0.
238
(0.0
24)*
**0.
075
(0.0
34)*
**
Ran
dom
Par
ts C
oeffi
cien
ts
— C
apita
l city
regi
on•
••
••
••
— R
egio
n w
ith s
econ
d-tie
r city
1.22
3 (0
.109
)***
1.20
9 (0
.137
)***
1.10
1 (0
.146
)***
0.84
9 (0
.148
)***
1.25
8 (0
.103
)***
0.98
0 (0
.158
)***
0.54
3 (0
.136
)***
— O
ther
regi
on1.
615
(0.1
08)*
**1.
532
(0.1
60)*
**1.
696
(0.1
35)*
**0.
988
(0.2
25)*
**1.
638
(0.1
17)*
**1.
673
(0.2
10)*
**1.
082
(0.1
87)*
**
Ln m
ultim
odal
acc
essi
bilit
y0.
475
(0.1
35)*
**0.
669
(0.1
35)*
**
Ln u
nit w
age
cost
s1.
750
(0.4
94)*
**2.
352
(0.3
05)*
**
Long
-term
une
mpl
oym
ent r
ate
0.10
9 (0
.025
)***
0.10
1 (0
.023
)***
Ln n
umbe
r of p
aten
ts0.
179
(0.0
68)*
**0.
224
(0.0
48)*
**
Uni
vers
ity d
egre
e ra
te0.
073
(0.0
08)*
**0.
073
(0.0
09)*
**
Inst
itutio
nal q
ualit
y0.
489
(0.0
93)*
**0.
780
(0.0
66)*
**
Cou
ntry
Fix
ed E
ffec
tsY
ESY
ESY
ESY
ESY
ESY
ESY
ES
Num
ber o
f Obs
erva
tions
350,
595
350,
595
350,
595
350,
595
350,
595
350,
595
350,
595
Num
ber o
f Inv
estm
ent
Dec
isio
ns7,
155
7,15
57,
155
7,15
57,
155
7,15
57,
155
Num
ber o
f Alte
rnat
ives
4949
4949
4949
49
Wal
d C
hi-S
quar
e1,
181
1,44
099
21,
005
1,61
681
495
5
Rob
ust s
tand
ard
erro
rs in
par
enth
eses
. Err
or te
rms
are
clus
tere
d by
par
ent fi
rm *
** p
< 0
.01;
**
p <
0.0
5, *
p <
0.10
. • =
Ref
eren
ce c
ateg
ory.
Onl
y si
gnifi
cant
ran
dom
com
pone
nts
of th
e co
effic
ient
s ar
e re
port
ed.

The Geography of Multinational Corporations in CEE Countries: Perspectives for Second-Tier... 203
Investigaciones Regionales, 29 (2014) – Pages 193 to 214
Tabl
e 3.
M
ixed
Log
it E
stim
ates
for
Loc
atio
n C
hoic
es o
f M
ultin
atio
nals
in C
EE
Reg
ions
(20
03-2
010)
(1)
Base
line
(2)
+ M
arke
t Ac
cess
ibili
ty
(3)
+La
bor
Cos
ts
(4)
+St
rate
gic
As
sets
(5)
+ P
rese
nce
Reso
urce
s
(6)
+ In
stitu
tiona
l Q
ualit
y an
d Ag
glom
erat
ion
(7)
Full
Spec
ifica
tion
Reg
ion
type
— C
apita
l city
regi
on•
••
••
••
— R
egio
n w
ith s
econ
d-tie
r city
–1.4
17 (0
.057
)***
–0.4
04 (0
.088
)***
–1.3
88 (0
.067
)***
–0.2
65 (0
.091
)***
–1.6
82 (0
.057
)***
–0.8
36 (0
.070
)***
0.20
4 (0
.091
)***
— O
ther
regi
on–1
.946
(0.0
64)*
**–0
.670
(0.0
82)*
**–1
.837
(0.0
73)*
**–0
.345
(0.0
91)*
**–2
.100
(0.0
62)*
**–1
.327
(0.0
83)*
**0.
009
(0.1
15)*
**
Ln m
ultim
odal
acc
essi
bilit
y1.
593
(0.0
83)*
**1.
056
(0.0
98)*
**
Ln u
nit w
age
cost
s–0
.903
(0.2
30)*
**–0
.098
(0.2
45)*
**
Long
-term
une
mpl
oym
ent r
ate
–0.0
23 (0
.012
)***
–0.0
27 (0
.012
)***
Ln n
umbe
r of p
aten
ts0.
454
(0.0
30)*
**0.
378
(0.0
33)*
**
Uni
vers
ity d
egre
e ra
te0.
044
(0.0
05)*
**0.
022
(0.0
08)*
**
Shar
e m
inin
g 0.
155
(0.0
13)*
**0.
101
(0.0
14)*
**
Inst
itutio
nal q
ualit
y–0
.075
(0.0
67)*
**0.
130
(0.0
69)*
**
Ln c
apita
l sto
ck d
ensi
ty0.
238
(0.0
24)*
**0.
075
(0.0
34)*
**
Ran
dom
Par
ts C
oeffi
cien
ts
— C
apita
l city
regi
on•
••
••
••
— R
egio
n w
ith s
econ
d-tie
r city
1.22
3 (0
.109
)***
1.20
9 (0
.137
)***
1.10
1 (0
.146
)***
0.84
9 (0
.148
)***
1.25
8 (0
.103
)***
0.98
0 (0
.158
)***
0.54
3 (0
.136
)***
— O
ther
regi
on1.
615
(0.1
08)*
**1.
532
(0.1
60)*
**1.
696
(0.1
35)*
**0.
988
(0.2
25)*
**1.
638
(0.1
17)*
**1.
673
(0.2
10)*
**1.
082
(0.1
87)*
**
Ln m
ultim
odal
acc
essi
bilit
y0.
475
(0.1
35)*
**0.
669
(0.1
35)*
**
Ln u
nit w
age
cost
s1.
750
(0.4
94)*
**2.
352
(0.3
05)*
**
Long
-term
une
mpl
oym
ent r
ate
0.10
9 (0
.025
)***
0.10
1 (0
.023
)***
Ln n
umbe
r of p
aten
ts0.
179
(0.0
68)*
**0.
224
(0.0
48)*
**
Uni
vers
ity d
egre
e ra
te0.
073
(0.0
08)*
**0.
073
(0.0
09)*
**
Inst
itutio
nal q
ualit
y0.
489
(0.0
93)*
**0.
780
(0.0
66)*
**
Cou
ntry
Fix
ed E
ffec
tsY
ESY
ESY
ESY
ESY
ESY
ESY
ES
Num
ber o
f Obs
erva
tions
350,
595
350,
595
350,
595
350,
595
350,
595
350,
595
350,
595
Num
ber o
f Inv
estm
ent
Dec
isio
ns7,
155
7,15
57,
155
7,15
57,
155
7,15
57,
155
Num
ber o
f Alte
rnat
ives
4949
4949
4949
49
Wal
d C
hi-S
quar
e1,
181
1,44
099
21,
005
1,61
681
495
5
Rob
ust s
tand
ard
erro
rs in
par
enth
eses
. Err
or te
rms
are
clus
tere
d by
par
ent fi
rm *
** p
< 0
.01;
**
p <
0.0
5, *
p <
0.10
. • =
Ref
eren
ce c
ateg
ory.
Onl
y si
gnifi
cant
ran
dom
com
pone
nts
of th
e co
effic
ient
s ar
e re
port
ed.

204 Dogaru, T., Burger, M., van Oort, F. and Karreman, B.
Investigaciones Regionales, 29 (2014) – Pages 193 to 214
Both regions with second-tier cities and other cities receive significant and substan-tially less foreign investments than capital city regions, confirming earlier research by Dogaru et al. (2014). The second model presented in column (2) introduces mul-timodal accessibility of regions as an indicator of the market access reason of foreign investments. Better accessibility is associated with more foreign investments, as the coefficient is highly significant.
Market access (foreign market seeking motivation) is a major reason for invest-ments. Controlled for market access, which is high in the capital city regions, sec-ond-tier and other types of regions still receive significantly less investments than capital city regions. The third model in Table 3 introduces labour costs (efficiency seeking) as a motive for investments, proxied by wages and unemployment levels. High wages are negatively related to foreign investments in regions in CEE-coun-tries. Second-tier and smaller urban regions, in particular, have such cost advantag-es (Dogaru et al., 2014). Controlling for cost advantages, non-capital city regions receive significant less investments than capital city regions. Other advantages of capital regions therefore have to be explored as well. Higher (long-term) unem-ployment rates attracts less foreign investments. The inefficient labour market ar-gument hampering the attraction of FDI appears more important than the potential (and additional) cheap labour argument. In column (4) in Table 3, the strategic asset motivation for investments is tested. Measured by a larger share of higher educated workforce and the number of patents, it turns out that this argument is a very im-portant explanation for investments in the capital regions compared to regions with second-tier cities and other regions. The variable is highly significant and positive: high scores on these indicators are associated with higher investment levels. Still, after controlling for this motive, second-tier city-regions and other regions receive fewer investments. Model (5) tests for the resource seeking argument —measured as location factor by the share of mining in the regional labour force—. A high share of mining is significantly correlated with more foreign investments, confirm-ing the resource motivation hypothesis. Again, controlled for this, the regions with second-tier cities and the smaller urban regions receive less investment than capital regions.
Having confirmed all four hypothesized motivations for foreign investments in our CEE-setting, we also tested for institutional quality and agglomeration (model 6 in Table 3). Institutional quality did not come out as an individual significant (pos-itive or negative) driving force. Agglomeration (measured by capital stock), does. Economic mass is thus important and probably instrumental for other motives for investments, like market access and strategic asset seeking. In column (7) of Table 3 we present a model in which all explanatory variables are introduced simultaneously. Now, the wage variable is not significantly attached to (less) investments anymore, indicating the little importance of the efficiency seeking argument of investments compared to other motives. All other motivation-based indicators remain significant and of the hypothesized sign. Remarkably, the good-institutions variable becomes significant now in explaining investment attraction: better institutions are associated with more investments.

The Geography of Multinational Corporations in CEE Countries: Perspectives for Second-Tier... 205
Investigaciones Regionales, 29 (2014) – Pages 193 to 214
Controlled for all these factors, model (7) shows that regions with second-tier cit-ies receive relatively more investments than capital city regions. Once controlled for all hypothesized motivations, we can remark that smaller urban regions do not receive more investments. In line with ESPON (2012), Breuss et al. (2010) and Scherpenzeel (2010), we are inclined to hypothesize that subsidies and region-specific economic and cohesion programmes may be responsible for this favourable outcome for sec-ond-tier city regions. It may well be that for future investment potentials, such subsi-dies and programmes in second-tier city regions should be connected more to several of the motivation factors distinguished in our analyses simultaneously. This may be a severe task, as our models clearly indicate that capital cities and capital city-regions score high on those indicators that attract most investments (market seeking) and the potentially most productive and innovative ones (strategic asset seeking). A simul-taneous improvement of critical mass, accessibility (market potential), and strategic asset concentration (universities, R&D) may be too much to demand from second-ti-er urban regions.
Because FDI is argued to be one of the variables very sensitive to economic shocks (The Economist 2012), the full model 7 in Table 3 is re-estimated for two periods in time: a pre-crisis period (2003-2007) and a (post) crisis period (2008-2010). Table 4 reports the results of this analysis. The general structure of factors influencing locational decisions of multinational investments is similar in both peri-ods. Important for our analysis is to notice that controlled for all factors, the position of regions with second-tier cities does not significantly contribute to the attraction of investments. The labour market arguments (wages and unemployment) are insig-
Table 4. Mixed Logit Estimates for Location Choices of Multinationals in CEE Regions by Period
2003-2007 2008-2010
Region type
— Capital city region • •
— Region with second-tier city 0.040 (0.129)*** –0.186 (0.149)***
— Other region –0.044 (0.141)*** –0.437 (0.166)***
Ln multimodal accessibility 0.989 (0.134)*** 0.726 (0.162)***
Ln unit wage costs –0.641 (0.350)*** –0.266 (0.360)***
Long-term unemployment rate –0.025 (0.012)*** –0.012 (0.034)***
Ln number of patents 0.304 (0.033)*** 0.416 (0.049)***
University degree rate 0.025 (0.010)*** –0.006 (0.012)***
Share mining 0.098 (0.015)*** 0.084 (0.024)***
Institutional quality 0.046 (0.078)*** 0.142 (0.099)***
Ln capital stock density 0.068 (0.041)*** 0.156 (0.055)***

206 Dogaru, T., Burger, M., van Oort, F. and Karreman, B.
Investigaciones Regionales, 29 (2014) – Pages 193 to 214
nificant in the (post) crisis model compared to the pre-crisis period. Agglomeration (measured by capital stock density) is significantly attached to investments in the (post) crisis period, and not in the per-crisis period. Combined, this suggests that eco-nomic agglomeration in larger city-regions provides larger opportunities of attracting investments in post-crisis circumstances, arguably due to the concentration of talent and a diversified economy that may mitigate the worse effects of recession (see for this argumentation Clark, 2009, and Cohen, 2012, p. 349).
5. Conclusions and discussion
In this paper we were looking for explanations of foreign direct investments in various types of regions in Central and Eastern European countries. Capital city re-gions attract by far most investments during 2003-2010, especially investments with motivations for market-seeking and strategic asset seeking. Agglomeration econo-mies are also important, indicating that a critical mass is needed to attract (more) investments. This critical mass may well be instrumental for market-seeking and strategic-asset seeking investments as well. Despite recently suggested advantages of
2003-2007 2008-2010
Random Parts Coefficients
— Capital city region • •
— Region with second-tier city 1.091 (0.162)***
— Other region 1.256 (0.215)*** 0.981 (0.166)***
Ln multimodal accessibility 0.490 (0.192)***
Ln unit wage costs 3.074 (0.369)***
Long-term unemployment rate 0.132 (0.017)*** 0.145 (0.046)***
University degree rate 0.065 (0.010)*** 0.074 (0.012)***
Share mining 0.096 (0.025)***
Institutional quality 0.713 (0.071)***
Ln capital stock density 0.124 (0.063)***
Country Fixed Effects YES YES
Number of Observations 226,821 123,774
Number of Investment Decisions 4,629 2,526
Number of Alternatives 49 49
Wald Chi-Square 1,218 663
Robust standard errors in parentheses. Error terms are clustered by parent firm *** p < 0.01; ** p < 0.05, * p < 0.10. • = Reference category Only significant random components of the coefficients are reported.

The Geography of Multinational Corporations in CEE Countries: Perspectives for Second-Tier... 207
Investigaciones Regionales, 29 (2014) – Pages 193 to 214
second-tier city regions (less congestion, growth opportunities in niche markets, stra-tegic network connections in value chains, lower costs of living), our findings foresee difficulties in achieving better positions in FDI networks for such cities and regions. As exogenous growth facilitator in regions, FDI «loves agglomeration».
Although agglomeration economies in the capital cities are already developed and their costs (negative externalities) are already high, these cities benefit from the crit-ical size requirement that obviously plays a dominant role in investment decisions. It should be remarked that the capital city regions are a heterogeneous and expanding group themselves. Between 1914 and 2014 there were drastic changes in the number of independent countries in Central and Eastern Europe, implying also a large variation in capital cities. Before 1914 there were five recognized capitals 2, after 1920 this grew to eleven 3, after 1945 it declined to eight again 4, and after 1992 it grew to twenty-one 5. All differ in size and structure —and not all of them are in the European Union—. In the same vein, second-tier cities differ in structure and sizes. Rotterdam (The Nether-lands), Milano (Italy), München (Germany) and Barcelona (Spain) are somewhat at odds in size, agglomeration and functional structure with Timisoara (Romania), Kra-kow (Poland), Brno (Czech Republic) or Szeged (Hungary). Still, all these cities are marked as second-tier cities (ESPON, 2012). The often suggested functioning of such cities in polycentric urban networks that collective may form a critical mass, is often met with institutional and cognitive barriers between the cities (Davoudi, 2003). For such a strategy to be successful, efforts of local and national governments in working on economic complementarities, infrastructure connections, translocal service provi-sion and a supra-regional strategy is necessary. It requires an adjusted strategy on place-based development, taking into account positions in networks of trade, knowl-edge and FDI as growth factors both (inter) regionally and (inter) nationally.
In order to create conditions for the economic performance of secondary city re-gions, strong public interventions are advocated by ESPON (2012), aiming at the creation of integrated, multi-level and participatory governance. These interventions should come, on the one hand, from the cities themselves, and, one the other hand, from the national and European level. Second-tier city regions are supposed to open up their internal structures towards cooperation with other stakeholders, mainly the economic and educational partners (triple Helix). They are also stimulated to open up in territorial sense, towards their surrounding areas, aiming at uniting the function-al urban area —economic development needs well organized functional cooperation area to allow agglomeration economies—. The tasks of national governments then is to establish overarching governance reforms to initiate cooperation between local governments within the same urban area and stimulate more regional decentralization: regions with more regional independence in planning would give more power to sec-ondary cities as centres of the regions. However, in CEE countries this decentralization
2 Vienna, Belgrade, Bucharest, Sofia, Cetinie (Montenegro).3 Vienna, Belgrade, Bucharest, Sofia, Budapest, Warsaw, Prague, Tirana, Tallinn, Riga, Vilnius.4 Vienna, Belgrade, Bucharest, Sofia, Budapest, Warsaw, Prague, Tirana.5 Vienna, Belgrade, Bucharest, Sofia, Budapest, Warsaw, Prague, Tirana, Tallinn, Riga, Vilnius,
Bratislava, Ljubljana, Zagreb, Sarajevo, Podgorica, Pristine, Skopje, Minsk, Kiev, Chisinau.

208 Dogaru, T., Burger, M., van Oort, F. and Karreman, B.
Investigaciones Regionales, 29 (2014) – Pages 193 to 214
process has not yet been experienced before at such levels. There is little experience and, more important, institutional and human resources are lacking. In consequence, future decentralization policies should come in well-planned and safe steps in order to avoid unstable public institutional capacity regarding public safety or local healthcare systems especially affecting smaller cities or rural areas within a region.
In the case of the Central East European secondary city regions there is little progress regarding their own efforts and more open and flexible government policies (Parkinson et al., 2014).There is a clear need for more European involvement in redirecting financing to secondary city regions. In this view, cohesion policy should partly shift its emphasis from compensating for deficient regional growth to encour-aging secondary growth centres. Additionally, EU guidelines should emphasize the importance of more decentralized regional development.
Our research outcomes confirm that a positive development of second-tier city regions in Europe is not as straightforward as recently suggested. Second-tier city re-gions do not have an overall central position in networks of foreign direct investment —an important (exogenous) development factor of regions and cities—. Given the simultaneously needed critical mass, knowledge endowments and physical accessi-bility, especially in post-crisis investment trajectories of multinationals, a networked FDI based development will be difficult. Presently, second-tier city regions, and even some of the smaller CEE capital city regions, are not capable of offering all these factors simultaneously in sufficient quantities. For improving their opportunities and contribution to European cohesion and convergence, more substantial and directed investments are needed. Without these, the suggested competitiveness opportunities of second-tier city regions are difficult to obtain.
References
Angoletti, C.; Bocci, C.; Iommi, S., and Marinari, P. (2014): «First and second-tier cities in regional agglomeration models», European Planning Studies (forthcoming).
Annoni, P., and Dijkstra, L. (2013): EU Regional Competitiveness Index - RCI 2013, JRC Sci-entific and Policy Reports. Brussels: Joint Research Center, European Union.
Barba Navaretti, G., and Venables, A. (2004): Multinational Firms in the World Economy, Prin-centon, NJ: Princeton University Press.
Barca, F.; McCann, P., and Rodríguez-Pose, A. (2012): «The case for regional development intervention: place-based versus place-neutral approaches», Journal of Regional Science 52: 134-152.
Basile, R.; Castellani, D., and Zanfei, A. (2008): «Location choices of multinational firms in Europe: the role of EU cohesion policy», Journal of International Economics, 74: 328-340.
Breuss, F.; Egger, P., and Pfaffenmayr, M. (2010): «Structural funds, EU enlargement and the redistribution of FDI in Europe», Review of World Economics, 146: 469-494.
Brienen, M.; Burger, M., and van Oort, F. (2010): «The geography of Chinese and Indian Greenfield investments in Europe», Eurasian Geography and Economics, 51: 254-273.
Burbidge, J. B.; Magee, L., and Robb, A. L. (1988): «Alternative transformations to handle extreme values of the dependent variable», Journal of the American Statistical Association 83: 123-127.

The Geography of Multinational Corporations in CEE Countries: Perspectives for Second-Tier... 209
Investigaciones Regionales, 29 (2014) – Pages 193 to 214
Burger, M.; van der Knaap, B., and Wall, R. (2013): «Revealed competition for Greenfield investments between European regions», Journal of Economic Geography, 13: 619-648.
Camagni, R., and Capello, R. (2014a): «Second-rank city dynamics: theoretical interpretations behind their growth potentials», European Planning Studies (forthcoming).
Camagni, R.; Capello, R., and Caragliu, A. (2014): «The rise of second-rank cities: what role for agglomeration economies?», European Planning Studies (forthcoming).
Capello, R.; Camagni, R.; Chizzolini, B., and Fratesi, B. & U. (2008): Modelling regional sce-nario’s for the enlarged Europe, Berlin: Springer.
Chapman, S. A., and Valentina, M. (2012): «Income disparities in the enlarged Europe: so-cio-economic, spcialisation and geographical clusters», Journal of Economic and Social Geography (TESG), 103: 293-311.
Chapman, S. A., Cosci, S., and Mirra, L. (2012): «Income dynamics in an enlarged Europe: the role of capital regions», Annals of Regional Science, 48: 663-693.
Charron, N., Dijkstra, L., and Lapuente, V. (2014): «Regional governance matters: quality of government within European Union member states», Regional Studies, 48: 68-90.
Clark, G. (2009): Recession, recovery and reinvestment: the role of local leadership in a global crisis, Paris: OECD.
Cohen, M. P. (2012): «Cities in times of economic crisis: a challenge for local governments», in: Cooke, P.; Parrilli, M. D., and Curbelo, J. L. (eds.), Innovation, global change and ter-ritorial resilience, Cheltenham: Edwad Elgar: 335-363.
Crozet M.; Mayer, T., and Mucchieli, J-L. (2004): «How do firms agglomerate? A study of FDI in France», Regional Science and Urban Economics, 34: 27-54.
Davoudi, S. (2003): «Polycentricity in European spatial planning: from an analytical tool to a normative agenda», European Planning Studies, 11: 979-999.
Defever, F. (2006): «Functional fragmentation and the location of multinationals in the en-larged Europe», Regional Science and Urban Economic, 36: 658-677.
Dijkstra, L. (2009): «Metropolitan regions in Europe», Regional Focus, n. 1/2009.— (2013): «Why investing more in the capital can lead to less growth», Cambridge Journal of
Regions, Economy and Society, 6: 251-268.Dijkstra, L.; Garcilazo, E., and McCann, P. (2013): «The economic performance of European
cities and city regions: myths and realities», European Planning Studies, 21: 334-354.Dogaru, T.; van Oort, F., and Thissen, M. (2011): «Agglomeration economies in European
regions: perspectives for objective-1 regions», Journal of Economic and Social Geography (TESG), 102: 486-494.
Dogaru, T.; Burger, M.; Karreman, B., and van Oort, F. (2014): «Functional and sectoral di-vision of labour within Central and Eastern European countries: evidence from greenfield FDI», Journal of Economic and Social Geography (TESG) (forthcoming).
Elhorst, P. (2003): «The mystery of regional unemployment differentials: theoretical and em-pirical explanations», Journal of Economic Surveys, 17: 709-748.
ESPON (2012): Second-tier cities and their development in Europe: performance, policies and prospects, Brussels: ESPON.
Ezcurra, R.; Pascual, P., and Rapún, M. (2007): «The dynamics of regional disparities in Cen-tral and Eastern Europe during transition», European Planning Studies, 15: 1397-1421.
Fratesi, U. (2012): «A globalization-based taxonomy of European regions», Regional Science Policy & Practice, 4: 1-23.
Frenken, K., and Hoekman, J. (2006): «Convergence in an enlarged Europe: the role of net-work cities», Journal of Economic and Social Geography (TESG), 97: 321-326.
Gardiner, B.; Martin, R., and Tyler, P. (2004): «Competition, productivity and economic growth across the European regions», Regional Studies, 38: 1045-1067.
Gorzelak, G.; Goh, C., and Fazekas, K. (eds.) (2012): Adaptability and change: the regional dimensions in Central and Eastern Europe, Warsaw: Euroreg and The Worldbank.

210 Dogaru, T., Burger, M., van Oort, F. and Karreman, B.
Investigaciones Regionales, 29 (2014) – Pages 193 to 214
Head, K., and Mayer, T. (2004): «Market potential and the location of investment in the Euro-pean Union», Review of Economics and Statistics 86: 959-972.
Heidenreich, M., and Wunder, C. (2008): «Patterns of regional inequality in the enlarged Eu-rope». European Sociological Review, 24: 19-36.
Iammarino, S., and McCann, P. (2013): Multinationals and economic geography. Location, technology and innovation, Cheltenham: Edward Elgar.
Kallioras, D., and Petrakos, G. (2010): «Industrial growth, economic integration and structural change: evidence from the EU new member states regions», Annals of Regional Science, 45: 667-680.
Lipsey, R. E. (2006): «Measuring the impact of FDI in Central and Eastern Europe», NBR Working Paper 12808, Cambridge Mass.
Long, J. S. (1997): Regression Models for Categorical and Limited Dependent Variables, Sage, Thousand Oaks, CA.
Malecki, E. J. (2002): «Hard and soft networks for urban competitiveness», Urban Studies, 39: 929-945.
Maroccu, E.; Paci, R., and Usai, S. (2012): «Productivity growth in the old and new Europe: the role of agglomeration externalities», Journal of Regional Science, 1-25.
McFadden, D. (1974): «Conditional logit analysis of qualitative choice behavior», in: Zaremb-ka, P. (ed.), Frontiers in Econometrics, Academic Press, New York, 105-142.
Müller, B.; Finka, M., and Lintz, G. (eds.) (2005): Rise and decline of industry in Central and Eastern Europe. Berlin: Springer.
Niebuhr, A., and Schlitte, F. (2009): «EU enlargement and convergence: does market access matter?», Eastern European Economics, 47: 28-56.
Parkinson, M.; Meegan, R., and Karecha, J. (2014): «City size and economic performance: is bigger better, small more beautiful or middling marvellous?», European Planning Studies (forthcoming).
Rodríguez-Pose, A. (2013): «Do institutions matter for regional development?», Regional Studies, 47: 1034-1047.
Rodríguez-Pose, A., and Novak, K. (2013): «Learning processes and economic returns in Eu-ropean cohesion policy», Investigaciones Regionales, 25: 7-26.
Rodríguez-Pose, A., and Ezcurra, R. (2010): «Does decentralization matter for regional dispar-ities? A cross-country analysis», Journal of Economic Geography, 10: 619-644.
Scherpenzeel, J. A. (2010): «EU cohesion policy and the Europeanization of Central and East-ern European regions», Regional and Federal Studies, 20: 45-62.
Schmidheiny, K., and Brülhart, M. (2011): «On the equivalence of location choice models: conditional logit, nested logit and Poisson», Journal of Urban Economics, 69: 214-222.
Spiekerman, K., and Wegener, M. (2006): «Accessibility and spatial development in Europe», Scienze Regionali, 5: 15-46.
Spies, J. (2010): «Network and border effects: where do foreign multinationals locate in Ger-many?», Regional Science and Urban Economics, 40: 20-32.
The Economist (2012): «FDI inflows into Eastern Europe decline again», Retrieved on 1-8-2014 at http://country.eiu.com/article.aspx?articleid=269762011.
Thissen, M.; van Oort, F.; Diodato, D., and Ruijs, A. (2013): Regional competitiveness and smart specialization in Europe. Place-based development in international economic net-works, Cheltenham: Edward Elgar.
Tracey, P., and Clark, G. (2003): «Alliances, networks and competitive strategy: rethinking clusters of innovation», Growth and Change, 34: 1-16.
Van Oort, F. G.; de Geus, S., and Dogaru, T. (2014): «Related variety and economic growth in a cross-Section of European urban regions», European Planning Studies (forthcoming).

The Geography of Multinational Corporations in CEE Countries: Perspectives for Second-Tier... 211
Investigaciones Regionales, 29 (2014) – Pages 193 to 214
Appendix A. Taxonomy of regions
NUTS-code Region Type NUTS-code Region Type
BG31 Other Region PL31 Other Region
BG32 Other Region PL32 Other Region
BG33 Region with Second-Tier City PL33 Other Region
BG34 Other Region PL34 Other Region
BG41 Capital City Region PL41 Region with Second-Tier City
BG42 Region with Second-Tier City PL42 Other Region
CZ01 Capital City Region PL43 Other Region
CZ02* Capital City Region PL51 Region with Second-Tier City
CZ03 Other Region PL52 Other Region
CZ04 Other Region PL61 Other Region
CZ05 Other Region PL62 Other Region
CZ06 Region with Second-Tier City PL63 Region with Second-Tier City
CZ07 Other Region RO11 Region with Second-Tier City
CZ08 Region with Second-Tier City RO12 Other Region
HU10 Capital City Region RO21 Region with Second-Tier City
HU21 Other Region RO22 Region with Second-Tier City
HU22 Other Region RO31 Other Region
HU23 Other Region RO32 Capital City Region
HU31 Region with Second-Tier City RO41 Region with Second-Tier City
HU32 Region with Second-Tier City RO42 Other Region
HU33 Other Region SK01 Capital City Region
PL11 Region with Second-Tier City SK02 Other Region
PL12 Capital City Region SK03 Other Region
PL21 Region with Second-Tier City SK04 Region with Second-Tier City
PL22 Region with Second-Tier City
* Constitutes travel-to-work area of Prague (CZ01)

212 Dogaru, T., Burger, M., van Oort, F. and Karreman, B.
Investigaciones Regionales, 29 (2014) – Pages 193 to 214
Appendix B. Taxonomy of investments by broad functions
Category Functions
Headquarters Headquarters
R&DDesign, Development, and TestingEducation and TrainingResearch and Development
Construction ConstructionICT and Internet Infrastructure
Extraction & Energy ExtractionEnergy
Production Plants Manufacturing
Business, Sales & Marketing Business ServicesSales, Marketing, and Support
Support & Servicing
Customer Contact CentresMaintenance & ServicingShared Service CentresTechnical Support Centres
Logistics & Distribution Logistics, Distribution and TransportationRetail

The Geography of Multinational Corporations in CEE Countries: Perspectives for Second-Tier... 213
Investigaciones Regionales, 29 (2014) – Pages 193 to 214
Appendix C. Descriptive statistics of variables included in the regressions
Name Description Mean SD
Region with second-tier city dummy
Takes value 1 if region with second-tier city. Classification based on Dijkstra (2009). 0.35 0.48
Other region dummyTakes value 1 if region is not capital city region or region with second-tier city. Classification based on Dijkstra (2009).
0.51 0.50
Ln multimodal accessibility
Natural logarithm of number of people that can potentially be accessed by air, rail, and road. Ob-tained from Spiekermann and Wegener (2006).
16.60 0.40
Ln unit wage costsNatural logarithm of regional wage costs divid-ed by regional gross value added. Obtained from Cambridge Econometrics.
0.54 0.22
Long-term unemployment rate
Long-term unemployment rate in a region. Ob-tained from Eurostat. 5.14 3.33
Ln number of patents Natural logarithm of number of patent applica-tions. Obtained from Eurostat. 1.62 0.98
University degree ratePercentage of the workforce between 25 and 64 with tertiary (ISCED 5-6) education. Obtained from Eurostat.
19.10 6.53
Share mining Employment in mining and utilities as percent-age of total employment. Obtained from Cam-bridge Econometrics.
2.62 1.38
Institutional quality Institutional quality index for European regions by Charron et al. (2014). –1.01 0.62
Ln capital stock density Natural logarithm of (capital stock / total area in km2). Obtained from Cambridge Econometrics. 0.51 1.32
Number of observations = 350595. Please note that for all logarithmic transformation we applied an inverse hyperbolic sine transformation (Burbidge et al., 1988) when we had to deal with variables that included observations with zero value.

214 Dogaru, T., Burger, M., van Oort, F. and Karreman, B.
Investigaciones Regionales, 29 (2014) – Pages 193 to 214
Appendix D. Correlation table of main variables included in the analyses (N=350595)
(1) (2) (3) (4) (5) (6) (7) (8) (9) (10)
(1) Region with second-tier city 1.00
(2) Other region dummy –0.74 1.00
(3) Ln multimodal accessibility –0.14 –0.35 1.00
(4) Ln unit wage costs 0.04 0.07 –0.25 1.00
(5) Long-term unemployment rate 0.13 0.09 –0.19 0.45 1.00
(6) Ln number of patents –0.02 –0.32 0.72 –0.29 –0.16 1.00
(7) University degree rate –0.13 –0.27 0.43 0.20 –0.10 0.47 1.00
(8) Share mining 0.23 –0.04 –0.15 0.07 0.16 –0.33 –0.35 1.00
(9) Institutional quality 0.04 0.06 0.23 –0.23 0.01 0.43 0.02 –0.41 1.00
(10) Ln capital density –0.11 –0.29 0.81 –0.34 –0.18 0.75 0.49 –0.26 0.35 1.00

© Investigaciones Regionales, 29 (2014) – Pages 215 a 236Section Articles
The European Cohesion policy and the promotion of entrepreneurship. The case of Andalusia
Isidoro Romero*, José Fernández-Serrano**
ABSTRACT: This paper discusses the significance, trends and achievements of the entrepreneurship and small and medium-sized enterprise policy in Anda-lusia developed with the support of the European Regional Development Fund (ERDF). The lack of entrepreneurial culture and business environment conditions unfavourable to entrepreneurship have traditionally acted as structural obstacles to regional development in Andalusia. In order to face this problem, the role of the entrepreneurship policy within the strategy for regional development has increased over the programming periods of the European Cohesion policy. This article proposes some recommendations for a more effective and efficient design of the Cohesion policy in this field drawing on the analysis of the experience of Andalusia.
JEL Classification: R11; R58; L26.
Keywords: Cohesion policy; ERDF; entrepreneurship; regional development; Andalusia.
La política europea de Cohesión y la promoción del emprendimiento. El caso de Andalucía
RESUMEn: Este trabajo tiene como objetivo discutir el sentido, las tendencias y los logros de las iniciativas de fomento de la actividad emprendedora y de la PYME en Andalucía desarrolladas con el apoyo del Fondo Europeo de Desarrollo Regional (FEDER). La falta de cultura emprendedora, junto a las condiciones des-favorables del entorno empresarial, han representado tradicionalmente obstáculos estructurales para el desarrollo regional. Para afrontar ese problema, el papel de la política de fomento empresarial en el marco de la estrategia andaluza para el desarrollo regional se ha incrementado a lo largo de los sucesivos periodos de programación de la política europea de Cohesión. El artículo presenta algunas re-
215
Received: 29 january 2014 / Accepted: 28 july 2014.
* Departamento de Economía Aplicada I. Universidad de Sevilla. Facultad de CC. Económicas y Empresariales. Av. Ramón y Cajal, 1, 41018, Sevilla, [email protected].
** Departamento de Economía Aplicada I. Universidad de Sevilla.

216 Romero, I. and Fernández-Serrano, J.
Investigaciones Regionales, 29 (2014) – Pages 215 a 236
comendaciones para un diseño más eficaz y eficiente de la política de Cohesión en este ámbito basadas en la experiencia de Andalucía.
Clasificación JEL: R11; R58; L26.
Palabras clave: Política de Cohesión; FEDER; emprendimiento; desarrollo regio-nal; Andalucía.
1. Introduction
The Cohesion policy is one of the most important European Union (EU) policies and also one of the most controversial. Thus, a debate exists about its effectiveness to foster regional development and achieve the convergence of regional economies (see, for instance, Rodríguez-Pose and Fratesi, 2004; Ramajo et al., 2008; Sosvilla-Rivero and Herce, 2008; Villaverde and Maza, 2010; Rodríguez-Pose and Novak, 2013). The discussion on the role and significance of regional development policies, along with the changes experienced by the European regions in the last two decades, have led to re-thinking regional policies in the EU. As a result, the design, implementation and evaluation of the EU Cohesion policy have undergone fundamental changes in recent times (Bachtler and Wrenb, 2006; McCann and Ortega-Argilés, 2013).
One of the principles that inspire the EU Cohesion policy post-2013 is the re-quirement for all regions to develop a «smart specialisation» strategy. This notion is based on the idea that economic growth relies on innovation, entrepreneurship and risk-taking. Therefore, policy action should build these conditions and favour them as a way of stimulating the adoption, embodiment, and adaptation of new technologies (McCann and Ortega-Argilés, 2013).
In the last decades the European institutions have been implementing an Enterprise policy to tackle the significant deficiencies in entrepreneurship observed in EU coun-tries and regions, especially in comparison to other economies, such as the USA (Euro-pean Commission, 2003 and 2013; Leibovitz, 2003; Romero and Fernández-Serrano, 2005). In this context, Cohesion policy instruments have also been employed with an increasing commitment to promote entrepreneurial activity in the EU member states.
This paper explores the relationship between these two lines of European policy in-tervention, considering the role of entrepreneurship promotion as a strategic dimension within the Cohesion policy that might contribute to increasing its effectiveness. From this perspective, the paper analyses the experience of the European Regional Develop-ment Fund (ERDF) in Andalusia (Spain) in the period 1989-2013. The article is based on the study case for Andalusia (Faíña et al., 2013), within the project «Evaluation of the main achievements of Cohesion policy programmes and projects over the long term in 15 selected regions (from the 1989-1993 programming period to the present)» 1.
1 This project was commanded by the European Commission and coordinated by the London School of Economics and the European Policies Research Centre of the University of Strathclyde. See Bachtler et al. (2013) for the overall conclusions.

The European Cohesion policy and the promotion on entrepreneurship. The case of Andalusia 217
Investigaciones Regionales, 29 (2014) – Pages 215 a 236
The particular aim of this paper is to assess the role that entrepreneurship promo-tion has played within the ERDF strategy in Andalusia and get closer to the possible results obtained. Andalusia represents an interesting case study in this respect, since it is a comparatively low-income region in the European and Spanish contexts that tradi-tionally suffers from a lack of entrepreneurial culture and a fragile business structure.
For the purposes of this paper, entrepreneurship policy is defined from a broad perspective including the actions aiming at:
a) Stimulating the emergence of entrepreneurs and firm creation.b) Supporting an entrepreneurial orientation in small and medium-sized en-
terprises (SMEs) materialised in risk-taking, innovation, access to external markets or firm growth and, therefore, improving the «entrepreneurial qual-ity» of the SME sector (Fernández-Serrano and Romero, 2013).
Though over the last four decades multiple initiatives in this policy field have been developed in Andalusia and implemented as part of national, regional and local programmes (Marchese and Potter, 2011), this paper will only consider the interven-tions within the ERDF framework.
The following section presents the rationale of the regional development strategy in Andalusia supported by the ERDF facilities. This section shows the importance given to the different priorities based on the diagnosis of the regional development problems. Section 3 describes the main interventions in the field of entrepreneurship policy undertaken within the ERDF framework over the successive programming periods. Section 4 assesses the results which might have been derived from these actions based on the evolution of different entrepreneurship indicators. Section 3 and 4 are based on the analysis of the ERDF programmes, planning documents and eval-uations, on complementary information from the Directorate General for Planning and European Funds of the regional administration of Andalusia, on the views of experts interviewed and other statistical sources (see Faíña et al., 2013: 136-139). Next, Section 5 draws some lessons from the Andalusian experience regarding the entrepreneurship promotion within the ERDF framework and the possible implica-tions for the design of the Cohesion policy.
2. The role of entrepreneurship policy within the ERDF regional strategy in Andalusia
From the 1989-93 programming period to the 2007-13 period the total expendi-ture of ERDF and Cohesion funds in Andalusia was 26,869.4 million Euros (at a con-stant 2000 value) (Faíña et al., 2013) 2. This substantial financial support received by Andalusia from European institutions —as an Objective 1 region, later Convergence region— has contributed significantly to regional growth and development over the last 25 years (Marchante and Sánchez-Maldonado, 2005; Lima and Cardenete, 2008; Sosvilla, 2009). Cohesion policy has favoured the process of convergence of the An-
2 The initial allocations are computed for the 2007-13 programing period.
218 Romero, I. and Fernández-Serrano, J.
Investigaciones Regionales, 29 (2014) – Pages 215 a 236
dalusian economy with the European Union standards. Thus, in 2011 the Gross Do-mestic Product (GDP) per capita (in PPS) of Andalusia reached 62.67 per cent of the EU-15 average while it was only 47.28 per cent in 1989.
In the late 1980s, Andalusia, a peripheral region in the Southern extreme of Eu-rope, suffered from severe deficiencies in transport infrastructure. Communication networks with the rest of Spain were poor and the region was deeply disjointed in-ternally. Furthermore, important deficits existed regarding environmental infrastruc-ture, especially associated with water supply, distribution and purification (Zaragoza, 1991; Junta de Andalucía, 2007).
The region also had important weaknesses regarding human capital resources (Requena and Cantón, 2007). In addition, the lack of an entrepreneurial culture and business environment conditions unfavourable to entrepreneurship historically acted as major obstacles to regional development. As a result of this, the small average busi-ness size and the underinvestment in research, technological development and innova-tion (RTDI) have always been important deficiencies of this regional economy (Junta de Andalucía, 2000; Marchese and Potter, 2011). These factors have also conditioned the regional specialisation in light industries, distribution and commercial services, agriculture and tourism, that is, in general terms, activities of relatively low value-add-ed (Guzmán et al., 2000; Antúnez and Sanjuan, 2008; Marchese and Potter, 2011).
Today, a large part of these needs have been met. Andalusia has transport in-frastructures comparable to those in many regions of the most developed European countries and the achievements in the field of environmental infrastructures have also been very significant (Faíña et al., 2013). However, in the field of entrepreneurship, innovation and competitiveness, though some improvement has been observed, the results are more debatable.
The analysis of the programmes and the ERDF expenditure (see Table 1) reveals that, among all the important needs of Andalusia at the end of the 1980s, the region-al development strategy focused on increasing the connectivity of the territory and facilitating access to other markets. This strategy aimed at mitigating the peripheral situation of the region and achieving economic growth through large investments in transport infrastructure projects 3.
From this perspective, the deficiencies in the transport infrastructure were the main obstacle to regional development in Andalusia. Once the infrastructure bot-tlenecks were resolved, other important needs related to improving human capital, fostering entrepreneurship and stimulating RTDI or internationalisation could be ad-dressed more effectively. In this way, the achievements in accessibility and internal connectivity led to a lesser emphasis on investment in transport infrastructure, though this remained a high priority over successive periods. In this way, the ERDF strategy evolved towards competitiveness, entrepreneurship and innovation in later program-ming periods. This has been a common pattern in other less developed regions in the
3 Projects such as the A92 motorway connecting Sevilla-Granada-Almería or the first high-speed train line —AVE— connecting Sevilla-Córdoba-Madrid are representative examples of this aim in the initial programming periods.
The European Cohesion policy and the promotion on entrepreneurship. The case of Andalusia 219
Investigaciones Regionales, 29 (2014) – Pages 215 a 236
framework of the European Cohesion policy (European Commission, 2014). Envi-ronmental infrastructure and reforestation was the second most important priority in Andalusia, also remaining constant over the programming periods (Junta de Andalu-cía, 2007 and 2012; Faíña et al., 2013).
Consequently, the strategy became more complex over successive program-ming periods and was enriched with other objectives and interventions in the field of social infrastructure (education and healthcare), as well as tourism infrastruc-ture. This strategic evolution was reinforced especially from 2000-06 onwards. In the 2000-06 period, competitiveness, the knowledge economy and innovation be-came priorities and the 2007-13 programme consolidated these new priorities in accordance with the new Strategy for the Competitiveness of Andalusia (Junta de Andalucía, 2007) and the objectives of the Lisbon Strategy and the National Re-form Plan of Spain.
This evolution in the strategy brought a change in the distribution of expenditure according to the eight thematic axes shown in Table 1. As pointed out in the intro-duction, the broad field of entrepreneurship and enterprise policy includes a wide range of interventions directly oriented to fostering business creation and business development (firm survival and growth, internationalisation and innovation). These interventions can naturally be associated with the following three thematic axes in Table 1: Enterprise (1), Structural Adjustment (2) and Innovation (3). The expendi-ture in these axes represents a reasonable approximation regarding the magnitude of entrepreneurship policy actions implemented with ERDF support, based on the infor-mation available 4. The last two columns in Table 1 show the aggregate expenditure in these areas as percentages of the overall funds.
As can be observed, the main priorities remain infrastructure and environmental sustainability, even in the last programming periods. The regional strategy also paid especial attention to the needs regarding social and spatial cohesion, through invest-ment in education, health and other social services.
The allocations and expenditure in the entrepreneurship and enterprise field of in-tervention grew over the programming periods 5. The share of the ERDF programmes in the Community Support Framework (CSF) allotted to the enterprise and structur-al adjustment axes in the 2007-13 period (allocations) almost doubled the share in the programming 1989-93 period (expenditure). Moreover, when this comparison is made considering the previous two axes together with that of innovation, the share more than tripled.
4 Some interventions within these three categories were not oriented to promoting entrepreneurship and supporting SMEs’ development. The Structural Adjustment axis includes some incentives for the loca-tion of large companies in the region, particularly, in specific problematic areas. Furthermore, the Innova-tion axis includes interventions in the public innovation system (public universities and research centres), which cannot be considered as part of the entrepreneurship policy either. However, some ERDF interven-tions in other axes could have also contributed to improving the entrepreneurial capabilities, for instance, the investments in educational infrastructures (secondary education, professional training and universities).
5 Data on «expenditure» for the 2007-13 programme is provisional. Consequently, it does not allow for an accurate comparison with previous periods.

220 Romero, I. and Fernández-Serrano, J.
Investigaciones Regionales, 29 (2014) – Pages 215 a 236
Table 1. ERDF funds by thematic axes in Andalusia in percentages
Axes
1989-1993
1994-1999 2000-2006 2007-2013
CSF Total Exp
ROP Alloc
ROP Exp
CSF Total Exp
ROP Alloc
ROP Exp
CSF Total Exp
ROP Alloc
ROP Exp
CSF Total Alloc
CSF Total
Exp (*)
1 0.8% 1.4% 2.1% 1.8% 4.8% 4.7% 4.1% 1.7% 0.9% 1.2% 0.9%
2 9.0% 4.9% 10.7% 11.4% 5.6% 8.1% 11.5% 20.9% 17.1% 14.8% 15.9%
3 1.8% 3.9% 2.2% 1.7% 3.2% 3.1% 6.8% 4.4% 2.6% 18.5% 2.4%
4 12.6% 26.5% 32.7% 37.0% 28.9% 24.3% 24.2% 29.4% 19.5% 21.2% 18.5%
5 1.4% 3.6% 4.5% 3.6% 3.2% 2.6% 2.1% 3.2% 2.7% 2.3% 2.5%
6 1.1% 2.9% 2.5% 2.0% 2.8% 2.5% 3.0% 8.7% 6.2% 6.1% 5.8%
7 73.1% 56.4% 44.9% 42.3% 51.3% 54.4% 48.1% 31.0% 50.5% 35.5% 53.6%
8 0.2% 0.3% 0.4% 0.3% 0.3% 0.3% 0.2% 0.6% 0.5% 0.4% 0.5%
Total 100% 100% 100% 100% 100% 100% 100% 100% 100% 100% 100%
1+2 9.8% 6.3% 12.8% 13.2% 10.4% 12.8% 15.6% 22.6% 18.0% 16.0% 16.8%
1+2+3 11.6% 10.2% 15.0% 14.9% 13.6% 15.9% 22.4% 27.0% 20.6% 34.5% 19.2%
Source: Re-elaborated from Faíña et al. (2013) based on the ERDF expenditure table and complementary information from DG for the Planning and European Funds of Andalucía.
1. Enterprise, 2. Structural Adjustment, 3. Innovation, 4. Environmental Sustainability, 5. Labour Market, 6. Social Cohesion, 7. Infrastructure and Spatial Distribution of Economic Activity, 8. Unspecified. CSF: ERDF programmes in the Community Support Framework. ROP: Regional Operational Programmes. Alloc: allocations. Exp: expenditure. (*) Provisional data.
The table shows the expenditure and allocation in the initiatives within Regional Operational Programmes (ROP) and the overall expenditure and allocation in all the ERDF programmes in the CSF. In this respect, it is convenient to point out that the increase in the expenditure and allocation in the three entrepreneurship-related axes is more intense when all the ERDF programmes in the CSF are taken into account. This is due to some national programmes (i.e., regional incentives, the knowledge econo-my and the technological fund), in which Andalusia has had a high participation, but which were not part of the ROP. In this respect, the evolution in the regional strategy cannot be seen exclusively as the result of a change in the regional policy of Andalu-sia. It was also driven by the changes in the national and European Cohesion strategy.
3. Entrepreneurship policy interventions in Andalusia within the ERDF framework
The Andalusian strategy in the field of the entrepreneurship and enterprise policy has been oriented to four objectives: a) Providing financial support for firm creation

The European Cohesion policy and the promotion on entrepreneurship. The case of Andalusia 221
Investigaciones Regionales, 29 (2014) – Pages 215 a 236
and development; b) Improving entrepreneurial capabilities and providing consul-tancy services; c) Fostering entrepreneurial culture and d) Improving the business environment.
The ERDF interventions have mainly been concentrated on the first category. However, investments in educational infrastructures (secondary education, profes-sional training and universities) with ERDF support could have also contributed to improving the managerial capabilities of potential entrepreneurs. Furthermore, as will be commented upon later, some incentives were implemented with the interven-tion of ERDF to facilitate the access of SMEs to professional consultancy services. Regarding the promotion of entrepreneurial culture, there was an important role played by the European Social Fund (ESF). This supported many actions undertaken by the public foundation «Andalucía Emprende». Finally, the strategy to improve the business environment in Andalusia has been mainly oriented towards the creation of business and technology parks, as special microenvironments particularly favourable for the creation and development of SMEs. The impact of business and technology parks in Europe is controversial. Nevertheless, this instrument seems to have better results in less developed countries than in highly-developed ones and the experience with them in Spain has been assessed in positive terms (Romera, 2003; Barge-Gil et al., 2011).
The actions implemented gained in complexity throughout the different pro-gramme periods, broadening the range of project types and using a wider range of intervention tools. In spite of classical regional incentives being used since the initial 1989-93 programming period as a mechanism to support structural adjust-ment, different types of actions backing the creation, expansion and modernisation of enterprises increased in importance over the periods. The implementation of this strategic change towards enterprise and innovation benefited from the application of new financial instruments in the last programming periods. JEREMIE and JESSICA funds were introduced in the 2007-13 period, providing a more efficient design of the incentive system. Moreover, RDTI were reinforced in the last programming periods through the support of research projects and infrastructure in universities, enabling the transfer of technology, knowledge and applied research.
Next, the main ERDF interventions in this field will be presented following the three main axes differentiated in the previous section: Enterprise Development, Structural Adjustment and Innovation.
3.1. Enterprise Development
Business development initiatives 6 have been implemented by the regional gov-ernment and the intermediary body in charge of managing the Andalusian Global
6 The regional and multiregional ERDF programmes in Andalusia invested €730.9 million (at a constant 2000 value) in the Enterprise Development axis in the 1989-2011 period, equivalent to circa 3 per cent of the overall expenditure across the study period.

222 Romero, I. and Fernández-Serrano, J.
Investigaciones Regionales, 29 (2014) – Pages 215 a 236
Grant Operational Programme: the Institute for the Economic Promotion of Andalu-sia (IFA), later renamed Agency for the Innovation and Development of Andalusia (IDEA). In time, this regional development agency has acquired a central role in the management of business incentives 7.
The interventions in this axis can be classified into four categories:
— Measures to facilitate the access of SMEs to funding. A selection of financial instruments has been used, adapted in each period to the changing financial and economic conditions.
— Provision of business infrastructure, particularly in industrial areas and busi-ness parks.
— Actions to facilitate and stimulate the access of SMEs to consulting services and technical expertise. These investments, although of relatively modest amounts, aimed at promoting entrepreneurial culture and increasing the man-agerial capabilities of SMEs.
— Actions to stimulate and support the internationalisation of Andalusian com-panies.
Table 2 points out some of the main interventions in Enterprise Development initiatives with ERDF support.
Table 2. Main interventions in the axis of Enterprise Development in Andalusia with ERDF 8 9
Objectives Instruments/interventions
Facilitating the access of SMEs to funding
1989-93 period: contribution to mutual guarantee societies (€17.85 million) and subsidies for interest rates.
1994-99 period: contribution to mutual guarantee societies (€18.4 million); interest rate bonuses for SME loans (€82.6 million); reim-bursable grants (loans) to young entrepreneurs for starting new com-panies 8.
2000-06 period: 1,347 warranties, 212 reimbursable grants and 5,266 interest subsidies (€3,340 million, 2.1 per cent of private fixed capital formation in the period) 9.
2007-13 period: grants to support firm creation, expansion and mod-ernisation; new grants for supporting RTDI and innovative start-ups; JEREMIE fund (€235.7 million).
7 The incentives for financial instruments were grouped into a single scheme from 2005 onwards. In the 2007-13 programme, the system of business incentives underwent major modifications with the aim of promoting business development and focussing on innovation, as a strategy to achieve a new growth model based on the knowledge economy.
8 Reported achievements include 151 companies created, with an induced investment of €45.1 mil-lion and 920 new jobs (0.14 per cent of private fixed capital formation in the period).
9 According to the results reported, 17,296 gross jobs were created (0.6 per cent of the employed population) and 133,746 jobs were maintained (4.8 per cent of the employed population).

The European Cohesion policy and the promotion on entrepreneurship. The case of Andalusia 223
Investigaciones Regionales, 29 (2014) – Pages 215 a 236
Table 2. (Continue)
Objectives Instruments/interventions
Providing business infrastructure
1989-93 and 1994-99 periods: infrastructure to provide SMEs with training and advisory services; infr. for basic services (telecommunica-tions, electricity, etc.) in industrial areas and business parks.
2000-06 period: business and industrial parks in particular sectors (i.e., metal-mechanical, automotive components, chemicals, furniture)10.
Facilitating the access of SMEs to consulting services and technical expertise
2000-06 period: promotion of consultancy services in quality manage-ment and product design.
2007-13 period: «Cheque Innovación» (subsidy to facilitate and en-courage the use of innovation consulting services for SMEs).
Stimulating internationalisation
Support for promotion campaigns, participation in fairs and technical and financial assistance for the internationalisation plans of SMEs by the Trade Promotion Agency of Andalusia (EXTENDA).
Programmes by the Spanish Institute for Foreign Trade (ICEX) and the Chambers of Commerce.
Source: Elaborated from Faíña et al. (2013).
3.2. Structural Adjustment 10
Various courses of action have been deployed in the field of Structural Adjust-ment 11 from classic incentives for private investments in backward areas, to incen-tives for industrial diversification, tourism development or the technological mod-ernisation of businesses, as presented in Table 3.
Table 3. Main interventions in the axis of Structural Adjustment in Andalusia with ERDF
Objectives Instruments/interventions
Developing backward areas
Incentives for attracting new investments to problematic areas (i.e., «Zonas de Acción Espacial» —ZAE— of Cádiz, Campo de Gibraltar, Jaén, etc.).
Projects for industrial development focussed on priority sectors (food industry, electronics industry, ICT, etc.).
Strengthening competitiveness
Incentives for the technological modernisation of firms.
Reinforcing supply chains, upgrading production technologies and generating high-value-added products.
10 An occupancy rate of 81 per cent was achieved for industrial sites. 5,995 jobs created (0.2 per cent of employed population in 2000-2006) with an induced investment of €18.5 million.
11 The ERDF programmes — regional and multiregional — invested €3,310.5 million in the theme of Structural Adjustment up to the end of 2011, equivalent to approximately 11 per cent of overall expen-diture in the 1989-2011 period.

224 Romero, I. and Fernández-Serrano, J.
Investigaciones Regionales, 29 (2014) – Pages 215 a 236
Table 3. (Continue)
Objectives Instruments/interventions
Fostering productive diversification
Incentives for industrial diversification.
Incentives for tourism development. Creation of a brand image for An-dalusia. Tourism diversification developing new forms of tourism dif-ferent from «sun and sand» type, especially in inland and rural areas.
Source: Elaborated from Faíña et al. (2013).
3.3. Innovation
The actions in the Innovation axis have grown in financial importance over the programme periods and innovation has been established as a key strategic priority for the improvement and enhancement of business competitiveness in Andalusia 12.
The innovation strategy was oriented to promote and coordinate the regional in-novation system. Three lines of action were developed with the aid of ERDF funding:
— Support of research projects and equipment endowment programmes, mostly in the public sector.
— Fostering knowledge and technology transfer and supporting applied research in sectors with a strong presence in Andalusia and other emerging sectors.
— Promotion of information and communication technologies (ICT).
Despite the ERDF emphasis given to RTDI in the later programming periods, the achievements stemmed mostly from the public sector, reflecting the lack of private sector capabilities. Nevertheless, different actions can be pointed out that directly targeted business innovation, as shown in Table 4.
Table 4. Main interventions in the axis of Innovation in Andalusia with ERDF 13
Objectives Instruments/interventions
Supporting applied research and technology transfer
Technology Parks (i.e., Technology Park of Andalusia —PTA—, Scientif-ic and Technological Park Cartuja 93 and Andalusian Aerospace Technol-ogy Park —Aerópolis 13).
12 The amount of €1,151.3 million was allocated to the priority of Innovation through ERDF pro-grammes up to the end of 2011, approximately equivalent to 4 per cent of total investments across the study period.
13 In the 1994-99 programme, the introduction of high-tech equipment facilitated manufacturing programmes in aeronautical factories, paving the way for the creation of the Andalusian Aerospace Tech-nology Park (Aerópolis) in Seville in the following period and the consolidation of the aeronautical cluster in Andalusia. Aerópolis started its operations in 2003 and was conceived to support the Andalusian indus-try for large Airbus projects, e.g., the military transport plane A400M and the manufacture of high-tech-nology components for the Airbus 350.

The European Cohesion policy and the promotion on entrepreneurship. The case of Andalusia 225
Investigaciones Regionales, 29 (2014) – Pages 215 a 236
Table 4. (Continue)
Objectives Instruments/interventions
Supporting applied research and technology transfer
Technology centres oriented to traditional and emerging sectors (i.e., Centre for Advanced Aerospace Technologies —CATEC— the Andalu-sian Centre of Innovation, Information and Communication Technolo-gies (CITIC), and the Andalusian Stone Technology Centre —CTAP).
Projects promoted by the Centre for Industrial Technological Develop-ment (CDTI), the Offices of Research Results Transfer (OTRIs) of the universities and the Innovation and Technology Transfer Centre of Anda-lusia (Andalucía CIT).
Promoting information and communication technologies (ICT)
Public contracts with private companies to implement ICT applications and systems for public services in education, health, environmental pro-tection, etc.
Source: Elaborated from Faíña et al. (2013).
4. About the overall impact of the ERDF initiatives on entrepreneurial activity in Andalusia
The ERDF interventions described in the previous section had direct effects in terms of start-ups, employment creation, investment, patents or other indicators that are reported as achievements in the ex-post evaluations of the programmes. Howev-er, a different issue is to what extent these efforts might have induced a change in the entrepreneurial activity from a macroeconomic perspective, strengthening the entrepreneurship culture and the competitiveness of the SME sector in Andalusia.
This section will try to approach this key issue by observing a set of indicators on entrepreneurship and business development in the region 14. Table 8 presents some summarised results at the end of this section. Due to limitations regarding data avail-ability, most of the analysis will be focused on the 1995-2013 period.
The level of business density in Andalusia has been traditionally among the lowest of the Spanish regions. Nevertheless, as a result of the trends in business demography (birth and mortality), business density —measured as the number of businesses per 1,000 inhabitants— has increased both in Andalusia and the whole of Spain in the last two decades (see Figure 1). The evolution of this indicator has followed the same pattern in both areas according to the business cycle: a steady in-crease throughout the expansion period (1995-2008) followed by a fall in the current crisis (2009-12).
The overall performance of this indicator in the last decade in the case of An-dalusia has brought about a slight catching-up process with respect to the Spanish
14 It is not possible to establish a direct causal link between the ERDF interventions and the overall changes experienced in these entrepreneurship indicators, since many other factors intervened. Nonethe-less, this analysis aims to check whether some changes can be appreciated in the entrepreneurial culture and entrepreneurial orientation of Andalusian SMEs —versus the traditional deficiencies in this area— that could be reasonably and partially attributed to the ERDF programmes.
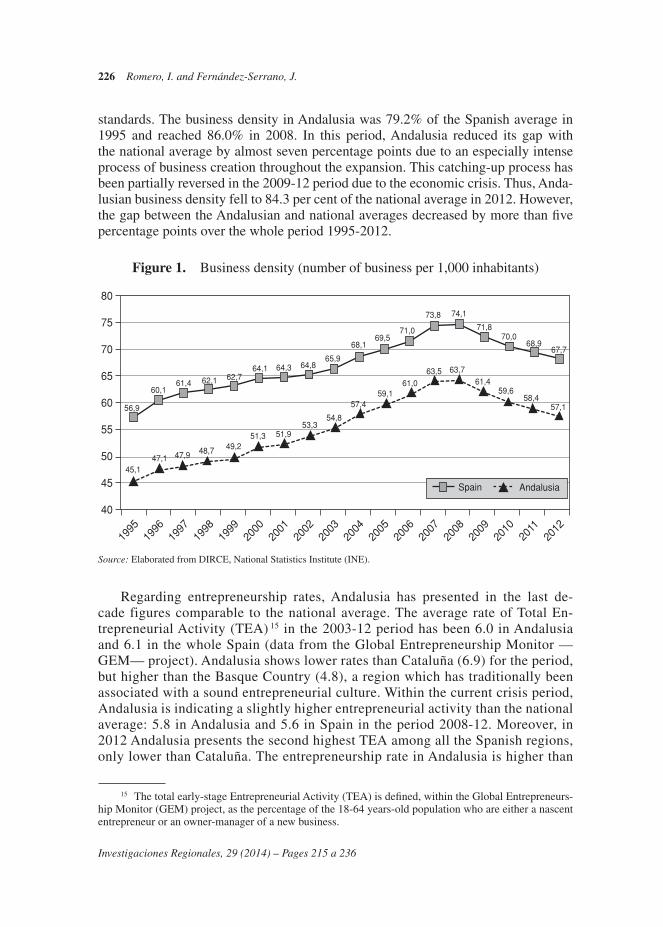
226 Romero, I. and Fernández-Serrano, J.
Investigaciones Regionales, 29 (2014) – Pages 215 a 236
standards. The business density in Andalusia was 79.2% of the Spanish average in 1995 and reached 86.0% in 2008. In this period, Andalusia reduced its gap with the national average by almost seven percentage points due to an especially intense process of business creation throughout the expansion. This catching-up process has been partially reversed in the 2009-12 period due to the economic crisis. Thus, Anda-lusian business density fell to 84.3 per cent of the national average in 2012. However, the gap between the Andalusian and national averages decreased by more than five percentage points over the whole period 1995-2012.
Figure 1. Business density (number of business per 1,000 inhabitants)
80
75
70
65
60
55
50
45
40
1995
1996
1997
1998
1999
2000
2001
2002
2003
2004
2005
2006
2007
2008
2009
2010
2011
2012
Spain Andalusia
56,9
45,147,1 47,9 48,7 49,2
51,3 51,953,3
54,8
57,459,1
61,063,5 63,7
61,459,6
58,457,1
60,161,4 62,1 62,7
64,1 64,3 64,865,9
68,169,5
71,0
73,8 74,1
71,870,0
68,967,7
Source: Elaborated from DIRCE, National Statistics Institute (INE).
Regarding entrepreneurship rates, Andalusia has presented in the last de-cade figures comparable to the national average. The average rate of Total En-trepreneurial Activity (TEA) 15 in the 2003-12 period has been 6.0 in Andalusia and 6.1 in the whole Spain (data from the Global Entrepreneurship Monitor —GEM— project). Andalusia shows lower rates than Cataluña (6.9) for the period, but higher than the Basque Country (4.8), a region which has traditionally been associated with a sound entrepreneurial culture. Within the current crisis period, Andalusia is indicating a slightly higher entrepreneurial activity than the national average: 5.8 in Andalusia and 5.6 in Spain in the period 2008-12. Moreover, in 2012 Andalusia presents the second highest TEA among all the Spanish regions, only lower than Cataluña. The entrepreneurship rate in Andalusia is higher than
15 The total early-stage Entrepreneurial Activity (TEA) is defined, within the Global Entrepreneurs-hip Monitor (GEM) project, as the percentage of the 18-64 years-old population who are either a nascent entrepreneur or an owner-manager of a new business.

The European Cohesion policy and the promotion on entrepreneurship. The case of Andalusia 227
Investigaciones Regionales, 29 (2014) – Pages 215 a 236
in the large EU economies (France, Germany or Italy), with the unique exception of the United Kingdom (see Table 5).
Table 5. TEA in the largest Spanish regions and EU economies
2003 2004 2005 2006 2007 2008 2009 2010 2011 2012
Andalusia 6.2 6.0 5.7 6.1 7.2 6.7 6.3 4.0 5.8 6.1
Catalonia 7.7 5.6 6.8 8.6 8.4 7.3 6.4 4.0 6.8 7.5
Madrid — 4.4 6.9 9.3 7.9 8.5 5.1 4.5 5.6 4.4
The Basque country — 5.3 5.4 5.4 6.4 7.0 3.0 2.5 3.9 4.4
Spain 6.8 5.2 5.7 7.3 7.6 7.0 5.1 4.3 5.8 5.7
Germany 5.2 4.4 5.1 4.2 — 3.8 4.1 4.2 5.6 5.3
France 1.6 6.4 5.4 4.4 3.2 5.6 4.3 5.8 5.7 5.2
Italy 3.1 4.3 4.9 3.5 5.4 4.6 3.7 2.4 — 4.3
UK 6.4 6.2 6.2 5.8 5.5 5.9 5.7 6.4 7.3 9.4
Source: Elaborated from http://www.gemconsortium.org/key-indicators, Ruiz et al. (2013) and Xavier et al. (2013).
This could be partially explained by the current crisis and the extraordinary high unemployment rates —especially severe in Andalusia 16— as factors causing an in-crease in the number of new entrepreneurs driven by necessity motives. According to the GEM data, necessity entrepreneurs represent 21.5% of the total number of en-trepreneurs in Spain and 25.9% in Andalusia as an average in the 2008-12 period. However, the rate of opportunity entrepreneurship (with respect to the working-age population) in Spain and Andalusia are similar: 4.2 and 4.0 as an average in the 2008-12 period.
In the expansion period of 1999-07, the total number of businesses increased in Andalusia faster than in the whole of Spain (see Table 6). Though a significant number of businesses were oriented to construction in this period, the comparative positive performance of Andalusia within the national framework also applies when the construction sector is excluded.
The current crisis is causing a reduction in the number of registered companies in Andalusia and Spain, which is more intense in the former. However, overall, in the 1999-2013 period the total number of businesses in Andalusia increased by 31.2 per cent versus a rise of 24.9 per cent in the whole of Spain. These data reveal a good performance of Andalusia in terms of business demography. This conclusion is also valid when businesses without employees (self-employment) are excluded (see Table 6).
16 The unemployment rate in Andalusia was 36.3% versus 26.4% in Spain in 2013 according to the Economically Active Population Survey elaborated by the National Statistics Institute.

228 Romero, I. and Fernández-Serrano, J.
Investigaciones Regionales, 29 (2014) – Pages 215 a 236
The regional economy has experienced a certain positive structural change in the last two decades, with a slight process of diversification 17 and some emerging sec-tors (aeronautics, business services and renewable energy). However, the industrial sector (with the exception of energy and construction) remained relatively modest in Andalusia, with its weight reducing from 11 per cent of regional employment and Gross Value Added (GVA) in 1999 to merely 8.8 per cent in 2011 (calculated from the Spanish Regional Accounts elaborated by the National Statistics Institute). Structural adjustment has failed in its attempt to build a sustainable manufacturing sector strong enough to significantly diversify the economic base of Andalusia and reinforce its potential to develop into a growth model focused on innovation and productivity. Diversification has mainly occurred through advances in tourism.
A major structural drawback of the Andalusian economy is the small average business size, leading to a problem of business fragmentation. The Andalusian pro-ductive system is characterised by a marked predominance of self-employees and microenterprises and a comparatively low participation of SMEs and large enterpris-es (see Table 7). In this respect, a positive trend was observed in the last expansion period with a relative decrease in the proportion of firms without employees in fa-vour of micro-enterprises (1 to 9 employees) and a slight increase in the proportion of SMEs.
The crisis has stopped this positive evolution and the proportion of self-employ-ees and microenterprises has increased together with the reduction in the share of SMEs. This is explained by the higher mortality rates observed for SMEs.
Andalusia has been traditionally characterised by its backwardness — in the na-tional and European context — regarding RTDI. In this field, some progress has been
17 The index of relative specialisation — given by the ratio of the Herfindahl index in the region to the average value of this index across all the Spanish regions — shows a decline in the level of specialisa-tion from 1.26 in the 1985-89 period to 1.11 in 2005-10 (Faíña et al., 2013).
Table 6. Evolution of the number of businesses (average annual growth rate)
Andalusia Spain
1999-07 2008-13 1999-13 1999-07 2008-13 1999-13
Total number of businesses 4.25 –2.04 1.96 3.46 –1.67 1.60
Number of businesses (construc-tion excluded) 3.78 –0.90 1.64 2.96 –0.57 1.37
Number of businesses with at least one employee 5.97 –2.93 2.70 4.41 –2.56 1.87
Number of businesses with at least one employee (construction excluded)
5.60 –1.06 2.78 4.15 –0.96 1.95
Source: Elaborated from DIRCE, INE (2013: data at 01/01/13).
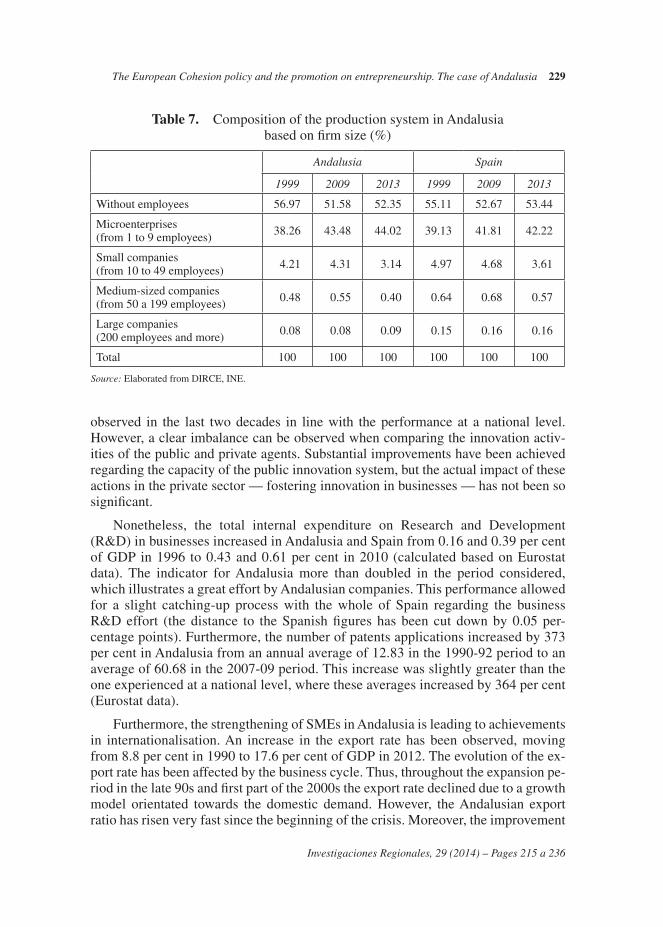
The European Cohesion policy and the promotion on entrepreneurship. The case of Andalusia 229
Investigaciones Regionales, 29 (2014) – Pages 215 a 236
observed in the last two decades in line with the performance at a national level. However, a clear imbalance can be observed when comparing the innovation activ-ities of the public and private agents. Substantial improvements have been achieved regarding the capacity of the public innovation system, but the actual impact of these actions in the private sector — fostering innovation in businesses — has not been so significant.
Nonetheless, the total internal expenditure on Research and Development (R&D) in businesses increased in Andalusia and Spain from 0.16 and 0.39 per cent of GDP in 1996 to 0.43 and 0.61 per cent in 2010 (calculated based on Eurostat data). The indicator for Andalusia more than doubled in the period considered, which illustrates a great effort by Andalusian companies. This performance allowed for a slight catching-up process with the whole of Spain regarding the business R&D effort (the distance to the Spanish figures has been cut down by 0.05 per-centage points). Furthermore, the number of patents applications increased by 373 per cent in Andalusia from an annual average of 12.83 in the 1990-92 period to an average of 60.68 in the 2007-09 period. This increase was slightly greater than the one experienced at a national level, where these averages increased by 364 per cent (Eurostat data).
Furthermore, the strengthening of SMEs in Andalusia is leading to achievements in internationalisation. An increase in the export rate has been observed, moving from 8.8 per cent in 1990 to 17.6 per cent of GDP in 2012. The evolution of the ex-port rate has been affected by the business cycle. Thus, throughout the expansion pe-riod in the late 90s and first part of the 2000s the export rate declined due to a growth model orientated towards the domestic demand. However, the Andalusian export ratio has risen very fast since the beginning of the crisis. Moreover, the improvement
Table 7. Composition of the production system in Andalusia based on firm size (%)
Andalusia Spain
1999 2009 2013 1999 2009 2013
Without employees 56.97 51.58 52.35 55.11 52.67 53.44
Microenterprises (from 1 to 9 employees) 38.26 43.48 44.02 39.13 41.81 42.22
Small companies(from 10 to 49 employees) 4.21 4.31 3.14 4.97 4.68 3.61
Medium-sized companies(from 50 a 199 employees) 0.48 0.55 0.40 0.64 0.68 0.57
Large companies(200 employees and more) 0.08 0.08 0.09 0.15 0.16 0.16
Total 100 100 100 100 100 100
Source: Elaborated from DIRCE, INE.

230 Romero, I. and Fernández-Serrano, J.
Investigaciones Regionales, 29 (2014) – Pages 215 a 236
in the export capacity of the Andalusian companies over time can be more clearly appreciated in the steady increase in the exports per capita which were in 2012 3.1 times larger than in 1990 (see Figure 2).
Figure 2. Andalusian exports of goods (as percentage of GDP and per capita in thousand constant 2011 euros)
2,500
2,000
1,500
1,000
500
0
Exp. pc (at a constant 2011 value) Exp/GDP
20
18
16
14
12
10
8
6
4
2
0
1990
1991
1992
1993
1994
1995
1996
1997
1998
1999
2000
2001
2002
2003
2004
2005
2006
2007
2008
2009
2010
2011
2012
Source: Elaborated from data of the Institute of Statistics and Cartography of Andalusia.
Table 8. Some evidence about the changes in the entrepreneurial activity in Andalusia
Area Traditional deficienciesRecent trends and current situation.
Evidence/results
Rate of entrepreneurial activity
Low entrepreneurial activityTEA around the Spanish averages and high-er than in the large economies in the EU (with the exception of the UK).
Type of entrepreneurship.
Motivations
Preponderance of necessity en-trepreneurship
Overall, similar composition of the total en-trepreneurial activity to the whole of Spain.
Slightly higher proportion of necessity en-trepreneurs.
Business creation Low business creationRates of increase in the number of business significantly higher than in the whole of Spain.
Business density Low business density
Overall increase in business density (with a procyclical behaviour).
Slight reduction in the gap with the values for the whole of Spain.

The European Cohesion policy and the promotion on entrepreneurship. The case of Andalusia 231
Investigaciones Regionales, 29 (2014) – Pages 215 a 236
Table 8. (Continue)
Area Traditional deficienciesRecent trends and current situation.
Evidence/results
Firm size composition
Excessive preponderance of microenterprises and self-em-ployees (fragmentation).
Scarce presence of large com-panies
Reduction in the proportion of self-employ-ees (without workers).
Increase in the proportion of microenter-prises.
Decrease in the share of SMEs.
Innovation Low firm innovation
Increase in R&D in the private sector. Slight reduction in the gap with the effort at a na-tional level.
Increase in patent applications.
Internationalisation Low export activity (especially for SMEs)
Overall increase in the export/PIB (with a procyclical behaviour).
Steady and persistent increase in exports per capita.
Source: Own elaboration.
5. Analysis and lessons from the case study of Andalusia
The analysis of the Andalusian experience allows for some conclusions to be drawn about the role that entrepreneurship promotion can play in the Cohesion policy framework (see Table 9 for a summary). In this respect, different considerations can be made regarding the strategy definition, the programme design and implementation and the evaluation of the initiatives.
The development strategy in Andalusia focused on increasing the connectivity of the region and facilitating access to other markets through large investments in transport infrastructure. Once the most important infrastructures were constructed, the expected returns of new infrastructural projects declined and some over-capacity may have appeared in particular cases. The strategy evolved in this way over the successive periods, changing the focus of attention towards the field of enterprise and innovation.
This strategic option could have been justified based on recent theoretical de-velopments. In addition to other socio-economic disadvantages, the peripheral posi-tion of Andalusia restricted returns from human capital, discouraging investment in education (Redding and Schott, 2003; López-Rodríguez et al., 2007). The deficien-cies in internal connectivity also limited the consolidation of an internal regional market with similar effects on the returns of human capital. Therefore, a distortion in the comparative wages of skilled and unskilled workers was induced (decreasing the relative wage of skilled workers), leading to a negative effect on highly-quali-fied workers. These deficiencies of skilled human capital were a major constraint

232 Romero, I. and Fernández-Serrano, J.
Investigaciones Regionales, 29 (2014) – Pages 215 a 236
on the development of economic activities oriented towards technology and inno-vation. In this context, the improvements in accessibility and internal connectivity could help to increase market potential and, therefore, the returns of human capital, stimulating the investment in education and the efforts to foster competitiveness (Faíña et al., 2013).
Consequently, the Andalusian strategy could have certainly represented the best possible approach considering the situation of this region at the end of the 1980s. More debatable is whether the change towards priorities in the fields of enterprise and innovation should have been more intense. Nowadays, though some progress has been made in this field as has been shown in Section 4, the main problems of the Andalusian economy are still related to business development, innovation and competitiveness.
In this respect, it is necessary to take into account that for an efficient use of the European Structural and Cohesion instruments it is also necessary for the productive system in a region to have enough absorption capacity. The Andalusian economy is characterised by significant weaknesses in its enterprise culture and business capa-bilities. Hence, regional companies may have not been prepared to assume a more ambitious enterprise and innovation policy.
One illustrative example of this is the case of the technological centres that have been created across the region to attend to the necessities of local industrial clusters. This initiative aimed at improving the transfer of research results to the business sec-tor and improving the technological capacity of SMEs that had not the financial and human capabilities to assume R&D efforts on their own.
Table 9. Some lessons regarding entrepreneurship promotion within the Cohesion policy framework based on the Andalusian experience
Level of intervention Considerations
Strategy
First, improving accessibility. Later, stimulating entrepreneurship and in-novation.
Evolution in the strategy over time: Looking for an optimal timing in the reorientation in priorities.
Long run policies with a slow maturation process: It is not possible to develop an entrepreneurial culture in the short and medium run.
Programme design/implementation
Adaptation to the regional socio-cultural environment.
Convenience of a bottom-up approach and demand analysis.
Benefits from a more integrated and coordinated approach.
Preference for reimbursable financial instruments to avoid a subsidy cul-ture.
Evaluation Necessity of a culture of evaluation of the initiatives.
Source: Own elaboration.

The European Cohesion policy and the promotion on entrepreneurship. The case of Andalusia 233
Investigaciones Regionales, 29 (2014) – Pages 215 a 236
However, a number of centres are experiencing difficulties in consolidating their activities and assuring their viability. Many of the centres are oriented towards sectors and local businesses with a low demand for their technological services. Business owners in Andalusia often assume an unimaginative and unadventurous approach to the management of their companies and are reluctant concerning cooperation initia-tives. This entrepreneurial culture poses an important obstacle for innovation along with the excessive presence of micro-enterprises and small firms. As Batterbury (2002) pointed out, a mismatch between the socio-cultural environment and policy design can reduce the effectiveness of public policies that are not adapted to the local conditions.
As a result, these efforts to stimulate innovation in the private sector are facing serious difficulties in their implementation in order to be effective. The key issue is developing a policy design, tailored to the characteristics and demands of the Anda-lusian business owners and companies, which effectively stimulates business innova-tion in the short run and contributes to the formation of a real culture of innovation in the long term. Furthermore, the productive specialisation of the Andalusia econo-my towards tourism and other, generally non-RTDI intensive, sectors constrains the achievements of the region in this area.
Deficiencies in entrepreneurial culture and entrepreneurial dynamism (birth, survival and expansion) have been a major structural drawback in Andalusia. The different actions developed within the ERDF programmes in the field of enterprise, innovation and structural adjustment have contributed to certain observed improve-ments, mainly in the last two decades. This effect of the Cohesion policy increasing entrepreneurship activity in economically backward regions has also been observed in other studies (see Sternberg, 2012, for Spain and Germany).
However, the entrepreneurial spirit has been historically poor in Andalusia, and significant socio-cultural obstacles make it difficult to obtain rapid and substantial results in this field. The role of education in instilling entrepreneurial attitudes and culture is crucial, but it needs to operate slowly. In this respect, there is another lesson that can be learnt from the Andalusian case: it is not possible to substantially change the entrepreneurial culture in a region with structural deficiencies in the short or me-dium run. Only in the long run could the actions reverse the situation and stimulate a vibrant entrepreneurial system. This has to be considered when evaluating the results of the programmes implemented.
In addition, in the design of the entrepreneurship policy, it is crucial to take de-mand considerations into account and to apply a bottom-up approach granting an important role to the private and intermediate agents. The supply side and top-down strategy could be an efficient approach for the development of large infrastructure projects. However, when the goal is stimulating firm creation and development, the primary role of public planning institutions might not lead to desirable results and it is recommendable to establish a more direct and intense dialogue with the interme-diate public institutions and private agents on a decentralised basis. The questionable experience of Andalusia with the technology centres, previously presented, can be seen as an illustration of these considerations.

234 Romero, I. and Fernández-Serrano, J.
Investigaciones Regionales, 29 (2014) – Pages 215 a 236
Entrepreneurship policy initiatives would also benefit from a more integrated and coordinated approach to policy design and implementation. This would facilitate the consideration of the complementarities/synergies and trade-offs between the projects supported by funding institutions at different levels (European, national, regional and local) and oriented to different fields of intervention (infrastructure, skills training, innovation and R&D, etc.).
Another lesson from the case of Andalusia is that, when trying to promote a real entrepreneurial culture in a region, the use of grants and subsidies implies the risk of creating a ‘subsidy’ culture and rent-seeking behaviours. In this respect, the use of reimbursable funds, credit guaranties or loans could have healthier effects for the stimulation of a real entrepreneurial culture.
Finally, it is convenient to develop a sound culture of evaluation of the interven-tions. Only in this way is it possible to detect best practices and learn from the errors in the design and implementation of the initiatives. Policy evaluation should be a tool for the introduction of corrective actions assuring the efficacy and efficiency of the programmes and interventions. The experience of Andalusia with the European Structural and Cohesion funds reveals that there is important room for improvement in this respect.
6. Conclusion
The relevance of entrepreneurship promotion has increased in the new Cohesion policy framework, which is inspired by the notion of smart specialisation. Regional policies seeking to stimulate a smart specialisation should foster entrepreneurship and technological diversification on the basis of the region’s existing skills, technol-ogies, and institutions (McCann and Ortega-Argilés, 2013).
This new approach calls for a better integration of the European Enterprise and Cohesion policies in order to develop an efficient framework to foster eco-nomic growth and social and spatial cohesion. In order to achieve this, a more profound theoretical understanding of the significance of entrepreneurship for re-gional development is needed together with further insights about the practical aspects of policy implementation in this field. In addition, the effectiveness of entrepreneurship promotion within the Cohesion policy framework requires these interventions to be tailored to the specific needs, capabilities and institutions of each region.
In this paper some conclusions have been drawn from the analysis of the ex-perience of Andalusia with the ERDF and its implications from the perspective of the entrepreneurship policy. Though a great heterogeneity exists regarding the entrepreneurial cultures and SME sectors within the EU (Romero and Fernán-dez-Serrano, 2007), some of these lessons could be relevant for other European regions, especially for other Mediterranean economies with similar problems to Andalusia.

The European Cohesion policy and the promotion on entrepreneurship. The case of Andalusia 235
Investigaciones Regionales, 29 (2014) – Pages 215 a 236
References
Antúnez, A., and Sanjuan, J. (2008): «Análisis de clusters en Andalucía», Investigaciones re-gionales, 12, 79-106.
Bachtler, J., Begg, I., Polverari, L., and Charles, D. (2013): Evaluation of the Main Achieve-ments of Cohesion Policy Programmes and Projects over the Longer Term in 15 Selected Regions (from 1989-1993 Programme Period to the Present (2011.CE.16.B.AT.015), Final Report to the European Commission (DG Regio), European Policies Research Centre, Uni-versity of Strathclyde (Glasgow) and London School of Economics.
Bachtler, J., and Wrenb, C. (2006): «Evaluation of European Union Cohesion policy: Research questions and policy challenges», Regional Studies, 40 (2), 143-153.
Barge-Gil, A., Vásquez Urriago, A., and Modrego Rico, A. (2011): «El impacto de los parques científicos y tecnológicos españoles sobre la innovación empresarial según distintos tipos de empresas», Información Comercial Española, Nº 860, 73-88.
Batterbury, S. C. E. (2002): «Evaluating Policy Implementation: The European Union’s Small and Medium Sized Enterprise Policies in Galicia and Sardinia», Regional Studies, 36 (8), 861-876.
European Commission (2003): Green Paper on Entrepreneurship in Europe, COM (2003) 27 final. — (2013): Entrepreneurship 2020 action plan. Reigniting the entrepreneurial spirit in Europe,
COM (2012) 795 final. — (2014): Investment for jobs and growth. Promoting development and good governance in
EU regions and cities. Six reports on economic, social and territorial cohesion, Publication Office of the European Union.
Faíña, A., López-Rodríguez, J., Romero, I., Fernández-Serrano, J., and Montes-Solla, P. (2013): Evaluation of the main achievements of cohesion policy programmes and projects over the longer term in 15 selected regions (from 1989-1993 programming period to the present). Case Study Andalucía. University of A Coruña, University of Seville, London School of Economics and European Policies Research Centre of the University of Strathclyde.
Fernández-Serrano, J., and Romero, I. (2013): «Entrepreneurial quality and regional develop-ment: Characterizing SME sectors in low income areas», Papers in Regional Science, 92 (3), 495-513.
Guzmán Cuevas, J. J., Santos Cumplido, F. J., Romero Luna, I., and Liñán Alcalde, F. (2000): «Las PYMEs y la calidad del tejido productivo andaluz», Boletín económico de Andalucía, 28-29, 43-56.
Junta de Andalucía (2000): Plan de Desarrollo Regional de Andalucía 2002-2006, Dirección General de Fondos Comunitarios, Consejería de Economía y Hacienda.
— (2007): Estrategia para la Competitividad de Andalucía 2007-2013, Consejería de Eco-nomía y Hacienda.
— (2012): Plan de Medio Ambiente de Andalucía Horizonte 2017, Consejería de Medio Am-biente.
Leibovitz, J. (2003): «Interrogating “Enterprise Europe”: Issues of Coordination, Governance and Spatial Development in the European Union’s Emerging Enterprise Policy», Interna-tional Journal of Urban and Regional Research, 27(3), 713-22.
Lima, M. C., and Cardenete, M. A. (2008): «The Impact of European Structural Funds in the South of Spain», European Planning Studies, 16 (10), 1445-1457.
López-Rodríguez, J., Faíña, J. A., and López-Rodríguez, J. (2007): «Human Capital Accumu-lation and Geography: Empirical Evidence in the European Union», Regional Studies, 4 (2), 217-234.
Marchante, A. J., and Sánchez-Maldonado, J. (dir.) (2005): Evaluación intermedia del Progra-ma Operativo Integrado de Andalucía 2000-2006, Junta de Andalucía and Universidad de Málaga.

236 Romero, I. and Fernández-Serrano, J.
Investigaciones Regionales, 29 (2014) – Pages 215 a 236
Marchese, M., and Potter, J. (2011): Entrepreneurship, SMEs and Local Development in An-dalusia, Spain, OECD Local Economic and Employment Development (LEED), Working Paper 2011/03, OECD Publishing.
McCann, P., and Ortega-Argilés, R. (2013): «Redesigning and Reforming European Regional Policy: The Reasons, the Logic, and the Outcomes», International Regional Science Re-view, 36 (3), 424-445.
Ramajo, J., Márquez, M. A., Hewing G. J. D., and Salinasa, M. M. (2008): «Spatial heteroge-neity and interregional spillovers in the European Union: Do cohesion policies encourage convergence across regions?», European Economic Review, 52, 551-567.
Redding, S., and Schott, P. (2003): «Distance, skill deepening and development: will peripheral countries ever get rich?», Journal of Development Economics, 72, 515-541.
Requena, T., and Cantón, F. J. (2007): El sistema educativo andaluz y su impacto social: Un estudio longitudinal. Fundación Centro de Estudios Andaluces, Consejería de la Presiden-cia, Junta de Andalucía.
Rodríguez-Pose, A., and Fratesi, U. (2004): «Between Development and Social Policies: The Impact of European Structural Funds in Objective 1 Regions», Regional Studies, 38 (1), 97-113.
Rodríguez-Pose, A., and Novak, K. (2013): «Learning processes and economic returns in Eu-ropean Cohesion policy», Investigaciones regionales, 25, 7-26.
Romera Lubias, F. (2003): «Los parques científicos y tecnológicos, sistemas virtuosos de inno-vación», Economía Industrial, 354(VI), 85-102.
Romero, I., and Fernández-Serrano, J. (2005): «La Política Europea de Fomento Empresarial. Un Análisis Crítico», Revista de Economía Mundial, 13, 137-161.
— (2007): «Un Análisis de la Heterogeneidad Empresarial en la Unión Europea: Implicacio-nes para la Política Europea de Fomento Empresarial», Ekonomiaz, 66, 350-371.
Ruiz, J. L. (dir.), Martínez, S., Medina, J. A., and Ramos, A. R. (2013): Global Entrepre-neurship Monitor. Andalucía. Informe Ejecutivo 2012, Cátedra de Emprendedores de la Universidad de Cádiz.
Sosvilla, S. (2009): «El impacto de los Fondos Europeos en la economía andaluza: 1989-2013», Revista de Estudios Regionales, 85, 97-118.
Sosvilla-Rivero, S., and Herce, J. A. (2008): «European cohesion policy and the Spanish econ-omy. A policy discussion case», Journal of Policy Modeling, 30, 559-570.
Sternberg, R. (2012): «Do EU Regional Policies Favour Regional Entrepreneurship? Empirical Evidence from Spain and Germany», European Planning Studies, 20(4), 583-608.
Villaverde, J., and Maza, A. J. (2010): «Los fondos estructurales europeos y la convergencia de las regiones españolas: 2000-2006», Papeles de Economía Española, 123, 2-15.
Xavier, S. R., Kelley, D., Kew, J., Herrington, M., and Vorderwülbecke, A. (2013): Global En-trepreneurship Monitor 2012 Global Report. Babson College, USA.
Zaragoza Rameau, J. A. (1991): «La política regional ante la integración europea: Principales líneas de desarrollo en Andalucía», Boletín Económico de Andalucía, 12, 9-18.

PLANTEAMIENTO Y FILOSOFÍA DE LA REVISTA
Investigaciones Regionales se creó con un objetivo básico: convertir la Revista en un prestigioso vehículo que permita dar a conocer aquellos trabajos de alta calidad que se están produciendo en el amplio ámbito académico y profesional de los estu-dios regionales, urbanos y territoriales, en general. La revista se fundó como iniciati-va de la Asociación Española de Ciencia Regional y cuenta con su pleno apoyo. Los procedimientos de evaluación siguen los estándares internacionales, de forma que todos los artículos, notas y posibles colaboraciones que sus autores deseen publicar se someten a la consideración de un Consejo de Redacción que actúa con criterios de oportunidad y calidad científica y que solicita, al menos, dos evaluaciones anónimas externas para su posible aceptación. La revista cuenta también con un Consejo Cien-tífico del que forman parte conocidos expertos internacionales.
Investigaciones Regionales quiere convertirse en un referente básico en el cam-po de investigaciones en el ámbito de la Ciencia Regional, al menos en cuanto a las publicaciones en español. El Consejo de Redacción valora especialmente los trabajos con un alto valor añadido, destacando las contribuciones de tipo metodológico y aquellas de carácter general que puedan ser de utilidad para un público amplio, tanto en España y otros países europeos como en Latinoamérica. Por ello, los trabajos remitidos sobre casos particulares se valoran en la medida en que contribuyen al co-nocimiento general y pueden trascender más allá del ámbito geográfico analizado.
Investigaciones Regionales es una revista pluridisciplinar. Son bienvenidos todos los trabajos generados desde la óptica de la economía, la geografía, la sociología, la ordenación del territorio, la ciencia política, etc. que, por su rigor, originalidad y valor añadido contribuyan a la consolidación de esta publicación y a mejorar sus niveles de calidad.
237
COLABORADORES INSTITUCIONALES DE LA REVISTA
FACULTAD DE CIENCIAS ECONÓMICAS Y EMPRESARIALES DE LA UNIVERSIDAD DE ALCALÁ, MADRID
INCASOL (INSTITUTO CATALÁ DEL SOL).GENERALITAT DE CATALUNYA, BARCELONA

238
PHILOSOPHY AND CONCEPT OF THE JOURNAL
Investigaciones Regionales was created with one basic objective: to convert itself into a prestigious tool to bring to light high-quality works carried out in the broad academic and professional fields of regional, urban and territorial research. It was founded by the Asociación Española de Ciencia Regional (Spanish Regional Science Association), and this association still fully supports the journal. Evaluation proce-dures comply with international standards, so that all articles, notes and possible contributions that authors wish to publish are subject to the review of an Editorial Board acting under scientific quality and opportunistic criteria, and requires, at least, two anonymous external evaluations before an acceptance is possible. The journal also counts on the assistance of a Scientific Council, comprising of well-known in-ternational experts.
Investigaciones Regionales hopes to become a basic reference within the field of Regional Science research, at least regarding publications in Spanish. The Editorial Board appreciates, in particular, works of a high quality, and highlights those which provide methodological and general contributions aimed at a large readership, not only in Spain and other European countries, but also in Latin America. The works received on specific cases are therefore valued regarding the contribution they make generally and as to whether they look further afield than the geographical area under analysis.
Investigaciones Regionales is a multidisciplinary journal. All contributions are welcome such as those generated from economics, geography, sociology, territorial planning, political science, etc. provided that their accuracy, originality and content help to strengthen the journal and increase its level of quality.
INSTITUTIONAL SUPPORTERS
FACULTAD DE CIENCIAS ECONÓMICAS Y EMPRESARIALES DE LA UNIVERSIDAD DE ALCALÁ, MADRID
INCASOL (INSTITUTO CATALÁ DEL SOL).GENERALITAT DE CATALUNYA, BARCELONA

NORMAS PARA EL ENVÍO DE ORIGINALES
1. Los artículos o notas enviados para su publicación en Investigaciones Regionales deberán ser originales no publicados ni aceptados para su publicación. Además, los trabajos remitidos no podrán encontrarse en proceso de evaluación para su publicación en otro medio de difusión.
2. Se enviará a la Secretaría de la Revista el original en papel y en formato electrónico (CD) con el contenido íntegro del trabajo en formato Microsoft Word. Los autores pueden optar por enviar el trabajo por correo electrónico a la siguiente dirección: [email protected] eximiéndose en este caso de su envío por medio impreso. En ambos casos la Secretaría de la Revista enviará acuse de recibo al autor(es) y anunciará el inicio del proceso de evaluación. No obstante, el correo postal será el medio utilizado en la comunicación de las decisiones de la Dirección y el Consejo de Redacción en relación con su publicación.
3. Todos los trabajos recibidos serán sometidos de una manera anónima a dos procesos, al menos, de evaluación externa. De acuerdo con los informes emitidos por los evaluadores, la Dirección y el Consejo de Redacción de la revista decidirán sobre la aceptación de los trabajos y su inclusión como artículos o como notas, en su caso. Dicha aceptación podrá venir condicionada a la introducción de modificaciones en el trabajo original.
4. La extensión total de los artículos nunca deberá exceder de 25 páginas (8.000 palabras aproximadamente), aunque es muy recomendable una extensión máxima de 20 páginas. En dicha extensión se incluyen cuadros, figuras, referencias bibliográficas, anexos, etc. El texto deberá estar mecanografiado a doble espacio. Las notas enviadas no podrán tener más de 8 páginas (recomendable unas 2.500 palabras) y han de estar mecanografiadas a doble espacio. Se rechazará todo trabajo que supere manifiestamente esta extensión.
5. Cada trabajo deberá ir precedido de una primera página que contenga el título del trabajo en español y en inglés, resumen en español y en inglés (100 palabras aproximadamente), palabras clave (entre dos y cinco), clasificación JEL (a dos dígitos), así como el nombre del autor(es), filiación y la dirección postal y electrónica del autor con el que debe mantenerse la correspondencia.
6. Las referencias bibliográficas irán al final del artículo en el epígrafe Referencias bibliográficas, ordenadas alfabéticamente por autores de acuerdo con el siguiente estilo:
Artículos: (1) Apellidos e inicial de todos los autores (en minúsculas); (2) año de publicación (entre paréntesis); (3) título completo del artículo (entre comillas);
239

240
(4) título de la revista (en cursiva); (5) volumen y número de la revista; (6) página inicial y final.
Ejemplo: Klein, L. R. (1969): «The Specification of Regional Econometric Models»,
Papers of the Regional Science Association, 23, 105-115. Libros: (1) Apellidos e inicial de todos los autores (en minúsculas); (2) año
de publicación (entre paréntesis); (3) título completo del libro (en cursiva); (4) edición; (5) editorial; (6) lugar de publicación.
Ejemplo: Anselin, L. (1986): Spatial Econometrics: Methods and Models, Kluwer Aca-
demic Publishers. Dordrech.
7. De ser necesario, se utilizarán notas a pie de página que irán numeradas correlativamente y voladas sobre el texto. Su contenido será mecanografiado a espacio sencillo.
8. Todos los cuadros, figuras, mapas, etc., irán intercalados en el texto. Tendrán una calidad suficiente para su reproducción y han de acompañarse con un título suficientemente explicativo y con sus respectivas fuentes. Los cuadros, figuras y mapas irán numerados correlativamente (cuadro 1, cuadro 2, figura 1...). Los cuadros y figuras deberán incluirse en el texto de forma que puedan formatearse (no han de ir pegados como imagen).
9. Las ecuaciones irán numeradas, integradas en el texto utilizando el editor de ecuaciones.
Envío de originales a:Investigaciones RegionalesSecretaría del Consejo de RedacciónFacultad de Ciencias Económicas y EmpresarialesPlaza de la Victoria, 228802 Alcalá de Henares, MadridTel.: 91 885 42 09 Fax: 91 885 42 49Email: [email protected] Site: www.investigacionesregionales.org
SUSCRIPCIOnES A LA REVISTA:
MARCIAL POnS LIBRERO, S. L.C/ San Sotero, 6, 28037 MADRIDTel.: 91 304 33 03 Fax: 91 754 12 18Email: [email protected] números/año. Precio: Instituciones: 85,0 €. Particulares: 45,0 €.
Los miembros de la Asociación Española de Ciencia Regional (AECR) recibirán gratuitamente los ejemplares de la Revista. Si no es socio de la AECR puede solicitar su ingreso en la Asociación y beneficiarse de ventajas adicionales.

LATEST ISSUES PUBLISHED
nº 28 - Spring 2014
Alberdi Pons, X.; Gibaja Martíns, J. J., and Davide Parrilli, M. Apprising Fragmentation in Regional Innovation Systems: A typology for Spain
Santos, D., and Simões, M. J. Regional innovation systems in Portugal: a critical evaluation
Elinbaum, P. Ten lessons on the recent European metropolitan planning. Arguments for reflecting on the practice and for designing spatial planning instruments
Aceytuno, M. T., and Sánchez-López, C. Academic Career and the Propensity to Engage in Technology Transfer. The Case of the University of Huelva
Jiménez García, M.; Ruiz Chico, J., and Peña Sánchez, A. R. Incidence of rural areas on the possible types of rural tourism: the case of Andalusia
Pablo-Romero Gil-Delgado, M. P.; Gómez-Calero Valdés, M. P., and Cerro Gutiérrez, G. Marginal product elasticity of productive factors. A translog function estimate for spanish provinces
Cabello Granado, P. A., and Hidalgo Vega, Á. Analysis of hospital efficiency by autonomous community in the National Health System field
Pellegrini, J. L., and Platino, M. The pattern of inequality in the spatial distribution of the Argentine manufacturing industry (1973-2003)
Escribá, F., and Murgui, M. J. BD.EURS (NACE Rev.1) Database
nº 27 - Autumn 2013
Seijas, A., and Iglesias, G. Evolution of productivity and relation with satisfaction in hospital care and specialized care of Autonomous Communities Health SystemsCapello, M.; Figueras, A.; Freille, S., and Moncarz, P. The role of federal transfers in regional convergence in human development indicators in Argentina
Escribá, F., and Murgui, M. J. Productivity and Regional Employment in Spain: A Dynamic Approach
Dueñas, D.; Iglesias, C., and Llorente, R. Labour segregation in the spanish regions from 1996 to 2010
González, V.; Rubiera, F., and Pérez, J. L. Description and analysis of the consequences of the housing Boom in Asturias using Geographical Information Systems, 1996-2006
Buendía, J. D., and Sánchez, M.ª M. The distribution of unemployment in Spanish regions: A spatial filtering approach with panel data
Maroto, A. Productivity and Services: A topic to be encouraged in the regional and territorial studies
241

242
ARTíCULOS ACEPTADOS (Para publicar en próximos números)
Artículos
Cardenete Flores, M. A., and Delgado López, M. C.Análisis del impacto de los Fondos Europeos 2007-2013 en Andalucía a través de un modelo de equilibrio general aplicado
Cañal-Fernández, V., and Hernández Muñiz, M.An exploratory analysis of disabled people accessibility to urban public transport: the use of Geographical Information Systems
Correia, C. M. y Silva, J.Measuring Creativity in the EU Member States
Goerlich Gisbert, F. J., and Cantarino Marti, I.El concepto europeo de ciudad: una aplicación para España
Hierro Recio, L. Á., and Atienza Montero, P.La evolución de los resultados distributivos de los sistemas de financiación autonómica, 1987-2010
Leal Marcos, A., and López Laborda, J.Un estudio de los factores determinantes de las desviaciones presupuestarias de las Comunidades Autónomas en el periodo 2003-2012

BOLETÍN DE SUSCRIPCIÓN
Sí, deseo suscribirme por un año (dos números y un monográfico) a IN VES TI GA-CIONES REGIONALES
Nombre ____________________________ Empresa ________________________
Dirección ____________________________________________________________
Código Postal __________________ Ciudad ______________________________
FORMAS DE PAGO
• Cheque adjunto a nombre de MARCIAL PONS, LIBRERO, S. L.• Transferencia Bancaria a nuestra c/c 0081-0532-46-0001118216 Banco de Sabadell• VISA o AMEX
___________________ Expiración _____________ Firma __________________
Envíe este pedido a
MARCIAL PONS, LIBRERO, S. L. San Sotero, 6. 28037 MADRID • Fax 91 754 12 18 • Tel. 91 304 33 03 e-mail: [email protected] • www.marcialpons.es
PRECIOS DE SUSCRIPCIÓn / SUBSCRIPTIOn RATES
ESPAÑA:
Anual individual 45,00 E (IVA incluido) Anual Instituciones 85,00 E (IVA incluido)
Para envíos fuera de España se añadirán costes de envío.


![A coruña[1]](https://img.pdfslide.net/doc/110x75/55a015811a28ab98208b4806/a-coruna1.jpg)