Embed Size (px)
Citation preview

1
Assessing the extreme risk of coastal inundation due to climate 1
change: A case study of Rongcheng, China 2
Aiqing Feng1,2, Jiangbo Gao1, Shaohong Wu1*, Yanzhong Li2,3, Xiliu Yue1,2 3
1 Key Laboratory of Land Surface Pattern and Simulation, Institute of Geographical Sciences and Natural Resources 4
Research, Chinese Academy of Sciences, Beijing 100101, China; 5
2 University of Chinese Academy of Sciences, Beijing 100049, China; 6
3 Key Laboratory of Water Cycle and Related Land Surface Processes, Institute of Geographical Sciences and Natural 7
Resources Research, Chinese Academy of Sciences, Beijing 100101, China. 8
9
*Corresponding author: Shaohong Wu 10
E-mail: [email protected] 11
12
Nat. Hazards Earth Syst. Sci. Discuss., doi:10.5194/nhess-2017-31, 2017Manuscript under review for journal Nat. Hazards Earth Syst. Sci.Published: 30 January 2017c© Author(s) 2017. CC-BY 3.0 License.

2
Abstract: Extreme water levels, caused by the joint occurrence of storm surges and high tides, 13
always lead to super floods along coastlines. Given the ongoing climate change, this study explored 14
the risk of future sea-level rise on the extreme inundation by combining P-III model and losses 15
assessment model. Taking Rongcheng as a case study, the integrated risk of extreme water levels 16
was assessed for 2050 and 2100 under three Representative Concentration Pathways (RCP) 17
scenarios of 2.6, 4.5, and 8.5. Results indicated that the increase in total direct losses would reach 18
an average of 60% in 2100 as a 0.82 m sea-level rise under RCP 8.5. In addition, affected population 19
would be increased by 4.95% to 13.87% and GDP (Gross Domestic Product) would be increased by 20
3.66% to 10.95% in 2050 while the augment of affected population and GDP in 2100 would be as 21
twice as in 2050. Residential land and farmland would be under greater flooding risk in terms of the 22
higher exposure and losses than other land-use types. Moreover, this study indicated that sea-level 23
rise shortened the recurrence period of extreme water levels significantly and extreme events would 24
become common. Consequently, the increase in frequency and possible losses of extreme flood 25
events suggested that sea-level rise was very likely to exacerbate the extreme risk of coastal zone in 26
future. 27
Keywords: sea-level rise; inundation risk; extreme water level; expected direct losses; affected 28
population and GDP; recurrence period. 29
30
1 Introduction 31
Coastal inundation is predominantly caused by extreme water levels when storm surges are 32
concurrent with astronomical high tides (e.g. Pugh, 2004; Quinn et al., 2014). Statistically, the 33
extreme flood events were occurred frequently and caused huge devastation (Trenberth et al., 2015). 34
Recent research indicated that sea-level rise, with global mean rates of 1.6 to 1.9 mm yr–1 over the 35
past 100 years (Holgate, 2007; Church and White, 2011; Ray and Douglas, 2011), had been strongly 36
driving the floods (Winsemius et al., 2016). Global mean sea-level was expected to rise more than 37
1 m by the end of this century (Levermann et al., 2013; Dutton et al., 2015), even if global warming 38
can be controlled within 2℃. Thus, coupled with continuous sea-level rise induced to climate 39
change, the future coastal inundation risk in terms of hazards and possible losses should be paid 40
Nat. Hazards Earth Syst. Sci. Discuss., doi:10.5194/nhess-2017-31, 2017Manuscript under review for journal Nat. Hazards Earth Syst. Sci.Published: 30 January 2017c© Author(s) 2017. CC-BY 3.0 License.

3
attention to disaster mitigation. 41
Projections for extreme water levels are indispensable for inundation risk assessment. Most 42
researches to date have focused on the coastal flooding caused by storm surges (e.g. Bhuiyan and 43
Dutta, 2011; Klerk et al., 2015). At present, exceedance probabilities of current extreme water level, 44
induced by tropical and extra-tropical storm surges, have been estimated (Haigh et al., 2014a, b). 45
However, on account of the sea-level rise, coastal flooding disasters would become more serious 46
(Feng et al., 2016) and 85% of global deltas experienced severe flooding in recent decades (Syvitski 47
et al., 2009). Feng and Tsimplis (2014) showed that extreme water level around the Chinese 48
coastline was increased by 2.0 mm to 14.1 mm yr-1 from 1954 to 2012. Based on an ensemble of 49
projection to global inundation risk, it argued that the frequency of flooding in Southeast Asia is 50
likely to increase substantially (Hirabayashi et al., 2013). By 2030, the portion of global urban land 51
exposed to the high-frequency flooding would be increased to 40% from a 30% level in 2000 52
(Guneralp et al., 2015). Conservative projections suggested that over a half of global delta surface 53
areas would be inundated as a result of sea-level rise by 2100 (Syvitski et al., 2009). 54
The impacts of coastal flooding on social economies were considered and some methods were 55
established to estimate the possible losses (e.g. Yang et al., 2016). With the socio-economic 56
development, the large aggregations of coastal population and assets would lead to the increase 57
exposed to inundation in future (Mokrech et al., 2012; Strauss et al., 2012; Alfieri et al., 2015). 58
Without adaptation, by 2100, 0.2% to 4.6% of the global population would be at risk of flooding, 59
and expected annual GDP losses would be 0.3% to 9.3% (Hinkel et al., 2014). In particular, 60
urbanization of China was rapidly fast in the world and many low-lying coastal cities were 61
confronted with high probabilities of flooding (Nicholls and Cazenave, 2010). More than 30% of 62
the China’s coast was assessed as ‘high vulnerability’ according the research of Yin et al., (2012), 63
and the population numbers exposed to flooding risk were the highest in the world (Neumann et al., 64
2015). A number of China’s cities including Guangzhou, Shenzhen, and Tianjin were in the top 20 65
global cities in terms of their exposure to 100-year inundation risk and huge average annual losses 66
because of water levels rising (Hallegatte et al., 2013). 67
Distinguishing the risk of extreme floods considering sea-level rise caused by climate change 68
is vital for disaster mitigation and adaptation on a large time scale. In this study, the flooding from 69
extreme water levels was simulated by a combination of storm surges, astronomical high tides, and 70
Nat. Hazards Earth Syst. Sci. Discuss., doi:10.5194/nhess-2017-31, 2017Manuscript under review for journal Nat. Hazards Earth Syst. Sci.Published: 30 January 2017c© Author(s) 2017. CC-BY 3.0 License.

4
sea-level rise heights under different RCP scenarios. Using Rongcheng City as a case study, a 71
comprehensive multi-dimensional analysis was presented to assess the inundation risk based on two 72
time scales of 2050 and 2100, and three RCP scenarios of 2.6, 4.5, and 8.5. The main objectives are 73
to (1) investigate the expansion of the inundated area and the increase in expected direct losses; (2) 74
analyze the effect of sea-level rise on population and GDP; and (3) reveal the future hazard change 75
of extreme water levels by the probability of occurrence. 76
2 Data and methodology 77
2.1 Study area 78
Rongcheng City, located at the tip of the Shandong Peninsula, China, is surrounded on three sides 79
by 500 km of Yellow Sea coastline (Fig. 1). This city has low-elevation and flat topography and 80
covers an area of more than 1,500 km2. Its population of 0.67 million people and GDP of $12.31 81
billion make it become one of the top one hundred counties in China. Rongcheng experiences a 82
monsoonal climate at medium latitudes with an average annual rainfall of 757 mm and a temperature 83
of 11.7℃ for nearly 50 years (data from http://data.cma.cn/). It is also in a critical geographical 84
position for trade exchange and the modern economy facing Korea across the Yellow Sea. 85
Substantial additional capital investment is expected in this region because the Shandong Peninsula 86
National High-tech Zone has been approved as a part of the National Independent Innovation 87
Demonstration Zone by the China’s State Council in 2016 (http://www.gov.cn/). A inundation risk 88
assessment for Rongcheng City is urgent to its long-term development, especially under the situation 89
of sea-level uptrend due to climate change. 90
Nat. Hazards Earth Syst. Sci. Discuss., doi:10.5194/nhess-2017-31, 2017Manuscript under review for journal Nat. Hazards Earth Syst. Sci.Published: 30 January 2017c© Author(s) 2017. CC-BY 3.0 License.

5
91
Fig. 1 Map to show the geographic locations of Rongcheng City and main tidal gauge stations 92
93
2.2 Assessment process and dataset 94
The assessment process of inundation risk followed three steps. First, extreme water levels were 95
calculated using storm surge data, astronomical high tides, and sea-level rise heights by the method 96
of Pearson Type Ⅲ (P-Ⅲ). Second, the inundated area and depth were identified by the flood 97
model (the four nearest neighbors algorithm) using the data of extreme water levels which resulted 98
from the first step and the Digital Elevation Model (DEM). Third, inundation risk was assessed by 99
direct losses model and recurrence period change. The dataset was summarized in Table 1. 100
101
102
103
104
105
106
Nat. Hazards Earth Syst. Sci. Discuss., doi:10.5194/nhess-2017-31, 2017Manuscript under review for journal Nat. Hazards Earth Syst. Sci.Published: 30 January 2017c© Author(s) 2017. CC-BY 3.0 License.

6
Table 1 Dataset of extreme risk assessment including hydrological, geographical, and statistical inputs 107
Data type Content Description Source
Hydrological
data
Sea-level rise Global mean sea-level rise in 2050 and 2100 under
RCPs 2.6, 4.5, 6.0, and 8.5. All scaled with two
degrees (low vs. high)
IPCC (2013)
Storm surge Return periods of storm surges were obtained using
the P-III model and historical data from 1967 to 2013
Tidal gauge stations,
National State Oceanic
Administration
Astronomical high tide Predicted using harmonic tide models based on
measured data (Wu et al. 2016)
Tidal gauge stations,
National State Oceanic
Administration
Geographical
data
1:10,000 digital topographic
maps
A 10 m × 10 m DEM was built using elevation points
and contour lines in ArcGIS
Bureau of Land
Management
Land-use maps High precision grid data at a 30 m scale were used to
characterize the land-use types in flooded area and
calculate direct damage
Institute of
Geographical Sciences
and Natural Resources
Research, Chinese
Academy of Sciences
(IGSNRR, CAS)
Spatial distribution of GDP and
population
1 km × 1 km grid data according to statistics from
2010
http://www.resdc.cn/
Statistical
data
Vulnerability curves and
estimated loss values for different
land-use types. Abbreviations: y,
loss rate (%); x, flood depth (m);
V, loss values ($/m2).
Residential land, y=16.682x, R2=0.6359, V=307.69;
Farmland, y=49.837x, R2=0.4246, V=0.77;
Grassland and woodland, y=36.304x, R2=0.9113,
V=12.31;
Unused land and water regions, y=0, V=0.
(Yin, 2011)
108
2.3 Construction of the cumulative probability distribution of extreme water levels 109
Extreme water level is a compound event caused by storm surges and astronomical high tides while 110
sea-level rise also contributes to extreme water levels under global climate change. Therefore, in 111
this study, the current extreme water levels (CEWLs) and future extreme water levels were 112
constructed. The latter was a combination of CEWLs and projected heights of sea-level rise under 113
different RCP scenarios and was defined as the scenario extreme water levels (SEWLs). The 114
cumulative probability distribution curves of CEWLs and SEWLs were refitted using a P-Ⅲ model 115
as the Equation (1). The details of this method were shown as Wu et al., (2016). 116
Nat. Hazards Earth Syst. Sci. Discuss., doi:10.5194/nhess-2017-31, 2017Manuscript under review for journal Nat. Hazards Earth Syst. Sci.Published: 30 January 2017c© Author(s) 2017. CC-BY 3.0 License.

7
𝑓(𝑥) =𝛽𝛼
𝛤(𝛼)∫ (𝑥 − 𝛼0)𝛼−1 𝑒−𝛽(𝑥−𝛼0)∞
𝑥𝑝 (1) 117
In this expression, α, β, and α0 are the shape, scale, and location parameters, respectively; x is 118
the annual maximum values for water levels; p is the probability of occurrence. 119
𝐶𝐸𝑊𝐿 = 𝑆𝑇 + 𝐴𝐻𝑇 (2) 120
where ST is storm surge and AHT is astronomical high tide; 121
𝑆𝐸𝑊𝐿 = 𝐶𝐸𝑊𝐿 + 𝑆𝐿𝑅 (3) 122
where SLR is the predicted height of sea-level rise in the future; 123
𝑇 = 1/𝑝 (4) 124
where T stands for the recurrence period of extreme water level and the T-year recurrence level 125
means that an event of extreme water level has a 1/T probability of occurrence in any given year 126
(Cooley et al., 2007). 127
Because of the uncertain impacts of sea-level-rise on storm surges, the statistical probabilities 128
of storm surge in this model were assumed to be unchanged in future (e.g. Hunter, 2012; Kopp et 129
al., 2013; Little et al., 2015). The extreme water levels were mainly constructed by historical records 130
of Chengshantou and Shidao tidal stations located in Rongcheng City (Fig. S1 in Supplementary 131
data). In order to reduce the error caused by the spatial distribution of extreme water levels, recorded 132
data of the surrounding six tidal stations (including Longkou, Penglai, Yantai, Qianliyan, 133
Xiaomaidao, and Rizhao) on Shandong Peninsula were still calculated using the inverse-distance-134
weighted (IDW) technique in ArcGIS software. 135
2.4 Identification of flooding 136
Inundated area was extracted from the flood model using the four nearest neighbors algorithm based 137
on high-resolution DEM (10 m × 10 m) and extreme water level layers (10 m × 10 m cells generated 138
in ArcGIS). Flooding criteria were that the extreme water level of layer cells must be greater than 139
or equal to the elevation of DEM and inundated cells must be connected to the coast individually 140
(Xu et al., 2016). The impacts of the elevations of urban landscapes and other buildings on flooding 141
process were not considered in this study. In this section, inundated area and depth could be 142
computed. 143
Nat. Hazards Earth Syst. Sci. Discuss., doi:10.5194/nhess-2017-31, 2017Manuscript under review for journal Nat. Hazards Earth Syst. Sci.Published: 30 January 2017c© Author(s) 2017. CC-BY 3.0 License.

8
2.5 Inundation risk assessment 144
Expected direct losses were calculated using inundated area, inundated depth, vulnerability curves, 145
and loss values for each land-use type. The land-use map of 30 m resolution was resampled to 10 m 146
cells using the raster processing tool in ArcGIS in order to match inundated cells. The assessment 147
model for expected direct losses is: 148
i
EDL A h r V (5) 149
where EDL stands for the expected direct losses of extreme floods; i denotes land-use type 150
including residential land, farmland, woodland, grassland, and unused land; A denotes inundated 151
area; h stands for flood depth; r stands for loss rate (vulnerability curves); and V stands for the per-152
unit loss value ($/m2). 153
The amounts of affected population and GDP were estimated based on the grid distribution 154
data of population and GDP (published in China 2010 at a resolution of 1 km, http://www.resdc.cn/). 155
Land-use cover change and socio-economic development were not considered in future (Hallegatte 156
et al., 2013; Hinkel et al., 2014; Muis et al., 2015). 157
3 Results and analysis 158
3.1 Inundated area 159
In the absence of adaptation, the areas inundated by CEWLs and SEWLs are shown as Fig. 2. At 160
the present stage, inundated areas range from 156.60 km2 to 168.8 km2 when Rongcheng City 161
encounters extreme water levels. However, an expanding trend in inundated area is inevitable 162
because of future sea-level rise; in this analysis, the smallest increase in inundated area would be 163
seen under RCP 2.6 while the largest would be seen under RCP 8.5 while it would be enlarged 164
significantly by 2100 compared to 2050 as sea-level rise continues. The extreme scenario, under 165
RCP 8.5, predicts that the total area where were threatened by flooding ranges from 168.35 km2 to 166
186.46 km2 in 2050, and that it may be between 187.72 km2 and 199.18 km2 by 2100. According to 167
this projection, the maximum area is around 13% by the end of the century. At high degree for each 168
RCP scenario, inundated area increases by 2100 is likely to range from 14.21% to 19.54% given a 169
100-year recurrence. Summary statistics of future inundated area increase for 50 to 1,000-year 170
recurrence periods are presented in Table S1(a). 171
Nat. Hazards Earth Syst. Sci. Discuss., doi:10.5194/nhess-2017-31, 2017Manuscript under review for journal Nat. Hazards Earth Syst. Sci.Published: 30 January 2017c© Author(s) 2017. CC-BY 3.0 License.

9
172
173
Fig. 2 Inundated areas under different RCP scenarios for 2050 and 2100. The blue solid line denotes the inundated 174
area curve as it changes with CEWLs, while the areas outlined by green and red stippled lines denote the extent of 175
inundated areas projected on the basis of SEWLs under low and high degree RCP scenarios for 2050 and 2100, 176
respectively. The green and red solid lines denote the median degree for each RCP scenario. Similarly, the 177
explanations are used for Fig. 4 and 5. 178
179
Land-use types of residential land, farmland, woodland and grassland are involved in the 180
estimation of total inundated area while the water bodies and unused land could be ignored in this 181
study. Thus, summarizing the inundated data, the total inundated land-use areas under RCP 8.5 are 182
shown in Fig. 3. Results show that residential land and farmland are more exposed to extreme water 183
levels than woodland and grassland. Indeed, when Rongcheng City is currently subjected by 184
extreme flooding, 42.63 km2 to 46.77 km2 of residential land and 34.15 km2 to 39.97 km2 of farmland 185
would be affected, based on 50 to 1000-year recurrence periods, respectively. Given a high degree 186
RCP 8.5 scenario, inundated areas of residential land and farmland would increase to 47.61 km2 and 187
41.13 km2 in 2050, and to 52.88 km2 and 51.47 km2 in 2100, respectively. More seriously, combined 188
areas of residential land and farmland exposed to flooding would rise to around 50 km2 in 2050 and 189
56 km2 in 2100, respectively. The flood map (Fig. S2) shows the extension of inundated area by 190
2050 and 2100 given a 100-year recurrence period. 191
192
Nat. Hazards Earth Syst. Sci. Discuss., doi:10.5194/nhess-2017-31, 2017Manuscript under review for journal Nat. Hazards Earth Syst. Sci.Published: 30 January 2017c© Author(s) 2017. CC-BY 3.0 License.

10
193
Fig. 3 Predicted inundated areas broken down by different land-use types given 50 to 1,000-year recurrence 194
periods in 2050 (a) and 2100 (b). RCP 8.5 is taken as an example in this paper and the inundated areas of different 195
land-use types under RCP 2.6 and 4.5 are similar. 196
197
3.2 Expected direct flood losses 198
Flood damage does not only depend on inundated area and depth, but is related to the loss rates and 199
values of exposed land-use types. The total expected direct flood losses would be exacerbated with 200
sea-level rise (Fig. 4), but for current extreme floods, loss magnitudes are up to $0.53 billion and 201
$0.69 billion for 50 to 1,000-year recurrence period CEWLs. Predictions for future extreme flood 202
show an increase of more than 20% when the elevation of sea-level rise exceeds 0.3 m, however, 203
the increase rates expand to beyond 40% given a 0.5 m sea-level rise. Indeed, by 2050, estimated 204
losses under the RCP 2.6 scenario would be between $0.6 billion and $0.84 billion. These losses 205
would be slightly increased by 2050 under the RCP 4.5 and 8.5 scenarios. Analyses show that 206
expected direct losses would be more aggravated by the end of the century. By 2100, the smallest 207
Nat. Hazards Earth Syst. Sci. Discuss., doi:10.5194/nhess-2017-31, 2017Manuscript under review for journal Nat. Hazards Earth Syst. Sci.Published: 30 January 2017c© Author(s) 2017. CC-BY 3.0 License.

11
range of expected damage given the low degree RCP 2.6 scenario would be between $0.63 billion 208
and $0.81 billion. However, the maximum range of expected damage under the high degree RCP 209
8.5 scenario is predicted to be between $0.88 billion and $1.08 billion. It is worth noting that the 210
increase rates reach an average of 60% under the high degree of RCP 8.5 scenario with a 0.82 m 211
sea-level rise. The largest increase in predicted direct flood damage would be up to 29% in 2050 212
and 67% in 2100. Additive statistical information of future expected direct losses increase is 213
presented in Table S1(b). The losses for main land-use types under the high degree RCP 8.5 scenario 214
are shown in Table S2 and results indicated that residential land would be seriously affected by 215
extreme floods. 216
217
218
Fig. 4 Expected direct losses (billion, dollar) in 2050 and 2100 given different RCP scenarios. 219
220
3.3 Population and GDP affected by extreme water levels 221
With the rapid socio-economic development, population and GDP have distributed along the 222
coastline. Thus, a large proportion of both population and GDP are expected to be affected by 223
extreme floods. Affected population and GDP exposed to flooding would be higher with the 224
expansion of inundation area as a direct result of sea-level rise. 225
The number of affected population under RCP scenarios of 2.6, 4.5, and 8.5 is shown as Fig. 226
5a. Expected population magnitudes, which would suffer from 50 to 1,000-year CEWLs, range 227
between about 70,000 and 79,000. In both 2050 and 2100, this increment is sharp with an enlarged 228
recurrence period and the maximum increment of affected population approaches 20,000 in 2050 229
and 30,000 in 2100. Considering the intermediate scenario of RCP 4.5, around 5.57% to 12.36% 230
Nat. Hazards Earth Syst. Sci. Discuss., doi:10.5194/nhess-2017-31, 2017Manuscript under review for journal Nat. Hazards Earth Syst. Sci.Published: 30 January 2017c© Author(s) 2017. CC-BY 3.0 License.

12
more people would be confronted with the inundation risk in 2050, while the affected population 231
would increase 9.52% to 23.53% in 2100. Detailed data of the increase in affected population are 232
provided in Table S1(c). 233
Similarly, sea-level rise also leads to an increased GDP exposure; the scope of affected GDP is 234
presented in Fig. 5b. In the case of no sea-level rise, the total GDP of Rongcheng City at risk from 235
extreme floods would be between $1.72 billion and $1.88 billion. As inundated area increasing due 236
to sea-level rise, the change in affected GDP is obvious. By 2100, projections for affected GDP 237
increase from $1.82 billion to $2.23 billion. At the most extreme, under the high degree RCP 8.5 238
scenario, affected GDP would increase by approximately 20% by the end of the century. Additional 239
information about increases in affected GDP is given in Table S1(d). 240
241
242
Fig. 5 Affected population and GDP exposed to inundation in 2050 and 2100 under different RCP scenarios 243
3.4 Variation of recurrence periods due to sea-level rise 244
Refitting SEWLs combined CEWLs with future sea-level rise demonstrates that the recurrence 245
periods would decrease sharply due to climate change (Fig. 6). Results suggest that, by 2050, the 246
recurrence periods of extreme water levels would be shortened rapidly. For example, in 2050, the 247
100-year recurrence period for CEWL is likely to fall by eight years to 31-year (RCP 2.6), seven 248
Nat. Hazards Earth Syst. Sci. Discuss., doi:10.5194/nhess-2017-31, 2017Manuscript under review for journal Nat. Hazards Earth Syst. Sci.Published: 30 January 2017c© Author(s) 2017. CC-BY 3.0 License.
13
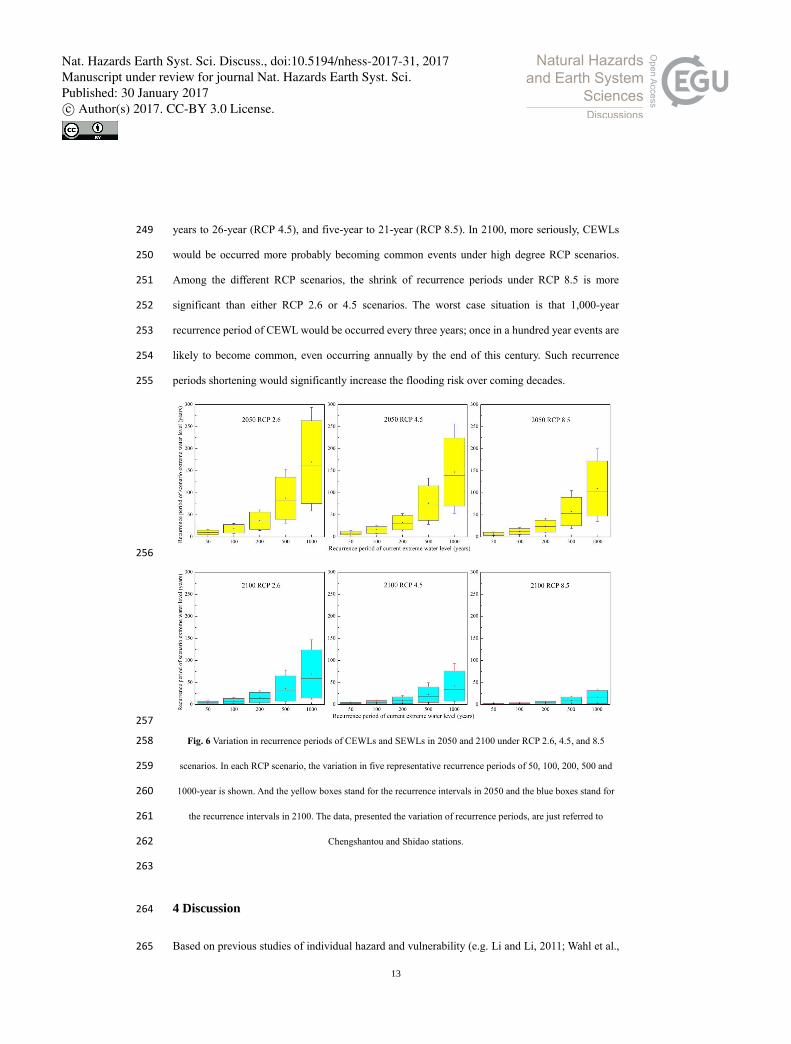
years to 26-year (RCP 4.5), and five-year to 21-year (RCP 8.5). In 2100, more seriously, CEWLs 249
would be occurred more probably becoming common events under high degree RCP scenarios. 250
Among the different RCP scenarios, the shrink of recurrence periods under RCP 8.5 is more 251
significant than either RCP 2.6 or 4.5 scenarios. The worst case situation is that 1,000-year 252
recurrence period of CEWL would be occurred every three years; once in a hundred year events are 253
likely to become common, even occurring annually by the end of this century. Such recurrence 254
periods shortening would significantly increase the flooding risk over coming decades. 255
256
257
Fig. 6 Variation in recurrence periods of CEWLs and SEWLs in 2050 and 2100 under RCP 2.6, 4.5, and 8.5 258
scenarios. In each RCP scenario, the variation in five representative recurrence periods of 50, 100, 200, 500 and 259
1000-year is shown. And the yellow boxes stand for the recurrence intervals in 2050 and the blue boxes stand for 260
the recurrence intervals in 2100. The data, presented the variation of recurrence periods, are just referred to 261
Chengshantou and Shidao stations. 262
263
4 Discussion 264
Based on previous studies of individual hazard and vulnerability (e.g. Li and Li, 2011; Wahl et al., 265
Nat. Hazards Earth Syst. Sci. Discuss., doi:10.5194/nhess-2017-31, 2017Manuscript under review for journal Nat. Hazards Earth Syst. Sci.Published: 30 January 2017c© Author(s) 2017. CC-BY 3.0 License.

14
2011), the extreme risk of inundation was assessed by integrating both of them. In this study, the 266
risk increase induced to sea-level rise was highlighted by the comparison of current with future 267
extreme water levels. SEWLs were recalculated by combining CEWLs with sea-level rise in 2050 268
and 2100 under RCP 2.6, 4.5, and 8.5. The results showed that recurrence periods would be likely 269
reduced by more than 70% by 2050 and this decrease could even exceed 80% by 2100 given high 270
RCP scenarios. In a similar study, Nicholls (2002) reported that a 0.2 m rise in sea-level could 271
markedly reduce recurrence periods of extreme water levels and a ten-year high water event was 272
converted into a six-month event. Indeed, as recurrence periods shortened, low-lying coastal areas 273
would have a higher probability of flood destruction over the next few decades. 274
The continuous sea-level rise would enhance the potential destructive force of future flooding. 275
For example, the results demonstrated that the potential inundated area would be extended by 3% 276
to 11% in 2050 and by 5% to 20% in 2100. In contrast, sea-level rise increased the inundated area 277
exposed to a cyclonic storm surge in Bangladesh by 15% with a 0.3 m rise (Karim and Mimura, 278
2008). Results showed that residential land and farmland were more vulnerable to sea-level rise 279
coupled with a large potential inundated area and a high proportion of expected direct damage. 280
Residential land was under the biggest risk, according to projected SEWLs under future RCP 281
scenarios which expected direct losses would up to $0.6 billion in 2050 and even exceed $1.00 282
billion by 2100. To put these predicted losses into context, average annual flood losses of Tianjin 283
City was estimated to be as high as $2.3 billion by 2050 (Hallegatte et al., 2013). It was predicted 284
that Shanghai, susceptible to high water levels, would be 46% underwater by 2100 with its seawalls 285
and levees submerged by rising sea-levels (Wang et al., 2012). A range of studies highlighted the 286
fact that many coastal cities, including San Francisco, would experience flooding in the near future 287
as a result of rising sea-level rather than heavy rainfall (Gaines, 2016). There was no doubt that 288
rising sea-levels would lead to a large number of people and property would be faced with flooding 289
risk, especially the fast growth of China’s coastal cities (McGranahan et al., 2007; Smith, 2011). 290
Given the shortening of recurrence periods in future, property and assets exposed to extreme 291
floods would be more likely. For instance, results showed that under a RCP 8.5 scenario, an extreme 292
event that was possible to take place every 1,000 years and cause damage of $0.7 billion would 293
occur about once every 50 years by 2050, even once every two years by 2100. Under these 294
circumstances, many people and industries at extreme risk from floods would have no choice but to 295
Nat. Hazards Earth Syst. Sci. Discuss., doi:10.5194/nhess-2017-31, 2017Manuscript under review for journal Nat. Hazards Earth Syst. Sci.Published: 30 January 2017c© Author(s) 2017. CC-BY 3.0 License.

15
retreat from coastal regions. However, studies indicated that most coastal populations were 296
completely unprepared for an increasing risk of extreme floods, especially in developing countries 297
(Woodruff et al., 2013). 298
Although this study manifested that sea-level rise would significantly increase the flooding risk, 299
some uncertainties still remain. First, on account of spatial heterogeneity, regional sea-level rise 300
should be projected in the future work. The objective of this paper is just to reveal the scientific 301
question that the impact of sea-level rise under global warming on extreme floods so that the 302
projection of global mean sea-level rise was used for its availability, which is consist with Wu et al., 303
(2016). Nevertheless, there is no obvious land subsidence for the regional crustal stability. Second, 304
the combination of climate and weather extremes, including storm surges, astronomical tides, 305
rainfall and sea-level rise need to be focused on as they underlie and amplify the extreme events as 306
well as generating extreme conditions (Leonard et al., 2014). Because the coastal regions of China 307
have a monsoonal climate, combining inundation risk assessment with consideration of rainfall is 308
particularly important (Bart et al., 2015; Wahl et al., 2015). Third, human activities, which impact 309
on socio-economic development and alter feedbacks from climate change, are the mainly driving 310
force of future inundation risk (Stevens et al., 2015) and should be focused in the next research. 311
Consequently, the deeper exploration aiming at these uncertainties would be undertaken. 312
5 Conclusions 313
This study assessed the inundation risk resulting from extreme water levels with future projections 314
for 2050 and 2100 under different RCP scenarios. Results demonstrated that continuous sea-level 315
rise would augment the inundation risk by shortening recurrence periods and increasing the expected 316
losses and potential effect. (1) Sea-level rise would make low-lying coastal regions more possible 317
to be exposed to flood because of the recurrence periods shortening of extreme water levels. (2) 318
Inundation risk would be increased by the increment of inundated area, direct damage, and affected 319
population and GDP. (3) The analysis presented that sea-level rise principally threatened the vertical 320
land-use types for human survival, especially residential land and farmland. (4) Projections showed 321
that inundation risk would continue to increase up to 2100 and would be the most serious under the 322
RCP 8.5 scenario. In summary, these results revealed that sea-level rise dramatically increased the 323
Nat. Hazards Earth Syst. Sci. Discuss., doi:10.5194/nhess-2017-31, 2017Manuscript under review for journal Nat. Hazards Earth Syst. Sci.Published: 30 January 2017c© Author(s) 2017. CC-BY 3.0 License.
16
flooding risk. Effective mitigation and adaptation plans are needed to deal with the increasing 324
coastal inundation risk. 325
Acknowledgements 326
This research project was supported by the National Science and Technology Support Program of 327
China (Grant No. 2013BAK05B04), the National Natural Science Foundation of China (Grant No. 328
41301089) and the Clean Development Mechanism Funding Projects of China (Grant No. 2013034). 329
The authors also thanked Dr. Wenhui Kuang (IGSNRR, CAS) for providing the high-precision land-330
use dataset of Rongcheng City. 331
References 332
Alfieri, L., Feyen, L., Dottori, F., and Bianchi, A.: Ensemble flood risk assessment in Europe under high end climate 333
scenarios, Glob. Environ. Chang., 35, 199-212, 2015. 334
Bart van den, H., Erik van, M., Paul de, V., Klaas-Jan van, H., and Jan, G.: Analysis of a compounding surge and 335
precipitation event in the Netherlands, Environ. Res. Lett., 10, 035001, 2015. 336
Bhuiyan, M. J. A. N., and Dutta, D.: Analysis of flood vulnerability and assessment of the impacts in coastal zones 337
of Bangladesh due to potential sea-level rise, Nat. Hazards, 61, 729-743, 2011. 338
Church, J. A., and White, N. J.: Sea-Level Rise from the Late 19th to the Early 21st Century, Surv. Geophys., 32, 339
585-602, DOI 10.1007/s10712-011-9119-1, 2011. 340
Cooley, D., Nychka, D., and Naveau, P.: Bayesian spatial modeling of extreme precipitation return levels, J. Am. 341
Stat. Assoc., 102, 824-840, 2007. 342
Dutton, A., Carlson, A., Long, A., Milne, G., Clark, P., DeConto, R., Horton, B., Rahmstorf, S., and Raymo, M.: 343
Sea-level rise due to polar ice-sheet mass loss during past warm periods, Science, 349, aaa4019, 2015. 344
Feng, A. Q., Gao, J. B., Wu, S. H., Liu, Y. H., He, X. J.: A review of storm surge disaster risk research and adaptation 345
in China under climate change (In Chinese), Progress in Geography, 35, 1411-1419, 2016. 346
Feng, X., and Tsimplis, M. N.: Sea level extremes at the coasts of China, J. Geophys. Res., 119, 1593-1608, 2014. 347
Gaines, J. M.: Flooding: Water potential, Nature, 531, S54-S55, 10.1038/531S54a, 2016. 348
Guneralp, B., Guneralp, I., and Liu, Y.: Changing global patterns of urban exposure to flood and drought hazards, 349
Glob. Environ. Chang., 31, 217-225, 2015. 350
Haigh, I., Wijeratne, E. M. S., MacPherson, L., Pattiaratchi, C., Mason, M., Crompton, R., and George, S.: Estimating 351
present day extreme water level exceedance probabilities around the coastline of Australia: tides, extra-tropical 352
storm surges and mean sea level, Clim. Dyn., 42, 121-138, 10.1007/s00382-012-1652-1, 2014a. 353
Haigh, I. D., MacPherson, L. R., Mason, M. S., Wijeratne, E. M. S., Pattiaratchi, C. B., Crompton, R. P., and George, 354
S.: Estimating present day extreme water level exceedance probabilities around the coastline of Australia: 355
tropical cyclone-induced storm surges, Clim. Dyn., 42, 139-157, 2014b. 356
Hallegatte, S., Green, C., Nicholls, R. J., and Corfee-Morlot, J.: Future flood losses in major coastal cities, Nature 357
Clim. Change, 3, 802-806, 10.1038/nclimate1979, 2013. 358
Hinkel, J., Lincke, D., Vafeidis, A. T., Perrette, M., Nicholls, R. J., Tol, R. S., Marzeion, B., Fettweis, X., Ionescu, 359
Nat. Hazards Earth Syst. Sci. Discuss., doi:10.5194/nhess-2017-31, 2017Manuscript under review for journal Nat. Hazards Earth Syst. Sci.Published: 30 January 2017c© Author(s) 2017. CC-BY 3.0 License.

17
C., and Levermann, A.: Coastal flood damage and adaptation costs under 21st century sea-level rise, Proc. Natl. 360
Acad. Sci. USA, 111, 3292-3297, 2014. 361
Hirabayashi, Y., Mahendran, R., Koirala, S., Konoshima, L., Yamazaki, D., Watanabe, S., Kim, H., and Kanae, S.: 362
Global flood risk under climate change, Nature Clim. Change, 3, 816-821, 2013. 363
Holgate, S. J.: On the decadal rates of sea level change during the twentieth century, Geophys. Res. Lett., 34, Artn 364
L01602 Doi 10.1029/2006gl028492, 2007. 365
Hunter, J.: A simple technique for estimating an allowance for uncertain sea-level rise, Clim. Chang., 113, 239-252, 366
2012. 367
IPCC: Climate Change 2013: The physical science basis: Working group I contribution to the fifth assessment report 368
of the Intergovernmental Panel on Climate Change, Cambridge University Press, 2013. 369
Karim, M. F., and Mimura, N.: Impacts of climate change and sea-level rise on cyclonic storm surge floods in 370
Bangladesh, Glob. Environ. Chang., 18, 490-500, 2008. 371
Kirwan, M. L., and Megonigal, J. P.: Tidal wetland stability in the face of human impacts and sea-level rise, Nature, 372
504, 53-60, 2013. 373
Klerk, W. J., Winsemius, H. C., Verseveld, W. J. v., Bakker, A. M. R., and Diermanse, F. L. M.: The co-incidence of 374
storm surges and extreme discharges within the Rhine–Meuse Delta, Environ. Res. Lett., 10, 035005, 2015. 375
Kopp, R. E., Simons, F. J., Mitrovica, J. X., Maloof, A. C., and Oppenheimer, M.: A probabilistic assessment of sea 376
level variations within the last interglacial stage, Geophys. J. Int., 193, 711-716, Doi 10.1093/Gji/Ggt029, 2013. 377
Leonard, M., Westra, S., Phatak, A., Lambert, M., van den Hurk, B., McInnes, K., Risbey, J., Schuster, S., Jakob, D., 378
and Stafford-Smith, M.: A compound event framework for understanding extreme impacts, Wires Clim. Change, 379
5, 113-128, 10.1002/wcc.252, 2014. 380
Levermann, A., Clark, P. U., Marzeion, B., Milne, G. A., Pollard, D., Radic, V., and Robinson, A.: The 381
multimillennial sea-level commitment of global warming, Proc. Natl. Acad. Sci. USA, 110, 13745-13750, 2013. 382
Li, K., and Li, G. S.: Vulnerability assessment of storm surges in the coastal area of Guangdong Province, Nat. 383
Hazards Earth Syst. Sci., 11, 2003-2010, 10.5194/nhess-11-2003-2011, 2011. 384
McGranahan, G., Balk, D., and Anderson, B.: The rising tide: assessing the risks of climate change and human 385
settlements in low elevation coastal zones, Environment and urbanization, 19, 17-37, 2007. 386
Mokrech, M., Nicholls, R. J., and Dawson, R. J.: Scenarios of future built environment for coastal risk assessment 387
of climate change using a GIS-based multicriteria analysis, Environ. Plann. B, 39, 120-136, Doi 388
10.1068/B36077, 2012. 389
Muis, S., Güneralp, B., Jongman, B., Aerts, J. C. J. H., and Ward, P. J.: Flood risk and adaptation strategies under 390
climate change and urban expansion: A probabilistic analysis using global data, Sci. Total Environ., 538, 445-391
457, 2015. 392
Neumann, B., Vafeidis, A. T., Zimmermann, J., and Nicholls, R. J.: Future Coastal Population Growth and Exposure 393
to Sea-Level Rise and Coastal Flooding - A Global Assessment, Plos One, 10, 10.1371/journal.pone.0118571, 394
2015. 395
Nicholls, R. J.: Analysis of global impacts of sea-level rise: a case study of flooding, Phys. Chem. Earth, Parts A/B/C, 396
27, 1455-1466, 2002. 397
Nicholls, R. J., and Cazenave, A.: Sea-Level Rise and Its Impact on Coastal Zones, Science, 328, 1517-1520, 398
10.1126/science.1185782, 2010. 399
Pugh, D.: Changing sea levels: effects of tides, weather and climate, Cambridge University Press, 2004. 400
Quinn, N., Lewis, M., Wadey, M. P., and Haigh, I. D.: Assessing the temporal variability in extreme storm-tide time 401
series for coastal flood risk assessment, J. Geophys. Res., 119, 4983-4998, 10.1002/2014jc010197, 2014. 402
Ray, R. D., and Douglas, B. C.: Experiments in reconstructing twentieth-century sea levels, Prog. Oceanogr., 91, 403
Nat. Hazards Earth Syst. Sci. Discuss., doi:10.5194/nhess-2017-31, 2017Manuscript under review for journal Nat. Hazards Earth Syst. Sci.Published: 30 January 2017c© Author(s) 2017. CC-BY 3.0 License.

18
496-515, DOI 10.1016/j.pocean.2011.07.021, 2011. 404
Smith, K.: We are seven billion, Nature Clim. Change, 1, 331-335, 2011. 405
Stevens, A. J., Clarke, D., Nicholls, R. J., and Wadey, M. P.: Estimating the long-term historic evolution of exposure 406
to flooding of coastal populations, Nat. Hazards Earth Syst. Sci., 15, 1215-1229, 10.5194/nhess-15-1215-2015, 407
2015. 408
Strauss, B. H., Ziemlinski, R., Weiss, J. L., and Overpeck, J. T.: Tidally adjusted estimates of topographic 409
vulnerability to sea level rise and flooding for the contiguous United States, Environ. Res. Lett., 7, 014033, 410
2012. 411
Syvitski, J. P., Kettner, A. J., Overeem, I., Hutton, E. W., Hannon, M. T., Brakenridge, G. R., Day, J., Vörösmarty, 412
C., Saito, Y., and Giosan, L.: Sinking deltas due to human activities, Nat. Geosci., 2, 681-686, 2009. 413
Trenberth, K. E., Fasullo, J. T., and Shepherd, T. G.: Attribution of climate extreme events, Nature Clim. Change, 5, 414
725-730, 10.1038/nclimate2657, 2015. 415
Wahl, T., Mudersbach, C., and Jensen, J.: Assessing the hydrodynamic boundary conditions for risk analyses in 416
coastal areas: a stochastic storm surge model, Nat. Hazards Earth Syst. Sci., 11, 2925-2939, DOI 10.5194/nhess-417
11-2925-2011, 2011. 418
Wahl, T., Jain, S., Bender, J., Meyers, S. D., and Luther, M. E.: Increasing risk of compound flooding from storm 419
surge and rainfall for major US cities, Nature Clim. Change, 5, 1093-1097, 2015. 420
Wang, J., Gao, W., Xu, S., and Yu, L.: Evaluation of the combined risk of sea level rise, land subsidence, and storm 421
surges on the coastal areas of Shanghai, China, Clim. Change, 115, 537-558, 10.1007/s10584-012-0468-7, 2012. 422
Winsemius, H. C., Aerts, J. C. J. H., van Beek, L. P. H., Bierkens, M. F. P., Bouwman, A., Jongman, B., Kwadijk, J. 423
C. J., Ligtvoet, W., Lucas, P. L., van Vuuren, D. P., and Ward, P. J.: Global drivers of future river flood risk, 424
Nature Clim. Change, 6, 381-385, 2016. 425
Woodruff, J. D., Irish, J. L., and Camargo, S. J.: Coastal flooding by tropical cyclones and sea-level rise, Nature, 426
504, 44-52, 10.1038/nature12855, 2013. 427
Wu, S. H., Feng, A. Q., Gao, J. B., Li, Y. Z., Wang, L.: Shortening the recurrence periods of extreme water levels 428
under future sea-level rise, Stoch. Env. Res. Risk Assess, 2016. doi: 10.1007/s00477-016-1327-2. 429
Xu, L., He, Y., Huang, W., and Cui, s.: A multi-dimensional integrated approach to assess flood risks on a coastal 430
city, induced by sea-level rise and storm tides, Environ. Res. Lett., 11, 014001, 2016. 431
Yang, S., Liu, X., and Liu, Q.: A storm surge projection and disaster risk assessment model for China coastal areas, 432
Nat. Hazards, 84, 649-667, 10.1007/s11069-016-2447-1, 2016. 433
Yin, J.: Study on the risk assessment of typhoon storm tide in China coastal area, Shanghai: East China Normal 434
University, 2011. 435
Yin, J., Yin, Z., Wang, J., and Xu, S.: National assessment of coastal vulnerability to sea-level rise for the Chinese 436
coast, J. Coast. Conserv., 16, 123-133, 10.1007/s11852-012-0180-9, 2012. 437
Nat. Hazards Earth Syst. Sci. Discuss., doi:10.5194/nhess-2017-31, 2017Manuscript under review for journal Nat. Hazards Earth Syst. Sci.Published: 30 January 2017c© Author(s) 2017. CC-BY 3.0 License.


![æ å ¡è³ æ æ¸ å ® [R002] · :kr 3urylgh 5hohydqw 6huylfhv wr wkh 3xeolf /lvw ri &klqd $ssrlqwhg $wwhvwlqj 2iilfhuv krxu (qtxlu\ +rwolqh 1r 1dph $gguhvv 7ho 1r 7ho 1r](https://img.pdfslide.net/doc/110x75/5ec9ae5b62518453642ce05a/-r002-kr-3urylgh-5hohydqw-6huylfhv-wr-wkh-3xeolf-lvw.jpg)

![HLWOLQLH ]XP 8PJDQJ PLW GHU &29,' (SLGHPLHde.china-embassy.org/det/gdxw/P020200318031744558131.pdf · 'lh 5hjlhuxqj ghu 9ronvuhsxeoln &klqd e]z lkuh .rpplvvlrq lp %h]xj dxi wudglwlrqhooh](https://img.pdfslide.net/doc/110x75/608bfe88071044043f75bbe8/hlwolqlh-xp-8pjdqj-plw-ghu-29-lh-5hjlhuxqj-ghu-9ronvuhsxeoln-klqd.jpg)


![Dieta Alleluja [tryb zgodnoÅ ci] - · PDF fileu sdvwru gu * 0donpxv zsurzdg]lã glhw $oohoxmd 7kh &klqd 3urmhfw , hwds l ,, hwds z\qlnl edgd qdxnrz\fk ]jrgqh ] nrqfhsfm](https://img.pdfslide.net/doc/110x75/5ab284f47f8b9a6b468d82ad/dieta-alleluja-tryb-zgodno-ci-sdvwru-gu-0donpxv-zsurzdgl-glhw-oohoxmd-7kh.jpg)


![] Ø Â B ã د ¼ ܯ©Â ì 0ÂÜã ¼¼ ã¯ÈÂ...(OLWH 6FUHHQV ,QF _ (OLWH 6FUHHQV 3W\ /WG $XVWUDOLD _ (OLWH 6FUHHQV &KLQD &RUS _ (OLWH 6FUHHQV (XURSH *0%+ _ (OLWH 6FUHHQV](https://img.pdfslide.net/doc/110x75/5f7880a63f93b22ab9481b04/-b-oe-0oe-olwh-6fuhhqv-qf-olwh.jpg)

![IEEE PSRC Jan 2017 Presentation PES Initiatives Novosel · 6WDWH *ULG &KLQD &RUS &DOLIRUQLD 38& HWF / d Z v ] o W } o ] Ç ^ µ } d l & } ... Microsoft PowerPoint - IEEE PSRC Jan](https://img.pdfslide.net/doc/110x75/6008c835946b3304276b6d90/ieee-psrc-jan-2017-presentation-pes-initiatives-6wdwh-ulg-klqd-rus-doliruqld.jpg)


![Politik Position - Position China C1 W2OXGZLJORUHW] FK OORUHW]#EOXHZLQ FK &KLQD v+DQGHOVDENRPPHQ (8 &KLQD 6HLW KDEHQ GLH (8 XQG &KLQD EHU HLQ ,QYHVWLWLRQVDENRPPHQ YHUKDQGHOW 1XQ VLQG](https://img.pdfslide.net/doc/110x75/60e06e5ee90b840f7202f72e/politik-position-position-china-c1-w2-oxgzljoruhw-fk-ooruhweoxhzlq-fk-klqd.jpg)