Embed Size (px)
Citation preview
Rice farming in the Philippines: some facts and opportunities
V. Bruce J. Tolentino, Ph.D. Deputy Director-General International Rice Research Institute September 2015
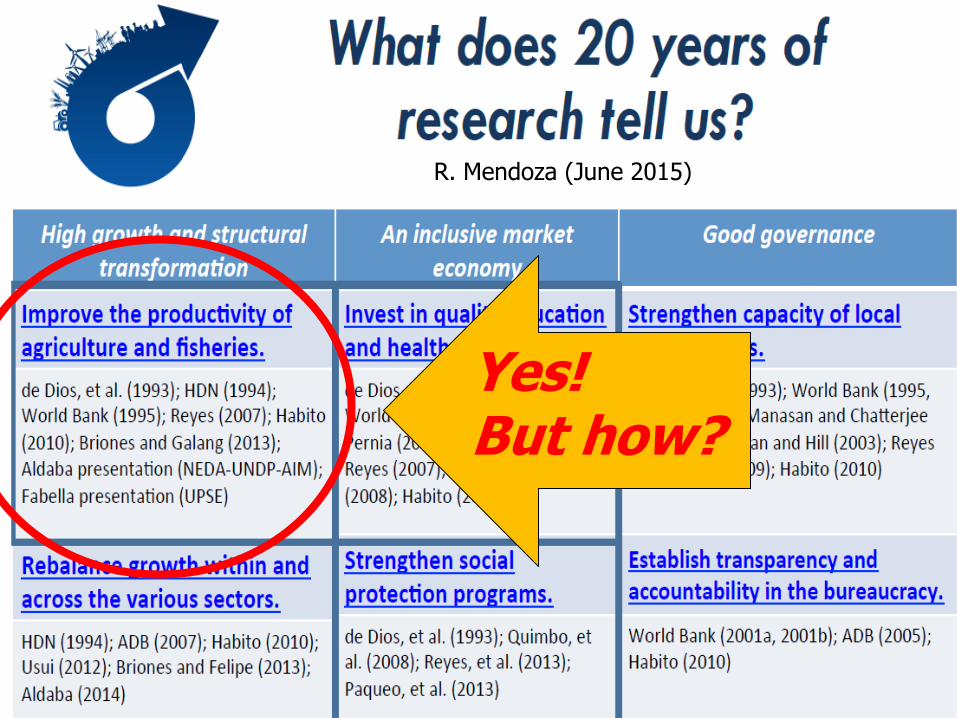
Yes! But how?
R. Mendoza (June 2015)
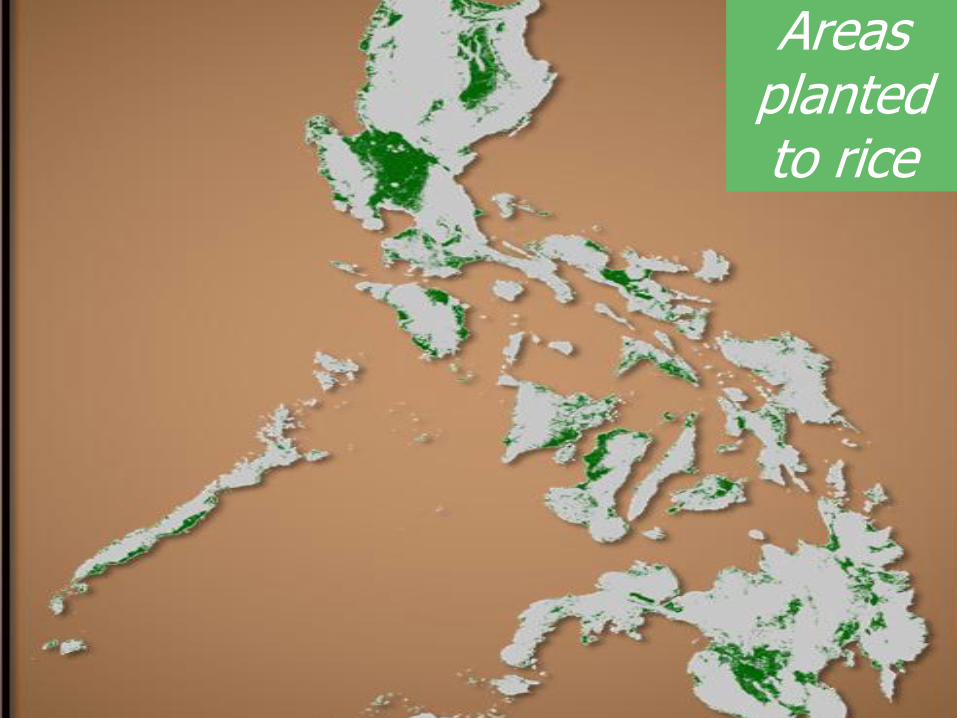
Areas planted to rice
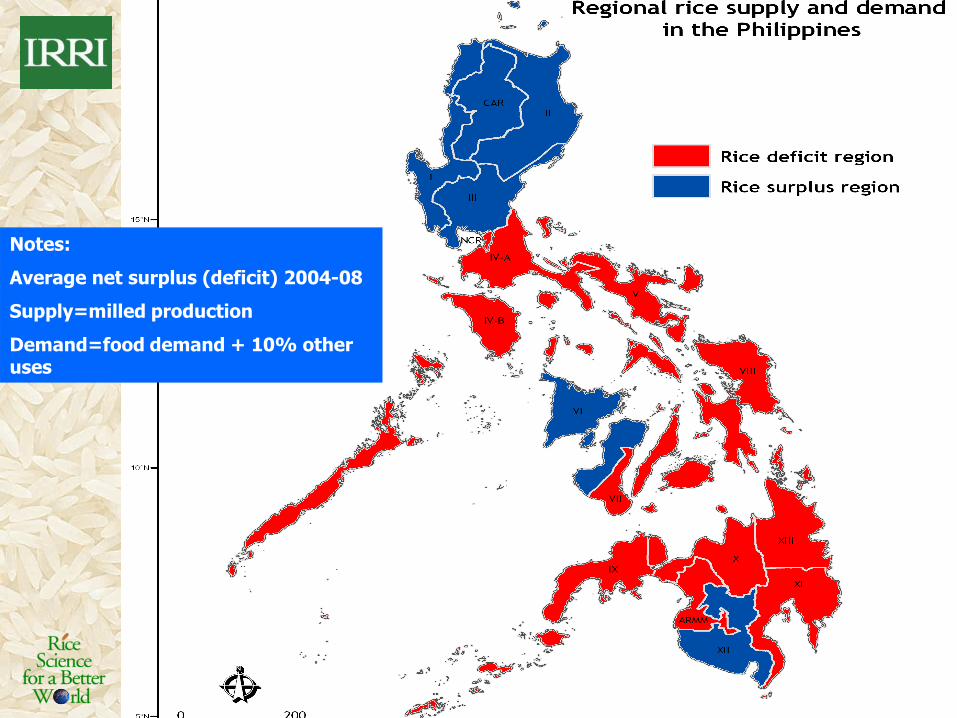
Notes:
Average net surplus (deficit) 2004-08
Supply=milled production
Demand=food demand + 10% other uses
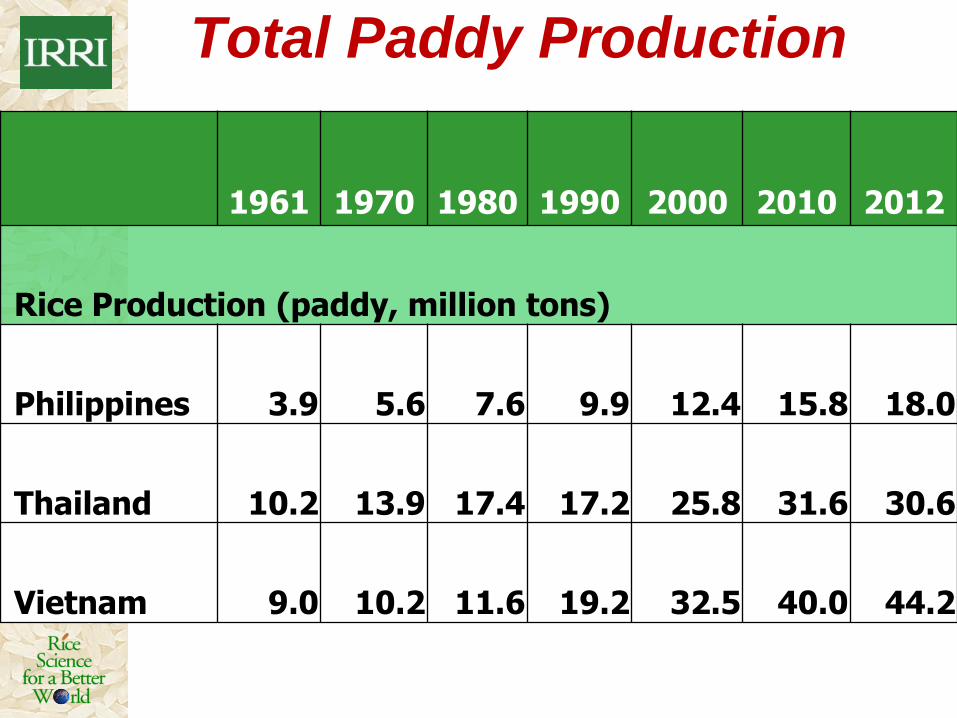
Total Paddy Production
1961 1970 1980 1990 2000 2010 2012
Rice Production (paddy, million tons)
Philippines 3.9 5.6 7.6 9.9 12.4 15.8 18.0
Thailand 10.2 13.9 17.4 17.2 25.8 31.6 30.6
Vietnam 9.0 10.2 11.6 19.2 32.5 40.0 44.2
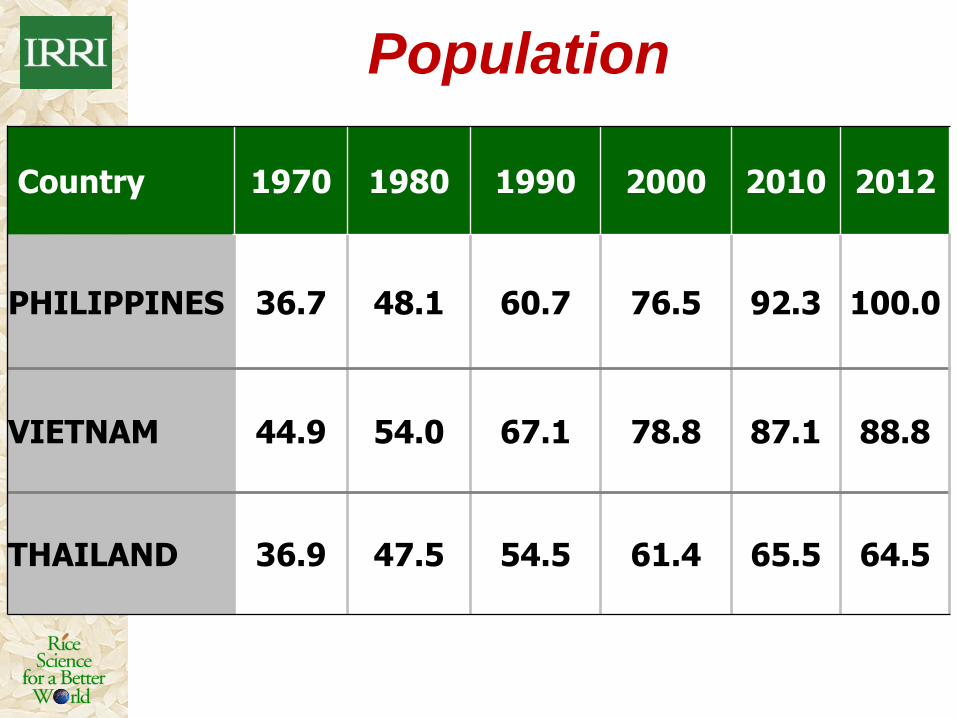
Population
Country 1970 1980 1990 2000 2010 2012
PHILIPPINES 36.7 48.1 60.7 76.5 92.3 100.0
VIETNAM 44.9 54.0 67.1 78.8 87.1 88.8
THAILAND 36.9 47.5 54.5 61.4 65.5 64.5
45
50
55
60
65
70
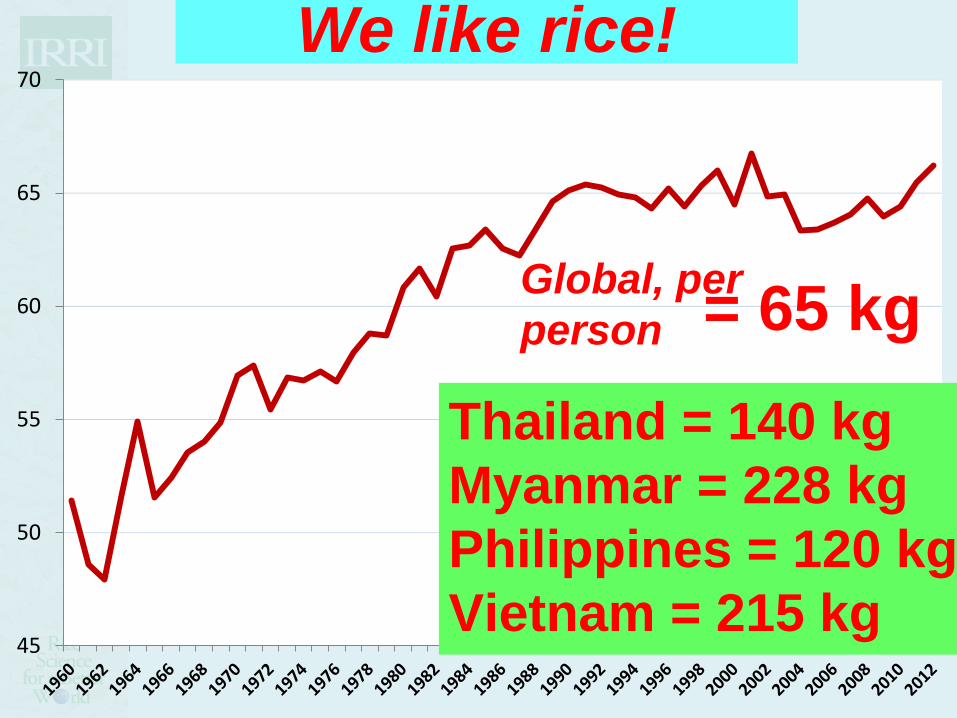
Consumption per capita in kg/person
Thailand = 140 kg
Myanmar = 228 kg
Philippines = 120 kg
Vietnam = 215 kg
We like rice!
Global, per
person = 65 kg
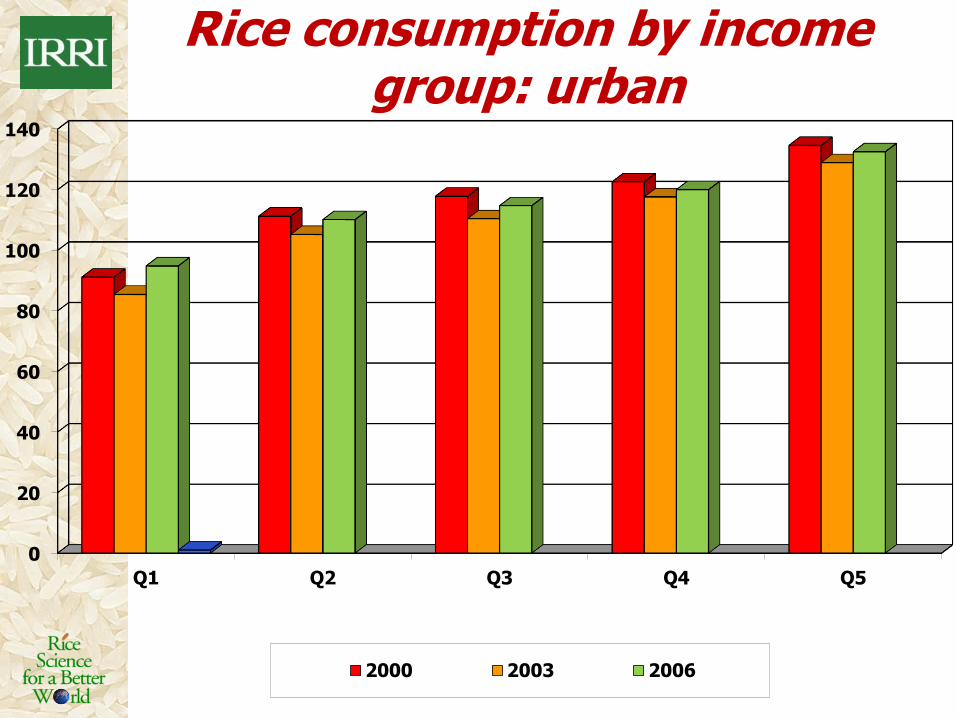
Rice consumption by income group: urban
0
20
40
60
80
100
120
140
Q1 Q2 Q3 Q4 Q5
2000 2003 2006
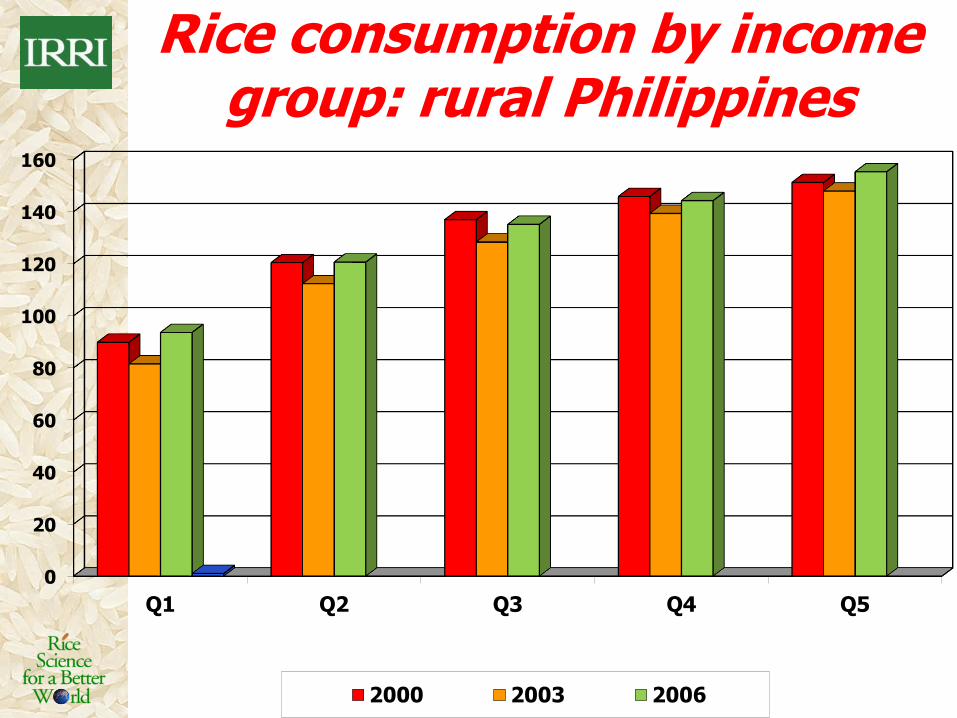
Rice consumption by income group: rural Philippines
0
20
40
60
80
100
120
140
160
Q1 Q2 Q3 Q4 Q5
2000 2003 2006
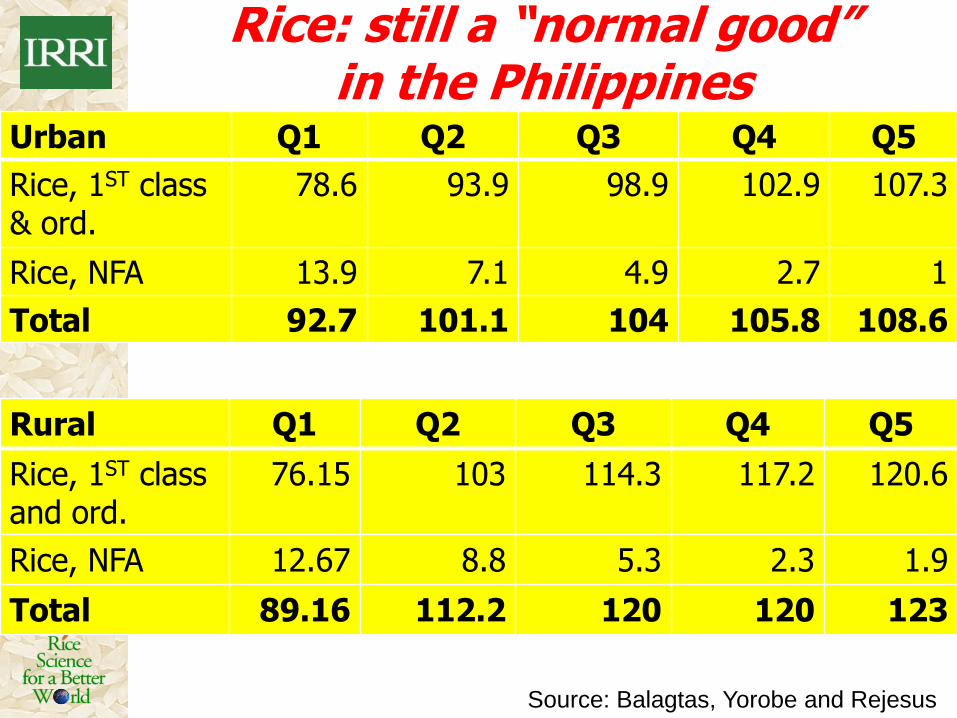
Rice: still a “normal good” in the Philippines
Urban Q1 Q2 Q3 Q4 Q5
Rice, 1ST class & ord.
78.6 93.9 98.9 102.9 107.3
Rice, NFA 13.9 7.1 4.9 2.7 1
Total 92.7 101.1 104 105.8 108.6
Rural Q1 Q2 Q3 Q4 Q5
Rice, 1ST class and ord.
76.15 103 114.3 117.2 120.6
Rice, NFA 12.67 8.8 5.3 2.3 1.9
Total 89.16 112.2 120 120 123
Source: Balagtas, Yorobe and Rejesus
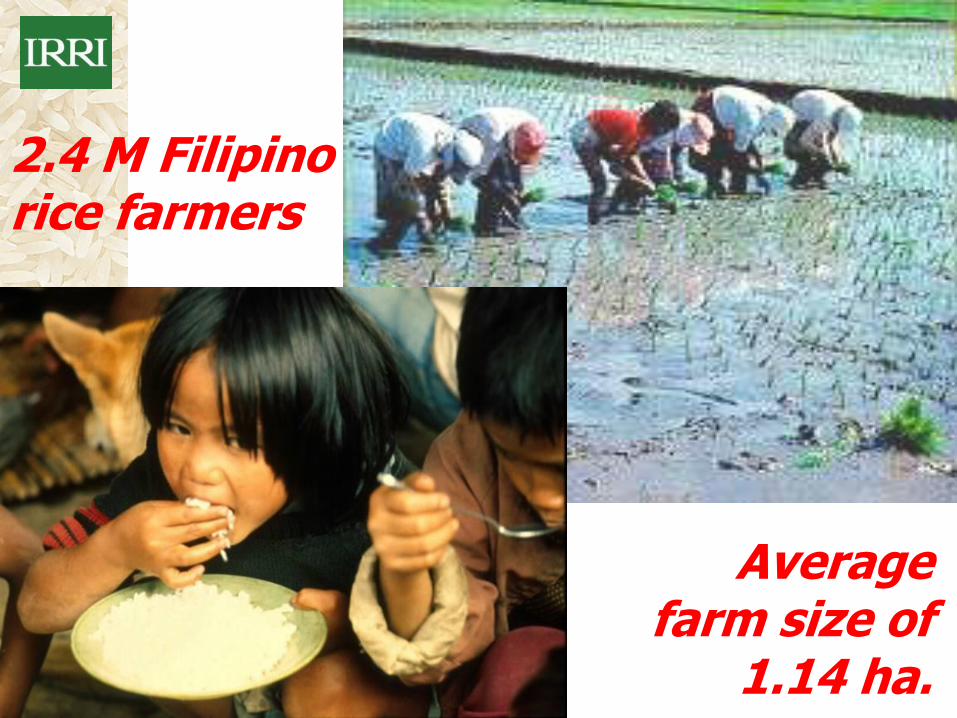
2.4 M Filipino rice farmers
Average farm size of
1.14 ha.
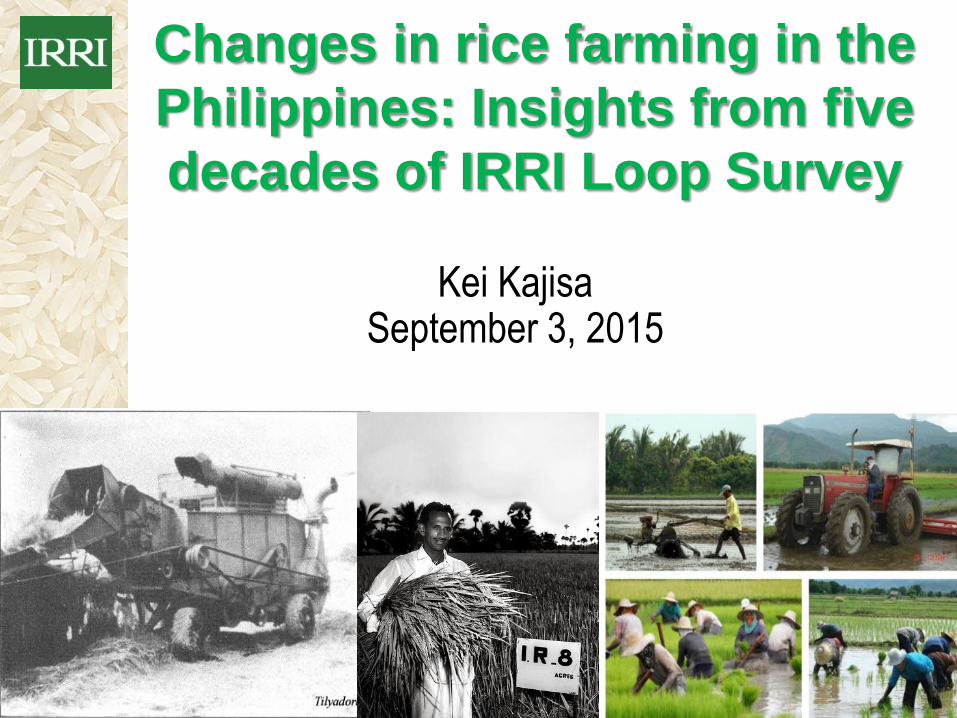
Changes in rice farming in the
Philippines: Insights from five
decades of IRRI Loop Survey
Kei Kajisa September 3, 2015
IRRI Loop Survey
•Initiated in 1966, every 4-5 years until 2011-12, 23 rounds;
•Detailed records on rice production in both wet and dry seasons.
•The world’s longest survey series of rice farming and rice farm families.
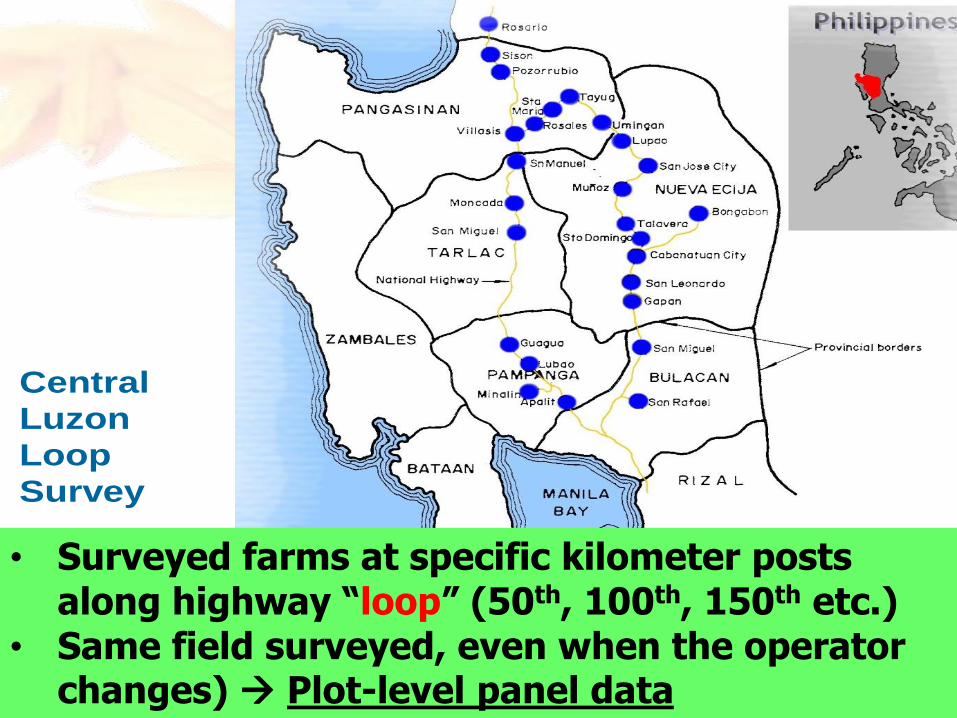
Central
Luzon
Loop
Survey
• Surveyed farms at specific kilometer posts along highway “loop” (50th, 100th, 150th etc.)
• Same field surveyed, even when the operator changes) Plot-level panel data
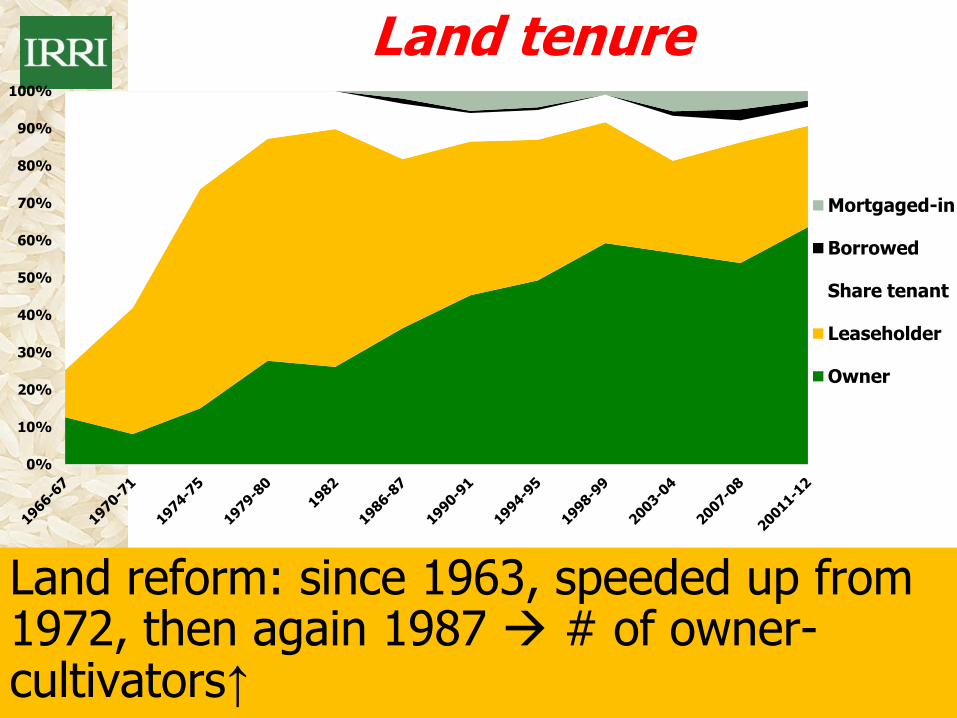
Land reform: since 1963, speeded up from 1972, then again 1987 # of owner-cultivators↑
0%
10%
20%
30%
40%
50%
60%
70%
80%
90%
100%
Land tenure
Mortgaged-in
Borrowed
Share tenant
Leaseholder
Owner
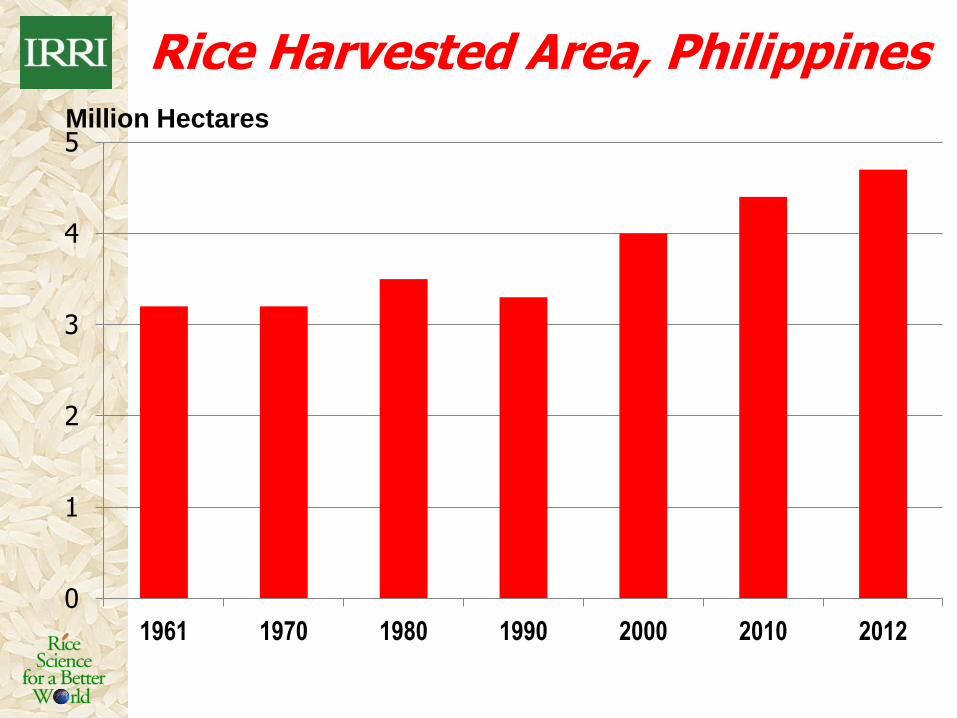
Rice Harvested Area, Philippines
0
1
2
3
4
5
1961 1970 1980 1990 2000 2010 2012
Million Hectares
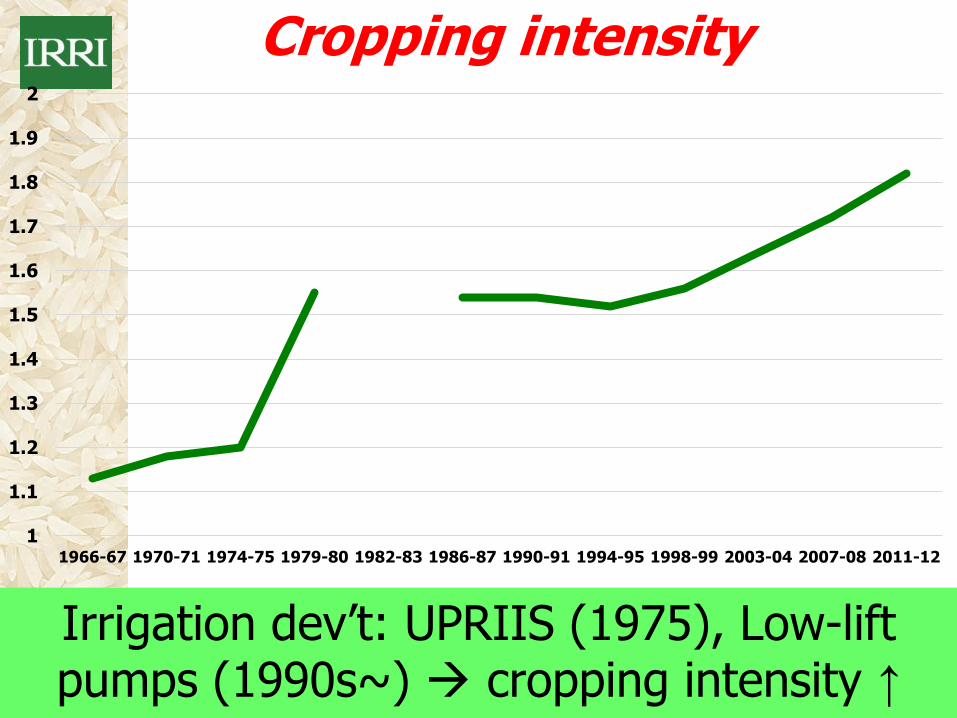
Irrigation dev’t: UPRIIS (1975), Low-lift pumps (1990s~) cropping intensity ↑
1
1.1
1.2
1.3
1.4
1.5
1.6
1.7
1.8
1.9
2
1966-67 1970-71 1974-75 1979-80 1982-83 1986-87 1990-91 1994-95 1998-99 2003-04 2007-08 2011-12
Cropping intensity
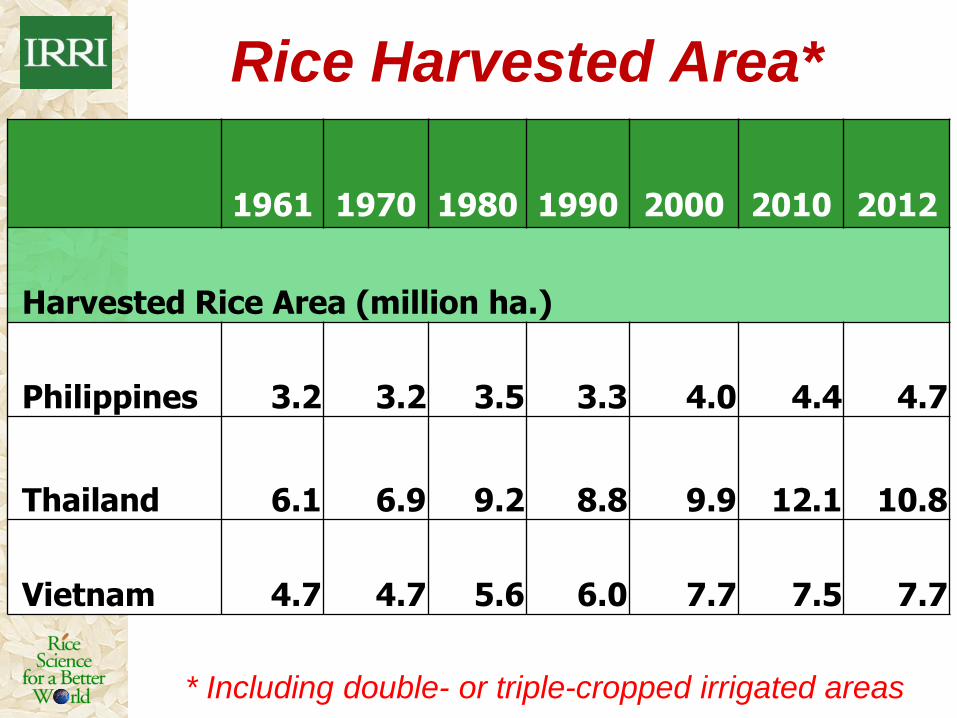
Rice Harvested Area*
1961 1970 1980 1990 2000 2010 2012
Harvested Rice Area (million ha.)
Philippines 3.2 3.2 3.5 3.3 4.0 4.4 4.7
Thailand 6.1 6.9 9.2 8.8 9.9 12.1 10.8
Vietnam 4.7 4.7 5.6 6.0 7.7 7.5 7.7
* Including double- or triple-cropped irrigated areas
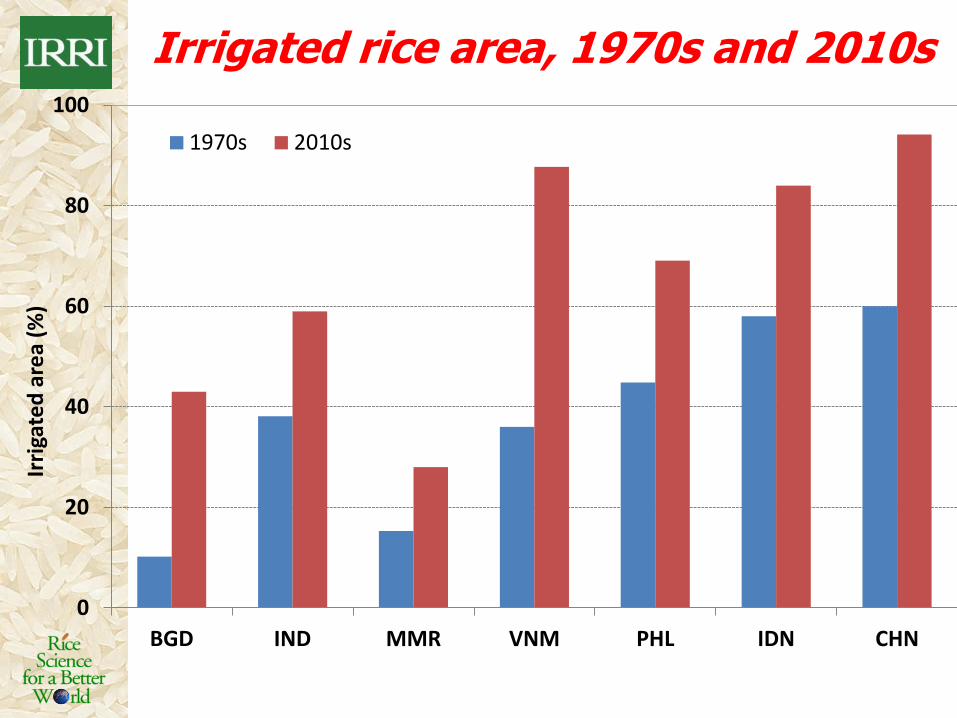
Irrigated rice area, 1970s and 2010s
0
20
40
60
80
100
BGD IND MMR VNM PHL IDN CHN
Irri
gate
d a
rea
(%)
1970s 2010s
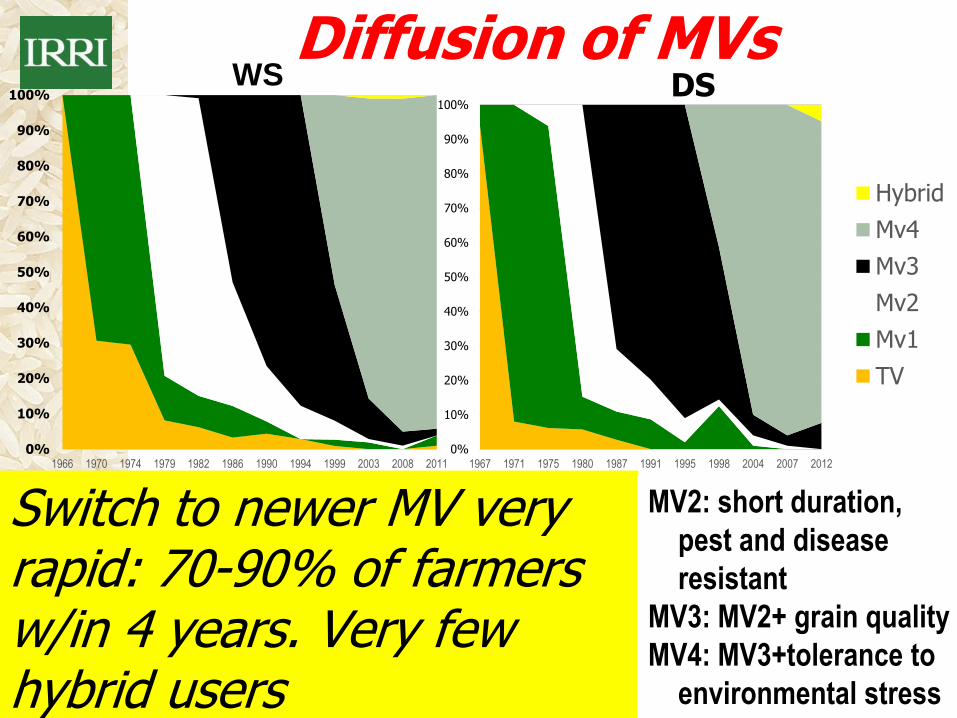
Diffusion of MVs
Switch to newer MV very rapid: 70-90% of farmers w/in 4 years. Very few hybrid users
0%
10%
20%
30%
40%
50%
60%
70%
80%
90%
100%
1966 1970 1974 1979 1982 1986 1990 1994 1999 2003 2008 2011
WS
0%
10%
20%
30%
40%
50%
60%
70%
80%
90%
100%
1967 1971 1975 1980 1987 1991 1995 1998 2004 2007 2012
DS
Hybrid
Mv4
Mv3
Mv2
Mv1
TV
MV2: short duration,
pest and disease
resistant
MV3: MV2+ grain quality
MV4: MV3+tolerance to
environmental stress
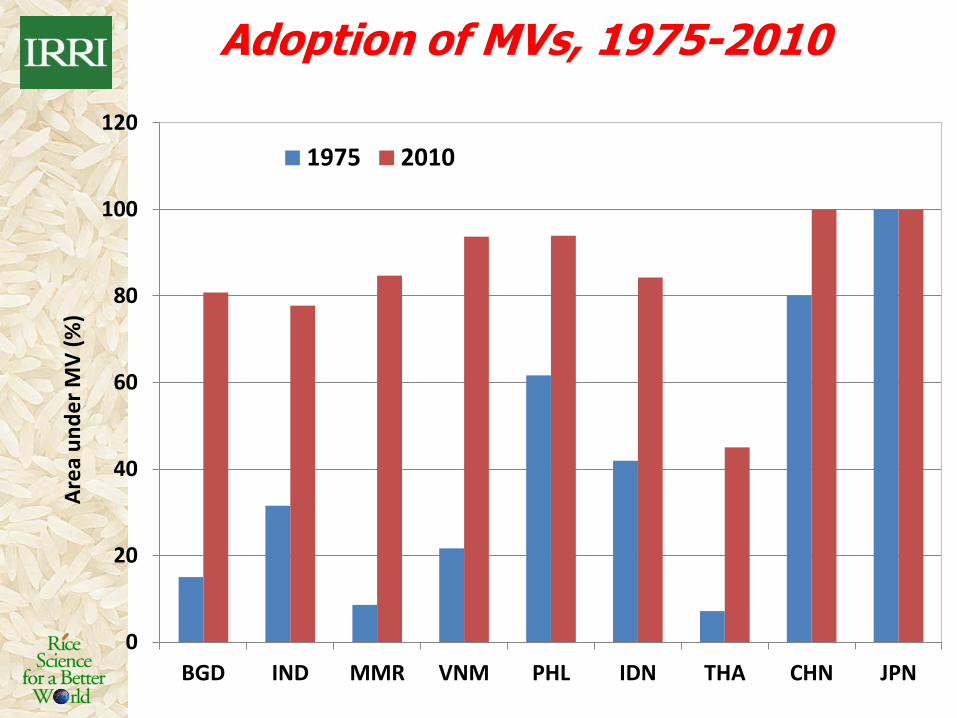
Adoption of MVs, 1975-2010
0
20
40
60
80
100
120
BGD IND MMR VNM PHL IDN THA CHN JPN
Are
a u
nd
er
MV
(%
)
1975 2010
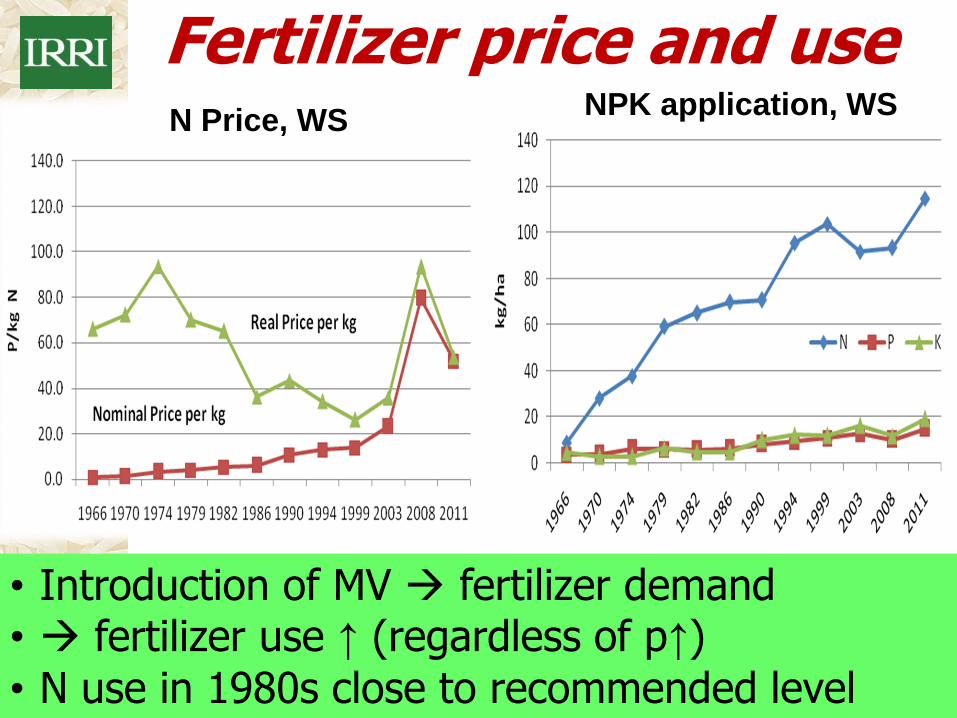
Fertilizer price and use
• Introduction of MV fertilizer demand • fertilizer use ↑ (regardless of p↑)
• N use in 1980s close to recommended level
N Price, WS NPK application, WS
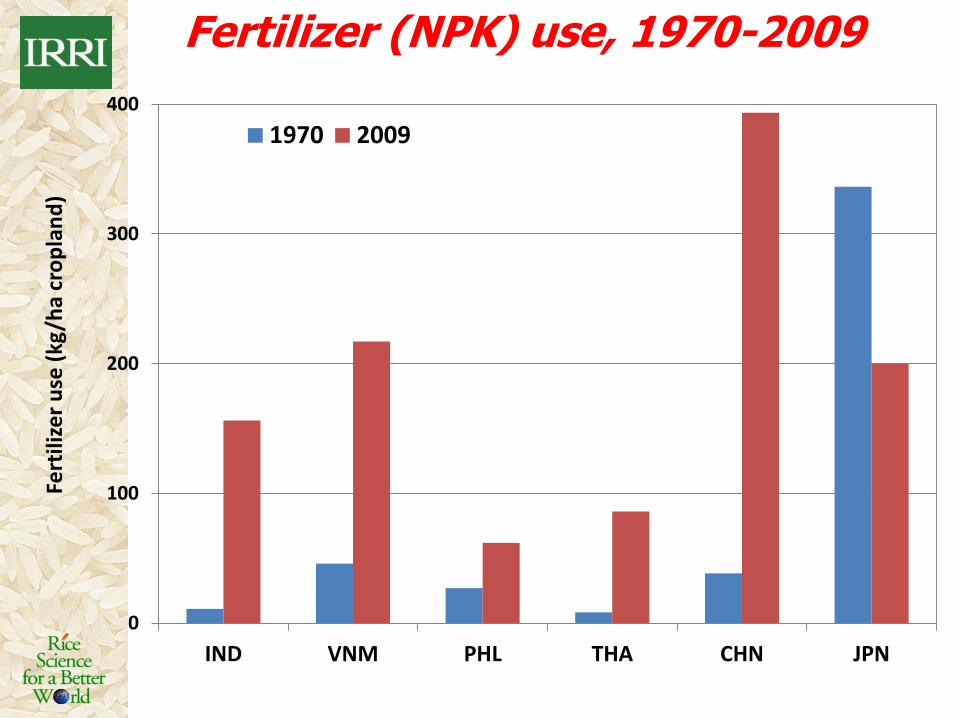
Fertilizer (NPK) use, 1970-2009
0
100
200
300
400
IND VNM PHL THA CHN JPN
Fert
ilize
r u
se (
kg/h
a cr
op
lan
d)
1970 2009
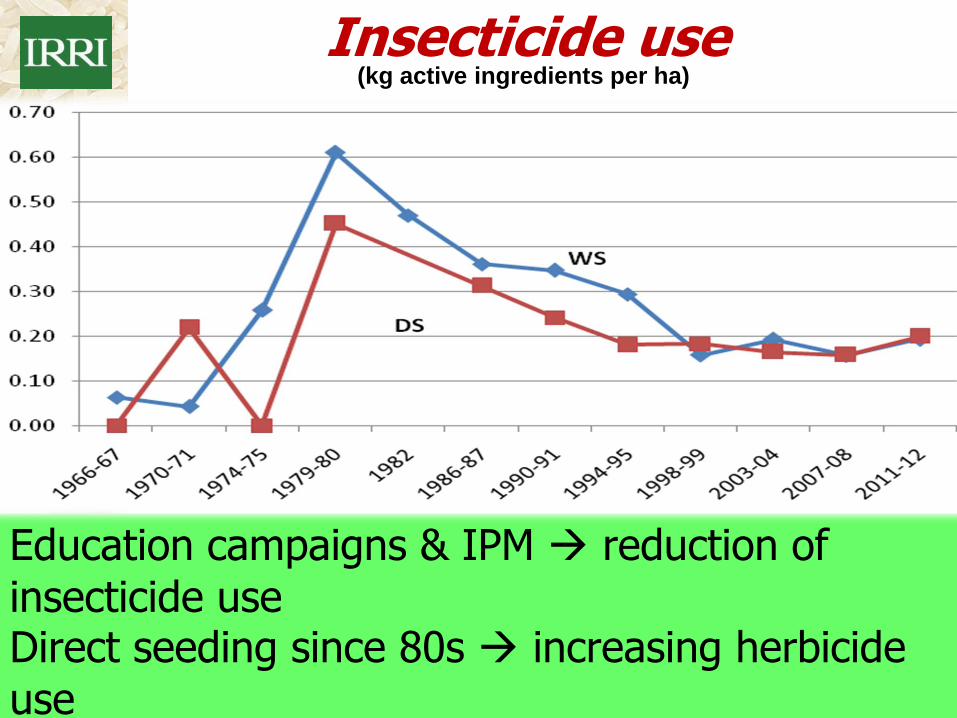
Insecticide use
Education campaigns & IPM reduction of
insecticide use Direct seeding since 80s increasing herbicide
use
(kg active ingredients per ha)
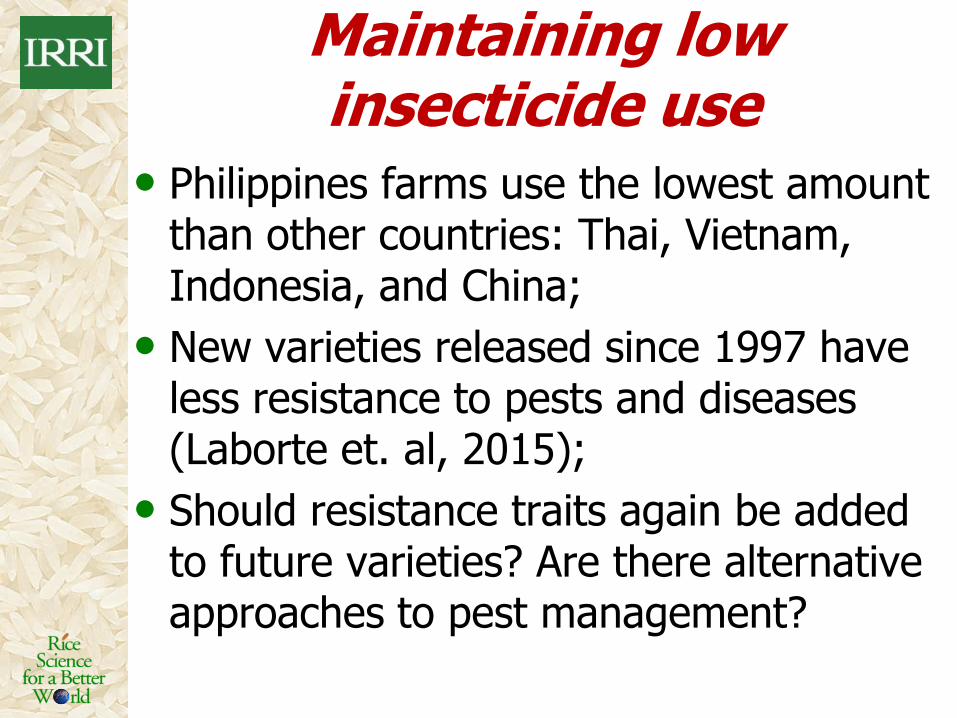
Maintaining low insecticide use
• Philippines farms use the lowest amount than other countries: Thai, Vietnam, Indonesia, and China;
• New varieties released since 1997 have less resistance to pests and diseases (Laborte et. al, 2015);
• Should resistance traits again be added to future varieties? Are there alternative approaches to pest management?
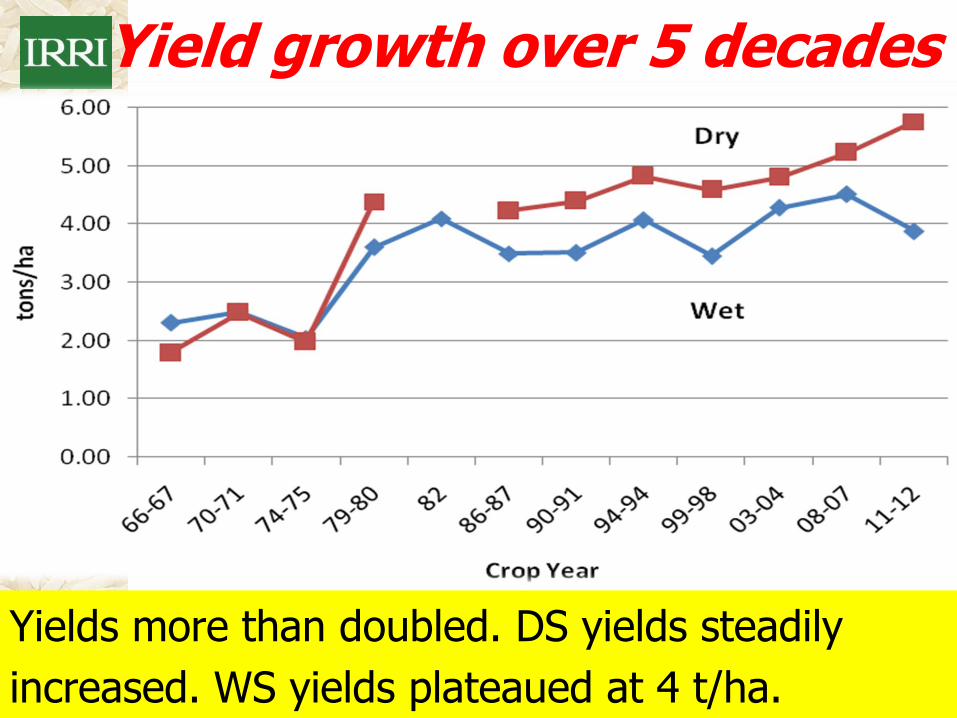
Yield growth over 5 decades
Yields more than doubled. DS yields steadily
increased. WS yields plateaued at 4 t/ha.
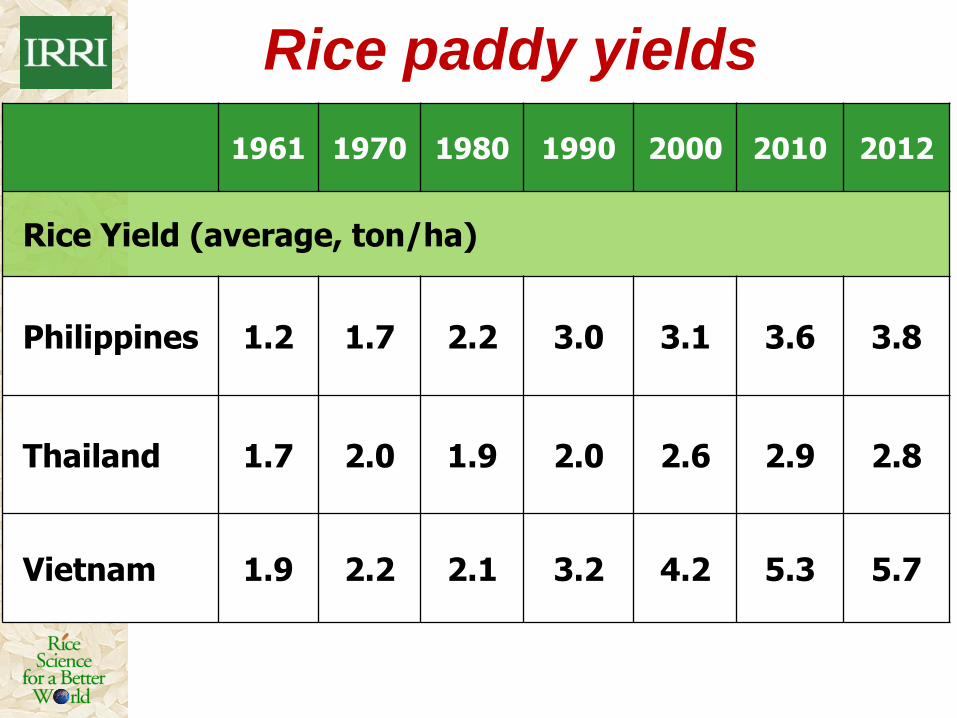
Rice paddy yields
1961 1970 1980 1990 2000 2010 2012
Rice Yield (average, ton/ha)
Philippines 1.2 1.7 2.2 3.0 3.1 3.6 3.8
Thailand 1.7 2.0 1.9 2.0 2.6 2.9 2.8
Vietnam 1.9 2.2 2.1 3.2 4.2 5.3 5.7
1
1.5
2
2.5
3
3.5
4
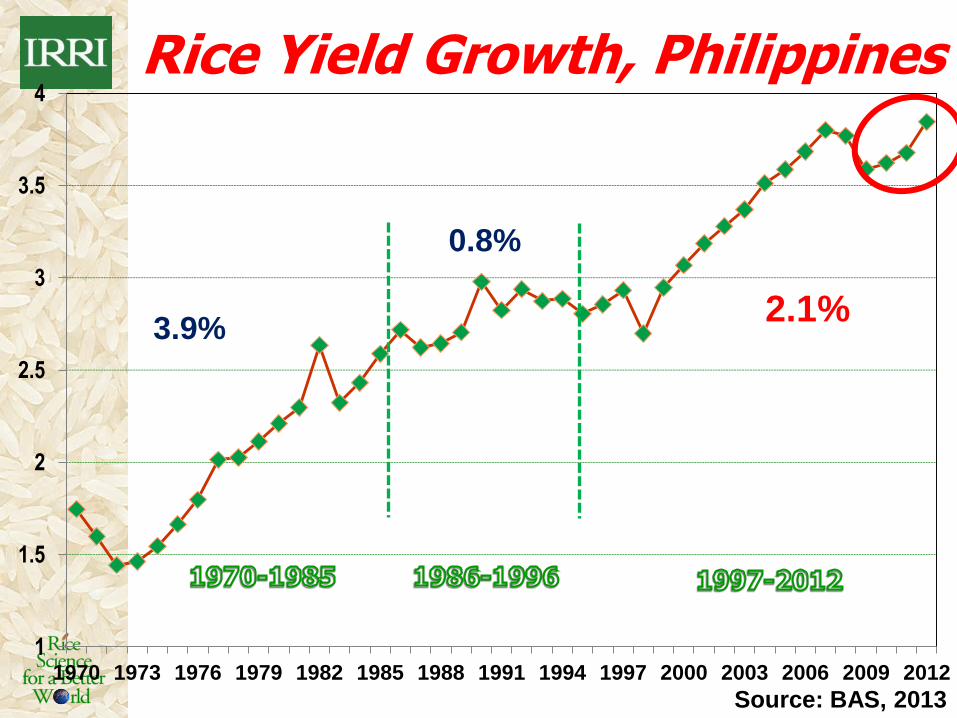
1970 1973 1976 1979 1982 1985 1988 1991 1994 1997 2000 2003 2006 2009 2012
3.9% 2.1%
0.8%
Source: BAS, 2013
Rice Yield Growth, Philippines
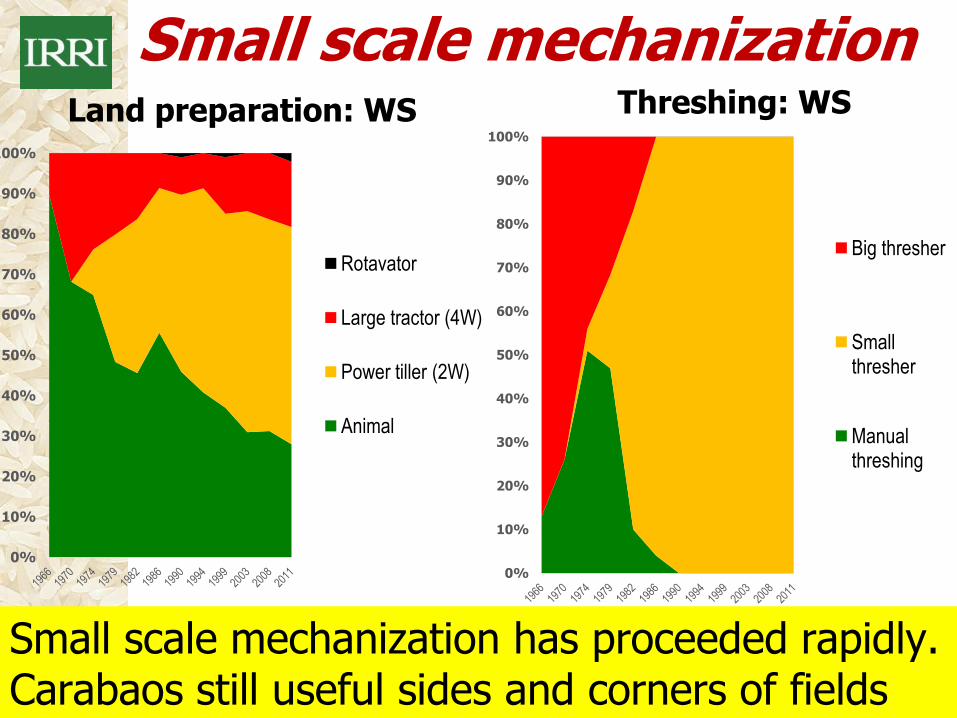
Small scale mechanization
Small scale mechanization has proceeded rapidly. Carabaos still useful sides and corners of fields
0%
10%
20%
30%
40%
50%
60%
70%
80%
90%
100%
Land preparation: WS
Rotavator
Large tractor (4W)
Power tiller (2W)
Animal
0%
10%
20%
30%
40%
50%
60%
70%
80%
90%
100%
Threshing: WS
Big thresher
Small thresher
Manual threshing
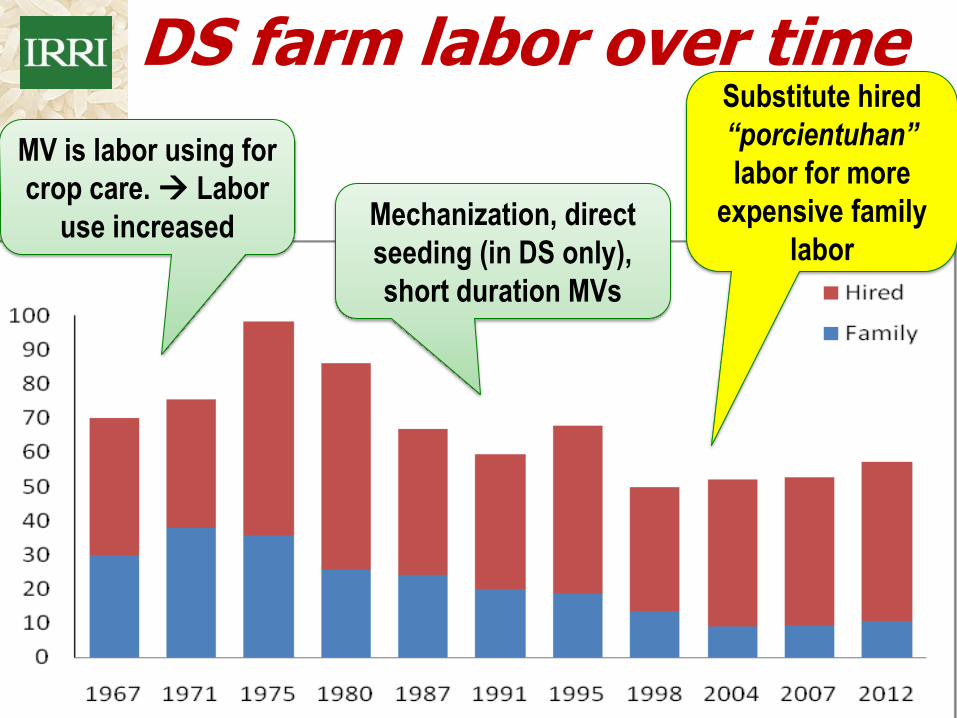
DS farm labor over time
MV is labor using for
crop care. Labor
use increased Mechanization, direct
seeding (in DS only),
short duration MVs
Substitute hired
“porcientuhan”
labor for more
expensive family
labor
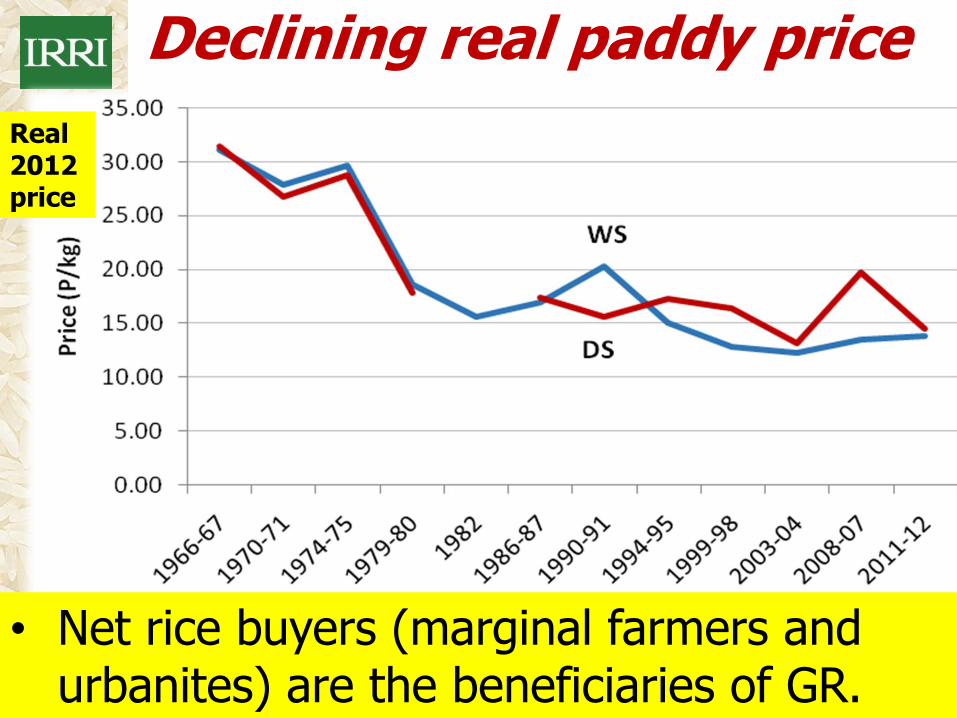
Declining real paddy price
• Net rice buyers (marginal farmers and urbanites) are the beneficiaries of GR.
Real 2012 price
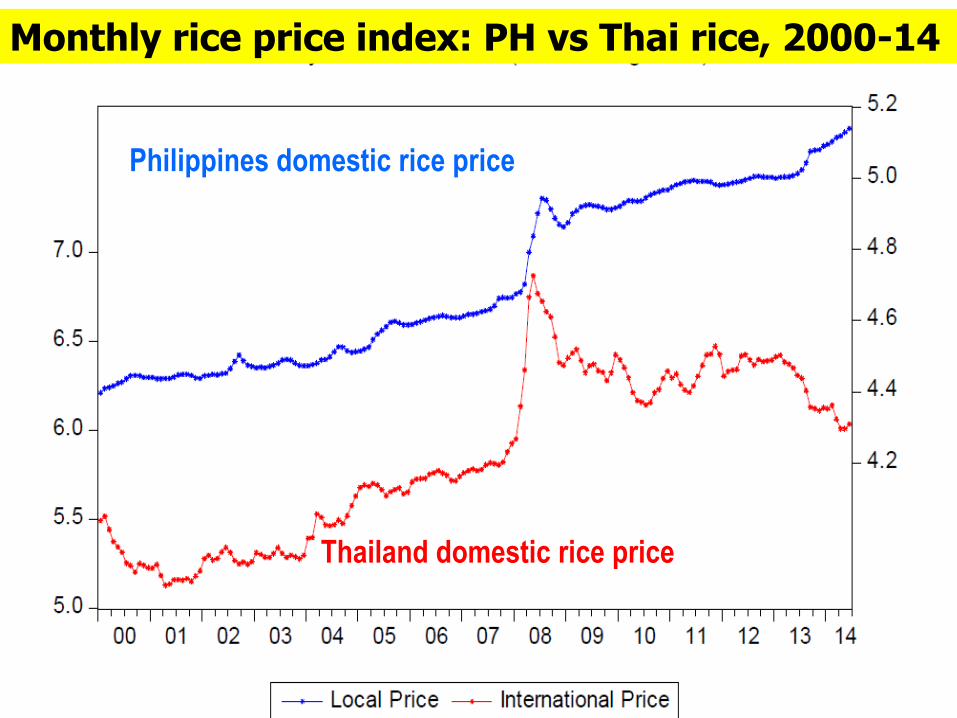
SWS
Philippines domestic rice price
Thailand domestic rice price
Monthly rice price index: PH vs Thai rice, 2000-14
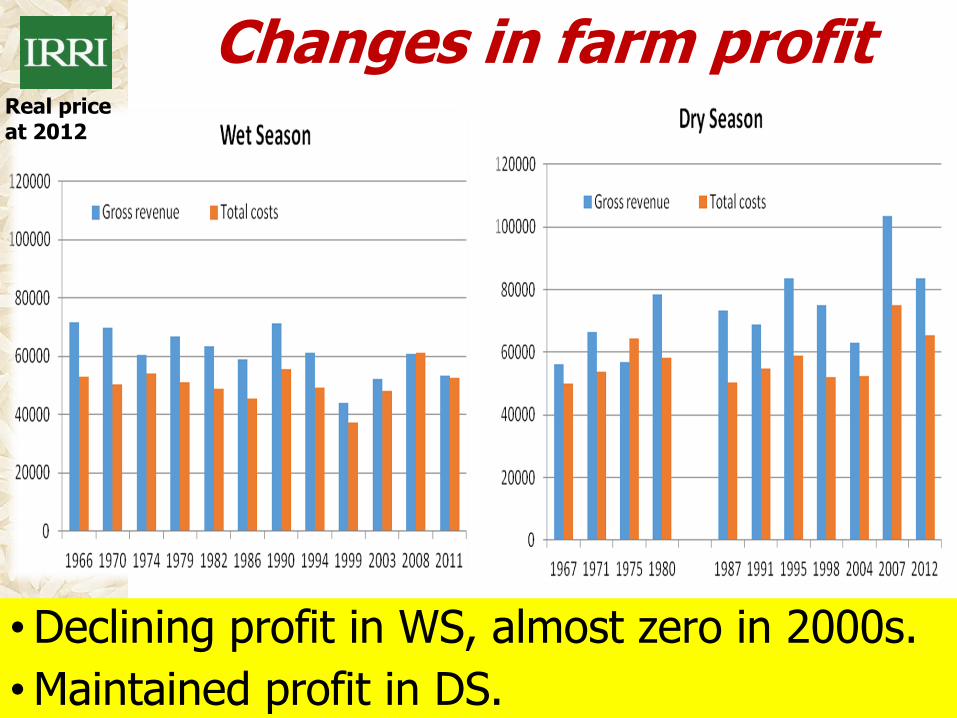
Changes in farm profit
•Declining profit in WS, almost zero in 2000s.
•Maintained profit in DS.
Real price at 2012
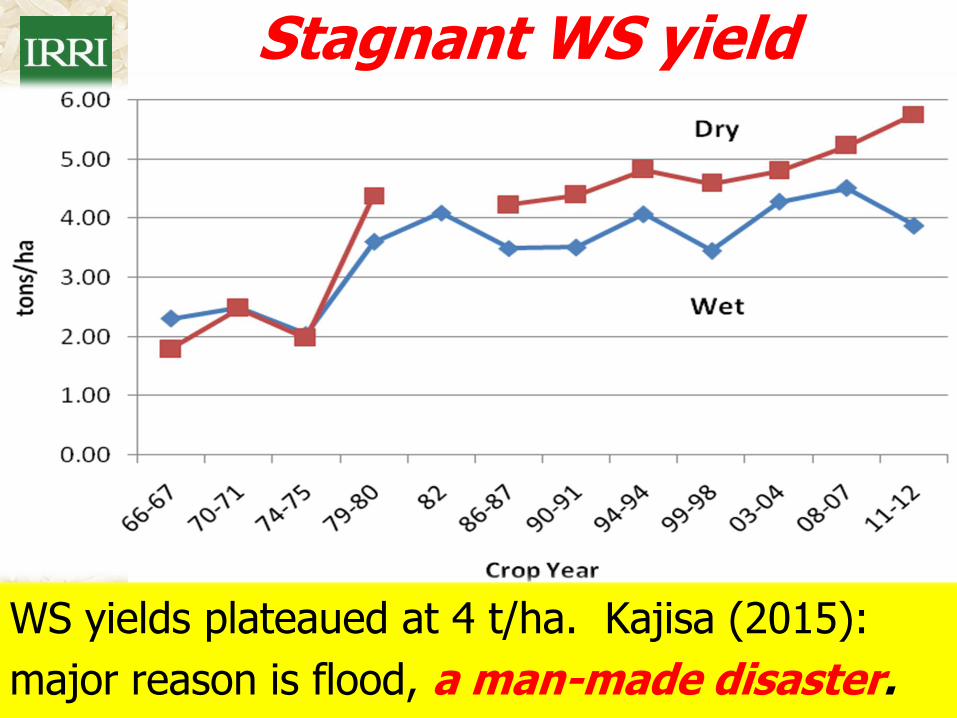
Stagnant WS yield
WS yields plateaued at 4 t/ha. Kajisa (2015):
major reason is flood, a man-made disaster.
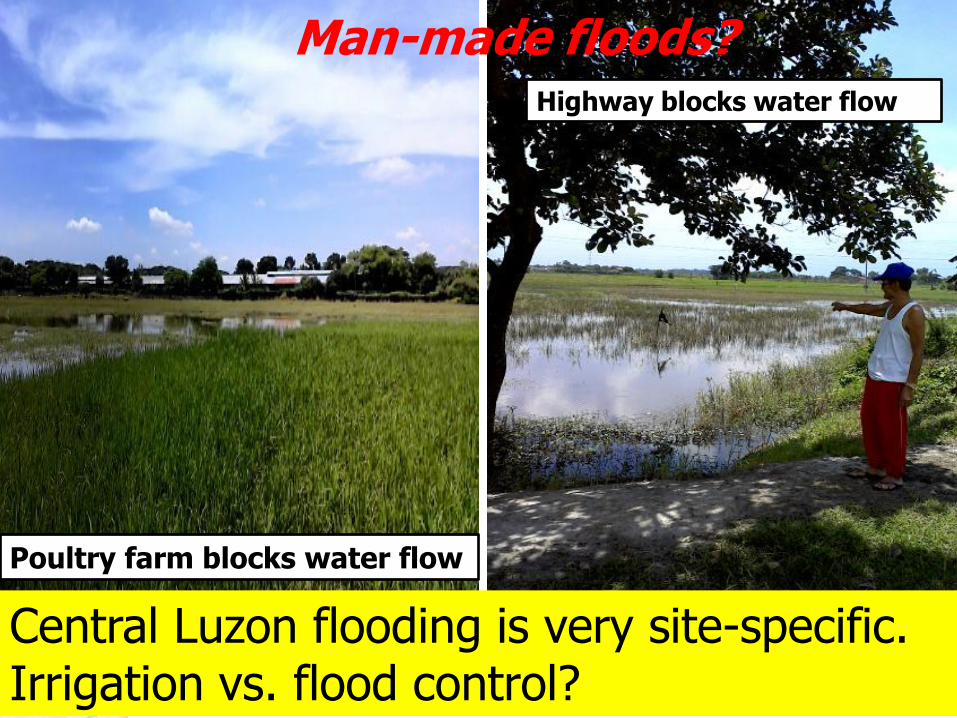
Poultry farm blocks water flow
Highway blocks water flow
Man-made floods?
Central Luzon flooding is very site-specific. Irrigation vs. flood control?
Reducing losses due to floods
WS flooding is worsening:
•A man-made disaster? Flooded areas in patches, seriousness varies by location.
•What is best approach? Breeding or engineering?
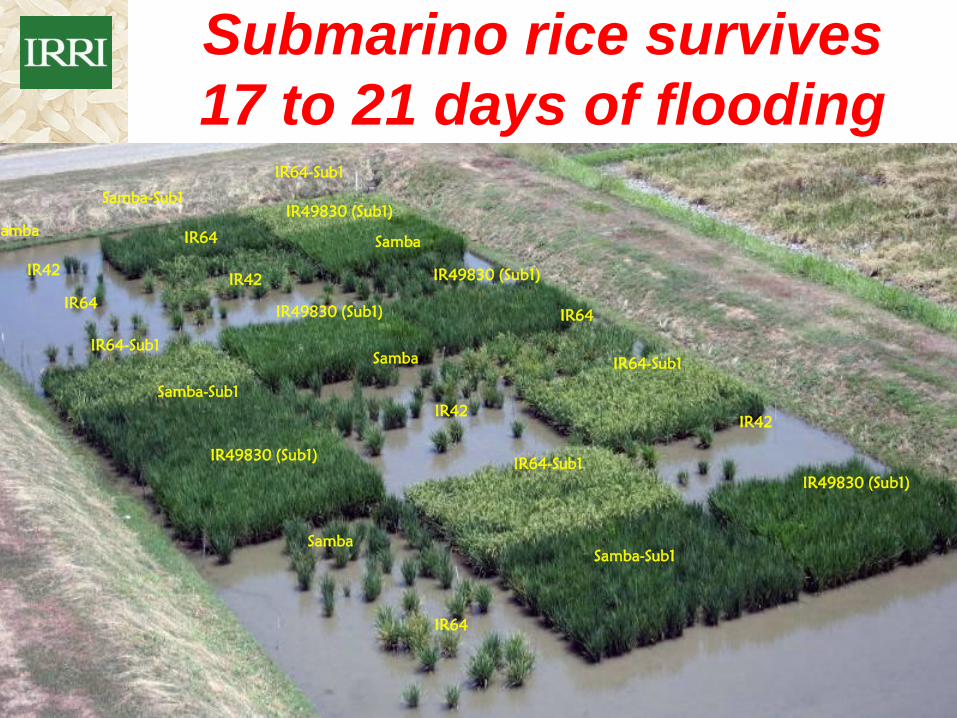
Submarino rice survives
17 to 21 days of flooding
Samba-Sub1
Samba
Samba-Sub1
IR64-Sub1
IR49830 (Sub1)
IR64
IR42
IR64
IR64-Sub1
Samba-Sub1
IR49830 (Sub1)
Samba
IR64
IR64-Sub1
IR49830 (Sub1)
IR42
IR64-Sub1
IR64
IR49830 (Sub1)
IR49830 (Sub1)
IR42
Samba
IR42
Samba
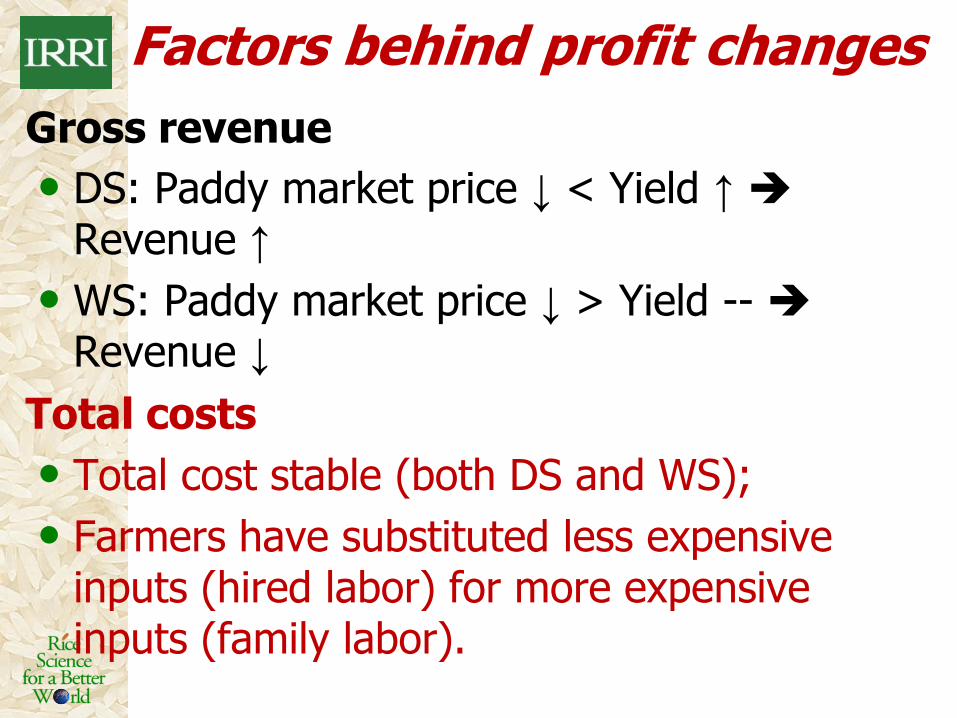
Factors behind profit changes
Gross revenue
• DS: Paddy market price ↓ < Yield ↑ Revenue ↑
• WS: Paddy market price ↓ > Yield -- Revenue ↓
Total costs
• Total cost stable (both DS and WS);
• Farmers have substituted less expensive inputs (hired labor) for more expensive inputs (family labor).
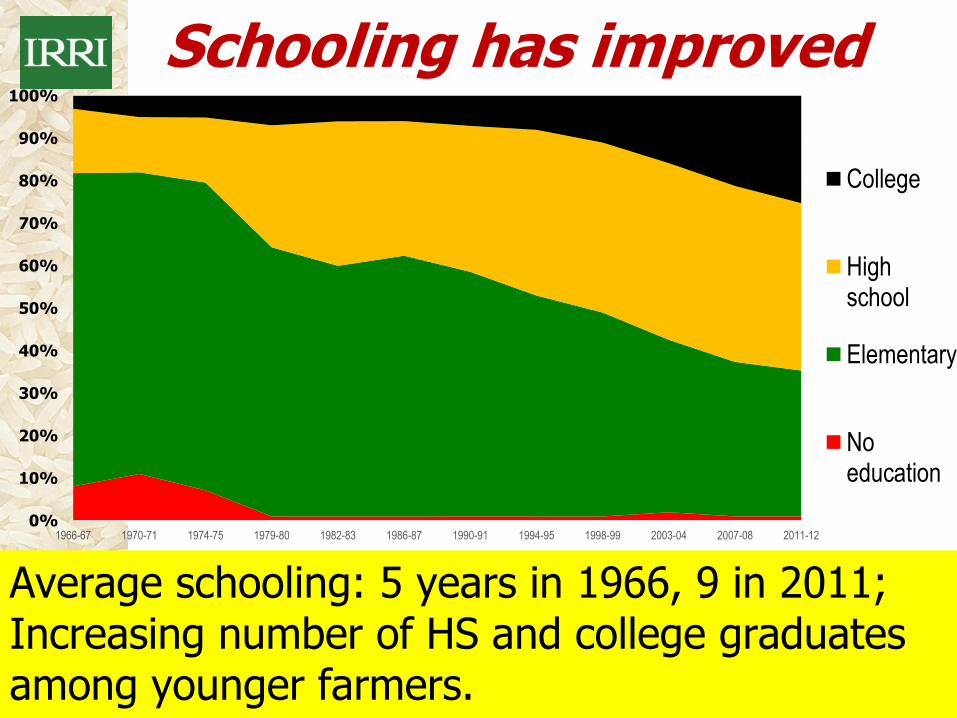
Schooling has improved
Average schooling: 5 years in 1966, 9 in 2011; Increasing number of HS and college graduates among younger farmers.
0%
10%
20%
30%
40%
50%
60%
70%
80%
90%
100%
1966-67 1970-71 1974-75 1979-80 1982-83 1986-87 1990-91 1994-95 1998-99 2003-04 2007-08 2011-12
College
High school
Elementary
No education
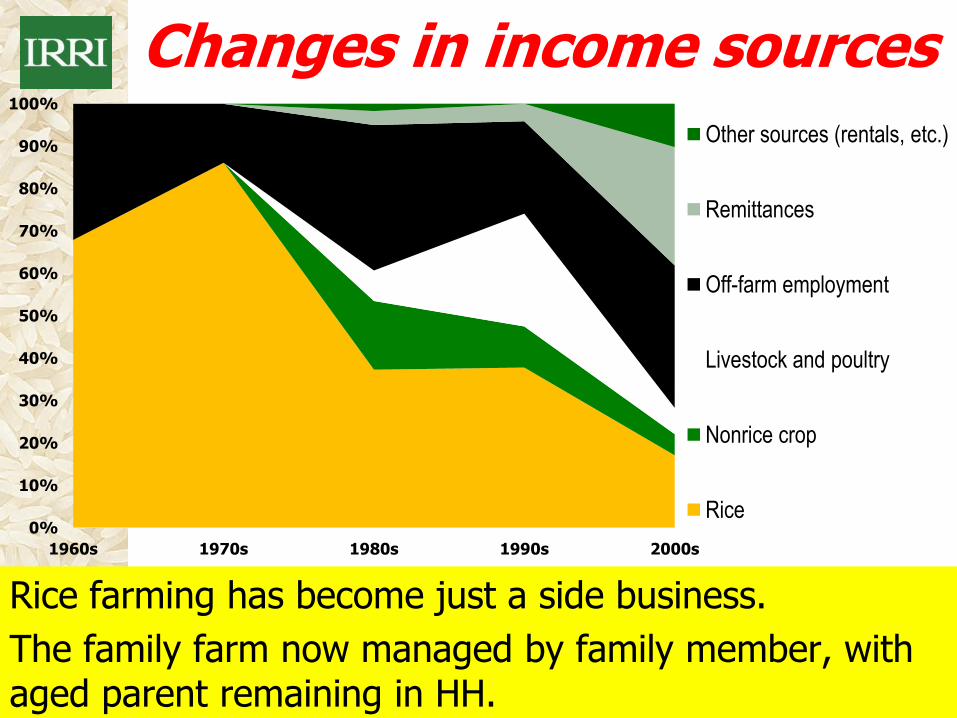
Changes in income sources
Rice farming has become just a side business.
The family farm now managed by family member, with aged parent remaining in HH.
0%
10%
20%
30%
40%
50%
60%
70%
80%
90%
100%
1960s 1970s 1980s 1990s 2000s
Other sources (rentals, etc.)
Remittances
Off-farm employment
Livestock and poultry
Nonrice crop
Rice
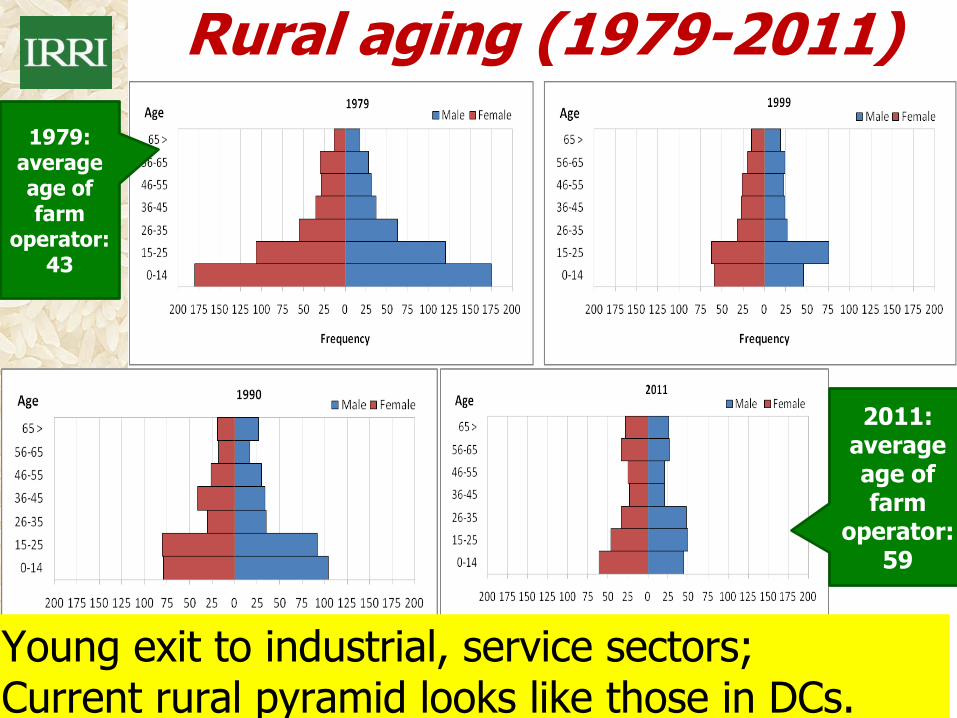
Rural aging (1979-2011)
1979: average age of farm
operator: 43
Young exit to industrial, service sectors; Current rural pyramid looks like those in DCs.
2011: average age of farm
operator: 59
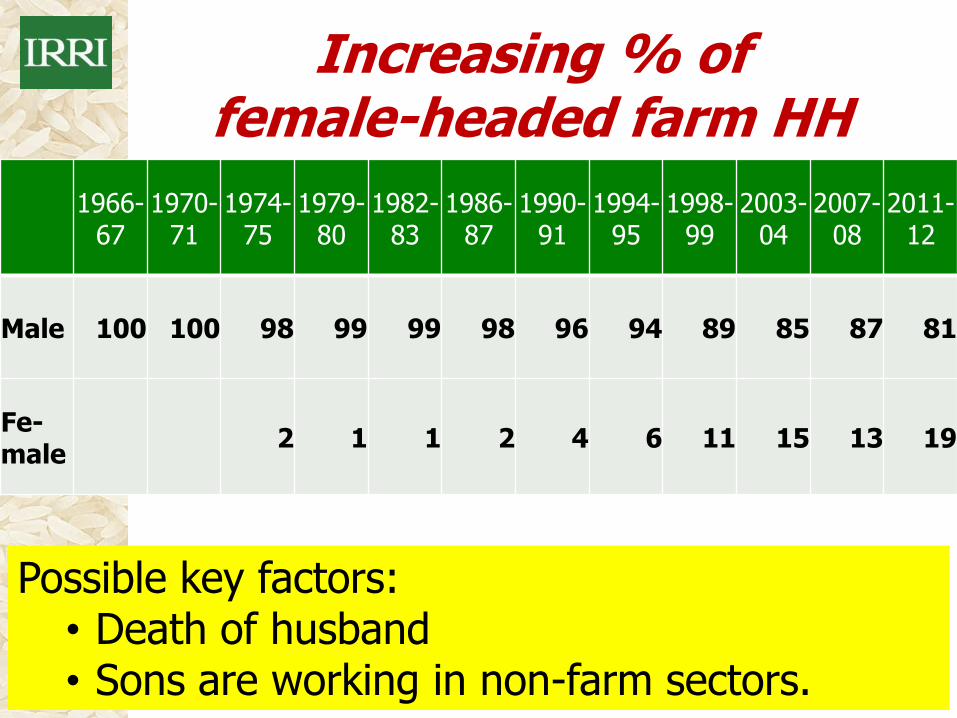
Increasing % of female-headed farm HH
1966-
67 1970-
71 1974-
75 1979-
80 1982-
83 1986-
87 1990-
91 1994-
95 1998-
99 2003-
04 2007-
08 2011-
12
Male 100 100 98 99 99 98 96 94 89 85 87 81
Fe-male
2 1 1 2 4 6 11 15 13 19
Possible key factors: • Death of husband • Sons are working in non-farm sectors.
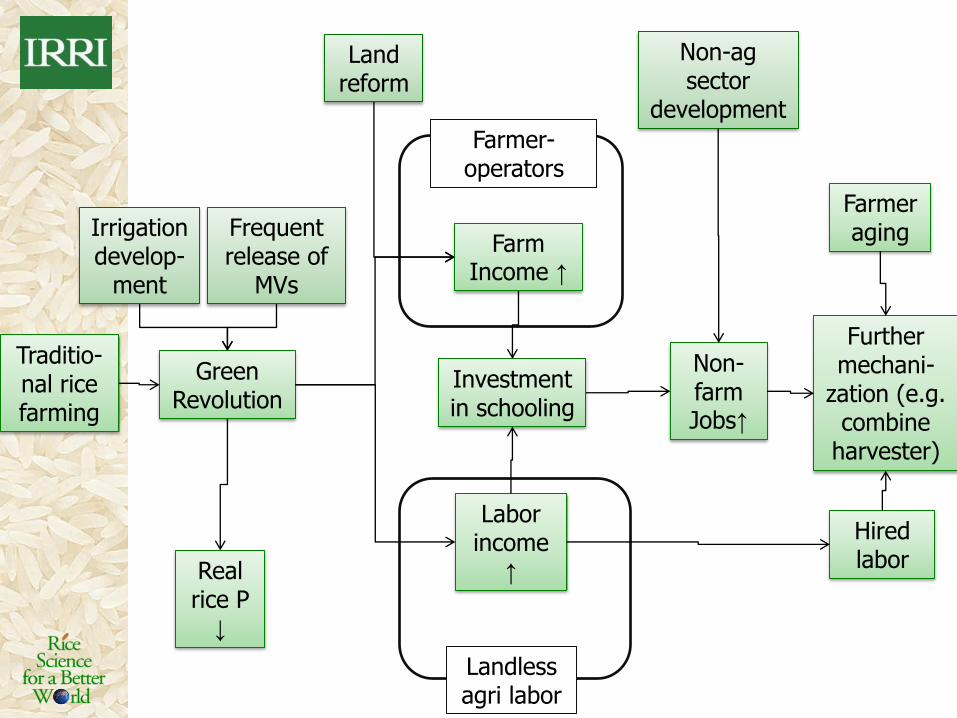
Traditio-nal rice farming
Green Revolution
Irrigation develop-
ment
Farm Income ↑
Investment in schooling
Non-farm Jobs↑
Farmer aging
Hired labor
Further mechani-
zation (e.g. combine
harvester)
Land reform
Non-ag sector
development
Frequent release of
MVs
Farmer-operators
Landless agri labor
Labor income
↑ Real rice P
↓
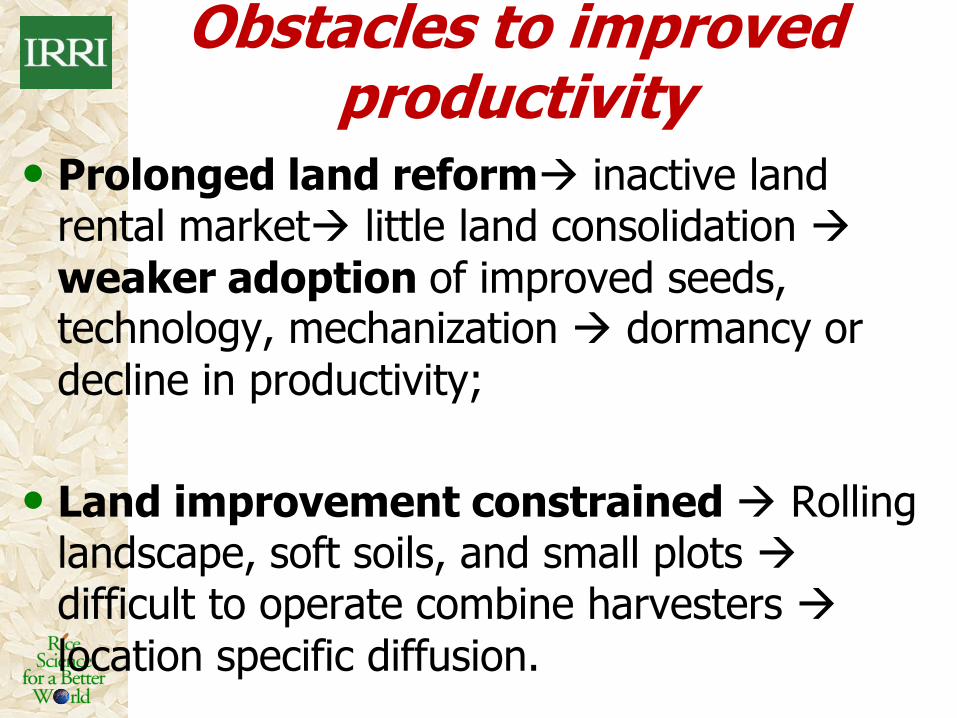
Obstacles to improved productivity
• Prolonged land reform inactive land rental market little land consolidation
weaker adoption of improved seeds, technology, mechanization dormancy or
decline in productivity;
• Land improvement constrained Rolling landscape, soft soils, and small plots difficult to operate combine harvesters
location specific diffusion.
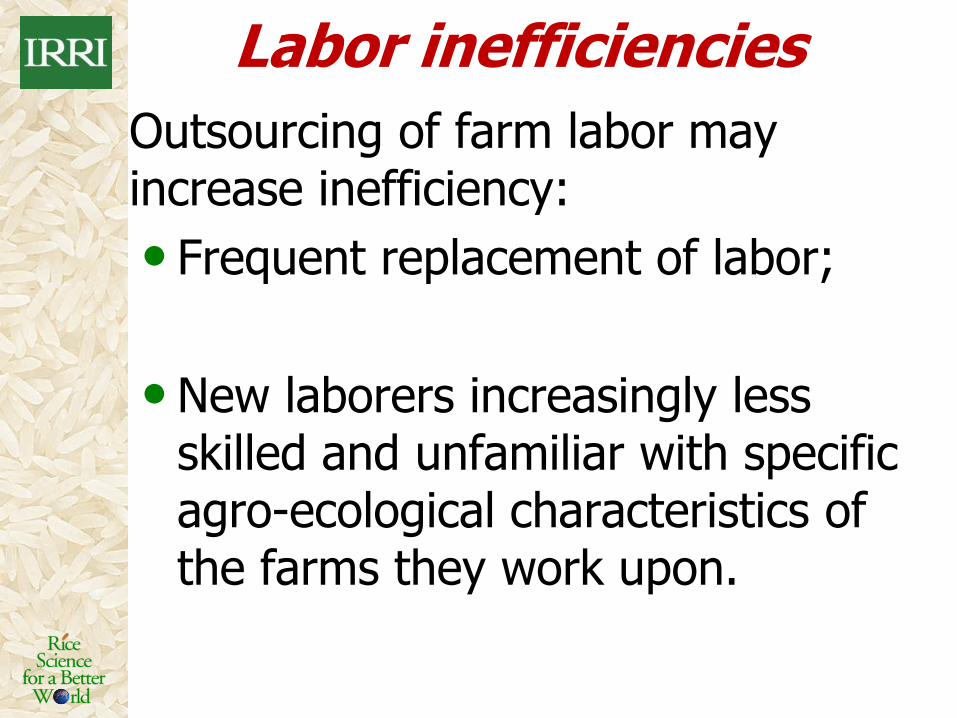
Labor inefficiencies
Outsourcing of farm labor may increase inefficiency:
• Frequent replacement of labor;
• New laborers increasingly less skilled and unfamiliar with specific agro-ecological characteristics of the farms they work upon.
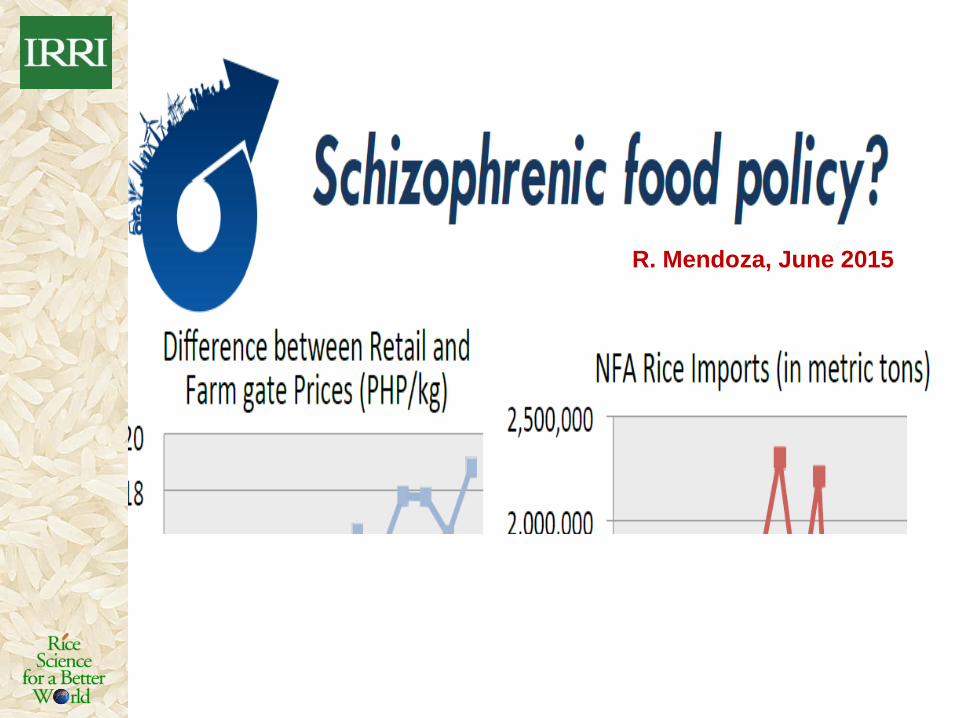
R. Mendoza, June 2015
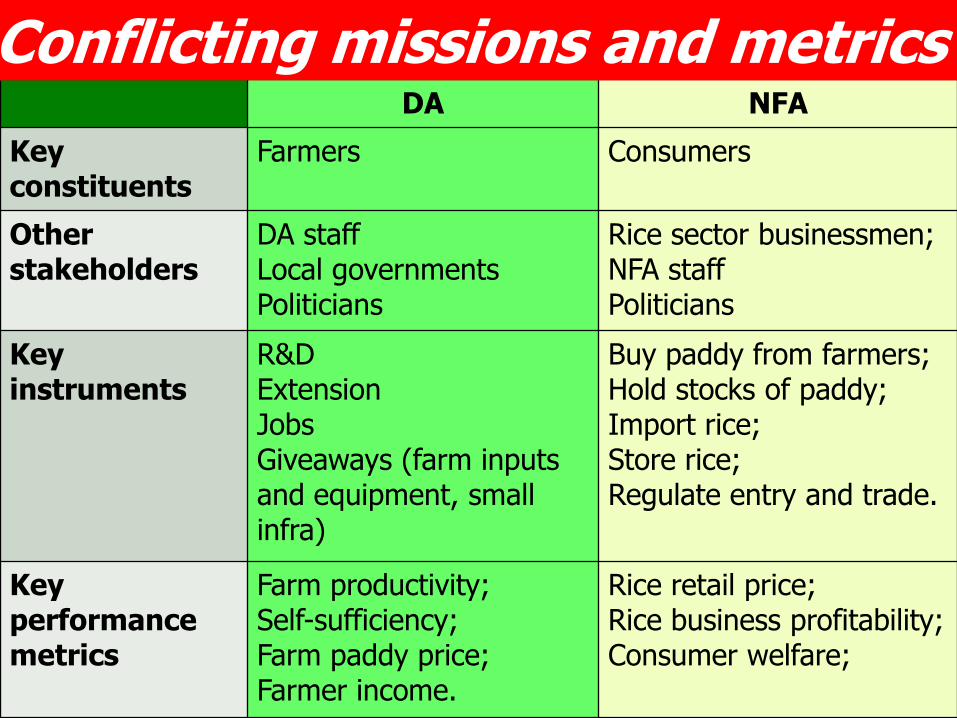
DA NFA
Key constituents
Farmers Consumers
Other stakeholders
DA staff Local governments Politicians
Rice sector businessmen; NFA staff Politicians
Key instruments
R&D Extension Jobs Giveaways (farm inputs and equipment, small infra)
Buy paddy from farmers; Hold stocks of paddy; Import rice; Store rice; Regulate entry and trade.
Key performance metrics
Farm productivity; Self-sufficiency; Farm paddy price; Farmer income.
Rice retail price; Rice business profitability; Consumer welfare;
Conflicting missions and metrics