Embed Size (px)
Citation preview
May 2009
77 1Department of Agribusiness Management, Faculty of Agricultural Sciences, Sabaragamuwa University of Sri
Lanka, Belihuloya ,Sri Lanka.
2 Department of Food and Economics ,Graduate school of Biosphere Sciences, Hiroshima University, Higashi
Hiroshima, Japan
RICE PINCH TO WAR THROWN NATION: AN OVERVIEW OF THE RICE
SUPPLY CHAIN OF SRI LANKA AND THE CONSUMER ATTITUDES ON
GOVERNMENT RICE RISK MANAGEMENT
D A M De Silva1 and M Yamao
2
ABSTRACT
Rice is staple for 2 million people in war thrown nation devastated by tsunami. This is the
second year running in which production increased in real terms through out past has failed
to keep pace with population growth. The harvest has also been hit by floods and unusual wet
weather. Time series forecasting analysis based on the secondary data was carried out to
identify the past, present and future trends of rice production, prices and self sufficiency level.
Focus group discussions and field observations used to construct the rice trading pattern.
Primary data on consumer attitudes on government rice risk management obtained through
the field survey. The study locations include both major rice growing areas (Hambantota,
Anuradhapura and Pollonnnaruwa) as well as important consumer hubs (Colombo,
Ratnapura, Galle, Matara and Hambantota). Cultivated and harvested land extends and yield
have positive increasing trend while simple time series modeler explains the increasing trend
of retail prices. Private sector is playing a very important role in rice marketing channel
where government intervention is minimal. Behavior of the rice processors has direct impact
on the availability of rice and the pricing in dome market. Consumers have negative attitudes
on government rice risk management and they are not confident on state intervention.
Key words: Rice, Sri Lanka, time series forecasting, consumer attitudes.
INTRODUCTION
World’s biggest rice producers are
developing nations, except China, to
whom rice is staple to their diet. Especially
the 2/3 of the world’s poor is depending on
rice or food subsidies from their own
governments. As harvests are always
subject to risks, a potential exporter may
temporarily become a rice importer,
consequently changing its trading policy
ex. Vietnam, India, Thailand and
Mynanmar (UNCTAD, 2008). Rice staple
to the 19.8 million inhabitants in Sri Lanka
where people used to consume minimum
two rice based meals per day. More often
Sri Lankans used to take 3 meals based on
rice and curry. Globalization changes the
food habits of the people around the world
including tiny Asian island. Today, most of
the urban dwellers in Sri Lanka used to
take one or two rice based meals. Majority
of the middle class consumers seeking
convenience and especially the preference
of working mothers goes for bread or “take
away” meals. The per capita consumption
of rice fluctuates around 100 Kg/year
depending on the price of rice, bread and
wheat flour (Ministry of Agriculture, 2000).
Rice is the single most important crop
occupying 34% (0.77/million/ha) of the
total cultivated area in Sri Lanka
((Ministry of Agriculture, 2000). On
average 560,000 ha are cultivated during
Maha season (October to February) and
310,000 ha during Yala season (May to
September) making the average annual
extent shown with rice to about 870,000 ha
(Ministry of Agriculture, 2000). About 1.8
million farm families are engaged in paddy
cultivation. Country currently produces 2.7
million tones of rough rice annually and
satisfies around 95% of the domestic
requirement and imported 88,000 MT
The Journal of Agricultural Sciences, 2009, vol. 4, no 2
78
milled rice (Department of Census and
statistics, 2007). Rice provides 45% of
total calorie and 40% of total protein
requirement of an average Sri Lankan.
According to the projections of Ministry of
Agriculture, the demand for rice will
increase at 1.1% year and to meet this rice
production should grow at the rate of
2.9%/year. Current cost of production of
rough paddy is about Rs. 8.57/Kg
(Department of Census and statistics,
2006). The cost of labor, farm power and
tradable inputs consists of 55%, 23% and
23% respectively in total rice production
(Ministry of Agriculture, 2005). Global as
well as local demand for rice will increase
at 1.62% per annum making the tradable
rice volume to be doubled in another 20
years time (Ministry of Agriculture, 2005).
In general, milled brown and white rice are
marketed in wholesale trade. Producers
used to sell paddy to millers and paddy is
not distribute through the proper channel.
Research problem
According to the Food and Agriculture
Organization (FAO, 2007), global food
process rose by 40% in 2007. Producing
the highest food cost level on record
making 2007 as a year of food price hyper
inflation. The world’s most vulnerable
millions of people are facing starvation.
The economists and the heads of the
international financial institutions world
over have cited at least four reasons for the
price increase: oil prices, climate, market
speculation and economic boom. Oil price
hike has both direct and indirect
involvement with the recent food crises as
a net importer of crude oil (In 1983
inflation adjusted price of barrel of crude
oil had been 25 US$ and it was reached to
100 US$ in 2007 and pass 135 US$ in
May 2008). Recent rice riots, the surge in
the volume of mass media coverage about
rice shortages and the political panic about
agricultural policies especially changing
rice policy direct us to investigate on
current topic. The principal research
questions were what will be the shape of
the retail rice price curve in future? and
what are the future production trends?.
Moreover, this study aims to investigate
the seasonal gults and shortages of rice
prices in retail market. Spiraling rice prices
have left the people of war thrown country
facing their worst food shortages since
1970s’. This study aims to understand
whether the Sri Lankan consumers are
confident in government intervention in
recent rice crises or not?
Objectives of the study
1. To investigate the past, present and
future trends of rice production, price,
marketing and consumption in Sri
Lanka
2. To analyze the consumer attitudes on
government in rice risk management in
Sri Lanka while facing the civil war
This paper consists of three main parts.
First part is covering the introductory note
following the history of rice marketing in
Sri Lanka. The body of the paper consists
of methodology and findings. Final part
composted of concluding remarks together
with recommendations for future policy.
MATERIALS AND METHODS
Major focuses of the study were three fold;
first to perform forecasting analysis for the
rice production in Sri Lanka, imports and
market prices to examine the future trends
of Sri Lankan rice market. Time series
forecasting analysis was utilized the
published secondary data of the
Department of Census and Statistics,
Hector Kobbekaduwa Agrarian Research
and Training Institute (HARTI),
Department of Sri Lanka Customs and
annual reports of Central Bank of Sri
Lanka. Time period for the production data
was 1952 to 2007 and retail prices and
import figures were taken from mid 1990s
to 2007 for the analysis. Moreover, time
series forecasting analysis was carried out
D.A.M.De Silva and M. Yamao
79
using SPSS 16 analysis package (SPSS inc.
2007). The retail prices of three common
varieties of rice in domestic market were
used for the analysis. Simple seasonal time
series model was used to observe the
future trends of rice prices.
Second focus of the study was to
investigate using the primary data
collected by different destinations of the
island. Primary data on consumer’s
confidence on government rice risk
management attitudes were obtained
through the field survey. Study locations
included both major rice growing areas as
well as important consumer hubs in main
cities. The selected cities were Colombo,
Ratnapura, Galle, Matara and Hambantota.
Thirty consumers from each location were
randomly selected to measure their
attitudes on food risk management or
confidence in government intervention on
current rice crises. Primary data were
collected through self administered
structured questionnaire. Consumer
attitudes were tested using attitudes survey
and “t” test was used to analyze the
significance of the test.
Food shoppers were tested using 10
attributes on government rice risk
management. Interviews were conducted
during the weekend. In general, many
people used to shop for food during the
weekend and grocery stores are packed by
food shoppers. Study locations of the each
destination were the rice retailers, grocery
stores, supermarkets and weekly direct
markets (fair or Pola). Seventy five
consumers from supermarkets and 75 from
other type of retailers were selected to
collect the primary data. Every 5th
food
shopper was selected and asked to answer
the structured questionnaire. When 5th
consumer refused to answer and then
requested from the 6th
. Five point Likert
type response format were used to
measure their attitudes on government
intervention on rice risk management
Survey was not intended to collect details
about consumers and length of the survey
was about 10 minutes. The questionnaire
was focused on two main areas,
demographics and confidence in rice risk
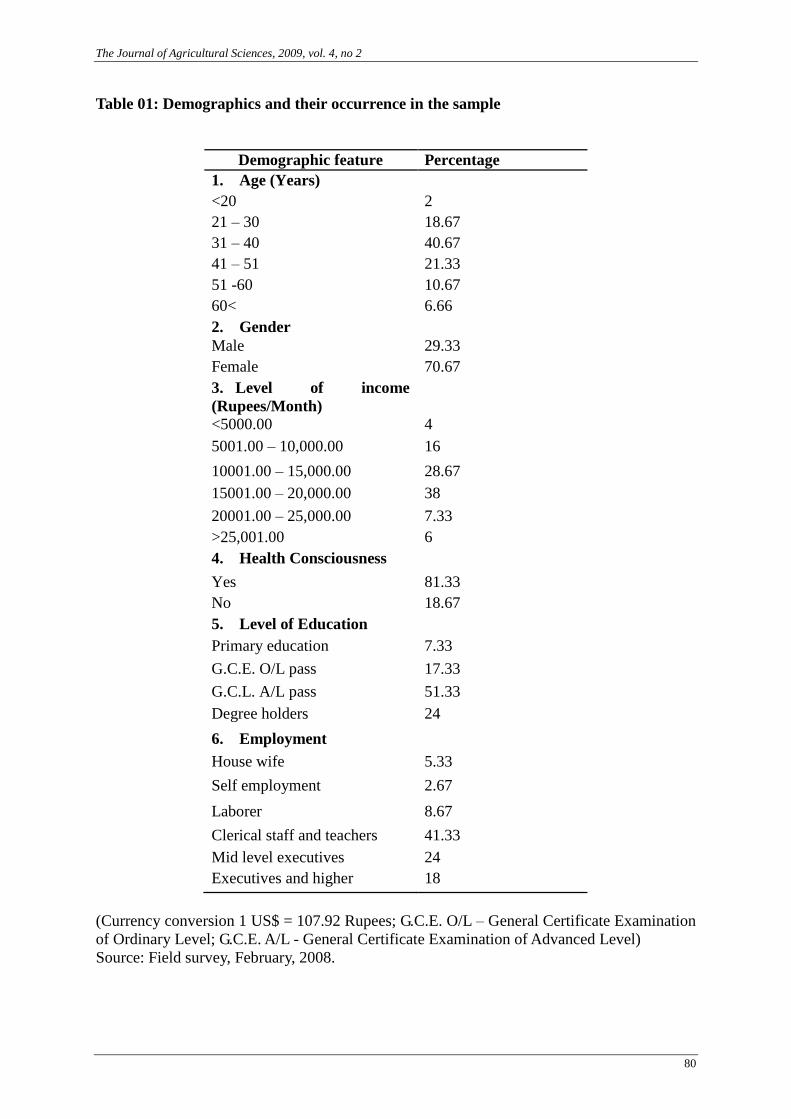
management. Table 1 describes the details
of the demographics and their occurrence.
Focus group discussions and field
observations were carried out using
experienced field workers were used to
collect the data on existing rice trading
pattern of Sri Lanka. Discussions were
conducted at major rice growing areas in
South, North-East, Central,
Sabaragamuwa and Western provinces.
Primary data were collected through case
study approach from retailers, wholesalers,
millers, traders, middlemen, importers and
consumers.
The Journal of Agricultural Sciences, 2009, vol. 4, no 2
80
Table 01: Demographics and their occurrence in the sample
Demographic feature Percentage
1. Age (Years)
<20 2
21 – 30 18.67
31 – 40 40.67
41 – 51 21.33
51 -60 10.67
60< 6.66
2. Gender
Male 29.33
Female 70.67
3. Level of income
(Rupees/Month)
<5000.00 4
5001.00 – 10,000.00 16
10001.00 – 15,000.00 28.67
15001.00 – 20,000.00 38
20001.00 – 25,000.00 7.33
>25,001.00 6
4. Health Consciousness
Yes 81.33
No 18.67
5. Level of Education
Primary education 7.33
G.C.E. O/L pass 17.33
G.C.L. A/L pass 51.33
Degree holders 24
6. Employment
House wife 5.33
Self employment 2.67
Laborer 8.67
Clerical staff and teachers 41.33
Mid level executives 24
Executives and higher 18
(Currency conversion 1 US$ = 107.92 Rupees; G.C.E. O/L – General Certificate Examination
of Ordinary Level; G.C.E. A/L - General Certificate Examination of Advanced Level)
Source: Field survey, February, 2008.
D.A.M.De Silva and M. Yamao
81
RESULTS AND DISCUSSION
Major concerns of the study were to
analyze the present and future market
trends of retail prices, rice production,
imports and self sufficiency in Sri Lanka.
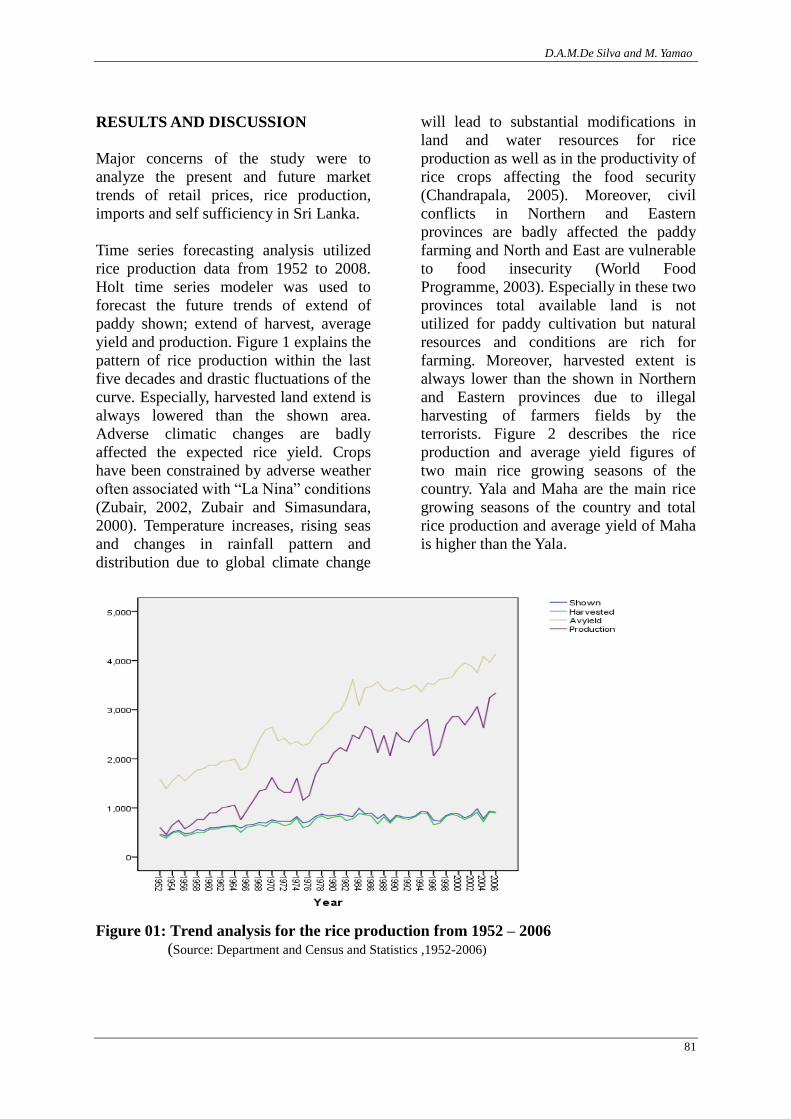
Time series forecasting analysis utilized
rice production data from 1952 to 2008.
Holt time series modeler was used to
forecast the future trends of extend of
paddy shown; extend of harvest, average
yield and production. Figure 1 explains the
pattern of rice production within the last
five decades and drastic fluctuations of the
curve. Especially, harvested land extend is
always lowered than the shown area.
Adverse climatic changes are badly
affected the expected rice yield. Crops
have been constrained by adverse weather
often associated with “La Nina” conditions
(Zubair, 2002, Zubair and Simasundara,
2000). Temperature increases, rising seas
and changes in rainfall pattern and
distribution due to global climate change
will lead to substantial modifications in
land and water resources for rice
production as well as in the productivity of
rice crops affecting the food security
(Chandrapala, 2005). Moreover, civil
conflicts in Northern and Eastern
provinces are badly affected the paddy
farming and North and East are vulnerable
to food insecurity (World Food
Programme, 2003). Especially in these two
provinces total available land is not
utilized for paddy cultivation but natural
resources and conditions are rich for
farming. Moreover, harvested extent is
always lower than the shown in Northern
and Eastern provinces due to illegal
harvesting of farmers fields by the
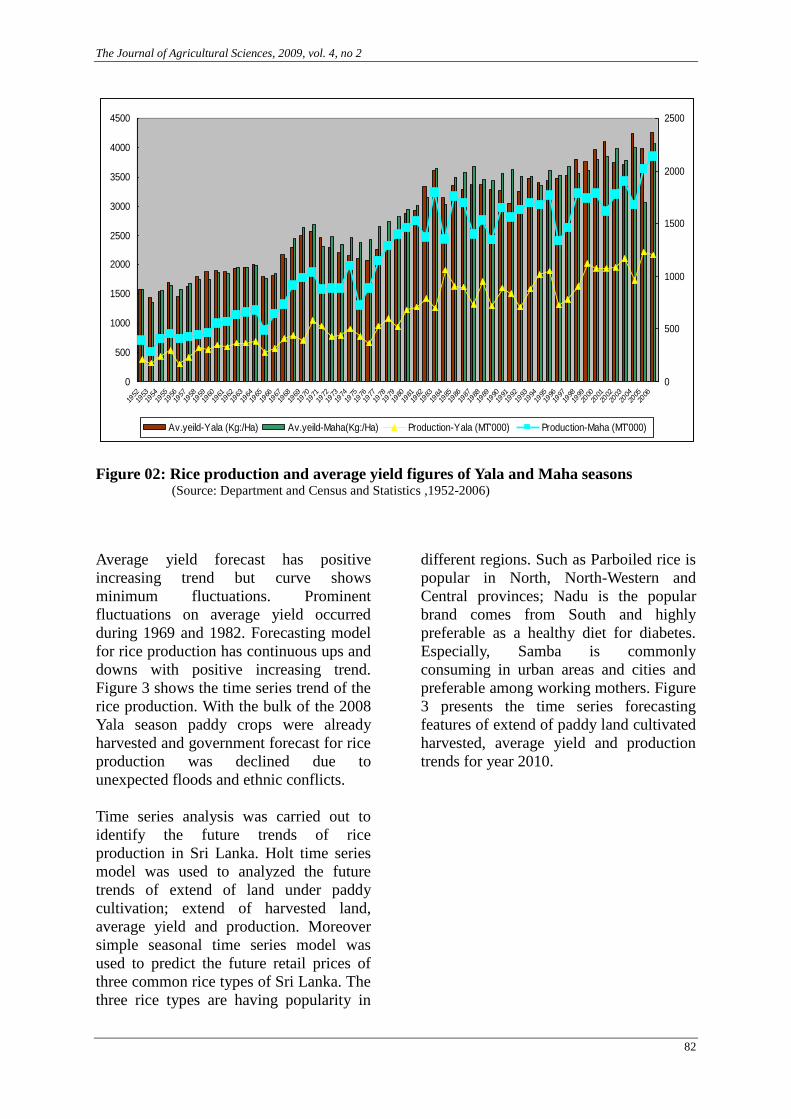
terrorists. Figure 2 describes the rice
production and average yield figures of
two main rice growing seasons of the
country. Yala and Maha are the main rice
growing seasons of the country and total
rice production and average yield of Maha
is higher than the Yala.
Figure 01: Trend analysis for the rice production from 1952 – 2006
(Source: Department and Census and Statistics ,1952-2006)
The Journal of Agricultural Sciences, 2009, vol. 4, no 2
82
0
500
1000
1500
2000
2500
3000
3500
4000
4500
1952
1953
1954
1955
1956
1957
1958
1959
1960
1961
1962
1963
1964
1965
1966
1967
1968
1969
1970
1971
1972
1973
1974
1975
1976
1977
1978
1979
1980
1981
1982
1983
1984
1985
1986
1987
1988
1989
1990
1991
1992
1993
1994
1995
1996
1997
1998
1999
2000
2001
2002
2003
2004
2005
2006
0
500
1000
1500
2000
2500
Av.yeild-Yala (Kg:/Ha) Av.yeild-Maha(Kg:/Ha) Production-Yala (MT'000) Production-Maha (MT'000)
Figure 02: Rice production and average yield figures of Yala and Maha seasons (Source: Department and Census and Statistics ,1952-2006)
Average yield forecast has positive
increasing trend but curve shows
minimum fluctuations. Prominent
fluctuations on average yield occurred
during 1969 and 1982. Forecasting model
for rice production has continuous ups and
downs with positive increasing trend.
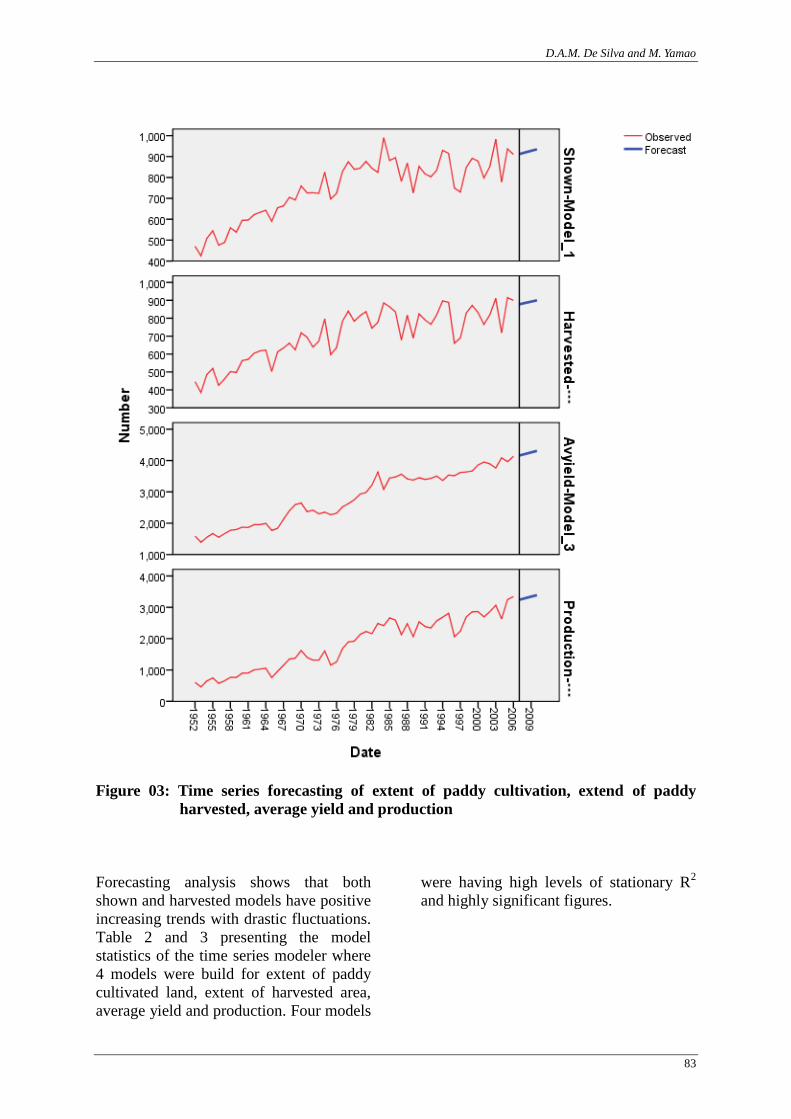
Figure 3 shows the time series trend of the
rice production. With the bulk of the 2008
Yala season paddy crops were already
harvested and government forecast for rice
production was declined due to
unexpected floods and ethnic conflicts.
Time series analysis was carried out to
identify the future trends of rice
production in Sri Lanka. Holt time series
model was used to analyzed the future
trends of extend of land under paddy
cultivation; extend of harvested land,
average yield and production. Moreover
simple seasonal time series model was
used to predict the future retail prices of
three common rice types of Sri Lanka. The
three rice types are having popularity in
different regions. Such as Parboiled rice is
popular in North, North-Western and
Central provinces; Nadu is the popular
brand comes from South and highly
preferable as a healthy diet for diabetes.
Especially, Samba is commonly
consuming in urban areas and cities and
preferable among working mothers. Figure
3 presents the time series forecasting
features of extend of paddy land cultivated
harvested, average yield and production
trends for year 2010.
D.A.M. De Silva and M. Yamao
83
Figure 03: Time series forecasting of extent of paddy cultivation, extend of paddy
harvested, average yield and production
Forecasting analysis shows that both
shown and harvested models have positive
increasing trends with drastic fluctuations.
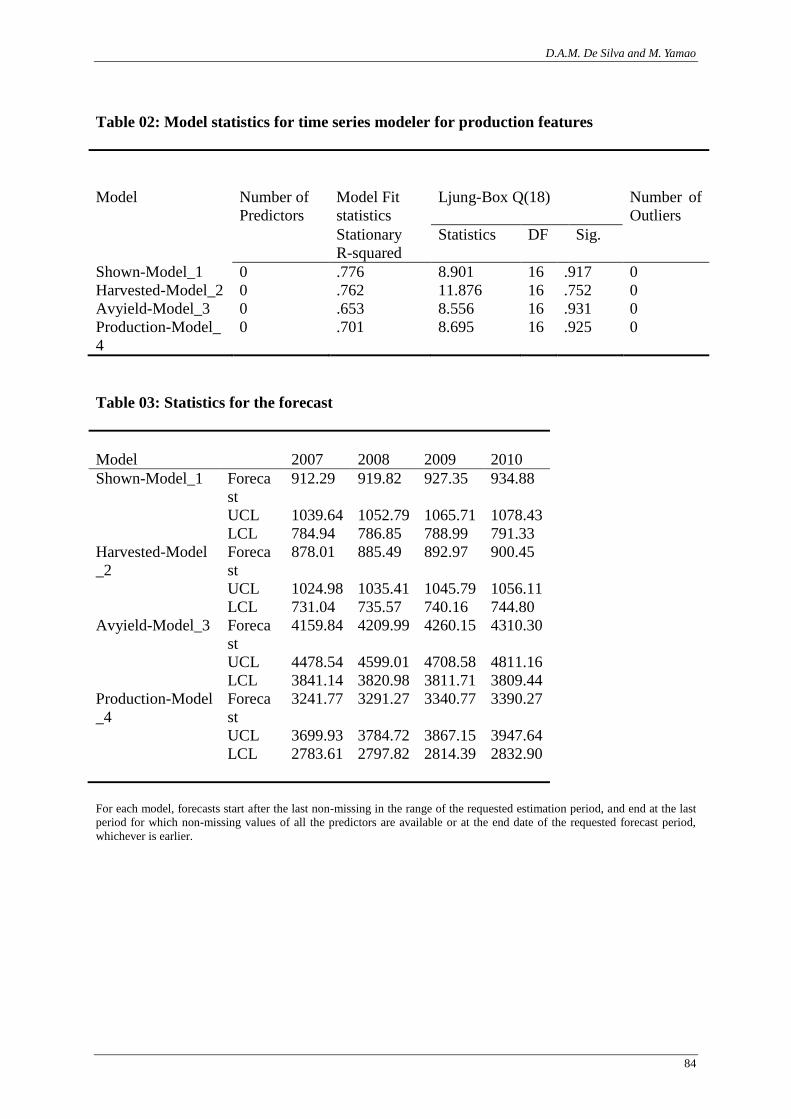
Table 2 and 3 presenting the model
statistics of the time series modeler where
4 models were build for extent of paddy
cultivated land, extent of harvested area,
average yield and production. Four models
were having high levels of stationary R2
and highly significant figures.
D.A.M. De Silva and M. Yamao
84
Table 02: Model statistics for time series modeler for production features
Model Number of
Predictors
Model Fit
statistics
Ljung-Box Q(18) Number of
Outliers
Stationary
R-squared
Statistics DF Sig.
Shown-Model_1 0 .776 8.901 16 .917 0
Harvested-Model_2 0 .762 11.876 16 .752 0
Avyield-Model_3 0 .653 8.556 16 .931 0
Production-Model_
4
0 .701 8.695 16 .925 0
Table 03: Statistics for the forecast
Model 2007 2008 2009 2010
Shown-Model_1 Foreca
st
912.29 919.82 927.35 934.88
UCL 1039.64 1052.79 1065.71 1078.43
LCL 784.94 786.85 788.99 791.33
Harvested-Model
_2
Foreca
st
878.01 885.49 892.97 900.45
UCL 1024.98 1035.41 1045.79 1056.11
LCL 731.04 735.57 740.16 744.80
Avyield-Model_3 Foreca
st
4159.84 4209.99 4260.15 4310.30
UCL 4478.54 4599.01 4708.58 4811.16
LCL 3841.14 3820.98 3811.71 3809.44
Production-Model
_4
Foreca
st
3241.77 3291.27 3340.77 3390.27
UCL 3699.93 3784.72 3867.15 3947.64
LCL 2783.61 2797.82 2814.39 2832.90
For each model, forecasts start after the last non-missing in the range of the requested estimation period, and end at the last
period for which non-missing values of all the predictors are available or at the end date of the requested forecast period,
whichever is earlier.
D.A.M.De Silva and M. Yamao
85
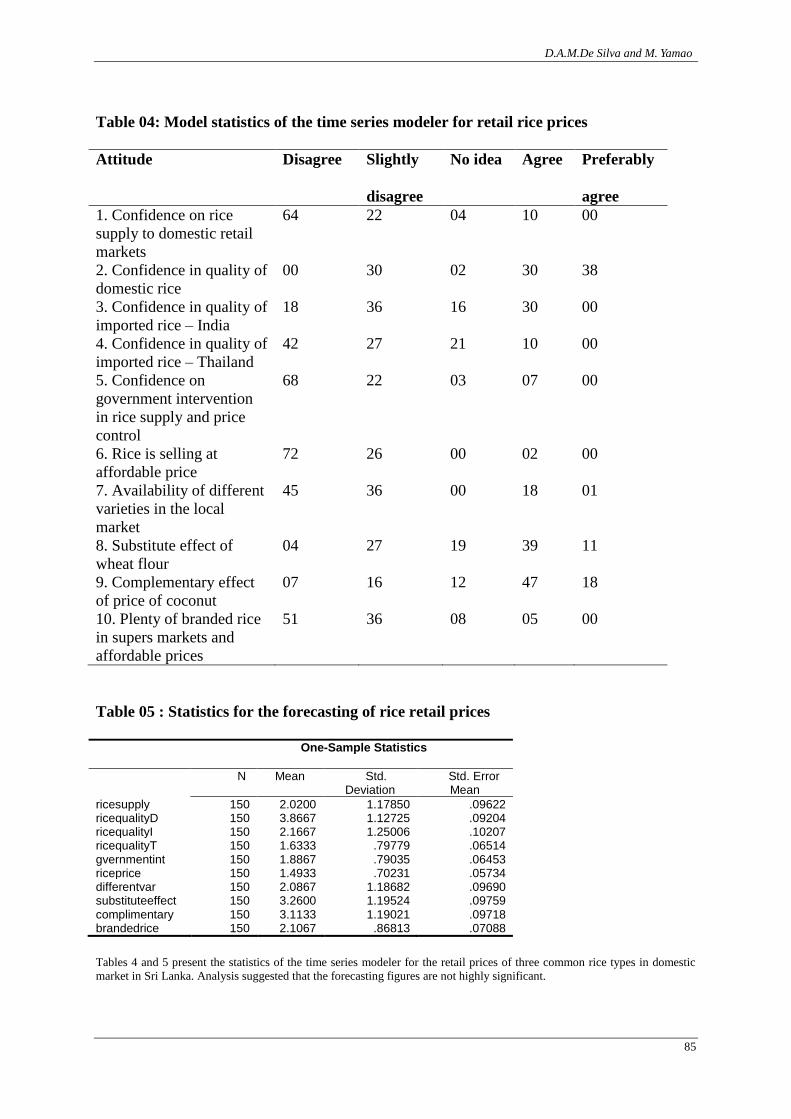
Table 04: Model statistics of the time series modeler for retail rice prices
Attitude Disagree Slightly
disagree
No idea Agree Preferably
agree
1. Confidence on rice
supply to domestic retail
markets
64 22 04 10 00
2. Confidence in quality of
domestic rice
00 30 02 30 38
3. Confidence in quality of
imported rice – India
18 36 16 30 00
4. Confidence in quality of
imported rice – Thailand
42 27 21 10 00
5. Confidence on
government intervention
in rice supply and price
control
68 22 03 07 00
6. Rice is selling at
affordable price
72 26 00 02 00
7. Availability of different
varieties in the local
market
45 36 00 18 01
8. Substitute effect of wheat flour
04 27 19 39 11
9. Complementary effect
of price of coconut
07 16 12 47 18
10. Plenty of branded rice
in supers markets and
affordable prices
51 36 08 05 00
Table 05 : Statistics for the forecasting of rice retail prices
One-Sample Statistics
N Mean Std. Deviation
Std. Error Mean
ricesupply 150 2.0200 1.17850 .09622 ricequalityD 150 3.8667 1.12725 .09204 ricequalityI 150 2.1667 1.25006 .10207 ricequalityT 150 1.6333 .79779 .06514 gvernmentint 150 1.8867 .79035 .06453 riceprice 150 1.4933 .70231 .05734 differentvar 150 2.0867 1.18682 .09690 substituteeffect 150 3.2600 1.19524 .09759 complimentary 150 3.1133 1.19021 .09718 brandedrice 150 2.1067 .86813 .07088
Tables 4 and 5 present the statistics of the time series modeler for the retail prices of three common rice types in domestic
market in Sri Lanka. Analysis suggested that the forecasting figures are not highly significant.
The Journal of Agricultural Sciences, 2009, vol. 4, no 2
86
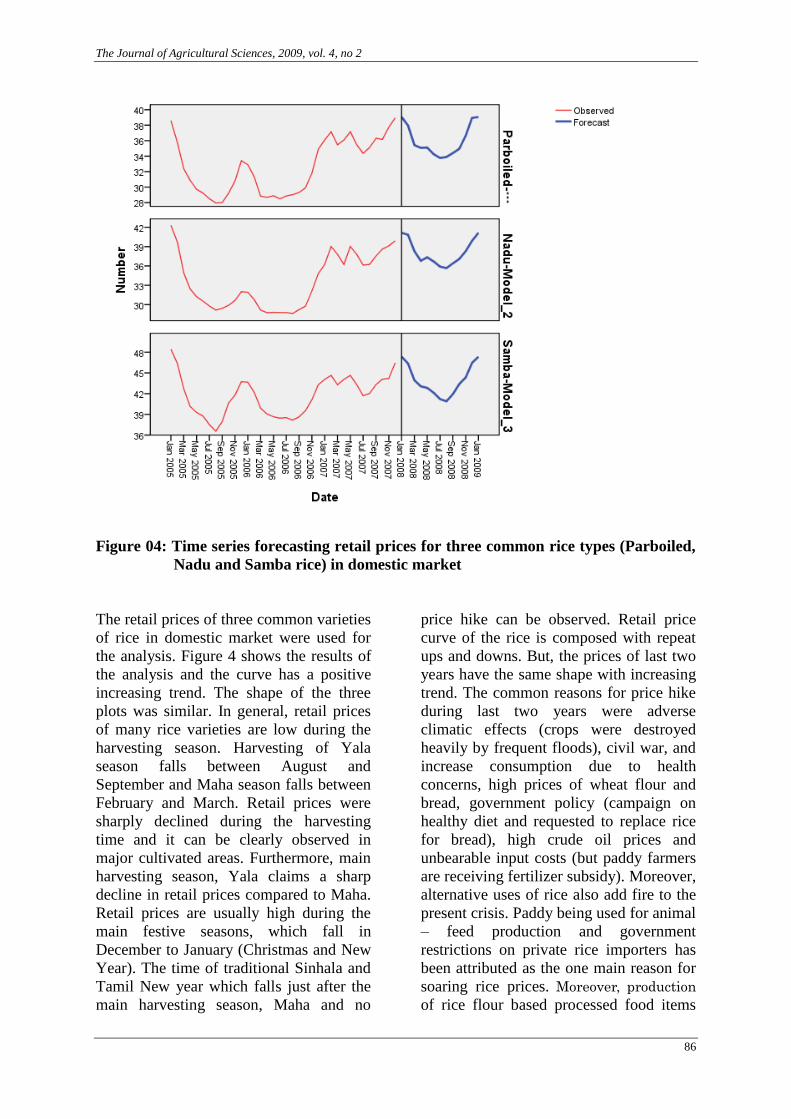
Figure 04: Time series forecasting retail prices for three common rice types (Parboiled,
Nadu and Samba rice) in domestic market
The retail prices of three common varieties
of rice in domestic market were used for
the analysis. Figure 4 shows the results of
the analysis and the curve has a positive
increasing trend. The shape of the three
plots was similar. In general, retail prices
of many rice varieties are low during the
harvesting season. Harvesting of Yala
season falls between August and
September and Maha season falls between
February and March. Retail prices were
sharply declined during the harvesting
time and it can be clearly observed in
major cultivated areas. Furthermore, main
harvesting season, Yala claims a sharp
decline in retail prices compared to Maha.
Retail prices are usually high during the
main festive seasons, which fall in
December to January (Christmas and New
Year). The time of traditional Sinhala and
Tamil New year which falls just after the
main harvesting season, Maha and no
price hike can be observed. Retail price
curve of the rice is composed with repeat
ups and downs. But, the prices of last two
years have the same shape with increasing
trend. The common reasons for price hike
during last two years were adverse
climatic effects (crops were destroyed
heavily by frequent floods), civil war, and
increase consumption due to health
concerns, high prices of wheat flour and
bread, government policy (campaign on
healthy diet and requested to replace rice
for bread), high crude oil prices and
unbearable input costs (but paddy farmers
are receiving fertilizer subsidy). Moreover,
alternative uses of rice also add fire to the
present crisis. Paddy being used for animal
– feed production and government
restrictions on private rice importers has
been attributed as the one main reason for
soaring rice prices. Moreover, production
of rice flour based processed food items
D.A.M.De Silva and M. Yamao
87
such as noodles, string hopper mixtures;
hopper mixtures, biscuits, etc. indirectly
affect the rice availability in the local
market. But popular belief of the country
was supply control by the paddy millers
make the condition worst. Exceptionally
wet conditions prevailed in large parts of
the country, especially wet zone, hindering
crops in most locations and causing the
country production fall. Moreover, recent
fierce fighting between government forces
and terrorists limit the available dry zone
paddy lands for cultivation. It was the
major impact on annual Maha crops. The
contribution of dry zone is high compared
to wet zone in annual rice production.
With the inclusion of rice to the list of
essential goods government hopes to
punish those who have withheld stocks
and aims to solve the crisis. Food and
Agricultural Organization (2007) listed Sri
Lanka among 14 countries facing 'food
emergencies' due to rising prices. Some
unofficial figures show that consumption
of bread and wheat-based products has
fallen by as much as 40 percent. Wheat
grain imports have been hovering around
80,000 metric tones per month in recent
months, compared to around 120,000
metric tones a month about five years ago
(Dept. of Customs, 2007). State campaign
on healthy diet appeals consumers to eat
more rice than wheat based products.
0
5
10
15
20
25
Price(K
g:/R
upees)
2002 2003 2004 2005 2006 2007 2008
price(Rupees/Kg:)
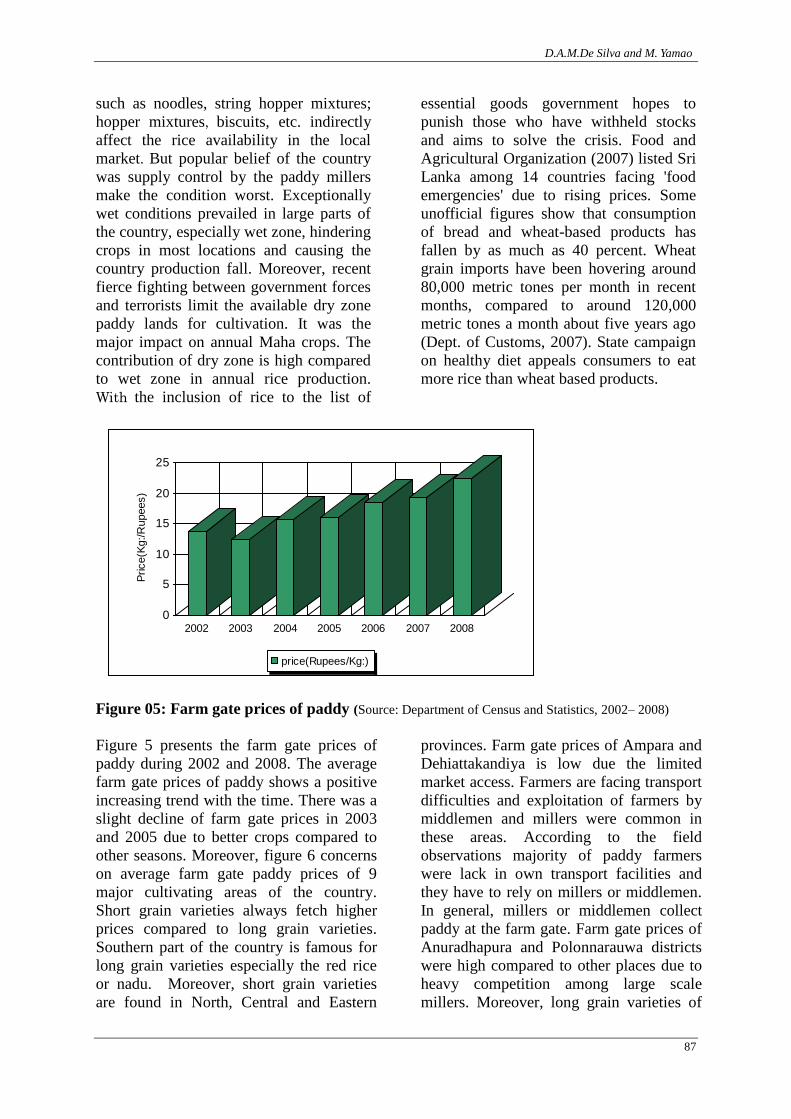
Figure 05: Farm gate prices of paddy (Source: Department of Census and Statistics, 2002– 2008)
Figure 5 presents the farm gate prices of
paddy during 2002 and 2008. The average
farm gate prices of paddy shows a positive
increasing trend with the time. There was a
slight decline of farm gate prices in 2003
and 2005 due to better crops compared to
other seasons. Moreover, figure 6 concerns
on average farm gate paddy prices of 9
major cultivating areas of the country.
Short grain varieties always fetch higher
prices compared to long grain varieties.
Southern part of the country is famous for
long grain varieties especially the red rice
or nadu. Moreover, short grain varieties
are found in North, Central and Eastern
provinces. Farm gate prices of Ampara and
Dehiattakandiya is low due the limited
market access. Farmers are facing transport
difficulties and exploitation of farmers by
middlemen and millers were common in
these areas. According to the field
observations majority of paddy farmers
were lack in own transport facilities and
they have to rely on millers or middlemen.
In general, millers or middlemen collect
paddy at the farm gate. Farm gate prices of
Anuradhapura and Polonnarauwa districts
were high compared to other places due to
heavy competition among large scale
millers. Moreover, long grain varieties of
The Journal of Agricultural Sciences, 2009, vol. 4, no 2
88
white and red rice of South usually fetch
high farm gate prices. Farmers endowed
with proper transport facilities, easy market
access, large number of small and medium
scale millers, high demand and popular
belief of “clean tasty rice of South”.
.
0
5
10
15
20
25
30
35
40
Price/K
g: (R
upees)
short grain Long grain/White Long grain/Red
Anuradhapura Polonnaruwa Kalawewa Kurunegala Dehiattakandiya
Ampara Ebilipitiya Matara Hambantota
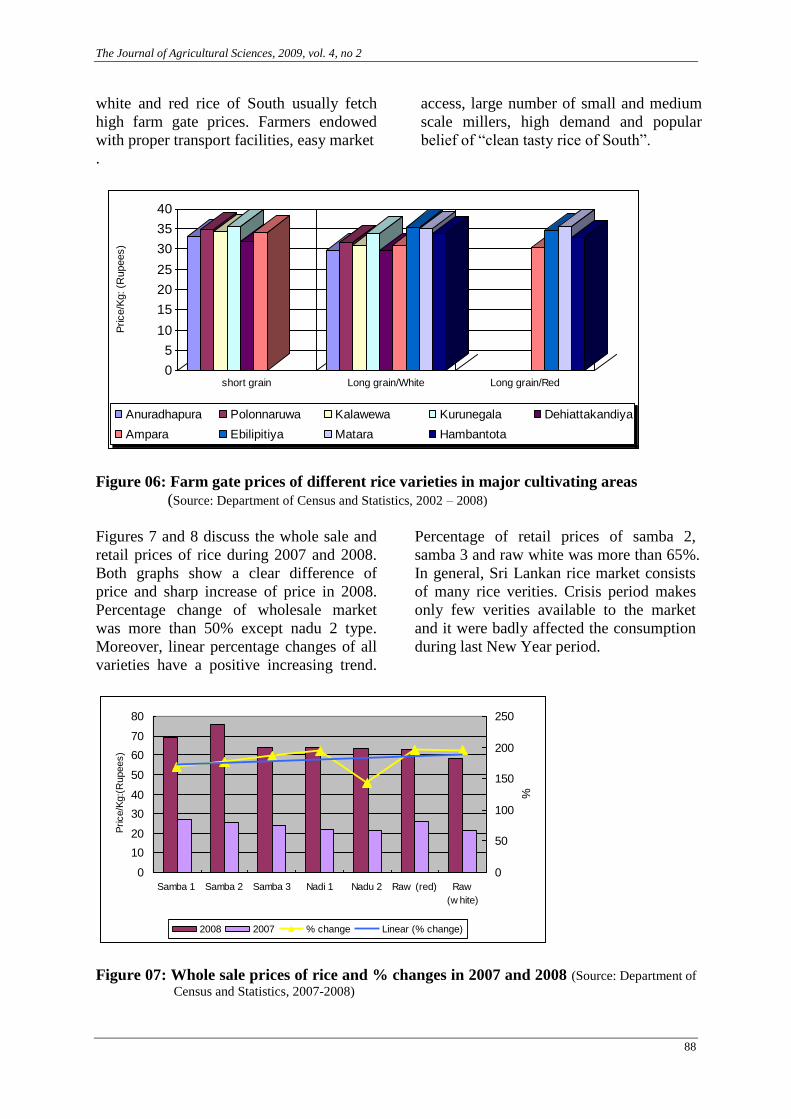
Figure 06: Farm gate prices of different rice varieties in major cultivating areas
(Source: Department of Census and Statistics, 2002 – 2008)
Figures 7 and 8 discuss the whole sale and
retail prices of rice during 2007 and 2008.
Both graphs show a clear difference of
price and sharp increase of price in 2008.
Percentage change of wholesale market
was more than 50% except nadu 2 type.
Moreover, linear percentage changes of all
varieties have a positive increasing trend.
Percentage of retail prices of samba 2,
samba 3 and raw white was more than 65%.
In general, Sri Lankan rice market consists
of many rice verities. Crisis period makes
only few verities available to the market
and it were badly affected the consumption
during last New Year period.
0
10
20
30
40
50
60
70
80
Samba 1 Samba 2 Samba 3 Nadi 1 Nadu 2 Raw (red) Raw
(w hite)
Price/K
g:(
Rupees)
0
50
100
150
200
250
%
2008 2007 % change Linear (% change)
Figure 07: Whole sale prices of rice and % changes in 2007 and 2008 (Source: Department of
Census and Statistics, 2007-2008)

D.A.M.De Silva and M. Yamao
89
0
10
20
30
40
50
60
70
80
Samba 1 Samba 2 Samba 3 Nadi 1 Nadu 2 Raw (red) Raw
(w hite)
Price/K
g: (R
upees)
0
20
40
60
80
100
120
%
2008 2007 % change Linear (% change)
Figure 08: Retail sale prices of rice and % changes in 2007 and 2008 (Source: Department
and Census and Statistics, 2007-2008)
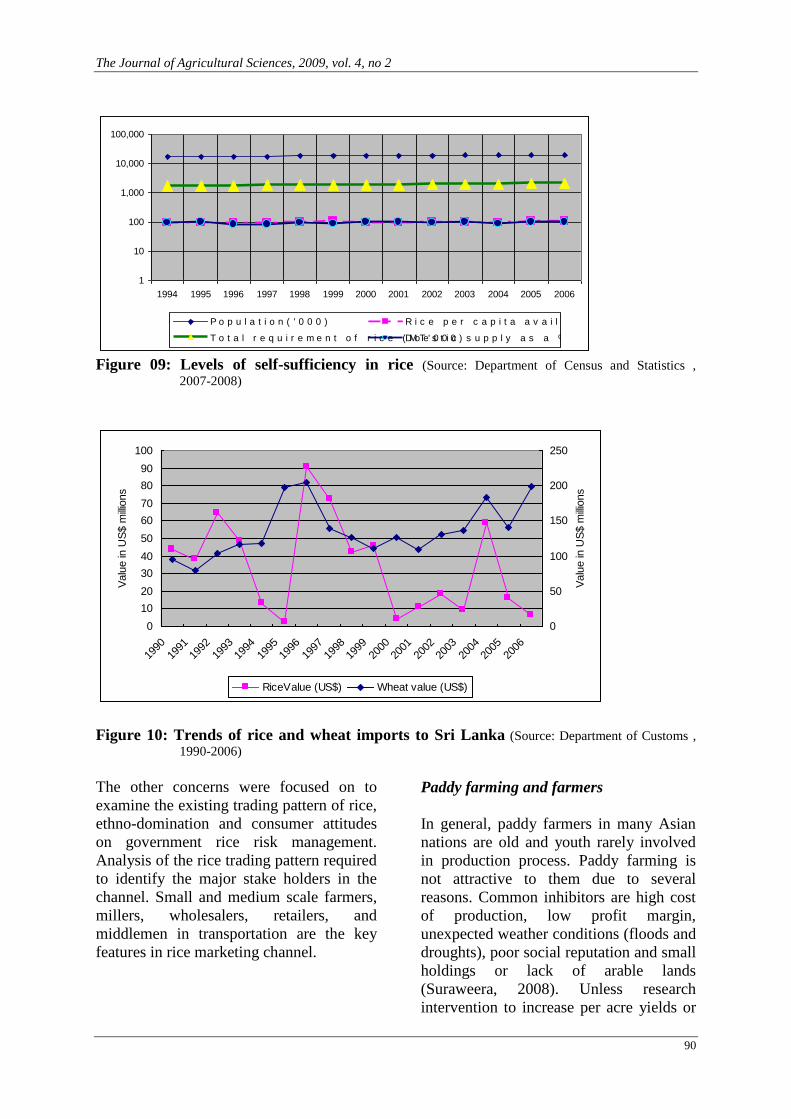
Figure 9 presents the self-sufficiency level
of rice in Sri Lanka during the period of
1994 – 2006. According to the figure, per
capita availability of rice is always
compatible with the percentage of
domestic rice supply. In general, country
can fulfill its demand for rice except
unusual weather conditions (Chandrapala,
2005). In mid 1980s country again reached
the level of self-sufficiency in rice
production while experiencing the taste of
new irrigation schemes. Recent crises of
rice supply have unusual face considered
with the country’s long experience of
self-sufficiency. Moreover, paddy farmers
and consumers believe that current crisis is
artificial and created by middlemen and
the millers seeking profit over it. On the
other hand increasing demand for broken
rice and rice bran as animal feed affected
the supply of rice for human consumption.
Sri Lankan government have taken steps
to ban the production, storage and
distribution of rice-based animal feed. The
government has decided to impose this
ban because the rising rice prices are
hurting the consumer and until prices
stabilize with imports and the next harvest
(The Poultry Site, 2008). Especially,
domestic consumers have to compete with
large scale animal feed producers such as
Prima Co. Ltd., Gold Coin Pvt. Ltd.,
Chemical Industries Colombo Ltd., for
rice while producers feel comfortable to
deal with multinational feed producers.
Attractive packages of feed producers
appeal rice farmers to sell their products to
companies. Company packages consists of
transportation, fixed price, assurance of
purchase on agreement, paying on time
and extra services such as input supplies.
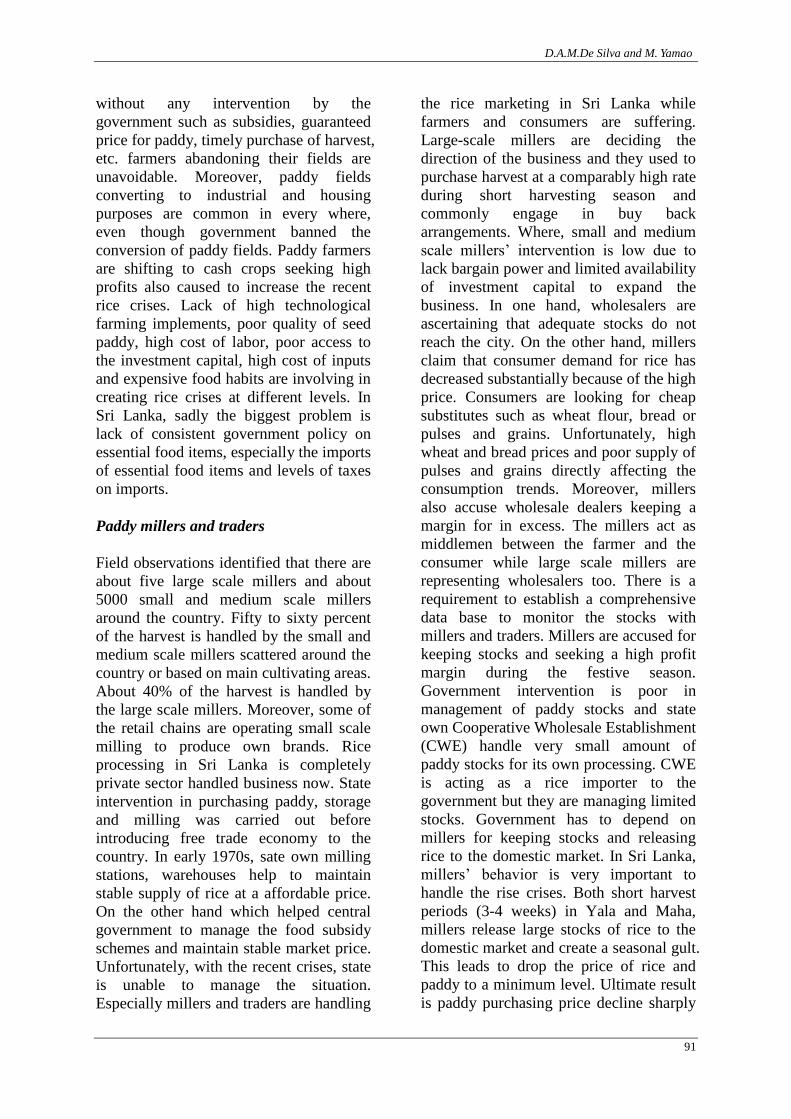
Figure 10 explains the rice and wheat
imports to Sri Lanka from 1990 to 2007.
Wheat imports have positive and
increasing trends with slight fluctuations.
But rice imports during the same period
have drastic fluctuations with a positive
increasing trend. Especially, mid 1996 and
mid 2005 adverse climatic changes
including floods and rains destroyed the
harvest and imported rice fulfilled the
demand. Moreover, perfect weather
conditions in 1995 - Yala, 2000 – Yala and
2006 – Yala produced better yields and
resulted lowest rice imports. Heavy rains
and unusual wet weather conditions in
2007 resulted poor harvests and add fire to
the present crisis. Furthermore, poor rice
harvest and changing consumption trends
(seeking for more convenience meals for
working middle class) create high demand
on wheat. The demand push supply curve
of wheat shifted upwards.
The Journal of Agricultural Sciences, 2009, vol. 4, no 2
90
1
10
100
1,000
10,000
100,000
1994 1995 1996 1997 1998 1999 2000 2001 2002 2003 2004 2005 2006
P o p u l a t i o n ( ' 0 0 0 ) R i c e p e r c a p i t a a v a i l a b i l i t y ( K g : / y r )
T o t a l r e q u i r e m e n t o f r i c e ( M T ' 0 0 0 )D o e s t i c s u p p l y a s a % o f t o t a l s u p p l y
Figure 09: Levels of self-sufficiency in rice (Source: Department of Census and Statistics ,
2007-2008)
0
10
20
30
40
50
60
70
80
90
100
1990
1991
1992
1993
1994
1995
1996
1997
1998
1999
2000
2001
2002
2003
2004
2005
2006
Valu
e in
US
$ m
illio
ns
0
50
100
150
200
250
Valu
e in
US
$ m
illio
ns
RiceValue (US$) Wheat value (US$)
Figure 10: Trends of rice and wheat imports to Sri Lanka (Source: Department of Customs ,
1990-2006)
The other concerns were focused on to
examine the existing trading pattern of rice,
ethno-domination and consumer attitudes
on government rice risk management.
Analysis of the rice trading pattern required
to identify the major stake holders in the
channel. Small and medium scale farmers,
millers, wholesalers, retailers, and
middlemen in transportation are the key
features in rice marketing channel.
Paddy farming and farmers
In general, paddy farmers in many Asian
nations are old and youth rarely involved
in production process. Paddy farming is
not attractive to them due to several
reasons. Common inhibitors are high cost
of production, low profit margin,
unexpected weather conditions (floods and
droughts), poor social reputation and small
holdings or lack of arable lands
(Suraweera, 2008). Unless research
intervention to increase per acre yields or
D.A.M.De Silva and M. Yamao
91
without any intervention by the
government such as subsidies, guaranteed
price for paddy, timely purchase of harvest,
etc. farmers abandoning their fields are
unavoidable. Moreover, paddy fields
converting to industrial and housing
purposes are common in every where,
even though government banned the
conversion of paddy fields. Paddy farmers
are shifting to cash crops seeking high
profits also caused to increase the recent
rice crises. Lack of high technological
farming implements, poor quality of seed
paddy, high cost of labor, poor access to
the investment capital, high cost of inputs
and expensive food habits are involving in
creating rice crises at different levels. In
Sri Lanka, sadly the biggest problem is
lack of consistent government policy on
essential food items, especially the imports
of essential food items and levels of taxes
on imports.
Paddy millers and traders
Field observations identified that there are
about five large scale millers and about
5000 small and medium scale millers
around the country. Fifty to sixty percent
of the harvest is handled by the small and
medium scale millers scattered around the
country or based on main cultivating areas.
About 40% of the harvest is handled by
the large scale millers. Moreover, some of
the retail chains are operating small scale
milling to produce own brands. Rice
processing in Sri Lanka is completely
private sector handled business now. State
intervention in purchasing paddy, storage
and milling was carried out before
introducing free trade economy to the
country. In early 1970s, sate own milling
stations, warehouses help to maintain
stable supply of rice at a affordable price.
On the other hand which helped central
government to manage the food subsidy
schemes and maintain stable market price.
Unfortunately, with the recent crises, state
is unable to manage the situation.
Especially millers and traders are handling
the rice marketing in Sri Lanka while
farmers and consumers are suffering.
Large-scale millers are deciding the
direction of the business and they used to
purchase harvest at a comparably high rate
during short harvesting season and
commonly engage in buy back
arrangements. Where, small and medium
scale millers’ intervention is low due to
lack bargain power and limited availability
of investment capital to expand the
business. In one hand, wholesalers are
ascertaining that adequate stocks do not
reach the city. On the other hand, millers
claim that consumer demand for rice has
decreased substantially because of the high
price. Consumers are looking for cheap
substitutes such as wheat flour, bread or
pulses and grains. Unfortunately, high
wheat and bread prices and poor supply of
pulses and grains directly affecting the
consumption trends. Moreover, millers
also accuse wholesale dealers keeping a
margin for in excess. The millers act as
middlemen between the farmer and the
consumer while large scale millers are
representing wholesalers too. There is a
requirement to establish a comprehensive
data base to monitor the stocks with
millers and traders. Millers are accused for
keeping stocks and seeking a high profit
margin during the festive season.
Government intervention is poor in
management of paddy stocks and state
own Cooperative Wholesale Establishment
(CWE) handle very small amount of
paddy stocks for its own processing. CWE
is acting as a rice importer to the
government but they are managing limited
stocks. Government has to depend on
millers for keeping stocks and releasing
rice to the domestic market. In Sri Lanka,
millers’ behavior is very important to
handle the rise crises. Both short harvest
periods (3-4 weeks) in Yala and Maha,
millers release large stocks of rice to the
domestic market and create a seasonal gult.
This leads to drop the price of rice and
paddy to a minimum level. Ultimate result
is paddy purchasing price decline sharply
The Journal of Agricultural Sciences, 2009, vol. 4, no 2
92
and millers having high bargaining power
used to packed their warehouses from new
harvest. But soon after, the harvesting
season, millers cancel the release of milled
rice to the wholesale market to create a
scarcity of rice.
Wholesalers
Wholesalers are based on central and
municipal wholesale markets established
in main cities. They are maintaining direct
contacts with both large scale and small
and medium scale millers. Large scale
millers supply bulk of the milled rice to
wholesalers under two categories, such as
branded and unbranded. Branded milled
rice sacks comes to the market in different
weight forms such as 10 Kg, 5 Kg, 2 Kg
and 1 Kg. In general, retail chains prefer
branded small sacks compared to bulk
rice.
Retailers
Rice retailers are commonly found in
everywhere in the country as the crop is
staple to the people. Retailers have
different faces such as Village Boutique,
Grocery store, Cooperatives, CWE,
Welfare shops, Super markets and Retail
Chains (Cargills, Keels, etc.). In general,
retail chains prefer branded small sacks
compared to the bulk rice.Retail chains
purchase milled rice directly from branded
large scale millers or purchase milled rice
from small and medium millers and
packed by using their own brand.
Established retailers such as Cargills
Ceylon Ltd. Has started their own rice
processing facility and Cargills outlets are
selling own branded rice. In general, retail
prices are varied place to place and shop to
shop. Cooperatives and CWE are
providing rice at a reasonable price
compared to private sector retailers.
Consumer behavior and patterns were
changed with the introduction of the
supermarket or retail chain culture to the
home market in Sri Lanka. Consumers
shop at retail chains prefer small sizes of
packed rice compared to the bulk rice.
Retailing of bulk rice is common allover
the country and rural consumers used to
buy rice in bulk forms.
Rice distribution channels in Sri Lanka are
unorganized and government has
minimum intervention ability to manage
the supply chain. Domestic rice supply
channels are controlled by private sector.
Only handful of millers control the rice
distribution channel and artificial price
fluctuations are common in the domestic
market. State intervention acts as a
facilitator on rice supply chain and
providing financial assistance through
state banks to the millers. According to the
field survey, state banks provide low
interest rate loans to millers for purchasing
and storing paddy.
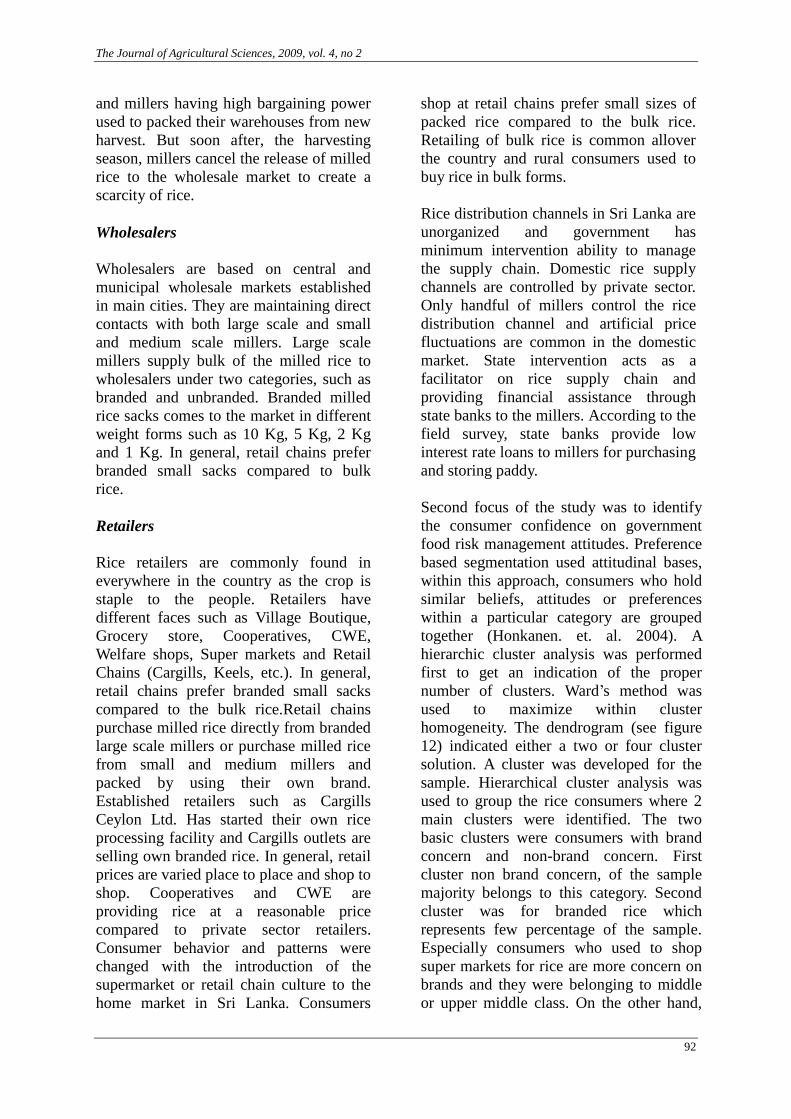
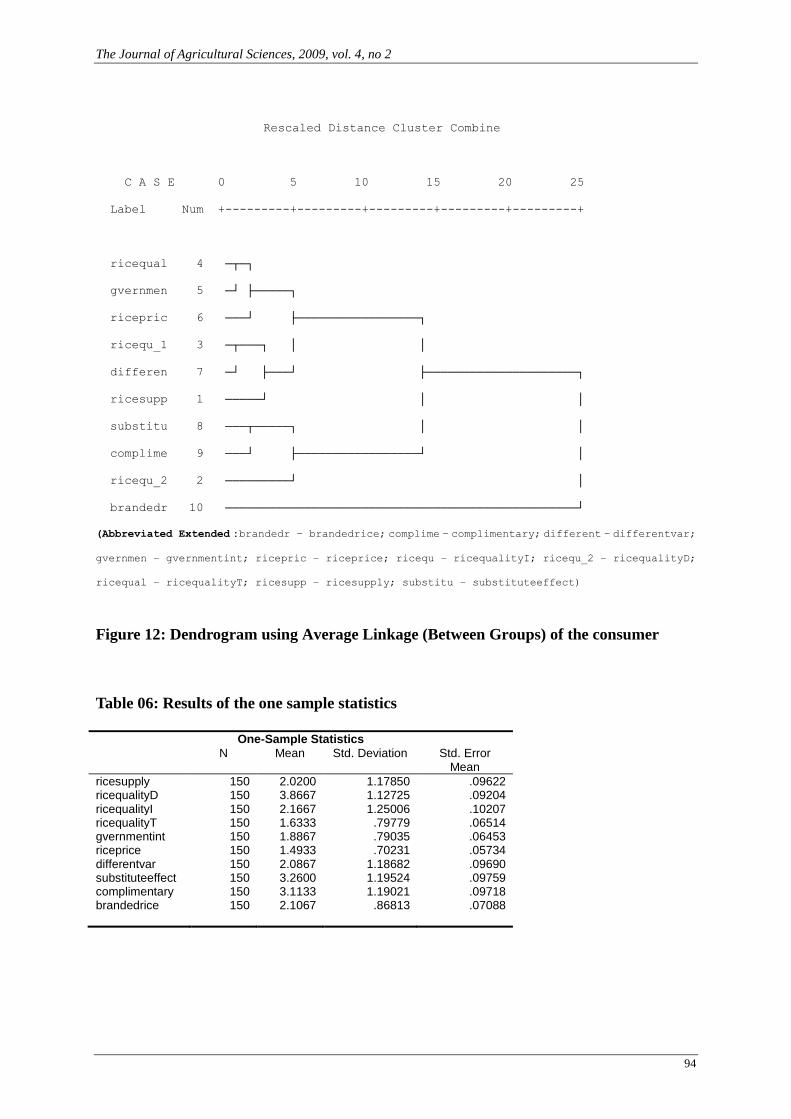
Second focus of the study was to identify
the consumer confidence on government
food risk management attitudes. Preference
based segmentation used attitudinal bases,
within this approach, consumers who hold
similar beliefs, attitudes or preferences
within a particular category are grouped
together (Honkanen. et. al. 2004). A
hierarchic cluster analysis was performed
first to get an indication of the proper
number of clusters. Ward’s method was
used to maximize within cluster
homogeneity. The dendrogram (see figure
12) indicated either a two or four cluster
solution. A cluster was developed for the
sample. Hierarchical cluster analysis was
used to group the rice consumers where 2
main clusters were identified. The two
basic clusters were consumers with brand
concern and non-brand concern. First
cluster non brand concern, of the sample
majority belongs to this category. Second
cluster was for branded rice which
represents few percentage of the sample.
Especially consumers who used to shop
super markets for rice are more concern on
brands and they were belonging to middle
or upper middle class. On the other hand,

D.A.M.De Silva and M. Yamao
93
majority of consumers were concern more
on substitutes such as wheat flour and
behavior of complementary goods such as
price of coconuts. Nine sub categories exist
within the non brand concern group. Lower
class or poor consumers were more concern
on substitutes and the complementary
goods. Table 6 shows the percentage of
consumer responses on government rice
risk management attitudes.
.
Figure 11: Distribution channel of the rice with stake holders
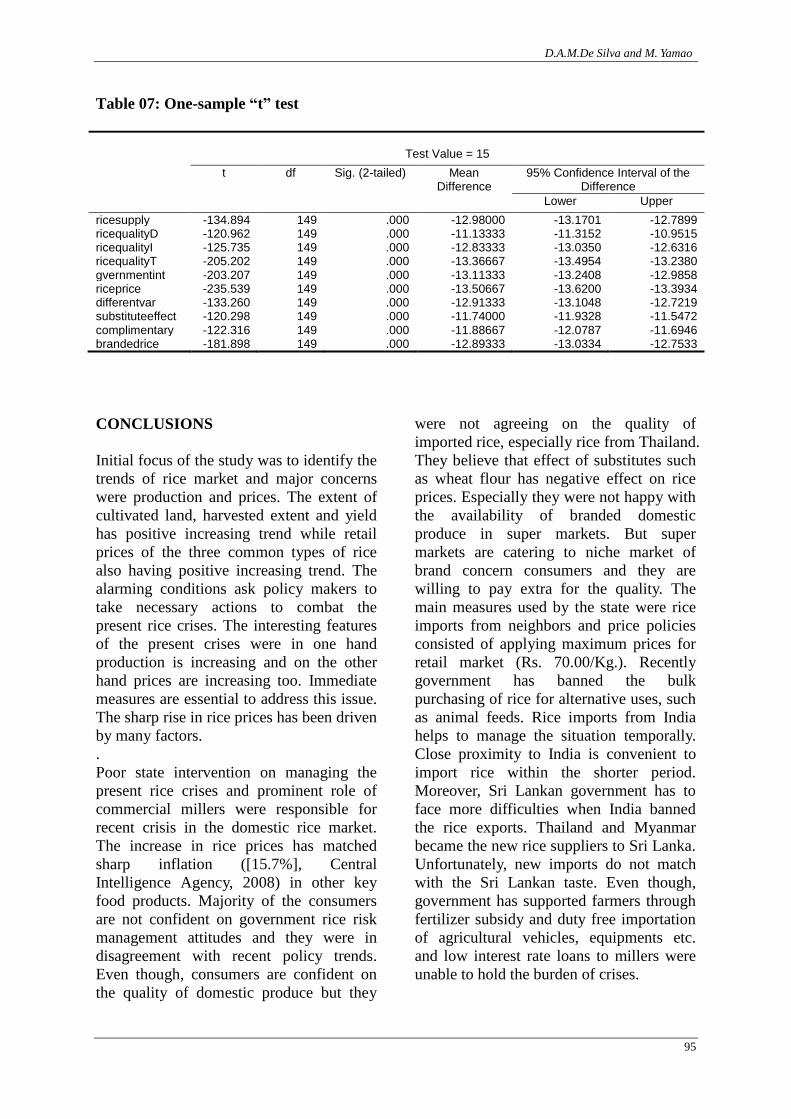
One sample “t” test was carried out to test
the difference between a sample mean of
attitudes and hypothesis. The sample
means disperse around the attitudinal score
of 15 and small stewarded deviation figures
indicate small amount of variation appeared.
Test statistic table (see table 6) shows the
results of the one sample “t” test. One
sample “t” test assumes that the data be
reasonably normally distributed, especially
with respect to the skewness. Based on
analysis, the means of the different
consumer’s attitudes is higher than the
population mean. There is a significant
difference between the two groups (70. 05)
Producers
Small and Medium
Scale millers Commercial
Millers
Importers
Wholesalers
Retailers
Consumers
Cooperatives
and CWE
The Journal of Agricultural Sciences, 2009, vol. 4, no 2
94
Rescaled Distance Cluster Combine
C A S E 0 5 10 15 20 25
Label Num +---------+---------+---------+---------+---------+
ricequal 4 ─┬─┐
gvernmen 5 ─┘ ├─────┐
ricepric 6 ───┘ ├─────────────────┐
ricequ_1 3 ─┬───┐ │ │
differen 7 ─┘ ├───┘ ├─────────────────────┐
ricesupp 1 ─────┘ │ │
substitu 8 ───┬─────┐ │ │
complime 9 ───┘ ├─────────────────┘ │
ricequ_2 2 ─────────┘ │
brandedr 10 ─────────────────────────────────────────────────┘
(Abbreviated Extended :brandedr – brandedrice; complime – complimentary; different – differentvar;
gvernmen – gvernmentint; ricepric – riceprice; ricequ – ricequalityI; ricequ_2 – ricequalityD;
ricequal – ricequalityT; ricesupp – ricesupply; substitu – substituteeffect)
Figure 12: Dendrogram using Average Linkage (Between Groups) of the consumer
Table 06: Results of the one sample statistics
One-Sample Statistics
N Mean Std. Deviation Std. Error Mean
ricesupply 150 2.0200 1.17850 .09622 ricequalityD 150 3.8667 1.12725 .09204 ricequalityI 150 2.1667 1.25006 .10207 ricequalityT 150 1.6333 .79779 .06514 gvernmentint 150 1.8867 .79035 .06453 riceprice 150 1.4933 .70231 .05734 differentvar 150 2.0867 1.18682 .09690 substituteeffect 150 3.2600 1.19524 .09759 complimentary 150 3.1133 1.19021 .09718 brandedrice 150 2.1067 .86813 .07088
D.A.M.De Silva and M. Yamao
95
Table 07: One-sample “t” test
Test Value = 15
t df Sig. (2-tailed) Mean Difference
95% Confidence Interval of the Difference
Lower Upper
ricesupply -134.894 149 .000 -12.98000 -13.1701 -12.7899 ricequalityD -120.962 149 .000 -11.13333 -11.3152 -10.9515 ricequalityI -125.735 149 .000 -12.83333 -13.0350 -12.6316 ricequalityT -205.202 149 .000 -13.36667 -13.4954 -13.2380 gvernmentint -203.207 149 .000 -13.11333 -13.2408 -12.9858 riceprice -235.539 149 .000 -13.50667 -13.6200 -13.3934 differentvar -133.260 149 .000 -12.91333 -13.1048 -12.7219 substituteeffect -120.298 149 .000 -11.74000 -11.9328 -11.5472 complimentary -122.316 149 .000 -11.88667 -12.0787 -11.6946 brandedrice -181.898 149 .000 -12.89333 -13.0334 -12.7533
CONCLUSIONS
Initial focus of the study was to identify the
trends of rice market and major concerns
were production and prices. The extent of
cultivated land, harvested extent and yield
has positive increasing trend while retail
prices of the three common types of rice
also having positive increasing trend. The
alarming conditions ask policy makers to
take necessary actions to combat the
present rice crises. The interesting features
of the present crises were in one hand
production is increasing and on the other
hand prices are increasing too. Immediate
measures are essential to address this issue.
The sharp rise in rice prices has been driven
by many factors.
.
Poor state intervention on managing the
present rice crises and prominent role of
commercial millers were responsible for
recent crisis in the domestic rice market.
The increase in rice prices has matched
sharp inflation ([15.7%], Central
Intelligence Agency, 2008) in other key
food products. Majority of the consumers
are not confident on government rice risk
management attitudes and they were in
disagreement with recent policy trends.
Even though, consumers are confident on
the quality of domestic produce but they
were not agreeing on the quality of
imported rice, especially rice from Thailand.
They believe that effect of substitutes such
as wheat flour has negative effect on rice
prices. Especially they were not happy with
the availability of branded domestic
produce in super markets. But super
markets are catering to niche market of
brand concern consumers and they are
willing to pay extra for the quality. The
main measures used by the state were rice
imports from neighbors and price policies
consisted of applying maximum prices for
retail market (Rs. 70.00/Kg.). Recently
government has banned the bulk
purchasing of rice for alternative uses, such
as animal feeds. Rice imports from India
helps to manage the situation temporally.
Close proximity to India is convenient to
import rice within the shorter period.
Moreover, Sri Lankan government has to
face more difficulties when India banned
the rice exports. Thailand and Myanmar
became the new rice suppliers to Sri Lanka.
Unfortunately, new imports do not match
with the Sri Lankan taste. Even though,
government has supported farmers through
fertilizer subsidy and duty free importation
of agricultural vehicles, equipments etc.
and low interest rate loans to millers were
unable to hold the burden of crises.
The Journal of Agricultural Sciences, 2009, vol. 4, no 2
96
References
Central Intelligence Agency (CIA). (2008). The world Fact Book, Guide to country profile,
Accessed 9th
June 2008, http://www.cia.gov/library/publications/the-world
Chandrapala L. (2005). Climate change, food security, sea level rise and environment in Sri
Lanka. Dept of Meterology, Colombo, Sri Lanka. Accessed 25th
June 2008.
http://www.wamis.org/agm/meetings/rsama08
Department of Census and statistics. (2006). Annual report, Department of Census and
Statistics, Colombo, Sri Lanka.
Department of Census and statistics. (2007). Annual report, Department of Census and
Statistics, Colombo, Sri Lanka.
Department of Customs. (2002 -2007). Annual reports, Department of Customs, Colombo,
Sri Lanka.
Food and Agriculture organization. (2007). Food emergencies and rising prices, Accessed 20th
July 2008, http://www.fao.org/worldfoodsituation/
Honkanen P., S.O.Olsen and Q.Myrland. (2006) Preference-based segmentation: a study of
meal preferences among Norwegian teenagers, Journal of Consumer Behavior, Volume
3, Issue 3, pp:235-250
Ministry of Agriculture. (2005). Rice Book (in Sinhala). Ministry of Agriculture
Development and Agrarian Services, Sri Lanka.
United Nations Conference on Trade and Development (UNTCD). (2008). Economic Policies.
Info Com, Market information in the commodities area.
http://www.unctad.org/infocomm/anglais/rice/ecopolicies.htm. Access 10th
June 2008.
World Food Programme. (2003). North and East are vulnerable to food insecurity, Food and
Agriculture organization. Accessed 18th
November 2008. http://www.fao.org/docrep
Suraweera S.A.D.L.K. (2008). Study on profitability and social impacts of paddy farming in
Polonnaruwa district. An un published undergraduate thesis, Department of
Agribusiness Management, Faculty of Agric. Sciences, Sabaragamuwa University of
Sri Lanka, pp: 20-27.
The Poultry Site. (2008). Sri Lanka: Rice Banned as Animal Feed, The Poultry Site,
http://www.thepoultrysite.com/poultrynews/13973/sri-lanka-rice-banned-as-animal-fe
ed . Accessed 2nd
June 2008.
Zubair L. (2002). El-Nino-Southern Oscillation influences on rice production in rice
production in Sri Lanka. International Journal of Climatology, 22 (2): pp 249-260
Zubair L. and S.Simasundara. (2000). ENSO influences on rice production in Sri Lanka.
Proceedings of the IRI forum on Agriculture, climate prediction and development,
International Rice Research Institute, Manila, Philippines.