Embed Size (px)
Citation preview
Prize Structure and Information in Tournaments: Experimental Evidence1
Richard B. Freeman, Harvard University, LSE, and NBER
Alexander M. Gelber, Harvard University and NBER
1 Freeman: NBER, 1050 Massachusetts Ave., Cambridge, MA 02138 (email: [email protected]); Gelber: 1050 Massachusetts Ave., Cambridge, MA 02138 (email: [email protected]). We thank Judd Kessler, Thomas Lemieux, Dina Pomeranz, Alvin Roth, two anonymous referees, and seminar participants at Columbia, Harvard, and Uppsala for suggestions. We thank Timur Akazhanov, Andrea Ellwood, Judd Kessler, and Julian Kolev for researchassistance. Gelber acknowledges financial support from the National Institute on Aging, Grant Number T32-AG00186. All remaining errors are our own.

2
Abstract
This paper examines behavior in a tournament in which we vary the tournament prize
structure and the information available about participants' skill at the task of solving mazes. The
number of solved mazes is lowest when payments are independent of performance; higher when
a single, large prize is given; and highest when multiple, differentiated prizes are given. This
result is strongest when we inform participants about the number of mazes they and others
solved in a pre-tournament round. Some participants reported that they solved more mazes than
they actually solved, and this misreporting also peaked with multiple differentiated prizes.
3
In tournament models, individuals respond to the opportunity to win prizes by assessing
their chances of winning, the size of the prizes, and the cost of effort in undertaking the
tournament task. Models of tournament behavior predict that the aggregate effort of individuals
in the tournament may be maximized by giving multiple prizes rather than a single prize, given a
constant total tournament purse, heterogeneous skills, and a sufficiently convex cost for
participants of putting forth effort (Benny Moldovanu and Aner Sela 2001). Multiple prizes give
more participants an incentive to try hard than does a single large prize, which many participants
may have little chance of winning. Prizes unrelated to output produce low effort as participants
see no return to effort. However, there is little empirical work examining how behavior responds
to differing prize structures or to information about participants’ level of ability at the
tournament task. Behavioral economics adds potential twists to traditional tournament theory,
including suggesting that incentives may crowd out intrinsic motivation (Uri Gneezy and Aldo
Rustichini 2000).
To assess behavior under different tournament prize structures and different information
given to participants, we use a maze-solving experiment that approximates important features of
real-world tournaments in which individuals with differing ability compete for prizes. We asked
groups of six subjects to solve a set of mazes in two rounds.2 In Round 1, we rewarded
individuals by piece rates so that their reward depended only on their own performance. After
the groups completed Round 1, we told participants in half of the groups about the distribution of
mazes solved in Round 1 in their group, but we did not tell participants in the other half of the
groups about the distribution in their groups. In Round 2, we gave three incentive treatments: a
treatment that paid each person the same regardless of performance; a treatment with one large
prize for the tournament winner; and a treatment with multiple prizes that increased with a
participant’s rank in the tournament. Total prize money was constant across the three incentive
treatments. We measured the effects of the six treatments—three prize treatments in each
information environment—on effort by measuring the number of mazes individuals solved.
Using the total number of mazes solved as a measure of output, we find that output is
lowest when payments to participants are independent of performance; higher when only a single
2 Gneezy, Muriel Niederle, and Rustichini (2003) use maze-solving to gauge the effort of subjects.

4
large prize is given; and highest when we give multiple differentiated prizes. While we cannot
pinpoint the prize structure corresponding to the global maximum of output among the infinite
number of possible allocations of a fixed tournament prize budget, our results demonstrate that
multiple differentiated prizes in some form can produce higher output than either one single prize
or prizes unrelated to performance.
We also find that the information individuals have about how they and others performed
in Round 1 of the experiment affected responses to the incentive conditions. The maximum
under multiple prizes is strongest when we inform participants about the number of mazes they
and others solved in Round 1. The differences in output among the conditions are, moreover,
driven largely by the different responses to incentives of subjects with high or low maze solving
ability, seemingly in response to the different marginal returns to effort in specific prize and
information settings. When subjects knew the distribution of solved mazes from Round 1, those
lower in the ability distribution solved more mazes with multiple prizes than they did with the
single prize condition; while by contrast, those higher in the ability distribution solved similar
numbers of mazes with multiple prizes as they did under the single prize condition. Lower-
ability subjects produced little when they knew they had little chance of winning a single prize
through more effort. When subjects did not know the distribution of solved mazes from Round
1, the single and multiple prize treatments produced similar outcomes across the ability
distribution—suggesting that when individuals did not know they ranked poorly in ability, they
did not “give up” on winning the single prize.
The paper and pencil maze technology that we used in our experiment allowed subjects to
falsely report unsolved mazes as solved. This serendipitously provides an independent test of the
impact of incentives on behavior and a new approach to detecting cheating in the laboratory. As
some form of cheating is widespread in many real-world contexts (e.g. Brian Jacob and Steven
Levitt 2003), our experiment provides an analog to a common setting. It relates to the multi-task
settings analyzed in the theory of incentives (Bengt Holmstrom and Paul Milgrom 1991), in
which one of the tasks is reporting outcomes accurately. This could be relevant to a recent
experience in the financial sector, in which increasingly high-powered incentives for executives

5
seem to underlie increased malfeasance. In our experiment, the extent of misreporting varied
with incentives in a similar way as did the number of mazes solved.
The experiments closest to ours (Weiland Müller and Andrew Schotter 2004; Haig
Nalbantian and Schotter 1997) examine how tournament prize structure affects effort but not
how information interacts with incentives or how incentives and information differently affect
individuals with different ability levels.3 Niederle and Lise Vesterlund (2007) compare the
decisions of men and women to enter a tournament. Ronald Ehrenberg and Michael Bognanno
(1990) find that golf tournaments have incentive effects but do not study the provision of
information or which distribution of prizes maximizes effort. Other recent analyses connected to
our work include Moldovanu, Sela, and Xianwen Shi (2007), who investigate the theory of
tournaments in the presence of status concerns; Tor Eriksson, Anders Poulsen, and Marie-Claire
Villeval (2008), who study the effect of feedback on performance under piece rates and
tournaments; and Oriana Bandiera, Iwan Barankay, and Imran Rasul (2007) and Clive Bull,
Schotter, and Keith Weigelt (1987), who compare piece rates and tournaments.
Section I describes the experiment. Section II presents the main results. Section III
discusses results relating to cheating in the experiment. Section IV concludes.
I. The Experiment
Our experiment recruited participants from the Harvard Business School Computer Lab
for Experimental Research subject pool. We asked subjects to solve a set of mazes from Dave
Phillips (1988, 1991) in a group with six participants. Groups gathered outside the room of the
experiment and entered together, and thus subjects could observe that they were competing in a
group with five others. The experiment had two rounds, each lasting for 15 minutes: a piece rate
incentive session (Round 1) and a tournament session (Round 2). The maze packet used for
Round 2 contained different mazes than those in the maze packet for Round 1. We presented the
3 Müller and Schotter (2004) find that some participants work hard in tournaments while others effectively drop out. Nalbantian and Schotter (1997) find that relative performance schemes outperform target-based schemes.

6
mazes in the same order to all subjects. The directions for each round and treatment are in the
Appendix.
The participants were paid a $13.00 show-up fee for participating in the experiment. In
Round 1 we paid each subject an additional 20 cents per maze solved to motivate effort. We
used the results under piece rates to identify their skill at solving mazes. At the end of Round 1,
we told subjects in half of the groups the scores of all group members in Round 1. Since
individuals knew their own score, this information allowed them to place themselves in the
distribution and assess their chances of ranking high or low in Round 2. We refer to this
treatment as “full information” because it gives subjects all the information that we have relevant
to assessing their chances of winning in the ensuing tournament. In the other half of the
experiments, we said nothing about how others performed, which we refer to as “no
information.” In all treatments, we announced the Round 2 prize structures after Round 1 was
complete.
In Round 2 subjects competed in a tournament with three incentive treatments, each of
which distributed $30 in total prizes to each group. Our equal prize treatment gave each
participant $5.00 regardless of their performance. The only incentive was thus the intrinsic
desire to solve mazes or to do well relative to others. Our single prize treatment gave $30 to the
top scorer and nothing to anyone else. In the multiple prize condition, we gave multiple
differentiated prizes. Out of the many ways to do this, we chose one that gave incentives to
persons in all parts of the distribution of maze-solving skill as reflected in their Round 1 maze
performances. We gave the first-prize winner $15, the second-prize winner $7, the third-prize
winner $5, the fourth-prize winner $2, and the fifth-prize winner $1. The experiment took
approximately 50 minutes. Mean total earnings, including the show-up fee, Round 1 earnings,
and Round 2 earnings, was $20.45.
We presented the exercise to the subjects in paper and pencil form. We asked subjects to
report the number of mazes they solved and told them that they had to solve them in the order
they were presented in the packet. Initially, we did not consider that subjects might cheat, say by
jumping over a line to complete a maze, or that some would misreport the mazes solved by
7
counting as completed mazes they solved after they had skipped one. When we checked the first
sets of maze packets, we found discrepancies between the number of mazes subjects reported
solving and the mazes that our rules would count as solved. We considered re-doing the
experiment in ways that would rule out such activity (for instance by using a computer maze
design) but realized that the potential for cheating serendipitously provides a second test of the
effect of incentives on cheating in a tournament that differs greatly from the type of evidence in
other experimental studies of cheating, such as studies on taxes.4 The fact that cheating arose
underscores the importance of examining its role in tournament settings and highlights a
sometimes neglected aspect of incentive pay – the fact that incentives not only increase the
reward to legitimate effort but also the reward to misreporting and cheating.
Incentives and Potential Behavior in the Experiment
The performance of individuals in maze-solving depends on their ability and the effort
they expend. The individual controls his or her effort. With total mazes solved in the group as
the measure of output, the relation between output and the prize structure in a tournament setting
depends on the distribution of participants’ abilities, their perceived probability that increased
effort will gain them a prize, and the prizes’ values. In the model of Edward Lazear and Sherwin
Rosen (1981), participants have equal ability and the optimal prize for winning mimics an
optimal piece rate. In the Moldovanu and Sela (2001) (M&S) model, participants have
heterogeneous ability levels.5 In this analysis, multiple prizes can lead to greater output than a
single prize because individuals with little chance of winning the single prize put in greater effort
when they can win the 2nd, 3rd, or nth prize. The most able person may be less motivated by the
presence of other prizes since the return to coming in first will be less than with a single prize but
less able contestants will be motivated by the rewards from doing better in the lower part of the
prize distribution. M&S show that with a sufficiently convex cost of effort function, total effort
is maximized in a setting with multiple prizes.6
4 Studies on cheating in taxes ask subjects to choose a level of cheating or shirking and explicitly state the reward or punishment scheme they will face; see James Alm, Gary McClelland, and William Schulze (1992).5 Vijay Krishna and John Morgan (1998) also study settings with multiple prizes.6 This is their Proposition 5, p. 549.

8
The information structure of the tournament should affect behavior as well. In the M&S
model, individuals know the distribution function from which abilities are drawn. This enables
those with high ability to assess their chances of winning. Assuming that individuals in the “no
information” conditions have correct priors over the distribution of ability, then the M&S
information setting mimics the “no information” condition. Our experiment has a stronger
information condition: In the full information case, individuals know the realized values of the
abilities of other contestants. This approximates an alternative and arguably more common set
of real-world conditions in which participants have a better idea of their potential for winning
than in the M&S model where they only know the distribution function from which competitors
are drawn. This should affect the perceived probability that a given individual will win a prize –
for instance, causing someone who is in a tournament with others with much higher Round 1
scores to put in low effort in the single prize condition as they perceive a low probability of
winning it.
II. Findings
Table 1 summarizes the means and standard deviations of subjects’ scores in each
treatment and both rounds of the experiment.7 Since we randomly assigned individuals to
treatments and gave the same Round 1 piece rate incentive to all subjects, Round 1 scores should
not differ noticeably among the groups. The Round 1 means show the different groups solved
similar numbers of mazes. F-tests and pair-wise two-tailed Mann-Whitney U-tests confirm that
there are no statistically different results in this round.8 The Round 2 means show noticeable
differences in scores among the treatment groups, which are significant by F-tests and pair-wise
two-tailed Mann-Whitney U-tests. In the full information treatment, mean prizes solved rises
7 We specified that the “mazes you solve that follow mazes you skipped will not be included in your total number of mazes,” but some participants ignored this instruction and proceeded to solve mazes after failing to solve one, perhaps intending to go back and solve that one later. Thus, one measure of output is the number of mazes that subjects completed even when some solved mazes followed unsolved mazes. A second measure of output is the number of mazes a subject solved prior to skipping a maze. The first measure provides a potentially better indicator of the effort induced by the treatment while the second follows our instructions. See Richard Freeman and Alexander Gelber (2006) for an analysis of the second measure, as well as an analysis of the number of mazes solved in the second round, as reported by the subjects. We obtain similar results to those reported in this paper, which uses the number of mazes that subjects completed even when some solved mazes followed unsolved mazes. We exclude misreported mazes from the totals and examine them in section III.8 For all three possible pairs of conditions, the pairwise test shows p > 0.40.
9
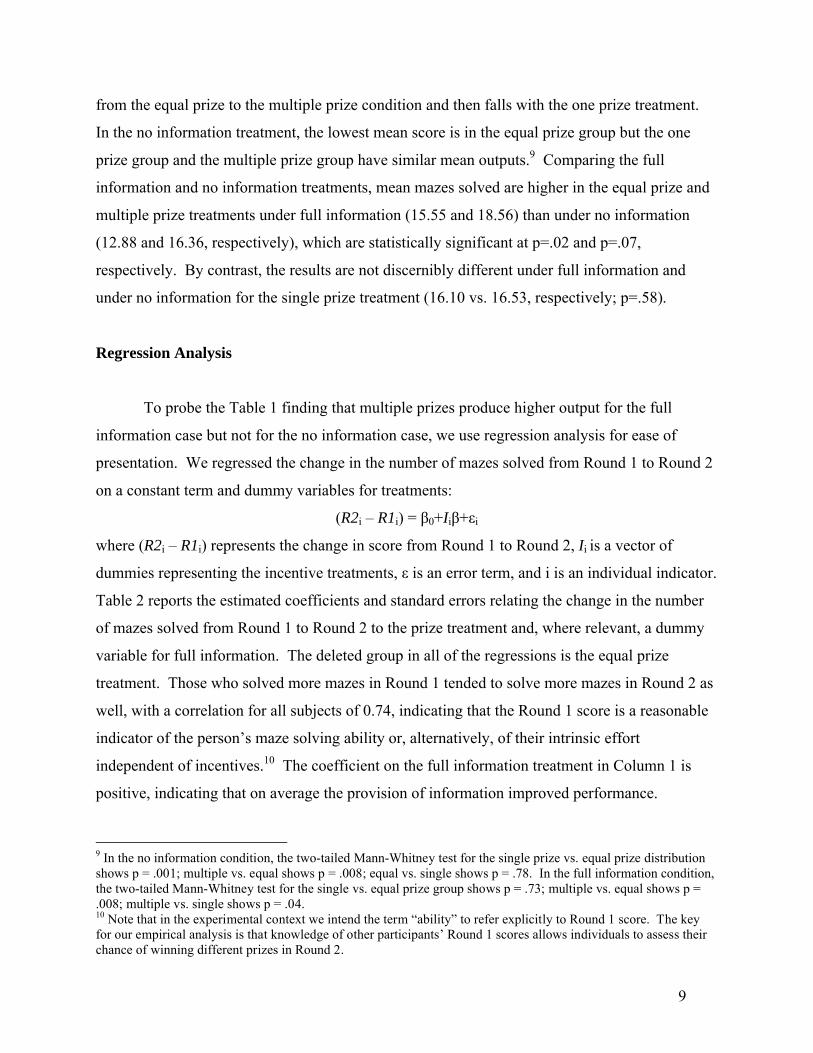
from the equal prize to the multiple prize condition and then falls with the one prize treatment.
In the no information treatment, the lowest mean score is in the equal prize group but the one
prize group and the multiple prize group have similar mean outputs.9 Comparing the full
information and no information treatments, mean mazes solved are higher in the equal prize and
multiple prize treatments under full information (15.55 and 18.56) than under no information
(12.88 and 16.36, respectively), which are statistically significant at p=.02 and p=.07,
respectively. By contrast, the results are not discernibly different under full information and
under no information for the single prize treatment (16.10 vs. 16.53, respectively; p=.58).
Regression Analysis
To probe the Table 1 finding that multiple prizes produce higher output for the full
information case but not for the no information case, we use regression analysis for ease of
presentation. We regressed the change in the number of mazes solved from Round 1 to Round 2
on a constant term and dummy variables for treatments:
(R2i – R1i) = β0+Iiβ+εi
where (R2i – R1i) represents the change in score from Round 1 to Round 2, Ii is a vector of
dummies representing the incentive treatments, ε is an error term, and i is an individual indicator.
Table 2 reports the estimated coefficients and standard errors relating the change in the number
of mazes solved from Round 1 to Round 2 to the prize treatment and, where relevant, a dummy
variable for full information. The deleted group in all of the regressions is the equal prize
treatment. Those who solved more mazes in Round 1 tended to solve more mazes in Round 2 as
well, with a correlation for all subjects of 0.74, indicating that the Round 1 score is a reasonable
indicator of the person’s maze solving ability or, alternatively, of their intrinsic effort
independent of incentives.10 The coefficient on the full information treatment in Column 1 is
positive, indicating that on average the provision of information improved performance.
9 In the no information condition, the two-tailed Mann-Whitney test for the single prize vs. equal prize distribution shows p = .001; multiple vs. equal shows p = .008; equal vs. single shows p = .78. In the full information condition, the two-tailed Mann-Whitney test for the single vs. equal prize group shows p = .73; multiple vs. equal shows p = .008; multiple vs. single shows p = .04.10 Note that in the experimental context we intend the term “ability” to refer explicitly to Round 1 score. The key for our empirical analysis is that knowledge of other participants’ Round 1 scores allows individuals to assess their chance of winning different prizes in Round 2.

10
The key result from the Table 2 regressions is that output is highest under the multiple
prize condition. The regression coefficients in Column 1 for all treatments show a strong
difference among the incentive treatments: the mazes solved by the equal prize group are
substantially less than those solved by subjects in the other two treatments, and the multiple prize
group has a higher number of mazes solved than the single prize group. When the sample is
divided by information treatment in Columns 2 and 3, the difference in coefficients between the
multiple prize and single prize treatment dummies is larger in the full information case (a
difference of 1.81 in Column 3) than in the no information case (a difference of 0.24 in Column
2).11 This suggests that the prediction in the M&S model that multiple prizes maximize output is
stronger under full information, as opposed to the setting that they explored that did not examine
the effect of the provision of such information.
To probe the robustness of this result, we investigated other specifications. We had data
on the gender of subjects and added a female dummy variable to the regression, with little impact
on the other coefficients.12 We regressed Round 2 score on Round 1 score and the treatments.
We entered the square of Round 1 score along with Round 1 score in the regressions. We
excluded from the analysis data from those groups in which at least one person misreported a
maze in Round 1. We introduced the Round 1 score of the highest-scoring person in the group
as an independent variable on the hypothesis that this could affect performances in the full
information condition. We aggregated the mazes solved to the group level and regressed the
change in total mazes solves each group from Round 1 to Round 2 on the treatment dummies.
As an alternative specification, we calculated changes in the mean number of mazes solved from
Round 1 to Round 2 for each of the treatments and used this as the dependent variable. We
investigated gender differences by estimating the models in Table 2 with the addition of a gender
11 When we replicate Table 2 but with the multiple prize dummy as the omitted category , we find the following: the dependent variable is significantly lower in the equal prize condition than the multiple prize condition (p<.001) when pooling both information settings and controlling for the dummy for the full information setting; output is insignificantly lower in the single prize condition than the multiple prize condition (p = .14) in this setting; in the no information setting, output is significantly lower in the equal prize condition than the multiple prize condition (p<.001) and insignificantly lower in the single prize condition than the multiple prize condition (p > .40); in the full information setting, output is significantly lower in the equal prize condition than the multiple prize condition (p<.001) and barely insignificantly lower in the single prize condition than the multiple prize condition (p = .10).12 Gneezy, Niederle and Rustichini’s (2003) findings suggest that women may perform differently in tournaments than men.

11
dummy and the interaction of that dummy with each of the five incentive treatments. None of
the interactions was significant at the 5% level.13
Unpacking the results
At the heart of the analysis linking outcomes to incentive treatments is the notion that
different prize structures should affect individuals differently depending on their maze-solving
skills, assuming they are aware of their skills relative to others in the tournament. We investigate
the impact of treatments on individuals in different positions in the maze-solving ability
distribution by dividing the sample into those in the upper half of the distribution of mazes
solved in Round 1 in the group in which they participated and those in the lower half of the
group.
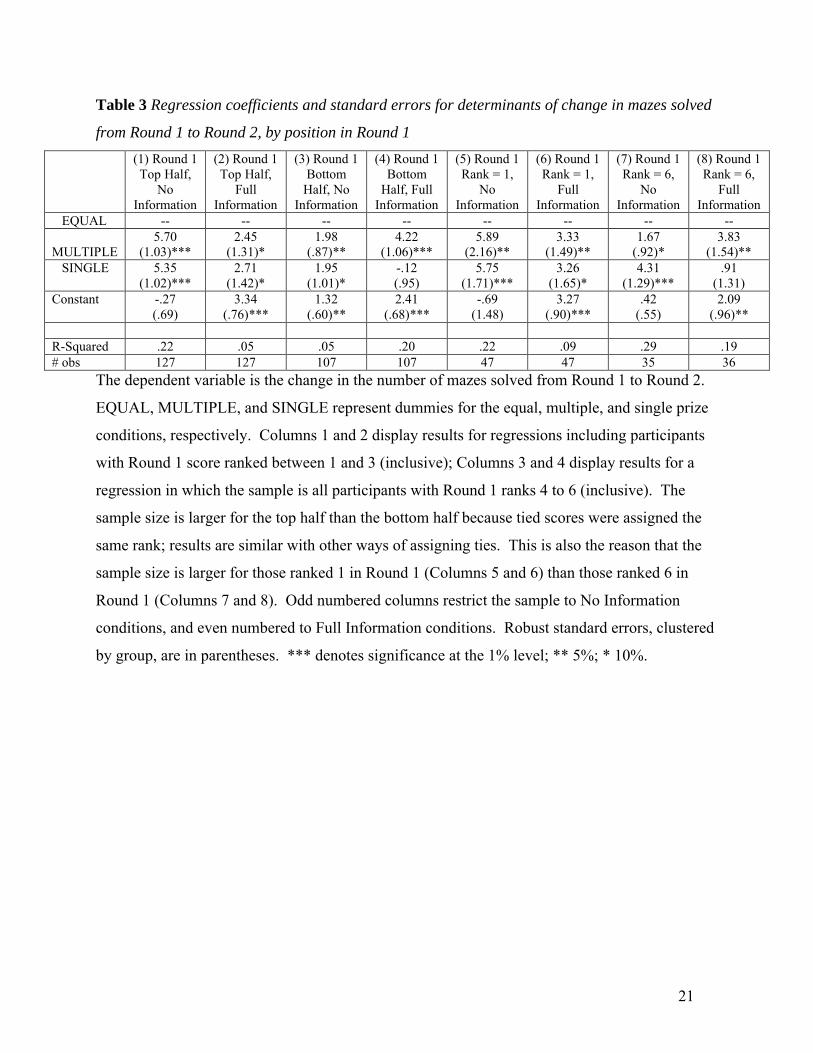
Table 3 shows the estimated regression coefficients and standard errors from this
analysis. The coefficients under the columns labeled top half and bottom half of the Round 1
distribution show different effects of the treatments. Under full information in the bottom half,
the single prize treatment is associated with a substantially smaller coefficient than the multiple
prize treatment (-.12 and 4.22, respectively). By contrast, in the top half under full information,
there is a slightly larger coefficient on the single prize treatment than on the multiple prize
treatment (2.71 and 2.45, respectively). Knowledge of their low chance of winning the single
prize seemingly discouraged people in the lower half of the distribution while encouraging those
in the upper half. As a result, the maximum associated with the multiple prize condition is
pronounced for the bottom half of the distribution but absent from the top half of the distribution.
The results for the no information treatment are different. Individuals in the top half of
the distribution score more under both single prize and multiple prize incentives than individuals
in the equal prize group. There is little evidence of a maximum under multiple prizes in the
bottom half of the distribution as the score for the multiple prize treatment somewhat exceeds
that for the equal prize and just exceeds that for the single prize treatment. Provision of
13 See the online appendix. The same robustness checks also did not materially affect the Table 3 and Table 4 results.

12
information has its biggest effect on individuals in the bottom half of the Round 1 distribution of
maze-solving scores. Knowledge that they have little chance of winning a single large prize
appears to discourage them.
One other pattern in the data requires explanation. This is the higher scores of subjects in
the full information equal prize group compared to the scores of subjects in the no information
equal prize (deleted) group. The unadjusted mean differences in Table 1 are significantly
different in the two conditions, and a regression controlling for Round 1 score also shows a
significant difference. Since subjects gained no money from solving more mazes in the equal
prize treatment, pecuniary incentives cannot account for this result. One possible explanation is
that individuals at the low end realized they could do better in the full information treatment and
tried harder due to intrinsic competitive motivation. Niederle and Vesterlund’s (2007) finding
that men respond more competitively to tournaments than women is consistent with the
hypothesis that men are more subject to an intrinsic motivation effect. Looking at our data by
gender, we find a pattern consistent with this hypothesis: in the equal prize treatment men raised
their scores more in the full information case than did women. In the equal prize treatment the
mean Round 1 to Round 2 gain in scores was 2.16 more in full information than in no
information for men, whereas it was 1.30 more for women (p<.05).
As a final check on the differential response to the treatments of subjects in different
positions in the maze-scoring distribution, we report in Columns 5 through 8 of Table 3 the
coefficients on treatments for the person who scored highest in their group in Round 1 and the
person who scored lowest in their group in Round 1. In both the full information and no
information cases, the individuals who did best in Round 1 increased their scores more in the
multiple prize and single prize treatment than in the equal prize treatment, while those who did
worst in Round 1 improved their scores most in the full information multiple prize treatment.
Comparing the difference in scores between full information and no information, those with high
scores increased their scores from the no information to the full information treatment by the
greatest amount in the equal prize case and the smallest amount in the multiple prize case. By
contrast, the lowest scoring subjects in Round 1 increased their scores most from no to full
information in the multiple prize treatment, presumably because they realized that they had a

13
chance to win some reward from greater effort. By contrast, they reduced their scores from the
no information to the full information treatments in the single prize treatment, presumably
because they realized they had little chance to win the single prize.14
III. Incentives and Misreporting/Cheating
By asking subjects to solve paper mazes where the subjects draw lines from the
beginning of the maze to the end with a pencil, we created another test of how incentives affect
behavior by opening the door for misreporting or cheating.15 Our instructions told subjects to
solve the mazes in the order that they appeared in their packets and that "any mazes you solve
that follow a maze you skipped will not be counted in your total number of mazes...." We also
told subjects that "solving a maze means drawing a continuous line from the place marked 'Start'
to the place marked 'Finish,' without crossing any of the walls of the maze with your line."
Finally, we asked subjects to report the number of mazes they solved according to those rules.
Reviewing the packets of solved mazes after the first set of experiments, we discovered
that subjects sometimes reported more mazes solved than met our rules. The vast majority of
misreporting consisted of subjects starting a maze but not finishing it, then moving on to
subsequent mazes in their maze packet, and reporting the subsequent mazes in their total number
solved. There were three other less frequent forms of misreporting. Some subjects completely
skipped a maze, yet reported subsequent mazes they solved in the number solved; some subjects
crossed one of the walls of a maze with a line, yet counted this maze among the total number
they solved; and some subjects reported a different total number solved than the total they
actually solved. The results we report include all four types of cheating, but all types of cheating
show similar patterns across treatments.16
14 In some situations, the top score from a group may matter rather than the sum of all the scores. Using a group’s top score to measure output, we still find that multiple prizes produce the greatest output, though the difference between multiple prizes and the single prize is smaller than in the comparable regression in Table 3. In other situations, the performance of the lower scoring individual may matter most. Under full information, the multiple prize condition gives markedly higher results than the other treatments, due to the incentives that multiple prizes give in the lowest part of the distribution. See Freeman and Gelber (2006).15 Breaking the rules of a maze solving experiment is not possible when subjects solve mazes on the computer, as in previous literature. 16 Some of the misreporting may have represented unintentional mistakes, but the empirical results show that misreporting varies strongly with incentives, and this cannot be reconciled with random mistakes. With random

14
The final two columns of Table 1 present summary statistics on the frequency of such
misreporting. In Round 1, the largest number of misreports occurred under the full information
multiple prize treatment. But F- or chi-squared tests of the effect of the treatments show no
statistically significant difference among the groups in this round. By contrast, the means for
Round 2 show that misreporting is higher in the full information treatment than in the no
information treatment (p=.006). This is presumably because people in full information have a
better idea of how they might improve their chances of gaining a prize by misreporting. In both
the full information case and the no information case, the mean number of misreports is several
times larger in the multiple prize and single prize treatments compared with the equal prize
treatment. In both the full information and no information setting, the largest number of
misreports is associated with the multiple prize condition. Thus incentives seem to work in a
similar way in misreporting as well as they do in genuine maze solving.
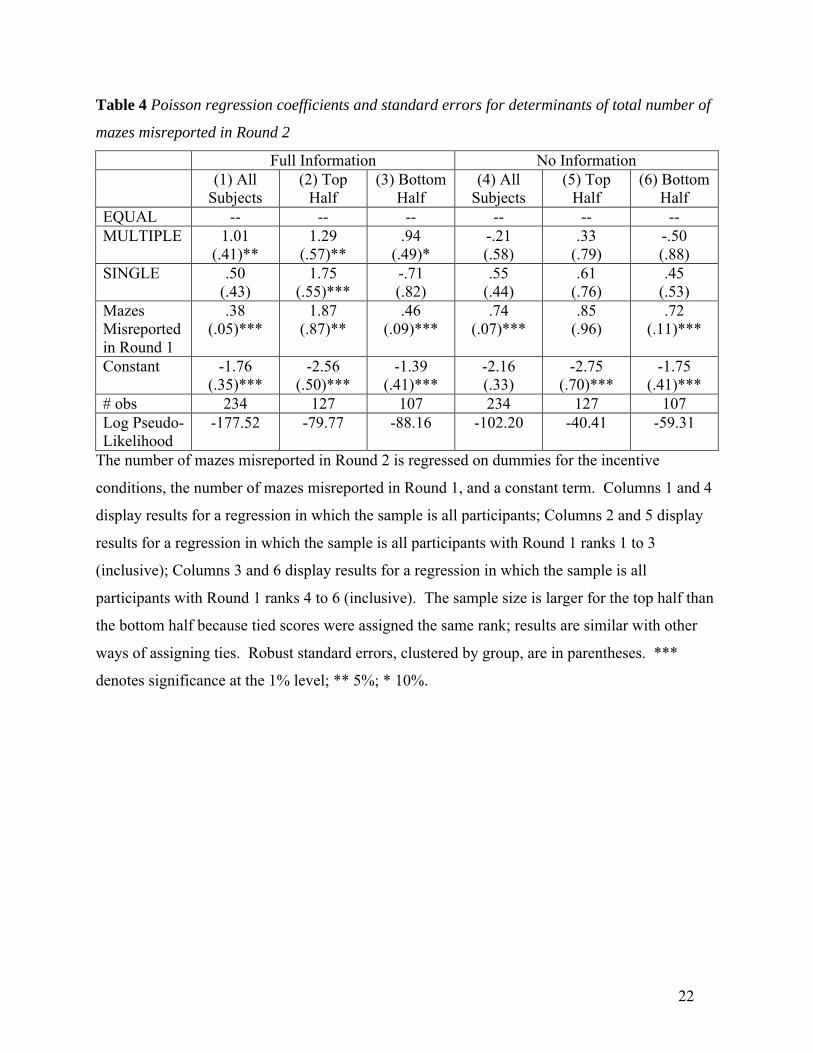
Table 4 presents the coefficients and standard errors from a Poisson regression in which
the dependent variable is the number of misreports in Round 2. We use the Poisson model
because misreports are a relatively infrequent event.17 In the full information case, the
regressions show that misreporting is greatest in the multiple prize setting, second-highest in the
single prize setting, and lowest in the equal prize condition (Column 1). Looking at behavior
among subjects in the upper and lower halves of the distribution of maze-solving in Round 1, the
regression coefficients in Columns 2 and 3 show that this result is due to much higher
misreporting by individuals in the multiple and single prize treatments than those in the equal
prize treatment for those at upper half of the distribution and a low number of misreports among
individuals in the single prize treatment in the bottom half of the distribution. When a lot of prize
money is at stake and participants know that they have a chance of winning, they are more likely
mistakes we would expect to find occasional under-reporting, but we did not find under-reporting. Moreover, it seems reasonable that if one starts a maze, does not finish it, but reports this maze as solved in one’s total number of mazes, then this is intentional. When we limit the measure of cheating to only those misreports that involved this form of misreporting, we find similar patterns to those reported. 17 Negative binomial regressions show similar results to the Poisson regressions. A linear model shows differences among the treatments with similar magnitudes to those implied by the unadjusted differences shown in Table 1. Adding individuals’ Round 1 score to the model does not appreciably change the results. Since the Poisson specification involves maximizing a non-linear likelihood function, we would face an incidental parameters problem if we first-differenced the dependent variable as in Tables 2 and 3. Thus we control for Round 1 fudges as an independent variable.
15
to cheat to win it. By contrast, there are no statistically significant differences in misreporting in
the no information treatment. Moreover, the percentage difference in cheating across treatments
is greater than the percentage differences across treatments in output.18
IV. Conclusion
This paper has examined the impact of tournament prize structure and provision of
information about individuals’ skill. The first round of the experiment gave all participants the
same piece rate incentive. The second round varied the incentives and information about the
number of mazes solved by participants in the pre-tournament round. The experiment found that
multiple prizes elicited more effort than a single prize or equal prizes. It is worth noting that the
most unequal compensation system—giving only one large prize—did not always maximize
aggregate effort. Nor did the most equal system, giving multiple prizes of equal value. In the
full information setting, it was a tournament prize structure in between these two extremes,
giving relatively strong incentives to individuals throughout the distribution of ability, that
maximized aggregate effort. This finding is consistent with the spirit of Moldovanu and Sela’s
(2001) analysis that multiple prizes maximize total effort. The evidence that the multiple prize
effect is stronger under full information than under no information goes beyond their model
because our full information treatment gives individuals information about the realized abilities
of their competitors.
The results were strongest for individuals in the bottom half of the distribution, where
output fell in the single prize treatment relative to the multiple prize treatment. When individuals
are aware of their ability relative to others, a single large prize does not motivate those at the
bottom of the ability distribution, who have little chance of winning it. They put forth more
effort when they have a better chance to win more in a multiple prize setting. This suggests that
theories of tournament behavior should focus more on the provision of information than they
currently do. Our results suggest that under some prize structures it may benefit an employer or
tournament creator to provide full information about performance while in other cases it may
18 This is consistent with Jacob and Levitt (2003), who find that cheating is extremely sensitive to the incentives to cheat.

16
not. The evidence that participants solved more mazes in the full information no inequality
treatment than in the no information no inequality treatment suggests that behavior is affected by
intrinsic motivation or some other psychological factor not typically examined in incentive
models. This points to potentially fruitful lines of further theoretical and empirical work.
Finally, our experimental design offers a new way to detect cheating without alerting
participants to the fact that their cheating will be examined by the experimenters. The finding
that the information and incentive structure affected cheating in a similar manner to output raises
important issues about analyses of incentive pay. The importance of cheating in our experiment
suggests the need to model multi-task moral hazard or other features of cheating in a tournament
setting. Economic analyses of executive compensation, in particular, have typically not focused
on the possibility that incentives not only motivate productive effort but also motivate cheating
of various forms. It has not escaped our notice that the cheating behavior uncovered in our
experiment has parallels in the behavior that contributed to the financial meltdown of Wall Street
of 2008. That relatively modest incentives generated as much misreporting as we uncovered
raises important questions about the responsiveness of misreporting and cheating to the much
larger stakes outside the laboratory. Tournament models that put greater stress on the dual effect
of incentives may offer greater guidance to firms and policy-makers concerned by the possible
impact of compensation structure on malfeasance.

17
References
Alm, James, Gary McClelland, and William Schulze. 1992. “Why do People Pay Taxes?”
Journal of Public Economics, 48(1): 21-36.
Bandiera, Oriana, Iwan Barankay, and Imran Rasul. 2005. “Social Preferences and the
Response to Incentives: Evidence from Personnel Data.” Quarterly Journal of
Economics, 120 (3): 917-962.
Bull, Clive, Andrew Schotter, and Keith Weigelt. 1987. “Tournaments and Piece Rates: An
Experimental Study.” Journal of Political Economy, 95(1): 1-33.
Ehrenberg, Ronald, and Michael Bognanno. 1990. “Do Tournaments Have Incentive
Effects?” Journal of Political Economy, 98(6): 1307-1324.
Tor Eriksson, Anders Poulsen, and Marie-Claire Villeval. 2008. “Feedback andIncentives:
Experimental Evidence.” IZA Discussion Paper No. 3440.
Freeman, Richard, and Alexander Gelber. 2006. “Optimal Inequality/Optimal Incentives:
Evidence from a Tournament.” NBER Working Paper 12588.
Gneezy, Uri, and Aldo Rustichini. 2000. “Pay enough or don’t pay at all.” Quarterly Journal
of Economics, 115(2): 791-810.
Gneezy, Uri, Muriel Niederle, and Aldo Rustichini. 2003. “Performance in Competitive
Environments: Gender Differences.” Quarterly Journal of Economics, 118(3): 1049-
1074.
Holmstrom, Bengt and Paul Milgrom. 1991. “Multi-Task Principal-Agent Analyses: Incentive
Contracts, Asset Ownership and Job Design.” Journal of Law, Economics &
Organization 7: 24-52.

18
Jacob, Brian, and Steven Levitt. 2003. “Rotten Apples: An investigation of the Prevalence and
Predictors of Teacher Cheating.” Quarterly Journal of Economics, 118(3): 843-877.
Krishna, Vijay and John Morgan. 1998. “The Winner-Take-All Principle in Small
Tournaments.” Advances in Applied Microeconomics, 1998(7): 841-64.
Lazear, Edward and Sherwin Rosen. 1981. “Rank Order Tournaments as Optimum Labor
Contracts.” Journal of Political Economy, 89(5): 841-64.
Moldovanu, Benny and Aner Sela. 2001. “The Optimal Allocation of Prizes in Contests.”
American Economic Review, 91(3): 542-558.
Moldovanu, Benny, Aner Sela, and Xianwen Shi. 2007. “Contests for Status.” Journal of Political Economy, 115(2): 338-363.
Müller, Weiland and Andrew Schotter. 2004. “Workaholics and Dropouts in Optimal
Organizations.” New York University working paper.
Nalbantian, Haig and Andrew Schotter. 1997. “Productivity Under Group Incentives: An
Experimental Study.” American Economic Review, 87(3): 314-340.
Niederle, Muriel, and Lise Vesterlund. 2007. “Do Women Shy away from Competition? Do
Men Compete too Much?” Quarterly Journal of Economics 122(3): 1067-1101.
Phillips, Dave. 1988. Space Age Mazes. New York, NY: Dover.
Phillips, Dave. 1988. Animal Mazes. New York, NY: Dover.

19
Table 1 Means and standard deviations of individuals’ mazes solved and mazes misreported, by
treatment
Treatment Mean (SD) Mazes Solved Mean (SD) Mazes Misreported
Full Information (1) Round 1 (2) Round 2 (3) Round 1 (4) Round 2 Equal prize 12.65
(4.86)15.55 (7.08)
.09 (.33)
.18 (.58)
Multiple prize 12.40(4.44)
18.56(6.87)
.13 (.54)
.51 (1.44)
Single prize 11.74(5.24)
16.10(7.88)
.19 (1.20)
.46 (1.15)
No Information Equal prize 12.46
(4.68)12.88(5.62)
.09 (.33)
.13 (.49)
Multiple prize 11.91 (5.27)
16.36(7.89)
.17 (.84)
.32 (1.62)
Single prize 12.31(5.05)
16.53 (7.38)
.12 (.39)
.23 (.68)
Source: Tabulated from the experiment described in text. The sample size is 78 subjects for each
of the six treatments shown, and 468 subjects total.

20
Table 2 Regression coefficients and standard errors for determinants of change in mazes solved
from Round 1 to Round 2
(1) All Participants
(2) No Info
(3) Full Info
EQUAL -- -- --MULTIPLE 3.65
(.61)*** 4.03
(.79)***3.27
(.93)***SINGLE 2.63
(.60)***3.79
(.74)***1.46 (.89)
FULL INFO 1.44 (.52)***
Constant .94 (.45)**
.42(.51)
2.90 (.50)***
R-squared .11 .14 .07N 468 234 234
The dependent variable is the change in the number of mazes solved from Round 1 to Round 2.
EQUAL, MULTIPLE, and SINGLE represent dummies for the equal, multiple, and single prize
conditions, respectively; FULL INFO represents a dummy for full information conditions.
Robust standard errors, clustered by group, are in parentheses. *** denotes significance at the
1% level; ** 5%; * 10%.
21
Table 3 Regression coefficients and standard errors for determinants of change in mazes solved
from Round 1 to Round 2, by position in Round 1
(1) Round 1 Top Half,
No Information
(2) Round 1 Top Half,
Full Information
(3) Round 1 Bottom
Half, No Information
(4) Round 1 Bottom
Half, Full Information
(5) Round 1 Rank = 1,
No Information
(6) Round 1 Rank = 1,
Full Information
(7) Round 1 Rank = 6,
No Information
(8) Round 1 Rank = 6,
Full Information
EQUAL -- -- -- -- -- -- -- -- MULTIPLE
5.70 (1.03)***
2.45(1.31)*
1.98(.87)**
4.22(1.06)***
5.89(2.16)**
3.33(1.49)**
1.67(.92)*
3.83(1.54)**
SINGLE 5.35 (1.02)***
2.71(1.42)*
1.95(1.01)*
-.12(.95)
5.75(1.71)***
3.26(1.65)*
4.31(1.29)***
.91(1.31)
Constant -.27 (.69)
3.34(.76)***
1.32(.60)**
2.41(.68)***
-.69(1.48)
3.27(.90)***
.42(.55)
2.09(.96)**
R-Squared .22 .05 .05 .20 .22 .09 .29 .19# obs 127 127 107 107 47 47 35 36
The dependent variable is the change in the number of mazes solved from Round 1 to Round 2.
EQUAL, MULTIPLE, and SINGLE represent dummies for the equal, multiple, and single prize
conditions, respectively. Columns 1 and 2 display results for regressions including participants
with Round 1 score ranked between 1 and 3 (inclusive); Columns 3 and 4 display results for a
regression in which the sample is all participants with Round 1 ranks 4 to 6 (inclusive). The
sample size is larger for the top half than the bottom half because tied scores were assigned the
same rank; results are similar with other ways of assigning ties. This is also the reason that the
sample size is larger for those ranked 1 in Round 1 (Columns 5 and 6) than those ranked 6 in
Round 1 (Columns 7 and 8). Odd numbered columns restrict the sample to No Information
conditions, and even numbered to Full Information conditions. Robust standard errors, clustered
by group, are in parentheses. *** denotes significance at the 1% level; ** 5%; * 10%.
22
Table 4 Poisson regression coefficients and standard errors for determinants of total number of
mazes misreported in Round 2
Full Information No Information(1) All
Subjects(2) Top
Half(3) Bottom
Half(4) All
Subjects(5) Top
Half(6) Bottom
HalfEQUAL -- -- -- -- -- --MULTIPLE 1.01
(.41)** 1.29
(.57)**.94
(.49)*-.21 (.58)
.33 (.79)
-.50 (.88)
SINGLE .50(.43)
1.75 (.55)***
-.71 (.82)
.55 (.44)
.61 (.76)
.45 (.53)
Mazes Misreported in Round 1
.38(.05)***
1.87 (.87)**
.46 (.09)***
.74 (.07)***
.85 (.96)
.72 (.11)***
Constant -1.76(.35)***
-2.56 (.50)***
-1.39 (.41)***
-2.16 (.33)
-2.75 (.70)***
-1.75 (.41)***
# obs 234 127 107 234 127 107Log Pseudo-Likelihood
-177.52 -79.77 -88.16 -102.20 -40.41 -59.31
The number of mazes misreported in Round 2 is regressed on dummies for the incentive
conditions, the number of mazes misreported in Round 1, and a constant term. Columns 1 and 4
display results for a regression in which the sample is all participants; Columns 2 and 5 display
results for a regression in which the sample is all participants with Round 1 ranks 1 to 3
(inclusive); Columns 3 and 6 display results for a regression in which the sample is all
participants with Round 1 ranks 4 to 6 (inclusive). The sample size is larger for the top half than
the bottom half because tied scores were assigned the same rank; results are similar with other
ways of assigning ties. Robust standard errors, clustered by group, are in parentheses. ***
denotes significance at the 1% level; ** 5%; * 10%.
23
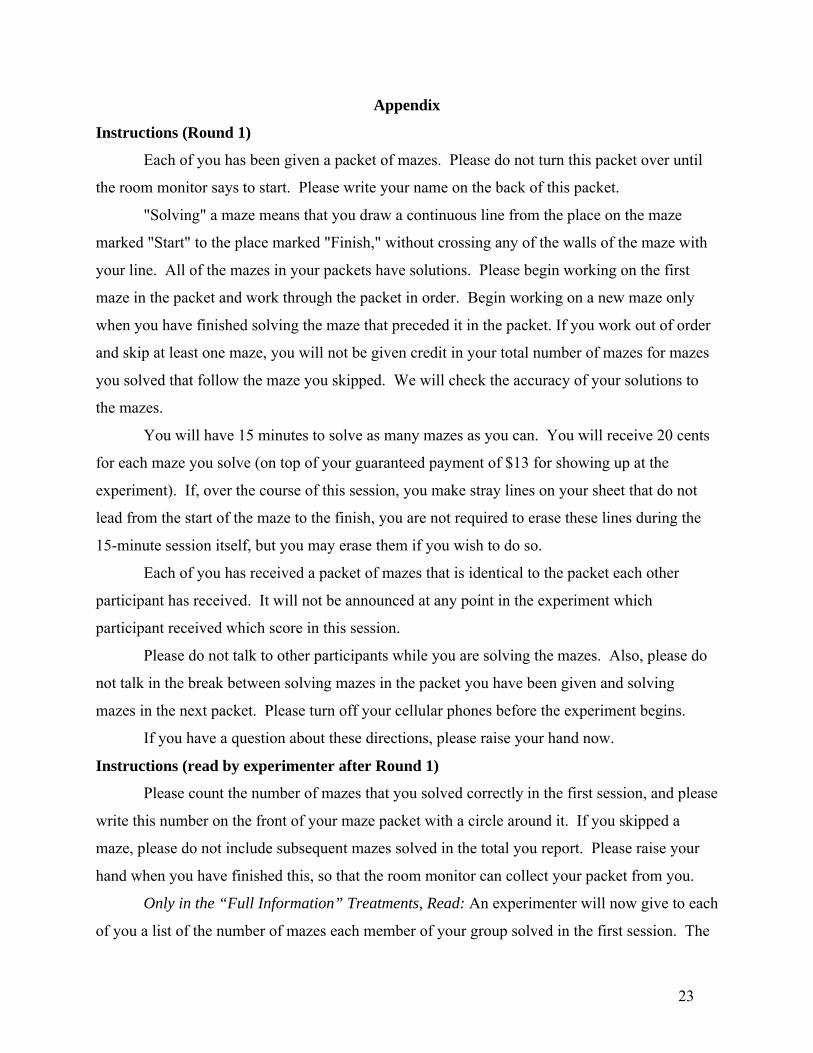
Appendix
Instructions (Round 1)
Each of you has been given a packet of mazes. Please do not turn this packet over until
the room monitor says to start. Please write your name on the back of this packet.
"Solving" a maze means that you draw a continuous line from the place on the maze
marked "Start" to the place marked "Finish," without crossing any of the walls of the maze with
your line. All of the mazes in your packets have solutions. Please begin working on the first
maze in the packet and work through the packet in order. Begin working on a new maze only
when you have finished solving the maze that preceded it in the packet. If you work out of order
and skip at least one maze, you will not be given credit in your total number of mazes for mazes
you solved that follow the maze you skipped. We will check the accuracy of your solutions to
the mazes.
You will have 15 minutes to solve as many mazes as you can. You will receive 20 cents
for each maze you solve (on top of your guaranteed payment of $13 for showing up at the
experiment). If, over the course of this session, you make stray lines on your sheet that do not
lead from the start of the maze to the finish, you are not required to erase these lines during the
15-minute session itself, but you may erase them if you wish to do so.
Each of you has received a packet of mazes that is identical to the packet each other
participant has received. It will not be announced at any point in the experiment which
participant received which score in this session.
Please do not talk to other participants while you are solving the mazes. Also, please do
not talk in the break between solving mazes in the packet you have been given and solving
mazes in the next packet. Please turn off your cellular phones before the experiment begins.
If you have a question about these directions, please raise your hand now.
Instructions (read by experimenter after Round 1)
Please count the number of mazes that you solved correctly in the first session, and please
write this number on the front of your maze packet with a circle around it. If you skipped a
maze, please do not include subsequent mazes solved in the total you report. Please raise your
hand when you have finished this, so that the room monitor can collect your packet from you.
Only in the “Full Information” Treatments, Read: An experimenter will now give to each
of you a list of the number of mazes each member of your group solved in the first session. The

24
number that you solved has been circled, and the numbers that the other members of your group
solved have not been circled.
Instructions (Round 2)
Each of you has been given a second packet of mazes. Please write your name on the
back of this packet. Please do not turn this packet over and begin working on it until the room
monitor says to start.
"Solving" a maze means that you draw a continuous line from the place on the maze
marked "Start" to the place marked "Finish," without crossing any of the walls of the maze with
your line. All of the mazes in your packets have solutions. Please begin working on the first
maze in the packet and work through the packet in order. Begin working on a new maze only
when you have finished solving the maze that preceded it in the packet. If you work out of order
and skip at least one maze, you will not be given credit in your total number of mazes for mazes
you solved that follow the maze you skipped. We will check the accuracy of your solutions to
the mazes.
You will have 15 minutes to solve mazes in your packet.
For “Equal prize” Treatments, read:
In this session, which is the final session of the experiment, you will receive $5,
regardless of how many mazes you solve.
For “Multiple Prize” Treatments, read:
In this session, which is the final session of the experiment, you will be paid based on
how many mazes you solve, in comparison with how many mazes the other participants solve. If
you solve the most mazes in this session out of the members of this group, you will receive $15,
in addition to your show-up fee, plus what you earned in the first session. If you solve the
second-most mazes in this session out of the members of this group, you will receive $7, in
addition to your show-up fee, plus what you earned in the first session. If you solve the third-
most mazes in this session out of the members of this group, you will receive $5, in addition to
your show-up fee, plus what you earned in the first session. If you solve the fourth-most mazes
in this session out of the members of this group, you will receive $2, in addition to your show-up
fee, plus what you earned in the first session. If you solve the fifth-most mazes in this session
out of the members of this group, you will receive $1, in addition to your show-up fee, plus what
you earned in the first session. If you solve the sixth-most mazes in this session out of the

25
members of this group, you will receive only your show-up fee, plus what you earned in the first
session.
Your payment from this session (the second session) will be based only on how many
mazes you solve in the second session. The number you solved in the first session is irrelevant
to the payment you receive in this session.
For “Single Prize” Treatments, read:
You will have 15 minutes to solve mazes in your packet. In this session, which is the
final session of the experiment, you will be paid based on how many mazes you solve, in
comparison with how many mazes the other participants solve. If you solve the most mazes in
this session out of the members of this group, you will receive $30, in addition to your show-up
fee, plus what you earned in the first session. Everyone else will receive only their show-up fee,
plus what they earned in the previous session.
Your payment from this session (the second session) will be based only on how many
mazes you solve in the second session. The number you solved in the first session is irrelevant
to the payment you receive in this session.
In all treatments, read:
Each of you has received a packet of mazes that is identical to the packet each other
participant has received. It will not be announced at any point in the experiment which
participant received which score in this session. Please do not talk while you are solving the
mazes.
If you have a question about these directions, please raise your hand now.

Online Appendix to “Prize Structure and Information in Tournaments: Experimental Evidence”
Appendix Table 1 Regression coefficients and standard errors for determinants of mazes solved in Round 2
(1) No Info
(2) Full Info
(3) No Info
(4) Full Info
EQUAL -- -- -- --MULTIPLE 4.06
(.80)***3.30
(.90)***4.11
(.81)***3.31
(.90)***SINGLE 3.80
(.75)***1.58
(.91)*3.84
(.76)**1.57
(.93)*Round 1 Score
1.06 (.06)***
1.13 (.05)***
1.28 (.22)***
1.07 (.18)***
Round 1 Score Squared
-.01 (.01)
.002 (.006)
Constant -.33 (.75)
1.23 (.76)
-1.53 (1.24)
1.58 (1.16)
R-squared .59 .58 .60 .58N 234 234 234 234
The dependent variable is the number of mazes solved in Round 2. EQUAL,
MULTIPLE, and SINGLE represent dummies for the equal, multiple, and single prize
conditions, respectively. “Round 1 score” is the total number of mazes an individual
solved in Round 1. Robust standard errors, clustered by group, are in parentheses. ***
denotes significance at the 1% level; ** 5%; * 10%.

Appendix Table 2 Regression coefficients and standard errors for determinants of change in mazes solved from Round 1 to Round 2
The dependent variable is the change in the number of mazes solved from Round 1 to
Round 2. EQUAL, MULTIPLE, and SINGLE represent dummies for the equal, multiple,
and single prize conditions, respectively. “Female” is a dummy that equals 1 if the
participant is female, 0 otherwise. Robust standard errors, clustered by group, are in
parentheses. *** denotes significance at the 1% level; ** 5%; * 10%.
(1) No Info
(2) Full Info
(3) No Info
(4) Full Info
EQUAL -- -- -- --MULTIPLE 4.05
(.79)***3.09
(.97)***4.66
(1.21)***2.33
(1.01)**SINGLE 3.90
(.77)***1.44 (.87)
4.02 (1.32)***
.51 (1.16)
MULTIPLE*Female
-1.05 (1.61)
1.37 (1.42)
SINGLE* Female
-.23 (1.90)
1.60 (1.57)
Female -1.59 (.71)**
-1.30 (.68)*
-1.16 (1.29)
-2.29 (.71)***
Constant 1.34 (.64)**
3.66 (.59)***
1.09 (.85)
4.25 (.51)***
R-squared .16 .09 .17 .09N 234 234 234 234

Appendix Table 3 Regression coefficients and standard errors for determinants of change in mazes solved from Round 1 to Round 2
The dependent variable is the change in the number of mazes solved from Round 1 to
Round 2. EQUAL, MULTIPLE, and SINGLE represent dummies for the equal, multiple,
and single prize conditions, respectively. Columns 1 and 2 show regressions for groups
that did not include any cheating in Round 1. Using the same sample as Table 2 of the
main text, scores are summed within each group and regressed on the treatment dummies
in columns 3 and 4. Columns 5 and 6 use the same sample as Table 2 of the main text
but add the highest Round 1 score in the group as a regressor. Robust standard errors are
in parentheses. The standard errors are clustered at the group level in columns 1, 2, 5 and
6. *** denotes significance at the 1% level; ** 5%; * 10%.
(1) No Info
(2) Full Info
(3) No Info
(4) Full Info
(5) No Info
(6) Full Info
EQUAL -- -- -- -- -- --MULTIPLE 3.69
(.91)***3.55
(1.23)***24.15
(4.78)***19.62
(5.94)***4.06
(.85)***3.20
(.96)***SINGLE 3.81
(.82)***.43
(1.08)22.77
(4.78)***8.77
(5.94)3.82
(.78)***1.31 (.88)
Round 1 Highest Score
-.02 (.10)
-.09 (.09)
Constant .55 (.58)
3.33 (.72)***
2.54 (3.38)
17.38 (4.20)***
.83 (1.68)
4.64 (1.65)***
R-squared .12 .09 .47 .23 .14 .08N 144 144 39 39 234 234