Embed Size (px)
Citation preview

ASPECTS OF CONCERT HALL ACOUSTICS
RICHARD C. HEYSER MEMORIAL LECTURE
Leo L. Beranek
Audio Engineering Society
123rd AES Convention
New York, NY USA

This paper starts with rank-ordering of halls into categories of
acoustical quality
Then it treats the important acoustical parameters: Sound
energy density buildup----reverberation time, T60----early
sound, including ITDG----apparent source width, ASW----
listener envelopment, LEV----sound strength, G----Stage
factors and various subjective considerations
It next compares a hall of different architectural design with a
hall highly acclaimed shoebox-shaped hall
and
Concludes with a new calculation that correlates highly with
subjective LEV

In my 2004 book, sixty concert halls have been divided into three categories according
to subjective ratings by conductors and music critics. Examples are:
T60(occup) Gmid (dB)
Category One: Vienna, Grosser Musikvereinssaal 2.0 6.5
Boston, Symphony Hall 1.9 4.2
Tokyo Opera City (TOC) Concert Hall 1.95 5.0
New York, Carnegie Hall 1.8 -
Cardiff, Wales, St. David’s Hall 1.95 3.2
Category Two: Cleveland, Severance Hall 1.6 3.5
Los Angeles, Disney Hall 1.85 -
Munich, Philharmonie Am Gasteig 1.8 1.9
Washington, D.C., JFK Concert Hall 1.7 2.5
Category Three: The rankings and the acoustical data here precede renovations.
London, Royal Festival Hall 1.45 1.9
Paris, Salle Pleyel 1.5 3.9
Montreal, Salle Wilfrid-Pelletier Hall 1.65 0.1
San Francisco, Davies Hall (bass and stage) 1.85 2.2
Buffalo, Kleinhans Music Hall 1.5 2.7

Assume that a violin plays a note 100 ms long
with energy in the 1000 Hz band. At a seat in the
center of the Boston Hall the cumulative energy will
rise as shown by the irregular curve. At 100 ms, the
energy will start to decay.
If a second note is sounded at just after 100 ms,
at its peak energy it will be heard easily above the
previous reverberation. But simply hearing each note
is not the only measure of the acoustical quality.
First, the reverberation time T60 must go with
the music to be performed in the Hall. An RT of 1.9
seconds goes with today’s symphonic music
repertoire.
Second, the initial-time-delay gap ITDG is important, the time at which the first
reflection is heard after the direct sound. For Boston, the ITDG is about 15 ms, and this
is about optimum. If greater than about 35 ms, the hall will sound like an arena, with a
lack of intimacy. Thus hall size is audible.
Third, there is the law of the first wave front: Before about 100 ms, the azimuth
location of the source is possible as heard from the first wave front and this is an
important contributor to sound quality.

Fourth, during this 100 ms period, the sound is
also broadened—called the apparent source width
ASW. The ASW depends on the proportion of the
early energy that arrives at the listener laterally and
is measured by the Inter-Aural Cross-Correlation
Coefficient IACC (microphones at two ears) or the
Lateral Fraction function LF (figure-8 microphone).
Boston Symphony Hall ranks with the best.
Fifth, after about 100 ms, the listener is
enveloped in the sound. Its measurement, LEV, must
be large enough for good sound quality. Note that
when LEV is achieved, the lateral direction of the
source can no longer be observed.
Sixth, Griesinger says that for best sound quality, the energy in the direct sound at
the listener’s position should be no weaker than about -10 dB below the ultimate level as
shown on the above curve. This -10 dB goal holds in Boston for 2/3 of the audience. But,
the ITDG is shorter in the balconies and the energy of the earliest reflections directly adds
to the energy of the direct sound, hence the remaining 1/3 of the audience is still well
served.
Seventh, Texture, which is the number and distribution of early reflections that occur
before about 100 ms, is an important factor in acoustical quality.
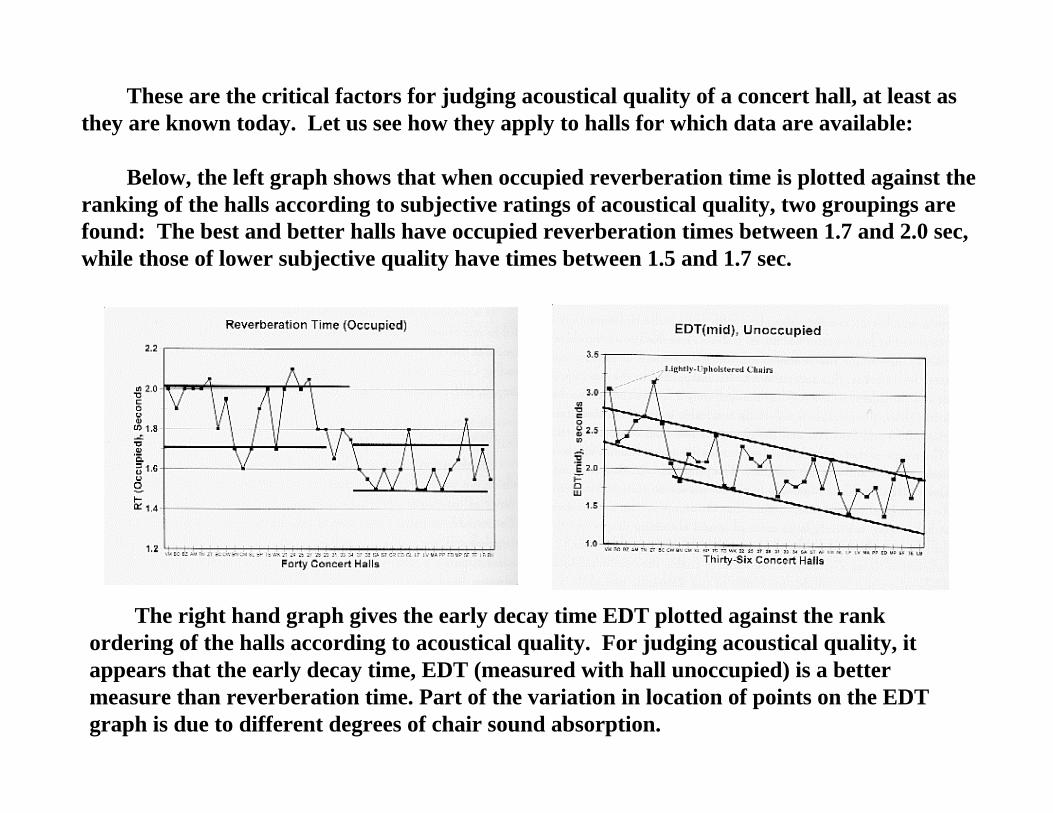
These are the critical factors for judging acoustical quality of a concert hall, at least as
they are known today. Let us see how they apply to halls for which data are available:
Below, the left graph shows that when occupied reverberation time is plotted against the
ranking of the halls according to subjective ratings of acoustical quality, two groupings are
found: The best and better halls have occupied reverberation times between 1.7 and 2.0 sec,
while those of lower subjective quality have times between 1.5 and 1.7 sec.
The right hand graph gives the early decay time EDT plotted against the rank
ordering of the halls according to acoustical quality. For judging acoustical quality, it
appears that the early decay time, EDT (measured with hall unoccupied) is a better
measure than reverberation time. Part of the variation in location of points on the EDT
graph is due to different degrees of chair sound absorption.

The graph on the left below plots Lateral Fraction, LFE4
versus subjective concert
hall ratings. Lateral fraction is the ratio of the energy measured with a figure-eight
microphone to that measured by a unidirectional microphone. The “E” stands for
integration before 80 ms and the “4” means the average of the levels in the four octave
bands from 125 to 1000 Hz. Also is plotted (crosses and dotted lines) the LFE3
where
the “3”means the average of the levels in the three octave bands 500, 1000 and 2000 Hz.
The low-bands LFE4
and mid-bands LFE3
curves are almost identical—this fact is used
later.
The graph on the right shows the Binaural Quality Index = [1 – IACCE3
] values
plotted against the subjective ratings.

This graph is a plot of the data from the graphs on the previous page, i.e., BQI = [1 –
IACCE3
] versus LFE4
, showing that for the 28 halls for which data for both are
available the two parameters are highly correlated. Part of the scatter is due to the
large differences in times in which the data were taken and the fact that a number of
laboratories were involved in taking the data.
Important use of this correlation will be made later in this paper.

SABINE AND EYRING EQUATIONS
If we use the Sabine and Eyring equations to predict the same reverberation time
____0.161 V_______ = T60 = ________0.161 V______________
Stot sab + 4mV Stot {-2.3 log (1 – ey)} + 4mV
Then,
sab = -2.3 log (1 – ey)
This means that if sab is known, ey is automatically known.
So, ( ey / sab) is known.
Let us designate the audience area, ST, other not-highly absorbing surfaces, SR, and any
highly absorbing surfaces, Si . Then, give them the Sabine sound absorption coefficients
T, R and i, respectively, and the Eyring absorption coefficients T, R and i, respectively.
For both equations, the total hall area is: Stot = ST + SR + Si. Then, it can be shown,
T= ( ey/ sab) T
R= ( ey/ sab) R
i = ( ey/ sab) i

What does it mean to say that both equations predict the
same T60? Consider T60 = 0 first.
For the Eyring Eq., T60 = 0 when the Eyring coefficient is 1.0.
For the Sabine Eq., T60 = 0 only if the Sabine coefficient is
very large.
This demands that the Sabine absorption coefficient must be allowed to
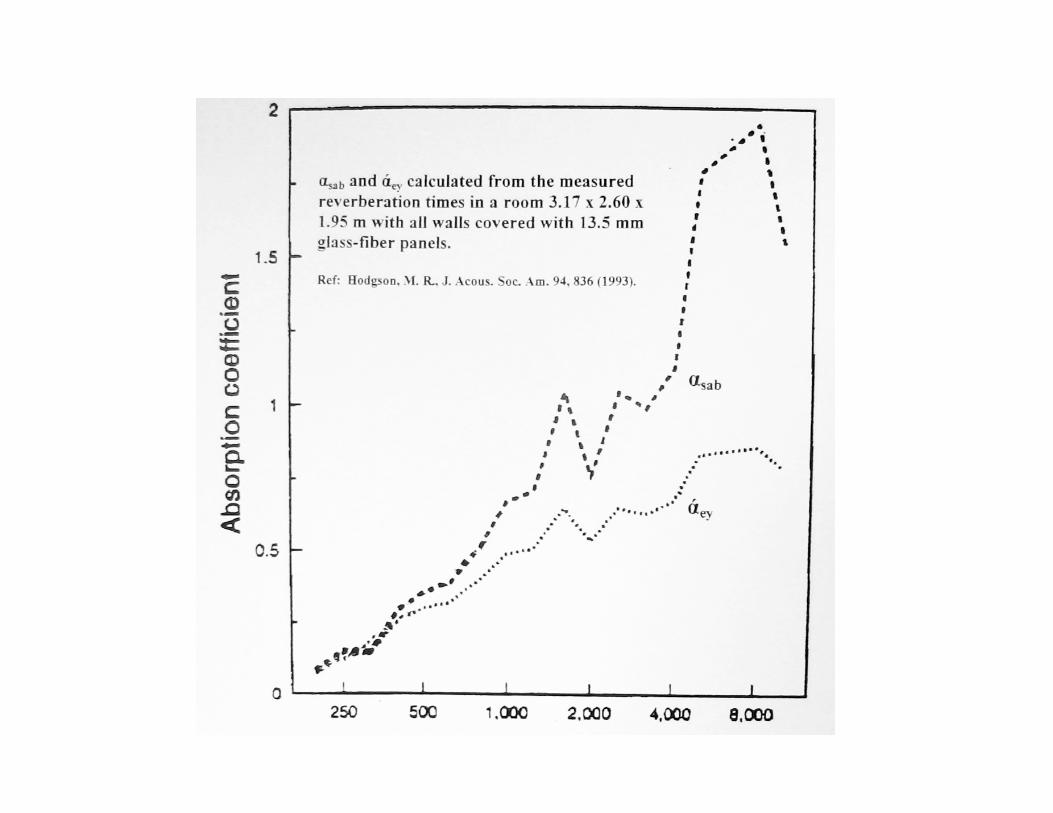
exceed 1.0, and this is my premise. Example:
Consider a very small room with all walls equally absorbing: Room: 3.17 x 2.60 x
1.95 m and covered with 13.5 mm glass-fiber panels.
What are the two measured absorption coefficients as a function of frequency?

It is hoped that no one is still calculating reverberation times in a concert hall
considering the audience absorption as being proportional to the number of occupants.
In repeated papers I have shown, and more recently Barron and Coleman have
confirmed, that the absorption of an audience is proportional to the area over which it
sits. This difference is serious because, for example, in the Amsterdam
Concertgebouw, 1200 people sit over an area of 500 square meters, while in the Munich
Philharmonie, only 900 sit over this area. Thus, because the absorption is proportional
to area, in the Munich hall each person absorbs 33 percent more sound energy than in
Amsterdam. Also, it must be noted that the area of an audience is greater if they are
on a slope than would be indicated by the projected area. The sloped area must be used
in calculations.
Furthermore, for different halls there is no one audience absorption coefficient if
the same reverberation equation is used for prediction in them. The audience in each
shape of hall absorbs a different amount of sound energy because of the difference in
the way successive sound reflections involve the different surfaces in it. Alternatively,
if the same absorption coefficient is to be used, a different reverberation equation must
be used for each shape of hall. This has been demonstrated by Joyce, Kuttruff, Hidaka
and others.
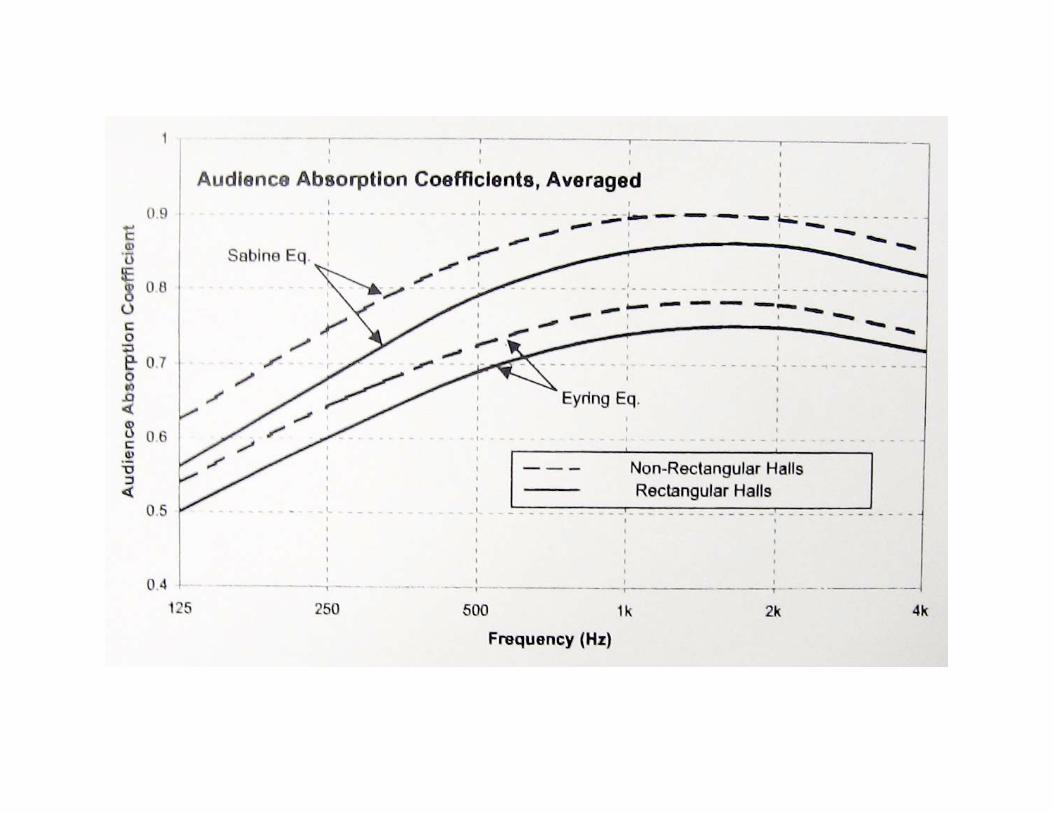
In the next figure the difference is shown in the audience absorption coefficient for
a classical shoebox shaped hall (average of 9 halls) compared to a non-shoebox shaped
hall (average of 11 halls). The absorption coefficient for the latter is 6 percent greater.

I wish to make some observations on the sound in two halls of quite different shapes,
Boston Symphony Hall and Los Angeles Walt Disney Hall.
Boston Symphony Hall opened in 1900. I am often asked why this hall is so successful
when so little was then known about concert hall acoustics. The most important
decision was made by the owner of the Boston Symphony Orchestra, Henry Lee
Higginson, who was also the Chairman of the building committee. He decided, after
consultation with conductors and musicians in Europe, that the hall should be shoebox
in shape (This assured uniform coverage of the audience). Second, for visual reasons, he
stipulated that the 2600 seat hall should be no wider than 75 ft (22.9 m) (This assured
adequate ASW, apparent source width). The building committee asked that the hall be
fireproof—concrete block and plaster (This assured strong bass). The architect wanted
a beautiful hall and asked for niches and statues on the side walls and coffers in the
ceiling (This assured a pleasant reverberation time). Sabine, using the equation that he
had discovered only 4 months before, calculated the ceiling height which resulted in
optimum reverberation time (for today’s orchestral repertoire). Finally, in order to
keep the length of the hall reasonable, Sabine designed a stage house that did not
significantly increase the volume of the hall (The musicians like the sound in it). These
decisions led to optimum values for RT, G, Clarity C80, ITDG, IACC, bass response and
musicians’ satisfaction.

Recent studies in several countries, including England, have shown that the Boston
stage is nearly ideal. It has flared vertical side walls, a ceiling that is about 43 feet
high, and a stage area that is as small as possible for comfortable seating of the
orchestra.

The only published plans for the Walt Disney Hall that I am aware of are as follows:
There are several ways this hall differs from the Boston hall. Most important, the
audience surrounds the orchestra. The height of the ceiling above the stage is about 49 ft
and the mid-frequency occupied reverberation time is 1.85 s, both near optimum. The
average strength G in the hall is about 2 decibels less than in Boston and 4 dB less than
than Vienna’s Vereinssaal. The principal difference in the sound in it and that in a
shoebox hall is in the number and distribution of the lateral reflections at the different
seats, which means that the sound is not as uniform as in Boston and Vienna. Also, the
orchestra must become accustomed to playing without side and rear walls, which,
apparently, the Los Angeles Symphony did after a couple weeks of practice. This means
that the players hear each other less well and must pay closer attention to the conductor.


Perceived Loudness at different distances from the stage.
In 2001, Zahorik and Wightman (in an obscure publication) found from
listener judgments in a carefully executed experiment, that even though the
strengths G in decibels of the music in a concert hall decreases with distance,
listeners say there is no change in loudness. Their explanation was that listeners
judge the loudness based on the strength of the reverberant field, which does not
vary much in a hall.
At a meeting a month ago in Madrid, Barron gave a paper, apparently
unaware of the above paper, in which he concluded, “Assessment of subjective
loudness indicates that the listeners’ loudness judgment is almost independent of
distance from the stage, which suggests that listeners are compensating their
judgment of loudness on the basis of visual information.” Barron even gives a
criterion for the strength G by which he says that ideally the sound strength G
should decrease with distance from the stage by about the same amount as it
decreases in Boston Symphony Hall.
This is an important discovery, even though we do not know for sure whether
listeners judge loudness in a hall based on the strength of the reverberant field
alone or in combination with vision.

CHAMBER MUSIC HALLS
Hidaka and Nishihara sought general design guidelines for chamber music
halls based on studies of 11 European halls and 7 Japanese halls. The occupancy
of the former ranged from 336 to 844 and the latter from 252 to 767. If halls
with seating over 339 and multi-purpose are excluded, the occupied-hall mid-
frequency reverberation times RT range from 1.5 to 1.7 s. Opinions of musicians
using halls between 500 and 600 seats were in agreement that those numbers are
optimum. For those particular halls, the mid-frequency (unoccupied) clarity
factor C80 lay in the range (0.2 + 1.6) dB. For the European halls, the
unoccupied hall-averaged sound strengths at mid-frequencies GM ranged from 9
to 13 dB and GL (125/250 Hz) from 9 to 14 dB. In the modern (mostly Japanese)
halls these values were 3 and 5 dB less, respectively. The initial-time-delay gaps
ITDG’s measured at mid-floor were 20 ms or less in the best halls. For the best
halls, the Binaural Quality Index’s integrated over 80 ms (BQIMID = {1 –
IACCMID} were more than 0.68 and integrated over 50 ms were more than 0.58.

Next, I wish to present a new formula for calculation of Listener Envelopment, LEV.
This method has as its basis a paper presented in the Journal of the Audio Engineering
Society Volume 51, September 2003, by Gilbert Soulodre, Michael Lavoie and Scott
Norcross of the Communication Research Center in Ottawa. I view this work as very
important. The changes that I am going to present are different in detail from their work
but are solidly based on their findings. My method makes possible the use of data of the
kind that I gave earlier in this lecture and that are tabulated in my 2004 book on Concert
Halls and Opera Houses. The following finding is also important:
First, it has been believed until now that the most important component of listener
envelopment is the energy arriving from lateral directions a person’s ears. But, Furuya,
Fujimoto, Wakuda and Nakano found from extensive subjective measurements of listener
envelopment LEV that late vertical energy and late energy from behind a listener affect
LEV by approximately 40 and 60 percent, respectively, of the late lateral energy. Hence,
one has to conclude that total late energy is a better component of LEV than late lateral
energy. Soulodre et al confirmed this result in their paper.
In the experiments performed by them a listener was surrounded by the sound from
five loudspeakers, one frontal, two + 30° and two + 110°. The sound stimulus was a 20 sec
segment of anechoic music (Handel’s Water Music). Direct sound came from the forward
loudspeaker. Early reflections and reverberant sound came from the other loudspeakers.
The reverberant sound and some of the early reflections were varied and the strength G
and reverberation time RT were varied. The subjects were asked “to rate only their
perception of being enveloped or surrounded by the sound.”

They measured in octave bands: (A) late lateral energy fraction (LFL)(measured
with figure-eight microphone and integrated after 80 ms), (B) late total energy (GL),
and (C) reverberation time.
Note: They found very little change in perceived LEV for RT’s between 1.7 and
2.0 sec, common for concert halls [They and Morimoto et al found that LEV is
diminished when the RT is low in any frequency region, whether low, middle or high].
An important conclusion: “The results are fairly independent of how the various
octave bands are grouped.” They even found slightly higher correlations between the
results of their subjects’ responses using the 500 and 1000 Hz bands for averaging
their measured data than using the four 125-1000 Hz bands. They decided for no
particular reason that they would average their results over the four, 125 to 1000 Hz,
bands.
As a by-product, they found that for the lower three bands, the transition time
between ASW and LEV is substantially longer than the usual 80 ms, but for the two
mid-frequency bands it is about 100 ms. Because at mid-frequencies the 100 ms
transition time is close enough to the 80 ms value which has been used for nearly all of
the data in the literature (and my book), I am using the 500/1000 Hz band average in
what follows.

Directly from the Soulodre et all, but with the above modifications, their formula
for calculating Listener Envelopment, LEV, which correlated highly with their
subjective judgments, becomes,
LEVcalc = 0.5 G Late,mid + 10 log LF Late,mid dB
G (overall) and the clarity factor C80, which measures the ratio of early to late
energy, are published for many halls in the literature and in my book. Obviously,
from these two quantities GLate can be determined.
Earlier in this lecture, I showed that [1 – IACC] is highly correlated with LF, hence,
[1 – IACCLate] can be substituted for LFLate, so that their formula revised to use
widely available data becomes,
LEVcalc = 0.5 GLate,mid + 10 log [1 – IACC Late,mid] dB

LEVcalc = 0.5 G Late,mid + 10 log [1 – IACC Late,mid] dB
With this formula, the calculated listener envelopment LEVcalc for 10 well-known halls
is as follows.
Hall LEVcalc
Vienna, Musikvereinssaal 2.0
Amsterdam, Concertgebouw 1.4
Berlin, Konzerthaus 1.2
Tokyo, TOC Hall 1.0
Tokyo, Suntory Hall 0.4
Boston, Symphony Hall 0.3
Berlin, Philharmonie -0.2
Baltimore, Symphony Hall 0
Sapporo, Kitara Hall -1.5
Buffalo, Kleinhans Hall -2.2
Anyone who has listened to music in these halls will agree that the degree of listener
envelopment is greater in the upper group of four halls than in the lower group of four
halls. Boston is appreciably lower than Vienna because, as shown in a table earlier, the
sound strength G is lower. The famous conductor Herbert von Karajan, whose home
hall was the Vienna Musikvereinssaal, said to me in an interview, “The sound in the
Vienna hall is so full that the technical attack of instruments—bows and lips—gets lost.
Also successive notes merge into each other. I consider Boston Symphony Hall a little
better than the Musikvereinssaal.”

A question, “Is this measurement, LEVcalc unique, or is it highly correlated with
other common measures?” Let us plot LEVcalc against:
(A) Total strength Gmid, and (B) Total room absorption, Stot sab (Note: Buffalo has
both exceptionally low Gmid and low [1 – IACClate])

IN SUMMARY
1. Sabine absorption coefficients should be allowed to go above 1.0 and, if so,
there is always a definite relation between Eyring and Sabine coefficients.
2. When calculating reverberation times, the sound absorption coefficients that
are used must have been determined in rooms of nearly the same shape and size.
Audience area and not audience count should be used in determining audience
absorption.
3. There is high correlation between measurements of low-frequency
lateral refraction LF and mid-frequency Binaural Quality Index [1 – IACC].
4. The lateral direction that the sound is coming from is determined by the direct
sound, and this continues up to about 100 ms, at which time the upper limit of
the first wave front is reached. Early reflections before about 100 ms act to
widen the apparent source width ASW.
5. Envelopment of the listener by LEV occurs only after the upper limit of the
first wave front is reached, where the direction of the sound source is no longer
apparent .

6. Listeners judge the loudness of an orchestra in a hall to be the same in remote
seats as in front seats even though the measured strength G decreases with
distance from the stage.
7. Listener envelopment LEV can be calculated by a new formula that includes
sound strength G (late), and the late lateral energy as measured by [1 –
IACC(late)], where “late” means after about 80 ms.
8. The calculation of LEV can made using available data in the 500 to 2000 Hz
octave bands and a transition time of 80 ms.
9. For most halls, The results of the formula for calculating LEV are highly
correlated with the overall G (not late) and the total room absorption Stot* tot
except when either, or both, the late lateral energy, BQI = [1 – IACC], or the
overall G is weak.