Embed Size (px)
Citation preview
Richmondshire Local Plan Renewable and Low Carbon Energy Study
Prepared for Richmondshire District Council by AECOM August 2012

Prepared by: .............................................................. Michael Henderson Associate Director Approved by: .............................................................. Stephen Ward Regional Director


1. Executive Summary ............................................................................................................................................................. 2
2. Introduction ......................................................................................................................................................................... 14
3. Drivers and Policy .............................................................................................................................................................. 18
4. Building Energy and Carbon Baseline ............................................................................................................................. 30
5. Existing Renewable and Low Carbon Energy Supply Audit ......................................................................................... 50
6. Review of Technical Potential of Renewable and Low Carbon Energy ....................................................................... 60
7. Testing Delivery Potential for Renewable and Low Carbon Technology .................................................................... 94
8. Growth as a Catalyst for Change .................................................................................................................................... 126
9. Policy Recommendations and Actions for Delivery ..................................................................................................... 156
Appendix 1: Existing buildings in Catterick Garrison Scenario ............................................................................................... 169
Table of Contents

Executive Summary
AECOM Richmondshire Local Plan Renewable and Low Carbon Energy Study 2
1.1. Introduction
This study, seeks to develop policy recommendations appropriate for the area covered by Richmondshire’s Local Plan (the ‘Local Plan area’1) to reduce building and development related carbon emissions through the planning process. It examines the current and future energy demand from the existing housing and non‐domestic building stock, as well energy requirements from new build delivered through the growth strategy proposed in the emerging Local Plan to 2028.
1.2. Drivers and Policy
This section provides an overview of the national and local drivers for increasing the local potential for generating low and zero carbon forms of Energy. It highlights that the UK is already committed to reducing greenhouse gas emissions by 80% from 1990 levels by 2050, and at least 34% by 2020, through the Climate Change Act (2008). To achieve this long term target, the UK Government in May 2011 announced intermediate carbon reduction target of 50% by 2025. As building related CO2 emissions currently account for approximately 25% of all CO2 emissions, improving efficiency and supplying buildings with renewable and low carbon energy is a priority. To meet this, the UK has also set targets according to its strengths, as follows:
30% of electricity
12% of heat
10% of transport
The 2004 Planning and Compulsory Purchase Act, as amended by Section 182 of the Planning Act 2008 sets out the legal framework for planning in England. Section 19 of the Act requires that ‘Development plan documents must (taken as a whole) include policies designed to secure that the development and use of land in the local planning authority’s area contribute to the mitigation of, and adaptation to, climate change’. Furthermore, in discharging their duties, Local Planning Authorities must have regard to the National Planning Policy Framework (NPPF) (2012).The NPPF sets out that the planning framework should support the development of a low‐carbon economy, stating that planning authorities should:
Plan for new development in locations and ways which reduce greenhouse gas emissions;
Actively support energy efficiency improvements to existing buildings; and
When setting any local requirement for a building’s sustainability, do so in a way consistent with the Government’s zero carbon policy and adopt nationally described standards.
1 The Local Plan area is the area covered by the Richmondshire Local Plan which is the area of Richmondshire District outside of the Yorkshire Dales National Park. The National Park is the Local Planning Authority for areas within its boundary.
1. Executive Summary
AECOM Richmondshire Local Plan Renewable and Low Carbon Energy Study 3
Expect new development to comply with Local Plans policies for decentralised energy, and take account of site characteristics to minimise energy consumption, when determining planning applications.
1.3. Building Energy and Carbon Profile
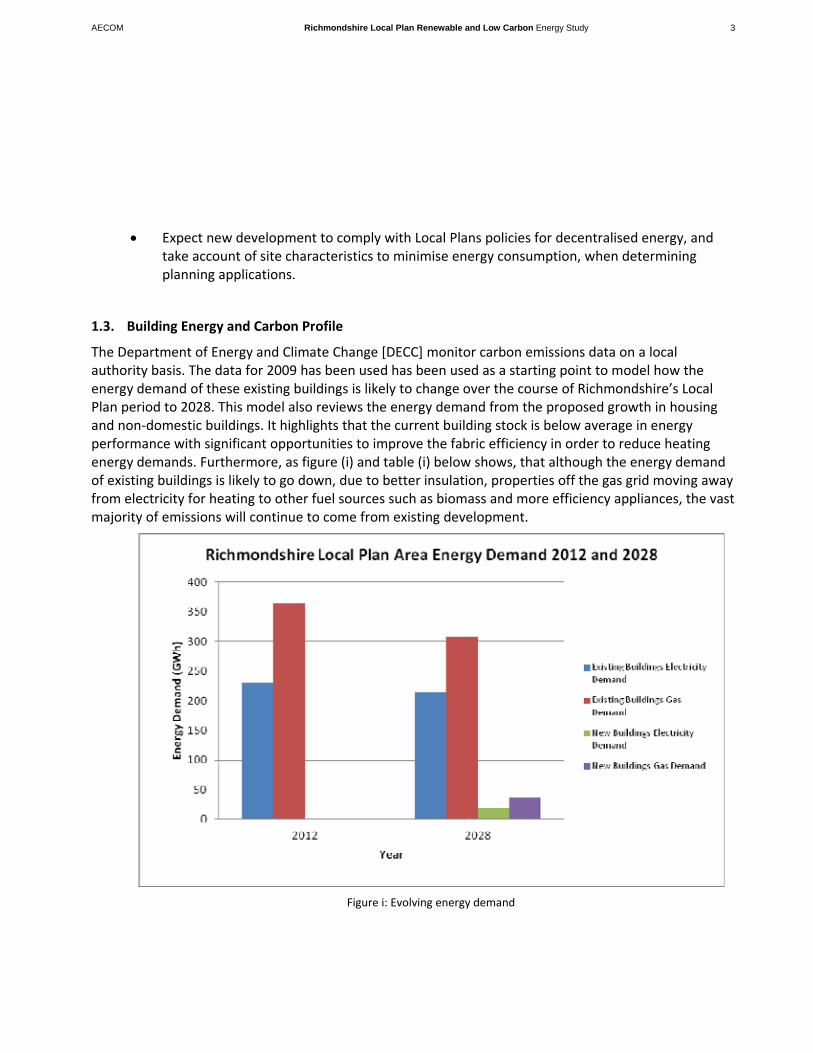
The Department of Energy and Climate Change [DECC] monitor carbon emissions data on a local authority basis. The data for 2009 has been used has been used as a starting point to model how the energy demand of these existing buildings is likely to change over the course of Richmondshire’s Local Plan period to 2028. This model also reviews the energy demand from the proposed growth in housing and non‐domestic buildings. It highlights that the current building stock is below average in energy performance with significant opportunities to improve the fabric efficiency in order to reduce heating energy demands. Furthermore, as figure (i) and table (i) below shows, that although the energy demand of existing buildings is likely to go down, due to better insulation, properties off the gas grid moving away from electricity for heating to other fuel sources such as biomass and more efficiency appliances, the vast majority of emissions will continue to come from existing development.
Figure i: Evolving energy demand

AECOM Richmondshire Local Plan Renewable and Low Carbon Energy Study 4
2012 2016 2020 2024 2028
Existing Residential Electricity Demand 91 92 92 92 92
Existing Residential Building Gas
Demand 205 194 183 172 161
Existing Non-Residential
Electricity Demand 140 135 131 126 122
Existing Non-Residential Gas
Demand 160 156 153 149 146
New Residential Electricity Demand 0.0 2.8 5.8 9.0 12.2
New Residential Building Gas
Demand 0.0 5.1 9.5 12.7 15.9
New Non-Residential
Electricity Demand 0.0 1.8 3.6 5.5 7.3
New Non-Residential Gas
Demand 0.0 9.0 16.6 18.7 20.7
Total Electricity Demand 231 231 232 233 234
Total Heat Demand 365 364 362 352 344 Table i: Evolving energy demand
1.4. Existing Renewable Energy Audit
Within Richmondshire District as a whole, approximately 8.5GWh of renewable and low carbon energy
installed, with a substantial portion of this sourced from landfill gas. This is the least contribution of all
local authorities in Yorkshire and Humber to renewable energy generation, producing less than one
percent of the Region’s total. The amount of renewable energy either consented or in the planning
process represents more than twice the amount already installed. If it was all to be installed,
Richmondshire’s total amount of renewable energy would increase to 20,000MW.
AECOM Richmondshire Local Plan Renewable and Low Carbon Energy Study 5
1.5. Review of Technical Potential for Renewable Energy
The review of the technical potential for renewable and low carbon energy provides refined and more detailed analysis of the regional Low Carbon and Renewable Energy Capacity in Yorkshire and Humber (LCRECYH) study, completed in 2011 following the regional methodology set out by DECC2.The review highlights that despite environmental, social and physical constraints, there is significant opportunities for adopting a wide range of renewable and low carbon technologies. The greatest potential comes from generating electricity from large wind turbines and growing biomass for generating heat. In addition, micro‐renewables and small scale hydro energy are likely to play a key role in delivering carbon saving on new developments as part of meeting zero carbon policy and could be adopted on existing buildings.
1.6. Testing Delivery Potential for Renewable Energy
Although the physical and technical capacity for renewable and low carbon energy is quite significant in the Local Plan area, this needs to be balanced with the appetite to deliver these technologies. There are a number of barriers to delivery including environmental sensitivity, and a number of different delivery partners, such as the public sector, energy developers, community groups and the private sector, that need to be engaged to ensure they are overcome. This section tests the delivery context in the Local Plan area using case studies and a workshop with potential delivery partners. While all delivery partners are interested in delivering renewable energy, the private sector and energy developers appear especially keen. These partners have the opportunity to be seen as leaders in driving the delivery of these technologies. While barriers to delivery do exist, none of them are insurmountable, and can be solved through communication, leadership, and ambition.
1.7. Growth as a Catalyst for Change
Planning can have an important influence on sites which have the potential to achieve large carbon reductions in a cost and carbon effective manner. Planning can also coordinate more strategic interventions across an area through the spatial planning process. New developments are often an important trigger for the delivery of new infrastructure, and hence it is important to understand what scale and type of development can drive energy solutions. Furthermore, post 2016, potential opportunities through the emerging approach to ‘zero carbon policy’ and ‘Allowable Solutions’ will place emphasis on local authorities to identify and support delivery of community scale solutions. This section shows that although the capital cost of building strategic low carbon infrastructure can be higher than building based solutions to meeting the carbon compliance element of zero carbon policy, there are likely to be significant other benefits, such as extending networks into existing settlements. Furthermore, capital costs need to be offset against potential revenue from heat sales.
2 Renewable and Low‐carbon Energy Capacity Methodology: Methodology for the English Regions, DECC (2010)

AECOM Richmondshire Local Plan Renewable and Low Carbon Energy Study 6
One of the main challenges in delivering a network is the phasing of development across multiple land owners and a long build out period. The best option would be to work with key delivery partners to develop a masterplan for the strategic growth areas. This would provide clarity to the ambition and help structure development coming forward in a way that can make best use of the opportunity for a district heating network. In turn, this would reassure potential developers as the requirement for the site would be known. It might also be useful in attracting an ESCo to help support with the capital cost of development in return for heat sales.
Energy use and related carbon emissions are only one element of sustainability than needs consideration in building development, particularly with the onset of climate change. The NPPF recommends using national rating systems such as the Code for Sustainable Homes and BREEAM to assess the sustainability of new buildings. Although there is likely to be a cost associated with this higher performance, the largest costs are associated with meeting energy requirements, which will be required by Building Regulations anyway. In addition, as the construction industry becomes more familiar methods of meeting the requirements it is likely that costs will decrease.
1.8. Policy Recommendations
Given the analysis of the evolving energy baseline of existing buildings, the impact of future development, the technical capacity for renewable and low carbon technologies and stakeholder views on delivery, this section presents recommendations for Local Plan policies to reduce carbon emissions associated with the built environment, focusing on:
Existing development
Opportunities from strategic growth areas
Supporting renewable energy development
Delivering wider sustainability benefits
Focus on existing development
In section 4, the assessment of the evolving energy baseline highlights that the energy demands and associated carbon emissions from existing development are significantly higher than the regional and national picture. This coupled with the propensity for larger, older and more exposed associated with more rural nature of the area such as this, suggests poor energy performance and fabric efficiency. Furthermore, over the plan period, energy demands from the existing building stock will continue to far outweigh that of new development. As such, existing development should be the focus of carbon reduction strategies.
AECOM Richmondshire Local Plan Renewable and Low Carbon Energy Study 7
Although the role of planning is limited in influence over existing development, the move towards localism and the NPPF, and support from the Committee on Climate Change, have highlighted the opportunities for local authorities to influence the energy performance of properties when applying for planning permission for a new extension – this is sometimes known as consequential improvements.
When owners submit an application for an extension to their building is an opportune time to encourage owners to also consider improving the energy efficiency of their buildings. It is not, however, advisable to set blanket requirements to improve existing buildings when a planning application is triggered through a proposal for an extension. We recommend that policy mechanisms and planning processes are promoted and that information is available to building owners that outlines the possibilities and associated costs. Information could be outlined in an SPD or targeted brochure.
As the existing building stock is so crucial to reducing carbon emission, a similar approach to consequential improvements could be adopted in the Local Plan area. RDC, especially Development Management officers, can play an active role by working with building owners and developers to prompt the opportunity to retrofit carbon reduction and adaptation measures. As such, the type and level of improvements required should be set out in supporting guidance. This could either be a specific % improvement or a check list of appropriate measure. Improvements should be relative to the cost of the extension.
Strategic Growth Areas ‐ Developing district heating
Section 8 of this report highlights that strategic development presents opportunities for delivering decentralised energy that could bring greater benefits, such as extending district heating networks into existing areas to elevate the risk of fuel poverty. Stimulating these opportunities and coordinating their delivery can however be difficult. Growth within the strategic growth areas of Catterick and Leyburn however presents a significant opportunity where the scale of development has the potential to deliver strategic low carbon infrastructure. As such, new development should be expected to investigate the viability and feasibility of contributing to the establishment of the network.
POLICY RECOMMENDATION – Consequential Improvements Planning applications for material changes to existing domestic dwellings will be required where possible and practical, to undertake reasonable improvements to the energy performance of the existing dwelling. This will be in addition to the requirements under Part L of the Building Regulations for the changes for which planning permission is sought.
AECOM Richmondshire Local Plan Renewable and Low Carbon Energy Study 8
Developing targets for the Local Plan area
This section considers whether the Local Plan area should set renewable energy targets that are different to those set out in national Low Carbon Transition Plan.
As highlighted in section 3, the UK Government is committed to reducing CO2 by setting a target for 30% of electricity and 12% of heat to be generated by renewable sources by 2020.For the Local Plan area to play a equitable role in meeting these targets, 74GWh of electricity and 43GWh of heat would need to be generated within the District. Although the assessment of renewable resource capacity in section 6 of this report shows that the scale of potential for renewable electricity generation is easily significant enough to exceed a 30% target, the delivery context has been constrained. Given the level of constraints highlighted in section 7 and fear of political resistance to wind development in the area other sites are more attractive to energy developers. Support from the District will be needed to stimulate increased deployment of strategic renewable infrastructure. As such, it is logical to assume that with moderate uptake of strategic renewable schemes, with contributions from micro‐generation, the 30% target might be obtainable.
There is also significant resource for generating heat through from renewable fuels. Delivery of the infrastructure to distribute this heat is however potentially more onerous. The greatest potential comes from developing a district heating network coordinated with delivery of strategic development around Catterick Garrison. If in delivering the 1900 general housing need and the 1440 MoD service families’ homes in this area, all new homes could obtain their heat from a District Heating Network then the national target of 12% of heat from renewable energy, 43GWh, would be obtainable. Although it is acknowledged that this presents considerable coordination challenges should Richmondshire seek to meet this target.
Energy Opportunities Plan
The various decentralised low carbon and renewable energy opportunities across the District have been compiled to create an Energy Opportunity Plan (EOP). The EOP acts as the key spatial map for energy projects in the Local Plan area. It presents a key evidence base, which underpins policies, targets and delivery mechanisms described here and can set out where money raised through allowable solutions or other funds (such as CIL and infrastructure funding) can be spent. The EOP should also be used to inform policy making, investment decisions, and other corporate strategies. It can be used to inform development decisions and discussions, but it only highlights areas with the greatest potential and as
RECOMMENDATION ‐ This study recommends focusing on meeting the national targets of generating 30% of electricity and 12% of heat from renewable sources by 2020 is appropriate for the Local Plan area.

AECOM Richmondshire Local Plan Renewable and Low Carbon Energy Study 9
such it should not be used to dismiss proposals where site‐based evidence shows there is an opportunity. The EOP can also be a useful tool for communities and other stakeholders to identify delivery opportunities. As such, it should be used in conjunction with other evidence, such as Managing Landscape Change: Renewable & Low Carbon Energy Developments – A Sensitivity Framework of North Yorkshire and York’ (2012) to shape the delivery of renewable and low carbon technology.
Delivering wider sustainability benefits
The Local Plan area will be affected by climate change, with increased flood risk, possible heat waves, changes in the landscape as well as changes in habitats and species composition, habitat fragmentation and changes in soils, recreation and tourism and cultural heritage. This means that actions must not only be taken to reduce the impacts of climate change by reducing CO2 emissions, but also to adapt proposed development to the effects of climate change and other environmental damage.
The Code for Sustainable Homes (CSH) is the voluntary Government‐backed building assessment tool that covers a full range of sustainability issues including, but not restricted to, energy and CO2 emissions. Similarly, BREEAM, although not a nationally approved standard, offers an independent rating system for non‐domestic buildings.
The analysis in Section 8 shows that the cost increase for achieving CSH Code level 4 (particularly for non energy related credits) is limited and should be within the viability testing for new development as highlighted by the Richmondshire DC Economic Viability Study Final Report (2011). Similarly the uplift to
POLICY RECOMMENDATION ‐ Delivering the Energy Opportunities Plan
The Local Planning Authority will support and encourage the generation of renewable and low carbon energy that:
a) responds positively to the opportunities identified in the ‘Richmondshire Local Renewable and Low Carbon Energy Capacity Study’ (2012) and the study's Energy Opportunities Plan;
b) demonstrates that there will be no significant adverse effects on visual receptors or landscape character (particularly in relation to cumulative impacts or impacts in the National Parks arsing from intervisibility) in accordance with the framework set out in ‘Managing Landscape Change: Renewable & Low Carbon Energy Developments – A Sensitivity Framework of North Yorkshire and York’ (2012);
c) is in accordance with the Spatial Principles and do not conflict with other Core Policies; and
d) demonstrates benefits for local communities
AECOM Richmondshire Local Plan Renewable and Low Carbon Energy Study 10
BREEAM Very Good is not significantly onerous, and as such, developments in the Local Plan area should be seeking these minimum sustainability benchmarks.
1.9. Glossary and references
AD – Anaerobic digestion
Anchor Heat Load (AHL) – Pertains to existing buildings with an energy demand that could provide economically viable and practical opportunities for utilising heat. It is known as an ‘anchor’ load because further opportunities [e.g. from nearby buildings] may arise for connecting nearby buildings to the original anchor load.
Allowable Solutions –Any form of carbon reduction measures implemented on or off‐site, once a development has achieved carbon compliance. The government has not yet defined the list of allowable solutions.
Anchor load – See Anchor Heat Load
Biomass – Plant matter which can be converted into an energy source. It is considered a low carbon renewable source.
BREEAM – A voluntary measurement rating for green buildings. BREEAM is reserved for commercial buildings.
CERT – Carbon emissions reduction target
Combined Heat and Power (CHP) – An efficient method for delivering electricity and heat
CO2 – Carbon dioxide
Code for sustainable homes ‐ A voluntary measurement rating for green buildings. It is reserved for residential buildings
POLICY RECOMMENDATION – Wider Sustainability Measures
i. All new residential development will be expected to meet Code for Sustainable Homes Level 4, and
ii. All new residential development of 10 dwellings or more and non‐residential development of 1000m2 will be
expected to submit an energy statement that shows consideration of opportunities to deliver carbon savings in
excess of Building Regulation requirements and to demonstrate that carbon savings have been maximised by
incorporating these opportunities into design. Where greater carbon savings could be achieved through
coordination and linking of infrastructure with neighbouring sites, this should be applied and demonstrated.
iii. All new non‐residential development will be expected to meet BREEAM very good.

AECOM Richmondshire Local Plan Renewable and Low Carbon Energy Study 11
Community Energy Savings Programme (CESP) – Funding provided for households in low income areas in Great Britain to improve energy efficiency standards and reduce energy bills
DCLG – Department for Communities and Local Government
DECC – Department of Energy and Climate Change
District Heating Network (DHN) – A system developed to distribute and share heat generated in a centralised location for residential and commercial heating needs, especially space and water heating.
EOM – Energy Opportunities Map
EOP – Energy Opportunities Plan
ESCo – Energy Services Company – A non‐utility‐based business established to provide energy solutions.
FiT – Feed‐in tariff
GHG ‐ Greenhouse gases
Green Deal – Government funding established to improve the energy efficiency of all properties in the country
GW ‐ Gigawatt
GWh – Gigawatt hour
Heat Density – The total amount of heat demanded in a geographic area. The higher the heat density, the better opportunities exist for implementing a district heating network
ktCO2 – kilotonnes of carbon dioxide
kWh – kilowatt hours
LA – Local Authority
LCRECYH – Low Carbon and Renewable Energy Capacity in Yorkshire and Humber study (
LGYH – Local Government of Yorkshire and Humber
Lower Layer Super Output Area ‐ A geographic area used to improve the reporting of statistics by assigning data to smaller areas.
LPA – Local Planning Authority
Micro‐generation – Small scale renewable energy projects, often implemented to supplement on‐site energy
Micro‐renewables ‐ Small scale renewable energy projects, often implemented to supplement on‐site energy
MoD – Ministry of Defence

AECOM Richmondshire Local Plan Renewable and Low Carbon Energy Study 12
MW ‐ Megawatt
MWh – Megawatt hour
NPPF – National Planning Policy Framework
PV – Solar photovoltaic panels
RDC – Richmondshire District Council
Renewable Heat Incentive (RHI) – Government funding established to incentivise the implementation of renewable heat initiatives, such as district heating networks.
Richmondshire Local Plan area – The area of Richmondshire District outside Yorkshire Dales National Park.
SAP rating ‐ The Standard Assessment Procedure (SAP) is the Government's recommended method for rating the energy efficiency of homes and is used for Building Regulations Part L compliance.
Weirs – a dam‐like structure often used in the generation of small‐scale hydro power

Introduction
AECOM Richmondshire Local Plan Renewable and Low Carbon Energy Study 14
2.1. Scope of the study
Through the Local Government Yorkshire and Humber Climate Change Skills Fund, Richmondshire District Council (RDC) commissioned AECOM to undertake a study to inform the development of its Local Plan with regard to delivering renewable energy and low carbon development. Although the challenge of reducing CO2 emissions and mitigating the effects of climate change is global in nature, national policy sets out an overall approach to achieving the target of an 80% reduction in CO2 from 1990 levels by 2050. The new National Planning Policy Framework (2012) and the previous Planning Policy Statement 1 Supplement (current at the time this study was commissioned) highlights that it is the responsibility of local planning authorities to seek to understand and capitalise on local opportunities to deliver CO2 reductions associated with the built environment.
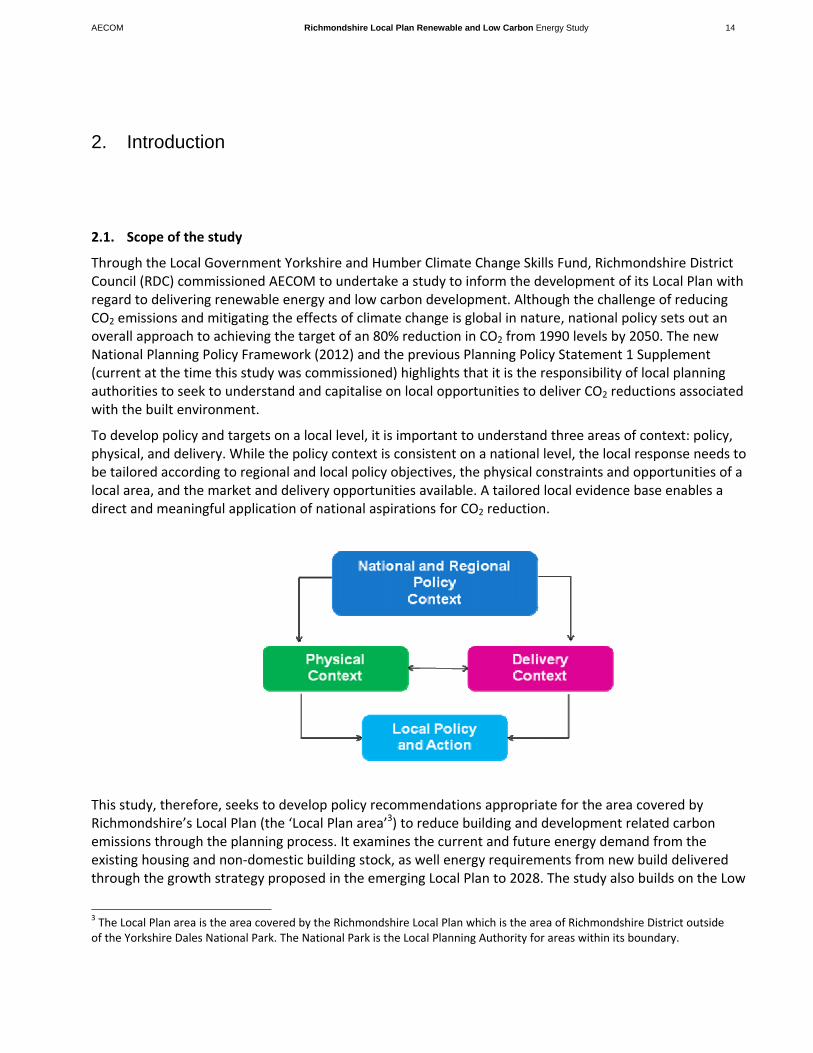
To develop policy and targets on a local level, it is important to understand three areas of context: policy, physical, and delivery. While the policy context is consistent on a national level, the local response needs to be tailored according to regional and local policy objectives, the physical constraints and opportunities of a local area, and the market and delivery opportunities available. A tailored local evidence base enables a direct and meaningful application of national aspirations for CO2 reduction.
This study, therefore, seeks to develop policy recommendations appropriate for the area covered by Richmondshire’s Local Plan (the ‘Local Plan area’3) to reduce building and development related carbon emissions through the planning process. It examines the current and future energy demand from the existing housing and non‐domestic building stock, as well energy requirements from new build delivered through the growth strategy proposed in the emerging Local Plan to 2028. The study also builds on the Low
3 The Local Plan area is the area covered by the Richmondshire Local Plan which is the area of Richmondshire District outside of the Yorkshire Dales National Park. The National Park is the Local Planning Authority for areas within its boundary.
2. Introduction

AECOM Richmondshire Local Plan Renewable and Low Carbon Energy Study 15
Carbon and Renewable Energy Capacity in Yorkshire and Humber Study (2011) (LCRECYH) to provide an updated assessment of the current renewable and low carbon energy provision within the District, as well as mapping areas with the greatest opportunity for deployment of new renewable and low carbon technologies. In some instances, such as in the case of district heating networks, the opportunities are intimately linked to new development and can be extended to reduce the emissions from existing stock, as such there has been particular focus on the spatial analysis of heating network opportunities.
Understanding the technical needs and potential opportunities helps to define the technical capacity. This, however, needs to be tempered with the realism of the appetite and viability for delivery. As such, this report includes the findings of a workshop and analysis of delivery partners to ascertain key barriers to delivering renewable energy in the Local Plan area. Conclusions from the study have been incorporated into draft policy and action recommendations for RDC.
2.2. Structure of the report
The rest of this report is set out as follows:
Chapter 3: Drivers and Policy ‐ Provides an overview of the national and local drivers for increasing the local potential for generating energy from low and zero carbon sources.
Chapter 4: Building Energy and Carbon Profile – Examines the current level of CO2 emissions, and energy efficiency in the Local Plan area. This section also examines the future energy consumption from these buildings and the energy needs of new proposed development. This information allows a baseline to be established which can be used to inform future strategy.
Chapter 5: Existing Renewable Energy Audit – Examines the current levels of low and zero carbon generation in the Local Plan area as well as relevant activities that have, or are taking place.
Chapter 6: Review of Technical Potential for Renewable Energy – Builds on the LCRECYH study to examine the potential for low and zero carbon energy sources in the Local Plan area in order to provide an accurate picture of how much of each resource can technically be delivered.
Chapter 7: Testing Delivery Potential for Renewable Energy – Discusses stakeholders’ perspectives on how best to drive delivery and uses case studies to illustrate how actions can drive delivery.
Chapter 8: Growth as a Catalyst for Change ‐ Consideration of the cost implications of incorporating low and zero carbon forms of energy on new development in the Local Plan area, taking into account the local opportunities and constraints in combination with technical feasibility and investigates opportunities for strategic low carbon infrastructure in the Strategic Growth Areas. It also considers the cost of delivering broader sustainability benefits to developments.

AECOM Richmondshire Local Plan Renewable and Low Carbon Energy Study 16
Chapter 9 Policy Recommendations and Actions for Delivery – Outlines how sound planning policy and long‐term strategic vision can be developed to promote low carbon development in the Local Plan area.

Drivers and Policy
AECOM Richmondshire Local Plan Renewable and Low Carbon Energy Study 18
3.1. International and National Drivers
The challenge of climate change and the drive to reduce greenhouse gas emissions has intensified in recent years. At the international level, the United Nations Climate Change Conference has been held annually with the most recent one held in Durban, South Africa over November and December 2011. The result of this conference was the establishment of a second commitment period for carbon reduction for 35 industrialised countries beginning on January 1, 2013 following the expiry of the Kyoto Protocol. The conference also agreed to begin the work of establishing new legally binding carbon reduction targets for both developed and developing countries by 2015 and coming into effect from 2020. The Green Climate Fund was also established to distribute $100 Billion per year to help developing countries adapt to climate change.
Nationally, the UK is already committed to reducing greenhouse gas emissions by 80% from 1990 levels by 2050, and at least 34% by 2020, through the Climate Change Act (2008). With the publication of the fourth carbon budget (which provides a summary of the UKs emissions profile) in May 2011, the UK Government announced an intermediate carbon reduction target of 50% by the mid 2020s. The Act is supported by the UK Low Carbon Transition Plan (2008), a national strategy for climate and energy, which sets out the Government’s approach to meeting their CO2 reduction commitments. It highlights that building related energy (space and water heating as well as electricity use) accounted for around a third of all emissions. As such, improving the efficiency of the building stock and reducing the carbon intensity of electricity supplied to them is key to achieving significant carbon reduction. The Transition Plan therefore includes commitments to reducing greenhouse gas emissions from existing housing stock by 29% and by 13% for places of work on 2008 levels by 2020 and challenges a local planning authority to consider opportunities for reducing carbon emissions across decision making. As it is predicted that around two‐thirds of the current housing stock will remain in 2050 it is crucial that measures are taken to improve their energy through energy efficiency measure. This is supported by the Governments recent response to the fourth carbon budget, The Carbon Plan: Delivering our low carbon future (2011), which sets out the forthcoming carbon reduction priorities including a suite of retrofit packages such as the Green Deal.
Another crucial part of the Government’s strategy to reduce CO2 emissions is a step‐change in the resources used to generate electricity and heat, through a switch away from fossil fuels (such as coal, oil and gas), to a much higher reliance on renewable and low carbon energy. Installations of renewable and low carbon energy infrastructure will need to be both significant and widespread, with every local authority area looking to utilise opportunities. The UK is committed to the EU Renewable Energy Target, which requires a 20% reduction in CO2 associated with electricity, heating and transport through the use of renewable energy. To meet this overall target, the UK has set targets according to its strengths, as follows:
30% of electricity
12% of heat
3. Drivers and Policy

AECOM Richmondshire Local Plan Renewable and Low Carbon Energy Study 19
10% of transport
The Carbon Plan sets out the proposed strategy to ‘secure low carbon electricity’. It highlights that the ‘nature of the electricity system’ will need to change. Different low carbon technologies have varying strengths and weaknesses and as such, a variety of technologies will need to be employed. Furthermore, the nature of generation and usage is also likely to become variable requiring ‘smarter’ responses to balancing supply and demand. This will be done through investment into a range of renewable and low carbon technologies at different scales, both strategic and small scale by supporting industry, streamlining the planning process (see paragraph 3.2) and through the incentives (see paragraph 3.4).
The Government has also launched The Future of Heating: A strategic framework for low carbon heat in the UK (2012) which supports the use of renewable fuels to generate heat and use of waste heat distributed more through decentralised networks to supply low carbon heat more efficiently.
Both the deployment of renewable and low carbon technologies, and the development of decentralised heat networks will require effective spatial planning.
3.2. National Planning Policy, the National Planning Policy Framework and Supporting Documents
The 2004 Planning and Compulsory Purchase Act, as amended by Section 182 of the Planning Act 2008 sets out the legal framework for planning in England. Section 19 of the Act requires that ‘Development plan documents must (taken as a whole) include policies designed to secure that the development and use of land in the local planning authority’s area contribute to the mitigation of, and adaptation to, climate change’. Furthermore, in discharging their duties, Local Planning Authorities must have regard to the National Planning Policy Framework (NPPF) (2012). The NPPF has been developed under the Localism agenda, and as such confers many powers to local authorities and communities. While the NPPF was developed to support all areas of sustainable development, with respect to renewable energy, one of the ‘Core Planning Principles’ is its support for a transition to a low carbon future. This recognises that planning plays an important role in reducing greenhouse gas emissions, mitigating vulnerabilities, and adapting to climate change impacts, including the delivery of renewable and low carbon energy and associated infrastructure. Section 10 of the NPPF reinforces the Planning and Compulsory Purchase Act recommending that ‘Local planning authorities should adopt proactive strategies to mitigate and adapt to climate change (in line with the objectives and provisions of the Climate Change Act 2008)’. Paragraphs 95 and 96 of the NPPF go further by specifically stating that planning authorities should:
Plan for new development in locations and ways which reduce greenhouse gas emissions;
Actively support energy efficiency improvements to existing buildings; and
AECOM Richmondshire Local Plan Renewable and Low Carbon Energy Study 20
When setting any local requirement for a building’s sustainability, do so in a way consistent with the Government’s zero carbon buildings policy and adopt nationally described standards;
Expect new development to comply with Local Plans policies for decentralised energy, and take account of site characteristics to minimise energy consumption, when determining planning applications.
As per the Localism Act (2011), the NPPF also suggests that all communities have the ability to contribute to renewable, low carbon sources. In order to support initiatives from these sources, local planning authorities should:
Have a positive strategy to promote energy from renewable and low‐carbon sources, including deep geothermal energy;
Design their policies to maximise renewable and low‐carbon energy development while ensuring that adverse impacts are addressed satisfactorily;
Consider identifying suitable areas for renewable and low‐carbon energy sources, and supporting infrastructure, where this would help secure the development of such sources;
Support community‐led initiatives for renewable and low carbon energy, including developments outside such areas being taken forward through neighbourhood planning; and
Identify opportunities where development can draw its energy supply from decentralised, renewable or low carbon energy supply systems and for co‐locating potential heat customers and suppliers.
Importantly, the NPPF does not require energy developers to prove the need for renewable or low carbon energy developments. Rather, it requires the approval of the application if its impacts are acceptable and recognises that renewable energy at all scales help cut greenhouse gas emissions.
In support of the NPPF, the Committee on Climate Change released, How local authorities can reduce emissions and manage climate risk (2012), which aims to provide additional guidance for local government. The report highlights five key drivers for improvement:
Improving energy efficiency in existing buildings4;
Developing low carbon plans containing ambitious reduction targets, especially over actions the local authority has influence. Leadership, encouragement, and monitoring should complement these targets.
4 Uttlesford District Council have successfully used the planning process to improve the energy efficiency of their existing housing stock through ‘consequential improvements’ to residential properties as part of planning applications for material changes to dwellings – see section 9.
AECOM Richmondshire Local Plan Renewable and Low Carbon Energy Study 21
Transportation, especially in rural areas, has a large impact on carbon emissions, and local authorities should focus on establishing low carbon transportation options (e.g., hybrid buses) and installing electric vehicle charge points.
Planning is crucial to reducing greenhouse gas emissions. The following are important areas of focus:
o Enforcing energy efficiency standards in new buildings and extensions and improving the energy performance of the existing building stock;
o Concentrating development in existing settlements;
o Low carbon infrastructure such as green infrastructure, Sustainable Drainage Systems (SuDS), and district heating networks.
Supporting the drive to increase district heating networks in the UK, DECC has published The Future of Heating: A strategic framework for low carbon heat in the UK (2012). This document recognised the importance renewable heat plays in reducing greenhouse gas emissions and sets out how to supply and use heat today. It also describes how heating infrastructure will need to evolve over time, and identifies the substantial economic changes required, and government’s role in that change. One of the key recommendations in the framework, which this report will address, suggests that,
“Through heat mapping and energy planning and in line with emerging planning policies, local authorities should identify opportunities where energy can be supplied from decentralised, renewable, or low carbon energy supply systems and for co‐locating potential heat customers and suppliers.”
With an understanding that the required changes will require incentives and funding, The Energy Act 2011 was enacted in December 2011 and provides improvements in the provision of energy efficiency measures to homes and businesses, and facilitates securing low carbon and renewable energy supplies and fair competition in the energy markets. The Act introduced the Green Deal (discussed in section 4.9), which provides funding for the implementation of energy efficiency measures.
Following the release of the NPPF and complementing the Energy Act 2011, the Government released a draft Energy Bill. As it relates to renewable and low carbon energy, the Bill’s main importance is its focus on electricity market reform (EMR). In this respect, new provisions have been created for:
Contracts for Difference – long‐term instruments to provide stable and predictable incentives for companies to invest in low‐carbon generation;
Investment Instruments – long‐term instruments to enable early investment in prior to Contracts for Difference coming into force;
Renewables Transitional – transition arrangements for investments under the renewables obligation scheme, and
AECOM Richmondshire Local Plan Renewable and Low Carbon Energy Study 22
Emissions Performance Standard – to limit carbon dioxide emissions from new fossil fuel power stations.
3.3. Building Regulations and the Trajectory to Zero Carbon
Following consultation, the Government's Building a Greener Future: Policy Statement announced in July 2007 that all new homes will be zero carbon from 2016. The Government later announced its ambition for all new non‐residential buildings to be zero carbon from 2019 (with earlier targets for schools and other public buildings). Again, these improvements will be implemented through the Building Regulations.
There has been a great deal of debate as to what zero carbon means. As of March 2011, the Government defined zero carbon to include the ‘as‐built performance’ of the building, including heating, fixed lighting and hot water (regulated emissions). Unregulated emissions from cooking and ‘plug‐in’ appliances such as refrigerators, computers, and televisions have not been included within in the definition of zero carbon and it is expected that other regulations aimed at appliance efficiency will help improve these energy consuming sectors.
Prior to the introduction of the zero carbon requirements, the following intermediary step changes are proposed to the requirements of Part L of the Building Regulations for dwellings:
2010: 25% improvements in regulated emissions (relative to 2006 levels). This is expected to broadly correspond to the energy and CO2 element (there are nine elements in total) of Level 3 of the Code for Sustainable Homes5.
2013: 44% improvement in regulated emissions (relative to 2006 levels), corresponding to Level 4 of the Code for Sustainable Homes.
2016: Zero carbon (initially defined as regulated and unregulated emissions as in Code for Sustainable Homes Level 6, but under recent government announcements this has been revised down to just include regulated emissions).
In addition, a consultation on proposals for Part L 2013, which closed in March 2012, proposed the following relevant updates:
Two emission reduction targets have been proposed for dwellings: an aggregate 8% or 26%
improvement with some homes delivering less and some delivering more than this target.
5 It is a common misconception that all aspects of Code levels will be required under the government proposals, but in fact it is just the CO2 targets of the Code that will be applied and are mandatory through Building Regulations (the energy category is one of nine different categories in the Code).
AECOM Richmondshire Local Plan Renewable and Low Carbon Energy Study 23
The targets are based upon a concurrent notional building. Government’s preference appears
to be an interim 8% reduction.
Regulatory energy demand targets for heating and cooling. Fabric Energy Efficiency Standards
(FEES) are 39 ‐ 43 kWh/m²/yr for apartments and mid‐terrace, 46 – 52 kWh/m²/yr for end‐
terrace, semi‐detached and attached properties.
There is more emphasis on limiting the heat gains in summer including the needs to insulate
circulation pipes for domestic hot water to prevent overheating.
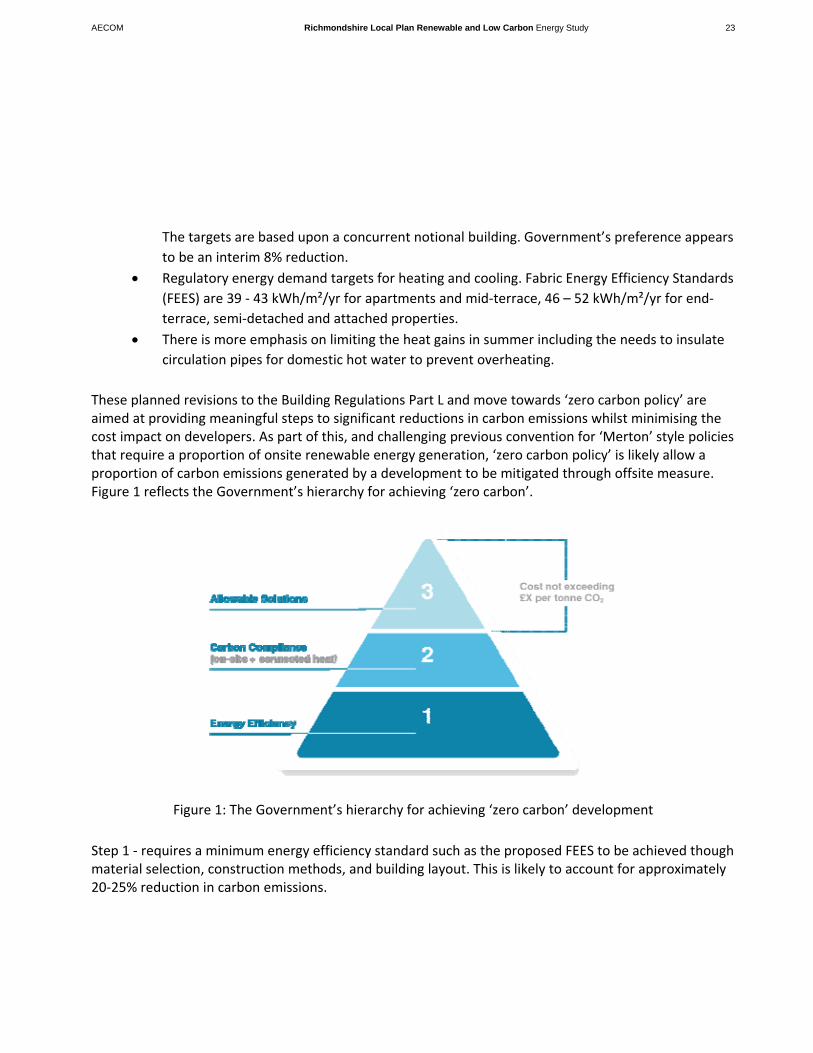
These planned revisions to the Building Regulations Part L and move towards ‘zero carbon policy’ are aimed at providing meaningful steps to significant reductions in carbon emissions whilst minimising the cost impact on developers. As part of this, and challenging previous convention for ‘Merton’ style policies that require a proportion of onsite renewable energy generation, ‘zero carbon policy’ is likely allow a proportion of carbon emissions generated by a development to be mitigated through offsite measure. Figure 1 reflects the Government’s hierarchy for achieving ‘zero carbon’.
Figure 1: The Government’s hierarchy for achieving ‘zero carbon’ development
Step 1 ‐ requires a minimum energy efficiency standard such as the proposed FEES to be achieved though material selection, construction methods, and building layout. This is likely to account for approximately 20‐25% reduction in carbon emissions.

AECOM Richmondshire Local Plan Renewable and Low Carbon Energy Study 24
Step 2 – renewable and low carbon energy must be supplied on‐site to meet the CO2 reductions required for Carbon Compliance (the levels proposed are based around the maximum viable savings which can be achieved across a range of developments). This level is yet to be defined.
Step 3 – once carbon compliance has been achieved onsite, further CO2 reduction can be made either on‐site, or though off site savings (known as Allowable Solutions). The third phase, the policy around allowable solutions, is still being developed by the Government but likely allowable solutions include:
Further CO2 reductions on and off‐site;
Energy efficient appliances;
Advanced forms of building control system which reduce the level of energy use in the home;
Exports of low carbon or renewable heat from the development to other developments; or
Investments in low and zero carbon community heat infrastructure.
Research by the Zero Carbon Hub titled ‘Allowable Solutions for Tomorrow’s Homes’ (July 2011) outlines the latest proposals and recommendations for how allowable solutions should be embedded in policy and administered. A key aspect of allowable solutions would be for the local planning authority (LPA) to collect allowable solutions financial contributions from developers. The Department for Communities and Local Government announced in August 2010 that they would implement a community energy fund, which would allow developers to make payments to the LPA or community. This would provide local councils with the ability to create policy which could determine how funds can best be used to meet government standards in a way that suits local circumstances. As in the absence of local policy, developer contributions would be delivered through a national list of allowable solution projects, the Zero Carbon Hub recommend that LPAs prepare for future allowable solutions by developing policies for contribution collection and identify potential allowable solution projects.
3.4. Government Incentives
Feed‐in Tariffs (FITs) were introduced in April 2010 to replace the support provided by the Low Carbon Buildings Programme and stimulate increased vigour in the take up of installation of small to medium scale renewable electricity generation.
The scheme includes:
Fixed payment from the electricity supplier for every kWh generated (the “generation tariff”).
A guaranteed minimum payment additional to the generation tariff for every kWh exported to the wider electricity market (the “export tariff”).

AECOM Richmondshire Local Plan Renewable and Low Carbon Energy Study 25
Generators receiving FITs will also benefit from on‐site use: where they use the electricity they generate on‐site, they will be able to offset this against electricity they would otherwise have had to buy.
Technologies included: wind, solar PV, hydro, anaerobic digestion and non‐renewable micro CHP.
Tariffs are tax free and will be paid for 25 years for new projects.
The tariff levels proposed have been calculated to ensure that the total benefits an investor can be expected to achieve (from the generation tariff, the export tariff and/or the offsetting benefit) should compensate the investor for the costs of the installation as well as provide financial return.
The government intends to set tariffs at a level to encourage investment in small scale low carbon generation. The rate of return will be established between 5% and 8%.
The proposed tariff levels for new projects will decrease by predetermined rates each year (“degression”). The tariff rate agreed at the project outset will be maintained for the 20 year period providing guaranteed returns for each installation.
Since its introduction, however, the Government has mentioned that it will come under review in 2013. In March 2011, the coalition government cut the incentive for larger scale solar installations (greater than 50kW) by more than 50%. While this will not directly impact micro‐generation installations, it does suggest that as a relatively new policy, FITs may continue to undergo changes going forward.
On 10 March 2011, the Government confirmed that the Renewable Heat Incentive (RHI) was to open for applications for the first phase of funding. Phase one was introduced on 28 November 2011. The first phase of funding focuses on supporting large emitters in the non‐domestic sector. As part of this phase, the Government also initiated the Renewable Heat Premium Payments (RHPP) programme, which is a £15m pilot programme to test installing renewable heating systems in homes. The first phase of the RHPP closed on 31 March 2012; however, pre‐registration for a second phase of funding is already underway. Phase 2 will run from 1 May 2012 to 31 March 2013.
The RHI represents over £850m of government investment. There is no upper limit to the size of heat equipment eligible under the Renewable Heat Incentive and anyone who installs a renewable energy system producing heat after July 15th 2009 is eligible. The following technologies are included in the scheme:
Solid and gaseous biomass, solar thermal, ground and water source heat‐pumps, on‐site biogas, deep geothermal, energy from waste and injection of biomethane into the grid.
AECOM Richmondshire Local Plan Renewable and Low Carbon Energy Study 26
Unlike FITs, tariffs will be paid not on the basis of a metered number of kWh generated, but instead on a “deemed” number of kWh, namely the reasonable heat requirement (or heat load) that the installation is intended to serve.
Tariff levels will be calculated to bridge the financial gap between the cost of conventional and renewable heat systems at all scales, with additional compensation for certain technologies for an element of the non‐financial cost and a rate of return of 12% on the additional cost of renewables, with 6% for solar thermal.
Starting in October 2012, the UK government will introduce the UK to improve the energy efficiency of all properties in the country. The funding enables owners to install energy efficient improvements with no upfront cost. Instead loans will be provided which are paid back as a surcharge on the energy bills. The scheme is attached to the address, rather than a specific person, which means that there is no financial loss when selling a building. All energy efficiency improvements made to homes or businesses qualify provided that they meet the ‘Golden Rule’ where the lifetime financial savings outweigh the capital cost plus finance cost, resulting in lower overall energy bills.
3.5. Regional and Local Policy
Since July 2010, it has been the Government’s clear intention to revoke the Regional Spatial Strategies (RSS), however concerns over the impact of the removal of this tier of government has resulted in the Government voluntarily undertaking an environmental assessment of the revocation of the existing regional strategies. As such, the Yorkshire and Humber Regional Spatial Strategy to 2026 (2008) remains a statutory planning document. In any case, the policies and baseline studies contained within the RSS important context, with the Climate Change and Resource Use policy (and its supporting evidence) offering insight into what is possible within the region. By 2016, the RSS set a target to reduce greenhouse gas emissions 20‐25% compared to 1990 levels. “Encouraging better energy, resource, and water efficient building,” and “increasing renewable energy capacity and carbon capture” were listed as effective strategies for reducing emissions after 2016.
Furthermore, in 2011 Local Government Yorkshire and Humber (LGYH) published research using Department for the Environment and Climate Change (DECC) methodology for assessing renewable and low carbon energy capacity in Yorkshire and Humber6. This report included appendices outlining the potential for renewable energy specific to Richmondshire suggesting that the District has the potential technical capacity to deliver 713 GWh of energy. These findings are revisited and analysed further in this document balanced against other delivery constraints.
Both the Richmondshire and North Yorkshire Sustainable Community Strategies (SCS) included carbon reduction and renewable energy generation aspirations7,8. While both SCSs were supportive of
6 Local Government of Yorkshire and Humber (2011) Low carbon and renewable energy capacity in Yorkshire and Humber 7 Richmondshire Local Strategic Partnership (2006) Richmondshire 2021: Sustainable Community Strategy
AECOM Richmondshire Local Plan Renewable and Low Carbon Energy Study 27
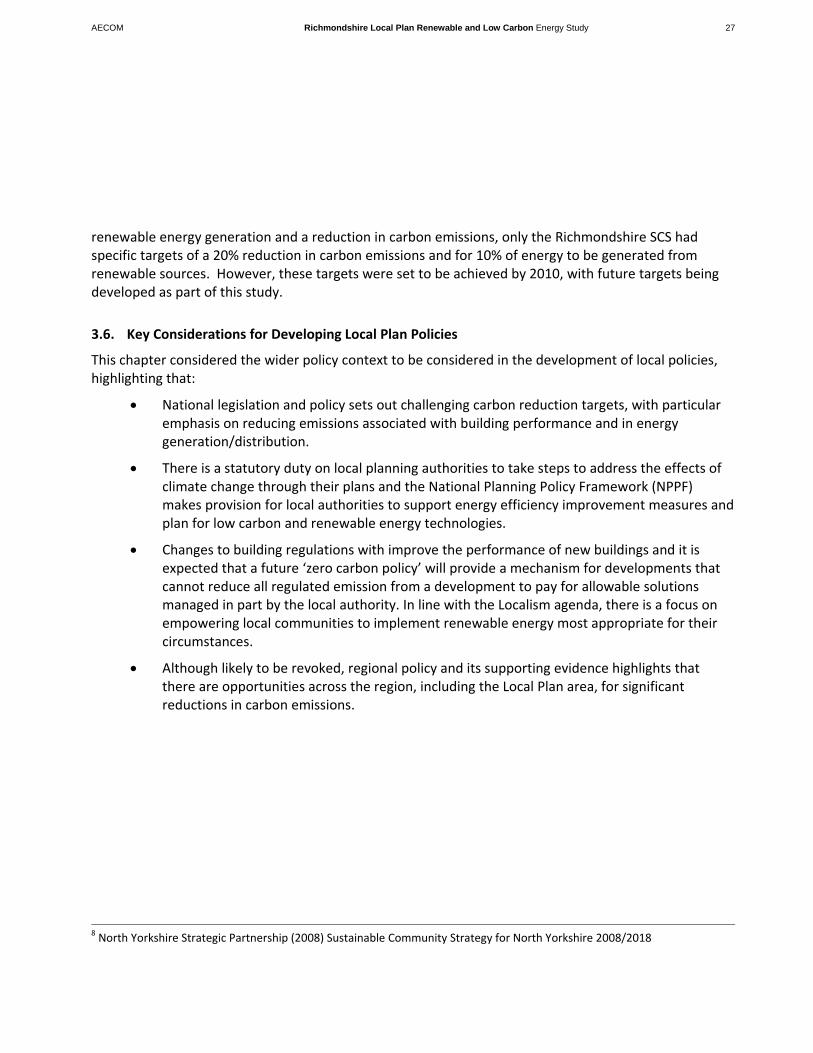
renewable energy generation and a reduction in carbon emissions, only the Richmondshire SCS had specific targets of a 20% reduction in carbon emissions and for 10% of energy to be generated from renewable sources. However, these targets were set to be achieved by 2010, with future targets being developed as part of this study.
3.6. Key Considerations for Developing Local Plan Policies
This chapter considered the wider policy context to be considered in the development of local policies, highlighting that:
National legislation and policy sets out challenging carbon reduction targets, with particular emphasis on reducing emissions associated with building performance and in energy generation/distribution.
There is a statutory duty on local planning authorities to take steps to address the effects of climate change through their plans and the National Planning Policy Framework (NPPF) makes provision for local authorities to support energy efficiency improvement measures and plan for low carbon and renewable energy technologies.
Changes to building regulations with improve the performance of new buildings and it is expected that a future ‘zero carbon policy’ will provide a mechanism for developments that cannot reduce all regulated emission from a development to pay for allowable solutions managed in part by the local authority. In line with the Localism agenda, there is a focus on empowering local communities to implement renewable energy most appropriate for their circumstances.
Although likely to be revoked, regional policy and its supporting evidence highlights that there are opportunities across the region, including the Local Plan area, for significant reductions in carbon emissions.
8 North Yorkshire Strategic Partnership (2008) Sustainable Community Strategy for North Yorkshire 2008/2018


Building Energy and Carbon Baseline
AECOM Richmondshire Local Plan Renewable and Low Carbon Energy Study 30
4.1. Introduction
Before policy and actions for reduction of energy‐related carbon can be developed, it is important to understand how much building related carbon is generated in the Local Plan area – the carbon baseline. This chapter considers the existing and future performance of homes and buildings in the Local Plan area in terms of consumption of energy [both electricity and heat]. First, it considers the current performance of existing buildings, and then considers how energy consumption is likely to change over time. Secondly, it considers the level of growth expected over the Core Strategy period until 2028 and the additional energy consumption this growth will entail. The energy modelling described in the Chapter was undertaken using AECOM energy models and building typologies developed through professional research projects.
4.2. Energy and CO2 Emissions – Current Status
DECC monitor carbon emissions data on a local authority basis. The data for 2010 has been used to compare CO2 emissions by sector in Richmondshire with that of Yorkshire and Humber and the UK as a whole in table 1 below. It shows that CO2 emissions per capita across the whole of Richmondshire District9 are higher than that of Yorkshire and Humber as a whole at 9.6Kt CO2 and 8.2 Kt CO2 respectively. Reflecting the rural nature of the area, emissions from Industry and Commercial properties are well below the regional and national average and road transport emissions are significantly higher. Domestic emissions are slightly above the regional average, but similar to the national picture.
9 Note that the lowest geographical area that this data is reported is for the Local Authority. It cannot be disaggregated just for the Local Plan area. However, as most of the settlements are in the Local Plan area the industrial and commercial emissions, as well as the domestic emissions are likely to reflect the Local Plan area. Transport related emission, which are particularly high, reflects the rural nature of the District including the National Park, and as such, is probably skewed when considering just the Local Plan area. More detailed analysis, just at the Local Plan area has been included later in this chapter.
4. Building Energy and Carbon Baseline

AECOM Richmondshire Local Plan Renewable and Low Carbon Energy Study 31
Table 1: Comparison of carbon emissions (Kilotonnes of CO2,) for Richmondshire, Yorkshire & Humber and UK (DECC 2009)
Richmondshire District
Population: 52,000
Yorkshire & Humber
Population: 5.28m
UK Average
Population: 62.26m
KtCO2 % Per Capita
KtCO2 % Per
Capita KtCO2 %
Per Capita
Industry & Commercial
135 27% 2.5 730 38% 4.1 21,245 49% 3.2
Domestic 123 24% 2.3 657 34% 2.2 11,272 26% 2.2
Road Transport 251 49% 4.7 522 27% 2.0 10,473 24% 2.0
Total Emissions 508 100% 9.6 1,907 100% 8.2 43,247 100% 8.2
4.3. Energy Demand of Existing Residential Buildings
Energy in the home is generally used in one of two ways, to power appliances which is usually done using electricity and to heat spaces/water, which is usually done using gas supplied through the national gas grid. The table below shows the average electricity and gas, per residential consumer in 200910 for the Local Plan area and compares them to the averages for Yorkshire and Humber and the UK. Figures 2 and 3 show how the average electricity and gas use varies spatially across the Local Plan area by Lower Layer Super Output Area (LLSOA)11.
Table X: Average energy consumption in kWh per residential consumer (DECC, 2009)
Local Plan area
Yorkshire & Humber
UK
Electricity (kWh) 4,521 3,849 4,198
Gas (kWh) 15,925 15,760 16,906
Total 20,446 19,609 21,104
10 This is the latest complete data from DECC at this time. 11 Super Output Areas (SOAs) are a geography designed to improve the reporting of small area statistics for the 2001 Census. They contain around 125 households. Lower Layer Super Output Areas are built from groups of contiguous Super Output Areas and have been automatically generated to be as consistent in population size as possible, and typically contain from four to six Super Output Areas. The Minimum population is 1000 and the mean is 1500.
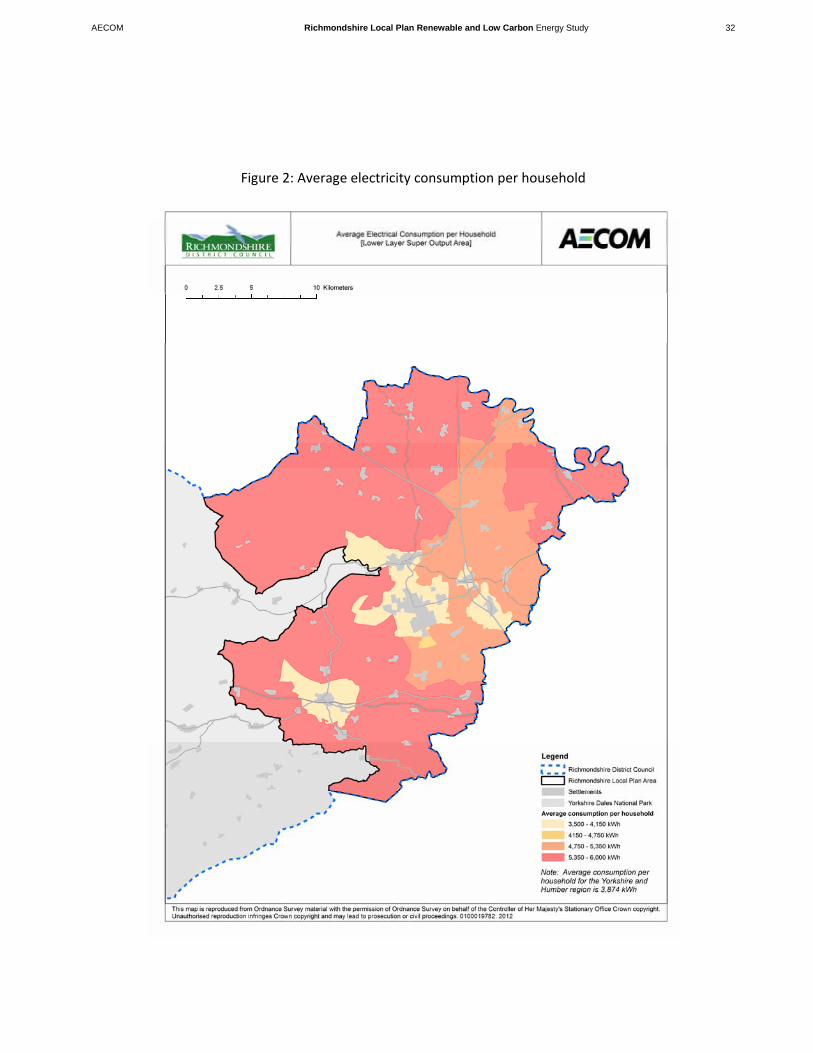
AECOM Richmondshire Local Plan Renewable and Low Carbon Energy Study 32
Figure 2: Average electricity consumption per household

AECOM Richmondshire Local Plan Renewable and Low Carbon Energy Study 33
Figure 3: Average gas consumption per household

AECOM Richmondshire Local Plan Renewable and Low Carbon Energy Study 34
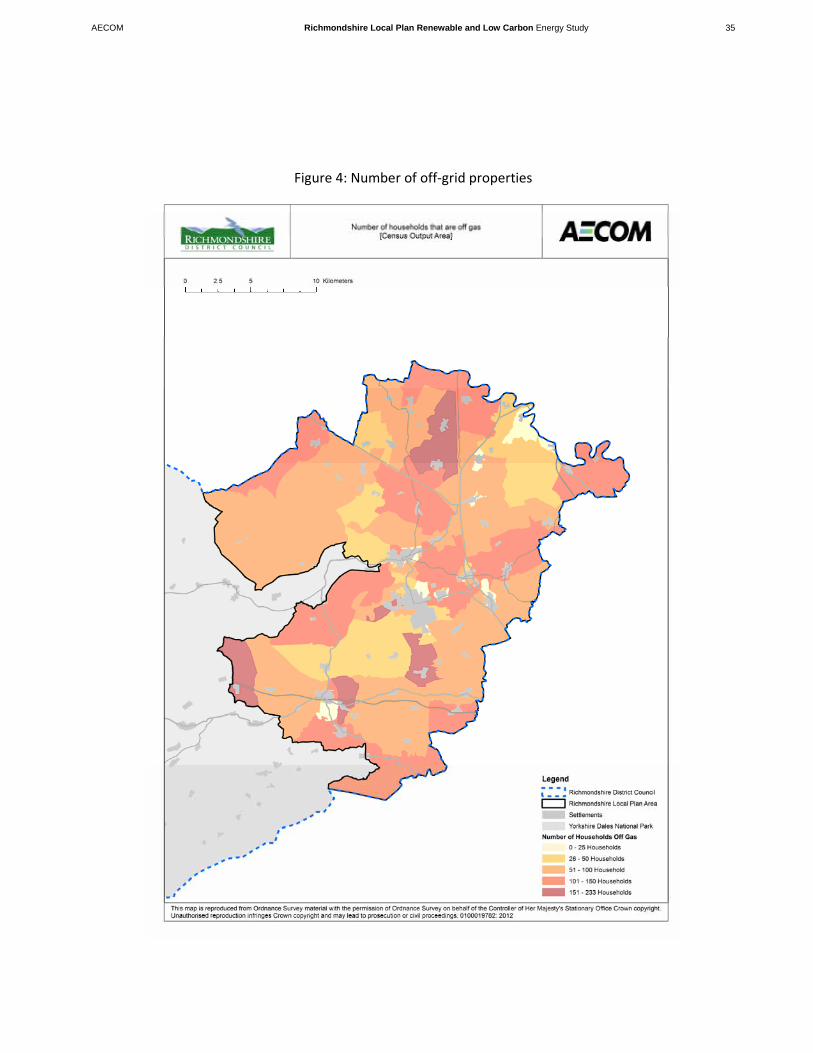
However, as Richmondshire is a rural district the national gas grid does not extend to all properties. As such, there are a significant number of properties (7,868) in the Local Plan area that are not on the gas grid. These properties predominantly use either oil (31.2GWh12) or coal (29.8GWh13) for heating. Some homes may also use electricity for heating, reflecting higher than average electricity use in some of the more rural areas. Figure 4 highlights the number of properties within a Super Output Area (SOA) that are off grid, highlighting areas around Hunton, Harmby, Melsonby, and Aldbrough St. John.
12 Derived from DECC Sub‐national consumption of other fuels 2010 tonnes oil equivalent data 13 ibid
AECOM Richmondshire Local Plan Renewable and Low Carbon Energy Study 35
Figure 4: Number of off‐grid properties
AECOM Richmondshire Local Plan Renewable and Low Carbon Energy Study 36
From this understanding of how energy is being used in the Local Plan area, it is possible to start to build a picture of the energy performance of residential properties within these areas and in turn target improvement measures to poorer performing areas. For example, gas demand is lower in more built up areas which are on the national gas grid. This is to be expected as buildings in close proximity shelter each other from the cooling impact of wind and those with shared walls have better efficiency, requiring less heating. On the other hand, areas to the north and north west of the Local Plan area that are off grid, and therefore obviously have low gas use, have higher electricity consumption, probably due to the use of electricity to heat space and water. It is generally expected that homes in rural areas use more gas and electricity as they are generally more exposed to the elements and larger, requiring more space heating and requiring more lighting and appliances. With recent policies focusing development to existing settlements, rural properties are often older with poorer building fabric efficiency.
The priority for the Local Plan area should therefore be to target low carbon heating opportunities for those properties that are off‐grid and target efficiency improvements, such as draft proofing, insulation and double glazing, particularly in rural households.
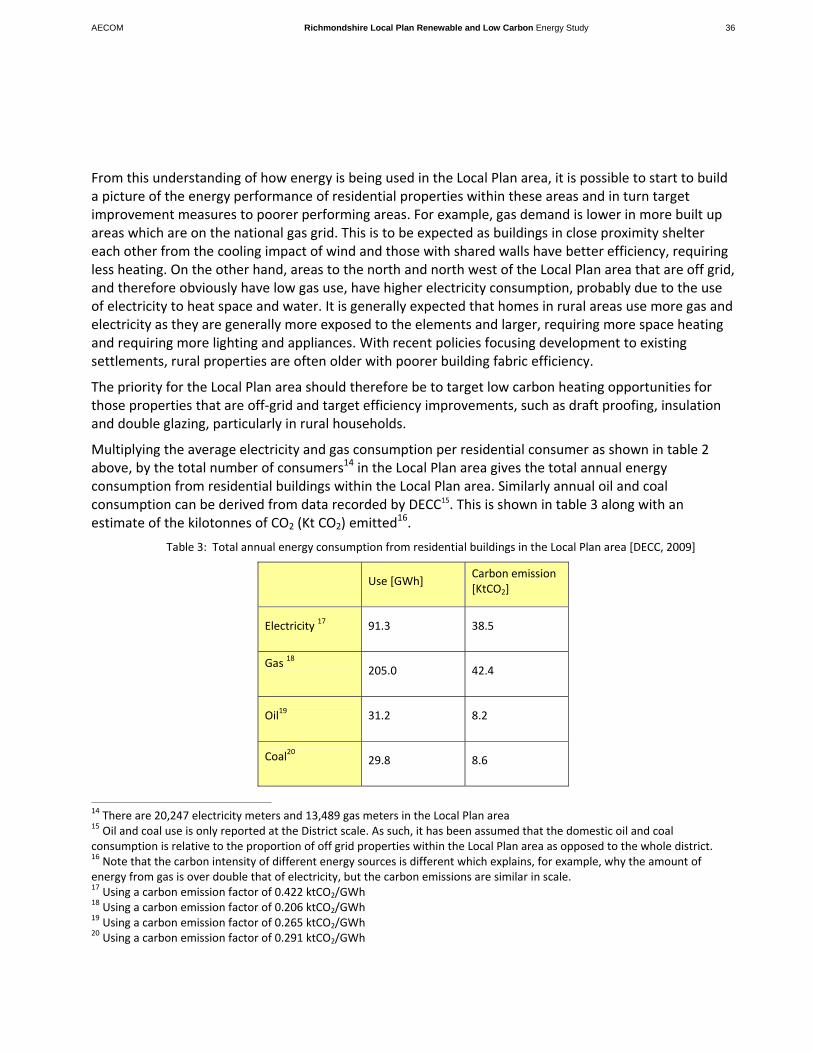
Multiplying the average electricity and gas consumption per residential consumer as shown in table 2 above, by the total number of consumers14 in the Local Plan area gives the total annual energy consumption from residential buildings within the Local Plan area. Similarly annual oil and coal consumption can be derived from data recorded by DECC15. This is shown in table 3 along with an estimate of the kilotonnes of CO2 (Kt CO2) emitted16.
Table 3: Total annual energy consumption from residential buildings in the Local Plan area [DECC, 2009]
Use [GWh] Carbon emission [KtCO2]
Electricity 17 91.3 38.5
Gas 18
205.0 42.4
Oil19 31.2 8.2
Coal20
29.8 8.6
14 There are 20,247 electricity meters and 13,489 gas meters in the Local Plan area 15 Oil and coal use is only reported at the District scale. As such, it has been assumed that the domestic oil and coal consumption is relative to the proportion of off grid properties within the Local Plan area as opposed to the whole district. 16 Note that the carbon intensity of different energy sources is different which explains, for example, why the amount of energy from gas is over double that of electricity, but the carbon emissions are similar in scale. 17 Using a carbon emission factor of 0.422 ktCO2/GWh 18 Using a carbon emission factor of 0.206 ktCO2/GWh 19 Using a carbon emission factor of 0.265 ktCO2/GWh 20 Using a carbon emission factor of 0.291 ktCO2/GWh

AECOM Richmondshire Local Plan Renewable and Low Carbon Energy Study 37
Fuel poverty
A home is determined to be in fuel poverty when 10% or more of the income is used for energy expenditure. A number of indicators are needed to find fuel poor households – SAP ratings21 and efficiency levels are not an indication because the homeowner may be sufficiently wealthy for energy expenditure to not be an issue. Therefore surveys combined with a number of other social and demographic indicators are used to determine levels of fuel poverty.
Data from the UK government suggests that on average, 16% of homes are in fuel poverty in England with a standard deviation of around 5% at local authority level. Fuel poverty within the Local Plan area is towards the upper end of this proportion; with 4,02922 or approximately 20% of homes considered to be in fuel poverty. Figure 5 shows that fuel poverty is most prevalent within the more sparsely populated rural areas, with the lowest levels within the main settlements. This correlates with the areas of greatest gas consumption, and those properties off the gas grid and relying predominantly on more expensive methods of heating homes using oil, coal and electricity.
21 The Standard Assessment Procedure (SAP) is the Government's recommended method for rating the energy efficiency of homes and is used for Building Regulations Part L compliance. The procedure calculates the annual regulated energy demands for a home and the associated CO2 emissions. These are used to estimate annual energy costs which is used to provide a SAP rating from 1 (high energy costs) to 100 (no energy costs). This score can then be converted into a rating from A-G used for housing performance certificates. 22 Sub-regional Fuel Poverty Levels, DECC (2010)
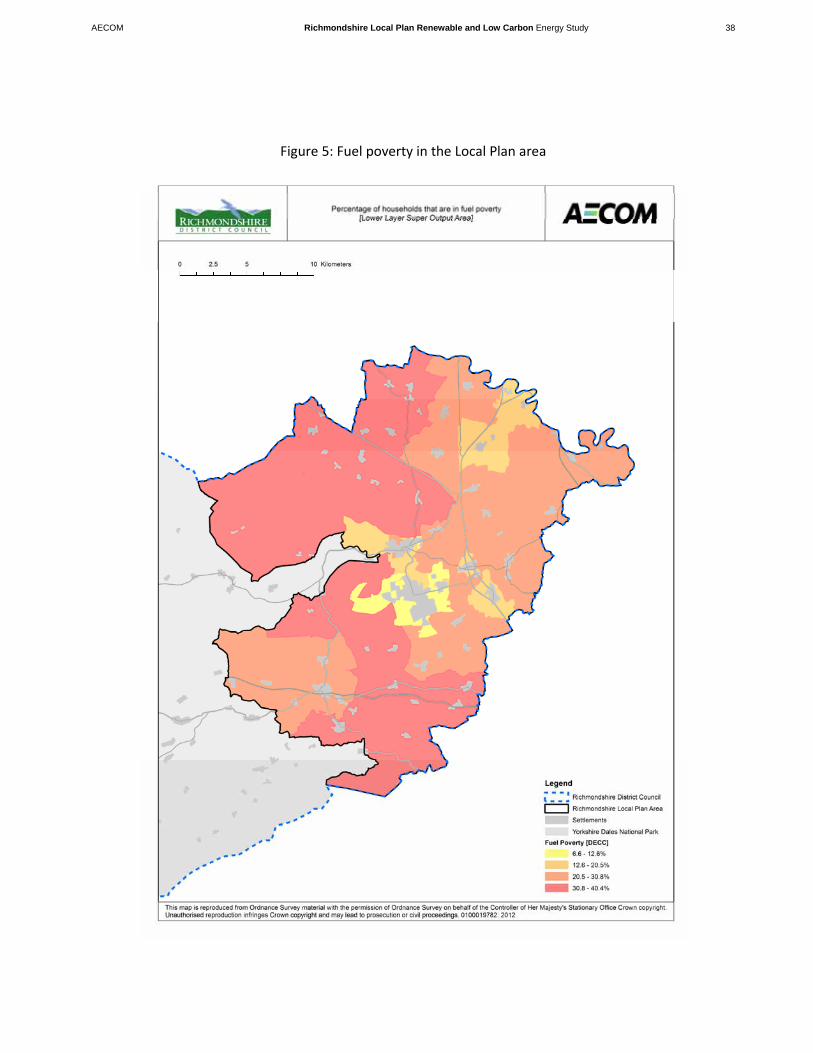
AECOM Richmondshire Local Plan Renewable and Low Carbon Energy Study 38
Figure 5: Fuel poverty in the Local Plan area

AECOM Richmondshire Local Plan Renewable and Low Carbon Energy Study 39
4.4. Energy Performance of Existing Non Residential Buildings
The annual energy consumption of non residential building in Richmondshire is shown in the table below. Given commercial sensitivity relating to energy use, current reporting from DECC does not allow for accurate spatial analysis of consumption. The most accurate energy use data is presented at a District Wide scale. However, as the majority of commercial and industrial operations are likely to be within the Local Plan area, it is sensible to assume that District wide figures are a useful proxy for the Local Plan area itself.
Table 4: Annual energy consumption from non residential buildings [DECC, 2009]
GWh KtCO2
Electricity [GWh] 139 58.7
Gas [GWh] 159 32.7
Oil 115 30.4
Coal 6.9 2.0
The assessment of energy efficiency in the non domestic sector is difficult due to the range of building forms, construction, and usage types. A large amount of advice is available from bodies such as the Carbon Trust on reducing building and process energy, but it is not simple to quantify the current UK levels, or the remaining potential for making energy efficiency improvements. Unlike the domestic sector where there are a number of surveys covering energy efficiency and a national and local level, there are no such equivalent surveys for the non‐domestic sector.
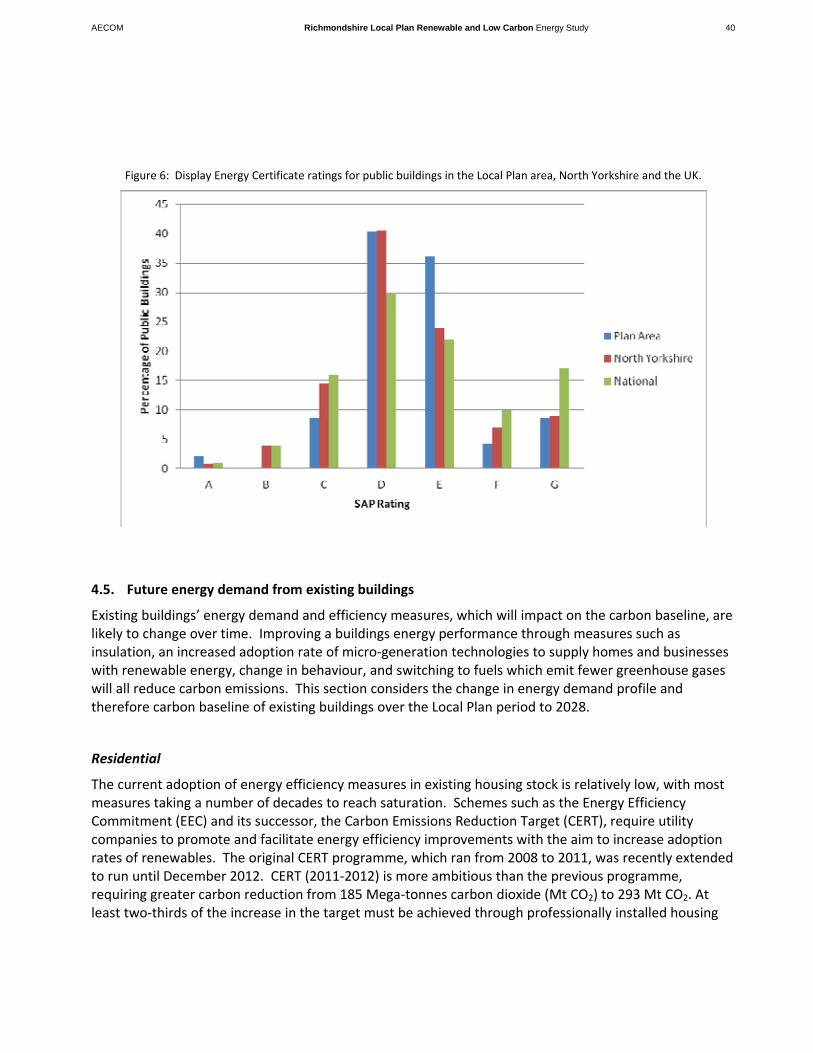
Display energy certificates are required for all public buildings and should be displayed in a position where they can be viewed publicly. They are calculated by assessing the actual energy consumption against a set of standard benchmarks of typical building types, with adjustments allowed for climate changes in occupancy and special uses. Figure 6 below shows that the 48 energy performance certificates issued for public buildings in the Local Plan area (some buildings such as schools are split into individual blocks) are comparable to the national and sub‐regional picture, with the vast majority (88%) with a rating of D or below.
AECOM Richmondshire Local Plan Renewable and Low Carbon Energy Study 40
Figure 6: Display Energy Certificate ratings for public buildings in the Local Plan area, North Yorkshire and the UK.
4.5. Future energy demand from existing buildings
Existing buildings’ energy demand and efficiency measures, which will impact on the carbon baseline, are likely to change over time. Improving a buildings energy performance through measures such as insulation, an increased adoption rate of micro‐generation technologies to supply homes and businesses with renewable energy, change in behaviour, and switching to fuels which emit fewer greenhouse gases will all reduce carbon emissions. This section considers the change in energy demand profile and therefore carbon baseline of existing buildings over the Local Plan period to 2028.
Residential
The current adoption of energy efficiency measures in existing housing stock is relatively low, with most measures taking a number of decades to reach saturation. Schemes such as the Energy Efficiency Commitment (EEC) and its successor, the Carbon Emissions Reduction Target (CERT), require utility companies to promote and facilitate energy efficiency improvements with the aim to increase adoption rates of renewables. The original CERT programme, which ran from 2008 to 2011, was recently extended to run until December 2012. CERT (2011‐2012) is more ambitious than the previous programme, requiring greater carbon reduction from 185 Mega‐tonnes carbon dioxide (Mt CO2) to 293 Mt CO2. At least two‐thirds of the increase in the target must be achieved through professionally installed housing
AECOM Richmondshire Local Plan Renewable and Low Carbon Energy Study 41
insulation. The expectation is for this measure to lead to energy supplier investment of approximately £5.5bn between 2008 and 2012.
Suppliers must focus 40% of their activity on a ‘Priority Group’ of vulnerable and low‐income households, including those receiving certain income/disability benefits and pensioners over 70. By increasing the energy efficiency of UK households, CERT will not only help households from falling into fuel poverty but is also expected to help alleviate fuel poverty.
The Energy Act 2011 included provision for a new 'Green Deal', which will ostensibly replace CERT. It intends to reduce building related carbon emissions by providing finance for investment in energy efficiency measures at no up‐front cost to the householder. Starting in October 2012 finance will be able to be secured as a charge on the property to be repaid through a surcharge on the electricity bill over a period of up to 25 years. The scheme is attached to the address, rather than a specific person, which means that there is no financial loss when selling a building. All energy efficiency improvements made to homes or businesses qualify provided that they meet the ‘Golden Rule’ where the lifetime financial savings outweigh the capital cost plus finance cost, resulting in lower overall energy bills.
Estimates for energy efficiency across the Local Plan area have been based on a study of the likely penetration of measures by 2028, which are based on historic, current, and new uptake schemes23. These predictions have been done on a nation‐wide scale and utilise expected uptake of a range of energy efficiency measures.
Extrapolating these expected rates of energy efficiency improvements from the 2009 energy demand baseline, as shown in figures 7, it can be seen that electricity demand is likely to increase slightly, as demand for more energy intensive appliances outweighs energy efficiency measures. Heat demand on the other hand is likely to decrease as energy efficiency measures are applied.
23 Delivering Cost Effective Carbon Saving Measures to Existing Homes. BRE for DEFRA. 2007.

AECOM Richmondshire Local Plan Renewable and Low Carbon Energy Study 42
Figure 7: Expected changes in energy demand from existing residential buildings over Local Plan period.
It should be noted that although it is expected that over Local Plan period a proportion of off‐grid properties will switch their fuel source away from oil and coal. It is unlikely to be viable to extend the national gas grid to these areas and therefore the most likely outcome is for these properties to use electric or biomass heating. If, for the purposes of this study it is assumed that the use of coal and oil is reduced by 5% every 5 years with immediate effect then the equivalent of 34GWh of heat would need to be delivered by other sources. As electricity was used, which is still very carbon intensive, this would result in 14ktCO2 per annum as opposed to 0.85ktCO2 if biomass fuel sources were used24.
Non‐residential
Based on Carbon Trust targets for non‐residential buildings, this study has developed estimates for energy efficiency improvement expected through behavioural change, and through capital cost measures. The trend for commercial and industrial development is one of increased efficiency in both electricity and gas use as set out in figure 8. While the Carbon Trust has developed targets for energy reduction in non‐residential buildings, the initiatives are less visible and less coordinated than those for residential buildings.
24 Comparing delivering 34GWh of heat using electricity with a carbon intensity of 0.422ktCO2/GWh against 34GWh of heat from biomass with a carbon intensity of 0.025ktCO2/GWh
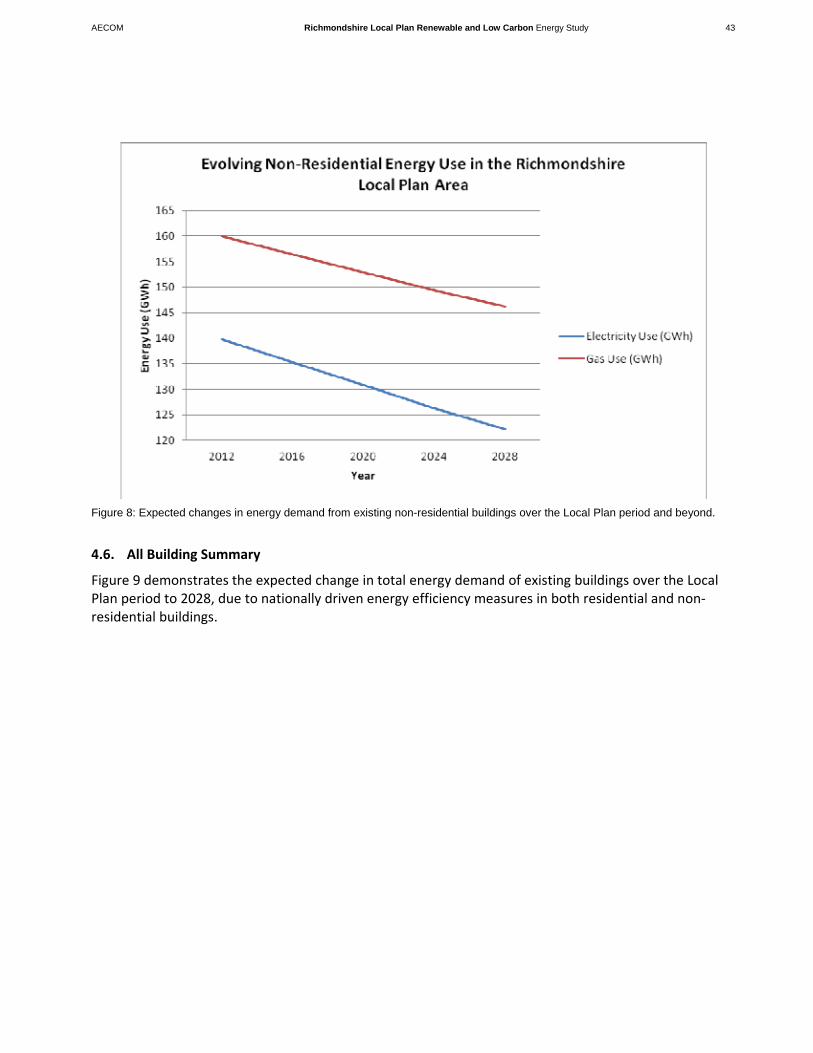
AECOM Richmondshire Local Plan Renewable and Low Carbon Energy Study 43
Figure 8: Expected changes in energy demand from existing non-residential buildings over the Local Plan period and beyond.
4.6. All Building Summary
Figure 9 demonstrates the expected change in total energy demand of existing buildings over the Local Plan period to 2028, due to nationally driven energy efficiency measures in both residential and non‐residential buildings.

AECOM Richmondshire Local Plan Renewable and Low Carbon Energy Study 44
Figure 9: Expected change in electricity and gas demand from existing buildings over the Local Plan period
4.7. Future Growth
New development will increase energy demands in the Local Plan area. Understanding the scale of expected development is crucial to understanding the probable changes in the energy profile. To model the expected energy demand from new development assumptions were made in line with the emerging Local Plan.
Residential Growth
It has been assumed that there will be an additional 3060 new homes in the Local Plan area by 2028, with a build out rate of approximately 180 new homes per annum. It has also been assumed that the average housing density across the Local Plan area will remain at approximately 30 dwellings per hectare and, for the purposes of this study the housing mix to meet this density will be similar (slight variation to meet density / number requirements) to the current housing type mix of:
Table 7: Assumed housing split
Detached Semi Detached Terrace Flat
35.5% 35.5% 23.0% 6.0%
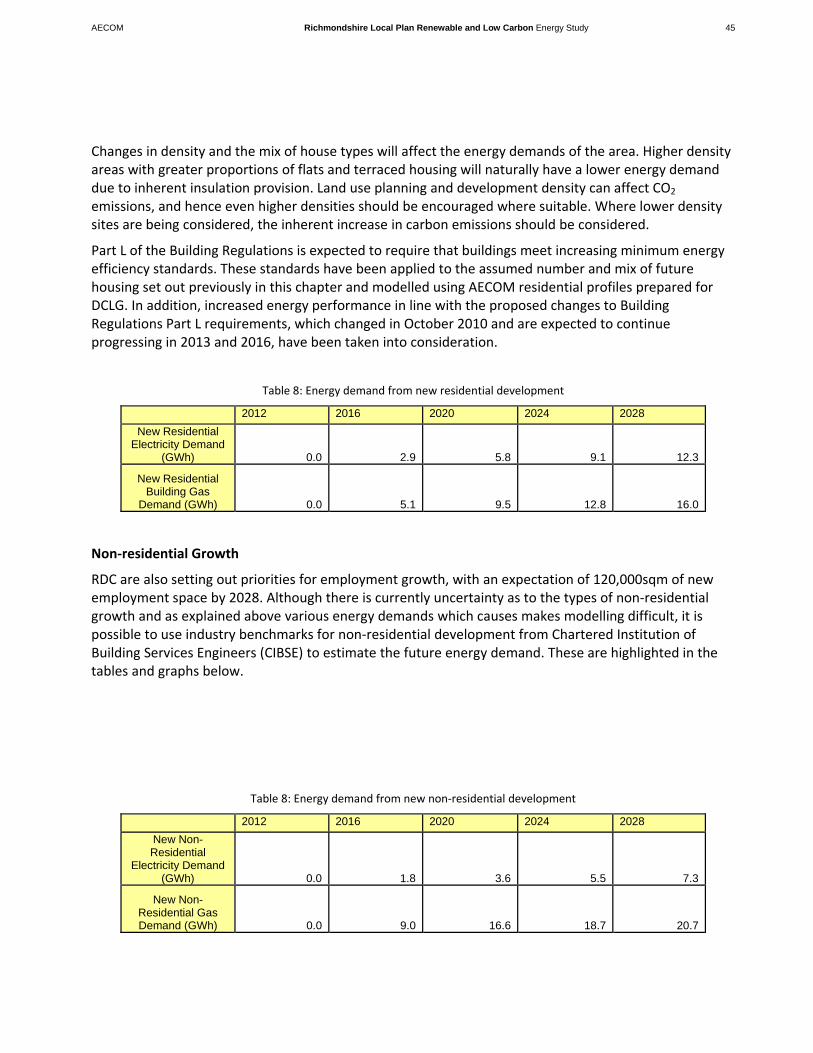
AECOM Richmondshire Local Plan Renewable and Low Carbon Energy Study 45
Changes in density and the mix of house types will affect the energy demands of the area. Higher density areas with greater proportions of flats and terraced housing will naturally have a lower energy demand due to inherent insulation provision. Land use planning and development density can affect CO2 emissions, and hence even higher densities should be encouraged where suitable. Where lower density sites are being considered, the inherent increase in carbon emissions should be considered.
Part L of the Building Regulations is expected to require that buildings meet increasing minimum energy efficiency standards. These standards have been applied to the assumed number and mix of future housing set out previously in this chapter and modelled using AECOM residential profiles prepared for DCLG. In addition, increased energy performance in line with the proposed changes to Building Regulations Part L requirements, which changed in October 2010 and are expected to continue progressing in 2013 and 2016, have been taken into consideration.
Table 8: Energy demand from new residential development
2012 2016 2020 2024 2028
New Residential Electricity Demand
(GWh) 0.0 2.9 5.8 9.1 12.3
New Residential Building Gas
Demand (GWh) 0.0 5.1 9.5 12.8 16.0
Non‐residential Growth
RDC are also setting out priorities for employment growth, with an expectation of 120,000sqm of new employment space by 2028. Although there is currently uncertainty as to the types of non‐residential growth and as explained above various energy demands which causes makes modelling difficult, it is possible to use industry benchmarks for non‐residential development from Chartered Institution of Building Services Engineers (CIBSE) to estimate the future energy demand. These are highlighted in the tables and graphs below.
Table 8: Energy demand from new non‐residential development
2012 2016 2020 2024 2028
New Non-Residential
Electricity Demand (GWh) 0.0 1.8 3.6 5.5 7.3
New Non-Residential Gas Demand (GWh) 0.0 9.0 16.6 18.7 20.7

AECOM Richmondshire Local Plan Renewable and Low Carbon Energy Study 46
4.8. Total energy Demand Profile
The figure below demonstrates the effect of new development on the expected energy profile. It shows that while new development will make up a significant proportion of the energy demand profile, it is still far outweighed by energy demand from existing development.
Figure 10: Comparison of energy demand from existing and new buildings
The tables below summarise the combined energy demand profile of the Local Plan area, along with the individual authorities over the Local Plan period.
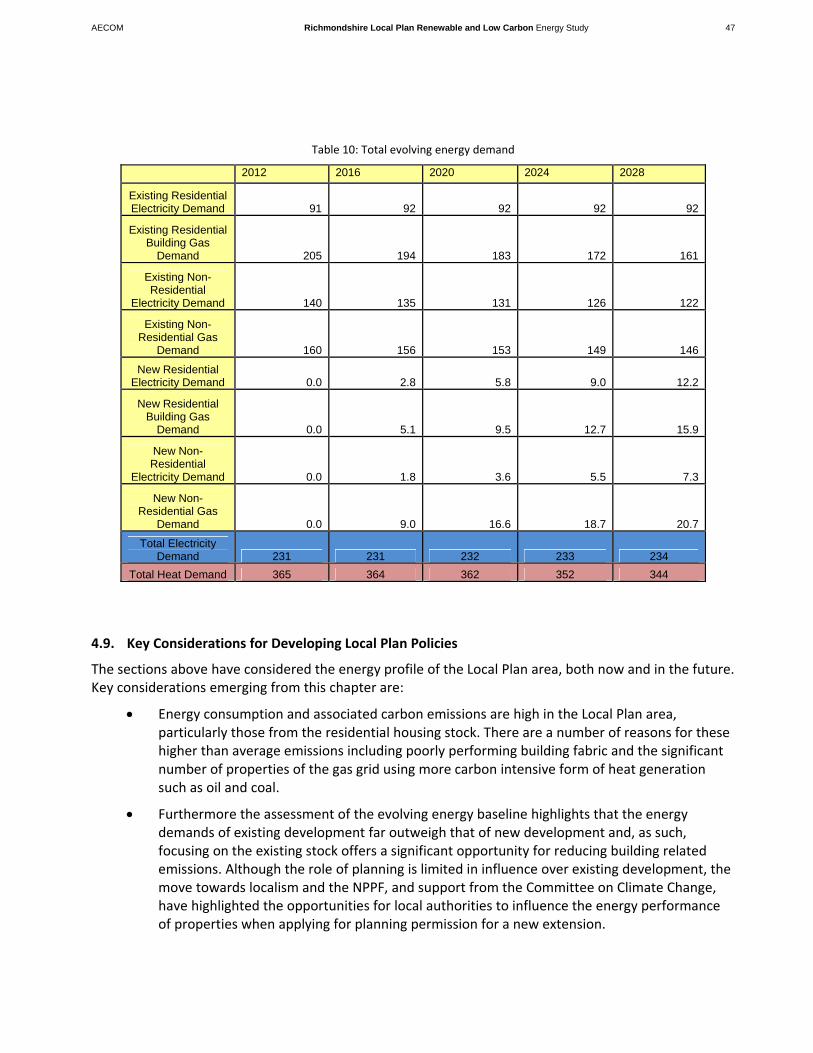
AECOM Richmondshire Local Plan Renewable and Low Carbon Energy Study 47
Table 10: Total evolving energy demand
2012 2016 2020 2024 2028
Existing Residential Electricity Demand 91 92 92 92 92
Existing Residential Building Gas
Demand 205 194 183 172 161
Existing Non-Residential
Electricity Demand 140 135 131 126 122
Existing Non-Residential Gas
Demand 160 156 153 149 146
New Residential Electricity Demand 0.0 2.8 5.8 9.0 12.2
New Residential Building Gas
Demand 0.0 5.1 9.5 12.7 15.9
New Non-Residential
Electricity Demand 0.0 1.8 3.6 5.5 7.3
New Non-Residential Gas
Demand 0.0 9.0 16.6 18.7 20.7
Total Electricity Demand 231 231 232 233 234
Total Heat Demand 365 364 362 352 344
4.9. Key Considerations for Developing Local Plan Policies
The sections above have considered the energy profile of the Local Plan area, both now and in the future. Key considerations emerging from this chapter are:
Energy consumption and associated carbon emissions are high in the Local Plan area, particularly those from the residential housing stock. There are a number of reasons for these higher than average emissions including poorly performing building fabric and the significant number of properties of the gas grid using more carbon intensive form of heat generation such as oil and coal.
Furthermore the assessment of the evolving energy baseline highlights that the energy demands of existing development far outweigh that of new development and, as such, focusing on the existing stock offers a significant opportunity for reducing building related emissions. Although the role of planning is limited in influence over existing development, the move towards localism and the NPPF, and support from the Committee on Climate Change, have highlighted the opportunities for local authorities to influence the energy performance of properties when applying for planning permission for a new extension.

AECOM Richmondshire Local Plan Renewable and Low Carbon Energy Study 48
In addition, the Council could play a key role in increasing energy efficiency of existing buildings. As existing buildings make up the bulk of the future energy demand; therefore retrofitting them should be a priority. Analysis of the Domestic Energy Database can be used, along with information on hard to treat homes (such as through CESP) can be used to target retrofit. Although CESP is coming to an end the launch of the Green Deal due late 2012 offers financial mechanisms to support the uptake of efficiency measures. The Committee on Climate Change highlights that local authorities such as Richmondshire District Council, might play one of two roles:
o Provider ‐ The local authority would take the lead in delivering the Green Deal, procuring a partner to deliver the scheme and possibly raising finance. Birmingham City Council has opted for this approach, suggesting that this would best enable it to achieve objectives to create jobs, alleviate fuel poverty and improve health, while earning an income stream.
o Partner ‐ Delivery and finance of the scheme is undertaken by a commercial partner, with the local authority helping to deliver the scheme. For example, local authorities could coordinate different Green Deal providers in their area, raise awareness amongst consumers, offer joint branding and marketing, provide information about the local housing stock, and provide access to social housing.

AECOM Richmondshire Local Plan Renewable and Low Carbon Energy Study 49
Existing Renewable and Low Carbon Energy Supply Audit

AECOM Richmondshire Local Plan Renewable and Low Carbon Energy Study 50
5.1. Introduction
With the current and expected future CO2 emissions in Richmondshire understood, it is also important to understand the current level of delivery of renewable and low carbon energy. This chapter provides an update to the regional LCRECYH study, to analyse how much renewable and low carbon energy has already been installed in the District relative to similar surrounding authorities; and provides some insight into what installations are expected to be delivered in the short term and potential delivery barriers that might exist in the long term.
5.2. Audit Methodology
Currently, an up‐to‐date, comprehensive database of existing renewable energy installations does not exist in the UK. For this reason, an audit of renewable energy installations in Richmondshire required consulting with a variety of public databases, including:
Department of Energy and Climate Change
Renewable Energy Statistics for the UK (RESTATS)
RenewableUK
International Small Hydro Atlas
Combining outputs from each of these databases provided a robust baseline of existing renewable energy in the District. However, the database represents a snapshot at a given time and the data may not reflect an up‐to‐date reality of what will come forward.
It should also be noted that while energy from waste has been included in the audit and the total of renewable energy generated within the region, it has not been used to compare renewable energy generation across Yorkshire and Humber local authorities. This is because waste disposal is within the remit of the county, but is not within control of district authorities.
As micro‐renewables are permitted development and are, therefore, not recorded in public databases, an estimate had to be used. While installations of micro‐renewable technologies has historically been low, the introduction of the Feed‐in Tariff (FiT) in April 2010 stimulated the industry, particularly the solar PV installations. The FiT database25 provides an accurate portrait of the amount of renewable energy installed since its introduction for each local authority area. Calculating the amount of renewable energy installed in each Yorkshire and Humber local authority required a population based estimation, using the 100,000 national microgeneration schemes installed before the FiT came into effect.26
25 Ofgem E‐serve FiT database (2012) https://www.renewablesandchp.ofgem.gov.uk/Public/ReportManager.aspx?ReportVisibility=1&ReportCategory=0 26 Environmental Change Institute. Oxford University. Available from:
5. Existing Renewable and Low Carbon Energy Supply Audit

AECOM Richmondshire Local Plan Renewable and Low Carbon Energy Study 51
5.3. Richmondshire Local Plan area’s Renewable Energy Installed Capacity
Currently there is approximately 8.5GWh of installed renewable and low carbon energy within Richmondshire District. Landfill gas is responsible for 7.5GWh, while hydro contributes 0.1GWh. The remainder is contributed through micro‐generation. This breakdown of installed renewables in Richmondshire is shown in table 11. For reference, electricity demand in Richmondshire District amounts to approximately 245 GWh.
While Richmondshire Local Plan area produces over 8GWh of renewable energy, it is important to understand the difference between capacity and generating potential. Megawatts (MW) are units of power or capacity, which measure the output from the systems at any given time. Megawatt‐hours (MWh), on the other hand, refer to the amount of energy generated over a given time (usually annually), and takes into account the amount of time the systems are operating a year (the load factor). The two are not directly comparable, particularly because different technologies operate with different load factors.
Table 11: Installed capacity of renewable energy in Richmondshire Local Plan area
Technology MW MWh
Anaerobic Digestion ‐ ‐
Biomass ‐ ‐
Energy from Waste ‐ ‐
Gas ‐ ‐
Hydro 0.01 85
Landfill 1.00 7,534
Solar PV ‐ ‐
Sewage Gas ‐ ‐
Wind ‐ ‐
Microgen27 1.17 922
Total ‐‐ 8,541
It is important to note the table above does not include Combined Heat and Power (CHP) plants. While these installations are a more efficient and lower carbon form of energy generation, their fuel source gas fired CHP is not considered renewable. A full list of installed CHP plants in Yorkshire and Humber can be found in table 12 below. Although Richmondshire does not currently have any operational CHP plants, the MoD have recently received planning consent for a new CHP plant at Catterick Garrison. This list does not include the Ministry of Defence CHP at Catterick Garrison as it is yet to be delivered, however table 14, which highlights renewable and low carbon energy installations currently in development does include the Catterick Garrison CHP plant.
http://www.eci.ox.ac.uk/research/energy/downloads/bmt‐evidence‐micro‐generation.pdf 27 The results for microgen have been adapted from Table 1 to reflect an estimate for the Richmondshire Local Plan area. This has been done assuming 86% of the population of Richmondshire District lives in the Local Plan area.
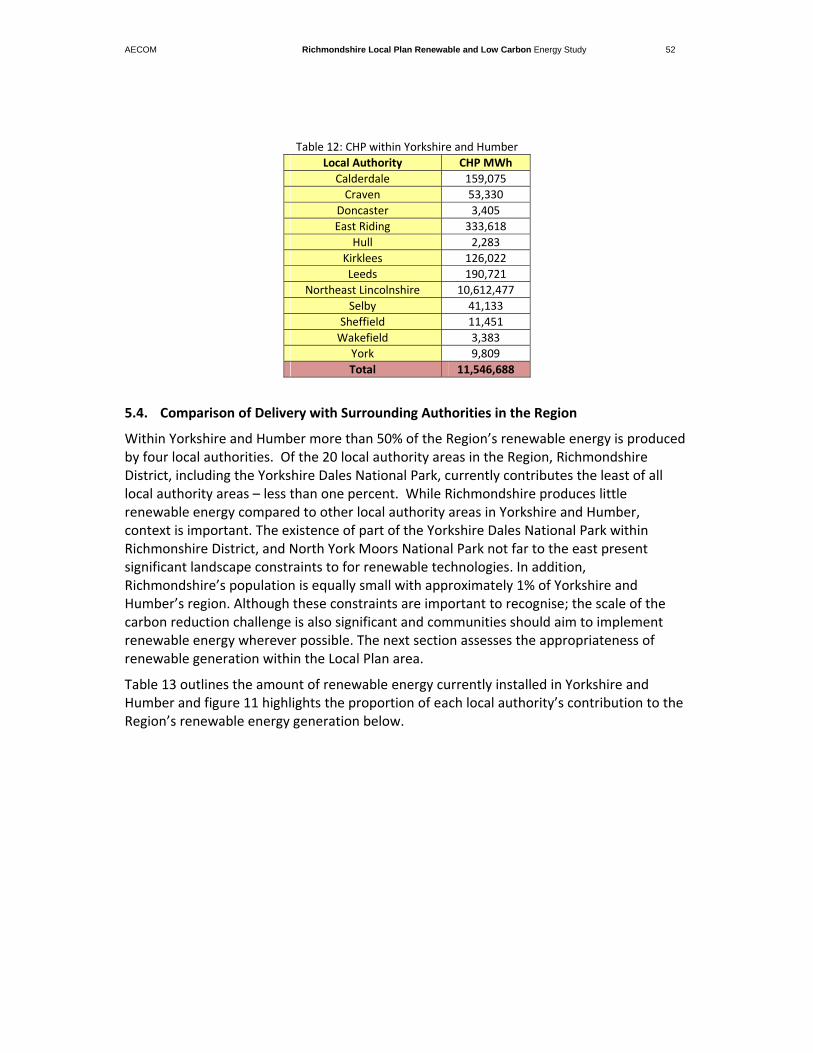
AECOM Richmondshire Local Plan Renewable and Low Carbon Energy Study 52
Table 12: CHP within Yorkshire and Humber
Local Authority CHP MWh
Calderdale 159,075
Craven 53,330
Doncaster 3,405
East Riding 333,618
Hull 2,283
Kirklees 126,022
Leeds 190,721
Northeast Lincolnshire 10,612,477
Selby 41,133
Sheffield 11,451
Wakefield 3,383
York 9,809
Total 11,546,688
5.4. Comparison of Delivery with Surrounding Authorities in the Region
Within Yorkshire and Humber more than 50% of the Region’s renewable energy is produced by four local authorities. Of the 20 local authority areas in the Region, Richmondshire District, including the Yorkshire Dales National Park, currently contributes the least of all local authority areas – less than one percent. While Richmondshire produces little renewable energy compared to other local authority areas in Yorkshire and Humber, context is important. The existence of part of the Yorkshire Dales National Park within Richmonshire District, and North York Moors National Park not far to the east present significant landscape constraints to for renewable technologies. In addition, Richmondshire’s population is equally small with approximately 1% of Yorkshire and Humber’s region. Although these constraints are important to recognise; the scale of the carbon reduction challenge is also significant and communities should aim to implement renewable energy wherever possible. The next section assesses the appropriateness of renewable generation within the Local Plan area.
Table 13 outlines the amount of renewable energy currently installed in Yorkshire and Humber and figure 11 highlights the proportion of each local authority’s contribution to the Region’s renewable energy generation below.
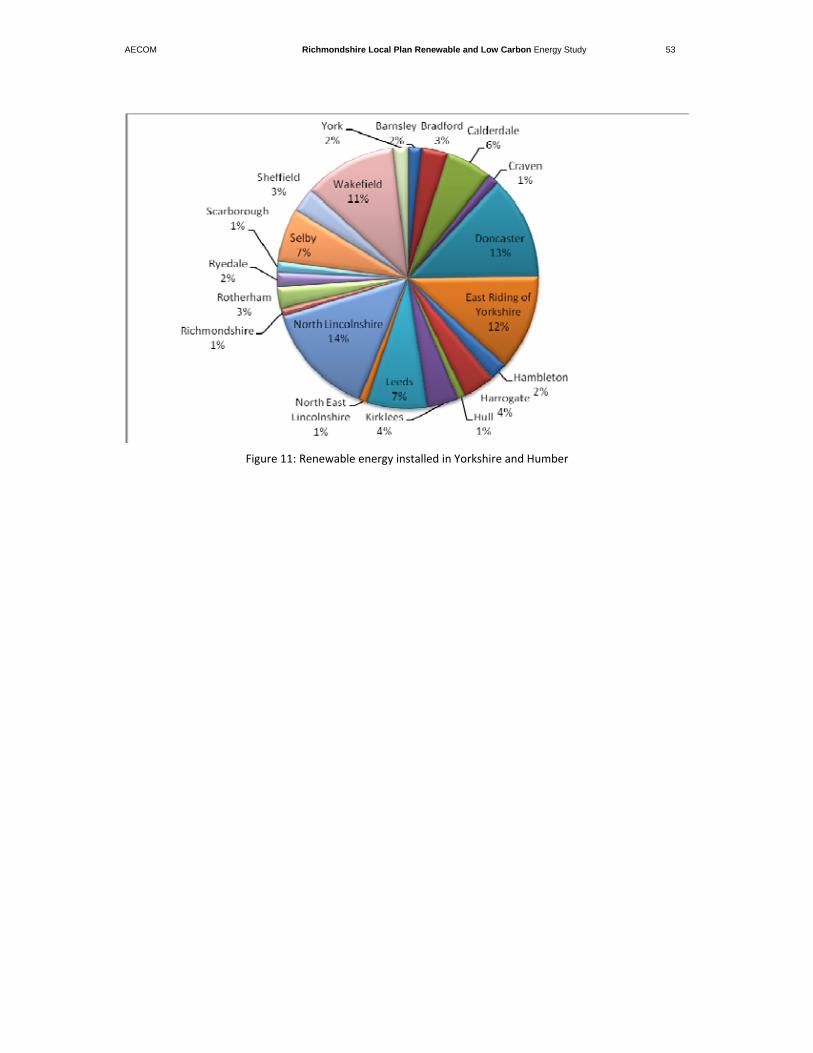
AECOM Richmondshire Local Plan Renewable and Low Carbon Energy Study 53
Figure 11: Renewable energy installed in Yorkshire and Humber
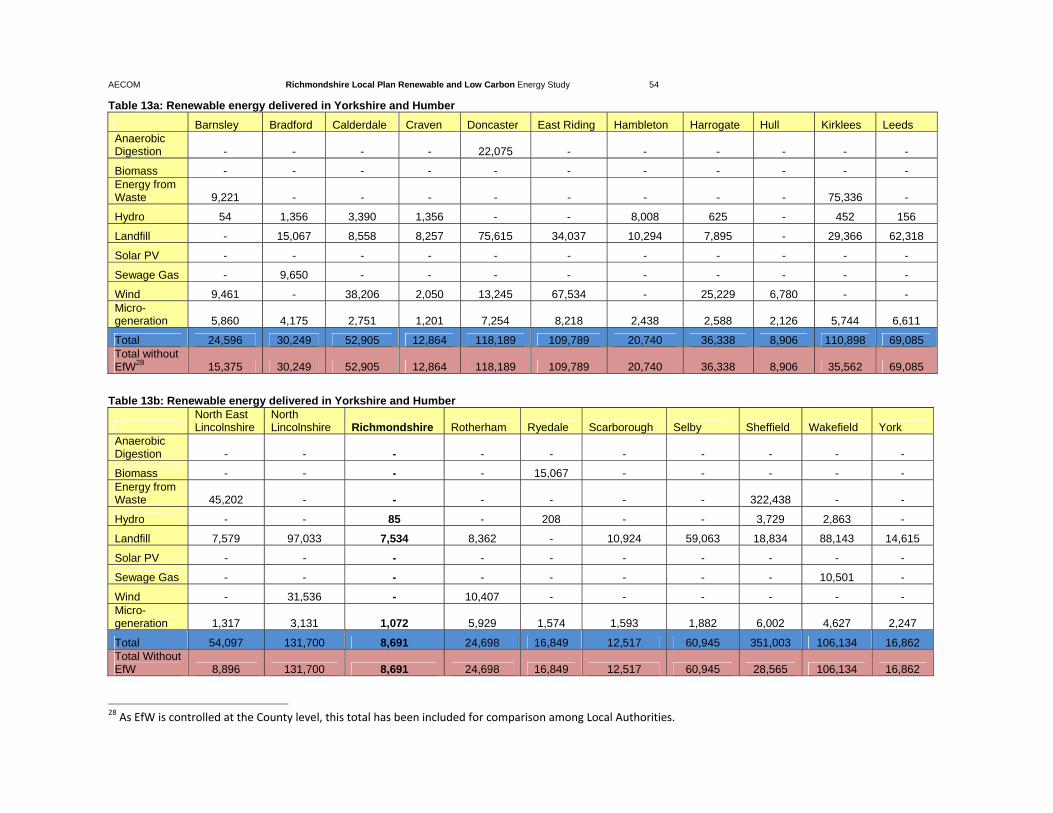
AECOM Richmondshire Local Plan Renewable and Low Carbon Energy Study 54
Table 13a: Renewable energy delivered in Yorkshire and Humber
Barnsley Bradford Calderdale Craven Doncaster East Riding Hambleton Harrogate Hull Kirklees Leeds Anaerobic Digestion - - - - 22,075 - - - - - -
Biomass - - - - - - - - - - - Energy from Waste 9,221 - - - - - - - - 75,336 -
Hydro 54 1,356 3,390 1,356 - - 8,008 625 - 452 156
Landfill - 15,067 8,558 8,257 75,615 34,037 10,294 7,895 - 29,366 62,318
Solar PV - - - - - - - - - - -
Sewage Gas - 9,650 - - - - - - - - -
Wind 9,461 - 38,206 2,050 13,245 67,534 - 25,229 6,780 - - Micro-generation 5,860 4,175 2,751 1,201 7,254 8,218 2,438 2,588 2,126 5,744 6,611
Total 24,596 30,249 52,905 12,864 118,189 109,789 20,740 36,338 8,906 110,898 69,085 Total without EfW28 15,375 30,249 52,905 12,864 118,189 109,789 20,740 36,338 8,906 35,562 69,085
Table 13b: Renewable energy delivered in Yorkshire and Humber
North East Lincolnshire
North Lincolnshire Richmondshire Rotherham Ryedale Scarborough Selby Sheffield Wakefield York
Anaerobic Digestion - - - - - - - - - -
Biomass - - - - 15,067 - - - - - Energy from Waste 45,202 - - - - - - 322,438 - -
Hydro - - 85 - 208 - - 3,729 2,863 -
Landfill 7,579 97,033 7,534 8,362 - 10,924 59,063 18,834 88,143 14,615
Solar PV - - - - - - - - - -
Sewage Gas - - - - - - - - 10,501 -
Wind - 31,536 - 10,407 - - - - - - Micro-generation 1,317 3,131 1,072 5,929 1,574 1,593 1,882 6,002 4,627 2,247
Total 54,097 131,700 8,691 24,698 16,849 12,517 60,945 351,003 106,134 16,862 Total Without EfW 8,896 131,700 8,691 24,698 16,849 12,517 60,945 28,565 106,134 16,862
28 As EfW is controlled at the County level, this total has been included for comparison among Local Authorities.

AECOM Richmondshire Local Plan Renewable and Low Carbon Energy Study 55
5.5. Renewable Energy Schemes coming Forward
Comparing the number of renewable energy installations in the planning process or with planning permission suggests that the majority of renewable energy being produced is from a handful of boroughs and districts. North Lincolnshire (35%), Selby (30%), and East Riding (14%) are responsible for nearly 80% of the proposed renewable energy projects. The databases currently show that Richmondshire has approximately 11,400MWh of renewable energy either in planning or consented. The majority if this is from the 1.45MW energy centre planned at Marne Barracks, which is complemented by a 0.1MW Broken Scar hydro scheme. It should be noted, however, the amount of renewable energy expected to come forward in the district was part of a desktop study, which sourced information from publicly available data. As such, the amount of renewable energy expected to be installed in Richmondshire Local Plan area represents a snapshot at a given time and the data may not reflect an up‐to‐date reality of what will come forward.

AECOM Richmondshire Renewable and Low Carbon Study 56
Table 14b: Renewable energy in planning or with consent in Yorkshire and Humber (MWh)
Barnsley Bradford Calderdale Craven Doncaster East Riding Hambleton Harrogate Hull Kirklees Leeds Anaerobic Digestion -
Biomass 474,617 549,953 8,287 3,013 Energy from Waste 112,251 114,511 165,739
Hydro 3,013
Landfill
Solar PV 79
Sewage Gas
Wind 31,378 2,681 68,591 96,185 538,367 19,158 28,114 19,316 23,810 Micro-generation
Total 31,378 114,931 68,591 3,013 685,312 1,254,059 19,158 36,480 22,329 23,810 Total Without EfW 31,378 2,681 68,591 3,013 570,802 1,088,320 19,158 36,480 22,329 23,810
Table 14b: Renewable energy in planning or with consent in Yorkshire and Humber North East
Lincolnshire North Lincolnshire Richmondshire Rotherham Ryedale Scarborough Selby Sheffield Wakefield York
Anaerobic Digestion
Biomass 489,684 2,486,088 10,924 45,202 2,184,744 188,340 Energy from Waste 146,905 60,269 15,821
Hydro 455 377 188
Landfill
Solar PV
Sewage Gas
Wind 19,710 228,636 31,221 47,304 79 144,277 1,340 25,229 Micro-generation
Total 509,394 2,861,629 11,379 31,221 92,506 456 2,389,290 205,689 25,229 Total Without EfW 509,394 2,714,724 11,379 31,221 92,506 456 2,329,021 189,869 25,229
AECOM Richmondshire Local Plan Renewable and Low Carbon Energy Study 57
5.6. Key Considerations for Developing Local Plan Policies
Richmondshire currently has approximately 8.5GWh of renewable and low carbon energy
installed, with a substantial portion of this sourced from landfill gas. This is the least of all local
authorities in Yorkshire and Humber to renewable energy generation, producing less than one
percent of the Region’s total.
The amount of renewable energy either consented or in the planning process represents
more than twice the amount already installed. If it was all to be installed, Richmondshire’s
total amount of renewable energy would increase to 20,000MW.
While the Local Plan area is unique in its barriers to increasing renewable energy generation,
opportunities should be explored wherever possible. These are explored further in the next
section.


Review of Technical Potential for Renewable and Low Carbon Energy
AECOM Richmondshire Local Plan Renewable and Low Carbon Energy Study 60
6.1. Introduction
This chapter seeks to clarify the ‘technical potential’ for renewable energy in the Local Plan area. The ‘technical potential’ is a theoretical estimation of the maximum amount of renewable energy that could be delivered in the area based on the amount of resource and space available. The technical potential is a useful starting point to compare the scale of various resources available and understand the strategic opportunities within the Local Plan area in regard to delivering renewable and low carbon energy generation.
6.2. The Low Carbon and Renewable Energy Capacity in Yorkshire and Humber Study
The starting point for this analysis is a detailed review and more detailed analysis of the regional LCRECYH study, completed in 2011 following the regional methodology set out by DECC29. The DECC methodology sets out a number of steps for a resource assessment and provides detailed assumptions and calculations for some of these steps along with recommended data sources. The methodology is based around a sequential constraint methodology, where constraints are progressively applied to reduce the natural resource (i.e. the maximum theoretical potential) to what is practically achievable. The stages in the methodology are numbered from 1 to 7, with stages 1 to 4 representing physical, technical, and regulatory constraints. This study unpacks the assumptions made for the regional assessment to provide more localised mapping of opportunities and constraints as well as higher level of granularity of assessment to help inform technical potential of renewable and low carbon energy across the region.
The DECC methodology is designed to assess potential resource capacity (the energy which may be obtained, e.g. kW) but it does not specify how to calculate potential energy resource (the energy that can be obtained in a year, e.g. kWh). Capacity is not necessarily related to the resultant energy output, and it is important that energy output is considered to allow the contribution from renewable and low carbon energy resources to be compared with the baseline demands.
The tables below summarise the total potential renewable and low carbon energy resource across the whole of Richmondshire and compares it to total for the rest of the Yorkshire and Humber region. Figures are given in installed capacity [MW] and are spilt based on electricity and heat capacity.
29 Renewable and Low‐carbon Energy Capacity Methodology: Methodology for the English Regions, DECC (2010)
6. Review of Technical Potential of Renewable and Low Carbon Energy
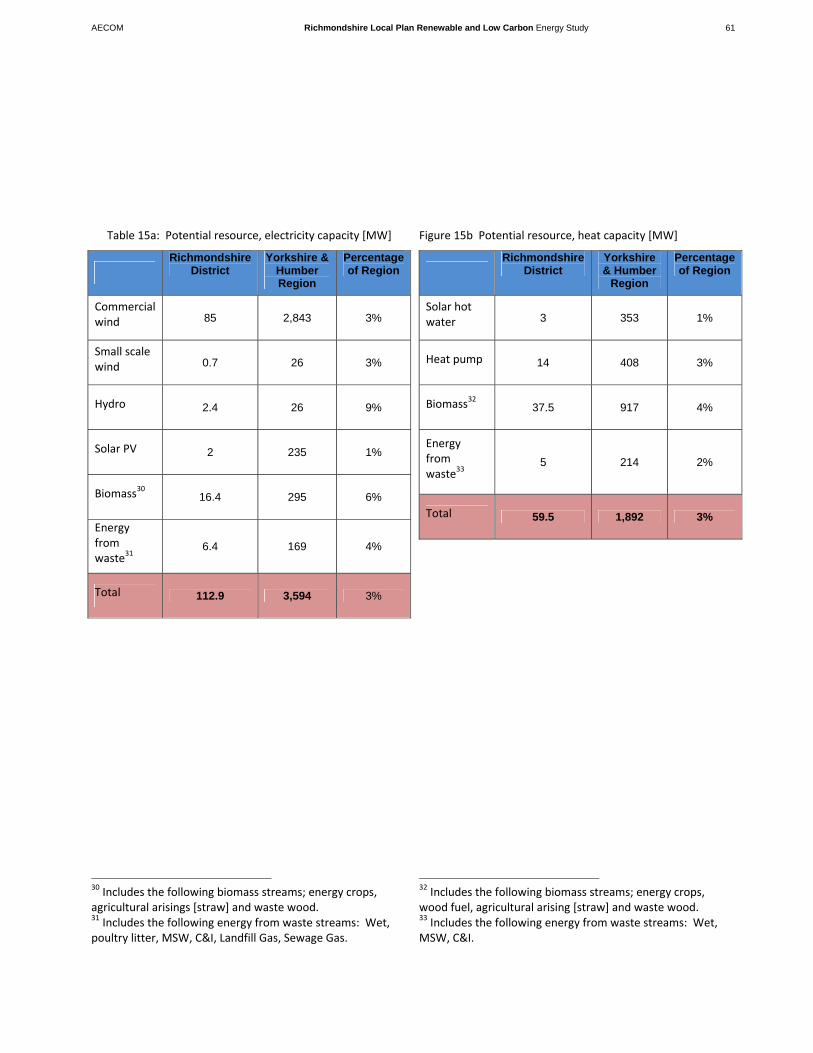
AECOM Richmondshire Local Plan Renewable and Low Carbon Energy Study 61
Table 15a: Potential resource, electricity capacity [MW]
Richmondshire
District Yorkshire &
Humber Region
Percentage of Region
Commercial wind 85 2,843 3%
Small scale wind 0.7 26 3%
Hydro 2.4 26 9%
Solar PV 2 235 1%
Biomass30 16.4 295 6%
Energy from waste31
6.4 169 4%
Total 112.9 3,594 3%
30 Includes the following biomass streams; energy crops, agricultural arisings [straw] and waste wood. 31 Includes the following energy from waste streams: Wet, poultry litter, MSW, C&I, Landfill Gas, Sewage Gas.
Figure 15b Potential resource, heat capacity [MW]
Richmondshire
District Yorkshire & Humber
Region
Percentage of Region
Solar hot water 3 353 1%
Heat pump 14 408 3%
Biomass32 37.5 917 4%
Energy from waste33
5 214 2%
Total 59.5 1,892 3%
32 Includes the following biomass streams; energy crops, wood fuel, agricultural arising [straw] and waste wood. 33 Includes the following energy from waste streams: Wet, MSW, C&I.

AECOM Richmondshire Local Plan Renewable and Low Carbon Energy Study 62
6.3. Large‐scale on‐shore wind energy
The term ‘Large scale wind’ describes the development of commercial scale wind turbines and wind farms. These typically comprise turbines of 1 MW or more with hub heights of circa 100m or more. To be considered commercially viable, wind speeds greater than 6.0m/s at 100m are needed. Figure 13 highlights the greatest average annual wind speeds, greater than 8m/s are across the upland areas to the north west of the Local Plan area. There is also a considerable area across the rolling farmland to the north west of the Local Plan area that have high enough average annual wind speed to suggest that wind turbine development is economically viable.

AECOM Richmondshire Local Plan Renewable and Low Carbon Energy Study 63
Figure 13: Average annual wind speeds at 45m across the Local Plan area

AECOM Richmondshire Local Plan Renewable and Low Carbon Energy Study 64
Although the speeds for wind across the Local Plan area appear to be technically viable there are a number of other practical, social and environmental constraints that need to be considered. The process of physical constraint mapping has been used to identify which sites are likely to have potential for large wind turbine location. Through GIS analysis, the constraints that have been included are listed below, shown in figure 14 and conform with the DECC guidance:
Non‐accessible areas
o Roads (A, B and motorways)
o Railways
o Water bodies
o Built up areas
o Airports
Exclusion areas
o Ancient semi‐natural woodland
o Sites of historic interest (but no buffer to be applied)
o Buffer around road and rail line = turbine tip height +10%
o Buffer around transmission lines = 300m
o Buffer around built up areas = 600m
o Buffer around airports and airfields (RAF Leeming) = 5km
o Civil Air Traffic Control constraints (RAF Leeming)
Designated landscape and nature conservation areas, including the following classifications.
o European designations include:
Special Areas of Conservation
RAMSAR Sites
Special Protected Areas
o National designations include
National Park (Yorkshire Dales)
Areas of Outstanding Natural Beauty
Sites of Special Scientific Interest
National Nature Reserves
o Sites Important for Nature Conservation
o Biodiversity Action Plan habitats

AECOM Richmondshire Local Plan Renewable and Low Carbon Energy Study 65
Figure 14: Practical and environmental constraints

AECOM Richmondshire Local Plan Renewable and Low Carbon Energy Study 66
Although landscape character is not included in the DECC methodology, as by nature it includes a level of subjectivity, it often informs much of the debate around wind development. The Countryside Agency Guidance on Landscape Character Assessment (2002) advise that in such circumstances that for any subjective elements, it is important that judgements are made in transparent and systematic manner. It is therefore important that these issues along with the benefits and constraints of different technologies are investigated openly. Natural England’s National Character Areas divide England into 159 natural areas each defined by a unique combination of landscape, biodiversity, geodiversity and economic and cultural activity. Four of these areas transect the Local Plan area; the Yorkshire Dales, Pennine Dales Fringe, Tees Lowlands, and Vale of Mowbray, see figure 15. The Yorkshire Dales and Pennine Dale Fringe are considered to be of ‘high’ landscape sensitivity, with the Vale of Mowbray considered to be of ‘medium’ landscape sensitivity, and Tees Lowlands considered to be of ‘low’ landscape sensitivity. In this case, therefore, the assessment of capacity has focused on these areas of lowest sensitivity.
Furthermore, and reaffirming the above, ‘Managing Landscape Change: Renewable & Low Carbon Energy Developments – a Landscape Sensitivity Framework for North Yorkshire and York’ (2012) appraises the landscapes sensitivity to specific types of development including wind turbines. Zooming into the Richmondshire area, this framework highlights that the lowest areas of sensitivity broadly correlate to the character assessment, see figure 16. It should be noted however, that these assessments do notappraise cumulative impacts.

AECOM Richmondshire Local Plan Renewable and Low Carbon Energy Study 67
Figure 15: National Landscape Character Areas
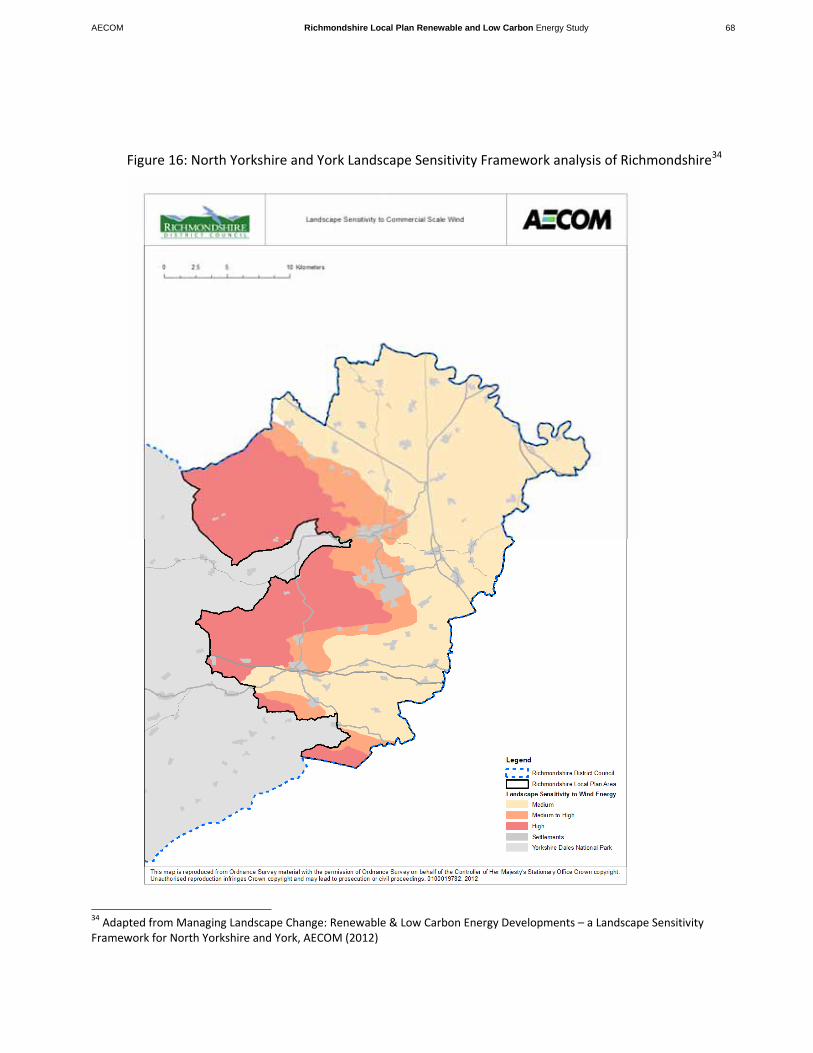
AECOM Richmondshire Local Plan Renewable and Low Carbon Energy Study 68
Figure 16: North Yorkshire and York Landscape Sensitivity Framework analysis of Richmondshire34
34 Adapted from Managing Landscape Change: Renewable & Low Carbon Energy Developments – a Landscape Sensitivity Framework for North Yorkshire and York, AECOM (2012)
AECOM Richmondshire Local Plan Renewable and Low Carbon Energy Study 69
Bringing these opportunities (viable wind speeds) and constraints (physical, environmental and character) together it is possible to develop a plan (see figure 17) that shows the most practical wind resource areas within the Local Plan area. These are the areas that, all other things being equal, would be the most attractive areas to investigate wind development As figure 17 demonstrate, the most suitable locations for wind turbine development are likely to be in the north east of the Local Plan area.
The main constraints are associated with the sensitivity of the landscape and the buffer areas associated with proximity to existing electrical transmission lines. In addition the map also assumes a 600‐metre buffer and highlights an 800m buffer from all existing residential development to allow for impacts such as noise and shadow flicker which may affect local residents. The 600m buffer is the nationally accepted standard for assessment as set out in by the Renewable and Low‐carbon Energy Capacity Methodology for the English Regions (DECC, 2010) and the 800m buffer is North Yorkshire County Council’s current35 policy position on the proximity of wind turbines to residential development. However, the DECC Methodology highlights that although the 600m buffer has been defined in consultation with wind farm noise specialists as a ‘rule of thumb’ for assessment purposes, in practice, the minimum distance required between a wind farm and residential properties is site‐specific; dependant on the proposed turbine and ambient background noise and as such some cases this buffer may be reduced without any significant adverse impact on residents.
It can be seen from figure 17 that the 600m buffer has a significant impact on the land area availability for wind turbines restricting potential development to the north east of the Local Plan area (with the 800m buffer even more restrictive). Because this buffer zone may be reduced in some cases without any adverse impact on residents, and because it is not a physical constraint, the assessment of wind turbine potential has been modelled by taking away this buffer from isolated properties (but retaining for groups of homes in towns and villages).
Taking these opportunities and constraints into consideration, and following the DECC guidance on the maximum capacity of wind turbine development, it is possible to derive a maximum theoretical capacity for wind energy within the Local Plan area of 85MW installed capacity.
35 It is understood that North Yorkshire County Council are currently considering their position on the proximity of wind turbines to residential development to 2km.

AECOM Richmondshire Local Plan Renewable and Low Carbon Energy Study 70
Figure 17: Practical Wind Resource
AECOM Richmondshire Local Plan Renewable and Low Carbon Energy Study 71
Other Practical Considerations
Large scale wind presents by far the greatest opportunity for renewable energy generation in the Local Plan area. The practical wind resource plan highlights at a broad level that there is significant opportunity for deployment in the north east of the Local Plan area. Although these areas present preferential areas for exploration, further detailed feasibility studies would have to consider a number of additional siting constraints before any site could be confirmed, including the issues below. The NPPF refers to the issues cited in the National Planning Statement for renewable energy, which sets out all considerations in some detail.
Local Wind Resource Survey ‐ This study is not a sufficient evidence base for the actual siting and delivery of wind turbines, but it gives a high level assessment of promising areas to look into further. Applications for individual sites will usually include a period of wind speed testing using pole‐mounted anemometers which means that local effects such as topography can be investigated.
Aeronautical and Defence Impacts – Wind turbines may interfere directly with the operation of aeronautical and defence equipment. Whilst safeguarded areas have been taken into account for all operational civilian and military airfields, consultation will have to be undertaken with MoD and nearby airport authorities to determine particular constraints in the area and possible mitigation strategies.
Grid connection and Sub Station Requirements – While this study has not identified any strategic infrastructure constraints, it will be necessary to carry out a detailed assessment of the opportunities and constraints presented by existing infrastructure in relation to each turbine site. This information should feed into any development programme for turbines. The potential for connection to the grid needs to consider both the technical potential relating to the capacity of the existing infrastructure to accept the renewable generation, and also the locational aspects and additional infrastructure. This may require developers to consider sites which are close to the existing infrastructure, or methods of mitigation (such as building underground sub stations and connections). UK has now moved to a ‘connect and manage’ approach to offering transmission connections to generators. This means that National Grid is obliged to offer connection within a set period of time (currently 3 years). As such, grid capacity is of less an issues/risk as it used to be for developers as it has been in the past. Quantification of constraints on the Growth of UK Renewable Generating Capacity (SKM 2008) highlights that connection and transmission remain viability constraints, although planning is potentially the main barrier enabling development. Furthermore, Growth Scenarios for UK Renewables Generation and Implications for future Developments and Operation of Electricity Networks (SKM, 2008) includes growth scenarios for different renewable technologies ‐ including a high wind scenario – which it suggests that each of the 17 critical network

AECOM Richmondshire Local Plan Renewable and Low Carbon Energy Study 72
boundaries identified in National Grid’s Seven Year Statement have capacity for additional wind resource.
Flood risk – As with all development, consideration flood risk needs to be a key consideration.
Blade Glint Modelling – Blade glint is the reflection of light from a turbines blade. This can be an issue at certain times of day when the wind is blowing, but effects can usually be mitigated, for example by using matt surfaces on the blades, and its effects have not been specifically considered at this stage. This would also need to include driver distraction issues, in partnership with the Highways Agency and local highways services.
Flicker – Flicker is an issue when a turbine is located between the sun (early morning or late evening) and a sensitive receptor. The rotating blades mean that the path of light from the sun is periodically “chopped” resulting in a flashing effect. The sun’s path is very predictable and can easily be modelled, allowing an assessment to be made of when this may be an issue, and the turbines to be temporarily shut down. This means that the impact can be minimised without reducing the number of turbines or restricting the location.
Telecommunication Impacts ‐ Wind turbines can potentially interfere with radio signals, television reception and telecommunications systems. This has not been specifically assessed at this stage, however consultation measures with relevant telecommunication companies can be put in place to mitigate these effects.
Bird Migration ‐ An important element that will need consideration is the annual migration of birds, particularly due to the presence of important environmental sites in the area. A detailed migration survey should be conducted over a year period. Overall wind turbines are only responsible for 0.01% of all the bird deaths attributed to human activity.
Transport Access Assessment per turbine – The blade section is the longest/largest full section of a wind turbine to be delivered to a site. Some sites are restrictive, and consideration is required of local transport infrastructure as well as access to and on the site.
Impact upon land use and land management ‐ The amount of land consumed by wind turbines is relatively small due to their small footprint requirements and other activities such as farming can continue in the area. However additional land is required for access roads and potentially substations, and a study should be carried out to ensure that the turbines do not have a negative effect upon land use potential.
Ground Condition Survey – The feasibility of the construction of a large turbine would have to be supported by geotechnical investigations to ensure that the ground conditions are suitable for locating the foundations and access roads.
AECOM Richmondshire Local Plan Renewable and Low Carbon Energy Study 73
Gas pipelines and other sub terrain analysis – As the relevant information was not made available, the current assessment has not analysed the presence of utility pipelines beneath the sites which could have a considerable impact on the ability to site turbines.
Archaeological Constraints – Whilst designated archaeological sites have been considered, any impacts on archaeology in the area will have to be assessed through more detailed studies depending on the level of ground works required.
Listed Building and Conservation Area impact – A detailed impact assessment has not been conducted at this stage and would be required for any further study. Whilst a turbine will not directly impact a listed building or conservation area, it needs to be considered in the context of the setting.
Noise implications ‐ Concerns over noise can be related to perception rather than actual experience36. The noise impact of large scale wind turbines will depend on local background sources of noise such as from major roads, rail lines, industrial areas, etc. More detailed studies will be required to map noise and identify areas of least impact for turbine development.
In addition to these practical constraints, there are a number of social and political concerns over the deployment of wind turbines. To ensure wind energy development is delivered appropriately, RDC should work with developers to make sure wind turbines are well placed.
6.4. Small and medium scale wind
The regional LCRECYH study also assessed the potential for medium and small scale wind turbines These are turbines which operate in a stand‐alone mode and not mounted on a building. They may provide electricity to a single customer (for example a farm) or be connected directly to the grid for export. Turbine sizes vary widely, and medium scale could include single or a small number of community owned which are approaching commercial scale. Indeed community schemes often use second hand commercial turbines with systems of around 225 kW being popular based on a common Vestas turbine design. However most of the analysis in the regional study is based on smaller scale turbines with a 6 kW capacity (these have a hub height of circa 10 – 15 m and can often be found installed in small commercial sites, schools, and remote rural locations) and hence the LCRECYH highlighted limited resource potential.
36 The environmental and community impacts of wind energy in the UK. Wind Engineering 14, Rand and Clarke 319–330 (1990)
AECOM Richmondshire Local Plan Renewable and Low Carbon Energy Study 74
There has been much debate on the quality of the DECC methodology for medium and small scale wind and the uptakes resulting from the methodology are very optimistic and based on high uptake assumptions. The balance between smaller scale wind and large commercial wind turbines also needs to be understood. Whilst medium and small scale turbines are much less effective and potentially correspondingly more expensive than large commercial turbines, the acceptability could help increase the overall potential for wind in the area. However the comparison with large scale wind is important when considering cumulative impact. For example, around 800 6 kW turbines would be required to displace a single 2.5 MW turbine. The low energy output per turbine, poorer performance, and correspondingly higher cost means that medium and small scale wind is unlikely to be delivered on a commercial basis, and the relatively low capacity means that the overall output is likely to be small in comparison with large scale wind. However medium and small scale wind can still help contribute to local energy generation and CO2 savings, in particular where it can be delivered in areas and by stakeholders who cannot deliver larger scale wind. Recent reports have shown that medium‐and small scale wind is generally not suited to urban or suburban locations due to the effects of turbulence at low levels on power output. However, they could be delivered where there is sufficient open land (for example low level industrial areas), or in rural areas by farmers and local communities, and with smaller buffer zones (closer to residential properties) than would be acceptable with large scale turbines.
Other Practical Considerations
Permitted development rights came into operation from the 1st December 2011 for small / micro scale turbines with a maximum height of 15m (building mounted) or 11.1 m (pole mounted) and a maximum swept area of 3.8 m2. The swept area limitation effectively limits turbines to the smallest of the small scale or micro scale devices, and the legislation is only likely to result in a very small increase in capacity. As such, the role of planning will be limited to ensuring that cumulative impacts are not detrimental over time. RDC may however wish to explore other opportunities to increase deployment, including:
Farmers – Richmondshire has a significant area of farmland which means that much of the land has potential for medium and small scale wind power. On sites for which large scale turbines are inappropriate or where it is unlikely that they can be commercially delivered, medium and small scale turbines could be viewed as a “next best” option. Another advantage to farmers can be the provision of power to isolated buildings where the cost of a turbine may be less than for a grid connection.
Industrial sites – On sites that are not located close to residential housing, but do not have the required space, medium and small scale turbines can often be accommodated.
Establishing partnerships – Turbine providers and installers can help leverage economies of scale. Installers could take the form of local councils, community groups, non‐profit organisations, or other organisation. Combined, they might represent a large group of buyers.

AECOM Richmondshire Local Plan Renewable and Low Carbon Energy Study 75
Feed‐in tariff – The feed‐in tariff (FIT) provides an additional revenue stream for wind generated electricity. The tariff depends on the capacity of the wind turbine and tariffs are currently available ranging from 26.7p/kWh (for generators between 1.5 and 15 kW) to 4.5p/kWh (for generators between 1.5MW and 5 MW). The FITs are available over a 20 year period and are designed such that the installation provides an acceptable financial return over its lifetime. For a small scale device of less than 15 kW, the FIT could be worth around £5,000 per year depending on level of output. This compares with an installation cost of circa £40,000 ‐ £50,000, demonstrating that payback may be achieved within the 20 year FIT lifetime.
Renewable Obligation Certificates (ROCs) – This incentive is open to all renewable electricity generating schemes, and is the market mechanism used in the electricity generation industry to incentivise the uptake of renewable electricity generation. A ROC is typically worth around 4.5p/kWh and therefore more suited to large scale commercial installations. For smaller installations, FITs provide a larger revenue stream due to the higher tariff levels.

AECOM Richmondshire Local Plan Renewable and Low Carbon Energy Study 76
6.5. Hydropower resource
Small scale hydro turbines can generate electricity from rivers with less environmental harm and disruption to water flow than large scale hydro schemes. The introduction of government targets for renewable energy generation, combined with technological development has increased the feasibility of micro hydro generation, both at historic mill sites and weirs (where an existing head of water exists) or in hilly areas with spring‐fed streams.
Micro hydro energy generation has a number of advantages. As well as being a renewable source of power, the ecological impacts of small‐scale turbines are usually small compared to large scale, dam‐based hydro power. Compared to wind power, micro hydro power sources offer more constant generation with load factors of around 50% typically achieved. In addition, maintenance costs are reasonably low and systems generally have a long lifetime of over 25 years. Moreover, the cost of reactivating historic sites can often be reduced by reusing existing structures such as the weir, minimising the civil engineering works required.
Defra recently conducted a review of potential hydropower sites across the UK. Table 16 and figure 18 highlights the location and size of potential hydro power sites identified across the Local Plan area. Although there are a significant number of potential hydro power sites across Richmondshire, the majority of these are along or in close proximity to the River Swale and River Ure within the National Park. There are 11 sites that could support the development of reasonably sized hydropower projects along the River Swale and along the River Ure, however, the majority of these are away from currently built up areas. There may however be opportunities to incorporate hydro into development of the strategic development growth areas.
Table 16: Potential hydropower resource in the Local Plan area
Power Category Number of Sites
0 to 20 kW 62
20 to 50 kW 1
50 to 100 kW 5
100 to 500 kW 5
500 kW plus 6

AECOM Richmondshire Local Plan Renewable and Low Carbon Energy Study 77
Figure 18: Potential hydropower resource in the Local Plan area

AECOM Richmondshire Local Plan Renewable and Low Carbon Energy Study 78
Other Practical Considerations
The main opportunities for hydro power exist in the National Park and potentially along the River Swale at Richmond and at Colburn; and along the River Ure near Leyburn. New strategic development in Catterick should investigate the practical feasibility, such as restrictions from wayleaves, and financial viability to capitalise on the hydro resource. Hydropower also represents an opportunity to restore historic weirs and has been utilised successfully in community delivery models such as Torrs Hydro, the UK’s first community owned hydropower scheme. It is situated on the site of a textile mill built in 1790 in rural Derbyshire, with the turbine sitting in the original mill pit where the water wheel would have been. Water flowing into the weir from the Rivers Sett and Goyt rotates the blades of the turbine with a maximum output of 63kW given a 3m head and a 3m/s flow. It is the ambition of Torrs Hydro to generate 240MWh of electricity.
There are however a number of important considerations including:
Land ownership – access in terms of ownership of land can be an issue for site development. Many of the sites may be located on private land and therefore the schemes will need the collaboration of landowners.
Extraction Licence – required on hydro schemes on rivers via the Environment Agency to ensure the water levels in rivers are not compromised.
Fish Passage – the Environment Agency requires fish passes to be installed which can increase the construction costs of any future schemes.
Access – the accessibility of the sites to construction and maintenance vehicles and machinery is varied. Although some sites have good existing access others would require the construction of potentially costly new routes, for what is a very small scheme.
Scheme Design – each site would require a bespoke design which responds to the unique flow characteristics and site constraints. Existing weirs may require significant modification or refurbishment which could render a hydro scheme uneconomic on its own grounds. However the refurbishment of existing weirs presents an ideal opportunity for the incorporation of a hydro scheme where viable.

6.6. Biomass resource
Biomass is an organic fuel, which can be used to produce low carbon energy. Whilst burning biomass does release CO2 emissions, CO2 is absorbed from the atmosphere during the growth and production and so the net lifecycle CO2 emissions are zero. In reality, all biomass fuels have an associated CO2 intensity due to additional energy required for collection, processing, and distribution. Transportation can be a large element of this for raw fuels, whilst heavily processed fuels such as wood pellets may require additional energy input during the process stages.
There are a number of types of biomass fuel available which can determine how energy is generated. The two primary types are woody biomass (wood) and wet biomass (food waste and farm wastes).
Woody biomass can contribute to generation of heat through either direct combustion in individual biomass boilers for buildings and district heating systems, and it can contribute to the generation of both heat and power through the use of a combined heat and power system (CHP). Biomass CHP can deliver greater CO2 reductions due to the offset of high carbon grid electricity. Waste wood from domestic, construction and industrial uses
o Forestry residues
o Fuel crops including miscanthus and short rotation coppice such as willow
o Straw
The wet biomass feedstocks are less suited to combustion (unless dried, which requires additional energy input) and are typically used in digestion systems such as anaerobic digesters to generate biogas. This can then be used in a CHP system, or collected for use in other gas consuming applications. Pig and poultry farming sectors
o Meat and Poultry Processors
o Brewing
o Water industry
Although it is likely that the Local Plan area could generate a significant biomass resource, the sourcing of biomass is critical when considering resource potential and sustainability. There is concern that excessive specification of biomass technologies on a site‐by‐site basis will lead to either long‐distance import of biomass material or the sacrifice of food‐producing arable land to grow dedicated biomass crops. For this reason, there is a need to take a region‐wide approach to biomass sourcing and supply to ensure that biomass is both available for energy use, but that its use is managed and sustainable and that waste biomass sources are utilised first. Therefore, although this study provides an assessment of the biomass resource from the Local Plan area, it is likely that this will feed into the wider biomass market. Conversely, development seeking to utilise biomass resources are likely to consider availability of biomass from a wider area.
Technical potential for biomass combustible in biomass boilers or biomass CHP
Wood from managed woodlands ‐ The LCRECYH study assesses the likely wood resource arising from each ha of woodland across the region. Within Richmondshire it highlighted that this could have the potential to deliver 7.5MW of heat. As approximately 70% of the woodland resource in Richmondshire is outside the Local Plan area, this should be revised down to 2.25MW.
Energy Crops – The LCRECYH study predicted the potential biomass resource from energy crops to be 24.8MW of heat and 13.7MW of electricity. This is based on using 10% of the grade 3 and 4 agricultural land (to avoid conflict with food production) to grow energy corps. In the Local Plan area there is 360km2 of agricultural land grades 3 and 4 without environmental constraints (see figure 19). From 1km2 the likely yield of energy crop is 1,20037 oven dry tonnes (odt) per annum. Across the Local Plan area this would generate 43,200odt. In a Combined Heat and Power plant 6,000odt would generate 2MW of heat and 1MW electricity. As such, using 36km2 of agricultural land from the Local Plan area to grow energy crops could generate 14.4MW of heat and 7.2MW of electricity. However, if the energy crops were just used to generate heat, substantially more heat energy could be generated. It would only take 660odt to generate 1MW of heat. This is because there is no heat wasted in turning turbines for electricity. In this instance, 36km2 of agricultural land could be used to generate 65MW of heat.
Waste wood ‐ The LCRECYH study assumed that there would be potential for approximately 0.3MW of heat and 0.2MW of electricity from waste wood from commercial and industrial activities. It is likely that most of these activities are within the Local Plan area, and as such the LCRECYH study are sensible for the Local Plan area.
Straw – Although the LCRECYH study predicted 4.9MW of heat and 2.5MW of electricity could come from straw, there are numerous competing uses for it. Feedback from the stakeholder workshop undertake as part of this study (see section 7) highlighted that it would be unlikely for straw resources cost effective as a fuel source.
37 All assumptions are taken from Welsh Government Practical Guidance – Planning for Renewable and Low Carbon Energy – A Toolkit for Planners [July 2010]

Figure 19: Biomass resources – agricultural land value and woodlands

Technical potential for organic waste suitable for use in anaerobic digestion There are a variety of waste streams available which could be used for energy production in anaerobic digestion (AD) schemes. AD refers to the decomposition of putrescible waste such as food waste, animal slurries and potentially a proportion of garden waste in anaerobic (oxygen‐less) conditions. AD produces a biogas made up of around 60 per cent methane and 40 per cent carbon dioxide (CO2). Anaerobic digesters also produce valuable fertilizer as a by‐product which can be recycled back onto the land aiding agricultural productivity. It is important when siting an AD scheme, that the disposal of the feedstock is considered as importantly as the availability of feedstock.
The biogas from AD schemes can be burned to generate heat and electricity in a CHP engine, with revenue streams potentially available from both. Alternatively the biogas can be captured and either compressed for storage and distribution, or upgraded and injected into the gas grid. Biogas is in many ways a good alternative transport fuel – particularly for buses and heavy vehicles. Alternatively, if injected into the grid, biogas can help decarbonise the use of natural gas across all sectors. It is important to note that the AD process itself requires a proportion of the electricity and heat output to maintain the process.
As a transport fuel, the potential of biogas has already been demonstrated in Europe. In the city of Lille38 in northern France, 120 of the city’s 400 buses run on biogas made from locally sourced food waste, with one new gas‐power bus commissioned every week. By the end of this year, the goal is for all buses to run on a mix of one‐third natural gas, two‐thirds biogas. The biogas will be produced by an anaerobic digester at the bus terminus, which fuels not only the buses but also the lorries that collect the waste. This means there will be a high degree of insulation to short term interruptions in the oil supply. In Switzerland there are 3500 vehicles running on biogas, and there are also major programmes in Sweden and Germany. Lincoln recently began operating eleven buses, which use biomethane sourced from household and animal waste. The converted buses are expected to reduce carbon emissions by 40% compared to traditional diesel buses.
Norfolk and South Staffordshire have commissioned anaerobic digesters as part of their waste strategy, but none have yet exploited the full transport potential of biogas – which is considerable. According to a report by Environmental Protection (formerly the National Society for Clean Air), Britain produces some 30 million dry tonnes of food waste and agricultural manure per year, and this could produce over 6 million tonnes of oil equivalent in biomethane. That equates to about 16% of total transport fuel demand, while public transport consumes less than 5%. In other words, Britain could fuel a public transport network three times bigger than today’s on food and agricultural waste alone.
The Low Carbon and Renewable Energy Capacity in Yorkshire and Humber (LCRECYH) study highlighted that there was some limited potential from wet waste, but no opportunity from poultry litter. Given the fragmentation of different potential resource streams it can be difficult to give an overall assessment of potential. Other considerations that could also be included are the slurry from agricultural waste, water industry sludge and the organic waste stream.
38 The Oil Depletion Analysis Centre and the Post Carbon Institute (2009) “Preparing for Peak Oil – Local Authorities and the Energy Crisis” ODAC
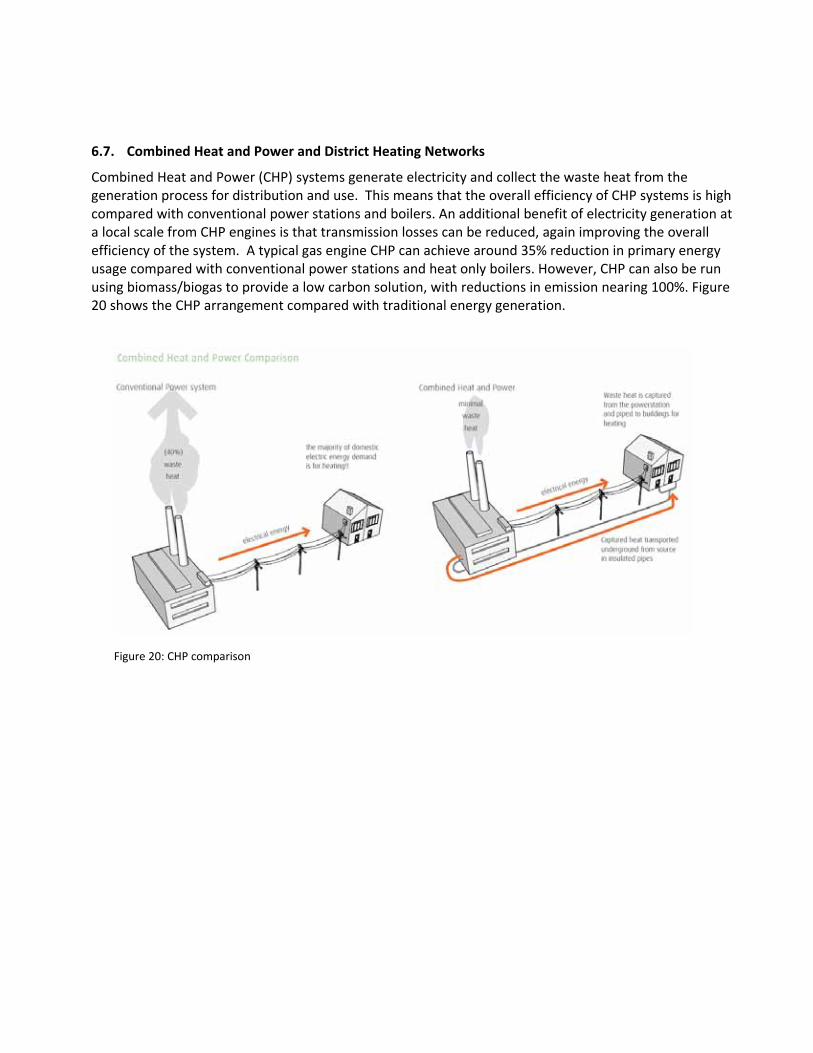
6.7. Combined Heat and Power and District Heating Networks
Combined Heat and Power (CHP) systems generate electricity and collect the waste heat from the generation process for distribution and use. This means that the overall efficiency of CHP systems is high compared with conventional power stations and boilers. An additional benefit of electricity generation at a local scale from CHP engines is that transmission losses can be reduced, again improving the overall efficiency of the system. A typical gas engine CHP can achieve around 35% reduction in primary energy usage compared with conventional power stations and heat only boilers. However, CHP can also be run using biomass/biogas to provide a low carbon solution, with reductions in emission nearing 100%. Figure
20 shows the CHP arrangement compared with traditional energy generation.
Figure 20: CHP comparison

6.8. Assessing the potential ‐ Heat Opportunity Plans
To assess the potential for CHP/District Heating Network (DHN), this study has undertaken more detailed mapping to establish ‘heat opportunity plans’. This section considers some of the issues associated with mapping opportunities for the utilisation of low carbon heat in District Heating Networks (DHNs). In reviewing the heat opportunity map we sought to identify locations with the most potential in the following areas:
Heat density
The DECC residential gas consumption data at Lower Layer Super Output Area39 (LLSOA)40, can be used to locate areas within the district with the highest levels of heat density and interrogate these to determine which buildings were contributing most to the apparent heat density.
Total heat demand
The data presented in the DECC database, and supplemented with metered data from the Council owned buildings where available were used to estimate the total heat demand within a certain area Assessing the total heat demand provided us with an indication of the size of revenue from the heat sales and therefore what level of initial capital investment could be supported.
Presence of Key Anchor Loads
Using the information provided by the Council, locations have been identified where there are a number of buildings with high and stable heat demands in close proximity. These types of buildings could include leisure centres with swimming pools, dense areas of social housing, hospitals and prisons. A cluster of anchor loads could provide the initial load in the creation of a wider network. When reviewing the existing Key Anchor Loads, consideration needs to be given to the likelihood of refurbishment or demolition that may be planned.
Building types
Locations with building types which result in a good balance of heat demand profiles have been identified. For example a residential area will require heat in mornings, evenings and weekends, but there is less demand for heat in the daytime. If commercial buildings are also present, which have a daytime heat demand, the overall demand profile is more consistent and will enable the system to operate more efficiently.
Future plans
As well as reviewing the existing heat demands and densities it is important to look at the future development plans within the area to see if there is potential for future development and expansion. Clusters that are close to one another also open up the opportunity for future expansion. Some of these opportunities are explored further in the next section.
39 Lower super output area is a geographic area used to improve the reporting of statistics by assigning data to smaller areas. 40 DECC 2009 Energy Statistics on Residential Gas Consumption which was available at the lower level super output area [LLSOA]

Identifying anchor “heat” loads [AHLs]
‘Anchor heat loads’ pertain to existing buildings with an energy demand that could provide economically viable and practical opportunities for utilising heat. It is known as an ‘anchor’ load because further opportunities [e.g. from nearby buildings] may arise for connecting nearby buildings to the original anchor load.
An ‘AHL’ therefore refers to a non‐residential energy demand that can act as a base for a District Heating [DH] schemes.
Buildings that are located near to a point load [such as social housing, etc] and which may benefit from and contribute to the viability of DH schemes are known as a ‘cluster’. A ‘cluster’ usually refers to a mix of social housing and non‐residential buildings which, together, represent opportunities due to their:
Complementary energy demand profile;
Planned development programme;
Commitment to reduce CO2 emissions.
The identification of AHLs and clusters require the mapping of:
Buildings owned by organisations with corporate climate change mitigation policies and an active commitment to reducing their carbon footprint, and;
Planned new development / refurbishment by the ‘anchor heat load’ organisation. New development is likely to be the catalyst for such change. CHP / DH schemes are most cost‐effective when installed as part of new development rather than retro‐fitting (this is covered under energy demand from proposed development and infrastructure).
Social housing schemes. These organisations are often tasked with achieving greater than the minimum environmental performance standards. The inclusion of such developments in DH/CHP schemes often enhance the energy profile to provide further evening, weekend and night time energy demands.
AHLs can help a CHP/DHN schemes to become a realistic prospect and there are usually particular conditions that need to be in place, such as planned new development and / or a commercial building / group of buildings with a significant demand for heat and / or with an energy profile suitable for the installation of a CHP unit.
Given the responsibilities placed upon LA’s and the public sector in general for driving the climate change mitigation agenda, AHL’s are often provided by buildings such as council administration centres, leisure buildings [particularly those with swimming pools] and hospitals; although shopping arcades and precincts have also been utilised in this way.
When it is proposed that private commercial buildings provide an ‘AHL’ the issue of ‘ownership’ is not as significant as when residential units are proposed for this role. The reason for this is that it is often impractical for developers to have to negotiate with many individual private householders whereas social landlords can more readily act on behalf of their tenants.

Investment interest of Energy Services Companies41 (ESCOs) may be secured through the identification of an anchor ‘heat’ load with the intention of development into a DH scheme.
41 An energy services company (ESCo) is an organisation that develops, installs, and arranges financing for projects designed to improve the energy efficiency and maintenance costs. They can act as project developers for a wide range of tasks and can be established by anyone, including community members.

Figure 21: Heat opportunities in the Local Plan area42
42 Education and training building locations are taken from the latest available data from the Local Land and Property Gazetteer, as such it is acknowledged that some buildings may have changed use.
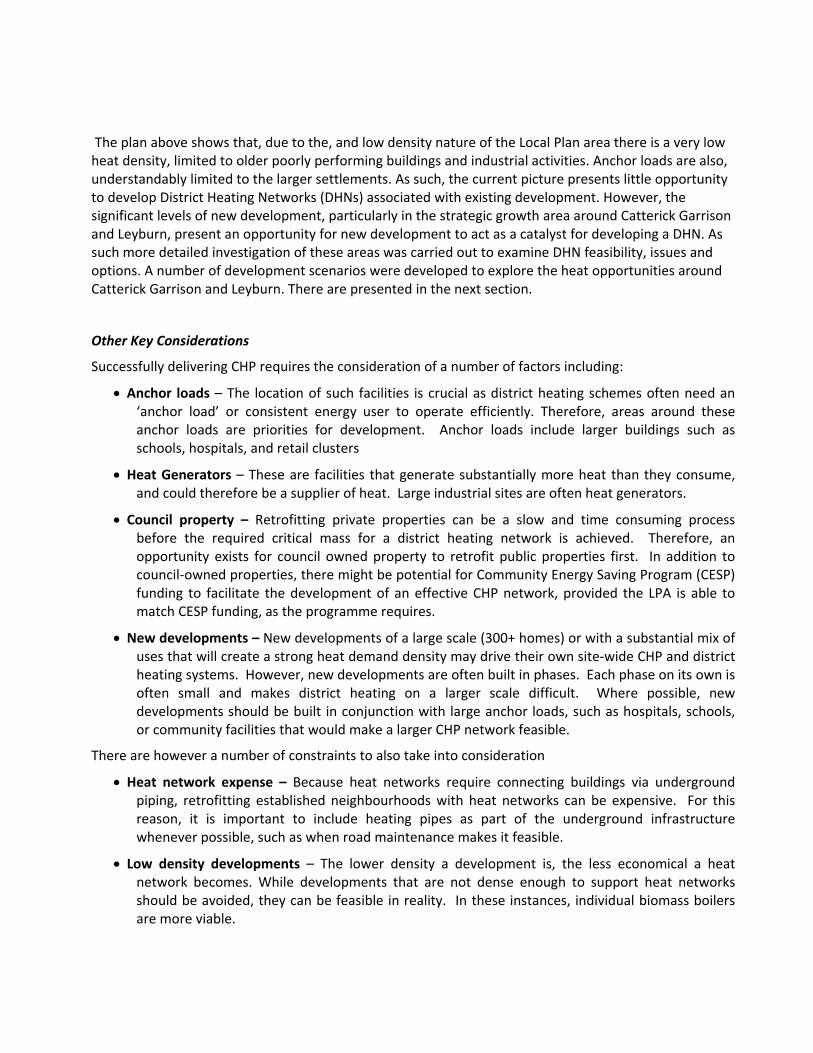
The plan above shows that, due to the, and low density nature of the Local Plan area there is a very low heat density, limited to older poorly performing buildings and industrial activities. Anchor loads are also, understandably limited to the larger settlements. As such, the current picture presents little opportunity to develop District Heating Networks (DHNs) associated with existing development. However, the significant levels of new development, particularly in the strategic growth area around Catterick Garrison and Leyburn, present an opportunity for new development to act as a catalyst for developing a DHN. As such more detailed investigation of these areas was carried out to examine DHN feasibility, issues and options. A number of development scenarios were developed to explore the heat opportunities around Catterick Garrison and Leyburn. There are presented in the next section.
Other Key Considerations
Successfully delivering CHP requires the consideration of a number of factors including:
Anchor loads – The location of such facilities is crucial as district heating schemes often need an ‘anchor load’ or consistent energy user to operate efficiently. Therefore, areas around these anchor loads are priorities for development. Anchor loads include larger buildings such as schools, hospitals, and retail clusters
Heat Generators – These are facilities that generate substantially more heat than they consume, and could therefore be a supplier of heat. Large industrial sites are often heat generators.
Council property – Retrofitting private properties can be a slow and time consuming process before the required critical mass for a district heating network is achieved. Therefore, an opportunity exists for council owned property to retrofit public properties first. In addition to council‐owned properties, there might be potential for Community Energy Saving Program (CESP) funding to facilitate the development of an effective CHP network, provided the LPA is able to match CESP funding, as the programme requires.
New developments – New developments of a large scale (300+ homes) or with a substantial mix of uses that will create a strong heat demand density may drive their own site‐wide CHP and district heating systems. However, new developments are often built in phases. Each phase on its own is often small and makes district heating on a larger scale difficult. Where possible, new developments should be built in conjunction with large anchor loads, such as hospitals, schools, or community facilities that would make a larger CHP network feasible.
There are however a number of constraints to also take into consideration
Heat network expense – Because heat networks require connecting buildings via underground piping, retrofitting established neighbourhoods with heat networks can be expensive. For this reason, it is important to include heating pipes as part of the underground infrastructure whenever possible, such as when road maintenance makes it feasible.
Low density developments – The lower density a development is, the less economical a heat network becomes. While developments that are not dense enough to support heat networks should be avoided, they can be feasible in reality. In these instances, individual biomass boilers are more viable.

Existing infrastructure – Connecting developments underground can encounter a number of infrastructure obstacles. With the increasingly more infrastructure being placed underground – including water, electricity and broadband – finding enough space to place heat piping can be one of the more pressing physical constraints. Sourcing the funding required will also be a major financial constraint.
6.9. Micro‐generation
The term micro‐generation is used to describe small scale technologies (typically less than 50 kW electric and 100 kW thermal). These technologies are usually based in a building or on a small site, providing energy to one or more buildings, including;
Photovoltaics (building mounted)
Solar thermal
Heat pumps (air source and ground source)
Micro wind
Micro CHP (domestic and commercial)
The LCRECYH study assessed the potential for the first four of these categories.
Table 17: Micro‐generation potential
Potential Heat Resource in the Local Plan area (MW)
Potential Electricity Resource in the Local Plan area (MW)
Small wind 0 1
Solar PV 0 2
Solar Thermal 3 0
Air source heat pumps 6 0
Ground source heat pumps 8 0
Total 17 3
Assessing the potential for micro‐generation technologies requires a different approach to most other schemes. Whereas the other energy generation technologies in this report are largely limited by resource availability, whether that is feedstock, land, or natural resource, micro‐generation is generally not geography specific and suitability will depend on building type, operation, layout, and surrounding landscape. Hence the geographic location of the Local Plan area has little effect on the viability of these small‐scale technologies, although the type of buildings and quality of the built environment will.
The methodology for calculating the potential for micro‐generation is based around the DECC methodology, using simple uptake fractions and defined capacities for different technologies and building types. The DECC methodology overestimates the capacity for some technologies and further constraints have been applied. One example is limiting heat pumps to post 1980 dwellings, which have higher levels of thermal efficiency.

Small scale wind generation is included as a micro‐generation technology and is assessed using the above approach, rather than the wind mapping constraints approach, which is used for large scale wind generation. In general, the viability of small scale wind is dependent on micro factors (such as adjacency of buildings) and less dependent on the macro scale constraints such as wind speed, and therefore is more suitably assessed as a micro‐generation technology.
Solar energy is a key type of micro‐generation. There are two main solar technologies that are generally delivered alongside built development: photovoltaic panels and solar thermal panels. Photovoltaic panels produce renewable electricity and can be mounted on structures or used in stand‐alone installations. Solar thermal panels, on the other hand, are commonly used to directly heat water in homes, but can also be used to assist heating. Photovoltaics have a high capital cost in comparison to other renewable energy options, but they are one of the few options available for renewable electricity production and are often one of the only on‐site options to assist in CO2 reduction associated with electricity use. Solar thermal panels are more space and cost effective and are well utilised technology for heating hot water.
Spatially, across the UK the relative benefit of the use of solar technologies varies. The figure below highlights Richmondshire’s potential for solar energy is average when compared to the rest of the Yorkshire and Humber or the UK average. On a global scale, solar technologies do not perform at high efficiencies in the UK. Nonetheless, parts of England receive as much, or more solar irradiation as Germany, which has a large installed capacity of solar panels.
Other Key Considerations
As of December 1, 2011, changes to permitted development rights for renewable energy sources added additional technologies to those already included in the 2008 amendment. The list of technologies no longer requiring planning permission for most domestic micro‐generation technologies, includes:
Roof‐mounted solar PV and solar thermal
Stand‐alone solar PV and solar
Wood burning boilers and stoves, and CHP
Ground source heat pumps
Air source heat pumps
Wind turbines (with substantial caveats)
Micro‐renewables are likely to play a significant role in contributing towards the onsite carbon compliance requirements, and potentially Allowable Solutions, on new built development where more strategic opportunities such as DHNs cannot be utilised. In addition, there may be opportunities to install micro‐renewables on existing buildings and benefit from the Feed‐in‐Tariff. However, the quality of the built environment and character of settlements may be affected by installing micro‐renewables. As such, to ensure that these are brought forward sensitively, RDC may wish to establish design guidance to ensure micro‐renewables are delivered in an appropriate way.

6.10. Key Considerations for Developing Local Plan Policies
The analysis above shows that there is significant technical potential for renewable and low carbon energy in the Local Plan area. The analysis of renewable and low carbon energy opportunities discussed above has been compiled to form an ‘Energy Opportunities Plan’ (EOP) for the Local Plan area – figure 22. EOPs can be used as a resource in policy and planning to guide key opportunities for consideration. This spatial map will help identify delivery opportunities now and into the future as new development opportunities come forward.
The energy opportunities map below should also be used to inform policy making in corporate strategies such as the Sustainable Community Strategy, Local Plan, neighbourhood plans, and climate change strategies. While these strategies are not required, their development is encouraged. The map should also be used to inform RDC’s investment decisions. The EOM could be incorporated into a planning guidance document and/or corporate strategies so that it can be readily updated to reflect new opportunities and changes in feasibility and viability.
The EOP includes the following:
Spatial distribution of opportunities and constraints relating to renewable resources, including large wind, biomass from woodland.
Areas where the intensity of heat demand makes the introduction of a district heating network a viable option.
The identification of urban areas where improvements to existing buildings should be focussed including energy efficiency measures and the integration of micro‐generation technologies.
The strategic growth area where the economies of scale of development might support more strategic renewable and low carbon energy installations (see section 8).
Figure 22: Richmondshire Local Plan area Energy Opportunities Plan

Testing Delivery Potential for Renewable and Low Carbon Technology

AECOM Richmondshire Local Plan Renewable and Low Carbon Energy Study 94
7.1. Introduction
Traditionally, energy studies have focused on setting targets based on the local authority area’s technical potential to deliver low carbon and renewable energy. This approach is beneficial in understanding the maximum theoretical capacity for renewable energy, and the opportunity for each technology, it does not however account for the local context and capacity to deliver that potential.
The review of capacity potential within the Local Plan area above helps to set the scale of aspirations, but only indicates what is technically possible, rather than is likely feasible. Achieving maximum potential requires setting goals for various stakeholders and organisations and co‐ordinating their actions. While establishing technical potential as the local potential would be ideal, it is important to tailor goals to local realities to ensure delivery partners see goals as achievable rather than overwhelming. This section builds on this, providing an additional layer of understanding possibilities – examining the ability and ambition of local delivery partners.
With this in mind, a relationship between technical and delivery potential can be seen. As shown in figure 23 the technical potential, calculated using the DECC methodology, is evocative of a ‘top‐down’ approach. An examination, on the other hand, of delivery partners and their ambitions can define what is realistically deliverable from the ‘bottom‐up.’ Setting targets should aim to push delivery potential as close to technical potential as possible, but understand that the technical potential might not ever be reached.
Figure 23: Finding the balance between technical and delivery potential
This section therefore examines the role of the range of different stakeholders. It builds on the feedback from a stakeholder workshop as well as relevant case studies.
7. Testing Delivery Potential for Renewable and Low Carbon Technology
AECOM Richmondshire Local Plan Renewable and Low Carbon Energy Study 95
7.2. Stakeholder Workshop
On the 8th of May 2012 60 stakeholders representing renewable and low carbon technology delivery partners gathered in Richmond to investigate barriers and opportunities to delivering reductions in building related carbon emissions across the District. Attendees were broadly grouped into five ‘delivery partners’ – public sector, private sector, community groups, housing developers and energy developers. During an initial discussion around opportunities for reducing energy related greenhouse gas (GHG) emissions, key opportunities outlined were: consistent, independent information and education, planning support, government incentives, engaging with land owners, and changing culture and attitudes.
Following this discussion, each group was then asked to consider their level of ambition for delivering renewable energy from:
Not interested at all, through to
Don’t mind if others do it
Make it easy and I’ll do it
Keenly looking for opportunities, and
WOWEE – really interested
Over 80% of attendees across all delivery stakeholders indicated that they were at least interested if it was easy, and over 50% were keenly looking for opportunities.
As ambition is only part of the story, each delivery partner was asked what priority actions they could undertake to facilitate their uptake of renewable energy. Better communication and engagement, and clear Government policies, were two actions mentioned a number of times. Others have been included in the discussions around each delivery partner below.
With priority actions set, each group was asked to consider how much renewable energy could be delivered over the Core Strategy period using a unique delivery game (picture below). Each group was asked to consider two scenarios. In the first scenario, ‘Business as Usual’, none of the priority actions were adopted. In the second scenario, ‘all actions adopted,’ all of the priority actions were achieved, creating an optimal environment for the delivery partner.

AECOM Richmondshire Local Plan Renewable and Low Carbon Energy Study 96
Once all the delivery partners’ potential to deliver renewable energy was combined, the two scenarios showed a substantial difference in what the partners thought they could achieve. Although in the ‘business as usual’ scenario, the delivery partners keenly thought they could deliver a significant proportion of both Richmondshire’s electricity and heat (primarily through wind and biomass respectively), despite relatively slow delivery to date, once barriers were removed they saw no problem in achieving the national 30% electricity and 12% heat targets within the District.
The sections below discuss each delivery partner in more detail.
7.3. Examining Delivery Partners: Public Sector
Delivery Activity The public sector consists of stakeholders and organisations, which are public owned or operated. Some examples include local councils, schools, and hospitals. As these organisations have a duty to deliver community benefit, they are seldom constrained to purely profitable actions. This is particularly important for renewable and low carbon energy, where payback periods can be protracted beyond what other delivery partners consider financially viable. For this reason, the public sector has the ability to create the critical mass required to make programmes related to renewable energy more affordable within the community.
Case Studies, Opportunities and Constraints
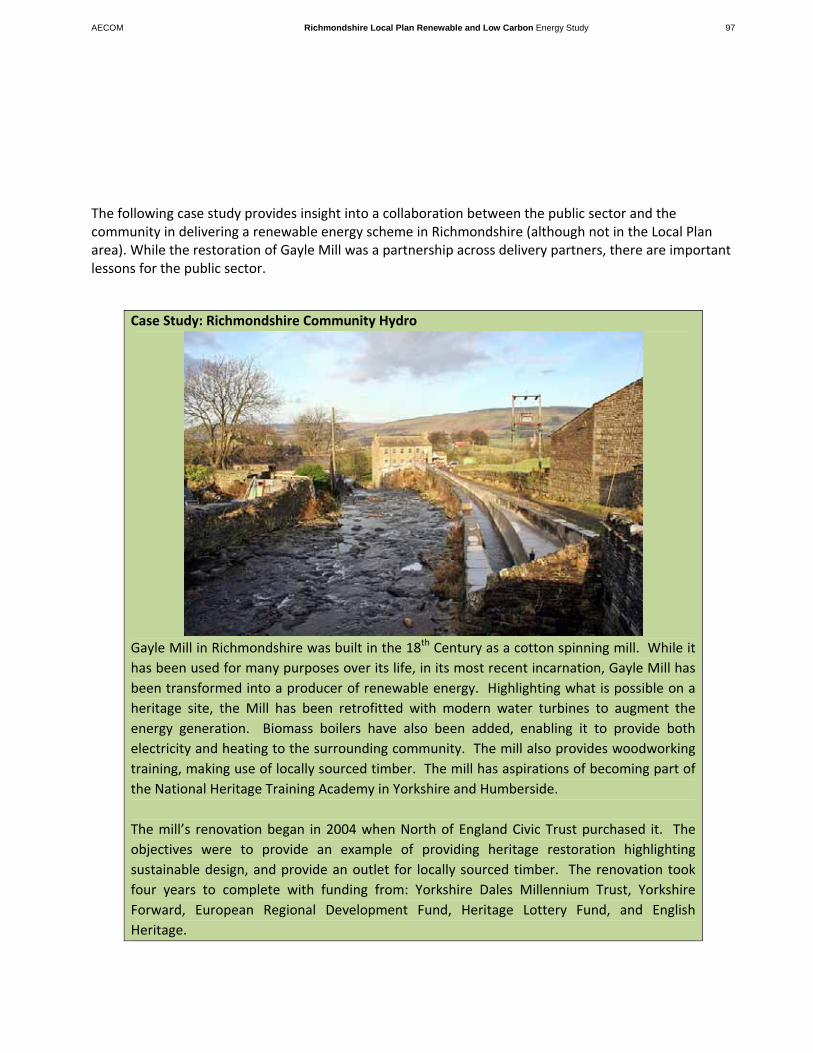
AECOM Richmondshire Local Plan Renewable and Low Carbon Energy Study 97
The following case study provides insight into a collaboration between the public sector and the community in delivering a renewable energy scheme in Richmondshire (although not in the Local Plan area). While the restoration of Gayle Mill was a partnership across delivery partners, there are important lessons for the public sector.
Case Study: Richmondshire Community Hydro
Gayle Mill in Richmondshire was built in the 18th Century as a cotton spinning mill. While it
has been used for many purposes over its life, in its most recent incarnation, Gayle Mill has
been transformed into a producer of renewable energy. Highlighting what is possible on a
heritage site, the Mill has been retrofitted with modern water turbines to augment the
energy generation. Biomass boilers have also been added, enabling it to provide both
electricity and heating to the surrounding community. The mill also provides woodworking
training, making use of locally sourced timber. The mill has aspirations of becoming part of
the National Heritage Training Academy in Yorkshire and Humberside.
The mill’s renovation began in 2004 when North of England Civic Trust purchased it. The
objectives were to provide an example of providing heritage restoration highlighting
sustainable design, and provide an outlet for locally sourced timber. The renovation took
four years to complete with funding from: Yorkshire Dales Millennium Trust, Yorkshire
Forward, European Regional Development Fund, Heritage Lottery Fund, and English
Heritage.

AECOM Richmondshire Local Plan Renewable and Low Carbon Energy Study 98
Lessons learned:
Collaboration between public sector and community groups can be an effective partnership in delivering desirable projects.
There are many barriers and risks to completing projects involving restoration of heritage buildings. Organisations taking on similar projects require tenacious commitment;
Volunteers are essential to ensuring adequate levels of firewood are stored leading up to winter, when heat demand is high;
Adequate storage for firewood should be considered at the outset.
AECOM Richmondshire Local Plan Renewable and Low Carbon Energy Study 99
What are the delivery opportunities for this partner?
Coordinate and lead – As leaders within the community, LAs have the ability to set policy and
establish how future Allowable Solutions funds may be used. The Council also has the ability to
act as a facilitator to encourage communication among other delivery partners and positively
influence the delivery of renewable energy in the area.
Focus on own properties – Many public sector partners, such as RSLs, hospitals, and schools,
own a significant number or large properties that could be retrofitted to be more energy
efficient. This is often initiated through pilot projects to prove the concept.
Educate and promote – Acting on behalf of the community, public partners have the ability to
educate the community on renewable energy and energy efficiency. Schools can play an
important role in this respect.
Setting favourable planning policy – Favourable renewable energy planning policy is one of the
most beneficial actions the Council can take to facilitate increased uptake of renewable
technologies in the Local Plan area.
What are the delivery constraints for this partner?
Political will – To stimulate delivery of renewable energy, strong leadership is needed from the
local authority. Local authority areas with significant levels of renewable energy installed are
often built upon supportive political leadership.
Priorities – If climate change mitigation and GHG reductions are priorities, it is important for
public sector partners to act on behalf of the community and prioritise uptake of low carbon
and renewable energy.
Funding – Funding is often a significant barrier in investing in renewable energies. Outside
government incentive schemes detailed elsewhere in this report such as renewable heat
incentive and feed‐in tariffs (section 3), as well as the Green Deal (section 4), other funding
mechanisms currently exist including:
o Community Energy Saving Programme (CESP) – This fund targets dwellings in areas of deprivation throughout the UK. CESP is funded by energy suppliers and generators (due to end December 2012).
o Salix Finance – Salix provides grant funding to Local Authorities that manage to reduce CO2 in a cost effective manner. Funding typically ranges from £250,000 to £500,000.
Lag time – From idea to implementation, the process of developing policies can seem
protracted, sometimes taking years. For this reason it is important to begin the process early.

AECOM Richmondshire Local Plan Renewable and Low Carbon Energy Study 100
Often the process itself can signal to other stakeholders that the Authority is concerned about
these issues.
Can this partner influence delivery by other partners?
Local authorities’ vision for low carbon and renewable energy helps establish the vision for other delivery partners. In setting clear targets and policies, local authorities can communicate their commitment and influence other delivery partners, particularly private sector and energy developers. Establishing strategic sites where low carbon infrastructure is required, planning authorities can ensure developers investigate and deliver feasible opportunities. The EOP included in this study can be used as a resource to identify strategic locations for delivering renewable and low carbon technologies. Providing a clear and robust policy stance with respect low carbon renewable energy will help provide the confidence and support other delivery partners are seeking to take forward progressive projects in the Local Plan area.
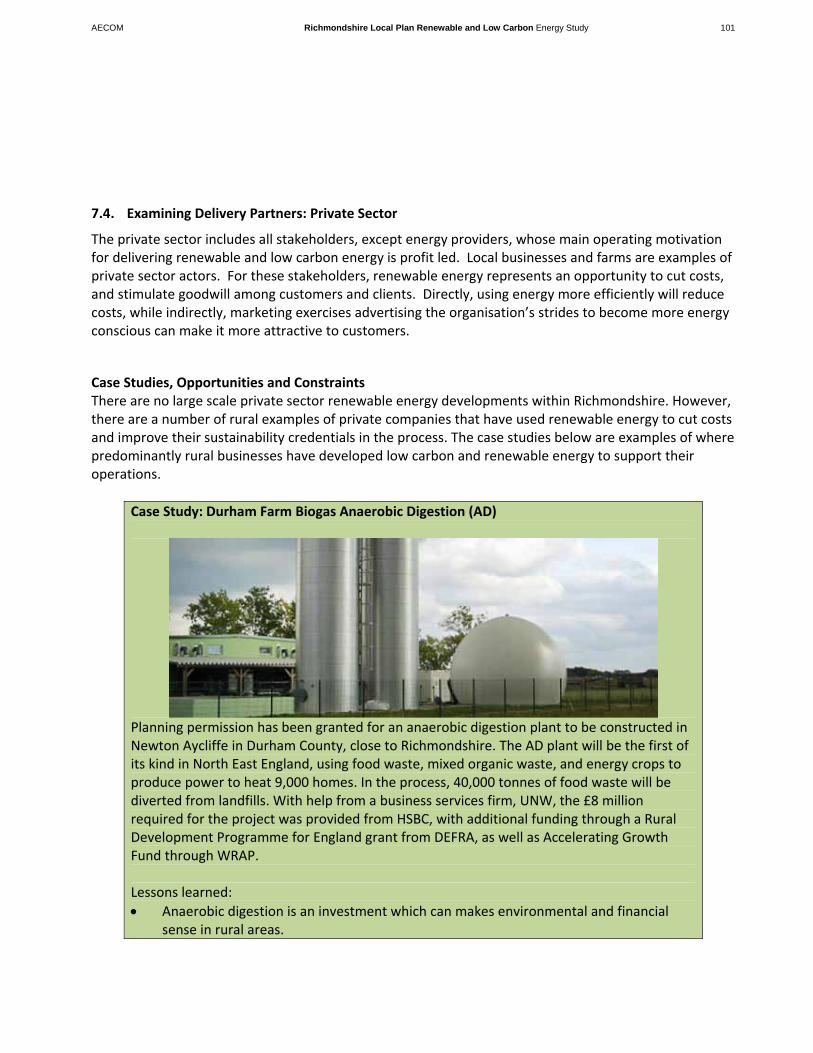
AECOM Richmondshire Local Plan Renewable and Low Carbon Energy Study 101
7.4. Examining Delivery Partners: Private Sector
The private sector includes all stakeholders, except energy providers, whose main operating motivation for delivering renewable and low carbon energy is profit led. Local businesses and farms are examples of private sector actors. For these stakeholders, renewable energy represents an opportunity to cut costs, and stimulate goodwill among customers and clients. Directly, using energy more efficiently will reduce costs, while indirectly, marketing exercises advertising the organisation’s strides to become more energy conscious can make it more attractive to customers.
Case Studies, Opportunities and Constraints There are no large scale private sector renewable energy developments within Richmondshire. However, there are a number of rural examples of private companies that have used renewable energy to cut costs and improve their sustainability credentials in the process. The case studies below are examples of where predominantly rural businesses have developed low carbon and renewable energy to support their operations.
Case Study: Durham Farm Biogas Anaerobic Digestion (AD)
Planning permission has been granted for an anaerobic digestion plant to be constructed in Newton Aycliffe in Durham County, close to Richmondshire. The AD plant will be the first of its kind in North East England, using food waste, mixed organic waste, and energy crops to produce power to heat 9,000 homes. In the process, 40,000 tonnes of food waste will be diverted from landfills. With help from a business services firm, UNW, the £8 million required for the project was provided from HSBC, with additional funding through a Rural Development Programme for England grant from DEFRA, as well as Accelerating Growth Fund through WRAP. Lessons learned:
Anaerobic digestion is an investment which can makes environmental and financial sense in rural areas.

AECOM Richmondshire Local Plan Renewable and Low Carbon Energy Study 102
Funding sources are key to increasing uptake of renewable energy – both loans and funding sources were required to develop the scheme.
Case Study: Newcastle University Anaerobic Digestion
Newcastle University’s Cockle Park Farm in Northumberland is an anaerobic digestion plant which has recently begun producing heat from agricultural waste. The plant relies on slurry from dairy, beef, and food waste from surrounding businesses. The £1.2 million plant is part of the university’s initiative to investigate ways for agriculture to become more sustainable. To facilitate this goal, an additional digester tank and sampling ports were added to enable experimentation with various feedstocks and energy crops. The quality of the biogas produced is then monitored. In addition to the producing energy, the farm also runs workshops to inform people of how anaerobic digestion works, and offers free feasibility assessment services to farmers considering alternative power sources. Newcastle University and the Rural Development Programme for England helped to fund the project. Lessons Learned:
Various forms of agricultural waste can be used to create energy though AD.
Education and promotion of renewable energy types is important for their increased adoption
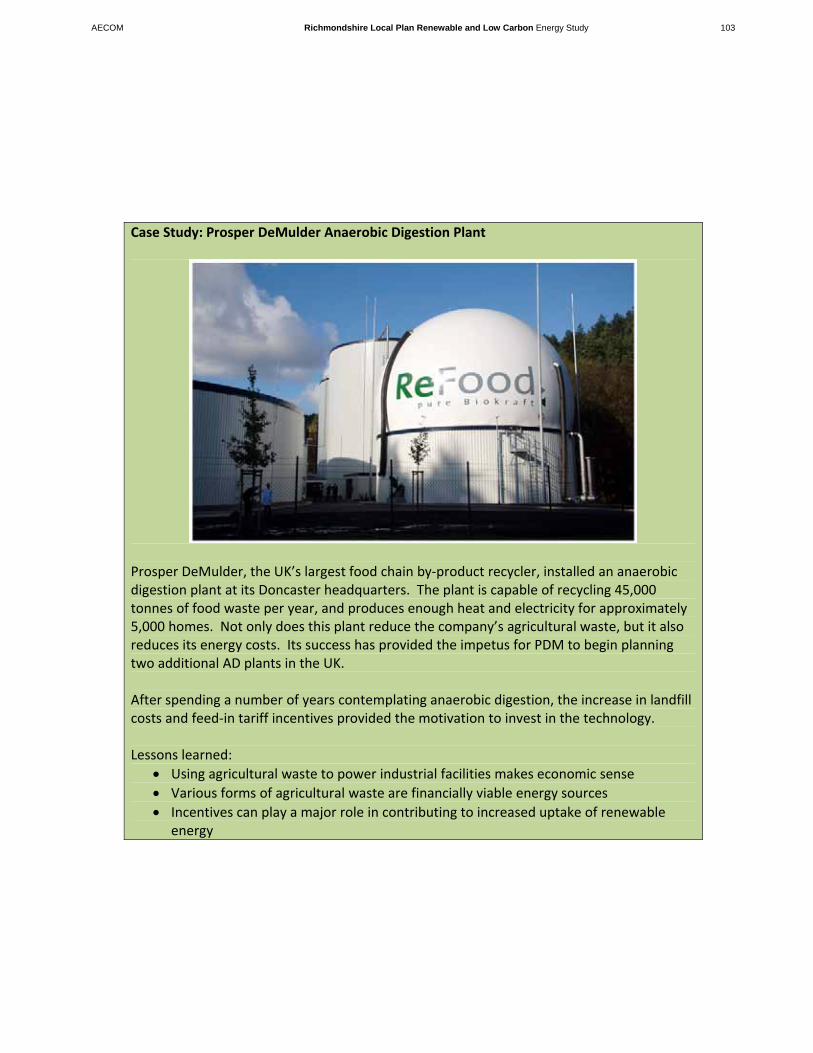
AECOM Richmondshire Local Plan Renewable and Low Carbon Energy Study 103
Case Study: Prosper DeMulder Anaerobic Digestion Plant
Prosper DeMulder, the UK’s largest food chain by‐product recycler, installed an anaerobic digestion plant at its Doncaster headquarters. The plant is capable of recycling 45,000 tonnes of food waste per year, and produces enough heat and electricity for approximately 5,000 homes. Not only does this plant reduce the company’s agricultural waste, but it also reduces its energy costs. Its success has provided the impetus for PDM to begin planning two additional AD plants in the UK. After spending a number of years contemplating anaerobic digestion, the increase in landfill costs and feed‐in tariff incentives provided the motivation to invest in the technology. Lessons learned:
Using agricultural waste to power industrial facilities makes economic sense
Various forms of agricultural waste are financially viable energy sources
Incentives can play a major role in contributing to increased uptake of renewable energy

AECOM Richmondshire Local Plan Renewable and Low Carbon Energy Study 104
Case Study: Branston Potatoes
Branston Potatoes, in Central Lincolnshire, installed an anaerobic digestion plant, which uses potatoes unfit for consumption to power its facility. Not only does this reduce waste, but it also reduces the factory’s electricity demand and reduces costs for the company in the process. One less heavy goods vehicle, which would otherwise be used to transport the unfit potatoes, is taken off the road each day.
The company’s desire to reduce wasted potatoes and reduce fuel costs drove them to install an anaerobic digestion plant using funding grants from the Rural Development Programme for England (RDPE) and DEFRA.
Lessons learned:
Biomass can be used to power large industrial facilities.
The Local Authority benefits environmentally from the increase in renewable energy installed, and reduction in energy demand and CO2 emissions. This also helps Central Lincolnshire achieve renewable energy targets.
There are many sources of biomass. In a rural part of Central Lincolnshire, different forms of agricultural waste can help provide low carbon power.
Not only can anaerobic digestion significantly reduce waste in the agricultural industry, but it can also save a substantial amount of money.
For industry partners, renewable and low carbon energy schemes often make financial sense to reduce energy costs and manage resources on‐site.
If incentives are in place, industry can play a major role in contributing to the renewable energy in Central Lincolnshire.

AECOM Richmondshire Local Plan Renewable and Low Carbon Energy Study 105
What are the delivery opportunities for this partner?
Economies of Scale – Many private sector partners have a number of locations and/or large
facilities. Sourcing energy renewable for stakeholders with a large aggregate demand can
result in a large financial return.
Anaerobic digestion – Within the food and agriculture industries in the Local Plan area, the
opportunity to create an additional, diversified income stream using anaerobic digestion is
attractive. Reducing waste, emissions, and costs while increasing energy independence are
some of the benefits of private enterprise producing energy from anaerobic digestion.
Energy cost reduction – Reducing energy use will reduce operating costs. Finding ways to use
energy more efficiently through either Combined Heat and Power (CHP) or anaerobic digestion
can particularly help large energy users, and have the ability to act as a catalyst to drive the
delivery of district heating schemes for surrounding communities with appropriate densities.
Waste reduction – Particularly for private partners with large amounts of food waste, rather
than incurring additional costs in discarding it, investigating ways to use that waste for energy
production, or sell it to other parties can be financially worthwhile.
Community involvement – Taking a leadership role in working with the community to achieve
its carbon emission targets through the implementation of renewable energy can improve the
image of businesses operating in the Local Plan area.
Green economy – Many local authorities are keen to improve their economy in a sustainable
manner. Using renewable and low carbon energy can play be beneficial for businesses and
industry in the Local Plan area.
Anchor loads – Private sector operators often have large facilities with a unique ability to
support district heating networks. This is due to their high heat demand, which can maintain
the network. Partnering with energy developers or the local authority can prove fruitful for all
parties.
Renewable Heat Incentive – The recent introduction of the renewable heat incentives provide
an additional financial incentive for installing CHP and district heating networks.
What are the delivery constraints for this partner?
Planning Policy – When a local authority’s policies are unclear or lack strength, the private
sector can see this as a barrier to committing itself to renewable energy initiatives.
Finance – Given the existing economic realities, funding energy initiatives with large upfront
capital costs can be difficult. Stressing the long‐term reduction in operating costs can help.

AECOM Richmondshire Local Plan Renewable and Low Carbon Energy Study 106
Uncertainty of how national policies, such as feed in tariffs, might change in the future also
represents a financial risk, and impacts developments in all areas across the country.
Energy Education – Private sector delivery partners often lack the industry knowledge to
determine which energy opportunities they should pursue or consider.
Can this partner influence delivery by other partners?
As the private sector has the best understanding of the local economic and business opportunities, and as such could be an important contributor to renewable energy schemes in the Local Plan area. Through partnering with either energy developers or the public sector, the private sector could improve opportunities for delivery of larger‐scale or strategic projects. Private sector land‐owners or large businesses can also drive delivery through use of their own property through collaboration with local communities and land owners.
As evidenced by the case studies, opportunities for private sector partners in rural areas, such as in the
Local Plan area, are focused on anaerobic digestion. Waste produced from agricultural industries lead to
a natural energy source. Establishing partnerships among farms and with energy developers could lead to
the delivery of more AD plants and diverting agricultural waste to low carbon energy generation.

AECOM Richmondshire Local Plan Renewable and Low Carbon Energy Study 107
7.5. Examining Delivery Partners: Communities and Individuals
These organisations often consist of volunteers that are motivated to improve their own community. For a local authority to deliver renewable energy projects, they often rely on support from community groups. Within Richmondshire there are a few active community groups concerned with the implementation of renewable energy in the Local Plan area. These groups are particularly active in the development of small scale hydro projects.
Case Studies, Opportunities and Constraints
In an age where many renewable energy project face objections from community members, Bainbridge Hydro in Yorkshire Dales National Park is a local example of how community groups can work with private sector to deliver benefits both partners are seeking.
Case Study: Richmondshire Community Hydro
Bainbridge hydro scheme is a community project that generates electricity on the River Bain
through a 45kW Archimedes Screw. The plant will produce enough electricity to power 45
homes, saving 110 tonnes of CO2 per year, and producing approximately £35,000 income
AECOM Richmondshire Local Plan Renewable and Low Carbon Energy Study 108
per years for the investors and community. The community will dedicate income generated
to River Bain conservation projects. These projects will also work to educate others on the
importance of managing riverside properties to mitigate the effects of climate change for
the river.
Lessons learned:
Even small scale community/private sector projects can be profitable for all involved;
Community initiative and support for renewable energy projects is crucial to their success.
What are the delivery opportunities for this partner?
Community ownership of renewable installations – While community members are likely to be
wary of large‐scale wind farm developments, their concerns are equally likely to be assuaged
when they stand to profit from them.
Individual financial benefits – National financial incentive programmes, such as the feed‐in tariff
and the renewable heat incentive, provide the opportunity for renewable technologies –
especially micro‐generation – to be economical in the long‐term. Educating the community about
these schemes is also important.
Wider partnership – Looking beyond the Local Plan area’s borders may reveal additional
opportunities. For example, forming a North Yorkshire community group, which purchases micro‐
renewable technologies in bulk might result in savings from economies of scale.
Engender passion and enthusiasm – The small number of community groups involved in the
delivery of renewable energy in the Local Plan area – specifically hydro – present a starting point
to galvanise the support for renewable energy in the area and establish widespread community
support for renewables.
Localism and neighbourhood planning – With National Policy emphasising community‐led
initiatives, it is an opportune time for Richmondshire’s communities to take the initiative and
support the delivery of low carbon and renewable energy.
Facilitate uptake – The local planning authorities have the ability to make low carbon energy
decisions easier for their residents. Some strategies might include:
o Discount provision – Available financing could be used to bulk buy technologies, thereby taking advantage of economies of scale, passing on the cost savings to households and businesses.
o Homeowner or business hire purchase – Appropriate technologies could be leased to householders and businesses. Rental costs could be charged as a proportion of the
AECOM Richmondshire Local Plan Renewable and Low Carbon Energy Study 109
generation income received by the beneficiary. After a period of time, ownership would transfer to the homeowner or business.
o Homeowner or business rental – A third model could be for the authority or partnership to retain ownership of the technologies and rent roof or other suitable space. Rental costs would also be set as a proportion of generation income in this model. As with the hire purchase model, this flexibility will enable the authority, as the administrator, to fund energy infrastructure identified in the EOP.
Education – With new Government incentive schemes for renewable energy, including the
Renewable Heat Incentive and the Feed‐in Tariff, educating community members will be
necessary if they are to apply for these incentive schemes.
What are the delivery constraints for this partner?
Other priorities – community groups largely consist of volunteers, and as such when more pressing
commitments arise, they are likely to abandon voluntary commitments. If the organisation can
achieve small, quick wins and build momentum in the process, commitments to the group can be
increased.
Leadership – Organising residents in a united effort to increase renewable energy in Richmondshire
has been lacking. Community members will need to take on a leadership role if renewable energy
is to become a significant part of the energy mix.
Funding – Financial barriers are some of the biggest facing small community organisations.
However, E.ON Sustainable Energy Fund and Big Lottery Fund are two places to source
community initiative funding.
Expertise – Community members can feel intimidated by their lack of expertise and understanding
of renewable energy and climate change. It is important for all members to have access to
knowledge and advice, and to understand that what they lack in knowledge they can make up for
in passion.
Can this partner influence delivery by other partners?
The Strategies for Innovative Low Carbon Settlements (SILCS) report43 concludes that in order to bring benefits to communities and to build trust and support for renewable energy: “We need to listen to, work with, and engage communities over the whole project life – to understand the “DNA of place” ‐ sharing the issues, the dreams and the solutions; identifying and working with local champions; and
43 21st Century Design: Delivering affordable low carbon development (SILCS report), Institute for Sustainability, 2011

AECOM Richmondshire Local Plan Renewable and Low Carbon Energy Study 110
ensuring the community benefits from the legacy of infrastructure investments such as retrofit and renewables through stimulating local low carbon supply chains.” The findings of the Richmondshire Renewable Study workshop held in May 2012 as well as those of the SILCS report indicate that renewable energy projects, led by any type of delivery partner, should have some form of community involvement or ownership to give benefits to community, promote cohesion and secure local support, increasing acceptability for future projects. One model for this, which works well with the hydro opportunities identified in the previous section, is demonstrated in the Bainbridge Hydro case study.
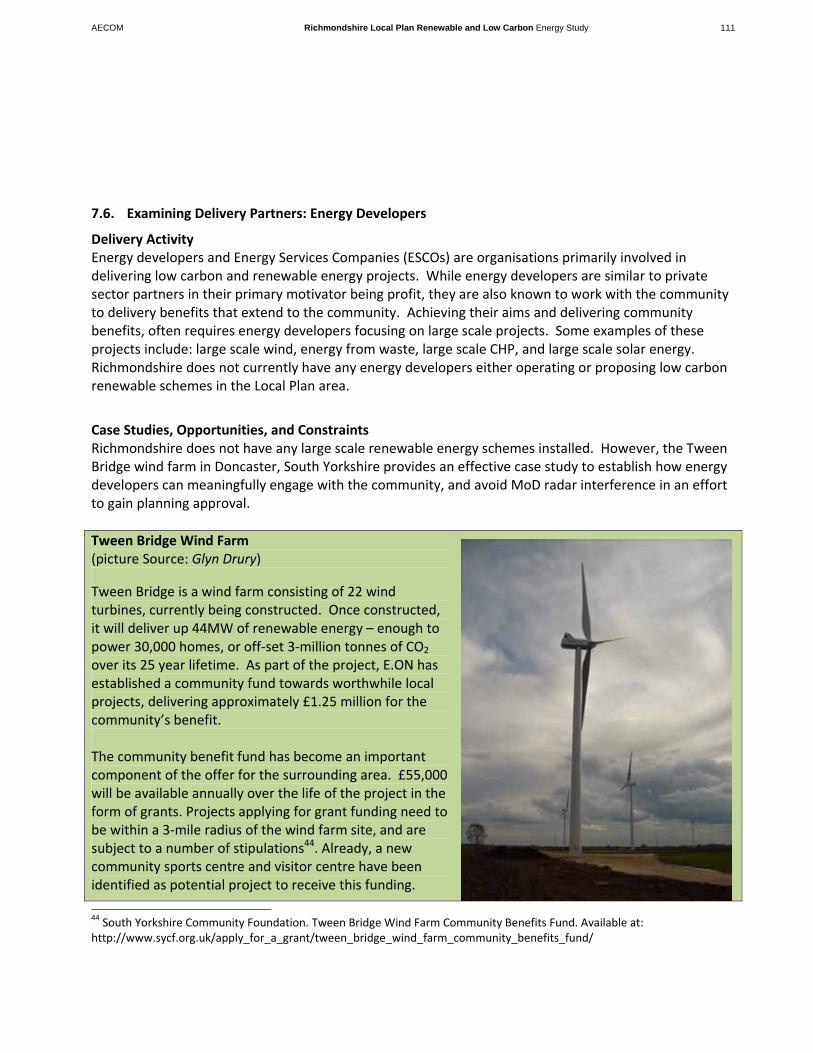
AECOM Richmondshire Local Plan Renewable and Low Carbon Energy Study 111
7.6. Examining Delivery Partners: Energy Developers
Delivery Activity Energy developers and Energy Services Companies (ESCOs) are organisations primarily involved in delivering low carbon and renewable energy projects. While energy developers are similar to private sector partners in their primary motivator being profit, they are also known to work with the community to delivery benefits that extend to the community. Achieving their aims and delivering community benefits, often requires energy developers focusing on large scale projects. Some examples of these projects include: large scale wind, energy from waste, large scale CHP, and large scale solar energy. Richmondshire does not currently have any energy developers either operating or proposing low carbon renewable schemes in the Local Plan area.
Case Studies, Opportunities, and Constraints Richmondshire does not have any large scale renewable energy schemes installed. However, the Tween Bridge wind farm in Doncaster, South Yorkshire provides an effective case study to establish how energy developers can meaningfully engage with the community, and avoid MoD radar interference in an effort to gain planning approval.
Tween Bridge Wind Farm (picture Source: Glyn Drury) Tween Bridge is a wind farm consisting of 22 wind turbines, currently being constructed. Once constructed, it will deliver up 44MW of renewable energy – enough to power 30,000 homes, or off‐set 3‐million tonnes of CO2 over its 25 year lifetime. As part of the project, E.ON has established a community fund towards worthwhile local projects, delivering approximately £1.25 million for the community’s benefit. The community benefit fund has become an important component of the offer for the surrounding area. £55,000 will be available annually over the life of the project in the form of grants. Projects applying for grant funding need to be within a 3‐mile radius of the wind farm site, and are subject to a number of stipulations44. Already, a new community sports centre and visitor centre have been identified as potential project to receive this funding.
44 South Yorkshire Community Foundation. Tween Bridge Wind Farm Community Benefits Fund. Available at: http://www.sycf.org.uk/apply_for_a_grant/tween_bridge_wind_farm_community_benefits_fund/

AECOM Richmondshire Local Plan Renewable and Low Carbon Energy Study 112
As with any large wind farm development, there were significant barriers to achieving planning consent. While there was some community opposition, community engagement was a key part of the process to understand issues which were important to stakeholders, residents and the local authority. Included within this was a monthly community liaison group established to voice concerns. The £1.25 million in community benefits also helped to mitigate residents’ concerns. Issues with radar interference were also an issue. However, by agreeing to install additional radar equipment to sidestep any impacts the wind farm might have on the airport.
Lessons learned:
Engaging with the community and providing funds for community benefits can reduce residents’ concerns and facilitate planning permission.
While the MoD safeguarding team often objects to wind farm development due to potential radar interference, providing additional radar equipment can mitigate these issues.
Doncaster has a high potential for the delivery of wind energy, and more wind farms are likely to come forward for planning approval.
What are the opportunities for this partner?
Wind and heat potential – The Local Plan area does have opportunities for large scale wind
energy. As the Local Plan area is largely rural, the opportunities for district heating are
concentrated in the strategic growth areas. There is also an opportunity to grow biomass and
supply surrounding settlements areas with local carbon neutral fuel source.
Supporting the economy and job opportunities – Diversification of agricultural activities into
biomass production could help provide economic resilience for farms, and potentially generate
employment from processing the fuel source. A skilled workforce will also be needed to develop
and manage biomass district heating technologies. Similarly, wind development can generate
ground rents for land owners and will attract employment in the development and manufacture
of wind farms.
Partnering with community – As energy developers often face opposition from community
groups, partnering with them to deliver benefits to the community can prove fruitful. Tween
Bridge in Doncaster provides evidence that this approach can be successful.
Allowable Solutions – Additional funding for renewable energy projects will likely be made
available through an Allowable Solutions mechanism.
AECOM Richmondshire Local Plan Renewable and Low Carbon Energy Study 113
What are the constraints for this partner?
Uncertainty in the planning process – When the Council’s regulations and ambitions for renewable
energy are unclear, energy developers are likely to be more reticent.
Local opposition – Although public opinion is often seen as a barrier to renewable energy
generation, surveys indicate this may be the result of a loud minority. Populus’ 2005 survey
indicated that 81% of UK residents are in favour of wind energy development. Encouraging the
quiet majority to speak up will provide the community support energy developers seek.
Radar interference – See section 6. Due to potential for radar interference, the MoD and civilian
airports need to be consulted if wind turbines are planned to be located nearby. Radar
interference issues do have technological solutions, however, it is likely that they would need to be
implemented at cost to the developer.
Grid connections – Local assessment of the capacity of the grid to accept new infrastructure would
need to be assessed on a site by site basis.
Can this partner influence delivery by other partners?
With no large scale low carbon renewable energy schemes operating in Richmondshire’s Local Plan area, there is little evidence of energy developers being active in the area. However, future developments have the potential to bring economic development opportunities to the area and attract inward investment. Any additional investment brought to the area should be linked to local skills development. In addition, through developing large scale renewable energy schemes, energy developers have the ability to educate the public, and drive uptake of micro‐renewables in the area. As highlighted at the delivery partner workshop and the case studies above, partnering and engaging with the community groups and the public sector will help to improve acceptability of renewable energy schemes in the longer term in the Plan area. Acceptance can be fostered further through developing delivery models which involve community ownership.
AECOM Richmondshire Local Plan Renewable and Low Carbon Energy Study 114
7.7. Examining Delivery Partners: Housing Developers
Delivery Activity Housing developers are organisations primarily involved in the delivery of housing. While they are primarily concerned with delivering profitable housing, in recent years there has been a strong focus on delivery of low carbon and renewable energy through new development. The current government proposals work towards enforcement of ‘zero‐carbon’ standards in all new housing development by 2016, and non‐residential development by 2019. As the housing market sees more energy efficient housing as a benefit, these regulations can be implemented profitably. With this evolution, housing and commercial developers are more aware of renewable and low carbon energy opportunities. The ease of delivering building integrated micro‐renewables has made them a popular solution. On large urban extensions of appropriate size and density, CHP and district heating networks are considered viable options.
Social housing landlords represent a sub‐group of housing developers. Because social housing landlords hold properties over the long term, they are interested in their operating efficiency and performance. This provides a business case for them to implement ambitious sustainability targets. Importantly, Richmondshire’s Local Plan outlines a need for approximately 250 affordable housing units in the Local Plan area per year. This represents a real opportunity for Registered Social Landlords (RSLs) to contribute to a more efficient, higher quality, and lower carbon housing stock. Due to RSLs added motivation to construct energy efficient housing supply, the case studies described below focus mainly on RSL developments.
Case Studies, Opportunities, and Constraints While there are no housing developments with a focus on renewable energy within the Local Plan area, lessons can be learned from other developments of rural character.. Three of the following case studies focus on RSLs, while the last one discusses a development built by a private housing developer. The case studies focus on the ambitious code 6 levels achieved within each development.

AECOM Richmondshire Local Plan Renewable and Low Carbon Energy Study 115
Case Study: One Earth Homes, Upton, Northamptonshire
One Earth Homes consist of six terraced houses located in Upton. The design of the homes
and selection of renewable technologies had to be suited to the rural nature of the area.
Achieving Code Six, meant building efficient housing by taking advantage of passive design,
high thermal mass construction, and low air permeability. With efficiency maximised,
renewable heating via a wood pellet boiler district heating network and solar thermal hot
water was incorporated. Photovoltaic solar panels were used to supplement electricity needs,
while green roofs and rainwater recycling was used to reduce freshwater needs. It is not
expected that the increase in price will be substantial compared to an equivalent home.
Lessons learned:
Passive technologies, which improve building efficiency should be used before implementing mechanical solutions such as solar PV and biomass boilers.
Delivery of Code level 6 requires substantial commitments and cooperative relationships among all stakeholders
It is best to collect evidence as soon as possible for the post construction certification
Specialist contractors should be sourced for design and installation of renewable technologies
District heating can be practical and cost effective
Monitoring the actual performance against the design of the development can help provide useful knowledge
Educating occupants is important to ensuring their homes operate to their designed efficiency
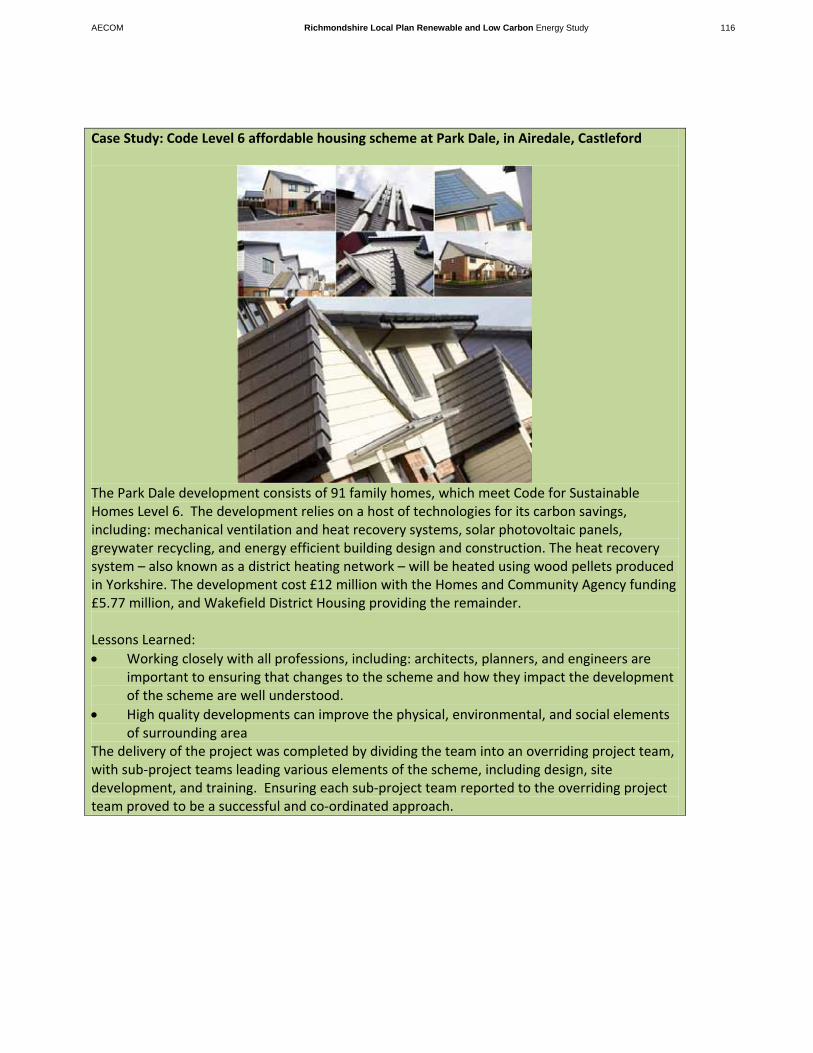
AECOM Richmondshire Local Plan Renewable and Low Carbon Energy Study 116
Case Study: Code Level 6 affordable housing scheme at Park Dale, in Airedale, Castleford
The Park Dale development consists of 91 family homes, which meet Code for Sustainable Homes Level 6. The development relies on a host of technologies for its carbon savings, including: mechanical ventilation and heat recovery systems, solar photovoltaic panels, greywater recycling, and energy efficient building design and construction. The heat recovery system – also known as a district heating network – will be heated using wood pellets produced in Yorkshire. The development cost £12 million with the Homes and Community Agency funding £5.77 million, and Wakefield District Housing providing the remainder. Lessons Learned:
Working closely with all professions, including: architects, planners, and engineers are important to ensuring that changes to the scheme and how they impact the development of the scheme are well understood.
High quality developments can improve the physical, environmental, and social elements of surrounding area
The delivery of the project was completed by dividing the team into an overriding project team, with sub‐project teams leading various elements of the scheme, including design, site development, and training. Ensuring each sub‐project team reported to the overriding project team proved to be a successful and co‐ordinated approach.
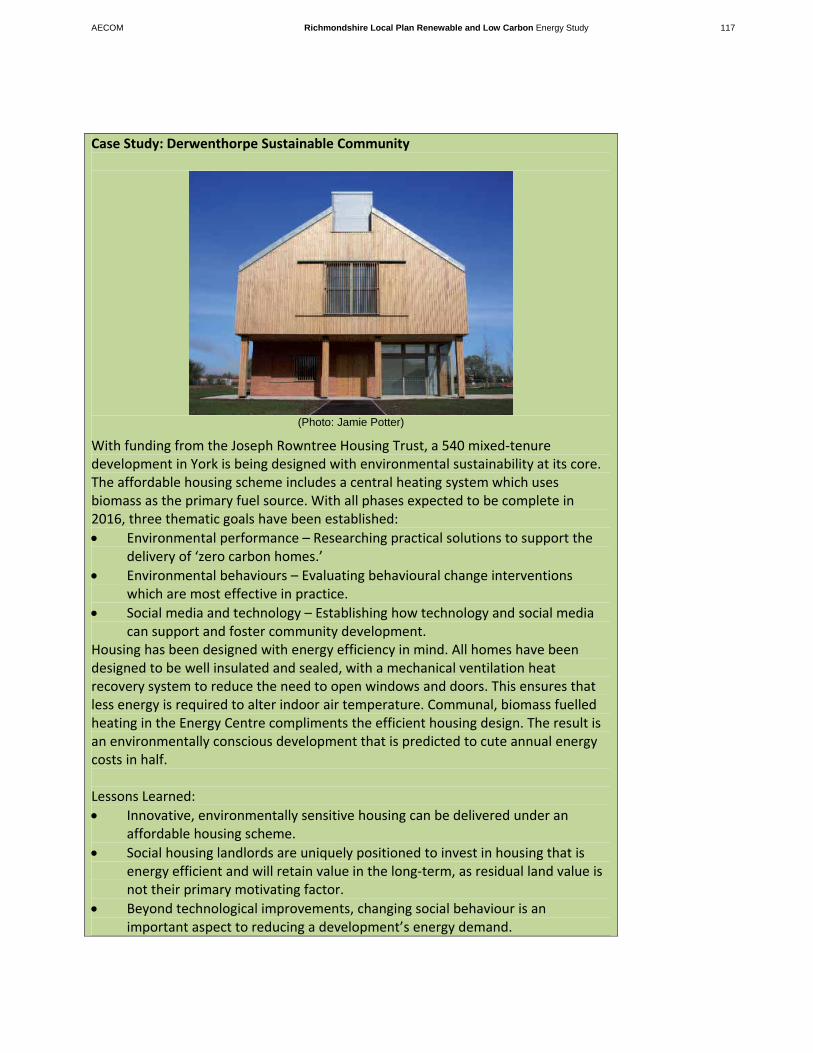
AECOM Richmondshire Local Plan Renewable and Low Carbon Energy Study 117
Case Study: Derwenthorpe Sustainable Community
(Photo: Jamie Potter)
With funding from the Joseph Rowntree Housing Trust, a 540 mixed‐tenure development in York is being designed with environmental sustainability at its core. The affordable housing scheme includes a central heating system which uses biomass as the primary fuel source. With all phases expected to be complete in 2016, three thematic goals have been established:
Environmental performance – Researching practical solutions to support the delivery of ‘zero carbon homes.’
Environmental behaviours – Evaluating behavioural change interventions which are most effective in practice.
Social media and technology – Establishing how technology and social media can support and foster community development.
Housing has been designed with energy efficiency in mind. All homes have been designed to be well insulated and sealed, with a mechanical ventilation heat recovery system to reduce the need to open windows and doors. This ensures that less energy is required to alter indoor air temperature. Communal, biomass fuelled heating in the Energy Centre compliments the efficient housing design. The result is an environmentally conscious development that is predicted to cute annual energy costs in half. Lessons Learned:
Innovative, environmentally sensitive housing can be delivered under an affordable housing scheme.
Social housing landlords are uniquely positioned to invest in housing that is energy efficient and will retain value in the long‐term, as residual land value is not their primary motivating factor.
Beyond technological improvements, changing social behaviour is an important aspect to reducing a development’s energy demand.
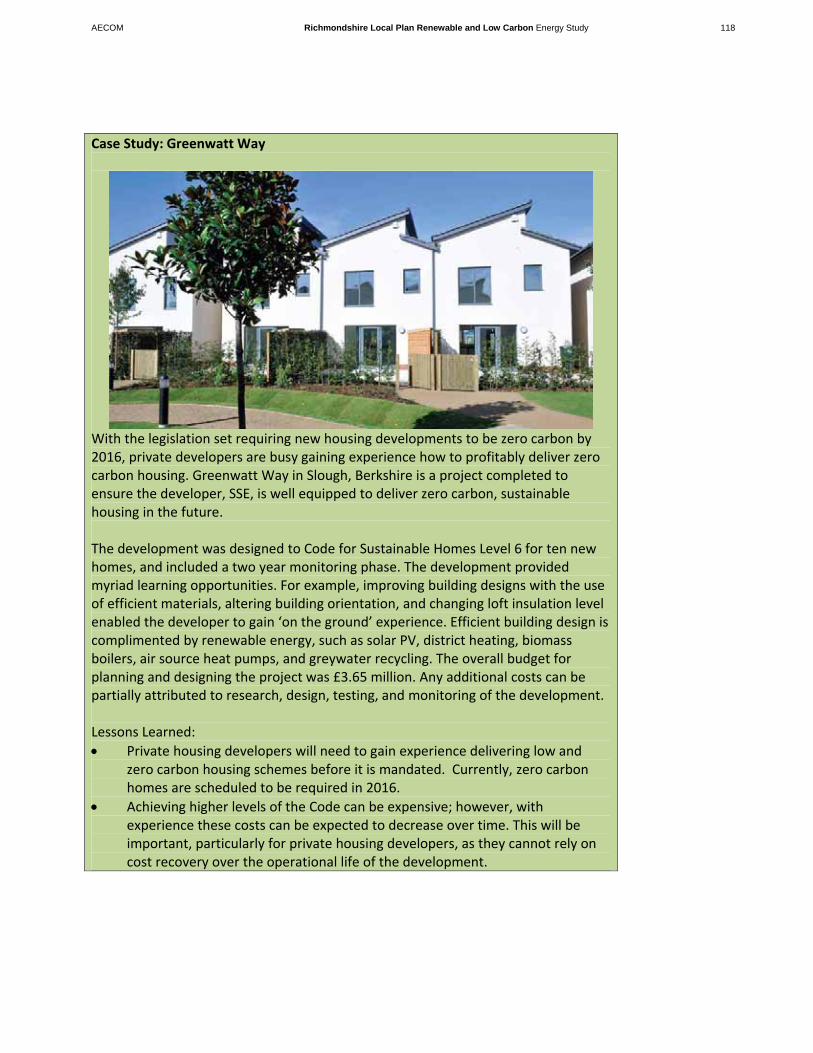
AECOM Richmondshire Local Plan Renewable and Low Carbon Energy Study 118
Case Study: Greenwatt Way
With the legislation set requiring new housing developments to be zero carbon by 2016, private developers are busy gaining experience how to profitably deliver zero carbon housing. Greenwatt Way in Slough, Berkshire is a project completed to ensure the developer, SSE, is well equipped to deliver zero carbon, sustainable housing in the future. The development was designed to Code for Sustainable Homes Level 6 for ten new homes, and included a two year monitoring phase. The development provided myriad learning opportunities. For example, improving building designs with the use of efficient materials, altering building orientation, and changing loft insulation level enabled the developer to gain ‘on the ground’ experience. Efficient building design is complimented by renewable energy, such as solar PV, district heating, biomass boilers, air source heat pumps, and greywater recycling. The overall budget for planning and designing the project was £3.65 million. Any additional costs can be partially attributed to research, design, testing, and monitoring of the development. Lessons Learned:
Private housing developers will need to gain experience delivering low and zero carbon housing schemes before it is mandated. Currently, zero carbon homes are scheduled to be required in 2016.
Achieving higher levels of the Code can be expensive; however, with experience these costs can be expected to decrease over time. This will be important, particularly for private housing developers, as they cannot rely on cost recovery over the operational life of the development.

AECOM Richmondshire Local Plan Renewable and Low Carbon Energy Study 119
What are the opportunities for this partner?
Opportunities for RSLs and private housing developers
Learning from other schemes – With every additional housing development that is built, there is
an opportunity to learn how to incorporate renewable energy more effectively. This is particularly
important with the scheduled mandate of zero carbon housing set for 2016.
Economies of scale – With opportunities for large amounts of growth, there is an opportunity to
take advantage of bulk purchasing and reduce the cost per unit of renewable technology.
Public Enthusiasm – With rising energy costs and concern over environmental issues, home buyers
are becoming sophisticated about their carbon footprint. Housing that is more energy efficient,
and uses renewable energy for power will have a high demand, and justify a higher selling price.
Opportunities for social landlords (RSLs)
Long term outlook – As RSLs hold on to their housing stock, they are less driven by short term
residual land values. Having responsibility for the long term maintenance and running of
properties, coupled with their duty of care to tenets means that they are more likely to consider
investing in carbon reduction strategies that can have long payback periods on the initial capital
investment. In doing so, they stand to reduce the operating costs over the development’s
lifetime.
Funding Sources – With the need to improve housing stocks and energy efficiency, there are a
number of funding sources, which can help RSLs deliver energy efficient housing. The Joseph
Rowntree Housing Trust is one such funding source.
Working with the Local Authority – The delivery is affordable housing is a priority for the Local
Plan area as it is with many local authorities. As such, there is an important opportunity for
collaborative working between RSLs and the Council.
What are the constraints for this partner?
Expertise – The lack of understanding in dealing with renewable energy might be a barrier to
increasing uptake in new developments.
Fear of change – Without the expertise close at hand, there is a fear of the unknown. This is true
for developers, but might also be true for owners/operators of buildings. Fear of change can be
mitigated through education.
Payback – Renewable energy tends to have a high up‐front capital cost, which pays off over the
life of the technology in lower operating costs. Because housing developers do not stand to
benefit from the operating costs, they are less inclined to undertake increased financial risk in the
building phase.
Skills in construction sector – There are currently a dearth of technological skills in the
construction sector in renewable energy and require further development. The Think Low Carbon
Sustainable Centre at Barnsley College is an excellent example of the type of skills development

AECOM Richmondshire Local Plan Renewable and Low Carbon Energy Study 120
required in environmental technologies. The Centre has worked closely with BRE to develop its
programme, and since opening at the beginning of 2012, the centre has already begun educating
small and medium enterprises (SMEs) on sustainable technologies and construction methods.
Sustain Magazine recently awarded Think Low Carbon Centre with the annual Energy Award,
which recognises excellence in energy efficiency in trade and industry.
Rural location – As much of the Local Plan area is rural, some renewable energy generation, such
as CHP and district heating can be difficult to incorporate outside the strategic growth areas.
However, other energies, such as wind and micro‐generation may be more suitable in other areas
Viability – Many developments are constrained financially. However, incorporating renewable
energy can be a differentiating factor that may be worth the investment. Furthermore
Richmondshire DC Economic Viability Study Final Report (2011) highlights that there financial
capacity in developments to support affordable housing objectives, which could include carbon
reduction strategies.
Can this partner influence delivery by other partners?
Housing developers are not currently delivering housing with renewable energy in the Local Plan area. However, given the drive towards zero carbon housing in 2016, they will need to gain the experience and knowledge needed to deliver housing with renewable energy. Some low carbon housing already exists, and there is an opportunity for housing developers to learn from these schemes and develop their expertise going forward. Housing developers can use these schemes as an opportunity to differentiate themselves from competitors. Public demand for energy efficient housing will only increase over time, and will likely justify increased housing prices for housing which incorporates renewable energy.
RSLs differ from private landlords as their motivation to deliver energy efficient housing is greater as the long term operating costs and social welfare of tenants are major drivers. As such, the adoption of carbon reduction strategies that generally only deliver a return on investment over a longer period of time area likely to be more attractive to this sub‐group than they would to general housing developers.

AECOM Richmondshire Local Plan Renewable and Low Carbon Energy Study 121
7.8. Examining Delivery Partners: Land owners and estate managers
Delivery Activity Land owners and estate managers are those people and organisations who own and operate a large amount of land and property within the Local Plan area. As such, they are able to influence the carbon emissions from a large number of buildings and have the potential to develop renewable and low carbon energy such as growing biomass or installing wind turbines. Creating energy efficient properties can result in more attractive properties for prospective tenants, and justify higher rents. In addition, land owners have a vested interest in making more their building more resilient in the long‐term. The Ministry of Defence (MoD) is a special case within Richmondshire. While they are a public organisation with some local autonomy over their asset management, there are ultimately controlled by centralised MoD decisions making in Whitehall which can be detached from the local context. Case Studies, Opportunities, and Constraints The following case study is the prime example of a large landowner installing renewable energy generation in Richmondshire. As the case study outlines, prudent business has led Zetland Estates to implement low carbon energy technologies within their business park.
Zetland Estates
Zetland Estates is a business park, which replaced its old oil heating with biomass boilers. The fuel is sourced from the surrounding estate woodland, providing 30 businesses with over 3,400 square metres of ‘carbon lean’ space. The scheme displaces 160,000 litres of oil previously used, saving 550 tonnes of
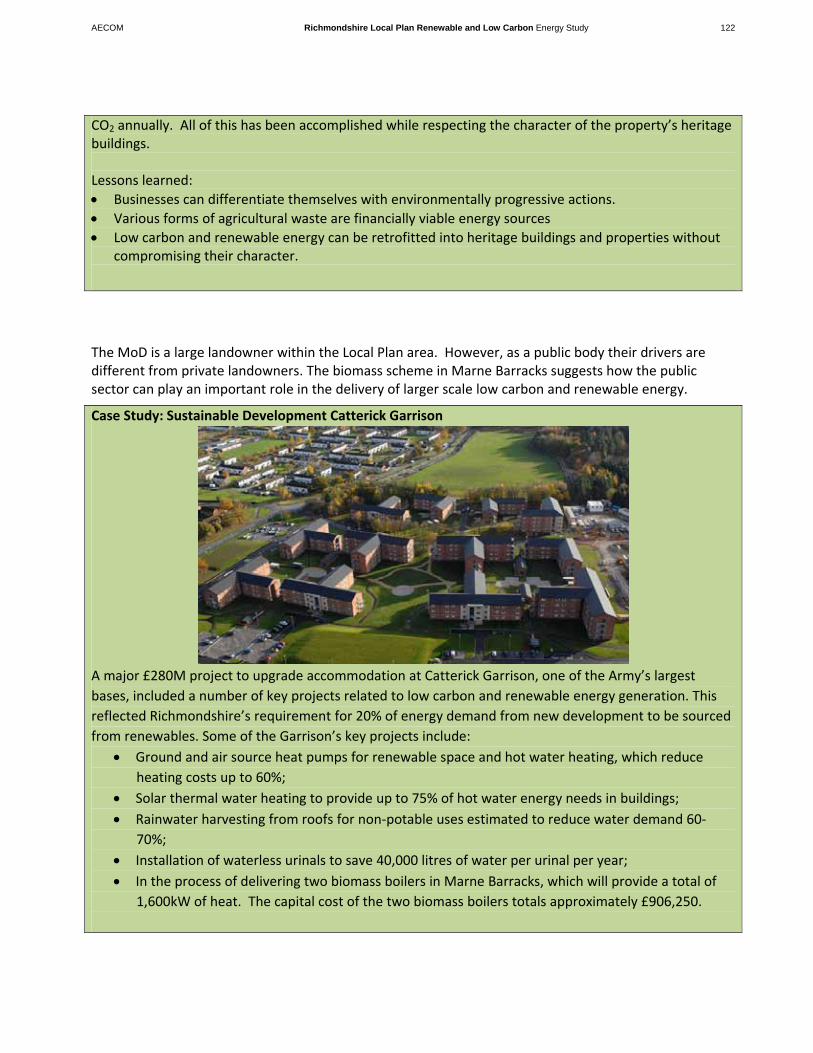
AECOM Richmondshire Local Plan Renewable and Low Carbon Energy Study 122
CO2 annually. All of this has been accomplished while respecting the character of the property’s heritage buildings. Lessons learned:
Businesses can differentiate themselves with environmentally progressive actions.
Various forms of agricultural waste are financially viable energy sources
Low carbon and renewable energy can be retrofitted into heritage buildings and properties without compromising their character.
The MoD is a large landowner within the Local Plan area. However, as a public body their drivers are different from private landowners. The biomass scheme in Marne Barracks suggests how the public sector can play an important role in the delivery of larger scale low carbon and renewable energy.
Case Study: Sustainable Development Catterick Garrison
A major £280M project to upgrade accommodation at Catterick Garrison, one of the Army’s largest
bases, included a number of key projects related to low carbon and renewable energy generation. This
reflected Richmondshire’s requirement for 20% of energy demand from new development to be sourced
from renewables. Some of the Garrison’s key projects include:
Ground and air source heat pumps for renewable space and hot water heating, which reduce
heating costs up to 60%;
Solar thermal water heating to provide up to 75% of hot water energy needs in buildings;
Rainwater harvesting from roofs for non‐potable uses estimated to reduce water demand 60‐
70%;
Installation of waterless urinals to save 40,000 litres of water per urinal per year;
In the process of delivering two biomass boilers in Marne Barracks, which will provide a total of
1,600kW of heat. The capital cost of the two biomass boilers totals approximately £906,250.
AECOM Richmondshire Local Plan Renewable and Low Carbon Energy Study 123
These improvements were part of a £280‐million budget for the redevelopment of Catterick Garrison.
Lessons learned:
Government policies are an important motivator in increasing renewable energy installations
within the District.
Due to economies of scale, implementing renewable energy will result in cost savings for the MoD
Large landowners have the ability to lead by example, and benefit from improved public
perception
What are the opportunities for this partner?
Focus on own properties – Landowners have an interest in retrofitting their own buildings to be more energy efficient. This can be initiated on a pilot project basis to prove the concept is effective.
Economies of Scale – As a large landowner, this partner can take advantage of the scale they are able to implement solutions. Sourcing renewable energy sustainably can be financially beneficial, particularly when done on a large scale.
Energy cost reduction – Reducing energy use will reduce operating costs. When considering multiple properties, options such as Combined Heat and Power (CHP) and district heating networks become a real opportunity to drive down costs.
Community involvement – As influential members of the community, large landowners have the ability to take a leadership role within the community, improving their image and creating goodwill in the process.
Renewable Heat Incentive – The recent introduction of the renewable heat incentive provides additional financial motivation for installing CHP and district heating networks.
What are the constraints for this partner?
Planning policy – When national incentives schemes such as feed in tariffs and renewable heat incentive are uncertain, there is a financial risk to landowners considering implementing large scale renewable energy improvements.
Finance – When faced with the financial realities of implementing renewable energy, the large up‐front capital costs can seem daunting. It is important, however, to stress the long‐term reduction in operating costs.
Energy education – Large landowners often lack the industry knowledge to determine which energy opportunities they should pursue.
Maintenance – Landowners might lack the maintenance knowledge for new forms of renewable energy, such as biomass boilers. Training or sourcing appropriate maintenance specialism may be required.
Can this partner influence delivery by other partners?
Land and estate owners have the ability to influence the use of large areas of land as well as the performance of the properties within their ownership. As such, they can play a number of carbon
AECOM Richmondshire Local Plan Renewable and Low Carbon Energy Study 124
reduction roles, from growing low carbon energy fuels, installing renewable and low carbon technologies and improving the efficiency of their building stock. Partnering with other landowners, or the public sector can often be beneficial in achieve wider carbon reduction goals. Opportunities are often unlocked when neighbouring properties see the benefits of installing various renewable energy technologies, such as district heating networks. The public sector often shares the same goals as the large landowners. Collaborating with the public sector to understand how low carbon and renewable energy projects can benefit both parties is important to creating a more resilient Local Plan area.
7.9. Key Considerations for Developing Local Plan Policies
The sections above have considered the renewable energy delivery potential for each of the delivery partners in the Local Plan area. A number of considerations have emerged.
Technical potential provides an upper limit for what is theoretically possible for delivering renewable energy in the Local Plan area. However, a range of different actors need to be involved in realising these opportunities and examining delivery partners’ motivations and capacity for delivery presents a more realistic perspective.
While during the workshop all delivery partners expressed interested in delivering renewable energy, the private sector and energy developers appear especially keen. These partners have the opportunity to be seen as leaders in driving the delivery of these technologies.
While barriers to delivery do exist, none of them are insurmountable, and can be solved through communication, leadership, and ambition. Clear planning policy was highlighted as an important step in setting the ambition and providing clarity for other deliver partners.
The analysis of renewable and low carbon energy potential above demonstrates that, due to the scale of potential, the Local Plan area should seek to exceed the national 30% target for renewable electricity generation. However, delivery to date has been limited. Planning policy can help provide the appropriate environment, as policies which are supportive of renewable and low carbon energy have been recognised as important to fostering energy developers’ delivery of renewable energy. As such, 30% remains a suitable target to aspire to. Similarly, there is also significant resource for generating heat from renewable fuels. Delivery of the infrastructure to distribute this heat is, however, potentially more onerous.
As one of the major landowners in the Plan Area, the MoD has a real ability to be a leader in the delivery of renewable energy. The greatest potential comes from developing a district heating network coordinated with delivery of strategic development around Catterick Garrison. If in delivering the target numbers of homes in this area, all new homes are to be required to obtain their heat from a District Heating Network then the national target of 12% of heat from renewable energy would be sensible.
Due to their interest in the long term operation of their properties, RSLs represent a key stakeholder in the delivery of high quality, carbon efficient housing. As the Core Strategy calls for an additional 250 affordable housing dwellings, there is an opportunity for many of these to be delivered with renewable energy in mind.

AECOM Richmondshire Local Plan Renewable and Low Carbon Energy Study 125
Growth as a Catalyst for Change
8.1 Introduction
Planning can have a direct influence on carbon reductions in new development through specific policies and targets. Historically, the enforcement of on‐site renewable targets and carbon emission reduction targets has seen significant success. Beginning with the introduction of ‘Merton‐rule’ style policies, planning has become a direct driver in directing the energy strategy for new development sites. Over time however, proposals for changes to Building Regulations have taken the emphasis away from planning targets with minimum standards being directed through national scale requirements. However, planning can still be used to shape the way in which low carbon development comes forward, not only to meet Building Regulations, but where viable and justified potentially exceed them in delivering responses to climate change that support to planning objectives and policy goals..
Planning can have an important influence on sites which have the potential to achieve large carbon reductions in a cost and carbon effective manner. Planning can also coordinate more strategic interventions across an area through the spatial planning process. New developments are often an important trigger for the delivery of new infrastructure, and hence it is important to understand what scale and type of development can drive energy solutions. Furthermore, post 2016, potential opportunities through the emerging approach to ‘zero carbon policy’ and ‘Allowable Solutions’ will place emphasis on local authorities to identify and support delivery of community scale solutions. It may therefore be productive for planning to begin to focus on identifying and delivering community scale energy opportunities which go beyond site boundaries, and obtaining an appropriate financial or delivery contribution from developers towards this. These opportunities do not need to be delivered exclusively in association with new development, although the two are not mutually exclusive. Large cost savings can often be made by planning in low carbon and renewable infrastructure at the start of the design process for new development. This approach could also reduce the burden on developers at a later date, when the zero carbon requirement is introduced, since coordination of community and large‐scale renewable and low carbon energy opportunities would enable them to access a broader range of Allowable Solutions for Building Regulations compliance.
This section therefore looks at the relative cost to developers of the meeting the onsite carbon compliance requirements of ‘zero carbon policy’ (see section 3.3) and the likely revenue generated for Richmondshire District Council through Allowable Solutions based on the Government’s current position45 before investigating opportunities for the strategic growth areas of Catterick Garrison and Leyburn. To finish, this section reviews the cost implications of achieving wider sustainability benefits through the Code for Sustainable Homes and BREEAM.
45 CLG, Zero Carbon Homes, Impact Assessment, May 2011
8. Growth as a Catalyst for Change

8.2 The relative cost to a developer of meeting the on‐site carbon compliance element of zero carbon
As highlighted above, to meet future Building Regulations and ‘zero carbon policy’ a proportion of carbon reduction will need to be achieved onsite. This will be known as ‘carbon compliance’. The amount of carbon compliance required is not yet defined, and may be assessed on a case by case basis. However, the emphasis of emerging ‘zero carbon policy’ is that it provides a cost efficient way of reducing carbon emissions and as such should not place significant over burden on the developer. As such, work on cost implications of the most likely carbon compliance solutions is currently being investigated. The most recent work on this was published by the Zero Carbon Hub, in February 201146. This work modelled the costs of meeting the carbon compliance element using Photovoltaics (PV) and gas boilers for each dwelling. In comparison, the study also calculated the contribution that district heating solutions could make to achieving Carbon Compliance, using either gas (engine) CHP or biomass heating instead of all or some of the PV. As using district heating solutions can reduce the amount of PV required to meet Carbon Compliance, the amount of capital investment into PV is also reduced. These savings, or ‘avoided costs’, from using less PV are summarised in the table below. It should be noted however, that this does not include the capital cost of the district solution which are shown in table 19.
Gas CHPbiomass
heatingGas CHP
biomass
heating
flat 54.5 14 £1,332 4.92 0.00 0.00 £1,332 £1,332
semi 76 11 £3,004 11.4 5.8 0 £726 £3,004
terrace 76 11 £3,444 9.4 3.6 0 £1,637 £3,444
detached 118 10 £4,033 14 8.7 0 £1,134 £4,033
Cost saving from
district solution (in
2016 prices) per
dwellingFloor
area (m2)
Carbon
compliance
level
(kgCO2/m2/yr)
Cost of carbon
compliance with PV
(2016 prices) excl.
fabric
PV required if
no district
heating (m2)
PV required with
district heating
(m2)Type of
dwelling
Table18: summary of potential avoided cost of PV from using district heating solutions
Notes on table:
Where the table says 2016 prices, this means the estimated price of the PV element in 2016, allowing
for expected learning rates, but with no inflation added in.
The cost of carbon compliance for PV is the cost of the PV element only, and does not include the
cost of the gas boiler.
From this table it can be seen that by 2016 (when PV costs are expected to be less than they are now, in real terms), the potential avoided cost of meeting carbon compliance to a developer from connecting to a district heating system could be in the range of £726‐£3,444 per dwelling, depending on the technology and the dwelling type, for higher density developments consisting of flats, or terraced and end‐of‐terrace/ semi‐detached homes47.
The most recent investigation into the cost of developing DHN is set out in a report for DECC by Poyry and AECOM on the potential for DHNs in the UK, from 200948. The data in the Poyry report was based on
46 “Carbon Compliance, setting an appropriate limit for zero carbon new homes, findings and recommendations”, February, 2011 47 Note that this table does not include the capital cost of building the DHN infrastructure. 48 “The Potential and Costs of District Heating Networks, a report to the Department of Energy and Climate Change, April 2009
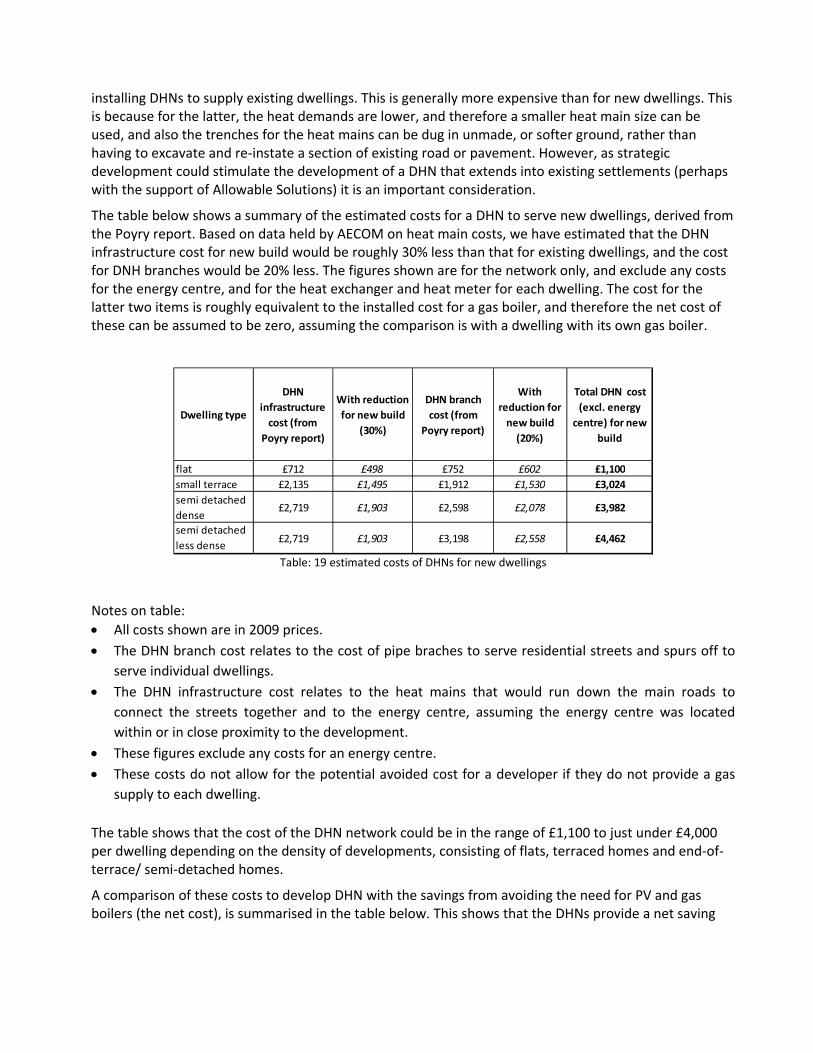
installing DHNs to supply existing dwellings. This is generally more expensive than for new dwellings. This is because for the latter, the heat demands are lower, and therefore a smaller heat main size can be used, and also the trenches for the heat mains can be dug in unmade, or softer ground, rather than having to excavate and re‐instate a section of existing road or pavement. However, as strategic development could stimulate the development of a DHN that extends into existing settlements (perhaps with the support of Allowable Solutions) it is an important consideration.
The table below shows a summary of the estimated costs for a DHN to serve new dwellings, derived from the Poyry report. Based on data held by AECOM on heat main costs, we have estimated that the DHN infrastructure cost for new build would be roughly 30% less than that for existing dwellings, and the cost for DNH branches would be 20% less. The figures shown are for the network only, and exclude any costs for the energy centre, and for the heat exchanger and heat meter for each dwelling. The cost for the latter two items is roughly equivalent to the installed cost for a gas boiler, and therefore the net cost of these can be assumed to be zero, assuming the comparison is with a dwelling with its own gas boiler.
Dwelling type
DHN
infrastructure
cost (from
Poyry report)
With reduction
for new build
(30%)
DHN branch
cost (from
Poyry report)
With
reduction for
new build
(20%)
Total DHN cost
(excl. energy
centre) for new
build
flat £712 £498 £752 £602 £1,100
small terrace £2,135 £1,495 £1,912 £1,530 £3,024
semi detached
dense£2,719 £1,903 £2,598 £2,078 £3,982
semi detached
less dense£2,719 £1,903 £3,198 £2,558 £4,462
Table: 19 estimated costs of DHNs for new dwellings
Notes on table:
All costs shown are in 2009 prices.
The DHN branch cost relates to the cost of pipe braches to serve residential streets and spurs off to
serve individual dwellings.
The DHN infrastructure cost relates to the heat mains that would run down the main roads to
connect the streets together and to the energy centre, assuming the energy centre was located
within or in close proximity to the development.
These figures exclude any costs for an energy centre.
These costs do not allow for the potential avoided cost for a developer if they do not provide a gas
supply to each dwelling.
The table shows that the cost of the DHN network could be in the range of £1,100 to just under £4,000 per dwelling depending on the density of developments, consisting of flats, terraced homes and end‐of‐terrace/ semi‐detached homes.
A comparison of these costs to develop DHN with the savings from avoiding the need for PV and gas boilers (the net cost), is summarised in the table below. This shows that the DHNs provide a net saving
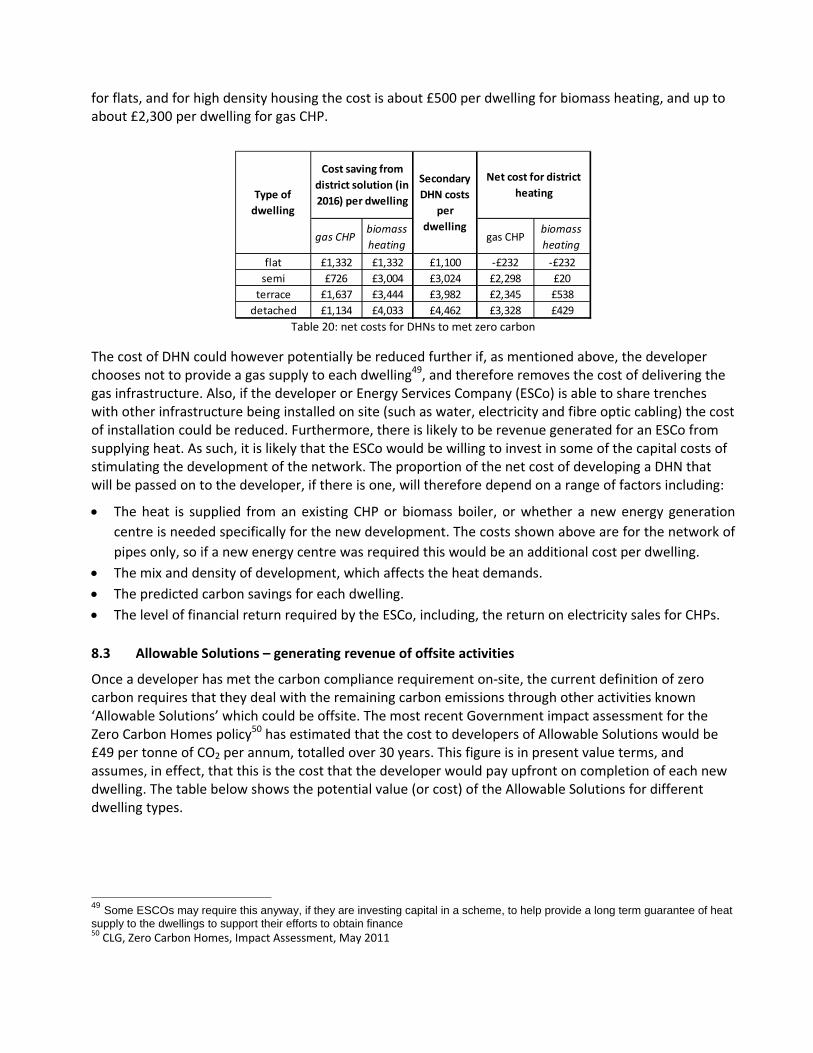
for flats, and for high density housing the cost is about £500 per dwelling for biomass heating, and up to about £2,300 per dwelling for gas CHP.
gas CHPbiomass
heatinggas CHP
biomass
heating
flat £1,332 £1,332 £1,100 ‐£232 ‐£232
semi £726 £3,004 £3,024 £2,298 £20
terrace £1,637 £3,444 £3,982 £2,345 £538
detached £1,134 £4,033 £4,462 £3,328 £429
Cost saving from
district solution (in
2016) per dwelling
Secondary
DHN costs
per
dwelling
Type of
dwelling
Net cost for district
heating
Table 20: net costs for DHNs to met zero carbon
The cost of DHN could however potentially be reduced further if, as mentioned above, the developer chooses not to provide a gas supply to each dwelling49, and therefore removes the cost of delivering the gas infrastructure. Also, if the developer or Energy Services Company (ESCo) is able to share trenches with other infrastructure being installed on site (such as water, electricity and fibre optic cabling) the cost of installation could be reduced. Furthermore, there is likely to be revenue generated for an ESCo from supplying heat. As such, it is likely that the ESCo would be willing to invest in some of the capital costs of stimulating the development of the network. The proportion of the net cost of developing a DHN that will be passed on to the developer, if there is one, will therefore depend on a range of factors including:
The heat is supplied from an existing CHP or biomass boiler, or whether a new energy generation
centre is needed specifically for the new development. The costs shown above are for the network of
pipes only, so if a new energy centre was required this would be an additional cost per dwelling.
The mix and density of development, which affects the heat demands.
The predicted carbon savings for each dwelling.
The level of financial return required by the ESCo, including, the return on electricity sales for CHPs.
8.3 Allowable Solutions – generating revenue of offsite activities
Once a developer has met the carbon compliance requirement on‐site, the current definition of zero carbon requires that they deal with the remaining carbon emissions through other activities known ‘Allowable Solutions’ which could be offsite. The most recent Government impact assessment for the Zero Carbon Homes policy50 has estimated that the cost to developers of Allowable Solutions would be £49 per tonne of CO2 per annum, totalled over 30 years. This figure is in present value terms, and assumes, in effect, that this is the cost that the developer would pay upfront on completion of each new dwelling. The table below shows the potential value (or cost) of the Allowable Solutions for different dwelling types.
49 Some ESCOs may require this anyway, if they are investing capital in a scheme, to help provide a long term guarantee of heat supply to the dwellings to support their efforts to obtain finance 50 CLG, Zero Carbon Homes, Impact Assessment, May 2011
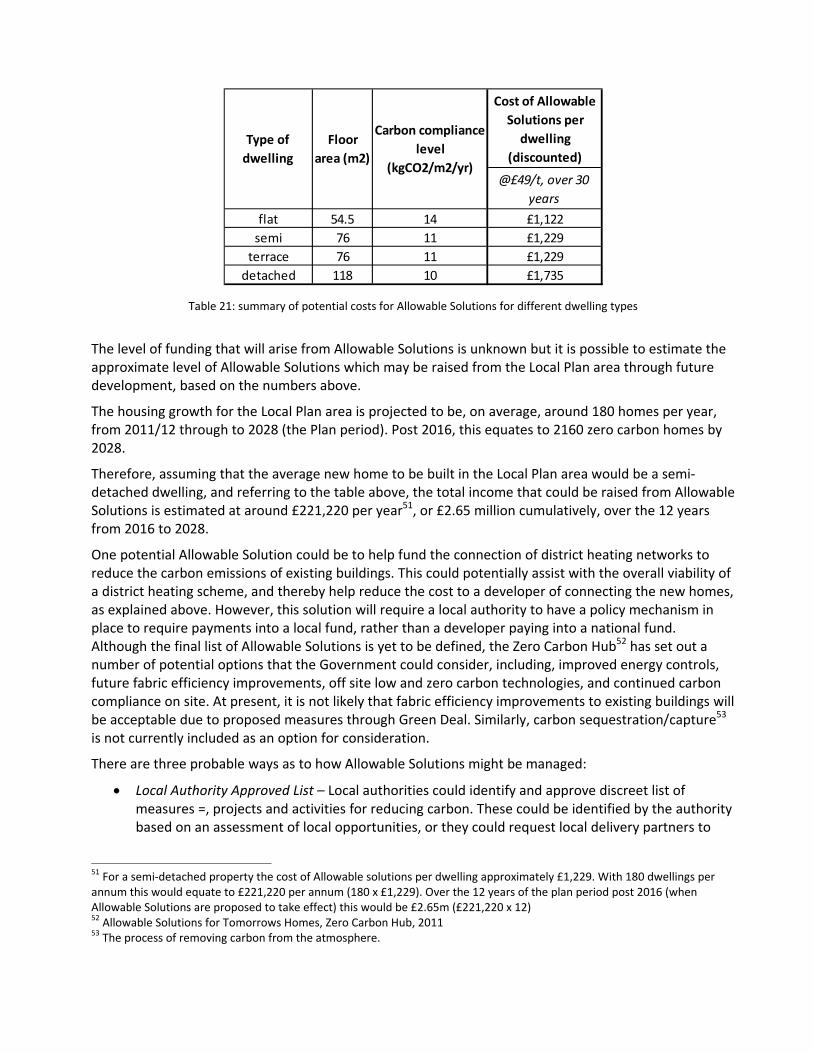
Cost of Allowable
Solutions per
dwelling
(discounted)
@£49/t, over 30
years
flat 54.5 14 £1,122
semi 76 11 £1,229
terrace 76 11 £1,229
detached 118 10 £1,735
Type of
dwelling
Floor
area (m2)
Carbon compliance
level
(kgCO2/m2/yr)
Table 21: summary of potential costs for Allowable Solutions for different dwelling types
The level of funding that will arise from Allowable Solutions is unknown but it is possible to estimate the approximate level of Allowable Solutions which may be raised from the Local Plan area through future development, based on the numbers above.
The housing growth for the Local Plan area is projected to be, on average, around 180 homes per year, from 2011/12 through to 2028 (the Plan period). Post 2016, this equates to 2160 zero carbon homes by 2028.
Therefore, assuming that the average new home to be built in the Local Plan area would be a semi‐detached dwelling, and referring to the table above, the total income that could be raised from Allowable Solutions is estimated at around £221,220 per year51, or £2.65 million cumulatively, over the 12 years from 2016 to 2028.
One potential Allowable Solution could be to help fund the connection of district heating networks to reduce the carbon emissions of existing buildings. This could potentially assist with the overall viability of a district heating scheme, and thereby help reduce the cost to a developer of connecting the new homes, as explained above. However, this solution will require a local authority to have a policy mechanism in place to require payments into a local fund, rather than a developer paying into a national fund. Although the final list of Allowable Solutions is yet to be defined, the Zero Carbon Hub52 has set out a number of potential options that the Government could consider, including, improved energy controls, future fabric efficiency improvements, off site low and zero carbon technologies, and continued carbon compliance on site. At present, it is not likely that fabric efficiency improvements to existing buildings will be acceptable due to proposed measures through Green Deal. Similarly, carbon sequestration/capture53 is not currently included as an option for consideration.
There are three probable ways as to how Allowable Solutions might be managed:
Local Authority Approved List – Local authorities could identify and approve discreet list of measures =, projects and activities for reducing carbon. These could be identified by the authority based on an assessment of local opportunities, or they could request local delivery partners to
51 For a semi‐detached property the cost of Allowable solutions per dwelling approximately £1,229. With 180 dwellings per annum this would equate to £221,220 per annum (180 x £1,229). Over the 12 years of the plan period post 2016 (when Allowable Solutions are proposed to take effect) this would be £2.65m (£221,220 x 12) 52 Allowable Solutions for Tomorrows Homes, Zero Carbon Hub, 2011 53 The process of removing carbon from the atmosphere.
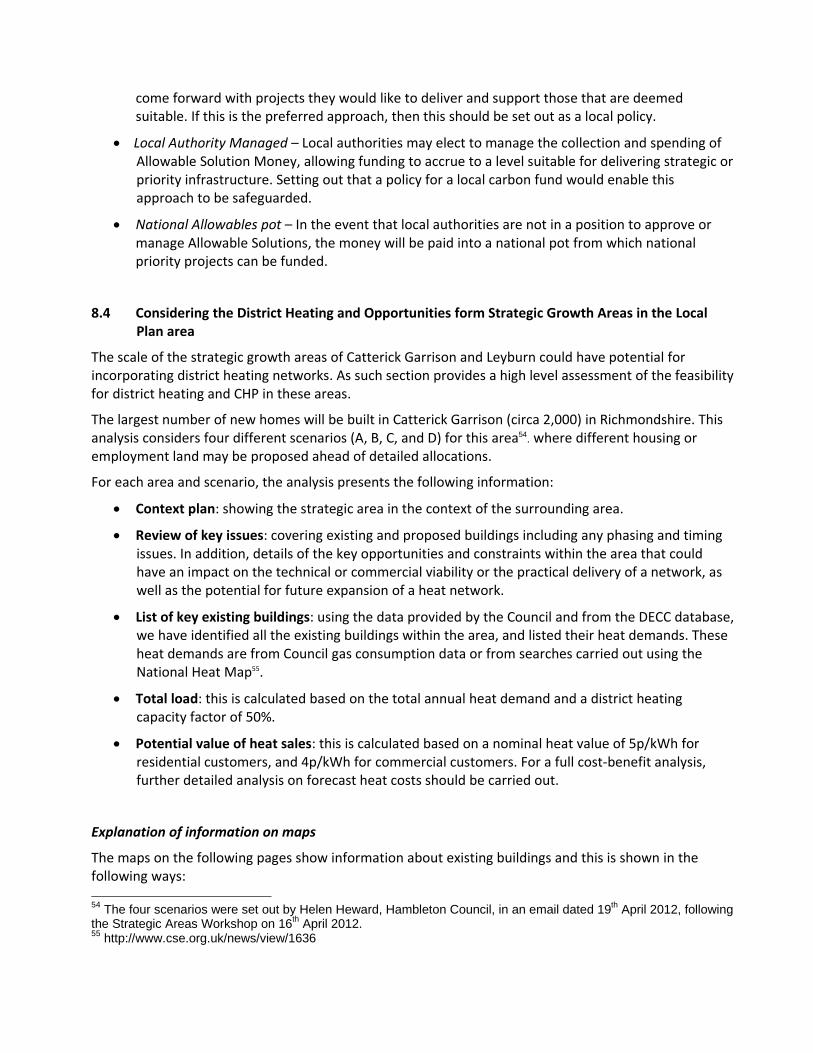
come forward with projects they would like to deliver and support those that are deemed suitable. If this is the preferred approach, then this should be set out as a local policy.
Local Authority Managed – Local authorities may elect to manage the collection and spending of Allowable Solution Money, allowing funding to accrue to a level suitable for delivering strategic or priority infrastructure. Setting out that a policy for a local carbon fund would enable this approach to be safeguarded.
National Allowables pot – In the event that local authorities are not in a position to approve or manage Allowable Solutions, the money will be paid into a national pot from which national priority projects can be funded.
8.4 Considering the District Heating and Opportunities form Strategic Growth Areas in the Local Plan area
The scale of the strategic growth areas of Catterick Garrison and Leyburn could have potential for incorporating district heating networks. As such section provides a high level assessment of the feasibility for district heating and CHP in these areas.
The largest number of new homes will be built in Catterick Garrison (circa 2,000) in Richmondshire. This analysis considers four different scenarios (A, B, C, and D) for this area54. where different housing or employment land may be proposed ahead of detailed allocations.
For each area and scenario, the analysis presents the following information:
Context plan: showing the strategic area in the context of the surrounding area.
Review of key issues: covering existing and proposed buildings including any phasing and timing issues. In addition, details of the key opportunities and constraints within the area that could have an impact on the technical or commercial viability or the practical delivery of a network, as well as the potential for future expansion of a heat network.
List of key existing buildings: using the data provided by the Council and from the DECC database, we have identified all the existing buildings within the area, and listed their heat demands. These heat demands are from Council gas consumption data or from searches carried out using the National Heat Map55.
Total load: this is calculated based on the total annual heat demand and a district heating capacity factor of 50%.
Potential value of heat sales: this is calculated based on a nominal heat value of 5p/kWh for residential customers, and 4p/kWh for commercial customers. For a full cost‐benefit analysis, further detailed analysis on forecast heat costs should be carried out.
Explanation of information on maps
The maps on the following pages show information about existing buildings and this is shown in the following ways: 54 The four scenarios were set out by Helen Heward, Hambleton Council, in an email dated 19th April 2012, following the Strategic Areas Workshop on 16th April 2012. 55 http://www.cse.org.uk/news/view/1636

Existing residential heat density (NB. Not including MoD residential accommodation). This is shown as a scale from 0‐5MW of heat demand per km2 area. Colburn has only one residential area that has reached the lower end of the scale (orange/yellow area) located just north of Catterick Road. Therefore this is an area which may be viable for a heat connection depending on a more detailed assessment of the heat demand per linear length of pipe work. However in general, there is a low density of heat demand in the area, and therefore targeting existing residential properties will be a low priority.
Existing social or sheltered housing clusters. This is shown by a blue circle and the size of the circle indicates the number of units in a cluster. For Colburn there is only one cluster picked up from the datasets provided by the Council and this is at Oak Tree, and consists of 38 units.
Existing non‐residential buildings. These could include many different types of non‐residential buildings and for Colburn the map shows schools and colleges (small dark green circles) and one leisure centre without a swimming pool (larger light green circles). There are additional non‐residential buildings not picked up by the Council data sets which we are aware of from the stakeholder engagement workshop and internet searches. These are added to the maps in the area summaries below.

8.5 Catterick Garrison Overview
Figure 24: Catterick Garrison

Catterick Garrison is a complex place and the likely pattern of development is affected by decisions made by MoD. The Local Plan Core Strategy provides for military related growth identified in the Catterick Garrison Long term Development Plan (2008). The detailed results of the National Defence and Security Review (2010) and their impacts on Catterick Garrison are not yet known, but the Defence Secretary has indicated that limited growth is now expected here. The Core Strategy responds to this uncertainty by indicating the general preferred direction of strategic development subject to the availability of specific sites. The overall strategic growth area is shown on the map above.
Within the overall area, three distinct areas can be identified whose different characteristics will affect the direction of development over the plan period. These are as follows:
Area 1 –Town Centre ‐ To the west of the area Catterick Garrison and centred on the proposed town centre development. This is an area with a strong military flavour, but also contains the main community facilities including Risedale Community College and the Catterick Garrison leisure centre. Development in this area is strongly influenced by military strategic landownership decisions.
Area 2 – Along Catterick Road – This contains the main development sites expected to come forward in the short to medium term. It also includes MoD buildings at the western end of the area at the junction with Horne Rd and a range of large sites beyond here to the east. There is a mix of land ownership including some military sites, a proportion of which are likely to come forward in the medium term, whilst others await commitments on the longer term future of the military base.
Area 3 ‐ South of Sour Beck‐ The area has been identified for long term strategic growth and will not be brought forward until other opportunities for development have been exhausted.
This section of the report will next introduce the key issues and opportunities for each of the three areas, and then model four scenarios for the quantum of new development in each area, and assess the impact this may have on the potential for district heating.

Area 1: Town Centre
This area focuses on the town centre and new development in this area generally includes housing infill sites. For existing heat demands, there are two medium‐sized colleges: Risedale Community College north of Cottages Beck river, and Darlington College, Catterick site, south of the river and the main Catterick Road.
Next to the Darlington College is an MoD site, which was the former Military Hospital, and is now the Duchess of Kent barracks. The heat demand of this building is unknown, however this is likely to be a significant demand compared to the surrounding buildings, and therefore could be an Anchor Heat Load (AHL).
On the west of the site, is the Catterick Garrison Leisure Centre, completed in 2008, which has a swimming pool and therefore would have a high heat demand. South of the Leisure Centre, is the Catterick Garrison superstore, which would have a high electricity demand. This cluster of sites could be viable for a district heating system on its own. For example, the new housing could trigger a new energy centre, with the Leisure Centre acting as the Anchor Heat Load, and superstore as the main customer for electricity.
North of Hipswell Road, and outside of the area, is the MoD Gaza barracks. These are likely to have a high heat demand and may have a central boiler house would facilitate connection to any district heat network.
Town Centre: Issues and Opportunities
Existing buildings Proposed buildings
Risedale Community College
Darlington College, Catterick site
MoD Duchess of Kent barracks
Tesco superstore and other retail buildings in the Catterick Garrison superstore
Catterick Garrison Leisure Centre
MoD Catterick Garrison HQ to the south of the garrison leisure centre
Gaza barracks, north of Hipswell road.
Housing infill sites
Potential housing site on MoD land
Site issues Site opportunities
Cottages Beck runs from the south west to the east of the site therefore limiting options for pipe routes for pipe network. For example, a pipe connection between Risedale Community College and any new housing may have to travel via Hipswell Road unless a suitable route across the beck can be located. This would be subject to consultation with Environment Agency, local flood maps, and local conservation groups.
Access to energy data for the MoD sites is protected, and as such the National Heat Map does not show these buildings have a high heat demand. Early
There may be opportunities for expansion in the following directions:
o West of the site as there may be further new housing sites that come forward.
o North of the site to the MoD Barracks.

engagement with the MoD will be crucial in fully understanding the opportunities in this area.
The Catterick Garrison Leisure Centre is also not reported on the National Heat Map, nor in the Council database, therefore further investigation into their current consumption, and existing buildings services will help to assess viability of the connection.
Area 2: Along Catterick Road
This area runs along the south of the Catterick Road and includes MoD buildings and sites close to Colburn Leisure Centre, which is shown by the light green circle. The energy opportunity mapping has also highlighted sheltered housing, at Oak Tree, on Catterick Road. These two buildings are important heat opportunities as they are buildings with high heat density and single building owners. They are also likely to have single boiler locations making it simpler to connect to a district heat network, because the internal infrastructure is in place.
This area demonstrates a good potential for district heating as there is a mix of proposed uses surrounded by existing Anchor Heat Loads (AHL’s). This area links the areas 1 and 3, therefore phasing on this site would be crucial to ensuring deliverability of a heat network to the surrounding sites. Locating the energy centre within this area would be preferred as it will be central to both sites.
This area includes a number of plots that have been indicated as potential housing or employment land and any of them could be suitable for housing an energy centre, depending on the location of the other loads that it was required to connect to. However, locating the energy centre close to employment land, or an existing single building owner with a large electricity use should be prioritised. This is because, in the case of a Combined Heat and Power (CHP) technology, the direct sale of electricity to a building will (currently) bring higher revenue to the scheme, compared to selling electricity back to the national grid.
Along Catterick Road: Issues and Opportunities
Existing buildings Proposed buildings
Colburn Community Primary School
Colburn Leisure Centre
Oak Tree Sheltered Housing (38 Units)
Duchess of Kent barracks
Potential housing site on MoD
Housing sites
Employment land
Site issues Site opportunities
Phasing of this site will be critical to enable the neighbouring areas to consider connecting to a heat network. For example, should the land on the east of Area 2 be developed as a first phase, and the housing in the town centre (Area 1) also developed as a first phase, then connecting the two sites will involve complex and expensive connections. However should the first phase include the land on the west of Area 2, alongside the town centre (Area 1) then these could be connected from the outset to a heat network.
There are potential opportunities for expansion into the north of the site to the existing Leisure Centre, sheltered housing and existing housing.
Area 3: South of Sour Beck
This area is a greenfield site to the south of the Area 2 along the Catterick Road. The area has been identified for housing, however it is not expected that all of the greenfield land would be developed upon. Due to the potentially large capacity for the site, the density of housing will be an important factor to ensure that district heating is a viable option. For example, housing spread across the whole of area 3 would result in long lengths of pipe work between the heat customers. However, clustering the homes into one area would reduce the amount of pipe work required. Locating new homes to the north of the area would also minimise heat mains lengths between areas 2 and 3, and hence increase the potential viability of the overall scheme.
Area 3 will also rely greatly on the phasing of Area 2, as this is likely to be the direction from which the heat mains would come onto the site. For example, if housing in Area 3 is built before Area 2, then the heat supply for Area 3 housing will need to be constructed before it may be possible to construct an energy centre in Area 2. Therefore, to make a district heating scheme more viable, the phasing of these three areas would need to consider a suitable energy centre location central to the main development areas, and that could be constructed during an early phase .
Other considerations for Area 3 are that Sour Beck runs west to east, along the border between areas 2 and 3. Suitable crossings of Sour Beck should be identified and this should inform the decision to locate new housing. There are also flooding and environmental issues, as well as access issues to the site, which are being investigated by the Council. These issues may affect the locations of the development.
This site is on the outskirts of Colburn however the Somme barracks are MoD barracks that lie just south west of the site and may have a high heat demand. Further investigation into this heat demand would help assess the viability of expanding the scheme to the south west of the site.
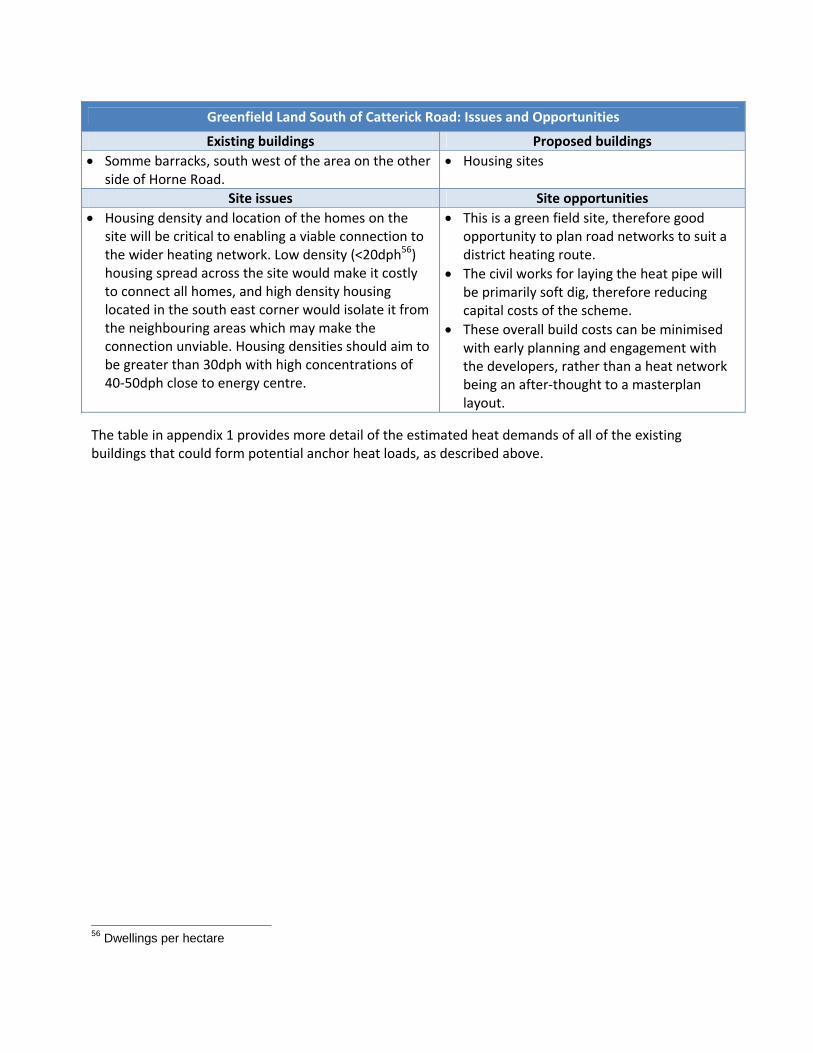
Greenfield Land South of Catterick Road: Issues and Opportunities
Existing buildings Proposed buildings
Somme barracks, south west of the area on the other side of Horne Road.
Housing sites
Site issues Site opportunities
Housing density and location of the homes on the site will be critical to enabling a viable connection to the wider heating network. Low density (<20dph56) housing spread across the site would make it costly to connect all homes, and high density housing located in the south east corner would isolate it from the neighbouring areas which may make the connection unviable. Housing densities should aim to be greater than 30dph with high concentrations of 40‐50dph close to energy centre.
This is a green field site, therefore good opportunity to plan road networks to suit a district heating route.
The civil works for laying the heat pipe will be primarily soft dig, therefore reducing capital costs of the scheme.
These overall build costs can be minimised with early planning and engagement with the developers, rather than a heat network being an after‐thought to a masterplan layout.
The table in appendix 1 provides more detail of the estimated heat demands of all of the existing buildings that could form potential anchor heat loads, as described above.
56 Dwellings per hectare
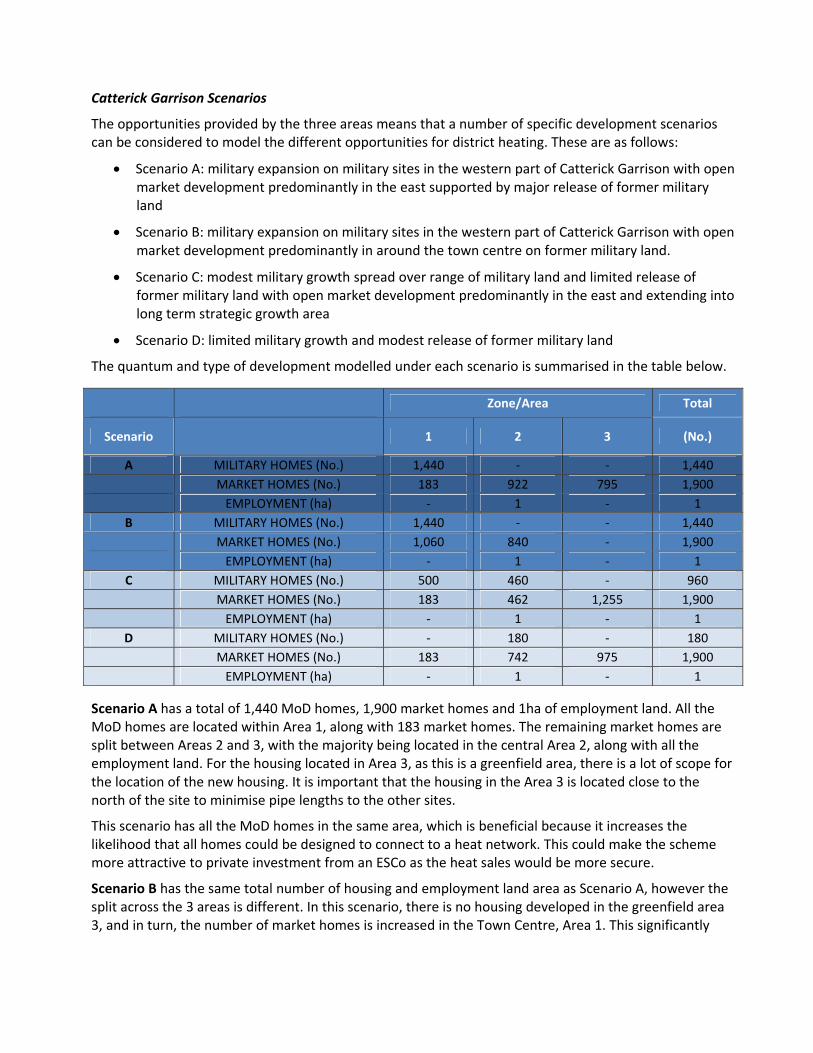
Catterick Garrison Scenarios
The opportunities provided by the three areas means that a number of specific development scenarios can be considered to model the different opportunities for district heating. These are as follows:
Scenario A: military expansion on military sites in the western part of Catterick Garrison with open market development predominantly in the east supported by major release of former military land
Scenario B: military expansion on military sites in the western part of Catterick Garrison with open market development predominantly in around the town centre on former military land.
Scenario C: modest military growth spread over range of military land and limited release of former military land with open market development predominantly in the east and extending into long term strategic growth area
Scenario D: limited military growth and modest release of former military land
The quantum and type of development modelled under each scenario is summarised in the table below.
Zone/Area Total
Scenario
1 2 3 (No.)
A MILITARY HOMES (No.) 1,440 ‐ ‐ 1,440
MARKET HOMES (No.) 183 922 795 1,900
EMPLOYMENT (ha) ‐ 1 ‐ 1
B MILITARY HOMES (No.) 1,440 ‐ ‐ 1,440
MARKET HOMES (No.) 1,060 840 ‐ 1,900
EMPLOYMENT (ha) ‐ 1 ‐ 1
C MILITARY HOMES (No.) 500 460 ‐ 960
MARKET HOMES (No.) 183 462 1,255 1,900
EMPLOYMENT (ha) ‐ 1 ‐ 1
D MILITARY HOMES (No.) ‐ 180 ‐ 180
MARKET HOMES (No.) 183 742 975 1,900
EMPLOYMENT (ha) ‐ 1 ‐ 1
Scenario A has a total of 1,440 MoD homes, 1,900 market homes and 1ha of employment land. All the MoD homes are located within Area 1, along with 183 market homes. The remaining market homes are split between Areas 2 and 3, with the majority being located in the central Area 2, along with all the employment land. For the housing located in Area 3, as this is a greenfield area, there is a lot of scope for the location of the new housing. It is important that the housing in the Area 3 is located close to the north of the site to minimise pipe lengths to the other sites.
This scenario has all the MoD homes in the same area, which is beneficial because it increases the likelihood that all homes could be designed to connect to a heat network. This could make the scheme more attractive to private investment from an ESCo as the heat sales would be more secure.
Scenario B has the same total number of housing and employment land area as Scenario A, however the split across the 3 areas is different. In this scenario, there is no housing developed in the greenfield area 3, and in turn, the number of market homes is increased in the Town Centre, Area 1. This significantly

increases the density of housing in Area 1 and strongly indicates that the energy centre should be located in the west of Area 2, or within Area 1, however this would move the energy centre further from the employment site in Area 2, which would have been beneficial because electricity generated at the energy centre could be sold at commercial rates rather than sold to the grid. Therefore, if an energy centre is located close to the overlap of Areas 1 and 2, a single electricity customer should be identified, such as Darlington College, Catterick site, or a building on the MoD sites.
Scenario B also has the MoD homes in the same area, which is beneficial as discussed above. Overall, Scenario B is more preferable for district heating, as it indicates high heat densities, minimises long pipe runs, and maximises the proportion of MoD homes.
Scenario C shifts the new housing out of the town centre Area 1, and into Areas 2 and 3. The MoD housing is now split between Areas 1 and 2 and market housing increases in the greenfield area 3. This is the scenario with the greatest proportion of housing the Area 3. With over 1,000 new homes in one greenfield development area, this could make a district heating network viable on its own. This would depend on a number of factors that can be influenced by the masterplanning of the site, therefore provided the developer considers district energy from the early stage, this could be built into the site layout, massing and phasing. The energy centre could also be located on Area 3. Therefore if issues arise with locating an energy centre in either Area 1 or 2, this scenario provides an option for locating the energy centre on Area 3.
Scenario D significantly reduces the MoD housing and has the majority of the market housing in the Area 3. This leaves only a small (183) number of market homes in the Town Centre, Area 1. The market homes are generally the more difficult types of homes to attract to a district heating scheme due to developers being unsure of saleability, as well as requiring ESCOs to sell heat to multiple homeowners, rather than a single landlord. In addition, identifying a heat route through a town centre is more difficult than with greenfield sites and hence more costly. Therefore, the heat sales would need to be of a significant value to warrant the capital cost for the network. Overall, for Scenario D, the heat network focus would be on the masterplanning of Area 3 and securing the connection with the employment land in Area 2.
Scenario modelling
Based on the above development scenarios, we modelled the potential heat demand under each scenario and the potential value of annual heat sales. The key assumptions in relation to heat demands were as follows:
Building type Assumed annual heat demand (MWh/unit)
Notes
MILITARY HOMES 5MWh/yr/home
Further clarification on types of homes or cluster flats would improve the accuracy of this figure. As well as understanding the occupancy rates across a typical year
MARKET HOMES 5MWh/yr/home
EMPLOYMENT 556MWh/yr/ha Based on typical industrial park plot density (0.5 gross floor space to site area) and TM46 energy benchmarks for General Office uses.

The existing buildings for all areas are also included where heat demand data is available, as set out in the previous section. The table below shows the results of the modelling for each scenario.
Table 22: Scenario modelling
Total
Estimated Heat demand
Total heat demand for scenario
Potential installed capacity
Potential Value of Heat Sales
Scenario
(No.) (MWh) (MWh/yr) (MW) (£k/yr)
A MILITARY HOMES (No.) 1,440 7,200
MARKET HOMES (No.) 1,900 9,500
EMPLOYMENT (ha) 1 556
EXISTING BUILDINGS 20,447 37,703 8.6 £1,609k
B MILITARY HOMES (No.) 1,440 7,200
MARKET HOMES (No.) 1,900 9,500
EMPLOYMENT (ha) 1 556
EXISTING BUILDINGS 20,447 37,703 8.6 £1,609k
C MILITARY HOMES (No.) 960 4,800
MARKET HOMES (No.) 1,900 9,500
EMPLOYMENT (ha) 1 556
EXISTING BUILDINGS 20,447 35,303 8.1 £1,513k
D MILITARY HOMES (No.) 180 900
MARKET HOMES (No.) 1,900 9,500
EMPLOYMENT (ha) 1 556
EXISTING BUILDINGS 20,447 31,403 7.2 £1,357k
The table above, along with the commentary for each scenario in the previous section, demonstrates that the Scenario B overall could deliver the highest heat sales, combined with the highest density of heat demand.
In principle, any of the four scenarios could accommodate a district heating network provided that the phasing and masterplan considers a heat network at the early stage. The following table provides guiding principles that are common across all the four scenarios.

Delivery Actions: Catterick Garrison
Planning
Policy Masterplan/Layout CIL / Allowable Solutions (AS)
Policy can be used to influence new housing to consider district heating.
In this case, the phasing and site layout is particularly important for maximising opportunities.
Locate the energy centre within central to west of Area 2;
Locate the energy centre close to one or two high electricity consuming customers, this could include MoD as a landlord for military homes;
Locate the housing within Area 3
as close to the northwest of the
site as possible, and as at high a
density as possible.
Phase the three areas to allow
the energy centre to be built
within an early phase, along
with infrastructure to the first
phase buildings;
Consider clusters of MoD housing to be one of the first connections to the network to secure heat sales and attract an ESCo to the scheme.
Create a mechanism for AS from new housing to finance a heat network to connect to existing buildings.
Other
Stakeholder Engagement Corporate Technical Assessments
Early engagement with the MoD and developer of the employment land.
Engagement with wider Catterick Garrison residents to support the scheme.
Ensure the Council departments working in the Catterick Garrison area are fully informed of the opportunities and constraints of the scheme.
Good communication with Council departments working with transport infrastructure projects to co‐ordinate any ground works required.
Conduct a technical assessment of the building services of the existing buildings, particularly the college and leisure centres.

8.6 Leyburn
Figure 25: Leyburn

The strategic growth area to the north of Leyburn has the capacity to potentially accommodate 100‐150 dwellings. It is a greenfield site with woodland in close proximity. This number of dwellings is relatively small, and the heat demand density is low, for a heat network, however the use of locally sourced woodland residue may be suitable for a medium‐small biomass scheme.
To the south east of the site there is a housing care facility, Thornborough Hall Gardens, which consists of 20 units, shown as a blue circle. This could provide an initial heat customer, as well as a single electricity user, should CHP technology be considered.
Further afield from here there are two schools within Leyburn, however these are generally small heat loads and located far from the site and therefore it is unlikely to be viable to connect. There is also a library marked on the map which is located within Thornborough Hall to the south of the site. The Hall also accommodates a number of meeting rooms, conference facilities and is also a venue for civil weddings. For the purpose of this analysis a total of 150 dwellings were assumed to be built within the strategic growth area, with a small district heating network, and with a connection to Thornborough Hall Gardens and Thornborough Hall.
Leyburn: Issues and Opportunities
Existing buildings Proposed buildings
Site Issues Site Opportunities
This is a small site therefore the total load is unlikely to bring wider interest from other buildings in Leyburn.
Existing heat supply to Thornborough Hall Gardens and Thornborough Hall, however further investigation on age and type of boiler, boiler location and internal heating system for the bedrooms is required. This will assess the level of work required to make the existing building compatible with a district heating network and hence help to assess viability of the connection.
Biomass crop is available nearby which could supply biomass fuel to the site and make a biomass heat only, or biomass CHP option more viable.
It should be noted that the cut off size between a small and medium sized biomass boiler is 200kW and the load sizing demonstrated in the table below indicates that a 280kW boiler may be suitable. Therefore, a biomass (heat only) system less than 200kW could also be considered in order to maximise the highest revenue from RHI and make good use of the biomass crop available. 57
Currently the RHI is only available to non‐domestic only, however a domestic property can be eligible for RHI, if it is supplied by a communal RHI installation, such as a communal biomass boiler.
The table below lists the key existing buildings in Leyburn, in close proximity to the development area.
57 RHI Biomass Tariff from April 2012 can be found here: http://www.decc.gov.uk/en/content/cms/meeting_energy/Renewable_ener/incentive/incentive.aspx For a small commercial biomass boiler, the first tier tariff (i.e. for the first 1,314 full‐load equivalent hours) is 8.3p/kWh, and for heat generated over the 1,314 hrs (Tier 2) the tariff is 2.1p/kWh.
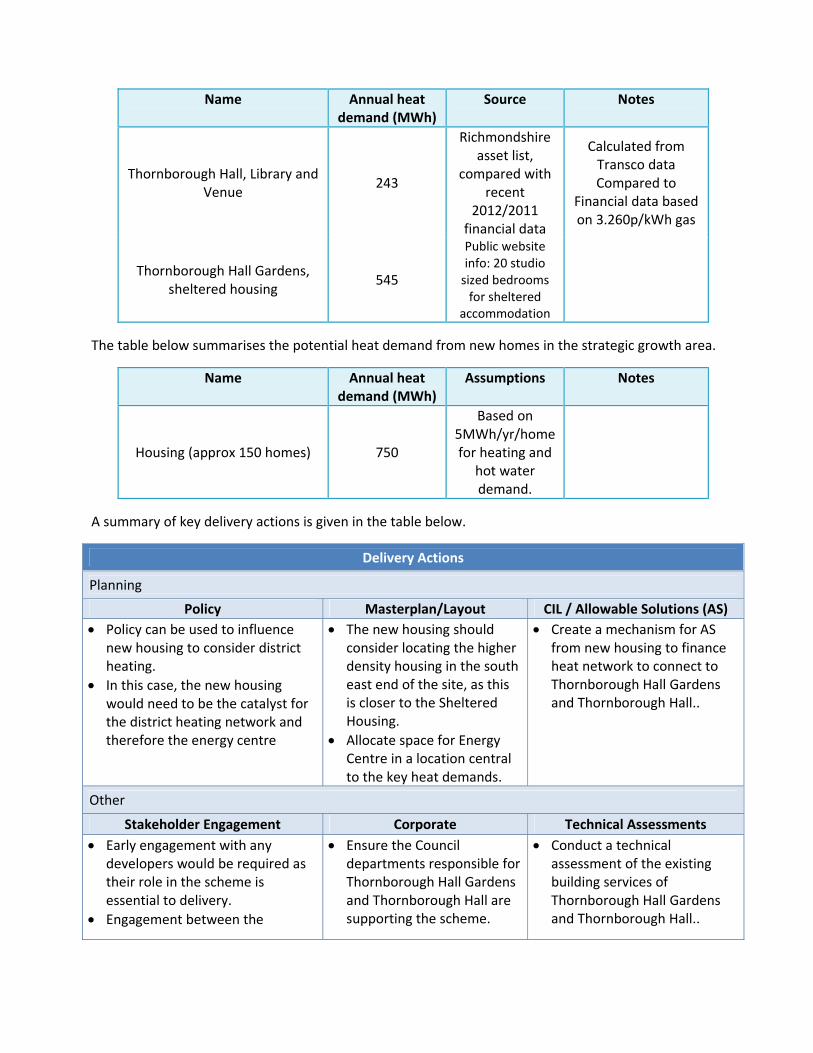
Name Annual heat demand (MWh)
Source Notes
Thornborough Hall, Library and Venue
243
Richmondshire asset list,
compared with recent
2012/2011 financial data
Calculated from Transco data Compared to
Financial data based on 3.260p/kWh gas
Thornborough Hall Gardens, sheltered housing
545
Public website info: 20 studio sized bedrooms for sheltered
accommodation
The table below summarises the potential heat demand from new homes in the strategic growth area.
Name Annual heat demand (MWh)
Assumptions Notes
Housing (approx 150 homes) 750
Based on 5MWh/yr/home for heating and
hot water demand.
A summary of key delivery actions is given in the table below.
Delivery Actions
Planning
Policy Masterplan/Layout CIL / Allowable Solutions (AS)
Policy can be used to influence new housing to consider district heating.
In this case, the new housing would need to be the catalyst for the district heating network and therefore the energy centre
The new housing should consider locating the higher density housing in the south east end of the site, as this is closer to the Sheltered Housing.
Allocate space for Energy Centre in a location central to the key heat demands.
Create a mechanism for AS from new housing to finance heat network to connect to Thornborough Hall Gardens and Thornborough Hall..
Other
Stakeholder Engagement Corporate Technical Assessments
Early engagement with any developers would be required as their role in the scheme is essential to delivery.
Engagement between the
Ensure the Council departments responsible for Thornborough Hall Gardens and Thornborough Hall are supporting the scheme.
Conduct a technical assessment of the existing building services of Thornborough Hall Gardens and Thornborough Hall..

developers, building operators of Thornborough Hall Gardens, and potential new tenants.
Make contact with local woodland owners for potential biomass fuel supply.
Summary
Potential installed capacity Potential value of annual heat
sales Significance of new development to
delivery Potential to expand
(MW) (£k) (High-Med-Low) (High-Med-Low)
0.351 £69k High Low
8.7 Driving Wider Sustainability Standards through Planning
Energy and associated carbon reduction is only one aspect of improving the sustainability performance of built development. With numerous pressures on water resources and biodiversity, as well as potential impacts of waste arising and materials specification local authorities need to ensure that the sustainability performance of development is high; particularly with increasing focus on the potential impacts resulting from climate change that are likely to require adaptation responses. The NPPF recommends using recognised rating systems such as the Code for Sustainable Homes (the Code) for residential properties and BREEAM for non‐domestic buildings provide a framework for measuring the sustainability performance of developments. This section considers the cost of implementing these rating systems.
8.8 The Code for Sustainable Homes
The Code, developed by BRE and supported by the Department of Communities and Local Government (DCLG), sets out a national rating system to assess the sustainability of new residential development, replacing the previous system ‘Ecohomes’. The Code consists of a number of mandatory elements which can be combined with a range of voluntary credits to achieve a credit level rating of between 1 and 6 covering nine sustainability criteria including CO2 reduction, water, ecology, waste, materials, management and pollution. If the mandatory elements for a particular level are not reached, irrespective of the number of voluntary credits, then that code level cannot be achieved. This means that to achieve a full code rating, a range of sustainability issues will have to be incorporated into the building and site design.
Table 23 outlines specific requirements to achieve different levels of the Code. November 2010 brought updates to the Code. One of the major changes compares Code levels 4 through 6 to Part L of 2010 Building Regulations as opposed to Part L from 2006’s Building Regulations. The resulting improvement over Target Emission Rate (TER) is the same – 44% improvement above Part L 2006, or 25% above Part L 2010.

Table 23: Performance required to meet Code levels.
Minimum entry requirements
Code Levels Energy
Improvement over TER
Water
litres/person/day
Total points score out of 100
Level 1 () 10% 120 36
Level 2 () 18% 120 48
Level 3 () 25% 105 57
Level 4 () 44% 105 68
Level 5 () 100% reduction in regulated emission through onsite measure58
80 84
Level 6 () Zero Carbon59 – both regulated and non regulated emissions on site
80 90
There is currently no national minimum requirement for the rating that they achieve; however, proposed changes to the Building Regulations are expected to reflect the requirements of the Code for energy. It should be noted that there is much confusion around this with many authorities assuming the improvements to Building Regulations are connected to the Code; they are not.
Cost Implications of the Code for Sustainable Homes
An industry report on the costs of building homes to full Code levels has been used to show the financial implications of achieving Code targets.60 The costs were predicted and the development industry does not fully support them yet. Only a handful of real Code assessments have been completed so there is not yet sufficient final cost data to establish robust cost benchmarks. An initial study was undertaken in 2008, and updated in 2010 as knowledge has progressed, but nevertheless cost estimates are still evolving. It is likely, however, that as the construction industry gets to grips with the Code the cost of implementation will decrease.
Predicted costs show that costs associated with meeting the Code are relatively modest for most elements. A significant proportion of the costs of delivering Code levels is in meeting the standards for CO2 emissions, which after 2010 will become necessary for meeting Building Regulations anyway. The percentage uplift in build costs associated with Code requirements not related to the energy and CO2 requirement is around 3% for flats and around 6% for houses for Code Level 4. This relates to achieving all additional Code credits – homes must actually achieve 57% of available credits to achieve Code Level 3 and 68% of available credits to achieve Code Level 4.
The figures below show that there is a significant jump in cost when moving from Code Level 4 to Code Level 5 due to the need for water re‐use and recycling systems in order to meet the mandatory water requirements for Code Level 5 and above61. The percentage increase in build costs for Code Level 5 (excluding the mandatory energy criteria) is around 4.5% for flats and nearly 12% for houses. As it is recommended that Code level 4 is used as standards for new development to ensure wider sustainability measures are appropriately considered.
58 Note that this is more onerous than the Government’s current definition of zero carbon which allows for Allowable Solutions to be off site. 59 Note that this is even more onerous than the Government’s current definition of zero carbon which only includes regulated emissions. 60 Code for Sustainable Homes: A Cost Review (produced for department for Communities Local Government by Davis Langdon , March 2010) 61 See footnote 51
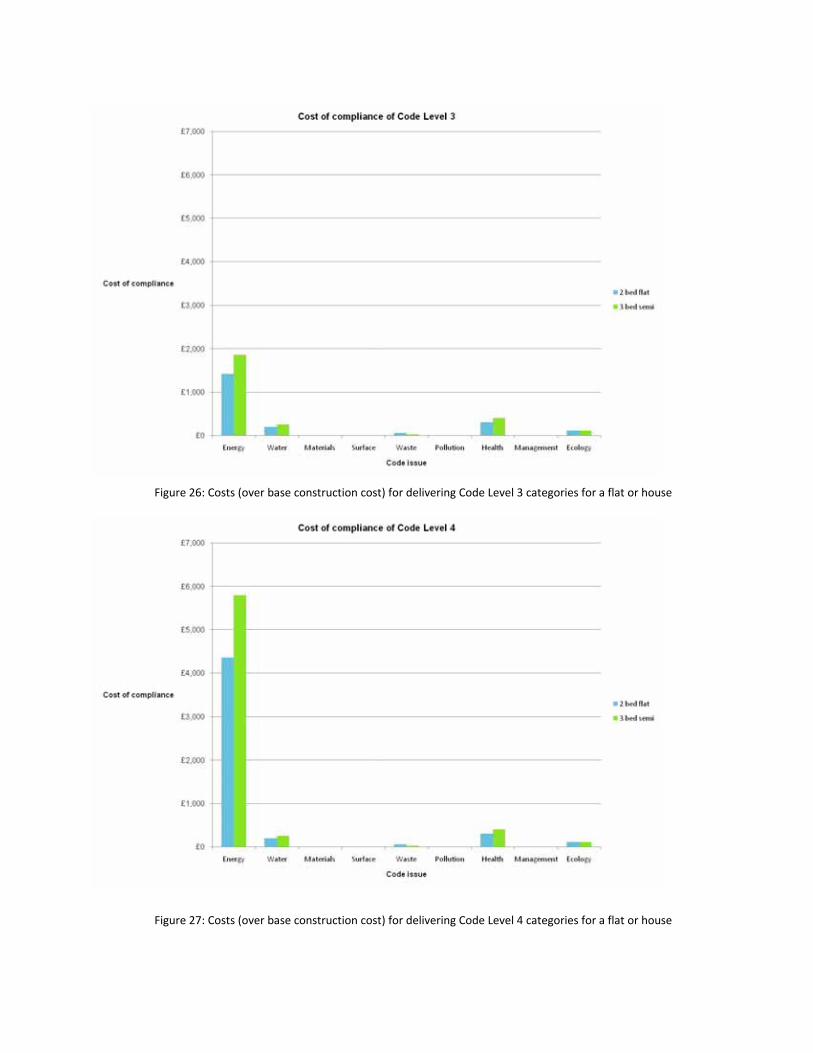
Figure 26: Costs (over base construction cost) for delivering Code Level 3 categories for a flat or house
Figure 27: Costs (over base construction cost) for delivering Code Level 4 categories for a flat or house
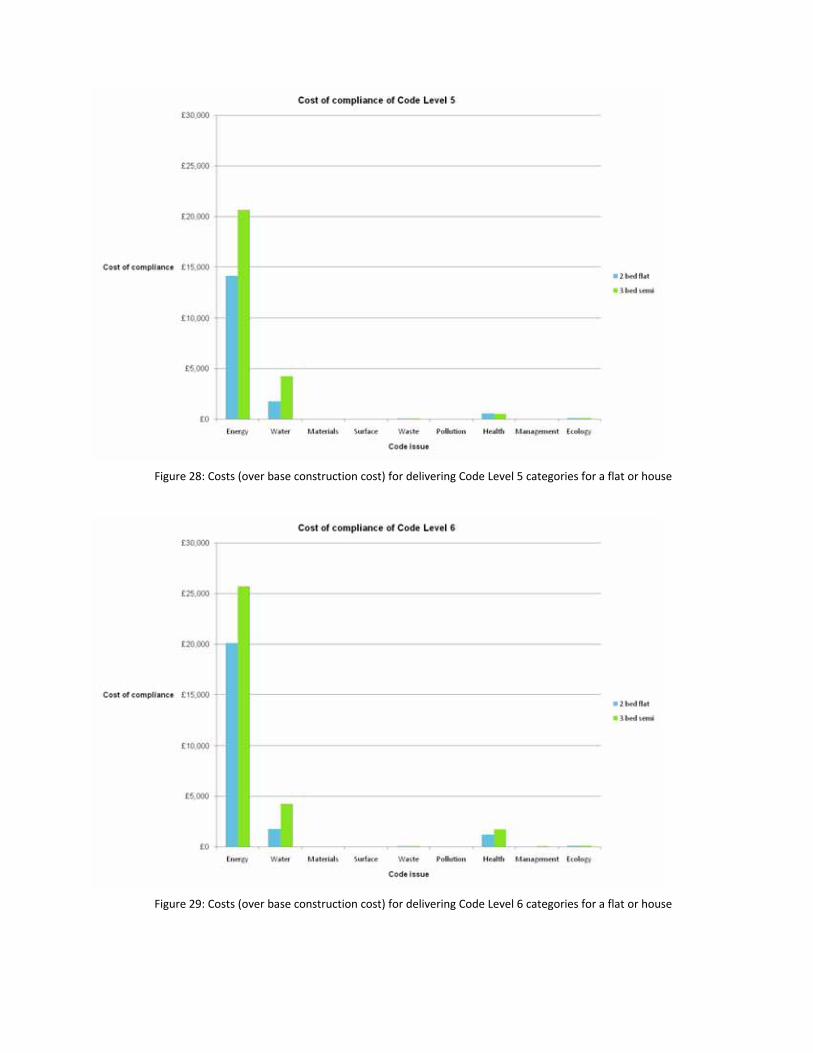
Figure 28: Costs (over base construction cost) for delivering Code Level 5 categories for a flat or house
Figure 29: Costs (over base construction cost) for delivering Code Level 6 categories for a flat or house

Figure 30: Costs associated with complying with the Code for Sustainable Homes
8.9 BREEAM
BREEAM (Building Research Establishment Environmental Assessment Method) is a voluntary assessment scheme which aims to help developers reduce the environmental impact of new non‐residential buildings. Like the Code, BREEAM allows independent assessors to appraise the environmental implications of a new building both at the design stage and post construction. This assessment can then be used to compare with other similar buildings. Therefore, it provides a consistent and independent assessment tool, which can be used in planning. An overall rating of the building’s performance is given using the terms Pass, Good, Very Good, Excellent, or Outstanding. The rating is determined from the total number of BREEAM criteria met, multiplied by their respective environmental weighting. A properly conducted BREEAM assessment can influence design – both in terms of the masterplanning process and detailed architectural, mechanical and electrical specifications.
BREEAM was initially launched in 1990 as an environmental assessment methodology aimed specifically at office buildings (BREEAM Offices). Since then BREEAM assessments have been made more flexible and capable of assessing a range of other building types, including schools, industrial, retail, healthcare, and mixed use buildings. In the latest BREEAM 2010 methodology, all of the assessment types are combined under a standard scheme which is tailored to suite the type of building being assessed. Credits are grouped in to the following categories:
Management
Health and Well Being
Energy
Transport

Water
Materials
Waste
Land Use and Ecology
Pollution
In policy terms BREEAM is useful as it provides a single assessment method which covers a number of key topics relating to sustainable construction. However it should be remembered that whilst it is the most common scheme in the UK, BREEAM is a commercial organisation (unlike the Code for Sustainable Homes) and there are alternative methods and schemes which can also be used.
Cost Implications of BREEAM Standards
While build cost estimates for BREEAM 2011 are not yet available, figures 31 and 32 show the percentage increase on the base build cost to deliver Very Good, Excellent, and Outstanding ratings under BREEAM Offices (2008). Target Zero led the costing exercise, supported by a host of private sector organisations, including AECOM.62 The same consortium of organisations has completed a similar analysis for schools63.
In order to help in the achievement of certain BREEAM standards, companies can claim both Enhanced Capital Allowances (ECA) and Carbon Trust grants to help them invest in Combined Heat and Power (CHP), renewables and other low and zero carbon technologies.
62
Target Zero (2011) Guidance on the Design and Construction of Sustainable Low Carbon Office Buildings 63 Target Zero (2011) Guidance on the Design and Construction of Sustainable Low Carbon School Buildings

Figure 31: Costs (over base construction cost) for delivering BREEAM Offices (2008) under different approaches64
The cost analysis above shows that the ‘Very Good’ level of BREEAM is achievable with minimal increase to build costs, while the costs associated with BREEAM ‘excellent’ are only slightly more. BREEAM ‘outstanding’, on the other hand, has substantial cost implications. These costs can vary significantly depending on the approach taken, with a marginal increase of 5.5% given the ‘best approach’ for offices. For schools, BREEAM costs vary depending on development context (urban versus rural). Achieving BREEAM ‘Outstanding’ schools in a greenfield development carries the heaviest costs increase of 7.2%; however, attaining lower BREEAM levels are substantially less expensive. It should also be noted that BREEAM standards are not static, and are updated over time to ensure that the higher levels are still challenging. With this in mind, planning requirements that use higher levels of BREEAM should be treated with caution.
64 Target Zero (2011) Guidance on the Design and Construction of Sustainable Low Carbon Office Buildings

Figure 32: Costs (over base construction cost) for delivering BREEAM Schools (2008) under different development contexts65
8.10 Key Considerations for Developing Local Plan Policies
This chapter considers some of the relative cost implications related to meeting the future changes to building regulations and the carbon compliance element of ‘zero carbon policy’ as well as examining opportunities for utilising strategic growth as the catalyst for developing district heating networks. It then highlighted the benefits of a broader consideration of sustainability issues and the likely cost implications of the Code for Sustainable Homes and BREEAM. A number of key considerations can be drawn from this chapter that need to be taken into account when developing local policies, including;
Work is currently being undertaken to define the proportion carbon compliance required onsite for a new development to be considered ‘zero carbon’. This includes an assessment of the relative capital costs between various technologies. It shows that although the initial capital costs of developing a strategic district heating network are likely to be slightly higher than other methods (most notable using PV) there are wider benefits of having a decentralised heating network, such as the ability to extending it into existing developed areas. Furthermore these costs may be reduced by not having a gas connection or sharing utility trenches for example. In addition, capital costs
65 Target Zero (2011) Guidance on the Design and Construction of Sustainable Low Carbon School Buildings

need to be offset against the revenue that is likely to be generated by heat sale. As such district heating networks might be an attractive option for developers of large strategic sites.
Analysis shows that there are potentially significant opportunities for developing district heat networks in the strategic growth areas of the Local Plan area. Coordination of land assembly and phasing of development will be key to assembling a viable network and as such, policy should seek to ensure that development coming provides the foundation for the network.
Energy and related carbon emissions are only one of a number of key sustainability considerations relating to built development. The Code for Sustainable Homes and BREEAM offer frameworks for rating the sustainability performance of residential and non‐domestic buildings respectively. The main cost of achieving higher levels of performance are associated with energy performance which is likely be required by Building Regulations anyway. Furthermore, as the development industry becomes more experienced at achieving these ratings it is likely that costs will go down.

Policy Recommendations and Actions for Delivery
AECOM Richmondshire Local Plan Renewable and Low Carbon Energy Study 156
9.1. Introduction
Given the analysis above of the evolving energy baseline of existing buildings, the impact of future development, the technical capacity for renewable and low carbon technologies and stakeholder views on delivery, this section presents recommendations for Local Plan policies to reduce carbon emissions associated with the built environment, focusing on:
Existing development
Opportunities from strategic growth areas
Supporting renewable energy development
Delivering wider sustainability benefits
9.2. Focus on existing development
In section 4, the assessment of the evolving energy baseline highlights that the energy demands and associated carbon emissions from existing development are significantly higher than the regional and national picture. This coupled with the propensity for larger, older and more exposed buildings associated with more rural nature of the area such as this, suggests poor energy performance and fabric efficiency. Furthermore, over the plan period, energy demands from the existing building stock will continue to far outweigh that of new development. As such, existing development should be a key priority of carbon reduction strategies.
Although the role of planning is limited in influence over existing development, the move towards localism and the NPPF, and support from the Committee on Climate Change, have highlighted the opportunities for local authorities to influence the energy performance of properties when applying for planning permission for a new extension – this is sometimes known as consequential improvements.
When owners submit an application for an extension to their building is an opportune time to encourage owners to also consider improving the energy efficiency of their buildings. It is, however, advisable to set flexible requirements to improve existing buildings when a planning application is triggered through a proposal for an extension. We recommend that information is also made available to building owners that outlines the possibilities and associated costs. Information could be outlined in an SPD or targeted brochure.
Precedent examples exist for these types of policies and supporting guidance for existing development within the Uttlesford District Council Energy Efficiency and Renewable SPD (2007). This SPD includes details of policies relating to extensions and replacement dwellings. These precedent policies are listed below:
Uttlesford Guidance 2 ‐ In relation to extensions, where a property is proposed to be extended the Council will expect cost effective energy efficiency measures to be carried out on the existing house. Applicants are asked to
9. Policy Recommendations and Actions for Delivery
AECOM Richmondshire Local Plan Renewable and Low Carbon Energy Study 157
complete and submit a home energy assessment form and are notified of energy savings measures that the Council will require as part of the conditions of granting planning permission for the extension
Uttlesford Guidance 3 ‐ In the case of replacement dwellings if the replacement is bigger than the existing house then the Council will seek an "as built" dwelling emission rate 10% lower than the target emissions rate calculated to comply with Part L1A of the Building Regulations
Uttlesford District Council has been successful in implementing these policies since adoption in 2005, which have also been well received by households. While the results stemming from this policy have never been empirically verified, by 2008 they had reportedly influenced approximately 1,400 extensions so far, and the estimated savings from measures required as a result are £72,60066 and 398tonnes of CO2 per year.
As the existing building stock is so crucial to reducing carbon emission, a similar approach to consequential improvements could be adopted in the Local Plan area. RDC Development Management officers and other officers of the Council and partner organisations can play an active role by working with building owners and developers to prompt the opportunity to retrofit carbon reduction and adaptation measures. As such, the type and level of improvements required should be set out in supporting guidance. This could either be a specific % improvement or a check list of appropriate measure. Improvements should be relative to the cost of the extension.
Great opportunities for reducing the emissions associated with existing buildings also exist outside of the planning system. The Green Deal, due for commencement late 2012 will provide a funding mechanism for householders to improve the fabric efficiency of their buildings. As highlighted above RDC’s role could be one of two ways
Provider ‐ taking the lead in delivering the Green Deal, procuring a partner to deliver the scheme and possibly raising finance. Birmingham City Council has opted for this approach, suggesting that this would best enable it to achieve objectives to create jobs, alleviate fuel poverty and improve health, while earning an income stream.
66 Based on 2008 gas prices. According to consumerfocus.org.uk the average standard gas tariff has increased by approximately 15% since 2008. As such, these savings could be as much as £10,890.
POLICY RECOMMENDATION – Consequential Improvements Planning applications for material changes to existing domestic dwellings will be required where possible and practical, to undertake reasonable improvements to the energy performance of the existing dwelling. This will be in addition to the requirements under Part L of the Building Regulations for the changes for which planning permission is sought.

AECOM Richmondshire Local Plan Renewable and Low Carbon Energy Study 158
Partner ‐ Delivery and finance of the scheme would be undertaken by a commercial partner, with the local authority helping to deliver the scheme. For example, local authorities could coordinate different Green Deal providers in their area, raise awareness amongst consumers, offer joint branding and marketing, provide information about the local housing stock, and provide access to social housing. In this regard RDC may wish to develop supporting guidance in an SPD, or targeted brochure
Many micro‐renewables now also fall under permitted development rights.RDC could also ensure that micro‐generation is delivered throughout the Local Plan area, by providing design guidance as to how technologies can be incorporated on different types of buildings. The guidance can demonstrate which technologies are most suitable for designated areas. Any guidance can also be strengthened with information on other sustainability topics such as water efficiency initiatives.
9.3. Strategic Growth Areas ‐ Developing district heating
Section 8 of this report highlights that strategic development presents opportunities for delivering decentralised energy that could bring greater benefits, such as extending district heating networks into existing areas to alleviate the risk of fuel poverty. Stimulating these opportunities and coordinating their delivery can however be difficult. Growth within the strategic growth areas of Catterick and Leyburn however presents a significant opportunity where the scale of development has the potential to deliver strategic low carbon infrastructure. As such, new development should be expected to investigate the viability and feasibility of contributing to the establishment of the network.
One of the main challenges in delivering a network is the phasing of development across multiple land owners and a long build out period. One option would be to work with key delivery partners to develop a masterplan for the strategic growth areas. This would provide clarity to the ambition and help structure development coming forward in a way that can make best use of the opportunity for a district heating
POLICY RECOMMENDATION – District Heating Networks in Strategic Growth Areas
All new development within the Strategic Growth areas of Catterick Garrison and Leyburn will be required to demonstrate reasonable endeavours will be undertaken to actively contribute towards the development of a district heating network including;
a) Establishing a new network onsite
b) Connecting to existing networks if/where available
c) Designing development to enable future connection.

AECOM Richmondshire Local Plan Renewable and Low Carbon Energy Study 159
network. In turn, this would reassure potential developers as the requirement for the site would be known. It might also be useful in attracting an ESCo to help support with the capital cost of development in return for heat sales.
Delivery Vehicles / Energy Service Companies (ESCo) ‐
Delivery vehicle models for DHNs range from fully public, through partnerships between public, private and community sectors to fully private. In general, the greater the involvement of third parties, the lower the risk to the authority, but importantly, the less control the authority will have. Whichever model is chosen, putting the delivery vehicle in place as early as possible is important. This ensures that technical and financial requirements can be understood prior to negotiations with potential customers. An ESCo, a company operating as generator, distributor, supplier and/or regulator, of an energy system is a key opportunity. An exciting opportunity is the possibility of RDC setting up a delivery vehicle for supplying heat to a network. The skills needed to do this will likely need development, but this is not an insurmountable barrier. A growing number of local authorities are engaging in similar activities in energy as well as other areas. The key to success is likely to be leadership: from senior local authority management or, at least initially, from committed individuals in planning or other departments.
For example, the Ouse Valley Energy Services Company (OVESCo), an Industrial and Provident Society for community benefit dedicated to localising energy generation in Lewes District since 2007 has ensured that local renewable projects have gained delivery traction, and its presence is a major advantage to carbon reduction delivery in Lewes District. They have achieved substantial delivery of micro‐generation in existing homes through targeted grant funding in partnership with Lewes District Council. Several other flagship projects in schools and new development also exist in the District.
Figure 33below highlights different partnership arrangements including examples of existing ESCos, and following table below highlights the relative merits of the different delivery models.
Partnership arrangements will need to be specific to the context of the ESCo. Depending on the relative roles of the partnerships various responsibilities, opportunities and relative risks need to be agreed including:
Technical issues – such as the type and scale of facility. Connection to the grid or private network;
Construction risk – who will be responsible for ensuring the construction is appropriate, build to time;
Operational risks – who will be responsible for running and maintaining the facility and network;
Future proofing – what are the long term financing plans, what are the opportunities to expand;
Funding – different funding arrangement have various requirements stipulated
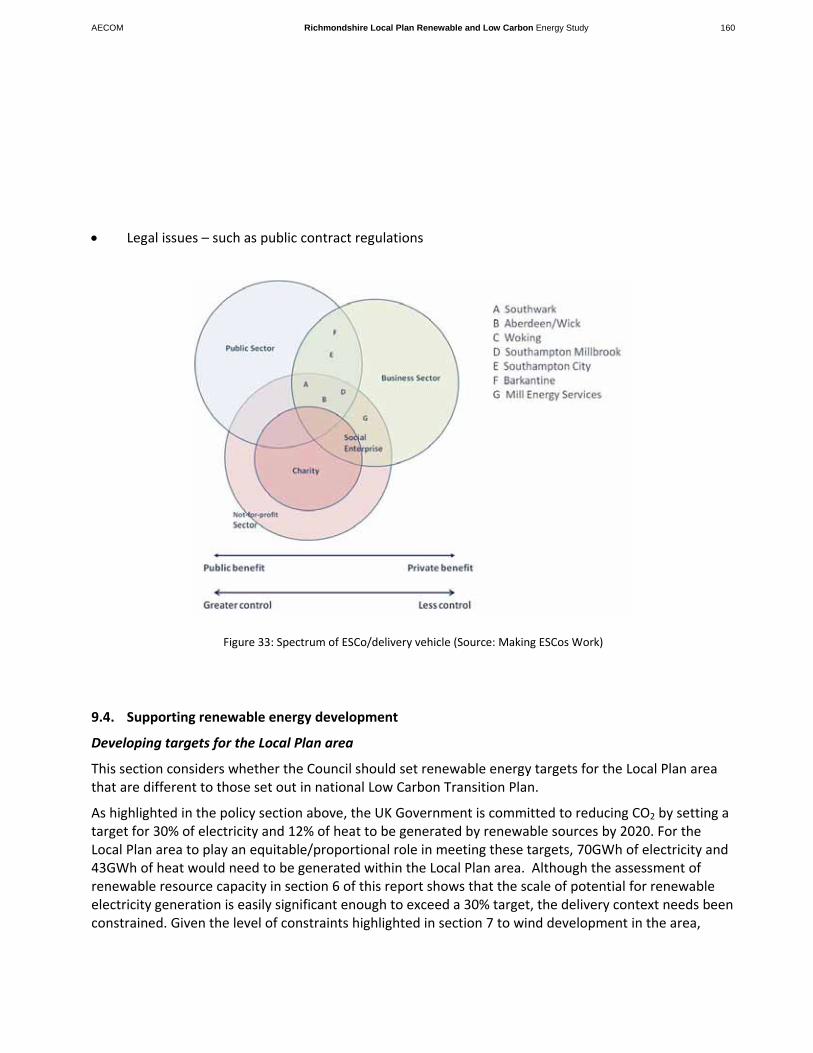
AECOM Richmondshire Local Plan Renewable and Low Carbon Energy Study 160
Legal issues – such as public contract regulations
Figure 33: Spectrum of ESCo/delivery vehicle (Source: Making ESCos Work)
9.4. Supporting renewable energy development
Developing targets for the Local Plan area
This section considers whether the Council should set renewable energy targets for the Local Plan area that are different to those set out in national Low Carbon Transition Plan.
As highlighted in the policy section above, the UK Government is committed to reducing CO2 by setting a target for 30% of electricity and 12% of heat to be generated by renewable sources by 2020. For the Local Plan area to play an equitable/proportional role in meeting these targets, 70GWh of electricity and 43GWh of heat would need to be generated within the Local Plan area. Although the assessment of renewable resource capacity in section 6 of this report shows that the scale of potential for renewable electricity generation is easily significant enough to exceed a 30% target, the delivery context needs been constrained. Given the level of constraints highlighted in section 7 to wind development in the area,
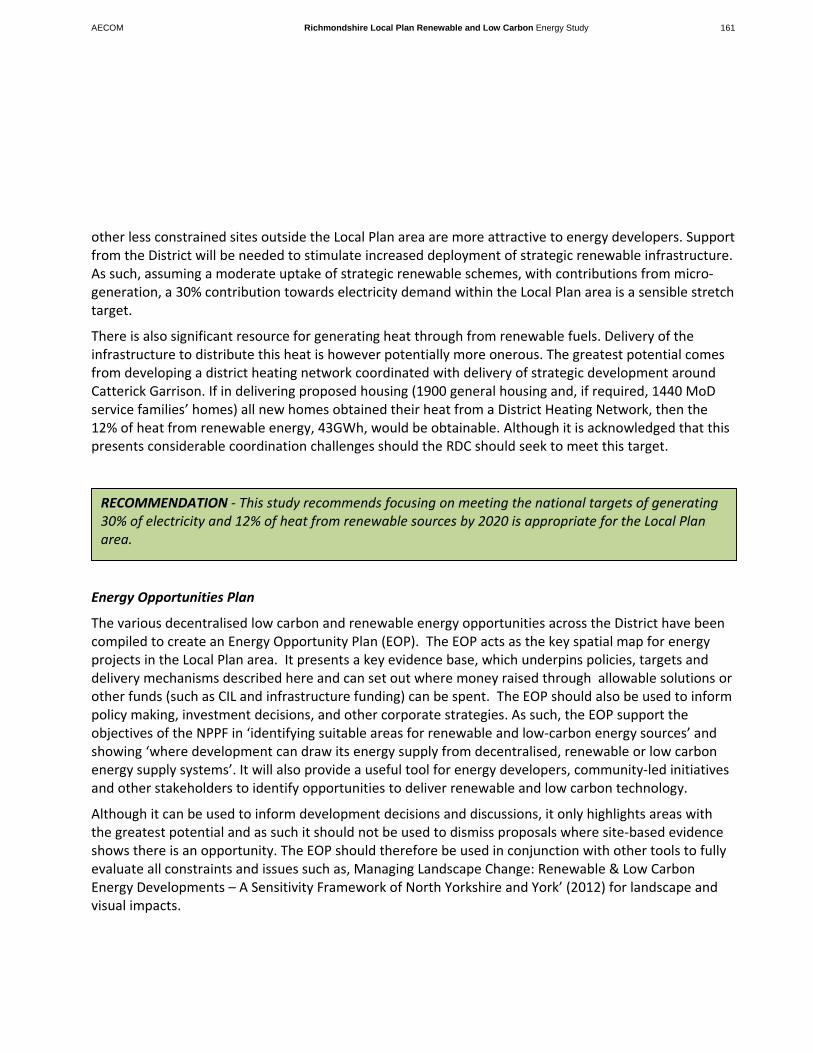
AECOM Richmondshire Local Plan Renewable and Low Carbon Energy Study 161
other less constrained sites outside the Local Plan area are more attractive to energy developers. Support from the District will be needed to stimulate increased deployment of strategic renewable infrastructure. As such, assuming a moderate uptake of strategic renewable schemes, with contributions from micro‐generation, a 30% contribution towards electricity demand within the Local Plan area is a sensible stretch target.
There is also significant resource for generating heat through from renewable fuels. Delivery of the infrastructure to distribute this heat is however potentially more onerous. The greatest potential comes from developing a district heating network coordinated with delivery of strategic development around Catterick Garrison. If in delivering proposed housing (1900 general housing and, if required, 1440 MoD service families’ homes) all new homes obtained their heat from a District Heating Network, then the 12% of heat from renewable energy, 43GWh, would be obtainable. Although it is acknowledged that this presents considerable coordination challenges should the RDC should seek to meet this target.
Energy Opportunities Plan
The various decentralised low carbon and renewable energy opportunities across the District have been compiled to create an Energy Opportunity Plan (EOP). The EOP acts as the key spatial map for energy projects in the Local Plan area. It presents a key evidence base, which underpins policies, targets and delivery mechanisms described here and can set out where money raised through allowable solutions or other funds (such as CIL and infrastructure funding) can be spent. The EOP should also be used to inform policy making, investment decisions, and other corporate strategies. As such, the EOP support the objectives of the NPPF in ‘identifying suitable areas for renewable and low‐carbon energy sources’ and showing ‘where development can draw its energy supply from decentralised, renewable or low carbon energy supply systems’. It will also provide a useful tool for energy developers, community‐led initiatives and other stakeholders to identify opportunities to deliver renewable and low carbon technology.
Although it can be used to inform development decisions and discussions, it only highlights areas with the greatest potential and as such it should not be used to dismiss proposals where site‐based evidence shows there is an opportunity. The EOP should therefore be used in conjunction with other tools to fully evaluate all constraints and issues such as, Managing Landscape Change: Renewable & Low Carbon Energy Developments – A Sensitivity Framework of North Yorkshire and York’ (2012) for landscape and visual impacts.
RECOMMENDATION ‐ This study recommends focusing on meeting the national targets of generating 30% of electricity and 12% of heat from renewable sources by 2020 is appropriate for the Local Plan area.

AECOM Richmondshire Local Plan Renewable and Low Carbon Energy Study 162
9.5. Delivering wider sustainability benefits
The Local Plan area will be affected by climate change, with increased flood risk, possible heat waves, changes in the landscape as well as changes in habitats and species composition, habitat fragmentation and changes in soils, recreation and tourism and cultural heritage. This means that actions must not only be taken to reduce the impacts of climate change by reducing CO2 emissions, but also to adapt proposed development to the effects of climate change and other environmental damage.
The Code for Sustainable Homes is the voluntary Government‐backed building assessment tool that covers a full range of sustainability issues including, but not restricted to, energy and CO2 emissions. Similarly, BREEAM, although not a nationally approved standard, offers an independent rating system for non‐domestic buildings.
The analysis in Section 8 shows that the stretch for achieving Code level 4 (particularly for non energy related credits) is limited and should be within the viability testing for new development as highlighted by the RDC Economic Viability Study Final Report (2011). Similarly the uplift to BREEAM Very Good is not significantly onerous, and as such, developments in the Local Plan area should be seeking these minimum sustainability benchmarks. The credits in these rating systems need to be interrogated to ensure they further RDC planning policy, and compliance with the rating systems should not be used to replace wider planning objectives.
POLICY RECOMMENDATION ‐ Delivering the Energy Opportunities Plan
The Local Planning Authority will support and encourage the generation of renewable and low carbon energy that:
e) responds positively to the opportunities identified in the ‘Richmondshire Local Renewable and Low Carbon Energy Capacity Study’ (2012) and the study's Energy Opportunities Plan;
f) demonstrates that there will be no significant adverse effects on visual receptors or landscape character (particularly in relation to cumulative impacts or impacts in the National Parks arsing from intervisibility) in accordance with the framework set out in ‘Managing Landscape Change: Renewable & Low Carbon Energy Developments – A Sensitivity Framework of North Yorkshire and York’ (2012);
g) accords with the rest of the Local Plan Core Strategy; and
h) demonstrates benefits for local communities

AECOM Richmondshire Local Plan Renewable and Low Carbon Energy Study 163
9.6. Monitoring
Key to delivering an effective area‐based low carbon and renewable energy strategy is ensuring that a record of renewable installations is kept up‐to‐date. Information contained within this report captures Richmondshire’s Local Plan area current and projected installed base of renewables. However, this should only be viewed as a portrait –circumstances are likely to change over time. For this reason, it will be important to continually update the renewable energy database, which accounts for planning applications – approvals and refusals – as well as opportunities, and constraints as they arise.
Although the National Indicators have been abolished, similar information will need to be regularly collated to understand how effectively the policies are being delivered. This is also an opportunity to update and/or create a set of locally specific indicators for transitioning to a low carbon economy that can feed into future Annual Monitoring Reports (AMR) for the Local Plan.
Monitoring should be directly related to the planning approach and policy recommendations outlined above and will require close liaison and feedback from Development Management officers:
Existing development – This study provides a baseline of the energy demands and carbon emissions from existing buildings. Understanding the activities that have been undertaken and where through the influence of publically sponsored initiatives, such as through the Green Deal or SPD guidance, should be recorded.
New Development – As the standard assessment procedure (SAP) for Building Regulations will be used to outline carbon reductions it will be possible to monitor the relative carbon reductions of new development. Furthermore, the pre assessment and post build validation of Code for Sustainable Homes / BREEAM will guide the monitoring of wider sustainability objectives.
Priority Areas for District Heating – It will important to keep an up to date and accurate picture of where district heating infrastructure has been delivered. Records of delivered district heating schemes should be kept centrally in GIS where possible to understand the delivery opportunities and constraints of
POLICY RECOMMENDATION – Wider Sustainability Measures
i. All new residential development will be expected to meet Code for Sustainable Homes Level 4, and
ii. All new residential development of 10 dwellings or more and non‐residential development of 1000m2 will be
expected to submit an energy statement that shows consideration of opportunities to deliver carbon savings in
excess of Building Regulation requirements and to demonstrate that carbon savings have been maximised by
incorporating these opportunities into design. Where greater carbon savings could be achieved through
coordination and linking of infrastructure with neighbouring sites, this should be applied and demonstrated.
iii. All new non‐residential development will be expected to meet BREEAM very good.
AECOM Richmondshire Local Plan Renewable and Low Carbon Energy Study 164
schemes proposed in priority areas. The Council should also monitor the proportion of carbon saving delivered through low carbon heat as a sub‐set of total carbon savings.
Renewable Energy Developments – The Council should continue to monitor the delivery of renewable and low carbon infrastructure. In addition to monitoring successful planning applications, where applications have been lodged but rejected, these should also be recorded along with the reasons for rejection within a central database. Smaller permitted development will be harder to record, however regular reviews of the FiT database67. Furthermore, LGYH are funding use of the CPlan Tool, which could be used by RDC to keep an up‐to‐date record of current and projected installations.
Allowable solutions – Relating to the ability to deliver carbon savings on site will be the expectation of payment into allowable solutions. RDC should develop a list of local projects / initiatives to be delivered through allowable solutions, such as supporting the DHN at Catterick Garrison (see section 8). It will be important to monitor the cost of carbon (if it chosen locally), how much is paid into the allowable solutions pot and the cost per carbon saving of the initiatives delivered (note that this may be incremental as the activity may have no initial benefit but unlock future viability).
Total Renewable Energy Delivery – understanding the improvements to the existing building stock, the efficiency of new development and the contribution of more strategic and community led infrastructure, RDC should be able to monitor their overall contribution to reducing carbon emissions from electricity and heating through use of renewable energy. This should be related back to the total energy and carbon profile developed in this study to calculate % reductions.
67 https://www.renewablesandchp.ofgem.gov.uk/Public/ReportManager.aspx?ReportVisibility=1&ReportCategory=0

Appendix 1


The table below lists the key existing buildings common across the three areas in Catterick Garrison. These buildings represent potential buildings to connect to a heating network, and have been included in the Catterick Garrison scenario modelling.
List of key existing buildings by total heat demand
Ref Name Annual heat demand (MWh)
Source Notes
Colburn Leisure Centre 270 National Heat
map
Energy data should be verified with
actual site consumption.
2 Colburn Community Primary
School 126
National Heat map
Energy data should be verified with
actual site consumption.
3 Risedale community college 3,968 National Heat
map
Energy data should be verified with
actual site consumption.
4 Darlington College, Catterick
site 274
National Heat map
Energy data should be verified with
actual site consumption.
5 Oak Tree, sheltered housing 298
Richmondshire asset list, Gas,
Transco AQ kWh converted to
MWh
Calculated from Transco AQ kWh (gas) converted to
MWh (heat). Compared to
Financial data based on 3.260p/kWh gas
6 Gaza Barracks 3,500
Based on approx number of
accommodation units
approx 10 accommodation
blocks with assumed 100 units / block
7 Catterick Garrison Leisure Centre with Swimming Pool
5,237 Based on
estimated floor area from aerial
Using TM46 benchmarks for Swimming Pool
Appendix 1: Existing buildings in Catterick Garrison Scenario
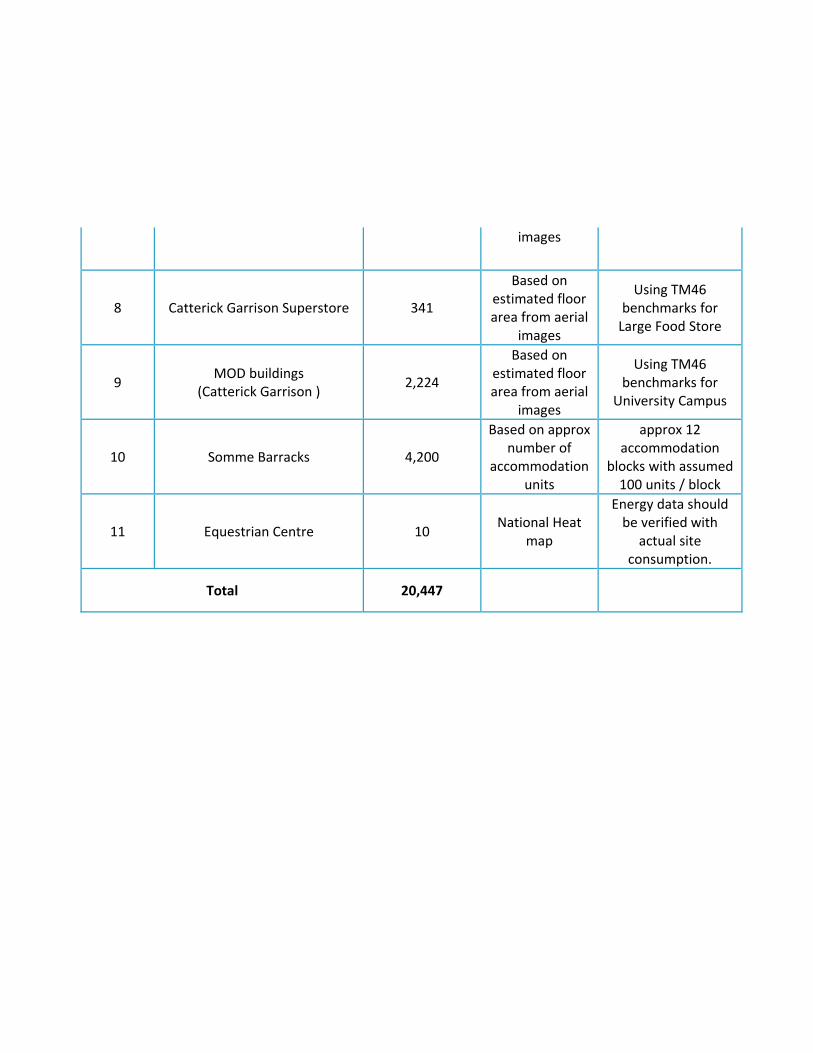
images
8 Catterick Garrison Superstore 341
Based on estimated floor area from aerial
images
Using TM46 benchmarks for Large Food Store
9 MOD buildings
(Catterick Garrison ) 2,224
Based on estimated floor area from aerial
images
Using TM46 benchmarks for
University Campus
10 Somme Barracks 4,200
Based on approx number of
accommodation units
approx 12 accommodation
blocks with assumed 100 units / block
11 Equestrian Centre 10 National Heat
map
Energy data should be verified with
actual site consumption.
Total 20,447