Embed Size (px)
DESCRIPTION
In 2011, Designs for Learning conducted the first experimental study of an iPad learning app. The study, which received a “Top Paper” award from Meaningful Play, found that playing Motion Math 20 minutes a day for five days improved students’ fractions knowledge and attitudes significantly in comparison with a control group.
Citation preview
Article
Results From aControlled Study ofthe iPad FractionsGame Motion Math
Michelle M. Riconscente1,2
AbstractAlthough fractions knowledge is essential for future success in mathematics, datashow that most U.S. students fail to become proficient in fractions. With the adventof mobile technologies such as iPad tablets, new kinds of interactions with subjectmatter have become possible that have potential for improving learning. The presentstudy used an experimental repeated measures crossover design to investigatewhether the iPad fractions game Motion Math would improve fourth graders’fractions knowledge and attitudes. In results from 122 participants, students’fractions test scores improved an average of over 15% after playing Motion Math for20 min daily over a 5-day period, representing a significant increase compared to acontrol group. In addition, children’s self-efficacy for fractions, as well as their likingof fractions, each improved an average of 10%, representing a statistically significantincrease compared to a control group. Implications for the design and study of inter-active games are discussed.
Keywordseducational technology, fractions, app, experimental design
1 Rossier School of Education, University of Southern California, Los Angeles, CA, USA2 New York Hall of Science, Queens, NY, USA
Corresponding Author:
Michelle M. Riconscente, Sara Lee Schupf Center for Play, Science and Technology Learning, New York
Hall of Science, 47-01 111th Street Queens, NY 11368, USA.
Email: [email protected]
Games and Culture8(4) 186-214
ª The Author(s) 2013Reprints and permission:
sagepub.com/journalsPermissions.navDOI: 10.1177/1555412013496894
gac.sagepub.com
*
CURRENT CONTACT INFO Michelle M. Riconscente, PhD
CEO, Designs for Learning, Inc. [email protected]
*
The topic of fractions has long been a challenging one for children (Hiebert, 1985;
Newton, 2008; Wu, 2010). Research by the National Center for Educational Statis-
tics shows that only 13% of U.S. fifth graders are proficient in fractions (Princiotta,
Flanagan, & Germino Hausken, 2006). Even though the topic of fractions appears
early in children’s mathematics trajectory, success or failure at this juncture carries
long-term consequences. The extent to which students master fractions is a strong
predictor of later mathematical success, particularly in algebra, which serves a
‘‘gatekeeper’’ role for access to higher education (U.S. Department of Education,
1997).
It is in this context that instructional designers are increasingly turning to new
technologies and creating learning experiences that leverage the unique interactive
features of devices such as the iPad. Although hundreds of iPad apps on the market
claim to improve learning, no published studies were found of controlled experi-
ments that tested the effectiveness of an educational iPad app for increasing learning
outcomes. This report describes a controlled study of the iPad app Motion Math, a
game aimed at improving students’ ability to relate various fraction representations
to the number line. The developers of the game believe that by gaining skill at this
central aspect of number sense, students will develop a better understanding of
fractions that will transfer to improved performance on the kinds of questions posed
on state and national standardized tests. Although little research has examined the
relation between learning and iPad interactions, from a learning science perspective,
there are several reasons to expect that the experience of playing Motion Math could
foster learning. In the game, which relies on the ‘‘tilt’’ feature of the iPad, the player
is continuously presented with fractions problems to solve, instant feedback,
rewards, and increasing levels of challenge. The question is whether this combina-
tion of experiences does more than help players get better at the game itself. The
present study sought to determine whether the game increased children’s fractions
knowledge, improved their attitudes toward fractions, and was perceived as fun and
helpful by participants.
Review of the Literature
In the United States, most students are initially introduced to fractions in the second
or third grade. By fifth grade, they are learning how to perform arithmetic operations
such as addition and subtraction with fractions. However, the instructional
approaches engaged in most classrooms are not proving effective for the vast major-
ity of students. Research shows that classroom instruction tends to focus on fractions
concretely as ‘‘parts of a whole’’ (Misquitta, 2011). This instruction tends to gener-
ate an inaccurate conceptualization which subsequently becomes an obstacle to
students’ abstract reasoning about fractions. For instance, it is difficult for students
to reconcile the part-whole model with the fact that fractions are continuous and infi-
nitely divisible (Behr, Lesh, Post, & Silver, 1983; Hiebert & Tonnessen, 1978).
Moreover, students’ prior knowledge of whole numbers has been theorized to lead
Riconscente 187
to misinterpretations of the representational form of numerator over denominator,
which students often understand simply as two whole numbers (Gallistel & Gelman,
1992).
The model for introduction currently in most of our textbooks is that of regions (square,
circle, and line). This enables us to talk of shares, but the result is a tangible amount
(slice of pizza, cube of chocolate) which does not neatly fit within the operations of
addition, subtraction, multiplication, and division. How can you multiply two pieces
of pizza? (Hart, 2000, pp. 53–54)
Understanding fractions abstractly means recognizing that fractions are numbers,
and as such they can be placed on a number line. Yet, most children fail to develop
this knowledge (National Mathematics Advisory Panel, 2008; Siegler, Thompson, &
Schneider, 2011a, 2011b), as can be seen in their reliance on procedural knowledge
rather than on conceptual understanding when solving problems with fractions
(Wong & Evans, 2007).
Case and colleagues have suggested that the mental number line is essential to early
numerical understanding (Case & Griffin, 1990; Case & Okamoto, 1996). Siegler and
Ramani (2009) theorized that the mental number line facilitates arithmetic problem
solving by providing a ‘‘retrieval structure that improves encoding, storage, and retrie-
val of numerical information by organizing the information around the numbers’ mag-
nitudes’’ (p. 555). Likewise, renownedmathematicianWu has published widely on the
value of teaching children the relation between fractions and the number line:
[T]he use of the number line has the immediate advantage of conferring coherence on the
study of numbers in school mathematics: decimals are rightfully restored as fractions of a
special kind, and positive and negative fractions all become points on the number line. In
particular, whole numbers are now points on the number line too and the arithmetic of
whole numbers, in this new setting, is now seen to be entirely analogous to the
arithmetic of fractions. ( . . . ) It must be said that this coherence has been largely absent
from school mathematics for a long time. (Wu, 2008, p. 4; emphasis original)
In a recent report to the U.S. Department of Education’s Institute of Education
Sciences, Siegler and colleagues (2010) reviewed the available research on fractions
teaching and learning. Among the five recommendations they forwarded for effective
fractions instruction is the suggestion to ‘‘[h]elp students recognize that fractions are
numbers and that they expand the number system beyond whole numbers. Use number
lines as a central representational tool in teaching this and other fraction concepts from
the early grades onward’’ (p. 19). The same report emphasizes that there is a dearth of
rigorous experimental studies that examine the effectiveness of specific approaches to
fractions instruction. With postsecondary success so closely bound to early mathe-
matics achievement, identifying research-based ways to support students’ fractions
learning is of highest priority (U.S. Department of Education, 1997; Wu, 2008).
188 Games and Culture 8(4)
Importantly, children’s struggles with understanding fractions often go hand in
hand with low motivation and negative attitudes toward mathematics (Ashcraft,
2002; Stipek et al., 1998). Numerous studies of students’ motivation have shown that
low self-efficacy—that is, lack of confidence in one’s ability to successfully
complete academic tasks—is associated with lower achievement (Bandura, 1997;
Pajares, 1996). Research also documents the importance of expectations for success
and valuing of academic tasks for increased persistence (Wigfield & Eccles, 2000).
Moreover, children are more likely to develop long-term interest in material that
they understand and see as relevant (Hidi & Renninger, 2006; Riconscente, 2010).
It is thus reasonable to conclude that comprehensively addressing the fractions crisis
will require approaches that improve students’ fractions knowledge while simulta-
neously transforming negative attitudes into positive ones.
Successfully integrating learning with motivation is a long-standing hallmark of
computer game design. In computer games, players are constantly challenged by
increasingly difficult obstacles they must overcome to attain a goal. The kinds of
obstacles they face are new, even counterintuitive, and players must discover the
rules of play in order to win. Good games will ‘‘ramp’’ up the challenge, by adding
new rules and constraints that must be figured out and surpassed. Failure is accepted
as a natural part of game play. In contrast to most academic settings, where failure is
rarely met with increased enthusiasm, games are designed such that failure and chal-
lenge strengthen motivation.
The last decade has seen an exponential surge in the creation of educational
games to address learning challenges in a variety of domains (Habgood & Ains-
worth, 2011). The theory and study of educational games is increasingly taking cen-
ter stage at academic conferences, and several journals dedicated to games and
learning have sprung up. Features of new technologies, especially mobile devices
such as the iPad and iPhone, offer instructional designers more options for creating
effective learning experiences that move beyond static presentation, limited interac-
tion, and the walls and schedules of formal schooling. For example, the multipoint
touch-sensitive iPad display can be ‘‘pinched’’ to zoom in or out on an image. The
iPad also detects when it is being moved or tilted, and through Global Positioning
System (GPS) data knows its position on the Earth.
Some researchers have leveraged the capability of these new technologies to
create embodied learning experiences. This approach is grounded in the insight that
‘‘cognitive processes are deeply rooted in the body’s interactions with the world’’
(Wilson, 2002). In other words, rather than residing entirely in one central
location—the brain—many cognitive scientists are now exploring the ways that
knowledge is rooted in our physical interactions with the world (Clark, 1999;
Wilson, 2002). Recent studies have examined embodied cognition in relation to
mathematics. For example, Alibali and Nathan (2011) found that teachers’ and stu-
dents’ gestures were valid evidence of their mathematical understanding.
Scholars have begun to apply the theory of embodied cognition to create
embodied learning experiences. For example, Ramani and Siegler (2008) showed
Riconscente 189
that preschoolers gained mathematical knowledge by playing board games. They
theorized that opportunities to physically interact with a number line by moving
tokens along linear board games helped children to develop a mental number line by
offering tangible clues about the order and magnitude of numbers. Large-scale virtual
embodied installations have also been shown to significantly increase students’ under-
standing of such topics as chemical titration (Tolentino et al., 2009) and geoscience
(Johnson-Glenberg, Birchfield, Savvides, & Megowan-Romanowicz, 2010).
As promising as these new technologies are, educational games remain challenged
by a tension between entertainment and learning. Habgood and Ainsworth (2011) sug-
gest that successful educational games are those that establish an intrinsic link between
a core game mechanic and the target learning content. In other words, the game play
itself engages the player with the content (Malone & Lepper, 1987). This design
perspective stands in contrast to many edutainment titles, in which the educational
content is artificially injected into game play—as, for instance, when the player must
solve a math problem to pass through doors in a castle. Unfortunately, this extrinsic
approach to game design is still prevalent. A recent search yielded 115 apps and games
developed for the iPad that purport to teach fractions. Upon closer examination, how-
ever, many of these ‘‘games’’ are better characterized as math quizzes; others contain
explicit instruction, however nearly always the instruction and the game (quiz) are
isolated from one another. Importantly, although one unpublished study was found
on an iPod literacy game for young children, to date there has been no experimental
research to ascertain whether these apps promote children’s learning of mathematics.
To extend the literature reviewed here, the present study used a controlled experi-
mental design to test whether the mobile learning game Motion Math improves chil-
dren’s fractions knowledge and attitudes. The most common use of the game is by
individuals on their own without the assistance of parents or teachers. Therefore,
rather than compare Motion Math to other apps or to classroom instruction, this
study focused on whether or not Motion Math achieves its goals as a learning app.
In other words, when young people play Motion Math, do they get better at fractions
and come away with more positive attitudes toward fractions?
About Motion Math
Motion Math was designed to help children strengthen their understanding of the
relationship between fractions, proportions, and percentages to the number line. The
game plays on iPad, iPhone, and iPod devices, leveraging the ‘‘accelerometer’’ fea-
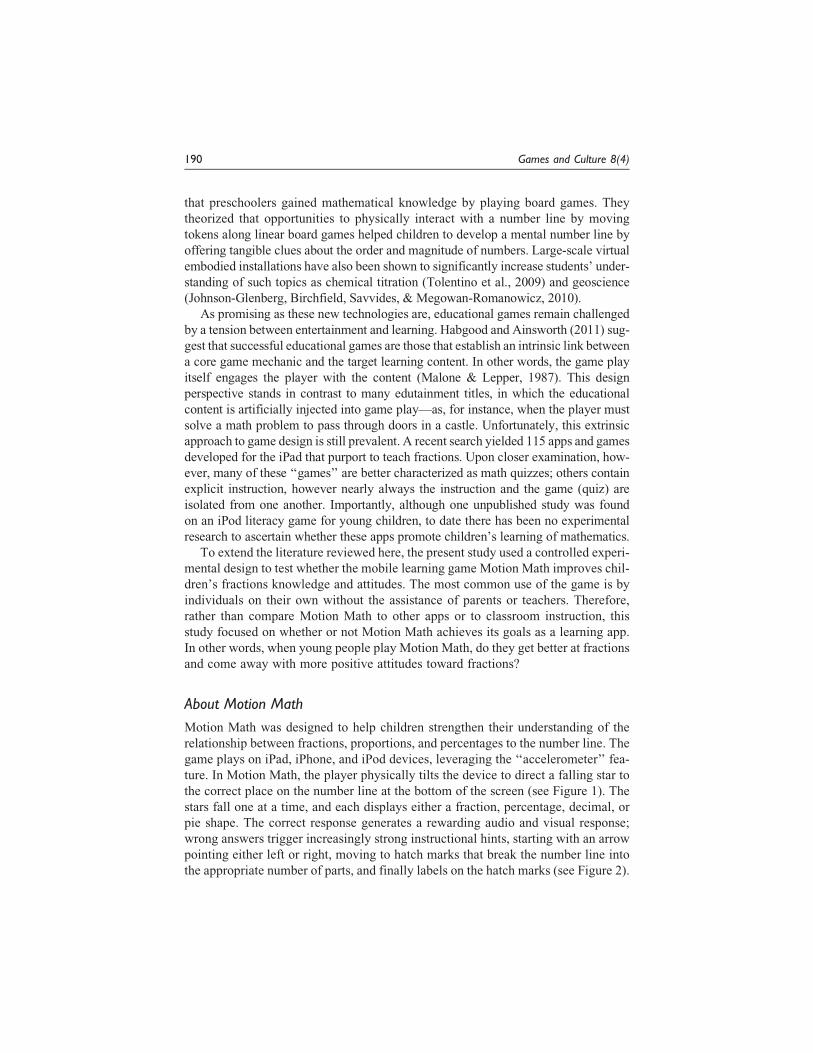
ture. In Motion Math, the player physically tilts the device to direct a falling star to
the correct place on the number line at the bottom of the screen (see Figure 1). The
stars fall one at a time, and each displays either a fraction, percentage, decimal, or
pie shape. The correct response generates a rewarding audio and visual response;
wrong answers trigger increasingly strong instructional hints, starting with an arrow
pointing either left or right, moving to hatch marks that break the number line into
the appropriate number of parts, and finally labels on the hatch marks (see Figure 2).
190 Games and Culture 8(4)
The game has three levels of difficulty, from beginner to hard, and each game dif-
ficulty mode consists of 24 increasingly challenging levels. Levels are generated
according to an algorithm that increases the range of the denominator and changes the
range of the number line. The visual and symbolic representations of the fractions also
vary, and during more challenging game play representations are mixed together
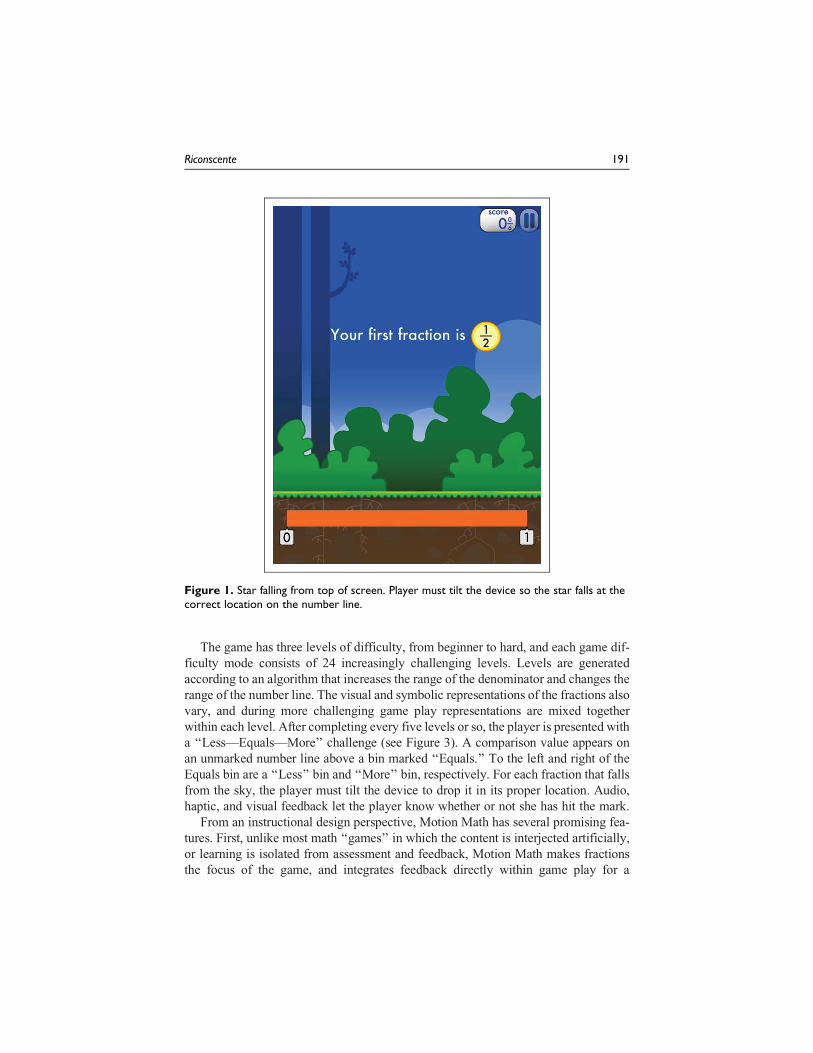
within each level. After completing every five levels or so, the player is presented with
a ‘‘Less—Equals—More’’ challenge (see Figure 3). A comparison value appears on
an unmarked number line above a bin marked ‘‘Equals.’’ To the left and right of the
Equals bin are a ‘‘Less’’ bin and ‘‘More’’ bin, respectively. For each fraction that falls
from the sky, the player must tilt the device to drop it in its proper location. Audio,
haptic, and visual feedback let the player know whether or not she has hit the mark.
From an instructional design perspective, Motion Math has several promising fea-
tures. First, unlike most math ‘‘games’’ in which the content is interjected artificially,
or learning is isolated from assessment and feedback, Motion Math makes fractions
the focus of the game, and integrates feedback directly within game play for a
Figure 1. Star falling from top of screen. Player must tilt the device so the star falls at thecorrect location on the number line.
Riconscente 191

continuous interactive experience. The visual interface, tone, and game mechanics
were also designed to promote players’ positive attitudes toward fractions. In addition,
the game is an embodied learning experience in that physical action is tied directly to
the target learning objectives.
Motion Math assumes a baseline of prior fractions knowledge. Specifically, the
player must already have a basic understanding of the fraction representational form.
In other words, Motion Math was not created with the goal of introducing the player
to fractions. Rather, it focuses on developing and strengthening a player’s under-
standing of how fractions are related to the number line. The expectation is that
by fostering children’s understanding of the relation between fractions and the num-
ber line, the game will lead to a better understanding of fractions, which in turn will
transfer to fractions knowledge more generally.
Study Design and Hypotheses
On the basis of the literature review, the purpose of this study was to ascertain
whether Motion Math increases learners’ fractions knowledge and attitudes. There
Figure 2. Wrong answers trigger increasingly explicit hints. This screen shows the last hintthe player receives before losing the level.
192 Games and Culture 8(4)
were several reasons to expect that playing Motion Math would lead to these
increases. Specifically, Motion Math utilizes the number line, which research and
theory indicate as key to conceptual understanding of fractions. Second, the game
mechanics are well designed to support instruction. For instance, players encounter
a very high number of problems in a relatively short time span, thus offering many
opportunities for practice. Third, the time factor could be expected to create a sense
of urgency around the problems, providing the player with a compelling need to
develop relevant schema. Finally, research shows that embodied learning experi-
ences promote learning and engagement.
The purpose of the study was intentionally chosen over other possible purposes
for several reasons. First, Motion Math was not designed to replace classroom
instruction by a teacher, and therefore it would not have been appropriate to compare
the game to classroom instruction. Second, comparing Motion Math to another frac-
tions app would only enable conclusions relative to that one specific app, not to frac-
tions apps more generally. At the time of this study, no apps were available that were
Figure 3. In Less—Equals—More levels, players must drop the falling fractions object intoone of the three zones in relation to a comparison value.
Riconscente 193
sufficiently aligned with the same goals as Motion Math to represent an appropriate
and valuable comparison point. Third, given the dearth of extant research on iPad
games, and fractions games in general, a fundamental question was whether the app
indeed attains its goal of helping players understand fractions better.
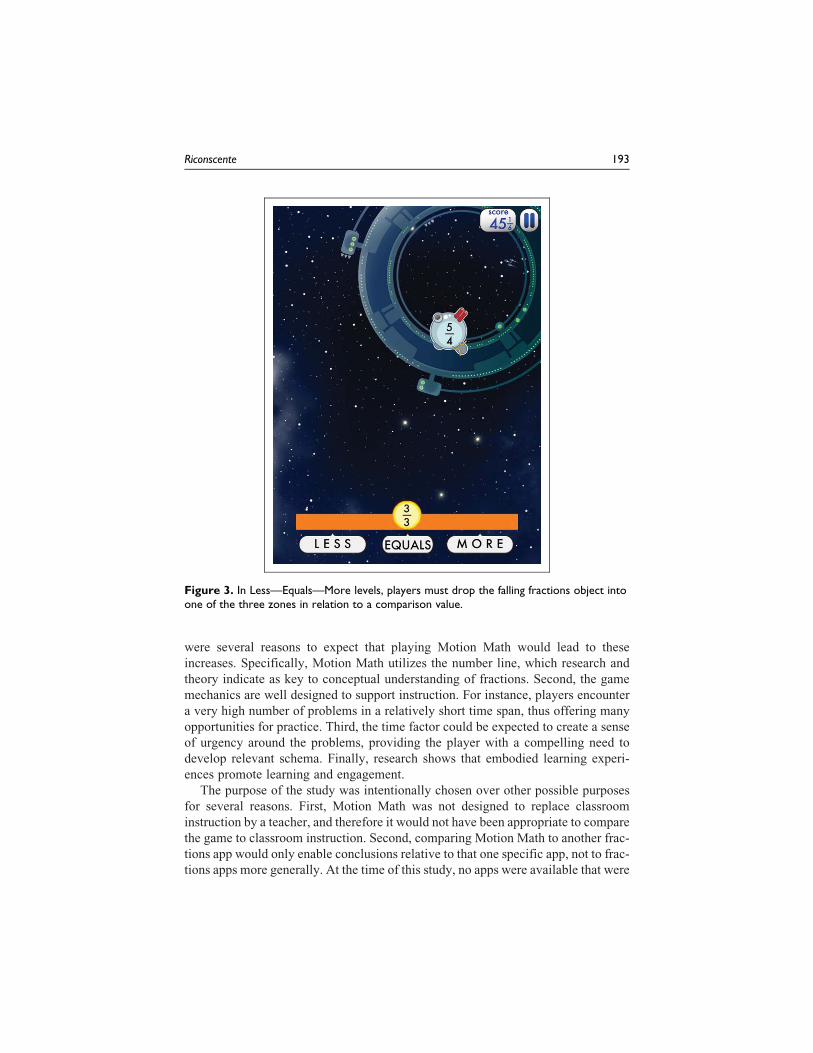
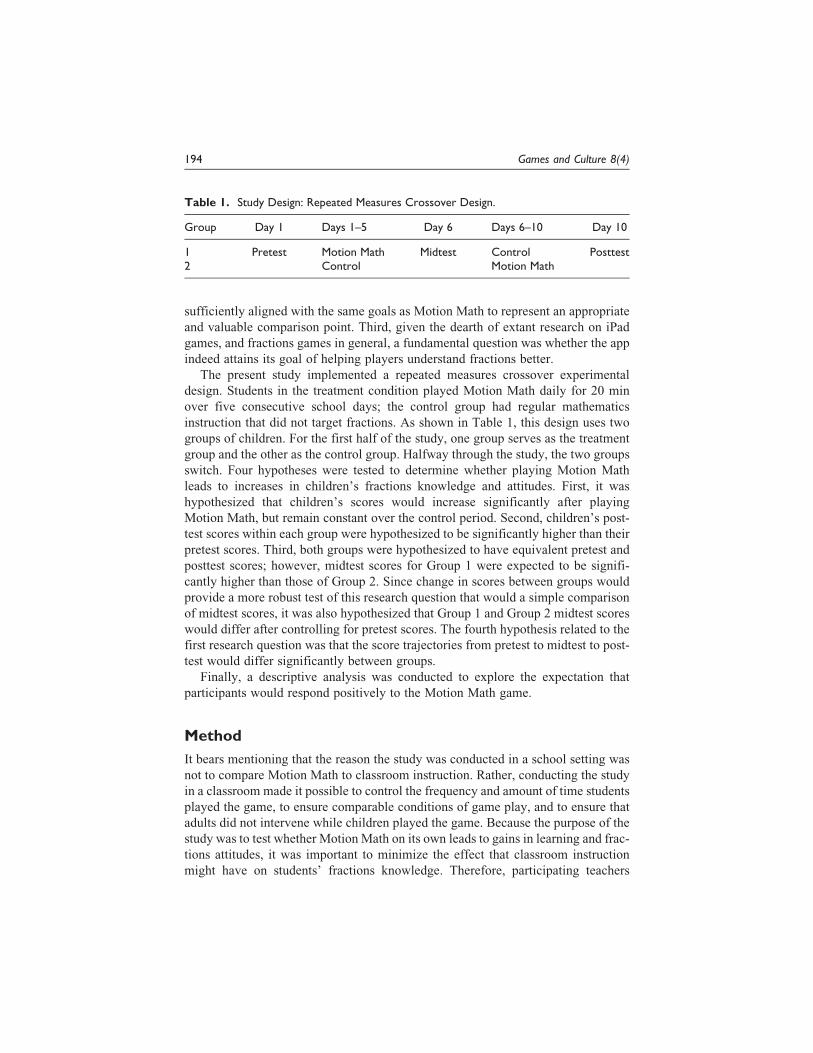
The present study implemented a repeated measures crossover experimental
design. Students in the treatment condition played Motion Math daily for 20 min
over five consecutive school days; the control group had regular mathematics
instruction that did not target fractions. As shown in Table 1, this design uses two
groups of children. For the first half of the study, one group serves as the treatment
group and the other as the control group. Halfway through the study, the two groups
switch. Four hypotheses were tested to determine whether playing Motion Math
leads to increases in children’s fractions knowledge and attitudes. First, it was
hypothesized that children’s scores would increase significantly after playing
Motion Math, but remain constant over the control period. Second, children’s post-
test scores within each group were hypothesized to be significantly higher than their
pretest scores. Third, both groups were hypothesized to have equivalent pretest and
posttest scores; however, midtest scores for Group 1 were expected to be signifi-
cantly higher than those of Group 2. Since change in scores between groups would
provide a more robust test of this research question that would a simple comparison
of midtest scores, it was also hypothesized that Group 1 and Group 2 midtest scores
would differ after controlling for pretest scores. The fourth hypothesis related to the
first research question was that the score trajectories from pretest to midtest to post-
test would differ significantly between groups.
Finally, a descriptive analysis was conducted to explore the expectation that
participants would respond positively to the Motion Math game.
Method
It bears mentioning that the reason the study was conducted in a school setting was
not to compare Motion Math to classroom instruction. Rather, conducting the study
in a classroom made it possible to control the frequency and amount of time students
played the game, to ensure comparable conditions of game play, and to ensure that
adults did not intervene while children played the game. Because the purpose of the
study was to test whether Motion Math on its own leads to gains in learning and frac-
tions attitudes, it was important to minimize the effect that classroom instruction
might have on students’ fractions knowledge. Therefore, participating teachers
Table 1. Study Design: Repeated Measures Crossover Design.
Group Day 1 Days 1–5 Day 6 Days 6–10 Day 10
1 Pretest Motion Math Midtest Control Posttest2 Control Motion Math
194 Games and Culture 8(4)
agreed to refrain from teaching fractions to participating students for the duration of
the study.
Participants
Participants were 122 fifth graders enrolled in two schools in southern California.
School A serves two equally sized classes of fifth graders and School B has 5
fifth-grade classes. At each school, students were randomly assigned to classes.
School A is an urban public school serving primarily Latino students from low-
income homes; School B is a public elementary school serving mostly Caucasian
and Latino students. All students at School A have the same math teacher whereas
the two classes of students who participated from School B are taught by different
math teachers. Students had all received fractions instruction in fourth grade. During
the study, which took place at the start of the 2011–2012 school year, the teachers
refrained from covering fractions in their mathematics classes. A summary of the
two school sites is presented in Table 2. The majority of participants (84%)
completed all three measures. Twenty children were absent on at least 1 day of test-
ing and were dropped from the analysis due to incomplete data. Seven of these
participants were from School A and 13 were from School B.
Study Measures
Fractions Knowledge. To assess fractions knowledge, a fractions test was created basedon released items targeting fractions and number sense from the California Stan-
dards Test, the National Assessment of Educational Progress (NAEP), and Trends
in International Mathematics and Science Study. Items were created to test chil-
dren’s abilities to solve problems that ranged from very similar to very different
from the kinds of problems posed in Motion Math.
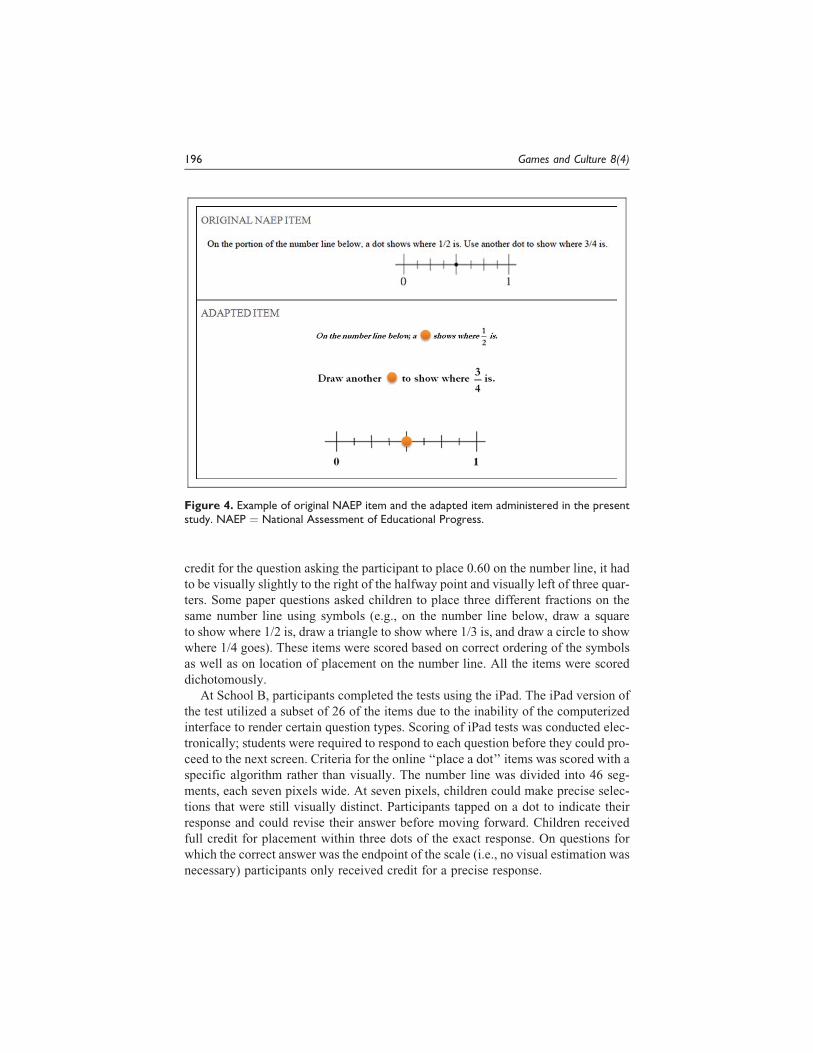
At School A, participants completed a paper version of the test, which comprised
34 items. Figure 4 shows a sample item adapted from a NAEP-released item. This
item was used in both the paper and the iPad versions of the test. The complete set
of test items are available from the author. Scoring of the paper tests was done by
hand using visual estimation. The criteria for correct responses on the paper tests
were based on comparisons to key positions on the number line. For instance, to earn
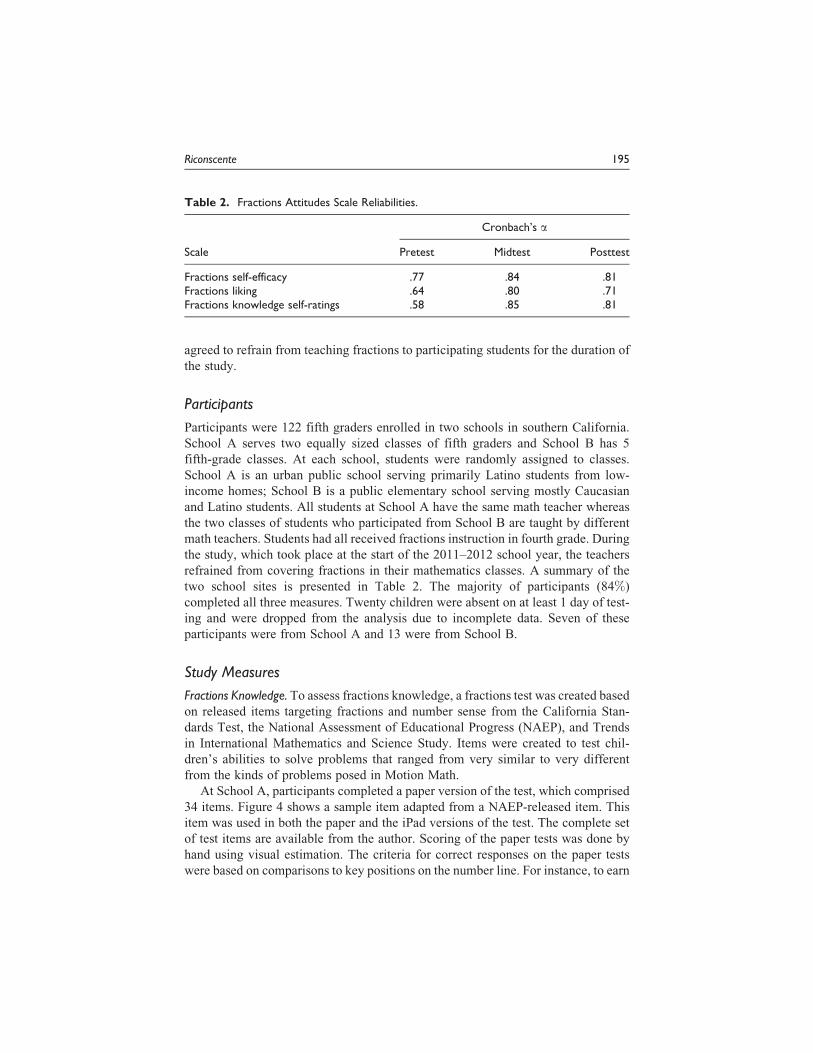
Table 2. Fractions Attitudes Scale Reliabilities.
Cronbach’s a
Scale Pretest Midtest Posttest
Fractions self-efficacy .77 .84 .81Fractions liking .64 .80 .71Fractions knowledge self-ratings .58 .85 .81
Riconscente 195
credit for the question asking the participant to place 0.60 on the number line, it had
to be visually slightly to the right of the halfway point and visually left of three quar-
ters. Some paper questions asked children to place three different fractions on the
same number line using symbols (e.g., on the number line below, draw a square
to show where 1/2 is, draw a triangle to show where 1/3 is, and draw a circle to show
where 1/4 goes). These items were scored based on correct ordering of the symbols
as well as on location of placement on the number line. All the items were scored
dichotomously.
At School B, participants completed the tests using the iPad. The iPad version of
the test utilized a subset of 26 of the items due to the inability of the computerized
interface to render certain question types. Scoring of iPad tests was conducted elec-
tronically; students were required to respond to each question before they could pro-
ceed to the next screen. Criteria for the online ‘‘place a dot’’ items was scored with a
specific algorithm rather than visually. The number line was divided into 46 seg-
ments, each seven pixels wide. At seven pixels, children could make precise selec-
tions that were still visually distinct. Participants tapped on a dot to indicate their
response and could revise their answer before moving forward. Children received
full credit for placement within three dots of the exact response. On questions for
which the correct answer was the endpoint of the scale (i.e., no visual estimation was
necessary) participants only received credit for a precise response.
Figure 4. Example of original NAEP item and the adapted item administered in the presentstudy. NAEP ¼ National Assessment of Educational Progress.
196 Games and Culture 8(4)
Fractions Attitudes. The fractions attitude measure comprised three subscales: frac-
tions self-efficacy (e.g., ‘‘I am good at fractions’’), fractions liking (e.g., ‘‘Fractions
are fun’’), and fractions-number line knowledge (e.g., ‘‘I know where 1/2 goes on the
number line’’). The order of negative and positive response options was mixed to
reduce response set threat to validity.
The attitudinal questions were presented in a format adapted from Susan Harter’s
(1981) work with young children to avoid social desirability threats to validity. For
each question, participants were presented with two stick figures expressing oppo-
site opinions about fractions and asked to circle the student who was most like them.
Children then indicated whether they were ‘‘a lot’’ or ‘‘a little’’ like the student they
had selected. Responses were coded into a 4-point Likert-type scale corresponding
to strongly disagree (1) through strongly agree (4) and reverse coded if appropriate.
Reliabilities are presented in Table 2.
Game Ratings. Four additional questions, using the same format as the fractions
attitudes measures, were used to assess participants’ perceptions of the Motion Math
game itself. Children indicated whether they wanted to play the game again, whether
the game was fun or boring, whether they thought their friends would like the game,
and whether the game helped them learn fractions.
Procedures
This study used a repeated measures crossover design. At each study site, one class
was randomly assigned to either Motion Math (Group 1) or control (Group 2) for the
first week. In Week 2, the order switched. As shown in Table 1, all participants took
the test 3 times, at the start, midpoint, and end of the study period. In this report,
these three time points are referred to as pretest, midtest, and posttest, respectively.
At both study sites, participating teachers agreed to refrain from teaching topics
directly related to fractions during the study, since the purpose of the study was not
to compare game play to classroom instruction but rather to ascertain whether the
game is effective as a stand-alone instructional tool.
At School A, all participants completed paper-and-pencil tests on the first day of
the study. They were instructed via a ‘‘STOP HERE’’ page in the booklet, as well as
by their teacher, to wait after completing the attitudinal questions. When all partici-
pants were ready, the teacher began the timed section of the test. Children then had
10 min to complete the fractions items. School B followed a similar procedure,
except that participants completed the measures using the iPads and were not timed.
At both sites, for the next 5 days, students in Group 1 spent 20 min daily playing
Motion Math. Children in Group 2 served as the control. After five school days, all
participants completed all measures under the same conditions as on Day 1. The
groups then switched treatment conditions. For the next five school days, children
in Group 2 played Motion Math for 20 min daily while Group 1 participants served
as the control. After Group 2 had played the game daily for five school days, all
Riconscente 197

participants completed the measures for a third and final time. At the end of the
study, all participants had experienced the same amount of exposure to Motion
Math.
Results
To respond to the research questions, analyses were conducted to compare the
groups to each other over time (i.e., between-subject comparisons) and to compare
changes in scores within each group over time (i.e., within-subject comparisons).
Data for the fractions attitude and game rating portions of the survey were aggre-
gated across sites since all items were identical. However, to account for different
administration conditions for the fractions knowledge tests, those data are presented
separately for School A and School B.
Fractions Knowledge
School A Results. At School A, participants completed the test on paper and were
given 10 min to complete the fractions test portion of the packet. Students completed
each item in sequence as presented in the booklet. By including a time limit, the
intent was to consider whether playing Motion Math would have an impact on accu-
racy of responses as well as number of items completed. However, the teacher
reported that on the midtest and posttest, but not on the pretest, the children in both
groups began to compete with one another to see how many questions they could
answer in the allotted time. This competitive element introduced a confound, such
that the number of items completed at the midtest and posttest, but not pretest, was
due to a combination of students’ fractions knowledge and the competitive element.
To correct for this confound, pretest results were examined to determine how many
items had been attempted by the majority of students, regardless of accuracy. Since
the majority of students completed the first 20 items on the pretest, but not the
remainder of the items, Items 1 through 20 were used as the basis for the analysis.
The two groups did not differ significantly at pretest, t(43.37)¼�.822, p¼ .415.
Levene’s test for equality of variances indicated that the two groups had equivalent
variances at midtest and posttest. Consistent with the hypothesis that Group 1, which
played Motion Math first, would have higher fractions knowledge relative to Group
2 at the midtest, a one-tailed independent samples t-test was conducted. Results
showed that at the midtest, Group 1 had a significantly higher average fractions
score compared to Group 2, t(52)¼ 2.670, p¼ .01. At the posttest, both groups were
again equivalent, based on results from a two-tailed independent samples t-test, t(52)
¼ 0.588, p ¼ .559. The effect sizes (ESs) presented in Table 3 were standardized by
taking the average standard deviation for each group for the time points of interest.
To ascertain whether scores at midtest were higher for Group 1 than for Group 2, an
analysis of covariance (ANCOVA) was conducted using the pretest as a covariate.
Results showed that the effect of treatment condition was significant, F(1, 53) ¼
198 Games and Culture 8(4)
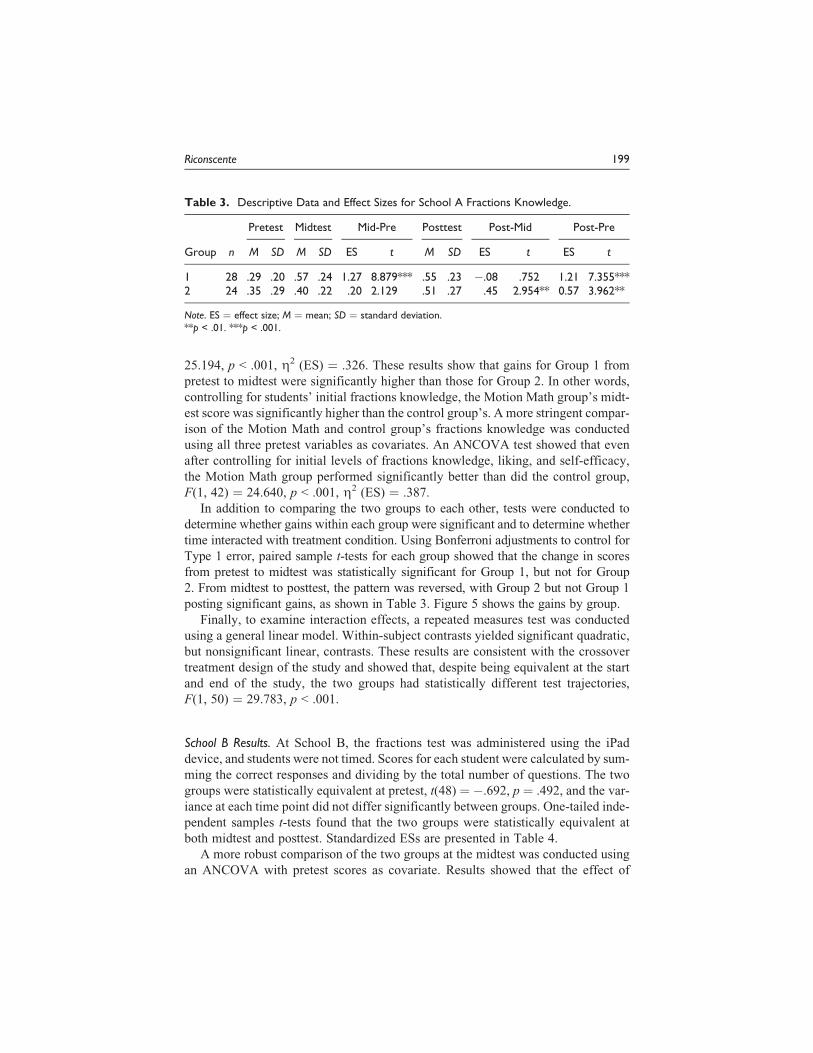
25.194, p < .001, Z2 (ES) ¼ .326. These results show that gains for Group 1 from
pretest to midtest were significantly higher than those for Group 2. In other words,
controlling for students’ initial fractions knowledge, the Motion Math group’s midt-
est score was significantly higher than the control group’s. A more stringent compar-
ison of the Motion Math and control group’s fractions knowledge was conducted
using all three pretest variables as covariates. An ANCOVA test showed that even
after controlling for initial levels of fractions knowledge, liking, and self-efficacy,
the Motion Math group performed significantly better than did the control group,
F(1, 42) ¼ 24.640, p < .001, Z2 (ES) ¼ .387.
In addition to comparing the two groups to each other, tests were conducted to
determine whether gains within each group were significant and to determine whether
time interacted with treatment condition. Using Bonferroni adjustments to control for
Type 1 error, paired sample t-tests for each group showed that the change in scores
from pretest to midtest was statistically significant for Group 1, but not for Group
2. From midtest to posttest, the pattern was reversed, with Group 2 but not Group 1
posting significant gains, as shown in Table 3. Figure 5 shows the gains by group.
Finally, to examine interaction effects, a repeated measures test was conducted
using a general linear model. Within-subject contrasts yielded significant quadratic,
but nonsignificant linear, contrasts. These results are consistent with the crossover
treatment design of the study and showed that, despite being equivalent at the start
and end of the study, the two groups had statistically different test trajectories,
F(1, 50) ¼ 29.783, p < .001.
School B Results. At School B, the fractions test was administered using the iPad
device, and students were not timed. Scores for each student were calculated by sum-
ming the correct responses and dividing by the total number of questions. The two
groups were statistically equivalent at pretest, t(48) ¼ �.692, p ¼ .492, and the var-
iance at each time point did not differ significantly between groups. One-tailed inde-
pendent samples t-tests found that the two groups were statistically equivalent at
both midtest and posttest. Standardized ESs are presented in Table 4.
A more robust comparison of the two groups at the midtest was conducted using
an ANCOVA with pretest scores as covariate. Results showed that the effect of
Table 3. Descriptive Data and Effect Sizes for School A Fractions Knowledge.
Pretest Midtest Mid-Pre Posttest Post-Mid Post-Pre
Group n M SD M SD ES t M SD ES t ES t
1 28 .29 .20 .57 .24 1.27 8.879*** .55 .23 �.08 .752 1.21 7.355***2 24 .35 .29 .40 .22 .20 2.129 .51 .27 .45 2.954** 0.57 3.962**
Note. ES ¼ effect size; M ¼ mean; SD ¼ standard deviation.**p < .01. ***p < .001.
Riconscente 199
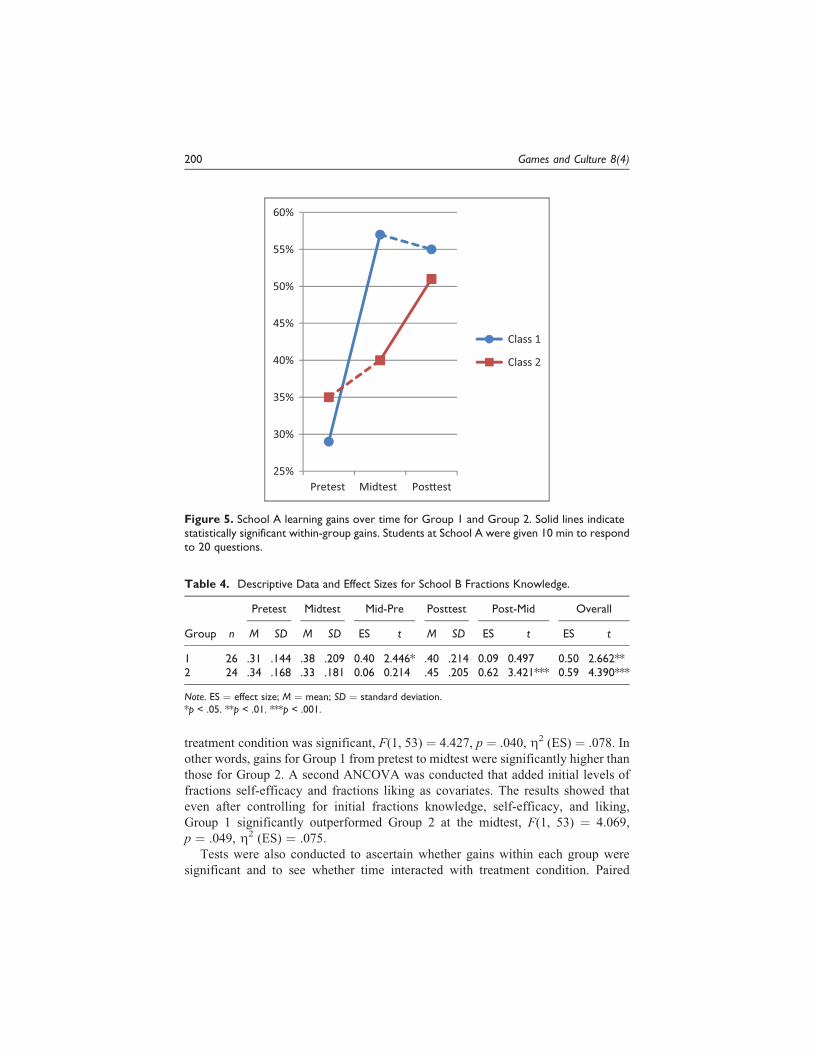
treatment condition was significant, F(1, 53) ¼ 4.427, p ¼ .040, Z2 (ES) ¼ .078. In
other words, gains for Group 1 from pretest to midtest were significantly higher than
those for Group 2. A second ANCOVA was conducted that added initial levels of
fractions self-efficacy and fractions liking as covariates. The results showed that
even after controlling for initial fractions knowledge, self-efficacy, and liking,
Group 1 significantly outperformed Group 2 at the midtest, F(1, 53) ¼ 4.069,
p ¼ .049, Z2 (ES) ¼ .075.
Tests were also conducted to ascertain whether gains within each group were
significant and to see whether time interacted with treatment condition. Paired
25%
30%
35%
40%
45%
50%
55%
60%
Pretest Midtest Pos�est
Class 1
Class 2
Figure 5. School A learning gains over time for Group 1 and Group 2. Solid lines indicatestatistically significant within-group gains. Students at School A were given 10 min to respondto 20 questions.
Table 4. Descriptive Data and Effect Sizes for School B Fractions Knowledge.
Pretest Midtest Mid-Pre Posttest Post-Mid Overall
Group n M SD M SD ES t M SD ES t ES t
1 26 .31 .144 .38 .209 0.40 2.446* .40 .214 0.09 0.497 0.50 2.662**2 24 .34 .168 .33 .181 0.06 0.214 .45 .205 0.62 3.421*** 0.59 4.390***
Note. ES ¼ effect size; M ¼ mean; SD ¼ standard deviation.*p < .05. **p < .01. ***p < .001.
200 Games and Culture 8(4)
sample t-tests with Bonferroni adjustments showed the same pattern as was obtained
for School A. Change in scores from pretest to midtest was statistically significant
for Group 1 but not for Group 2. From midtest to posttest, the pattern was reversed,
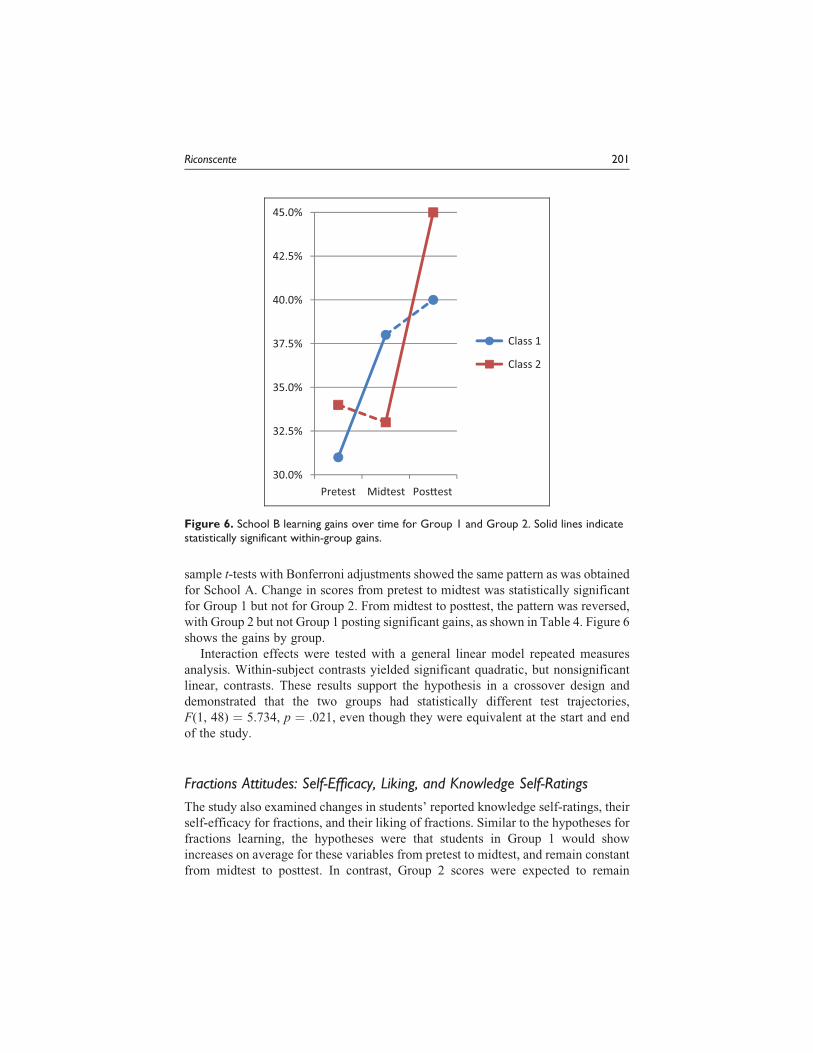
with Group 2 but not Group 1 posting significant gains, as shown in Table 4. Figure 6
shows the gains by group.
Interaction effects were tested with a general linear model repeated measures
analysis. Within-subject contrasts yielded significant quadratic, but nonsignificant
linear, contrasts. These results support the hypothesis in a crossover design and
demonstrated that the two groups had statistically different test trajectories,
F(1, 48) ¼ 5.734, p ¼ .021, even though they were equivalent at the start and end
of the study.
Fractions Attitudes: Self-Efficacy, Liking, and Knowledge Self-Ratings
The study also examined changes in students’ reported knowledge self-ratings, their
self-efficacy for fractions, and their liking of fractions. Similar to the hypotheses for
fractions learning, the hypotheses were that students in Group 1 would show
increases on average for these variables from pretest to midtest, and remain constant
from midtest to posttest. In contrast, Group 2 scores were expected to remain
30.0%
32.5%
35.0%
37.5%
40.0%
42.5%
45.0%
Pretest Midtest Pos�est
Class 1
Class 2
Figure 6. School B learning gains over time for Group 1 and Group 2. Solid lines indicatestatistically significant within-group gains.
Riconscente 201
constant from pretest to midtest and to increase significantly from midtest to postt-
est. Since administrations of the fractions attitudes measures at both school sites
were comparable, attitudes data were aggregated.
Fractions Self-Efficacy. The two groups had equivalent self-efficacy scores at the start
of the study, t(92) ¼ �.112, p ¼ .911, and at all three time points did not differ
significantly in variance. At the midtest, average self-efficacy for Group 1 was
significantly higher than that of Group 2, t(92) ¼ 2.414, p ¼ .009. At the posttest,
both groups were again equivalent, based on results from a two-tailed independent
samples t-test, t(92) ¼ 0.140, p ¼ .889. Standardized ESs are shown in Table 5.
Controlling for pretest levels of self-efficacy, ANCOVA results showed that the
effect of treatment condition was significant, F(1, 94) ¼ 7.357, p ¼ .008. In other
words, self-efficacy gains for Group 1 from pretest to midtest were significantly
higher than those for Group 2. Analyses were also carried out to determine whether
gains within each group were significant. Using Bonferroni adjustments to control
for Type 1 error, paired sample t-tests for each group showed that change in scores
from pretest to midtest was statistically significant for Group 1 but not for Group 2.
From midtest to posttest, the pattern was reversed, with Group 2 but not Group 1
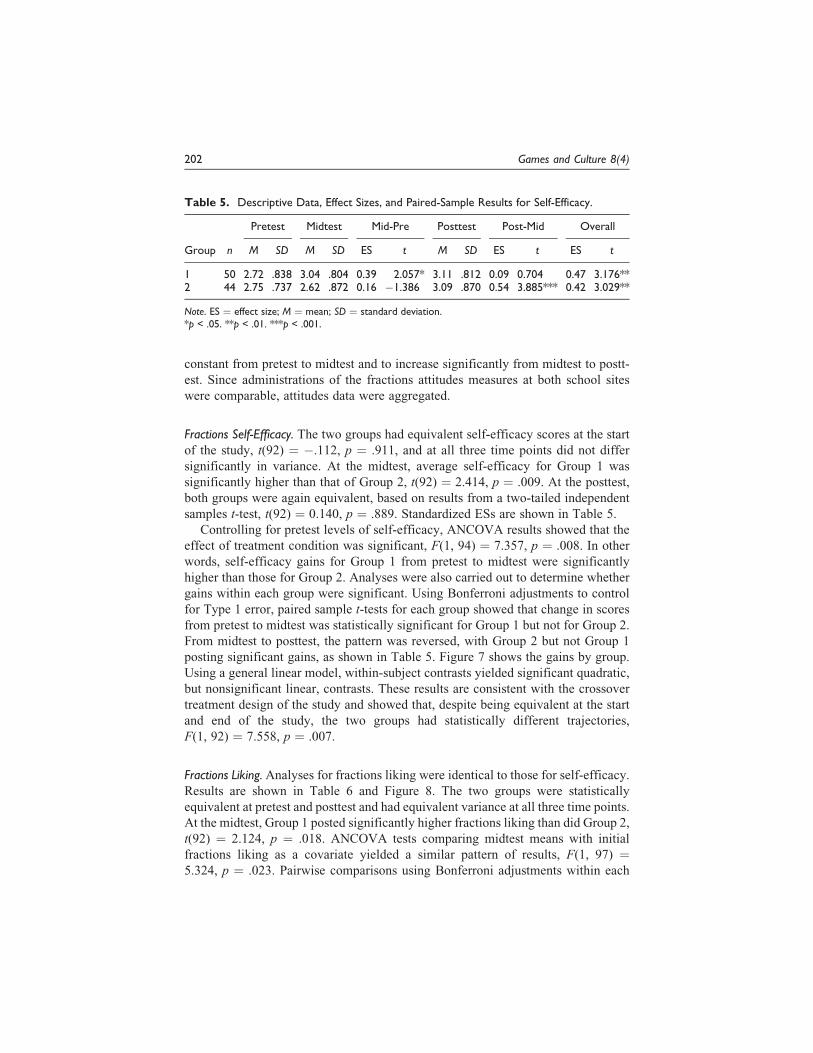
posting significant gains, as shown in Table 5. Figure 7 shows the gains by group.
Using a general linear model, within-subject contrasts yielded significant quadratic,
but nonsignificant linear, contrasts. These results are consistent with the crossover
treatment design of the study and showed that, despite being equivalent at the start
and end of the study, the two groups had statistically different trajectories,
F(1, 92) ¼ 7.558, p ¼ .007.
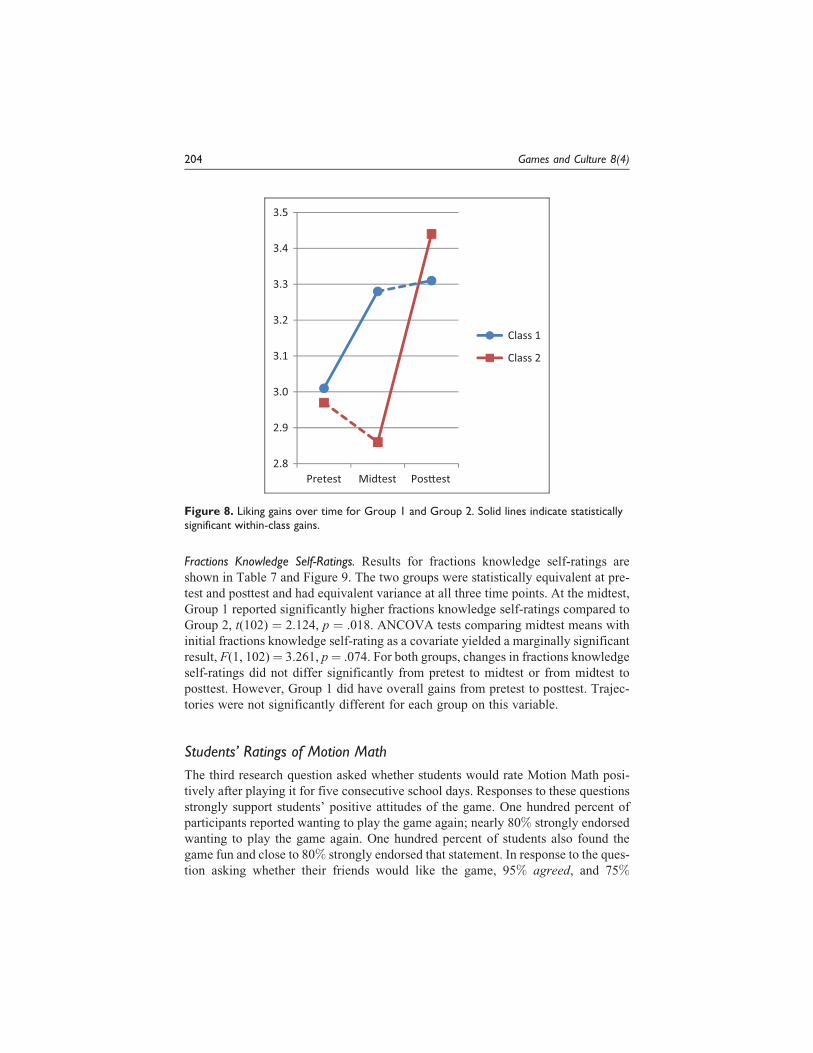
Fractions Liking. Analyses for fractions liking were identical to those for self-efficacy.Results are shown in Table 6 and Figure 8. The two groups were statistically
equivalent at pretest and posttest and had equivalent variance at all three time points.
At the midtest, Group 1 posted significantly higher fractions liking than did Group 2,
t(92) ¼ 2.124, p ¼ .018. ANCOVA tests comparing midtest means with initial
fractions liking as a covariate yielded a similar pattern of results, F(1, 97) ¼5.324, p ¼ .023. Pairwise comparisons using Bonferroni adjustments within each
Table 5. Descriptive Data, Effect Sizes, and Paired-Sample Results for Self-Efficacy.
Pretest Midtest Mid-Pre Posttest Post-Mid Overall
Group n M SD M SD ES t M SD ES t ES t
1 50 2.72 .838 3.04 .804 0.39 2.057* 3.11 .812 0.09 0.704 0.47 3.176**2 44 2.75 .737 2.62 .872 0.16 �1.386 3.09 .870 0.54 3.885*** 0.42 3.029**
Note. ES ¼ effect size; M ¼ mean; SD ¼ standard deviation.*p < .05. **p < .01. ***p < .001.
202 Games and Culture 8(4)
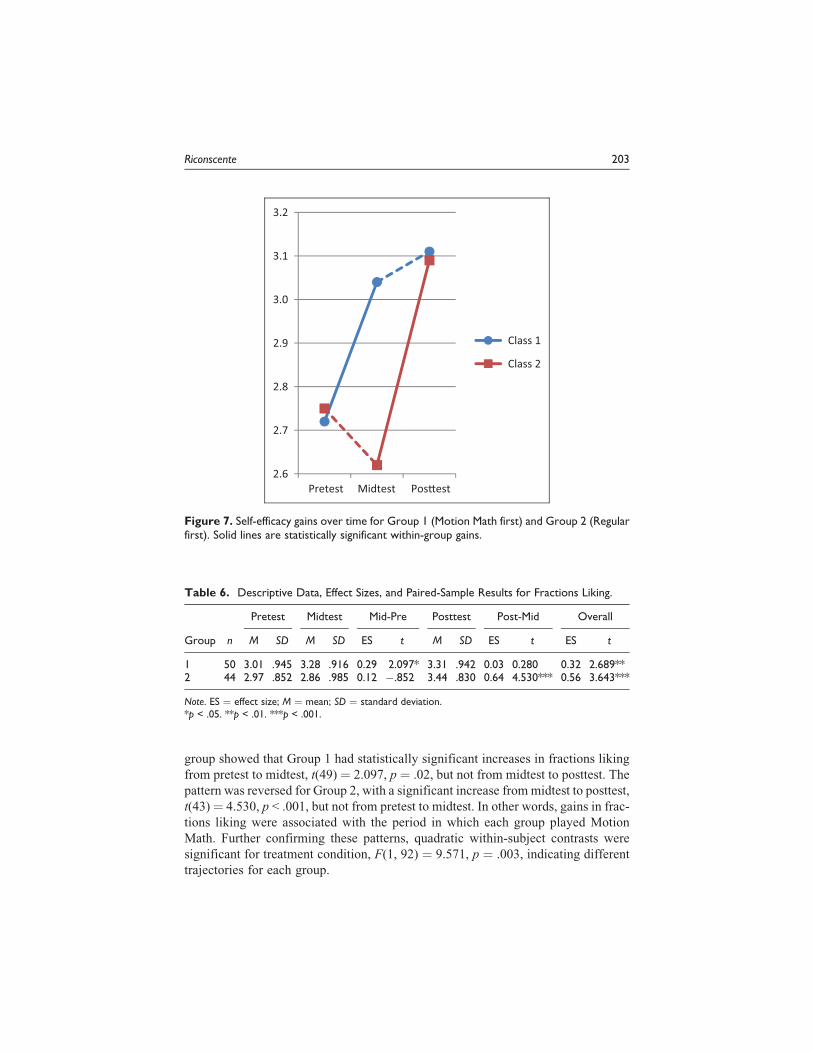
group showed that Group 1 had statistically significant increases in fractions liking
from pretest to midtest, t(49) ¼ 2.097, p ¼ .02, but not from midtest to posttest. The
pattern was reversed for Group 2, with a significant increase frommidtest to posttest,
t(43)¼ 4.530, p < .001, but not from pretest to midtest. In other words, gains in frac-
tions liking were associated with the period in which each group played Motion
Math. Further confirming these patterns, quadratic within-subject contrasts were
significant for treatment condition, F(1, 92) ¼ 9.571, p ¼ .003, indicating different
trajectories for each group.
2.6
2.7
2.8
2.9
3.0
3.1
3.2
Pretest Midtest Pos�est
Class 1
Class 2
Figure 7. Self-efficacy gains over time for Group 1 (Motion Math first) and Group 2 (Regularfirst). Solid lines are statistically significant within-group gains.
Table 6. Descriptive Data, Effect Sizes, and Paired-Sample Results for Fractions Liking.
Pretest Midtest Mid-Pre Posttest Post-Mid Overall
Group n M SD M SD ES t M SD ES t ES t
1 50 3.01 .945 3.28 .916 0.29 2.097* 3.31 .942 0.03 0.280 0.32 2.689**2 44 2.97 .852 2.86 .985 0.12 �.852 3.44 .830 0.64 4.530*** 0.56 3.643***
Note. ES ¼ effect size; M ¼ mean; SD ¼ standard deviation.*p < .05. **p < .01. ***p < .001.
Riconscente 203
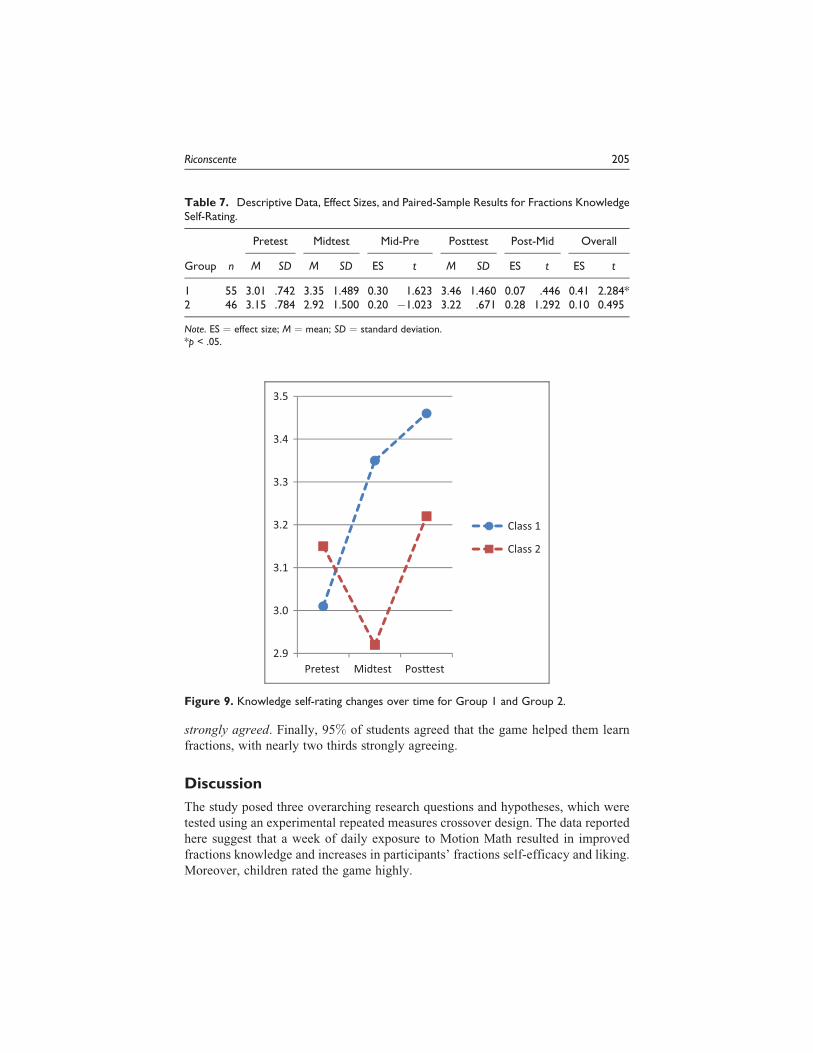
Fractions Knowledge Self-Ratings. Results for fractions knowledge self-ratings are
shown in Table 7 and Figure 9. The two groups were statistically equivalent at pre-
test and posttest and had equivalent variance at all three time points. At the midtest,
Group 1 reported significantly higher fractions knowledge self-ratings compared to
Group 2, t(102) ¼ 2.124, p ¼ .018. ANCOVA tests comparing midtest means with
initial fractions knowledge self-rating as a covariate yielded a marginally significant
result, F(1, 102)¼ 3.261, p¼ .074. For both groups, changes in fractions knowledge
self-ratings did not differ significantly from pretest to midtest or from midtest to
posttest. However, Group 1 did have overall gains from pretest to posttest. Trajec-
tories were not significantly different for each group on this variable.
Students’ Ratings of Motion Math
The third research question asked whether students would rate Motion Math posi-
tively after playing it for five consecutive school days. Responses to these questions
strongly support students’ positive attitudes of the game. One hundred percent of
participants reported wanting to play the game again; nearly 80% strongly endorsed
wanting to play the game again. One hundred percent of students also found the
game fun and close to 80% strongly endorsed that statement. In response to the ques-
tion asking whether their friends would like the game, 95% agreed, and 75%
2.8
2.9
3.0
3.1
3.2
3.3
3.4
3.5
Pretest Midtest Pos�est
Class 1
Class 2
Figure 8. Liking gains over time for Group 1 and Group 2. Solid lines indicate statisticallysignificant within-class gains.
204 Games and Culture 8(4)
strongly agreed. Finally, 95% of students agreed that the game helped them learn
fractions, with nearly two thirds strongly agreeing.
Discussion
The study posed three overarching research questions and hypotheses, which were
tested using an experimental repeated measures crossover design. The data reported
here suggest that a week of daily exposure to Motion Math resulted in improved
fractions knowledge and increases in participants’ fractions self-efficacy and liking.
Moreover, children rated the game highly.
Table 7. Descriptive Data, Effect Sizes, and Paired-Sample Results for Fractions KnowledgeSelf-Rating.
Pretest Midtest Mid-Pre Posttest Post-Mid Overall
Group n M SD M SD ES t M SD ES t ES t
1 55 3.01 .742 3.35 1.489 0.30 1.623 3.46 1.460 0.07 .446 0.41 2.284*2 46 3.15 .784 2.92 1.500 0.20 �1.023 3.22 .671 0.28 1.292 0.10 0.495
Note. ES ¼ effect size; M ¼ mean; SD ¼ standard deviation.*p < .05.
2.9
3.0
3.1
3.2
3.3
3.4
3.5
Pretest Midtest Pos�est
Class 1
Class 2
Figure 9. Knowledge self-rating changes over time for Group 1 and Group 2.
Riconscente 205
Fractions Knowledge
At both study sites, significant learning gains were tied to the period in which parti-
cipants played Motion Math. Lending further strength to the findings is the fact that
these patterns were produced by two different measures of fractions knowledge, at
schools with two different demographic profiles, and in comparison with a control
group. Importantly, the benefits accrued by the first groups to play the game did not
shrink after several days of nonexposure to the game. Therefore, it is reasonable to
conclude that the gains made were stable, at least in the short term.
Why did playing Motion Math improve participants’ fractions knowledge? There
are many possible answers to this question, and most likely several factors contribute
to the game’s effectiveness. One possible contributing factor is the instant feedback
and scaffolding provided by the game. Another is that players tackle many fractions
problems each time they play the game. Over the course of this study, each student
encountered an average of over 770 math problems. This represents an incredible
amount of fractions practice. The motivation generated by the engaging game
mechanic may have been crucial to this benefit. In other words, the entertainment
value of the game provided students the motivation necessary to persist in the exten-
sive practice needed to attain mastery and automaticity. The timed nature of the
game is another important feature, in that a time constraint adds a sense of urgency
to problem solving, and may also foster rapid schema development. Importantly, the
embodied nature of Motion Math game play is a key consideration in its effective-
ness. Having to physically tilt the device repeatedly may have helped students
develop their mental number line. This explanation is consistent with the Ramani
and Siegler (2008), and Siegler and Ramani (2009) studies reviewed earlier.
The success of Motion Math in promoting learning opens up many questions for
future exploration regarding the relation between the game design and learning.
Important insights would be gained from in-depth analysis of game play data, such
as how many problems students correctly solved on the first ‘‘bounce,’’ the trajec-
tories of game level attained, or whether specific problems serve as particularly
strong predictors of fractions proficiency. The extent to which assessment of
fractions proficiency could be embedded within game play has intriguing implica-
tions for student testing.
The gains observed from pretest to posttest indicate that the game served an
instructional function. One question that emerges from these results is the extent
to which the game was primarily teaching students to relate fractions to the number
line, or activating and reinforcing students’ prior knowledge. A related question is
the extent to which, and the processes by which, experience with fractions estima-
tion transfers to other kinds of fractions knowledge and problem solving. Future
research could tease apart students’ conceptual understanding from procedural
understanding, and probe the extent to which game play brings students to a deeper
conceptual understanding of fractions as numbers. Other topics for additional
research include identifying game design features most responsible for learning
206 Games and Culture 8(4)
gains. For instance, do specific problem sequences lead to conceptual insights more
quickly or effectively than do others?
Another set of questions regards ways to optimize learners’ interactions with
Motion Math. For example, is the game most effective for students who are at a
certain level of understanding of fractions? One of the participating teachers in the
present study observed that students who had not yet grasped the basic idea of a frac-
tion did not appear to improve their game play, whereas other students gave signs of
making new connections and insights. An interesting consideration is how slight
modifications to the game might lead to improved learning for a broader range of
students. Motion Math was designed for students with a baseline understanding of
the fractions representation form. For students with limited prior knowledge who
may not spontaneously extract patterns from game play, introducing explicit
sequences may prove effective. For instance, an introductory level might start with
a sequence of unit fractions with increasing denominators (i.e., 1/2, 1/3, 1/4, 1/5, and
1/6) and explicitly draw the player’s attention to the inverse relationship between the
denominator and the distance from zero on the number line. Other instructional
sequences include using a constant denominator with an incremental decrease or
increase in the numerator; or maintaining the same fraction while changing the
labels on the number line endpoints. Adding a whole number ‘‘refresher’’ level could
serve as an effective scaffold to bridge students’ intuitive understanding of whole
numbers to an understanding of fractions as numbers (Wu, 2008). Changing the
number line more often may foster more flexible schema development. Motion Math
already includes levels in which the number line spans from �1 to zero. Including
additional levels with number lines that span zero, such as one anchored at �1 and
þ1, could help reinforce the concept that fraction magnitude is independent of sign.
Wu (2008) asserted that fractions research should be integrated with the study of
fractions instruction. Though Motion Math was created as a stand-alone game, it
may be that even minimal instructional support exponentially increases the educa-
tional value of game play. Simple instructional prompts from a teacher, parent, or
older peer could unlock insights for students. Future research should explore the
value added by a variety of instructional wraparounds. Another consideration is the
length of exposure to the game. This study took place over 10 school days. Over
longer periods of time, do students develop deeper conceptual understanding?
Fractions Self-Efficacy, Liking, and Knowledge Self-Ratings
The study also investigated changes in students’ attitudes toward fractions. The
results for fractions self-efficacy and liking were highly similar to those for learning.
Increases in these attitudes were associated with the period in which students played
Motion Math and persisted after game play. These results are arguably just as impor-
tant as the learning results, given the strong connection documented in the research
literature between students’ attitudes and subsequent learning. Developing positive
Riconscente 207
affect for fractions should benefit students as they encounter new challenges in
mathematics.
Gains in students’ self-efficacy show that their confidence in their ability to solve
fractions problems improved as a result of playing Motion Math. Importantly, the
study asked students to rate their self-efficacy for fractions in general, not for their
ability to succeed at the game. In other words, these outcomes suggest that the expe-
rience of playing Motion Math gave students a sense of confidence in fractions that
extends beyond game play. One explanation for this outcome is the fact that mastery
experiences are a well-documented source of self-efficacy (Usher & Pajares, 2008).
The design of Motion Math enabled students to experience and be rewarded for
success each time they correctly solved a problem. This stands in contrast to the kind
of feedback students receive in school, where they are scored on overall assignments
or tests. In this context, correctly solving a single problem is unlikely to contribute to
a student’s self-efficacy. A game environment also promotes persistence, a key
motivation indicator. Several features of game play are likely to contribute to persis-
tence. First, failure is an accepted part of game play, whereas in school tasks it is
often reason for students to withdraw from the task. Everyone expects to have to fail
many times before winning in a game. Second, a well-balanced game maintains the
right proportion of challenge to skill level, so that persistence is rewarded by new
successes, which in turn fuels more persistence. The game also gives students
multiple chances to succeed at each problem. Related to this is that scaffolding com-
municates to the student that the game is ‘‘on their side’’ and thus encourages risk
taking and persistence. Finally, the entertainment value of the game is probably
responsible to a large degree for students’ persistence.
Students also reported liking fractions more after playing Motion Math. Similar
to the results obtained for learning and self-efficacy, these increases remained when
students no longer played the game. In a game environment, the positive experience
of game play is likely to become associated with the material, much like, in a neg-
ative fashion, bad experiences with math class lead to negative affect toward math.
One reason for increased liking is the fact that learners tend to have more positive
attitudes toward topics they feel they understand and can succeed in. Many school-
children believe that fractions are too hard to understand. By offering students
opportunities to succeed at solving fractions problems, Motion Math also provided
students with experiences that contributed to more positive fractions affect. The
importance of this outcome cannot be underestimated for students’ future decisions
to persist in and succeed at mathematics.
In contrast, students’ self-ratings of their fractions knowledge did not yield
significant changes, although there were significant differences between the two
groups at the midpoint of the study. There are several possible explanations for this
outcome. Reliability was very low (a ¼ .58) for this 3-item measure, which was
created for the present study to assess whether students might rate themselves more
highly after game play on their ability to solve the specific kinds of questions played
in the game. The low reliability may be the reason for the nonsignificant changes
208 Games and Culture 8(4)
observed here. It may also be that the instrument, beyond being unreliable, was not a
valid measure of self-rated knowledge due to language comprehension. Many
students from School A provided inconsistent responses to the negatively worded
item for this measure. Another possible explanation is that prior to playing Motion
Math, students had never been asked to place a fraction or decimal on the number
line, and therefore did not understand the questions. The fact that reliabilities
increased to acceptable levels after the experience of game play suggest that once
students began playing the game, the question made more sense and they were able
to respond more accurately and consistently.
Ratings of Motion Math
Students’ ratings of Motion Math were overwhelmingly positive and demonstrate
that the game is successful in providing students with an entertaining experience.
Outcomes regarding enjoyment of the game and interest in playing it again are all
the more powerful in light of the evidence of learning documented here. After play-
ing the game for 20 min a day, 5 days in a row, students’ enthusiasm for the game
remained high. The fact that students still wanted to play the game after doing so for
five consecutive school days suggests that the game mechanic has hit the mark with
a powerful ‘‘addictive’’ quality. Perhaps most importantly, in Motion Math, learning
is seamlessly integrated with assessment. Game play and assessment are one and the
same. Future research could probe the keys to the game’s entertainment value,
including interactive features, visual, haptic, and audio rewards, the tilt-based game
mechanic, and the handheld nature of device interaction.
Limitations
Like every research study, the present investigation had several limitations that
should be considered in interpreting and applying the results. First, the study did not
compare Motion Math to traditional classroom instruction or to other educational
apps. Therefore, the study did not enable conclusions to be drawn regarding the
effectiveness of Motion Math relative to other approaches to learning fractions.
Second, the study did not collect information on individual student demographics
or academic achievement. Therefore, it was not possible to examine whether certain
groups of students (e.g., by gender, ethnicity, and prior knowledge) responded more
favorably than others to the Motion Math game. Third, game play data were not ana-
lyzed in this study. As a result, although the data enable valid claims about whether
students learned, we do not know why they learned. Moreover, it is highly likely that
certain students benefited more than others from exposure to the game. In addition,
16% of students did not complete all assessments and therefore were not included in
the analyses. The inclusion of data from these students, who may have higher rates
of absenteeism than their peers, may have changed the outcomes of the study.
Finally, it could be argued that Motion Math was successful in promoting students’
Riconscente 209
fractions learning because of the large number of problems students solved. In other
words, if Motion Math is essentially fractions practice, then research should be
conducted to determine whether it is more effective than other kinds of practice, for
instance work sheets or flash cards.
Another consideration is the effect the iPad itself may have had on the outcomes
obtained here. Anecdotal evidence suggested that most students in this study did not
own their own iPad. It is therefore possible that students’ reported enthusiasm for
fractions and for Motion Math could be explained in part by their enthusiasm for the
device itself. Even if the iPad was responsible for the attitudes outcomes, it is
unlikely that the use of the iPad per se was responsible for fractions learning. The
excitement at using the iPad may have given students the motivation they needed
to persist at the game, which in turn led to fractions learning. The question is whether
students would continue to engage effectively with the game once the novelty of the
technology subsides. Finally, the fact that students participated in the context of the
school day may have influenced the quality of their engagement with the game. It is
possible that the quality of engagement in informal settings would result in smaller
learning and attitudes gains.
Future Research
The present study offers a foundation for future research into these issues. Emergent
mobile devices make it possible for players to interact physically with devices in
revolutionary ways. Much is yet to be learned about how the new affordances of
these devices can support learning, and how our conception of learning itself might
change in light of these new ways of interacting with the world around us.
With attention to protection to individuals’ privacy, research could use GPS data
to determine where people are most likely to make use of mobile learning apps. Are
they typically at home, work, waiting in line at the grocery store? Does location of
use relate to aspects of mobile learning app usage? How is location of game play
related to game features and to learning? For example, it may be that individuals are
less likely to engage in games that require conspicuous physical interaction in public
spaces. In addition, brief games are perhaps most appropriate for learning that
happens best with distributed practice, whereas games that focus on shifting strong
misconceptions may demand longer play periods, and consequently be less aligned
with spontaneous usage.
Much is to be learned about how individual differences affect the way that
learners interact physically with mobile devices. In the present study, differences
were observed in the extent to which individuals were willing to dramatically tilt the
device. While some students tended to use exaggerated movements, others were
reticent to engage physically with the device. Future research, and the development
of embodied learning apps, should consider the interplay between individual charac-
teristics and game features.
210 Games and Culture 8(4)

Mobile learning apps offer tremendous potential for dynamic assessment that
is embedded in game play (Riconscente & Vattel, 2013). In other words, in well-
designed apps, learning could be tracked without the need for external tests and
quizzes. Research and development is already underway in this direction; however,
this approach to assessment is yet in its infancy.
Motion Math is grounded in research and theory on the field of mathematics and
on how people learn. To be effective, developers of learning apps will need to invest
substantial resources to deeply probe the target learning material, concepts, and
skills, and explicitly shape game mechanics to reflect the target learning.
Conclusion
The well-documented difficulties children face when learning fractions call for new
approaches to teaching this topic. To date, the present study is the first to hold the
promise of iPad apps up to experimental evidence. This project investigated Motion
Math, a mobile learning game that leverages the physical interaction features of the
iPad to engage students in a fractions learning experience. In this controlled experi-
ment, Motion Math significantly improved participants’ fractions knowledge and
attitudes. Moreover, children’s ratings of the game were quite positive. This study
thus offers evidence that Motion Math successfully integrates learning and entertain-
ment, and in the process boosts players’ attitudes toward fractions.
Authors’ Note
Michelle Riconscente is now at the New York Hall of Science.
Acknowledgment
The author wishes to acknowledge Warren Buckleitner, Gregory Ferenstein, Steven Hecht,
and Lucien Vattel for helpful feedback on an earlier version of this article.
Declaration of Conflicting Interests
The author(s) declared no potential conflicts of interest with respect to the research, author-
ship, and/or publication of this article.
Funding
The author(s) disclosed receipt of the following financial support for the research, authorship,
and/or publication of this article: This research was conducted as a third-party evaluation.
Compensation for the evaluation was supported by a grant from the Noyce Foundation to
Motion Math Games.
References
Alibali, M. W., & Nathan, M. J. (2011). Embodiment in mathematics teaching: Evidence from
learners’ and teachers’ gestures. Journal of the Learning Sciences, 21, 247–286. doi:10.
1080/10508406.2011.611446
Riconscente 211
Ashcraft, M. H. (2002). Math anxiety: Personal, educational, and cognitive consequences.
Current Directions in Psychological Science, 11, 181–185.
Bandura, A. (1977). Self-efficacy: Toward a unifying theory of behavioral change.
Psychological Review, 84, 191–215.
Behr, M., Lesh, R., Post, T., & Silver, E. (1983). Rational number concepts. In R. Lesh & M.
Landau (Eds.), Acquisition of mathematical concepts and processes (pp. 91–125).
New York, NY: Academic Press.
Case, R., & Griffin, S. (1990). Child cognitive development: The role of central conceptual
structures in the development of scientific and social thought. In C. A. Hauert (Ed.),
Developmental psychology: Cognitive, perceptuo-motor, and neuropsychological per-
spectives (pp. 193–230). Amsterdam, the Netherlands: Elsevier Science.
Case, R., & Okamoto, Y. (1996). The role of central conceptual structures in the development of
children’s thought.Monographs of the Society for Research in Child Development, 61, 1–2.
Clark, A. (1999). An embodied cognitive science? Trends in Cognitive Sciences, 3, 345–351.
Department of Education. (1997).Mathematics equals opportunity. White Paper prepared for
U.S. Secretary of Education Richard W. Riley for speech at the National Press Club,
Washington, DC, September 23, 1997.
Gallistel, C. R., & Gelman, R. (1992). Preverbal and verbal counting and computation.
Cognition, 44, 43–74.
Habgood, M. P. J., & Ainsworth, S. E. (2011): Motivating children to learn effectively:
Exploring the value of intrinsic integration in educational games. Journal of the
Learning Sciences, 20, 169–220.
Hart, K. (2000). Mathematics content and learning issues in the middle grades. In National
Research Council (Ed.), Mathematics Education in the Middle Grades: Proceedings of a
National Convocation and Action Conferences (pp. 50–57). Washington, DC: National
Academy Press.
Harter, S. (1981). A new self-report scale of intrinsic versus extrinsic orientation in the class-
room: Motivational and informational components. Developmental Psychology, 17,
300–312.
Hidi, S., & Renninger, K. A. (2006). The four-phase model of interest development.
Educational Psychologist, 41, 111–127.
Hiebert, J. (1985). Children’s knowledge of common and decimal fractions. Education and
Urban Society, 17, 427–437.
Hiebert, J., & Tonnessen, L. H. (1978). Development of the fraction concept in two physical con-
texts: An exploratory investigation. Journal for Research in Mathematics Education, 9,
374–378.
Johnson-Glenberg, M. C., Birchfield, D., Savvides, P., & Megowan-Romanowicz, C.
(2010) Semi-virtual embodied learning—Real world STEM assessment. In L.
Annetta & S. Bronack (Eds.), Serious educational game assessment: Practical meth-
ods and models for educational games, simulations and virtual worlds (pp. 225–241).
Rotterdam, The Netherlands: Sense Publications.
Malone, T. W., & Lepper, M. R. (1987). Making learning fun: A taxonomy of intrinsic moti-
vations for learning. In R. E. Snow & M. J. Farr (Eds.), Aptitude, learning and instruction
212 Games and Culture 8(4)
III: Conative and affective process analyses (pp. 223–253). Hillsdale, NJ: Lawrence
Erlbaum.
Misquitta, R. (2011). A review of the literature: Fraction instruction for struggling learners in
mathematics. Learning Disabilities Research & Practice, 26, 109–119.
National Mathematics Advisory Panel. (2008). Foundations for success: The final report of the
National Mathematics Advisory Panel. Washington, DC: U.S. Department of Education.
Newton, K. J. (2008). An extensive analysis of preservice teachers’ knowledge of fractions.
American Educational Research Journal, 45, 1080–1110.
Pajares, F. (1996). Self-efficacy beliefs in academic settings. Review of Educational
Research, 66, 543–578.
Princiotta, D., Flanagan, K. D., & Germino Hausken, E. (2006). Fifth grade: Findings from
the fifth-grade follow-up of the early childhood longitudinal study, kindergarten class of
1998-99 (ECLS-K). (NCES 2006-038). Washington, DC: National Center for Education
Statistics, U.S. Department of Education.
Ramani, G. B., & Siegler, R. S. (2008). Promoting broad and stable improvements in low-
income children’s numerical knowledge through playing number board games. Child
Development, 79, 375–394.
Riconscente, M. M. (2010). Using latent profile analysis to evaluate the 4-phase model of
interest development. In M. Ainley (Chair), The next decade of interest research:
Processes and measures. Symposium presented at the Biannual International
Conference on Motivation, Porto, Portugal.
Riconscente, M. M., & Vattel, L. (2013). Extending ECD to the design of learning experi-
ences. In M. M. Riconscente (Chair), ECD from A to Z: Applying evidence-centered design
across the assessment continuum. Invited session presented at the National Council on
Measurement in Education, San Francisco, CA.
Siegler, R. S., Carpenter, T., Fennell, F., Geary, D., Lewis, J., Okamoto, Y., Thompson, L., &
Wray, J. (2010). Developing effective fractions instruction for kindergarten through
8th grade: A practice guide (NCEE Paper No. 2010-4039). Washington, DC: National
Center for Education Evaluation and Regional Assistance, Institute of Education
Sciences, U.S. Department of Education. Retrieved from whatworks.ed.gov/publications/
practiceguides
Siegler, R. S., & Ramani, G. B. (2009). Playing linear number board games—But not circular
ones—Improves low-income preschoolers’ numerical understanding. Journal of
Educational Psychology, 101, 545–560.
Siegler, R. S., Thompson, C. A., & Schneider, M. (2011a). An integrated theory of whole
number and fractions development. Cognitive Psychology, 62, 273–296.
Siegler, R. S., Thompson, C. A., & Schneider, M. (2011b). Magnitude representations are
central to understanding of fractions. In E. Kroesbergen & M. Kolkman (Chairs),
Domain general and domain specific processes in numerical development. Symposium
presented at the Biannual Meeting of the Society for Research in Child Development.
Montreal, Quebec, Canada.
Stipek, D., Salmon, J. M., Givvin, K. B., Kazemi, E., Saxe, G., & MacGyvers, V. L. (1998).
The value (and convergence) of practices suggested by motivation research and promoted
Riconscente 213
by mathematics education reformers. Journal for Research in Mathematics Education,
29, 465–488.
Tolentino, L., Birchfield, D., Megowan-Romanowicz, C., Johnson-Glenberg, M. C., Kelliher,
A., & Martinez, C. (2009). Teaching and learning in the mixed-reality science classroom.
Journal of Science Education and Technology, 18, 501–517.
Usher, E. L., & Pajares, F. (2008). Sources of self-efficacy in school: Critical review of the
literature and future directions. Review of Educational Research, 78, 751–796.
Wigfield, A., & Eccles, J. S. (2000). Expectancy-value theory of achievement motivation.
Contemporary Educational Psychology, 25, 68–81.
Wilson, M. (2002). Six views of embodied cognition. Psychonomic Bulletin & Review, 9,
625–636.
Wong, M., & Evans, D. (2007, July). Students’ conceptual understanding of equivalent
fractions. In J. Watson & K. Beswick (Eds.), Mathematics: Essential research, essential
practice, Vol 1. Proceedings of the 30th Annual Conference of the Mathematics
Education Research Group of Australasia (pp. 824–833). Hobart, Australia, July 2–6, 2007.
Wu, H. (2008). Fractions, decimals, and rational numbers. Retrieved from http://math.berke-
ley.edu/*wu/NMPfractions4.pdf
Wu, H. (2010). Teaching fractions: Is it poetry or mathematics? Paper presented at the 2010
National Council of Teachers of Mathematics Annual Meeting and Exposition, San
Diego, CA.
Author Biography
Michelle M. Riconscente, PhD, has over 20 years experience at the intersection of learning,
technology, and assessment. Her current design and research interests include: extending
evidence-centered design to create games, simulation, and interactive experiences that
successfully promote learning and motivation; designing embedded assessments of cognitive
and affective outcomes in interactive environments; and conducting program evaluations for a
variety of educational technology initiatives.
214 Games and Culture 8(4)