Embed Size (px)
Citation preview

RIET, JAIPUR
Univ. Roll No. ----------------
B.TECH II Yr (IV SEM) I Mid Term Exam February 2018
BRANCH: - Electronics & Communication Engineering
SUBJECT: EMI
TIME: 2 Hours MAX. MARKS: 20
Instructions to Candidates:-
Attempt all four questions. All questions carry equal marks. Schematic diagrams must be shown
wherever necessary.
Q1. What do you mean by accuracy and precision? Explain them.
OR
Q1. Define the following for Gaussian distribution of data:
(i) Precision index (ii) Probable error
Q2. A Circuit was tuned for resonance by eight different student and the Values of resonant
frequency in KHz as 532, 548, 543, 535, 546, 531, 543 and 536. Calculate (i) Deviation from
mean (ii) arithmetic mean (iii) Average and standard deviation (iv) variance.
OR
Q2. The following 9 observations were recorded when measuring a voltage: 31.6, 31.0, 31.7,
31.0, 32.1, 31.9, 31.0, 32.5 and 31.8 volt. Find
(i) The probable error of one reading
(ii) The probable error of mean.
Q3. Describe the construction and working of thermocouples. Discuss about ‘seeback’ effect.
OR
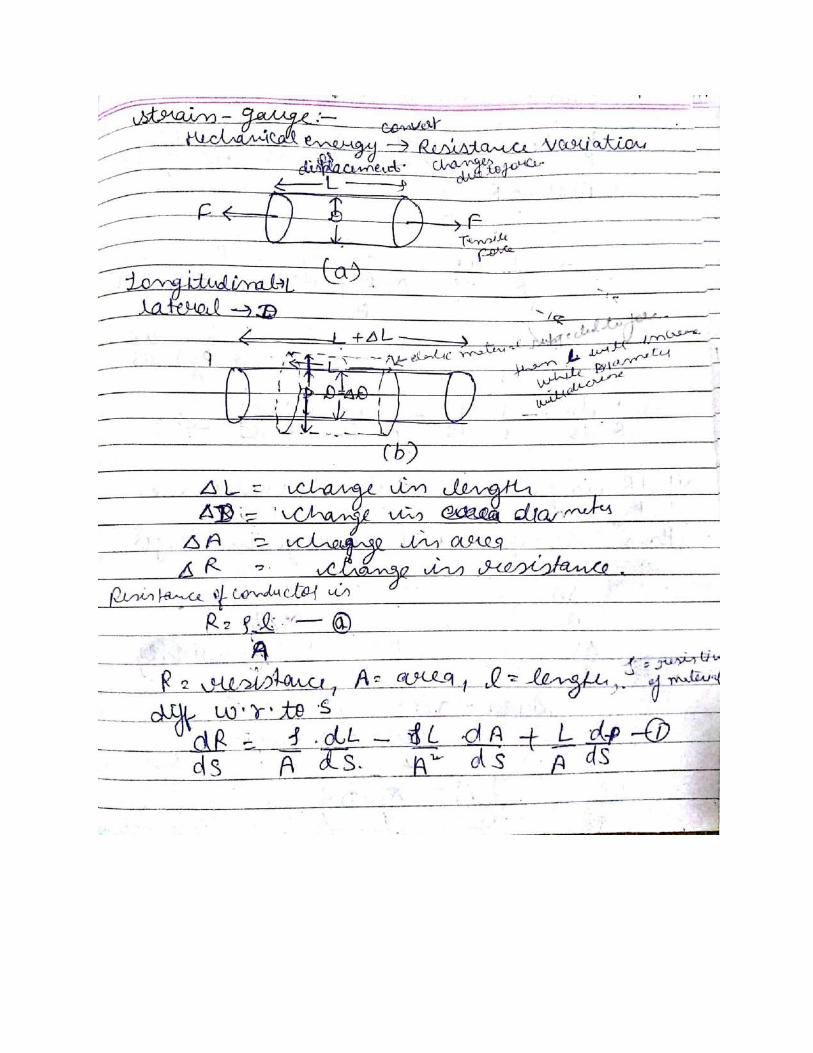
Q3. Write short note on strain gauge?
Q4. Explain construction and working principle RTD.
OR
Q4. Explain the following errors
(i) Systematic errors.
(ii) Random errors.

EMI SOLUTION
Ans.1 Accuracy: Accuracy is the degree of closeness with which an instrument reading
approaches the true value of quantity being measured.

Precision: Precision indicates the repeatability or reproducibility of an instrument (but does not
indicate accuracy).
Precision means repetition of successive readings, but it does not guarantee accuracy; successive
readings may be close to each other, but far from the true value. On the other hand, an accurate
instrument has to be precise also, since successive readings must be close to the true value (that
is unique).
OR
Ans.1 (i) Precision index: When x=0 than y= h
√𝜋
Thus it is clear from equation y depends upon h. The largest the value of h the sharper the curve.
Thus the value of h determines the sharpness of the curve. Since curve depends upon h.
(ii) Probable error: Probable error defines the half-range of an interval about a central point for
the distribution, such that half of the values from the distribution will lie within the interval and
half outside. The Probable error r is given by
r = 0.4769
h.

Ans.2

Ans.3 A thermocouple is a device made by two different wires joined at one end, called junction
end or measuring end. The two wires are called thermo elements or legs of the thermocouple: the
two thermo elements are distinguished as positive and negative ones. The other end of the
thermocouple is called tail end or reference end. The junction end is immersed in the
environment whose temperature T2 has to be measured, which can be for instance the
temperature of a furnace at about 500°C, while the tail end is held at a different temperature T1,
e.g. at ambient temperature. Because of the temperature difference between junction end and tail
end a voltage difference can be measured between the two thermo elements at the tail end: so the
thermocouple is a temperature-voltage transducer. The flow of current due to temperature
difference is called as seeback effect .
Construction or Parts of thermocouple: Thermocouple junction, compensating lead, protecting
well, mill voltmeter.

Following are advantages of Thermocouple type of instruments:
1. The thermocouple type of instruments accurately indicates the root mean square value of
current and voltages irrespective of the waveform. There is a wide varieties of range of
thermocouple instruments are available in the market.
2. Thermocouple type of instruments give very accurate reading even at high frequency,
thus these types of instruments are completely free from frequency errors.
3. The measurement of quantity under these instruments is not affected by stray magnetic
fields.
4. These instruments are known for their high sensitivity.
5. Usually for measuring the low value of current bridge type of arrangement is used i.e.
ranging from 0.5 Amperes to 20 Amperes while for measuring the higher value of current
heater element is required to retain accuracy.
Disadvantages of Thermocouple Type Instruments:
Instead of many advantages these type of instruments posses one disadvantage, The over load
capacity of thermocouple type of instrument is small, even fuse is not able to the heater wire
because heater wire may burn out before the fuse blows out.
OR
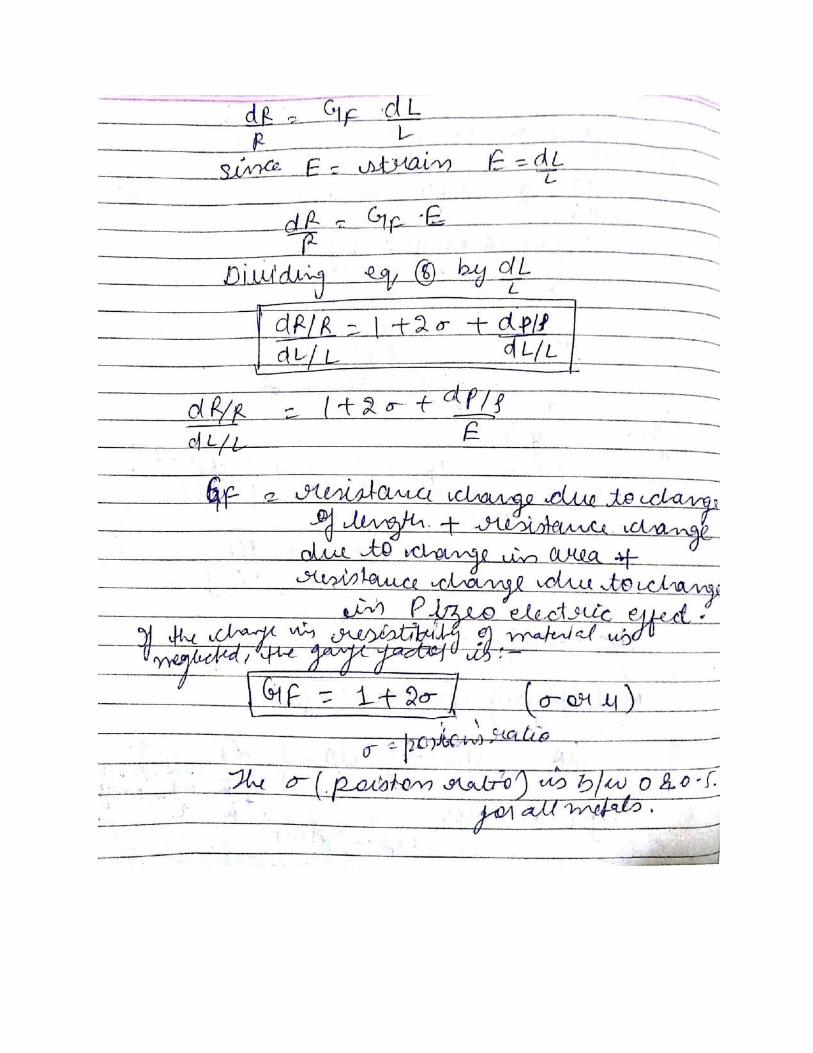
Ans.3 Strain Gauge: A strain gauge is a device used to measure strain on an object. As the
object is deformed, the foil is deformed, causing its electrical resistance to change. This
resistance change, usually measured using a Wheatstone bridge, is related to the strain by the
quantity known as the gauge factor.


Ans.4 RTD:
An RTD (resistance temperature detector) is a temperature sensor that operates on the
measurement principle that a material’s electrical resistance changes with temperature. The
relationship between an RTD’s resistance and the surrounding temperature is highly predictable,
allowing for accurate and consistent temperature measurement. By supplying an RTD with a
constant current and measuring the resulting voltage drop across the resistor,
the RTD’s resistance can be calculated, and the temperature can be determined.

OR

Ans.4 (i) Systematic errors
Systematic errors in experimental observations usually come from the measuring instruments.
They may occur because:
there is something wrong with the instrument or its data handling system, or
Because the instrument is wrongly used by the experimenter.
Two types of systematic error can occur with instruments having a linear response:
1. Offset or zero setting error in which the instrument does not read zero when the quantity
to be measured is zero.
2. Multiplier or scale factor error in which the instrument consistently reads changes in the
quantity to be measured greater or less than the actual changes.
These errors are shown in Fig. 1. Systematic errors also occur with non-linear instruments when
the calibration of the instrument is not known correctly.

Fig. 1. Systematic errors
Examples of systematic errors caused by the wrong use of instruments are:
errors in measurements of temperature due to poor thermal contact between the
thermometer and the substance whose temperature is to be found,
errors in measurements of solar radiation because trees or buildings shade the radiometer.
The accuracy of a measurement is how close the measurement is to the true value of the quantity
being measured. The accuracy of measurements is often reduced by systematic errors, which are
difficult to detect even for experienced research workers.
(ii)Random Errors
Random errors in experimental measurements are caused by unknown and unpredictable changes
in the experiment. These changes may occur in the measuring instruments or in the
environmental conditions.
Examples of causes of random errors are:
electronic noise in the circuit of an electrical instrument,
Irregular changes in the heat loss rate from a solar collector due to changes in the wind.
Random errors often have a Gaussian normal distribution (see Fig. 2). In such cases statistical
methods may be used to analyze the data. The mean m of a number of measurements of the same
quantity is the best estimate of that quantity, and the standard deviation s of the measurements
shows the accuracy of the estimate. The standard error of the estimate m is s/sqrt(n), where n is
the number of measurements.
Fig. 2. The Gaussian normal distribution.

The precision of a measurement is how close a number of measurements of the same quantity
agree with each other. The precision is limited by the random errors. It may usually be
determined by repeating