Embed Size (px)
Citation preview

Right Sizing Tomorrow's Water Systems for Efficiency, Sustainability, & Public Health
Andrew Whelton, Jade Mitchell, Janice Beecher, Joan Rose, Juneseok Lee, Pouyan Nejadhashemi, Erin Dreelin, Tiong Gim Aw, Amisha Shah, Matt Syal, Maryam Salehi
December 14, 2017

The goals of this project are to…
1. Improve the public’s understanding of decreased flow and establish a range of theoretical premise plumbing flow demands from the scientific literature and expert elicitation with our strategic partners
2. Elucidate the factors and their interactions that affect drinking water quality through fate and transport simulation models for residential and commercial buildings
3. Create a risk-based decision support tool to help guide decision makers through the identification of premise plumbing characteristics, operations and maintenance practices that minimize health risks to building inhabitants.

Association PartnersUS Green Building Council
American Society of Plumbing Engrs.National Environmental Health Assoc.
American Water Works AssociationIndiana Rural Water Assoc.Healthy Building Network
Design & Consulting FirmsGordon & Rosenblatt, LLC
Watershed, LLCCoEngineers, LLC
HRC, Inc. Inspectapedia
Science Interactive
Academic PartnersUniv. Cincinnati, USA
Univ. Laval, CANIsrael Technol. Inst., ISRDenmark Tech. U, DEN
Full-Scale Test Sites ReNEWW Home
LEED Platinum Office BldgLEED cert. Middle School
LEED Silver Office BldgRenovated Office Bldg
Government CollaboratorsGenesee Co. Health Dept.
NISTNAVFAC
Army PHC
Innovation Partner: Whirpool Corporation
Obj 1.Synthesis Review
Workshop 1
Obj 2. Field &
PilotStudies,
Modeling
Obj 3. Decision Support
Tool
Workshop 2
Main Objectives
Utility CollaboratorsDekalb County, GA
Desoto Public Utilities, TXJacksonville Naval Hospital
Citizens EnergyPurdue Utilities
Michigan State Utilities

Several full-scale buildings are being studied
21

Core Team
PI Whelton SalehiShah
Mitchell Rose
AboualiNejadhashemiBeecher
Dreelin SyalLee Aw

Our Partners, Supporters, and Participants
Science
Interactive
IRWA
Watershed, LLC

Proposed Schedule of Major Activities
Project awarded Q4 2016QAPP approved Q2 2017

Current Status
Year 1 Overview
1. Bibliography (in annual report)
2. Plumbing safety workshop
3. Field and laboratory work
4. Next steps

Plumbing Safety Research Workshop Aug 23-24, 2017
Investigate Plumbing Safety with a skilled team of microbiologists, risk assessors, data scientists, civil, environmental, and ecological engineers, ecologists, and political scientists. Whirlpool Corporation is our team’s innovation partner. Our research
partners represent plumbing and architectural design companies, nonprofit organizations, trade industry associations, water providers, and health agencies.

Day 1, Time Activity
8:00-8:30 Sign-in
8:30-9:15 Welcome and opening remarks
9:15-10:00 Project overview
9:45-10:45 Identifying challenges: Premise plumbing and water safety
10:45-11:00 Break
11:00-12:00 Identifying challenges: Greatest difference to the future
12:00-1:00 Lunch
1:00-2:15 Prioritizing challenges: Highest priority for action
2:15-2:30 Break
2:30-3:45 Data and Information Needs: Water quality
4:00-4:30 Synthesis
4:30-5:00 Wrap up and next steps
Agenda
Day 2, Time Activity
8:00-8:30 Sign-in
8:30-9:50 Decision Support Tool
9:50-10:05 Break
10:05-11:30 Data and Information Needs: Water Use
11:30-12:00 Next steps

Key Contributions to the Project and Findings
Reviewed and compiled sources of water usage data
Identified data gaps in building types
Received feedback
• Need for integration of standards and codes
• Need for software development
More….
Workshop synthesis document (in preparation)
Better understand technology and information limitations
Exposure variability across building types
Positioned to better interpret results and setup for standards and codes

The ReNEWW House, West Lafayette, Indiana
• Called the ReNEWW House for Retrofitted Net-Zero Energy, Water and Waste
• Whirlpool / Purdue University partnership to retrofit a 1920s vintage home into a net-zero energy, water and zero-waste-to-landfill structure
• Year 1 - Energy Retrofit
• Year 2 - Water Retrofit
• Year 3 (now) - Zero Waste-to-landfill
Courtesy: Whirlpool

The ReNEWW House - Real-World Data
Over 100 channels of Data to the cloud every second = +20 BILLION data
points/yr
Courtesy: Whirlpool

Goal: To better understand link between water use & drinking water quality.
Hypotheses:1. Water quality inside the building influenced by chemical leached by PEX pipes.
2. Fixture usage pattern & water temperature influence organic & bacteria levels in water.
3. Less frequent used fixtures have lower water quality.
ReNNEW HouseNet Zero Energy
Low-flow fixtures3 Bedroom 2.5 bath
PEX plumbing

Residential plumbing is critical for the health and safety of populations worldwide.
5-10 million miles of plumbing Water saving & Low-flow devices
Increased Water Age
Enable contaminant leaching
Disinfectant residual loss
Microorganism proliferation
15
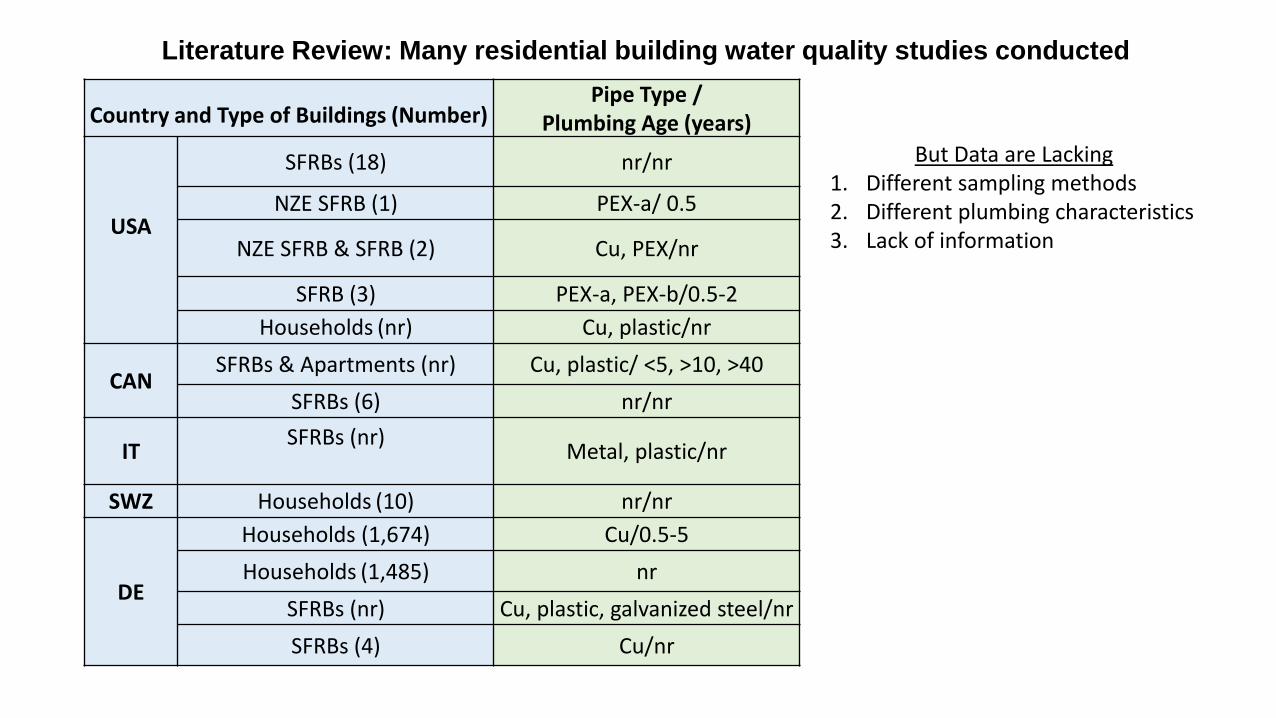
Country and Type of Buildings (Number)Pipe Type /
Plumbing Age (years)
USA
SFRBs (18) nr/nr
NZE SFRB (1) PEX-a/ 0.5
NZE SFRB & SFRB (2) Cu, PEX/nr
SFRB (3) PEX-a, PEX-b/0.5-2
Households (nr) Cu, plastic/nr
CANSFRBs & Apartments (nr) Cu, plastic/ <5, >10, >40
SFRBs (6) nr/nr
ITSFRBs (nr)
Metal, plastic/nr
SWZ Households (10) nr/nr
DE
Households (1,674) Cu/0.5-5
Households (1,485) nr
SFRBs (nr) Cu, plastic, galvanized steel/nr
SFRBs (4) Cu/nr
Literature Review: Many residential building water quality studies conducted
But Data are Lacking1. Different sampling methods2. Different plumbing characteristics3. Lack of information

Water Sampling
Water sampling (cold/hot) on day 3, 15, 30, 60 & 90

Water Quality Monitoring
Chemical Quality: Free chlorine, pH, Alkalinity, Total Organic Carbon (TOC),UV254 absorbance, Metals, Threshold Odor Number (TON)
Bacterial Quality: Culture-based HPC & Culture-independent quantitative real-time PCR (qPCR)
19
Water Softener Heater
Laundry
Kitchen Sink
Bathroom Sink
TOCTOC
TOC PbCu
Zn
TOCTOC
TOC TOC
TOC
TOC
PbCu
Zn
Pb
Cu
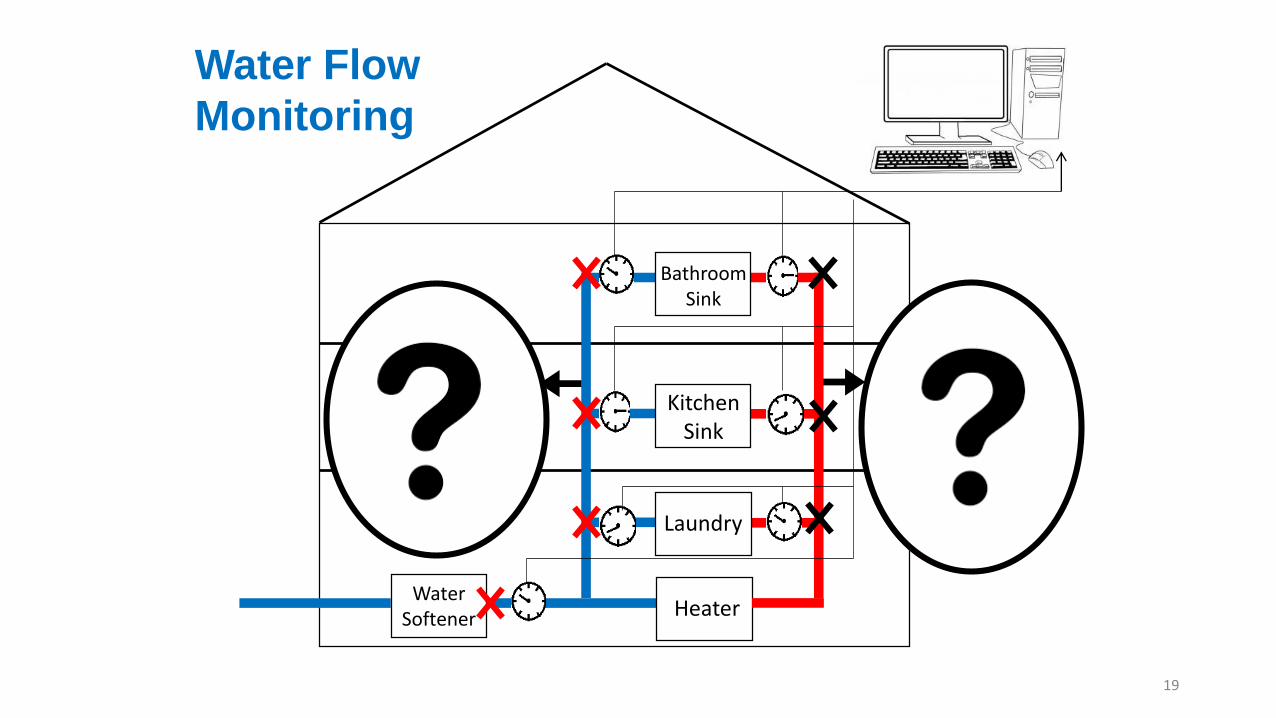
Water Flow
Monitoring

Water Usage Analysis
Elapsed
Time
Since Last
Event
Event Duration
Time (s)
Water Flow (GPS)
64,891,484 data points
20

December Water Use, Month 3
Water
Sampling
Location
Total
Volume of
Water Used,
m3
Number of
Events
Average
Stagnation
Time, hr
Maximum
Stagnation
Time, hr
Service Line 5.2 3535 0.1 72
Basement-Cold 0.4 60 0.5 72
Basement-Hot 0.04 21 0.7 72
1st Floor-Cold 0.3 619 0.6 72
1st Floor-Hot 0.2 389 0.9 72
2nd Floor-Cold 0.1 145 2.0 72
2nd Floor-Hot 1.0 825 0.5 72
Fixture Use: We monitored
water use at 4 locations in a
new green building during
a 3 month period
Salehi et al. 2017.

22
Water Usage Patterns
During October to December the daily water usage
varied between 0.169-0.245 m3/d.
Basement fixture was the least used (number of events
at cold: 60-105, hot: 21-69) compared to the other
fixtures in the building (number of events at cold: 145-
856, hot: 326-2,230).
During October to December the most frequently used
fixture was the 2nd floor hot water (bathroom sink,
number of events per month 2,230).
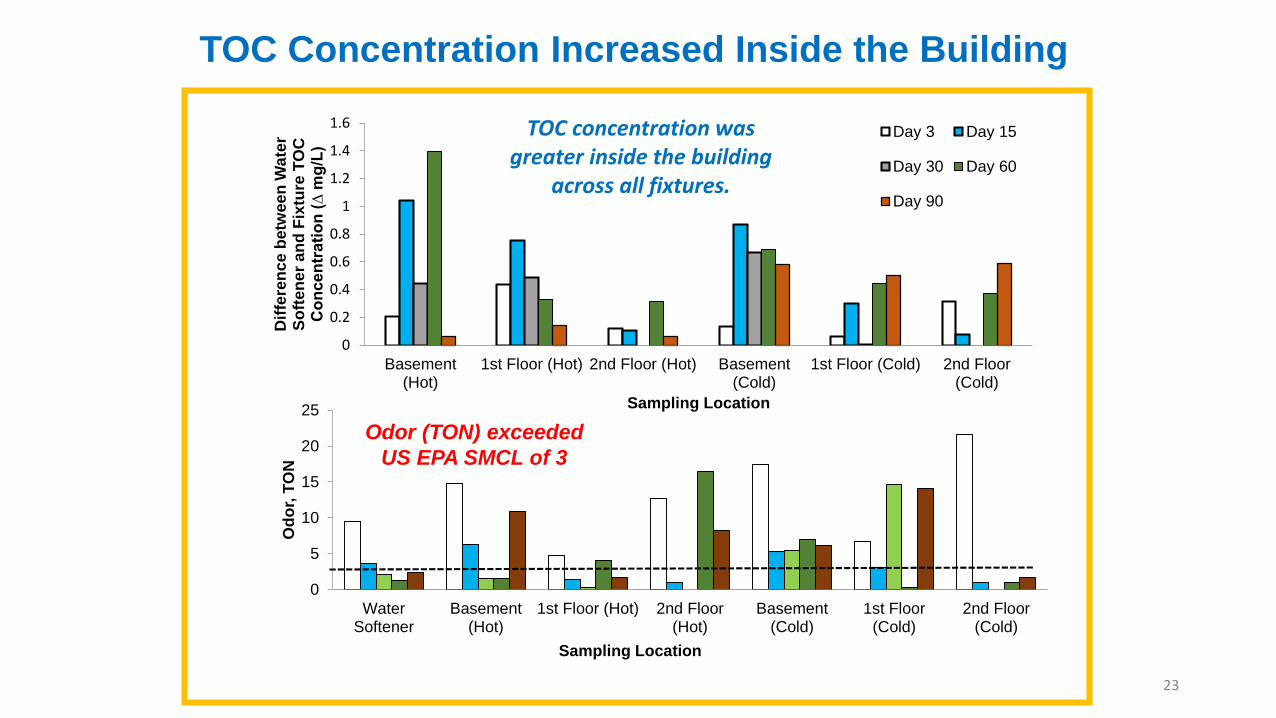
TOC Concentration Increased Inside the Building
0
0.2
0.4
0.6
0.8
1
1.2
1.4
1.6
Basement(Hot)
1st Floor (Hot) 2nd Floor (Hot) Basement(Cold)
1st Floor (Cold) 2nd Floor(Cold)
Dif
fere
nc
e b
etw
ee
n W
ate
r S
oft
en
er
an
d F
ixtu
re T
OC
C
on
ce
ntr
ati
on
(∆
mg
/L)
Sampling Location
Day 3 Day 15
Day 30 Day 60
Day 90
TOC concentration was greater inside the building
across all fixtures.
0
5
10
15
20
25
WaterSoftener
Basement(Hot)
1st Floor (Hot) 2nd Floor(Hot)
Basement(Cold)
1st Floor(Cold)
2nd Floor(Cold)
Od
or,
TO
N
Sampling Location
Odor (TON) exceeded
US EPA SMCL of 3
23

Several Heavy Metals with Health & Aesthetic Limits were Detected
0
5
10
15
20
25
WaterSoftener
Basement(Hot)
1st Floor(Hot)
2nd Floor(Hot)
Basement(Cold)
1st Floor(Cold)
2nd Floor(Cold)
Pb
(µ
g/L
)
US EPA Action Level 15 µg/L
24
Fe concentration exceeded US EPA SMCL of 300 µg/L at Basement Hot
(Day 15).
Mn exceeded its 50 µg/L USEPA SMCL in the basement hot water on day 15.

25
0
1
2
3
4
5
6
7
WaterSoftener
Basement(Hot)
1st Floor(Hot)
2nd Floor(Hot)
Basement(Cold)
1st Floor(Cold)
2nd Floor(Cold)
Zn
Co
nc
en
tra
tio
n (
mg
/L)
Day-3 Day-15 Day-30 Day-60 Day-90US EPA SMCL of 5
mg/L
The basement fixture brass needle valve may have caused maximum
Zn (5.9 mg/L), Fe (4.1 mg/L), and Pb (23 μg/L) levels compared to other
fixture water samples.

Both HPC
levels & Gene
Copy Numbers
Increased at
1st & 2nd Floor
Least
Frequent
Used Fixture
Greatest
HPC
Greatest
Bacteria
Level
Greatest Fe,
Zn and Pb
Levels
Greatest
TOC
Least
Disinfectant
Residual
During the same period, bacteria levels increased with time and bacteria were more numerous in hot water vs. cold water
Salehi et al. 2017.
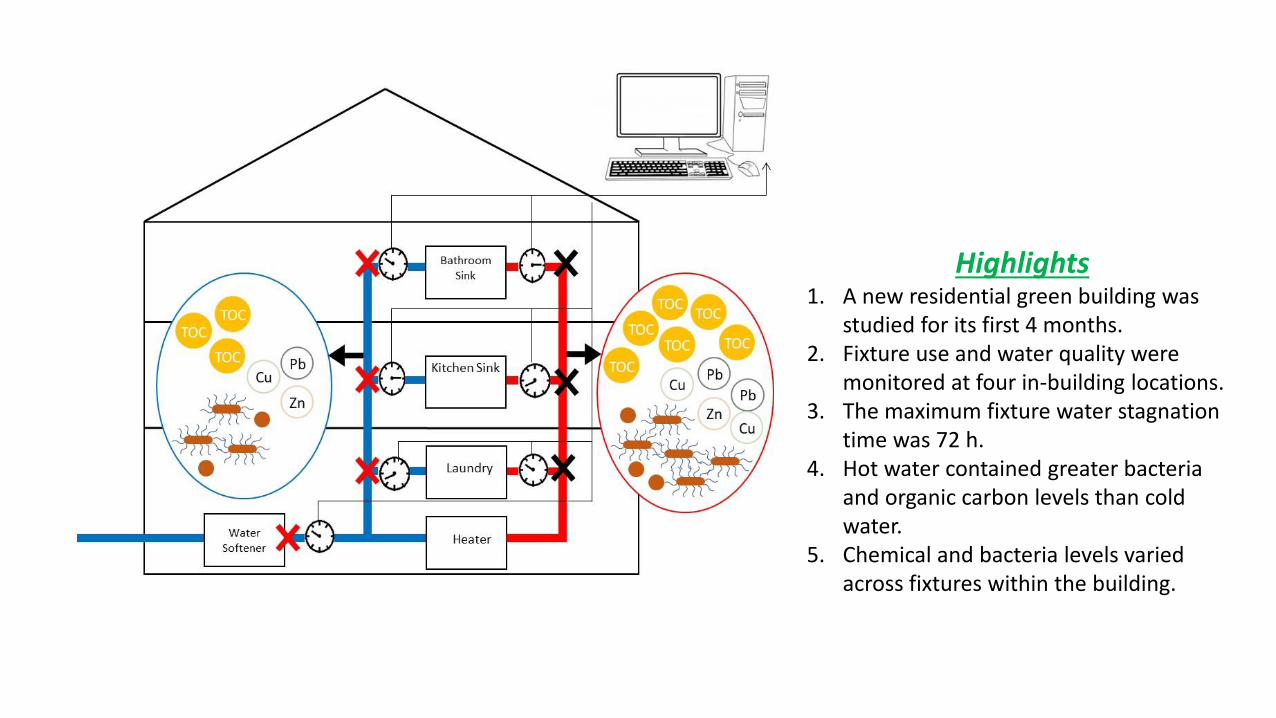
Highlights1. A new residential green building was
studied for its first 4 months.2. Fixture use and water quality were
monitored at four in-building locations.3. The maximum fixture water stagnation
time was 72 h.4. Hot water contained greater bacteria
and organic carbon levels than cold water.
5. Chemical and bacteria levels varied across fixtures within the building.

Summary
The maximum water stagnation time was 72.0 hr.
Bacteria & organic carbon levels increased inside the plumbing system compared to the municipal tap water entering the building.
A greater amount of bacteria was detected in hot water samples compared to cold water samples.
Hot water plumbing promoted greater microbial growth.
At the basement fixture, where the least amount of water use events occurred, greater organic carbon, bacteria, and heavy metal levels were detected.

Pipe Network
Design - pipe
sizes, layout,
fixtures
Water Demand,
Flow and UseTemperature
Chemical and
Microbial
Contaminant
Concentrations
Obj. 2B
EPANET-MSXIntegrative Hydraulic-
Water Quality Models
Water Quality at
each fixture
Water Age –
Stagnation
time/Residence
Time
Water Quality
Parameters
Water pH
Alkalinity
NOM
Disinfectant
Larson Index
Water
Treatment
Process
Well Water
Lake Water
River Water
Metal
Content
Input
Bench
Scale
ExperimentPilot Study
Field Study
Rate Constants
Output
TOC/AOC
Disinfectant
Residual
Metal
Content
Pathogen
Content
By-Products
Model Calibration
Model Benchmark/ Validation
Obj. 2A: FIELD MEASUREMENTS Obj. 1: LITERATURE, PARTNERS, WORKSHOP
Obj. 2B SIMULATIONS – DIFFERENT WATER DEMAND, WATER
QUALITY, HYDRAULIC PRESSURES
Obj. 3A: RISK ASSESSMENT
MODELS
What are the human health risk associated with the measured and predicted
contaminant concentrations?
Which factors (inputs) significantly influence water
quality?
Obj. 2C: WATER
QUALITY MODELS
Input
Ob
j. 3B
: DEC
ISION
SUP
PO
RT TO
OL

Testing at ReNEWWHouse
Microbiology• Legionella spp.
• L. pneumophila
• P. aeruginosa
• Mycobacterium
• E. Coli
• Total coliforms
• HPC
Chemistry• Temperature
• pH
• Disinfectant residual
• DO
• Metals
• TOC/DOC
• AOC
• Alkalinity
• Ions
• DBPs
Physical
• Pressure
• Fixture temperature
• Indoor air temperature
• Flow rate
• # of events
• Event duration
And more…

Gateway to more advanced research related to complex
systems or new knowledge
Advanced analytics, including custom mapping, integrated
index creation, raster calculations, relational mapping,
information communication, basic statistical analysis
Data gathering, integration, and delivery
Knowledge Hierarchy DST Functions
DSTshortens data development time, answers critical questions, and
discovers new relationships
Raw Data
31

Raw Data32
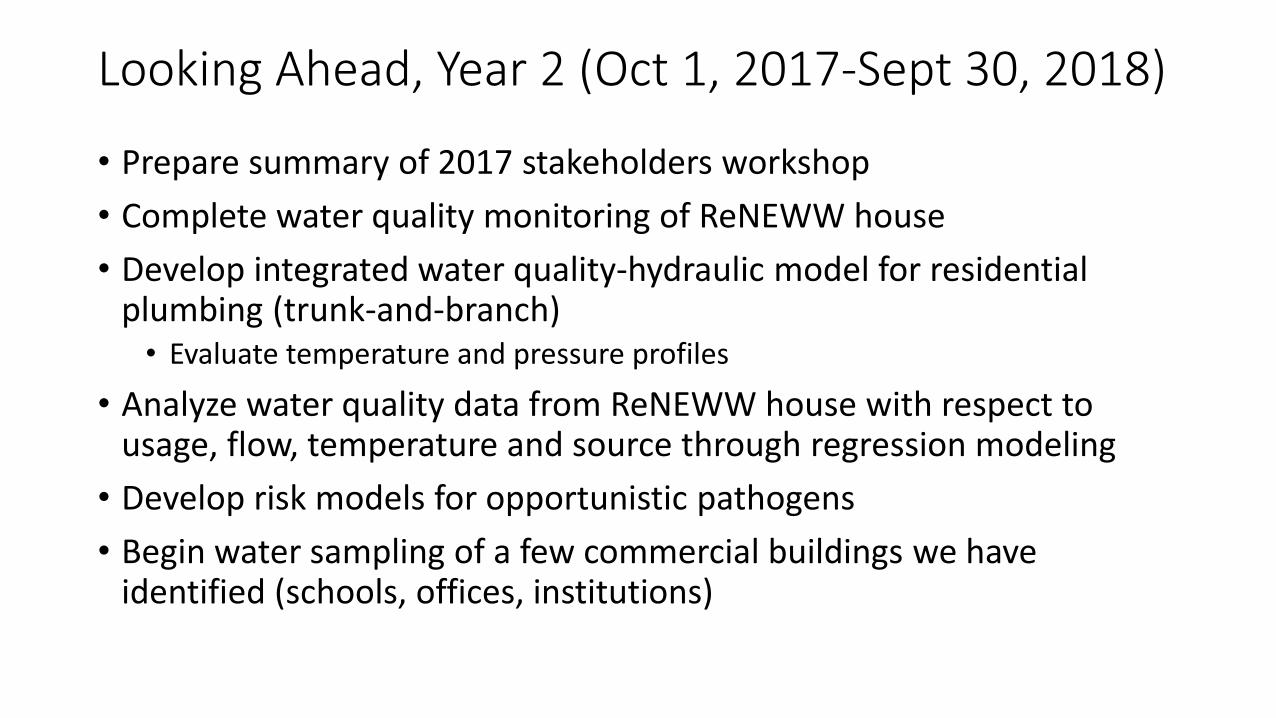
Looking Ahead, Year 2 (Oct 1, 2017-Sept 30, 2018)
• Prepare summary of 2017 stakeholders workshop
• Complete water quality monitoring of ReNEWW house
• Develop integrated water quality-hydraulic model for residential plumbing (trunk-and-branch)• Evaluate temperature and pressure profiles
• Analyze water quality data from ReNEWW house with respect to usage, flow, temperature and source through regression modeling
• Develop risk models for opportunistic pathogens
• Begin water sampling of a few commercial buildings we have identified (schools, offices, institutions)

• Disseminate results to the public and stakeholders✓Society of Risk Analysis Annual Meeting✓Expert drinking water safety panel at the U.S. Green Building Council (USGBC)
GreenBuild Conference
• American Chemical Society Annual Conference, March 2018, Louisiana• American Water Works Association Annual Conference and Exposition• National Environmental Health Association Annual Educational Conference &
Exhibition and HUD Healthy Homes Conference• Emerging Water Technology Symposium sponsored by American Society of
Plumbing Engineers (ASPE), Alliance for Water Efficiency (AWE), International Association of Plumbing and Mechanical Officials (IAPMO), Plumbing Manufacturers International (PMI), and World Plumbing Council (WPC)
Looking Ahead, Year 2 (Oct 1, 2017-Sept 30, 2018)

Right Sizing Tomorrow's Water Systems for Efficiency, Sustainability, & Public Health
Andrew Whelton (PI), Jade Mitchell, Janice Beecher, Joan Rose, Juneseok Lee, Pouyan Nejadhashemi, Erin Dreelin, Tiong Gim Aw, Amisha Shah, Matt Syal, Maryam Salehi
Learn more at www.PlumbingSafety.org
Andrew Whelton, Ph.D. Jade Mitchell, [email protected] [email protected]