Embed Size (px)
Citation preview
Right to Food Assessment
Philippines
3
2
1Causes of HungerA Profile of Hunger and Analysis of its Causes

Right to Food Assessment
Philippines
The study was developed by APPC for Food and Agriculture Organization for the project “Developing methods and instruments to implement the right to food” funded by the Government of Germany. The study team is composed of Carlos O. Abad-Santos, Rosemarie G. Edillon, Sharon Faye A. Piza, Virgilio del os Reyes and Maria Socorro I. Diokno. The team acknowledges the valuable inputs and comments given during the Right to Food Workshop held last September 3-4, 2008 where an initial draft of this study was presented. They are also grateful to the excellent research assistance of Regina Baroma, Donna Mae Odra, Sharon Fangonon and Francis Alan Piza. The analyses, views, and opinions presented herein are those of the authors and should not be represented as those of either FAO or APPC.
1Causes of HungerA Profile of Hunger and Analysis of its Causes
Carlos O. Abad SantosRosemarie G. EdillonSharon Faye A. Piza
grap
hic d
esig
ner:
Dan
iela
Ver
ona

iiiCauses of Hunger
�� Table�of�Content
� Rationale�and�Objectives� 1� Objectives Component 1: Causes of Hunger 2
� � 1.1�Monitoring�Hunger 3 Incidence of Hunger in the Philippines Comparing qualitative and quantitative measures of hunger 5
� � 1.2�Profiling�Hunger� 6 � Time dimension Space dimension 7
� � 1.3�Underlying�Causes�of�Hunger 14 � Analytical Framework The Model 16 Comparing the Hungry vs Non-Hungry 20 Comparing the Hungry Poor vs Non-Hungry Poor 23 Comparing the Hungry Nonpoor vs Non-Hungry Nonpoor 27 Comparing the Hungry Poor vs Hungry Non-Poor 32
� � 1.4�Concluding�Remarks 35
� � Annex�A:�Hunger Incidence by Province, 2006� 36

1Causes of Hunger
�� Rationale�and�ObjectivesThe Government of the Philippines (GOP), through the National Anti-Poverty Commission is speeding up its efforts
to address the issue of hunger and food insecurity in the Philippines. The main avenue to consolidate all efforts against hunger and food insecurity is the Accelerated Hunger Mitigation Program (AHMP). Discussions by FAO with Philippine government officials indicate that there is a need to enhance the AHMP to ensure that interventions are appropriate and that these interventions are geared toward the population groups that need them the most.
The GOP is also a party to the International Covenant on Economic, Social and Cultural Rights (ICESCR) that obligates it to recognize the right of every Filipino to an adequate standard of living including food, clothing and housing. The covenant recognizes the fundamental right of everyone to be free from hunger. This implies enabling individuals to produce or procure adequate quantities and quality of food for an active and healthy life. This is consistent with a human rights-based approach to development that empowers individuals and civil society to participate in decision-making, to claim their rights and to demand recourse, by holding public officials and governments accountable for their programs and policies.
The entirety of Government policies and programs should build an enabling environment that ensures that individuals can feed themselves. A clear and unambiguous legal framework will provide the necessary enabling environment to ensure that legal and institutional mechanisms are in place to support efforts toward the mitigation and eventual eradication of hunger in the country. An assessment of the policy framework will reveal the extent to which policies, strategies and programs are conducive to progressively realizing the right to adequate food and whether the policy framework responds to the underlying and root causes of the non-realization of the right to adequate food.
The FAO has responded to this concern by highlighting the agenda for food security and the right to food. It has initiated efforts to examine the various issues related to food insecurity in the Philippines and to arrive at recommendations grounded on sound policy research and analysis. In line with this, it has commissioned the Asia-Pacific Policy Center to a Right to Food Assessment. The assessment will include an analysis of the anatomy of hunger in the Philippines, including the causes and socio-economic characteristics of the hungry, an assessment of the legal framework on the right to food, and a review of the government’s safety nets and social protection policies and programs related to the population’s right to adequate food.
ObjectivesThe general objective of the assessment is to provide analytical support to the Philippine Government in its efforts
to mitigate the incidence of hunger in the country and to address the underlying causes of food insecurity in the Philippines.
Specifically, the study will:
1. Identify the socio-economic characteristics of the hungry in the country;
2. Analyze the root causes of food insecurity and hunger in the Philippines;
3. Assess the legal framework on the right to food;
4. Assess the government’s safety nets and social protection programs.
Item 1 will enhance the Government’s efforts to provide direct assistance to those in need, through better design and targeting of its interventions. Items 2, 3 and 4 will inform policy and institutional reform measures to reduce hunger and improve the prospects of food security in the country.

2 Right to Food Assessment Philippines 1
Component�1:�Causes�of�HungerThe Voluntary Guidelines on the Progressive Realization of the Right to Adequate Food in the Context of National
Food Security (VG) emphasize that the design of policies to achieve the right to food should begin with identifying the hungry and understanding the reasons for their food insecurity.
There are currently many difficulties in identifying the hungry and analyzing the causes of hunger in the Philippines. Sufficient data to identify and characterize food insecure and vulnerable groups may not always be available or, more often, may not be adequately analyzed for this purpose.
Component 1 covers the first two items stated above. In particular,
1. Monitoring the hungry and food insecure. The status of hunger in the country, particularly the incidence of hunger and food insecurity based on various data sources. It will present comparisons between the different measures of hunger.
2. Profiling the hungry and the food insecure. A profile of the hungry and food insecure which include geographic/locational characteristics, demographic characteristics, and socio-economic characteristics. This will be important in targeting the hungry and food insecure. It is likewise an important input in the conduct of causality analysis on the causes of hunger.
3. Identifying the causes of hunger and food insecurity. The causes of hunger and food insecurity must be clearly understood by those who formulate policies and implement programs. This will be done using the extensive data sets on hunger and other related variables.
The analysis and conclusions drawn from the abovementioned sub-study areas will provide the basis for coming up with specific recommendations on the following:
1. Information and data requirements to properly identify the hungry and food insecure (including a hunger indicators survey)
2. Targeting and enhancement of the Accelerated Hunger Mitigation Program.
3Causes of Hunger
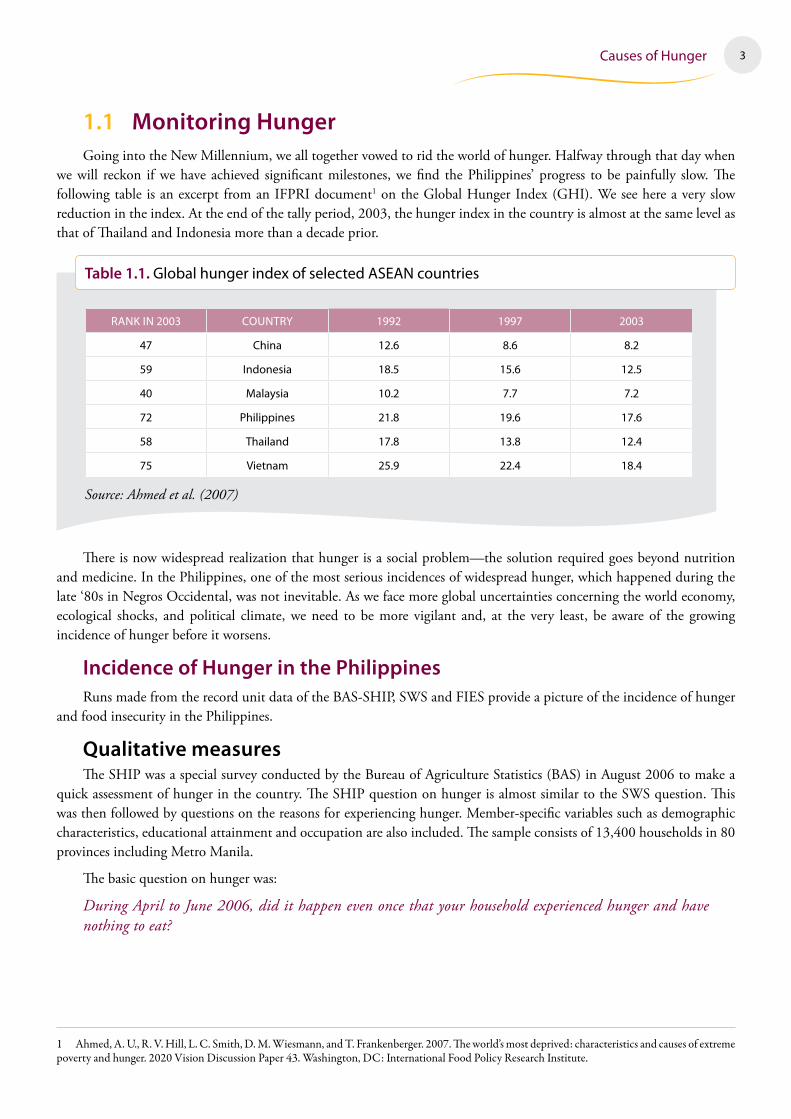
1.1� Monitoring�Hunger�Going into the New Millennium, we all together vowed to rid the world of hunger. Halfway through that day when
we will reckon if we have achieved significant milestones, we find the Philippines’ progress to be painfully slow. The following table is an excerpt from an IFPRI document1 on the Global Hunger Index (GHI). We see here a very slow reduction in the index. At the end of the tally period, 2003, the hunger index in the country is almost at the same level as that of Thailand and Indonesia more than a decade prior.
Table�1.1.�Global hunger index of selected ASEAN countries
RANk IN 2003 COUNTRY 1992 1997 2003
47 China 12 6 8 6 8 2
59 Indonesia 18 5 15 6 12 5
40 Malaysia 10 2 7 7 7 2
72 Philippines 21 8 19 6 17 6
58 Thailand 17 8 13 8 12 4
75 Vietnam 25 9 22 4 18 4
Source: Ahmed et al. (2007)
There is now widespread realization that hunger is a social problem—the solution required goes beyond nutrition and medicine. In the Philippines, one of the most serious incidences of widespread hunger, which happened during the late ‘80s in Negros Occidental, was not inevitable. As we face more global uncertainties concerning the world economy, ecological shocks, and political climate, we need to be more vigilant and, at the very least, be aware of the growing incidence of hunger before it worsens.
Incidence�of�Hunger�in�the�PhilippinesRuns made from the record unit data of the BAS-SHIP, SWS and FIES provide a picture of the incidence of hunger
and food insecurity in the Philippines.
Qualitative�measures�The SHIP was a special survey conducted by the Bureau of Agriculture Statistics (BAS) in August 2006 to make a
quick assessment of hunger in the country. The SHIP question on hunger is almost similar to the SWS question. This was then followed by questions on the reasons for experiencing hunger. Member-specific variables such as demographic characteristics, educational attainment and occupation are also included. The sample consists of 13,400 households in 80 provinces including Metro Manila.
The basic question on hunger was:
During April to June 2006, did it happen even once that your household experienced hunger and have nothing to eat?
1 Ahmed,A.U.,R.V.Hill,L.C.Smith,D.M.Wiesmann,andT.Frankenberger.2007.Theworld’smostdeprived:characteristicsandcausesofextremepovertyandhunger.2020VisionDiscussionPaper43.Washington,DC:InternationalFoodPolicyResearchInstitute.
4 Right to Food Assessment Philippines 1
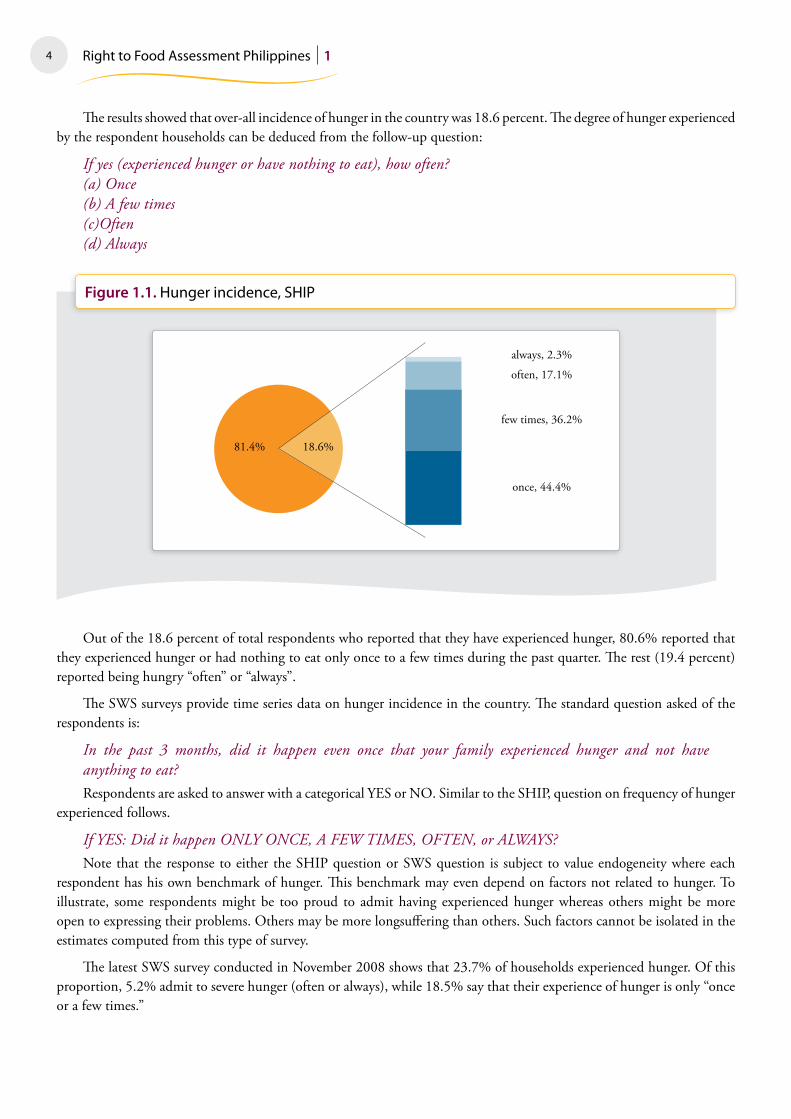
The results showed that over-all incidence of hunger in the country was 18.6 percent. The degree of hunger experienced by the respondent households can be deduced from the follow-up question:
If yes (experienced hunger or have nothing to eat), how often? (a) Once(b) A few times(c)Often(d) Always
Figure�1.1.�Hunger incidence, SHIP
always, 2.3%
few times, 36.2%
often, 17.1%
once, 44.4%
81.4% 18.6%
Out of the 18.6 percent of total respondents who reported that they have experienced hunger, 80.6% reported that they experienced hunger or had nothing to eat only once to a few times during the past quarter. The rest (19.4 percent) reported being hungry “often” or “always”.
The SWS surveys provide time series data on hunger incidence in the country. The standard question asked of the respondents is:
In the past 3 months, did it happen even once that your family experienced hunger and not have anything to eat? Respondents are asked to answer with a categorical YES or NO. Similar to the SHIP, question on frequency of hunger
experienced follows.
If YES: Did it happen ONLY ONCE, A FEW TIMES, OFTEN, or ALWAYS?Note that the response to either the SHIP question or SWS question is subject to value endogeneity where each
respondent has his own benchmark of hunger. This benchmark may even depend on factors not related to hunger. To illustrate, some respondents might be too proud to admit having experienced hunger whereas others might be more open to expressing their problems. Others may be more longsuffering than others. Such factors cannot be isolated in the estimates computed from this type of survey.
The latest SWS survey conducted in November 2008 shows that 23.7% of households experienced hunger. Of this proportion, 5.2% admit to severe hunger (often or always), while 18.5% say that their experience of hunger is only “once or a few times.”
5Causes of Hunger
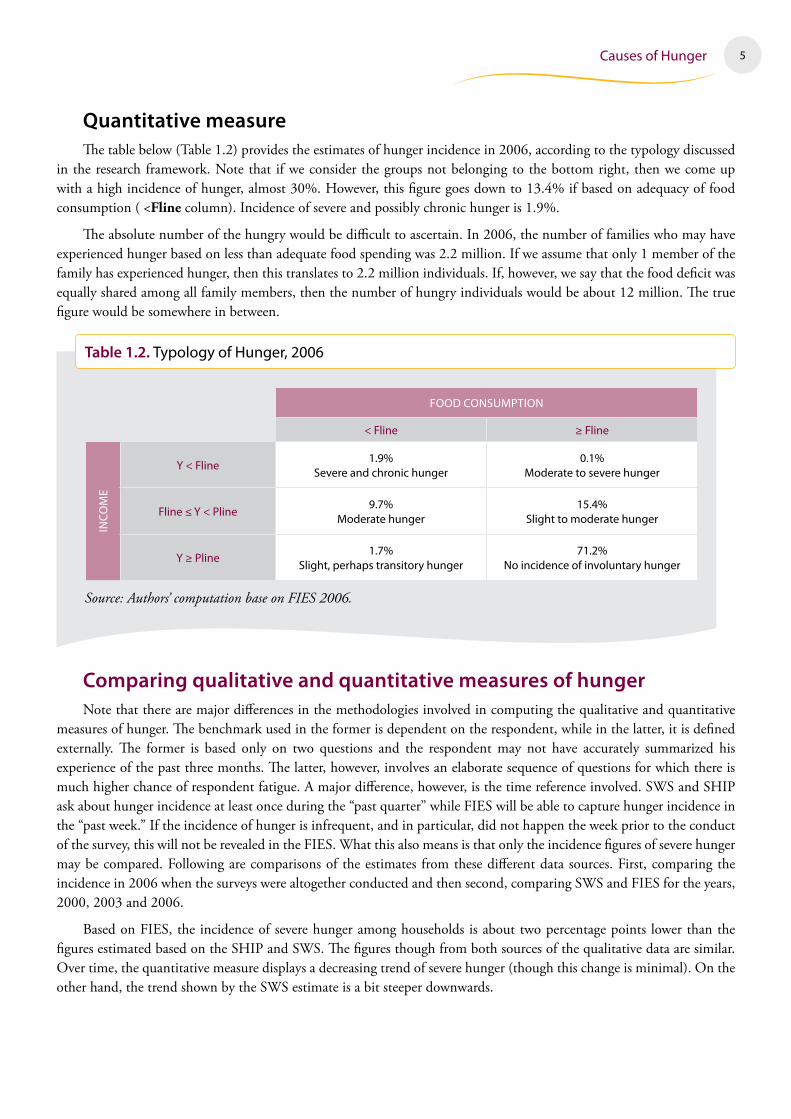
Quantitative�measure�The table below (Table 1.2) provides the estimates of hunger incidence in 2006, according to the typology discussed
in the research framework. Note that if we consider the groups not belonging to the bottom right, then we come up with a high incidence of hunger, almost 30%. However, this figure goes down to 13.4% if based on adequacy of food consumption ( <Fline column). Incidence of severe and possibly chronic hunger is 1.9%.
The absolute number of the hungry would be difficult to ascertain. In 2006, the number of families who may have experienced hunger based on less than adequate food spending was 2.2 million. If we assume that only 1 member of the family has experienced hunger, then this translates to 2.2 million individuals. If, however, we say that the food deficit was equally shared among all family members, then the number of hungry individuals would be about 12 million. The true figure would be somewhere in between.
Table�1.2.�Typology of Hunger, 2006
FOOd CONSUMPTION
< Fline ≥ Fline
INCO
ME
Y < Fline1 9%
Severe and chronic hunger0 1%
Moderate to severe hunger
Fline ≤ Y < Pline9 7%
Moderate hunger15 4%
Slight to moderate hunger
Y ≥ Pline1 7%
Slight, perhaps transitory hunger71 2%
No incidence of involuntary hunger
Source: Authors’ computation base on FIES 2006.
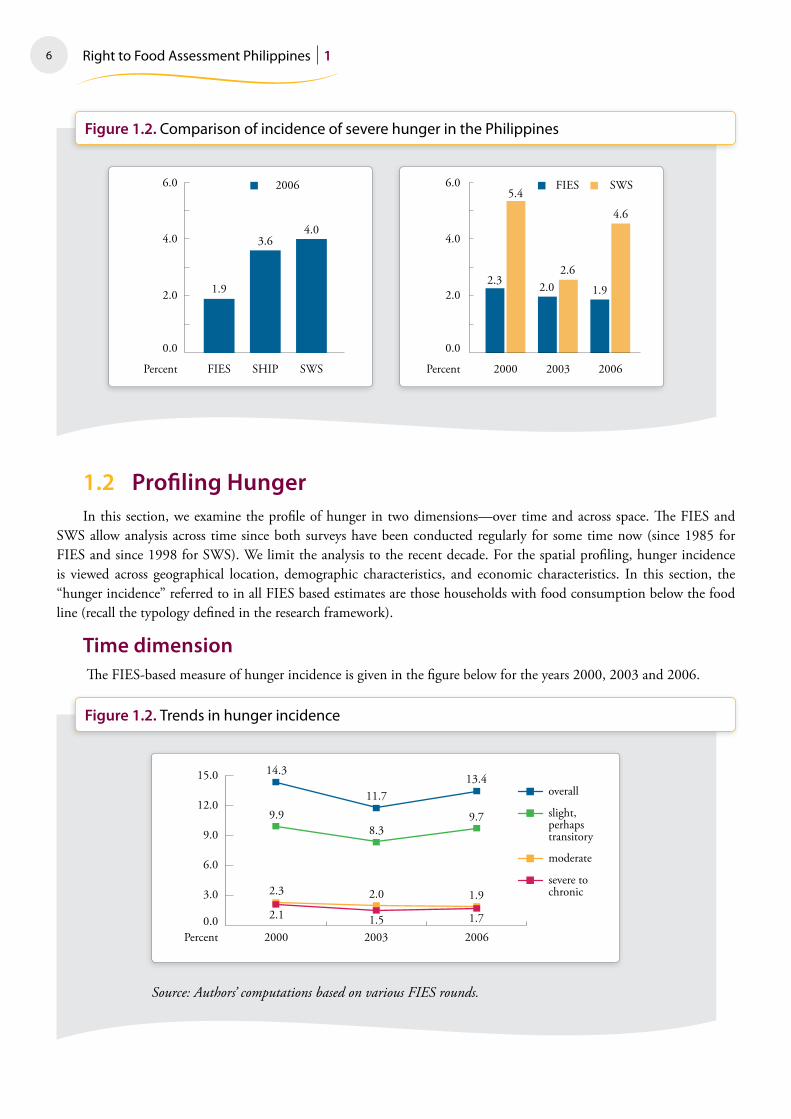
Comparing�qualitative�and�quantitative�measures�of�hunger�Note that there are major differences in the methodologies involved in computing the qualitative and quantitative
measures of hunger. The benchmark used in the former is dependent on the respondent, while in the latter, it is defined externally. The former is based only on two questions and the respondent may not have accurately summarized his experience of the past three months. The latter, however, involves an elaborate sequence of questions for which there is much higher chance of respondent fatigue. A major difference, however, is the time reference involved. SWS and SHIP ask about hunger incidence at least once during the “past quarter” while FIES will be able to capture hunger incidence in the “past week.” If the incidence of hunger is infrequent, and in particular, did not happen the week prior to the conduct of the survey, this will not be revealed in the FIES. What this also means is that only the incidence figures of severe hunger may be compared. Following are comparisons of the estimates from these different data sources. First, comparing the incidence in 2006 when the surveys were altogether conducted and then second, comparing SWS and FIES for the years, 2000, 2003 and 2006.
Based on FIES, the incidence of severe hunger among households is about two percentage points lower than the figures estimated based on the SHIP and SWS. The figures though from both sources of the qualitative data are similar. Over time, the quantitative measure displays a decreasing trend of severe hunger (though this change is minimal). On the other hand, the trend shown by the SWS estimate is a bit steeper downwards.
6 Right to Food Assessment Philippines 1
Figure�1.2.�Comparison of incidence of severe hunger in the Philippines
2006
Percent
0.0
2.0
4.0
6.0
Percent
0.0
2.0
4.0
6.0 FIES
FIES
1.92.3 2.0 1.9
2000
SWS
SHIP
3.6
5.4
2.6
4.6
2003SWS
4.0
2006
1.2� Profiling�HungerIn this section, we examine the profile of hunger in two dimensions—over time and across space. The FIES and
SWS allow analysis across time since both surveys have been conducted regularly for some time now (since 1985 for FIES and since 1998 for SWS). We limit the analysis to the recent decade. For the spatial profiling, hunger incidence is viewed across geographical location, demographic characteristics, and economic characteristics. In this section, the “hunger incidence” referred to in all FIES based estimates are those households with food consumption below the food line (recall the typology defined in the research framework).
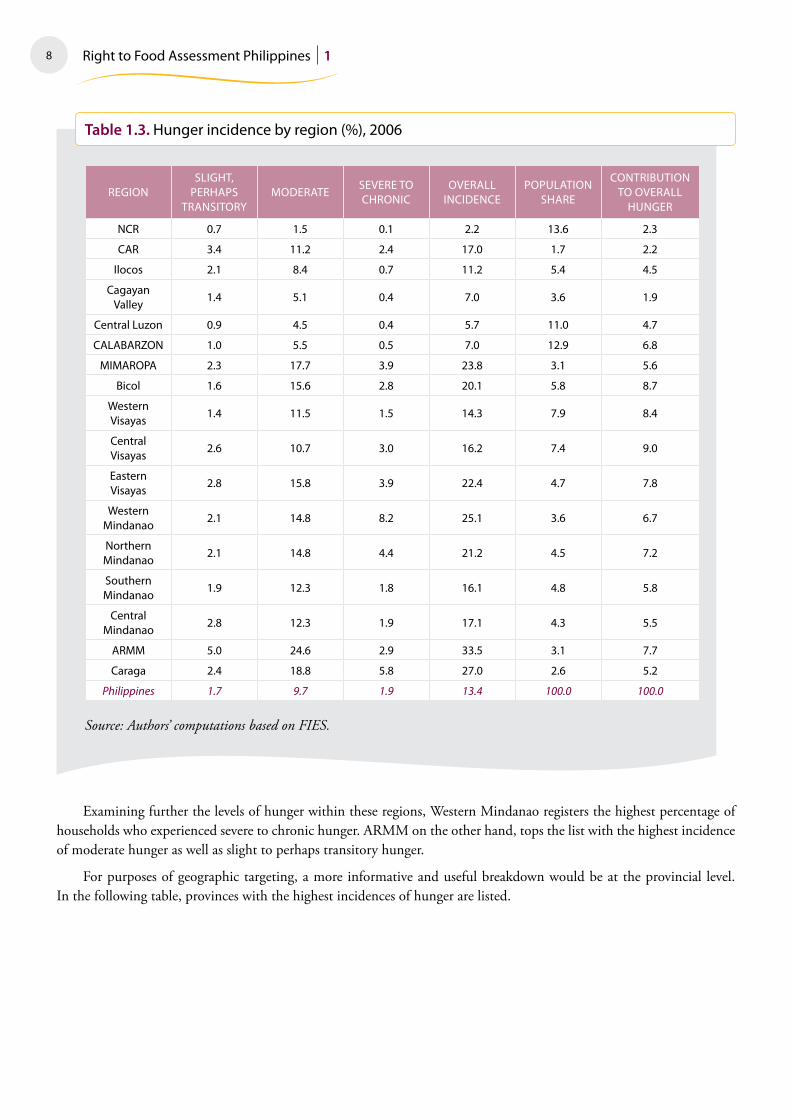
Time�dimension The FIES-based measure of hunger incidence is given in the figure below for the years 2000, 2003 and 2006.
Figure�1.2.�Trends in hunger incidence
2000 2003 20060.0
3.0
6.0
9.0
12.0
15.0 14.3
9.9
2.3
2.1
11.7
8.3
2.0
1.5
13.4
9.7
1.9
1.7
Percent
Source: Authors’ computations based on various FIES rounds.
overall
slight, perhaps transitory
moderate
severe to chronic

7Causes of Hunger
In 2000, we estimate that 14% of households experienced hunger ranging from slight, perhaps transitory to severe and chronic hunger. More than 2% of households experienced severe and chronic hunger. The situation improved in 2003, where the hunger incidence decreased to 11.7%; although improvement in severe and chronic hunger incidence was only slight, down to 2%. In 2006, the situation worsened again; hunger incidence increased to 13.4%; moderate hunger, 9.7%. Note that the worsening of the hunger incidence between 2003 and 2006 is not due to an increase in the incidence of severe and chronic hunger. This figure has in fact declining, albeit very slowly. It is actually the incidence of slight, perhaps transitory and moderate hunger that have increased.
The SWS time series data, meanwhile is longer. Following is the graph:
Figure�3.�Trends in self-rated hunger
Source: Authors’ computations based on various SWS rounds.
Percent
0.0
4.0
8.0
12.0
16.0
20.0
2006Q1 Q2 Q3 Q4
2005Q1 Q2 Q3 Q4
2004Q1 Q2 Q3 Q4
2003Q1 Q2 Q3 Q4
2002Q1 Q2 Q3 Q4
2001Q1 Q2 Q3 Q4
2000Q1 Q2 Q3 Q4
1999Q1 Q2 Q3 Q4
Some patterns emerged from plotting the quarterly incidence of hunger using the SWS data. From 1999 to 2002, the general trend shows hunger incidence increasing during the 4th, 1st and 2nd quarters, followed by a correction in the third quarter. The correction however is not adequate to bring back hunger to the same level as the previous year. Thus, the increasing trend observed over time. The pattern shifts in the latter part of 2002, where we see a downward trend over several quarters. Unfortunately we see a reversal of this trend starting 2004. There is an increasing trend of hunger incidence, but this time on a higher level.
Space�dimensionThe FIES is a very rich source of information. It allows finer disaggregation of hunger incidence to different population
sub-groupings that are useful to policy makers particularly in program design and implementation. For this subsection, estimates on hunger are calculated from the most recent FIES survey collected in 2006.
By�geographical�locationThree Mindanao regions register the highest incidence of hunger—ARMM, Caraga and Western Mindanao. However,
if we consider population share, the Visayas regions and Bicol region contribute at least 8% each to overall hunger. ARMM would only come fifth in the list. On the other hand, the National Capital Region and its surrounding regions (Central Luzon and CALABARZON) have the least incidence. The other region with lowest hunger incidence is Cagayan Valley. This is easily expected since these regions are food production centers particularly Central Luzon and Cagayan Valley.
8 Right to Food Assessment Philippines 1
Table�1.3.�Hunger incidence by region (%), 2006
REGIONSlIGHT,
PERHAPS TRANSITORY
MOdERATESEVERE TO CHRONIC
OVERAll INCIdENCE
POPUlATION SHARE
CONTRIbUTION TO OVERAll
HUNGER
NCR 0 7 1 5 0 1 2 2 13 6 2 3
CAR 3 4 11 2 2 4 17 0 1 7 2 2
Ilocos 2 1 8 4 0 7 11 2 5 4 4 5
Cagayan Valley
1 4 5 1 0 4 7 0 3 6 1 9
Central luzon 0 9 4 5 0 4 5 7 11 0 4 7
CAlAbARZON 1 0 5 5 0 5 7 0 12 9 6 8
MIMAROPA 2 3 17 7 3 9 23 8 3 1 5 6
bicol 1 6 15 6 2 8 20 1 5 8 8 7
Western Visayas
1 4 11 5 1 5 14 3 7 9 8 4
Central Visayas
2 6 10 7 3 0 16 2 7 4 9 0
Eastern Visayas
2 8 15 8 3 9 22 4 4 7 7 8
Western Mindanao
2 1 14 8 8 2 25 1 3 6 6 7
Northern Mindanao
2 1 14 8 4 4 21 2 4 5 7 2
Southern Mindanao
1 9 12 3 1 8 16 1 4 8 5 8
Central Mindanao
2 8 12 3 1 9 17 1 4 3 5 5
ARMM 5 0 24 6 2 9 33 5 3 1 7 7
Caraga 2 4 18 8 5 8 27 0 2 6 5 2
Philippines 1.7 9.7 1.9 13.4 100.0 100.0
Source: Authors’ computations based on FIES.
Examining further the levels of hunger within these regions, Western Mindanao registers the highest percentage of households who experienced severe to chronic hunger. ARMM on the other hand, tops the list with the highest incidence of moderate hunger as well as slight to perhaps transitory hunger.
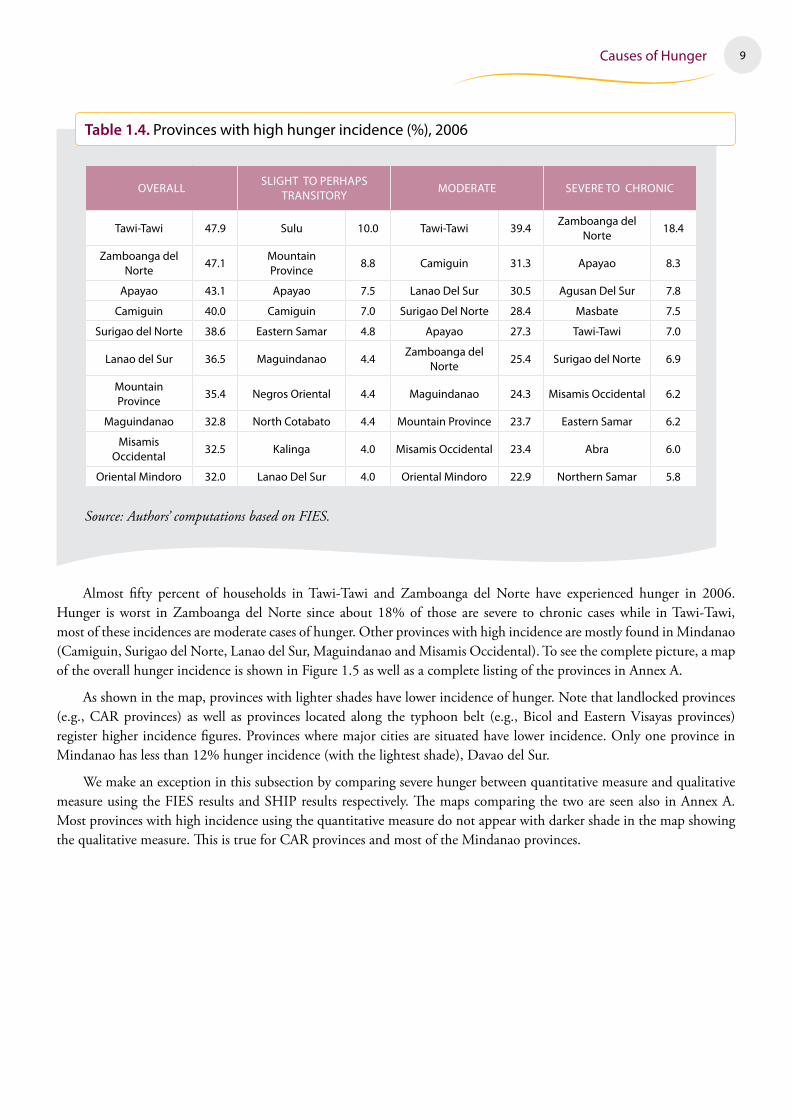
For purposes of geographic targeting, a more informative and useful breakdown would be at the provincial level. In the following table, provinces with the highest incidences of hunger are listed.
9Causes of Hunger
Table�1.4.�Provinces with high hunger incidence (%), 2006
OVERAllSlIGHT TO PERHAPS
TRANSITORYMOdERATE SEVERE TO CHRONIC
Tawi-Tawi 47 9 Sulu 10 0 Tawi-Tawi 39 4Zamboanga del
Norte 18 4
Zamboanga del Norte
47 1Mountain Province
8 8 Camiguin 31 3 Apayao 8 3
Apayao 43 1 Apayao 7 5 lanao del Sur 30 5 Agusan del Sur 7 8
Camiguin 40 0 Camiguin 7 0 Surigao del Norte 28 4 Masbate 7 5
Surigao del Norte 38 6 Eastern Samar 4 8 Apayao 27 3 Tawi-Tawi 7 0
lanao del Sur 36 5 Maguindanao 4 4Zamboanga del
Norte 25 4 Surigao del Norte 6 9
Mountain Province
35 4 Negros Oriental 4 4 Maguindanao 24 3 Misamis Occidental 6 2
Maguindanao 32 8 North Cotabato 4 4 Mountain Province 23 7 Eastern Samar 6 2
Misamis Occidental
32 5 kalinga 4 0 Misamis Occidental 23 4 Abra 6 0
Oriental Mindoro 32 0 lanao del Sur 4 0 Oriental Mindoro 22 9 Northern Samar 5 8
Source: Authors’ computations based on FIES.
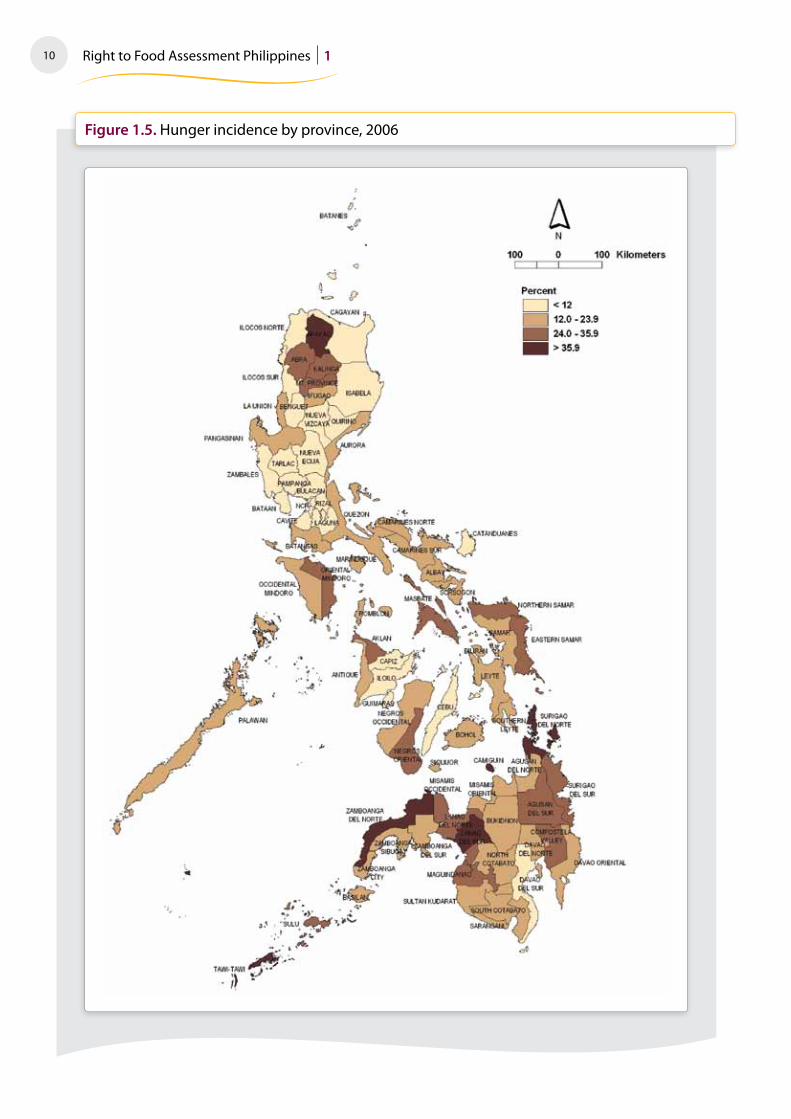
Almost fifty percent of households in Tawi-Tawi and Zamboanga del Norte have experienced hunger in 2006. Hunger is worst in Zamboanga del Norte since about 18% of those are severe to chronic cases while in Tawi-Tawi, most of these incidences are moderate cases of hunger. Other provinces with high incidence are mostly found in Mindanao (Camiguin, Surigao del Norte, Lanao del Sur, Maguindanao and Misamis Occidental). To see the complete picture, a map of the overall hunger incidence is shown in Figure 1.5 as well as a complete listing of the provinces in Annex A.
As shown in the map, provinces with lighter shades have lower incidence of hunger. Note that landlocked provinces (e.g., CAR provinces) as well as provinces located along the typhoon belt (e.g., Bicol and Eastern Visayas provinces) register higher incidence figures. Provinces where major cities are situated have lower incidence. Only one province in Mindanao has less than 12% hunger incidence (with the lightest shade), Davao del Sur.
We make an exception in this subsection by comparing severe hunger between quantitative measure and qualitative measure using the FIES results and SHIP results respectively. The maps comparing the two are seen also in Annex A. Most provinces with high incidence using the quantitative measure do not appear with darker shade in the map showing the qualitative measure. This is true for CAR provinces and most of the Mindanao provinces.
10 Right to Food Assessment Philippines 1
Figure�1.5.�Hunger incidence by province, 2006
11Causes of Hunger
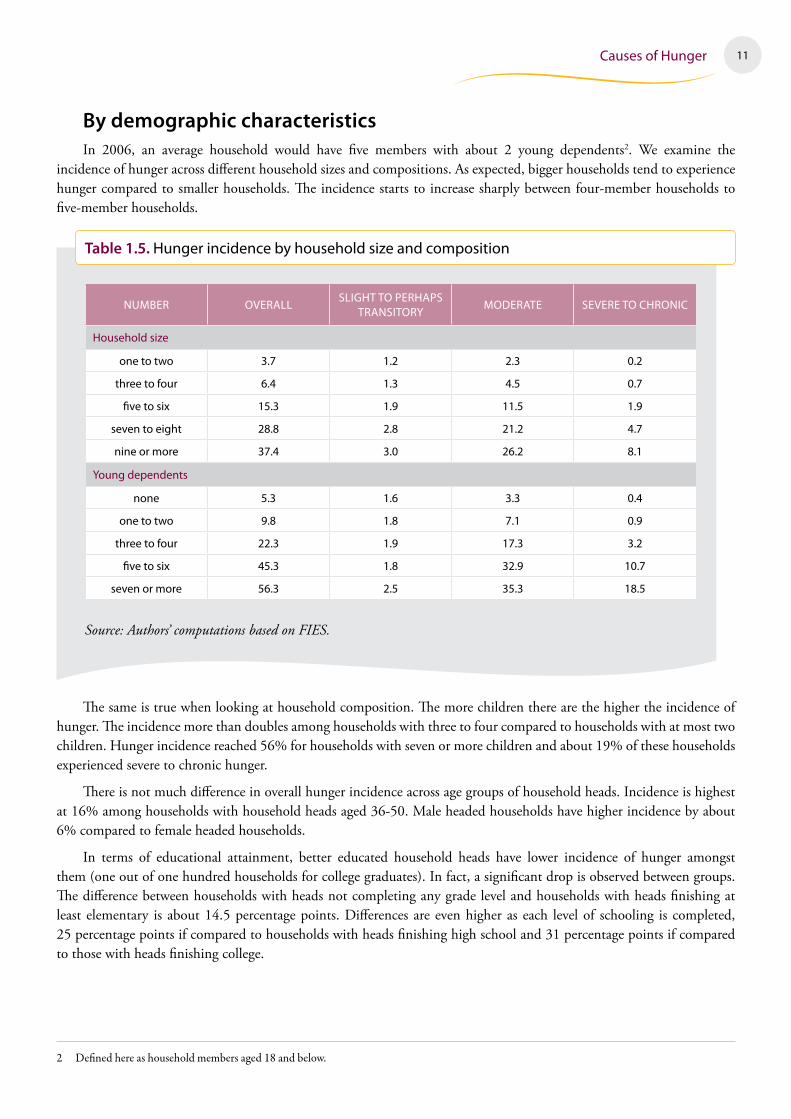
By�demographic�characteristicsIn 2006, an average household would have five members with about 2 young dependents2. We examine the
incidence of hunger across different household sizes and compositions. As expected, bigger households tend to experience hunger compared to smaller households. The incidence starts to increase sharply between four-member households to five-member households.
Table�1.5.�Hunger incidence by household size and composition
NUMbER OVERAllSlIGHT TO PERHAPS
TRANSITORYMOdERATE SEVERE TO CHRONIC
Household size
one to two 3 7 1 2 2 3 0 2
three to four 6 4 1 3 4 5 0 7
five to six 15 3 1 9 11 5 1 9
seven to eight 28 8 2 8 21 2 4 7
nine or more 37 4 3 0 26 2 8 1
Young dependents
none 5 3 1 6 3 3 0 4
one to two 9 8 1 8 7 1 0 9
three to four 22 3 1 9 17 3 3 2
five to six 45 3 1 8 32 9 10 7
seven or more 56 3 2 5 35 3 18 5
Source: Authors’ computations based on FIES.
The same is true when looking at household composition. The more children there are the higher the incidence of hunger. The incidence more than doubles among households with three to four compared to households with at most two children. Hunger incidence reached 56% for households with seven or more children and about 19% of these households experienced severe to chronic hunger.
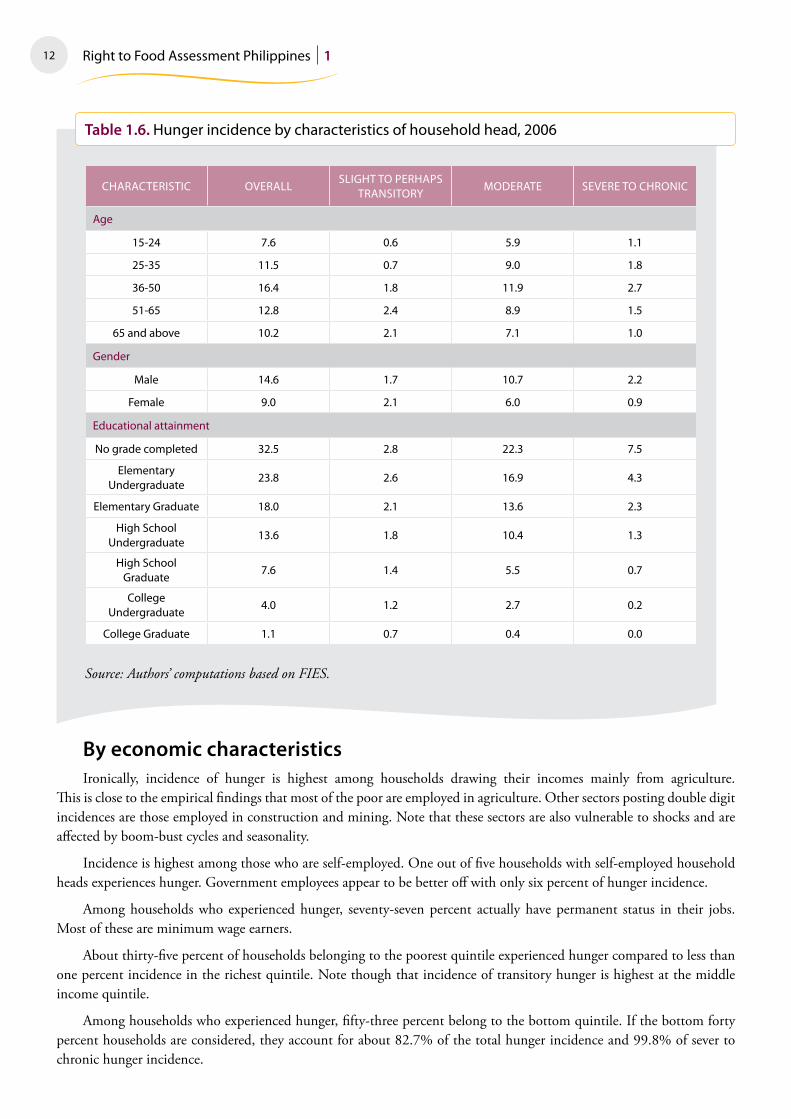
There is not much difference in overall hunger incidence across age groups of household heads. Incidence is highest at 16% among households with household heads aged 36-50. Male headed households have higher incidence by about 6% compared to female headed households.
In terms of educational attainment, better educated household heads have lower incidence of hunger amongst them (one out of one hundred households for college graduates). In fact, a significant drop is observed between groups. The difference between households with heads not completing any grade level and households with heads finishing at least elementary is about 14.5 percentage points. Differences are even higher as each level of schooling is completed, 25 percentage points if compared to households with heads finishing high school and 31 percentage points if compared to those with heads finishing college.
2 Definedhereashouseholdmembersaged18andbelow.
12 Right to Food Assessment Philippines 1
Table�1.6.�Hunger incidence by characteristics of household head, 2006
CHARACTERISTIC OVERAllSlIGHT TO PERHAPS
TRANSITORYMOdERATE SEVERE TO CHRONIC
Age
15-24 7 6 0 6 5 9 1 1
25-35 11 5 0 7 9 0 1 8
36-50 16 4 1 8 11 9 2 7
51-65 12 8 2 4 8 9 1 5
65 and above 10 2 2 1 7 1 1 0
Gender
Male 14 6 1 7 10 7 2 2
Female 9 0 2 1 6 0 0 9
Educational attainment
No grade completed 32 5 2 8 22 3 7 5
Elementary Undergraduate
23 8 2 6 16 9 4 3
Elementary Graduate 18 0 2 1 13 6 2 3
High School Undergraduate
13 6 1 8 10 4 1 3
High School Graduate
7 6 1 4 5 5 0 7
College Undergraduate
4 0 1 2 2 7 0 2
College Graduate 1 1 0 7 0 4 0 0
Source: Authors’ computations based on FIES.
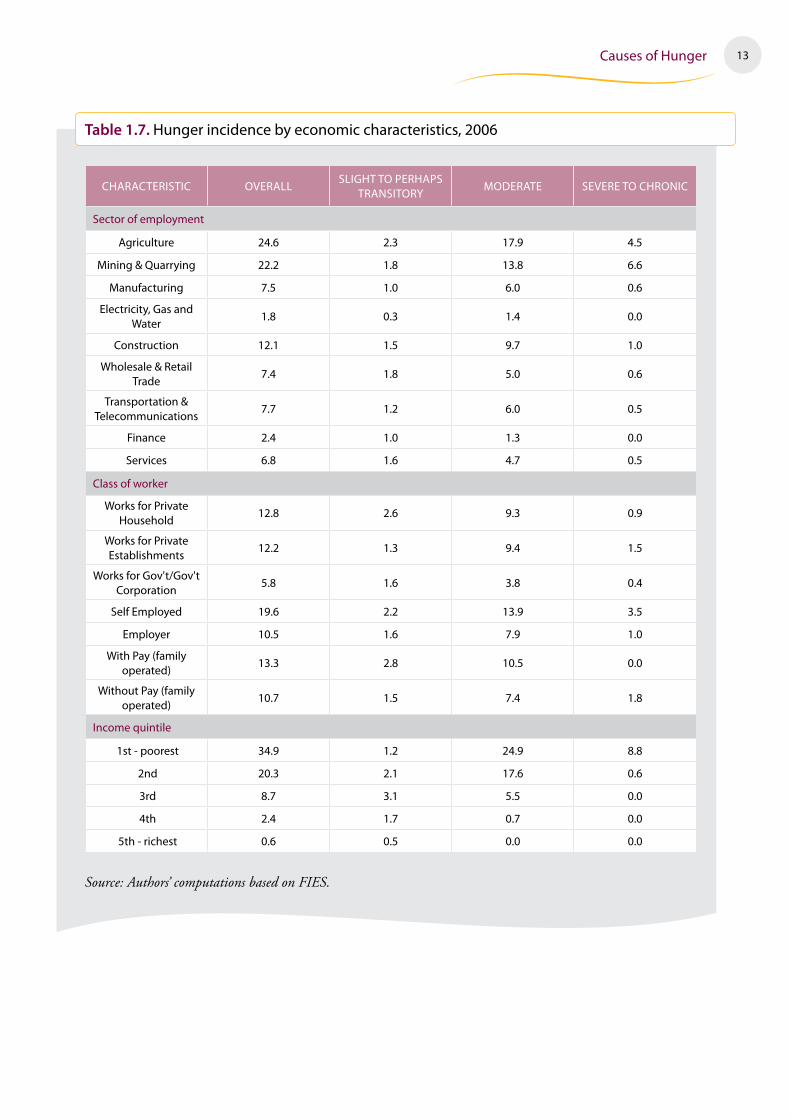
By�economic�characteristicsIronically, incidence of hunger is highest among households drawing their incomes mainly from agriculture.
This is close to the empirical findings that most of the poor are employed in agriculture. Other sectors posting double digit incidences are those employed in construction and mining. Note that these sectors are also vulnerable to shocks and are affected by boom-bust cycles and seasonality.
Incidence is highest among those who are self-employed. One out of five households with self-employed household heads experiences hunger. Government employees appear to be better off with only six percent of hunger incidence.
Among households who experienced hunger, seventy-seven percent actually have permanent status in their jobs. Most of these are minimum wage earners.
About thirty-five percent of households belonging to the poorest quintile experienced hunger compared to less than one percent incidence in the richest quintile. Note though that incidence of transitory hunger is highest at the middle income quintile.
Among households who experienced hunger, fifty-three percent belong to the bottom quintile. If the bottom forty percent households are considered, they account for about 82.7% of the total hunger incidence and 99.8% of sever to chronic hunger incidence.
13Causes of Hunger
Table�1.7.�Hunger incidence by economic characteristics, 2006
CHARACTERISTIC OVERAllSlIGHT TO PERHAPS
TRANSITORYMOdERATE SEVERE TO CHRONIC
Sector of employment
Agriculture 24 6 2 3 17 9 4 5
Mining & Quarrying 22 2 1 8 13 8 6 6
Manufacturing 7 5 1 0 6 0 0 6
Electricity, Gas and Water
1 8 0 3 1 4 0 0
Construction 12 1 1 5 9 7 1 0
Wholesale & Retail Trade
7 4 1 8 5 0 0 6
Transportation & Telecommunications
7 7 1 2 6 0 0 5
Finance 2 4 1 0 1 3 0 0
Services 6 8 1 6 4 7 0 5
Class of worker
Works for Private Household
12 8 2 6 9 3 0 9
Works for Private Establishments
12 2 1 3 9 4 1 5
Works for Gov't/Gov't Corporation
5 8 1 6 3 8 0 4
Self Employed 19 6 2 2 13 9 3 5
Employer 10 5 1 6 7 9 1 0
With Pay (family operated)
13 3 2 8 10 5 0 0
Without Pay (family operated)
10 7 1 5 7 4 1 8
Income quintile
1st - poorest 34 9 1 2 24 9 8 8
2nd 20 3 2 1 17 6 0 6
3rd 8 7 3 1 5 5 0 0
4th 2 4 1 7 0 7 0 0
5th - richest 0 6 0 5 0 0 0 0
Source: Authors’ computations based on FIES.

14 Right to Food Assessment Philippines 1
1.3� Underlying�Causes�of�HungerIn this section, we investigate the underlying causes of hunger. We begin with an analytical framework and then the
model. Following this, we discuss the results of the estimation. We conclude the section with a synthesis of the results.
Analytical�FrameworkThe official definition of the hungry compares the food consumption against the food threshold. This seems to be
similar to the definition of the subsistence poor, but a closer examination would reveal noteworthy differences.
Following is a chart depicting the minimum utility level that an individual must attain in order to be considered as nonpoor. The utility curve is drawn along the food-nonfood space and let us denote the benchmark utility level as U0.
Figure�1.6.�
food
A
B
U0
FA
NFA
non-food
The point, labeled A, represents a consumption basket consisting of FA amount of food and NFA amount of nonfood. This corresponds to the minimum basic needs that an individual must have in order to live decent lives.
The line labeled B is the budget line. It contains the point A and all points along B represent a consumption basket that is just as affordable as A.
An individual is deemed poor if his income3, drawn as his actual budget line, falls below B. This means that he is unable to afford A, and similarly, any consumption basket along B. On the other hand, a person is deemed hungry if his food consumption falls below FA.
We now revisit the diagram, but this time, differentiating among the “types” of hungry and non-hungry. We do this by delineating areas in the graph marked by the horizontal line FA and the budget line B.
3 Strictlyspeaking,weshouldconsiderhisconsumptionexpenditure.ThereaderisencouragedtoreadBalisacan2002tobefamiliarwiththeconceptualandoperationalissuesonthedebate.
15Causes of Hunger
Figure�1.7.�
food
A
I II
III
IV
B
U0
FA
NFA
non-food
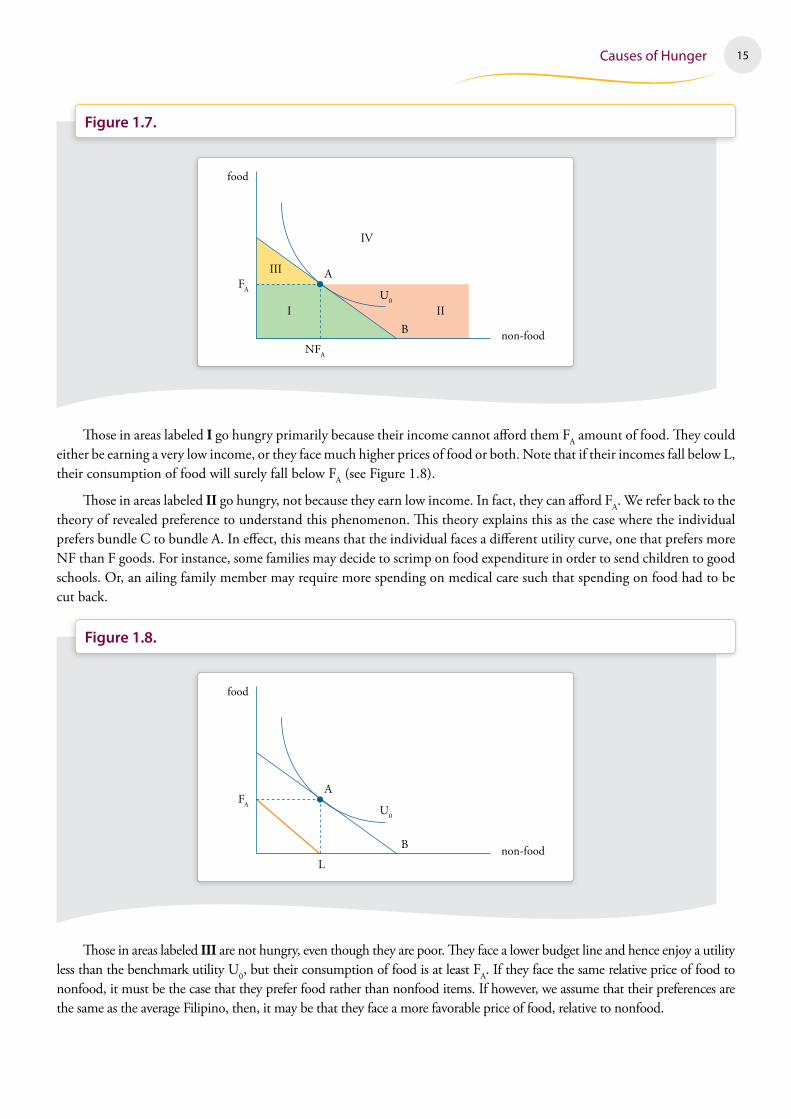
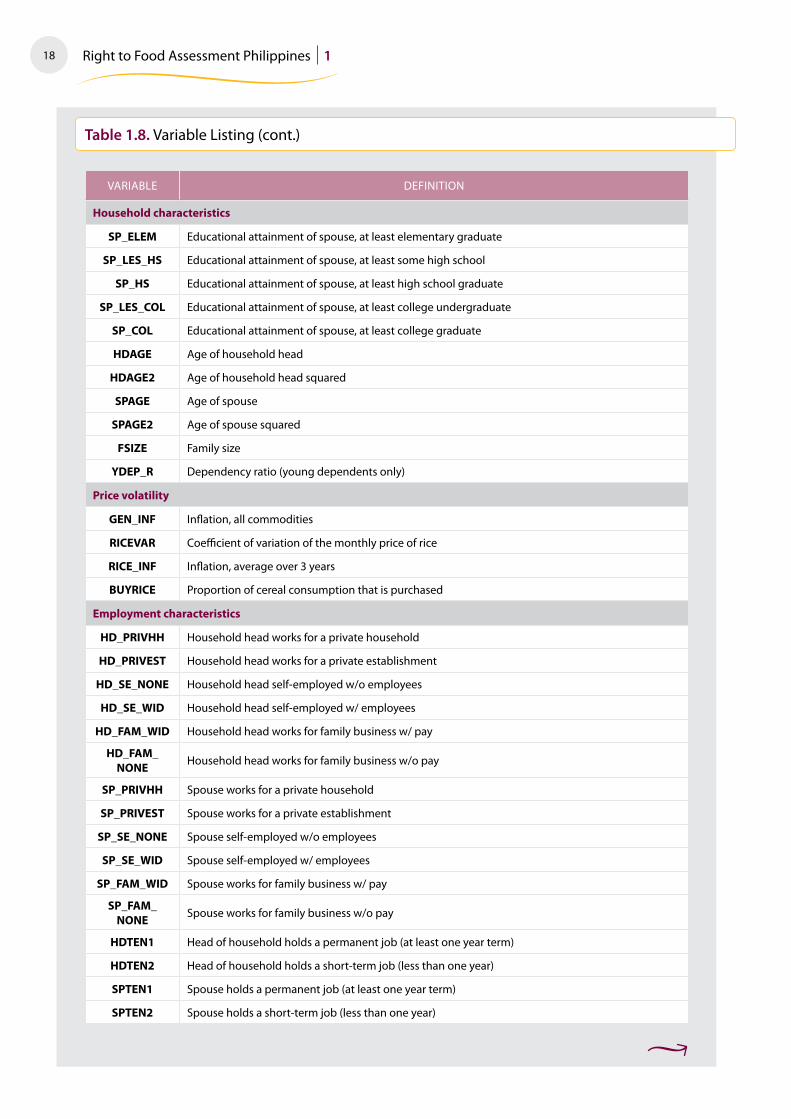
Those in areas labeled I go hungry primarily because their income cannot afford them FA amount of food. They could either be earning a very low income, or they face much higher prices of food or both. Note that if their incomes fall below L, their consumption of food will surely fall below FA (see Figure 1.8).
Those in areas labeled II go hungry, not because they earn low income. In fact, they can afford FA. We refer back to the theory of revealed preference to understand this phenomenon. This theory explains this as the case where the individual prefers bundle C to bundle A. In effect, this means that the individual faces a different utility curve, one that prefers more NF than F goods. For instance, some families may decide to scrimp on food expenditure in order to send children to good schools. Or, an ailing family member may require more spending on medical care such that spending on food had to be cut back.
Figure�1.8.�
food
A
B
U0
FA
Lnon-food
Those in areas labeled III are not hungry, even though they are poor. They face a lower budget line and hence enjoy a utility less than the benchmark utility U0, but their consumption of food is at least FA. If they face the same relative price of food to nonfood, it must be the case that they prefer food rather than nonfood items. If however, we assume that their preferences are the same as the average Filipino, then, it may be that they face a more favorable price of food, relative to nonfood.

16 Right to Food Assessment Philippines 1
Those in areas labeled IV are not hungry and are not poor. Note that even if NF is much preferred to F, a very high income will still ensure food consumption that is at least FA.4 Similarly, the impact of high prices on going hungry becomes muted when incomes are high enough.
Finally, it must be said that preferences and budget lines are not constant over time. However, over the short term when there is not much change in household characteristics, income status, etc., preferences are expected to hold. Budget lines, on the other hand, will always move either due to changes in relative prices or incomes. Negative changes could result in hunger. Hence, there should be some consideration of vulnerability—the likelihood of shocks and ability of the family to cope with the shock.
The�ModelGuided by the above framework, we now develop a model that includes indicators of income, relative prices,
preferences and vulnerability. The model should be relevant and useful to policy makers and program implementers.
Following are the variables that are included in the analysis. Some of these are inherent characteristics of the family; some are structural/economic while others are structural/sectoral.
Family�CharacteristicsSome family characteristics may reveal income-earning capability, e.g., age and educational attainment of parents. Age
of parents may also indicate the likelihood of a shock. Other characteristics may reflect preferences or lifestyle choices.
Employment�CharacteristicsTenure of employment can be used as proxy for stability of income streams. The class of worker can indicate access
to social protection schemes—SSS, GSIS, ECC, etc. The industry affiliation of working members is also important, as some sectors are prone to boom-bust cycles or seasonality (e.g., agriculture, construction, etc. See Section 1.2 for more discussion.)
Price�VolatilityVariability in prices, particularly of cereals, increases the vulnerability of some households. The recent rice price
shock, for instance, has resulted in more individuals sliding to poverty5 and becoming hungry6. Unfortunately, the data used in this study covers only the years 2003 and 20067. Hence, the magnitude of price increase was nowhere near the inflation experienced in 2008.
Another variable of interest is the share of cereal consumption that is purchased. A high share implies increased vulnerability to price shocks, if incomes are not high enough. On the other hand, a low share could mean that the family is a subsistence farming household.
Structural�FactorsLocation of residence of the household can indicate vulnerability to price shocks.
Having a rich neighboring province produces pecuniary benefits. As capacities in the rich province are breached, opportunities for development are created for the less rich province. These can be in the form of more employment opportunities, tenants for residences or even potential homeowners.
4 Weareexcludingheretheextremecasewhereanindividualreallychoosestostarve.
5 AsianDevelopmentBank(2008).SoaringFoodPrices:ResponsetotheCrisis.May2008.Downloadedfromhttp://www.adb.org/Documents/Papers/soaring-food-prices/soaring-food-prices.pdf
6 SocialWeatherStations(2009).FourthQuarter2008SocialWeatherSurvey:Self-RatedPovertystaysat52%.12January2009.Downloadedfromhttp://www.sws.org.ph/pr090112.htm
7 Thesedatasetsarethelatestasoftimeofwriting.TheFIESisscheduledtobeconductedinJuly2009andJanuary2010whichmaynotcapturethepriceinflationexperiencedin2008.SeethesectiononresearchframeworkforadiscussionofdatasetsthatcanbeusedtoanalyzethephenomenonofhungerinthePhilippines.

17Causes of Hunger
A rich province or a neighboring rich province also attracts trade. This implies the presence of extensive trade and market infrastructure. In addition, there could be increased competition resulting in competitive prices.
The impact of having a high proportion of agricultural households can go either way. Provinces with a high proportion of agricultural households have a thin market for agricultural produce. If the neighboring provinces are also mainly agricultural, then higher transportation and transaction costs are incurred in order to expand the market. On the other hand, agricultural provinces have the benefit of abundant supply of food and the ability to safeguard food consumption against demand shocks. Of course, the implicit assumption is that agricultural provinces produce food crops. One only needs to remember the Negros Island famine to realize that the descriptor agricultural needs to be further clarified.
The table following lists the variables included in the model. Note that household income is not explicitly included. For sure, this is a significant variable. However, its inclusion would introduce multicollinearity to the model. This would render as insignificant the other variables that could proxy for income and are more relevant for program design since they could be easily measured and verified.
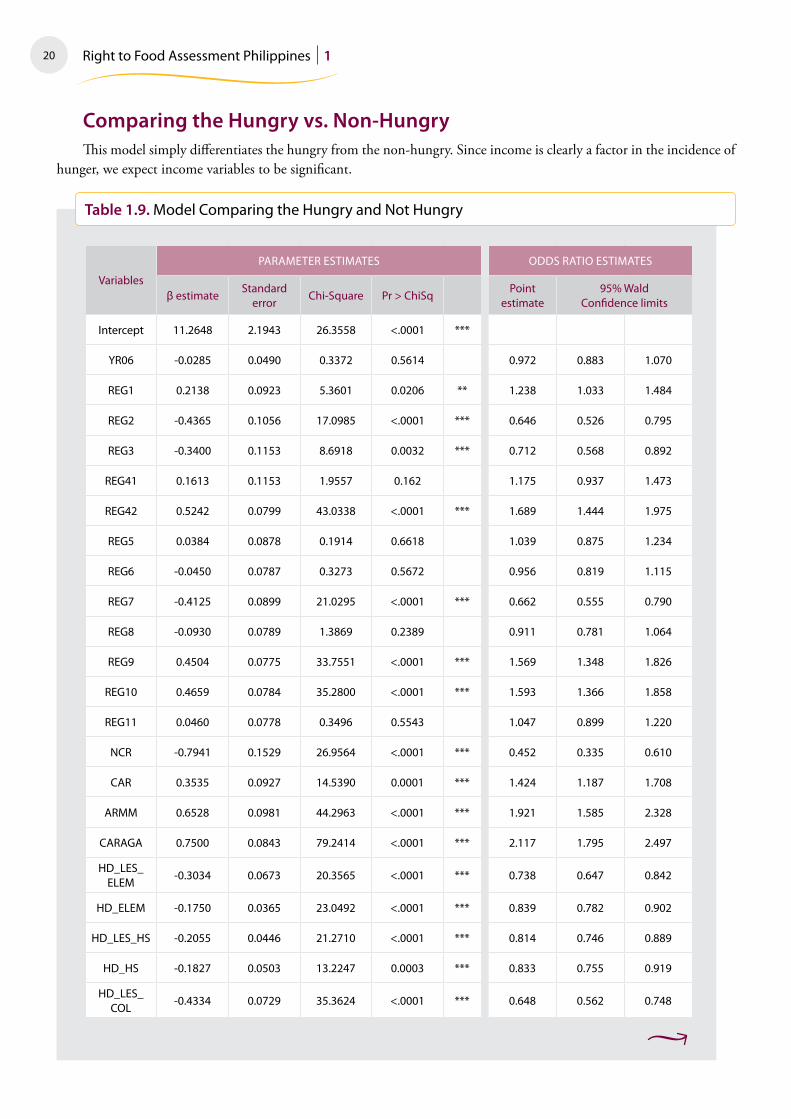
Table�1.8.�Variable listing
VARIAblE dEFINITION
Geographical factors (dummy variables, Region 12 as control)
REG1 Region 1
REG2 Region 2
REG3 Region 3
REG41 CAlAbARZON
REG42 MIMAROPA
REG5 Region 5
REG6 Region 6
REG7 Region 7
REG8 Region 8
REG9 Region 9
REG10 Region 10
REG11 Region 11
NCR National Capital Region
CAR Cordillera Administrative Region
ARMM Autonomous Region of Muslim Mindanao
CARAGA Caraga
Householdcharacteristics
HD_LES_ELEM Educational attainment of household head, at least some elementary
HD_ELEM Educational attainment of household head, at least elementary graduate
HD_LES_HS Educational attainment of household head, at least some high school
HD_HS Educational attainment of household head, at least high school graduate
HD_LES_COL Educational attainment of household head, at least college undergraduate
HD_COL Educational attainment of household head, at least college graduate
SP_LES_ELEM Educational attainment of spouse, at least some elementary
18 Right to Food Assessment Philippines 1
Table�1.8.�Variable listing (cont )
VARIAblE dEFINITION
Householdcharacteristics
SP_ELEM Educational attainment of spouse, at least elementary graduate
SP_LES_HS Educational attainment of spouse, at least some high school
SP_HS Educational attainment of spouse, at least high school graduate
SP_LES_COL Educational attainment of spouse, at least college undergraduate
SP_COL Educational attainment of spouse, at least college graduate
HDAGE Age of household head
HDAGE2 Age of household head squared
SPAGE Age of spouse
SPAGE2 Age of spouse squared
FSIZE Family size
YDEP_R dependency ratio (young dependents only)
Pricevolatility
GEN_INF Inflation, all commodities
RICEVAR Coefficient of variation of the monthly price of rice
RICE_INF Inflation, average over 3 years
BUYRICE Proportion of cereal consumption that is purchased
Employmentcharacteristics
HD_PRIVHH Household head works for a private household
HD_PRIVEST Household head works for a private establishment
HD_SE_NONE Household head self-employed w/o employees
HD_SE_WID Household head self-employed w/ employees
HD_FAM_WID Household head works for family business w/ pay
HD_FAM_NONE Household head works for family business w/o pay
SP_PRIVHH Spouse works for a private household
SP_PRIVEST Spouse works for a private establishment
SP_SE_NONE Spouse self-employed w/o employees
SP_SE_WID Spouse self-employed w/ employees
SP_FAM_WID Spouse works for family business w/ pay
SP_FAM_NONE Spouse works for family business w/o pay
HDTEN1 Head of household holds a permanent job (at least one year term)
HDTEN2 Head of household holds a short-term job (less than one year)
SPTEN1 Spouse holds a permanent job (at least one year term)
SPTEN2 Spouse holds a short-term job (less than one year)

19Causes of Hunger
Table�1.8.�Variable listing (cont )
VARIAblE dEFINITION
Employmentcharacteristics
AGRI Number of family members employed in agriculture
MNG Number of family members employed in mining
MFG Number of family members employed in manufacturing
EGW Number of family members employed in utilities
CONST Number of family members employed in construction
TRADE Number of family members employed in trade
TELCOM Number of family members employed in transportation and communication
FIN Number of family members employed in finance
SERV Number of family members employed in services
Structuralfactors
YGINI_00 Income gini, 2000
YGINI_00SQ Income gini, 2000 (squared)
LN_NEIGHY Average income of province and neighboring provinces
NEIGH_AGRI Proportion of agricultural households in province and neighboring provinces
YR06 Year dummy
The model is specified as follows:
Probhjk(hunger) = f (Dcharshjk, Echarshjk, Pj, Cjk * Structurej )
where
Probhjk(hunger) is the likelihood that household h living in province j with neighboring province k suffers from hunger
Dcharshjkis a set of variables representing demographic characteristics of household h living in province j with neighboring province k
Echarshjkis a set of variables representing employment characteristics of household h living in province j with neighboring province k
Pjis a set of price characteristics confronting province j
Cjkis a contiguity matrix with cell entries equal to 1 if province j is accessible from province k, 0 otherwise. Note that Cjj = 1
Structurejis a set of structural variables for each province j
20 Right to Food Assessment Philippines 1
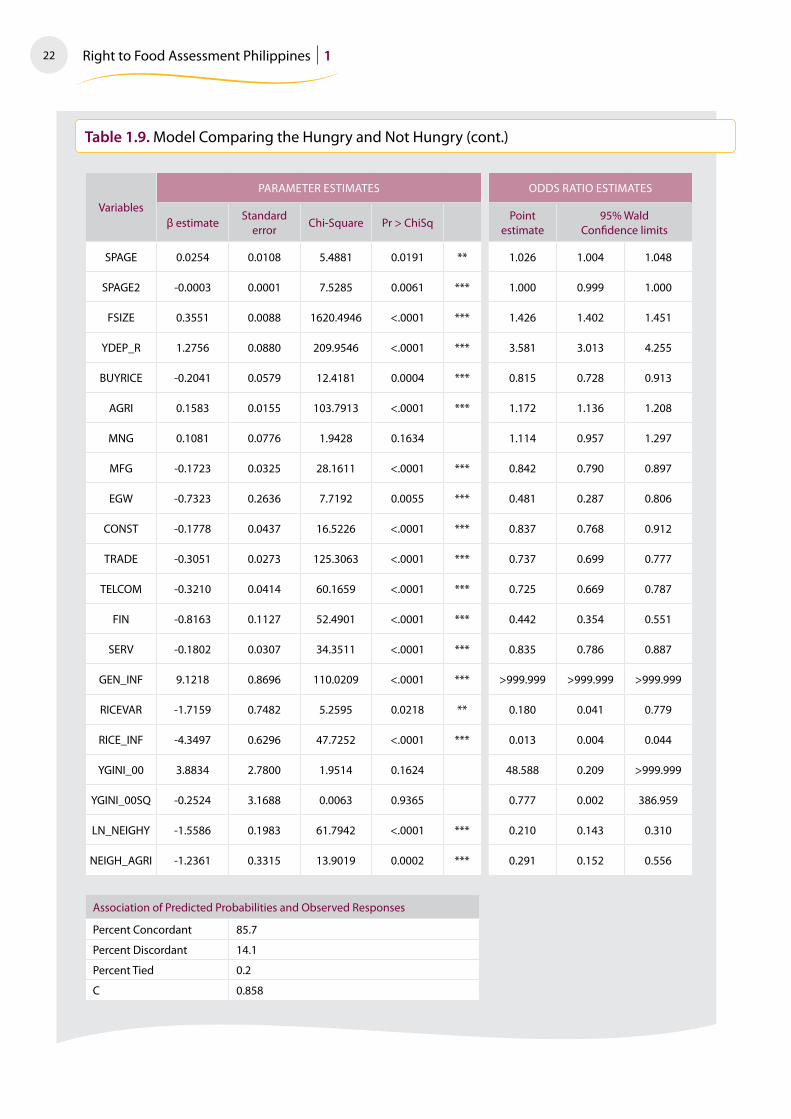
Comparing�the�Hungry�vs.�Non-HungryThis model simply differentiates the hungry from the non-hungry. Since income is clearly a factor in the incidence of
hunger, we expect income variables to be significant.
Table�1.9.�Model Comparing the Hungry and Not Hungry
Variables
PARAMETER ESTIMATES OddS RATIO ESTIMATES
β estimateStandard
errorChi-Square Pr > ChiSq
Point estimate
95% Wald Confidence limits
Intercept 11 2648 2 1943 26 3558 < 0001 ***
YR06 -0 0285 0 0490 0 3372 0 5614 0 972 0 883 1 070
REG1 0 2138 0 0923 5 3601 0 0206 ** 1 238 1 033 1 484
REG2 -0 4365 0 1056 17 0985 < 0001 *** 0 646 0 526 0 795
REG3 -0 3400 0 1153 8 6918 0 0032 *** 0 712 0 568 0 892
REG41 0 1613 0 1153 1 9557 0 162 1 175 0 937 1 473
REG42 0 5242 0 0799 43 0338 < 0001 *** 1 689 1 444 1 975
REG5 0 0384 0 0878 0 1914 0 6618 1 039 0 875 1 234
REG6 -0 0450 0 0787 0 3273 0 5672 0 956 0 819 1 115
REG7 -0 4125 0 0899 21 0295 < 0001 *** 0 662 0 555 0 790
REG8 -0 0930 0 0789 1 3869 0 2389 0 911 0 781 1 064
REG9 0 4504 0 0775 33 7551 < 0001 *** 1 569 1 348 1 826
REG10 0 4659 0 0784 35 2800 < 0001 *** 1 593 1 366 1 858
REG11 0 0460 0 0778 0 3496 0 5543 1 047 0 899 1 220
NCR -0 7941 0 1529 26 9564 < 0001 *** 0 452 0 335 0 610
CAR 0 3535 0 0927 14 5390 0 0001 *** 1 424 1 187 1 708
ARMM 0 6528 0 0981 44 2963 < 0001 *** 1 921 1 585 2 328
CARAGA 0 7500 0 0843 79 2414 < 0001 *** 2 117 1 795 2 497
Hd_lES_ElEM
-0 3034 0 0673 20 3565 < 0001 *** 0 738 0 647 0 842
Hd_ElEM -0 1750 0 0365 23 0492 < 0001 *** 0 839 0 782 0 902
Hd_lES_HS -0 2055 0 0446 21 2710 < 0001 *** 0 814 0 746 0 889
Hd_HS -0 1827 0 0503 13 2247 0 0003 *** 0 833 0 755 0 919
Hd_lES_COl
-0 4334 0 0729 35 3624 < 0001 *** 0 648 0 562 0 748

21Causes of Hunger
Table�1.9.�Model Comparing the Hungry and Not Hungry (cont )
Variables
PARAMETER ESTIMATES OddS RATIO ESTIMATES
β estimateStandard
errorChi-Square Pr > ChiSq
Point estimate
95% Wald Confidence limits
Hd_COl -0 7764 0 1403 30 6192 < 0001 *** 0 460 0 349 0 606
SP_lES_ElEM
-0 2568 0 0693 13 7464 0 0002 *** 0 773 0 675 0 886
SP_ElEM -0 2306 0 0376 37 7104 < 0001 *** 0 794 0 738 0 855
SP_lES_HS -0 2063 0 0418 24 3222 < 0001 *** 0 814 0 750 0 883
SP_HS -0 1307 0 0474 7 6170 0 0058 *** 0 877 0 800 0 963
SP_lES_COl -0 2971 0 0703 17 8675 < 0001 *** 0 743 0 647 0 853
SP_COl -0 5252 0 1119 22 0097 < 0001 *** 0 591 0 475 0 737
Hd_PRIVHH 0 5173 0 1801 8 2522 0 0041 *** 1 677 1 179 2 387
Hd_PRIVEST 0 1471 0 0620 5 6222 0 0177 ** 1 158 1 026 1 308
Hd_SE_NONE
0 3211 0 0636 25 4588 < 0001 *** 1 379 1 217 1 562
Hd_SE_WId -0 1876 0 0785 5 7113 0 0169 ** 0 829 0 711 0 967
Hd_FAM_WId
-0 1476 0 3875 0 1450 0 7034 0 863 0 404 1 844
Hd_FAM_NONE
0 0008 0 2215 0 0000 0 9972 1 001 0 648 1 545
SP_PRIVHH 0 4846 0 0925 27 4190 < 0001 *** 1 624 1 354 1 946
SP_PRIVEST 0 1824 0 0706 6 6791 0 0098 *** 1 200 1 045 1 378
SP_SE_NONE
0 0263 0 0731 0 1298 0 7186 1 027 0 890 1 185
SP_SE_WId -0 1683 0 1653 1 0375 0 3084 0 845 0 611 1 168
SP_FAM_WId
0 7705 0 4938 2 4350 0 1187 2 161 0 821 5 688
SP_FAM_NONE
0 0817 0 0769 1 1287 0 2880 1 085 0 933 1 262
HdTEN1 -0 3789 0 0557 46 1941 < 0001 *** 0 685 0 614 0 764
HdTEN2 -0 1775 0 0615 8 3355 0 0039 *** 0 837 0 742 0 945
SPTEN1 -0 1064 0 0671 2 5151 0 1128 0 899 0 788 1 025
SPTEN2 -0 1120 0 0728 2 3694 0 1237 0 894 0 775 1 031
HdAGE 0 0009 0 0110 0 0067 0 9346 1 001 0 979 1 023
HdAGE2 0 0000 0 0001 0 0412 0 8392 1 000 1 000 1 000
22 Right to Food Assessment Philippines 1
Table�1.9.�Model Comparing the Hungry and Not Hungry (cont )
Variables
PARAMETER ESTIMATES OddS RATIO ESTIMATES
β estimateStandard
errorChi-Square Pr > ChiSq
Point estimate
95% Wald Confidence limits
SPAGE 0 0254 0 0108 5 4881 0 0191 ** 1 026 1 004 1 048
SPAGE2 -0 0003 0 0001 7 5285 0 0061 *** 1 000 0 999 1 000
FSIZE 0 3551 0 0088 1620 4946 < 0001 *** 1 426 1 402 1 451
YdEP_R 1 2756 0 0880 209 9546 < 0001 *** 3 581 3 013 4 255
bUYRICE -0 2041 0 0579 12 4181 0 0004 *** 0 815 0 728 0 913
AGRI 0 1583 0 0155 103 7913 < 0001 *** 1 172 1 136 1 208
MNG 0 1081 0 0776 1 9428 0 1634 1 114 0 957 1 297
MFG -0 1723 0 0325 28 1611 < 0001 *** 0 842 0 790 0 897
EGW -0 7323 0 2636 7 7192 0 0055 *** 0 481 0 287 0 806
CONST -0 1778 0 0437 16 5226 < 0001 *** 0 837 0 768 0 912
TRAdE -0 3051 0 0273 125 3063 < 0001 *** 0 737 0 699 0 777
TElCOM -0 3210 0 0414 60 1659 < 0001 *** 0 725 0 669 0 787
FIN -0 8163 0 1127 52 4901 < 0001 *** 0 442 0 354 0 551
SERV -0 1802 0 0307 34 3511 < 0001 *** 0 835 0 786 0 887
GEN_INF 9 1218 0 8696 110 0209 < 0001 *** >999 999 >999 999 >999 999
RICEVAR -1 7159 0 7482 5 2595 0 0218 ** 0 180 0 041 0 779
RICE_INF -4 3497 0 6296 47 7252 < 0001 *** 0 013 0 004 0 044
YGINI_00 3 8834 2 7800 1 9514 0 1624 48 588 0 209 >999 999
YGINI_00SQ -0 2524 3 1688 0 0063 0 9365 0 777 0 002 386 959
lN_NEIGHY -1 5586 0 1983 61 7942 < 0001 *** 0 210 0 143 0 310
NEIGH_AGRI -1 2361 0 3315 13 9019 0 0002 *** 0 291 0 152 0 556
Association of Predicted Probabilities and Observed Responses
Percent Concordant 85 7
Percent discordant 14 1
Percent Tied 0 2
C 0 858
23Causes of Hunger
Household�characteristicsLarge families and those with high dependency ratios are more likely to go hungry. The age of the spouse is also
a significant variable, but not the age of the household head. The impact of age of the spouse is nonlinear in that the probability of being hungry increases with age until age 42, then decreases thereafter. This could be indicative of the wealth of the household which is expected to build up after a number of years of productive employment.
Other things remaining the same, families with educated parents have less probability of being hungry. Additional education will reduce the probability even more.
Employment�characteristicsA family whose head has been working for different employers over a period of 3 months is more likely to go hungry.
A contractual worker, even if less than one year, is 15% less likely to hungry. If the household head works under a longer-term contract (at least one year), the likelihood is reduced by 33%.
Sector of employment affects the likelihood of going hungry. The more members there are in the family working in agriculture, the higher this likelihood. Workers in agriculture are paid low returns for their labor. In addition, they are subject to many and varied shocks—geoclimatic, pests, shocks in the price of inputs, etc. On the other hand, we find that households with the most number of workers in the finance sector are the least likely to go hungry.
Price�VolatilityHigh levels of overall inflation increase the likelihood of going hungry. Interestingly, high levels of inflation and
volatility in the price of rice reduces the likelihood of going hungry. Of course, this result has to be taken ceteris paribus. Given two provinces, say P1 and P2 with the same level of general inflation, the province with lower food inflation, say P1, will host the higher incidence of the hungry. Note that the price situation is such that inflation of nonfood prices in P1 is higher. A number of these items are regular expenditures like tuition fees, house rental, utilities; hence the family will absorb the higher price and probably scrimp on food consumption if there is no savings. In contrast, in P2, it may be the case that the higher food price has translated into higher returns for the producers of food—agriculture workers. This then leads to lower incidence of hunger.
The above result should be taken with a grain of salt. Recall that the data on which this is based only covers the years 2003 and 2006, when there was no incident of hyperinflation in food. It may very well be the case that the impact of relative prices on the incidence of hunger is nonlinear, where it becomes positive at very high levels of food inflation, given a high level of general inflation.
Structural�FactorsResiding in a rich province or having a rich neighboring province reduces the probability of suffering from hunger.
Provinces with a high proportion of agricultural households, other factors remaining the same, also have lower incidence of hunger. These findings, taken together, support our earlier discussion where the province could be enjoying extensive trade and market infrastructure. Being adjacent to food supply further reduces transport and marketing costs.
Some regions also exhibit higher probability of being hungry (compared against Region 12): Ilocos, MIMAROPA, Western and Northern Mindanao, CAR, ARMM and CARAGA. On the other hand, we observe lower probability in the following regions: Cagayan Valley, Central Luzon, Central Visayas and NCR.
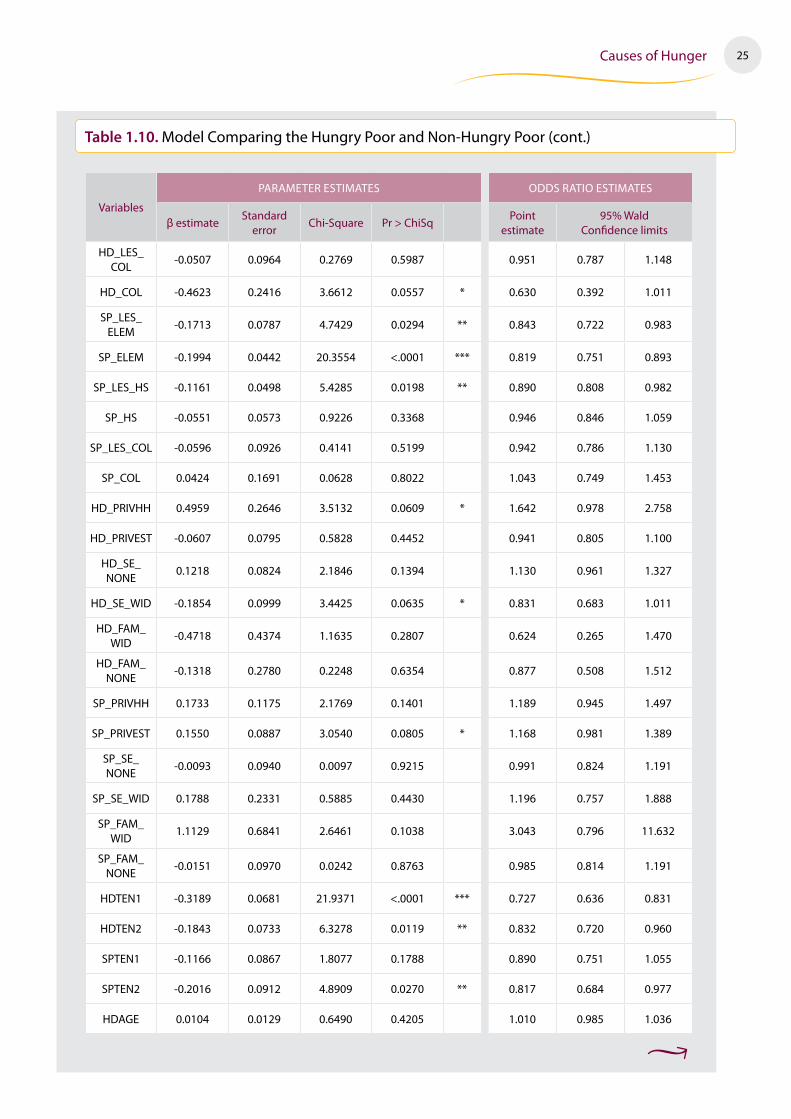
Comparing�the�Hungry�Poor�vs.�Non-Hungry�Poor�In the following, we consider only the poor and try to determine the factors that differentiate the hungry poor
from the non-hungry poor. We expect these variables to reflect differences in preferences, relative prices and vulnerability to shocks.

24 Right to Food Assessment Philippines 1
Family�CharacteristicsThe hungry poor has a bigger family size, although there is no significant difference with respect to dependency ratio
compared against the non-hungry poor. The spouse is also much younger than 46 years old. Most probably, the parents
have not received any formal education at all since even a few years in elementary would have reduced significantly the probability of going hungry.
Table�1.10.�Model Comparing the Hungry Poor and Non-Hungry Poor
Variables
PARAMETER ESTIMATES OddS RATIO ESTIMATES
β estimateStandard
errorChi-Square Pr > ChiSq
Point estimate
95% Wald Confidence limits
Intercept 1 4941 2 7782 0 2892 0 5907
YR06 -0 0437 0 0588 0 5540 0 4567 0 957 0 853 1 074
REG1 -0 0388 0 1130 0 1178 0 7314 0 962 0 771 1 200
REG2 -0 4870 0 1307 13 8751 0 0002 *** 0 614 0 476 0 794
REG3 -0 3844 0 1371 7 8585 0 0051 *** 0 681 0 520 0 891
REG41 -0 0684 0 1359 0 2532 0 6148 0 934 0 715 1 219
REG42 0 4187 0 0946 19 5948 < 0001 *** 1 520 1 263 1 830
REG5 -0 0282 0 1047 0 0727 0 7874 0 972 0 792 1 194
REG6 -0 0244 0 0942 0 0669 0 7959 0 976 0 811 1 174
REG7 -0 1237 0 1113 1 2352 0 2664 0 884 0 710 1 099
REG8 -0 0489 0 0940 0 2702 0 6032 0 952 0 792 1 145
REG9 0 5618 0 0948 35 0929 < 0001 *** 1 754 1 456 2 112
REG10 0 4200 0 0940 19 9455 < 0001 *** 1 522 1 266 1 830
REG11 0 1917 0 0939 4 1685 0 0412 ** 1 211 1 008 1 456
NCR -0 7823 0 1941 16 2418 < 0001 *** 0 457 0 313 0 669
CAR 0 1062 0 1158 0 8414 0 3590 1 112 0 886 1 395
ARMM 0 5685 0 1134 25 1396 < 0001 *** 1 766 1 414 2 205
CARAGA 0 5900 0 1014 33 8815 < 0001 *** 1 804 1 479 2 201
Hd_lES_ElEM
-0 2409 0 0762 9 9898 0 0016 *** 0 786 0 677 0 913
Hd_ElEM -0 0668 0 0431 2 4041 0 1210 0 935 0 860 1 018
Hd_lES_HS -0 1531 0 0535 8 1785 0 0042 *** 0 858 0 773 0 953
Hd_HS -0 0213 0 0617 0 1192 0 7299 0 979 0 867 1 105
25Causes of Hunger
Table�1.10.�Model Comparing the Hungry Poor and Non-Hungry Poor (cont )
Variables
PARAMETER ESTIMATES OddS RATIO ESTIMATES
β estimateStandard
errorChi-Square Pr > ChiSq
Point estimate
95% Wald Confidence limits
Hd_lES_COl
-0 0507 0 0964 0 2769 0 5987 0 951 0 787 1 148
Hd_COl -0 4623 0 2416 3 6612 0 0557 * 0 630 0 392 1 011
SP_lES_ElEM
-0 1713 0 0787 4 7429 0 0294 ** 0 843 0 722 0 983
SP_ElEM -0 1994 0 0442 20 3554 < 0001 *** 0 819 0 751 0 893
SP_lES_HS -0 1161 0 0498 5 4285 0 0198 ** 0 890 0 808 0 982
SP_HS -0 0551 0 0573 0 9226 0 3368 0 946 0 846 1 059
SP_lES_COl -0 0596 0 0926 0 4141 0 5199 0 942 0 786 1 130
SP_COl 0 0424 0 1691 0 0628 0 8022 1 043 0 749 1 453
Hd_PRIVHH 0 4959 0 2646 3 5132 0 0609 * 1 642 0 978 2 758
Hd_PRIVEST -0 0607 0 0795 0 5828 0 4452 0 941 0 805 1 100
Hd_SE_NONE
0 1218 0 0824 2 1846 0 1394 1 130 0 961 1 327
Hd_SE_WId -0 1854 0 0999 3 4425 0 0635 * 0 831 0 683 1 011
Hd_FAM_WId
-0 4718 0 4374 1 1635 0 2807 0 624 0 265 1 470
Hd_FAM_NONE
-0 1318 0 2780 0 2248 0 6354 0 877 0 508 1 512
SP_PRIVHH 0 1733 0 1175 2 1769 0 1401 1 189 0 945 1 497
SP_PRIVEST 0 1550 0 0887 3 0540 0 0805 * 1 168 0 981 1 389
SP_SE_NONE
-0 0093 0 0940 0 0097 0 9215 0 991 0 824 1 191
SP_SE_WId 0 1788 0 2331 0 5885 0 4430 1 196 0 757 1 888
SP_FAM_WId
1 1129 0 6841 2 6461 0 1038 3 043 0 796 11 632
SP_FAM_NONE
-0 0151 0 0970 0 0242 0 8763 0 985 0 814 1 191
HdTEN1 -0 3189 0 0681 21 9371 < 0001 *** 0 727 0 636 0 831
HdTEN2 -0 1843 0 0733 6 3278 0 0119 ** 0 832 0 720 0 960
SPTEN1 -0 1166 0 0867 1 8077 0 1788 0 890 0 751 1 055
SPTEN2 -0 2016 0 0912 4 8909 0 0270 ** 0 817 0 684 0 977
HdAGE 0 0104 0 0129 0 6490 0 4205 1 010 0 985 1 036

26 Right to Food Assessment Philippines 1
Table�1.10.�Model Comparing the Hungry Poor and Non-Hungry Poor (cont )
Variables
PARAMETER ESTIMATES OddS RATIO ESTIMATES
β estimateStandard
errorChi-Square Pr > ChiSq
Point estimate
95% Wald Confidence limits
HdAGE2 -0 0001 0 0001 0 3531 0 5524 1 000 1 000 1 000
SPAGE 0 0276 0 0127 4 7150 0 0299 ** 1 028 1 003 1 054
SPAGE2 -0 0003 0 0001 4 2319 0 0397 ** 1 000 0 999 1 000
FSIZE 0 2740 0 0114 577 6767 < 0001 *** 1 315 1 286 1 345
YdEP_R 0 0275 0 1119 0 0604 0 8058 1 028 0 825 1 280
bUYRICE -0 1216 0 0695 3 0638 0 0801 * 0 885 0 773 1 015
AGRI 0 1199 0 0190 39 8981 < 0001 *** 1 127 1 086 1 170
MNG 0 1755 0 0980 3 2073 0 0733 * 1 192 0 984 1 444
MFG 0 0363 0 0424 0 7355 0 3911 1 037 0 954 1 127
EGW -0 1909 0 4737 0 1624 0 6869 0 826 0 327 2 091
CONST -0 0285 0 0574 0 2461 0 6199 0 972 0 868 1 088
TRAdE -0 0786 0 0354 4 9443 0 0262 ** 0 924 0 863 0 991
TElCOM -0 0687 0 0554 1 5382 0 2149 0 934 0 838 1 041
FIN -0 3055 0 1817 2 8262 0 0927 * 0 737 0 516 1 052
SERV 0 1094 0 0455 5 7764 0 0162 ** 1 116 1 020 1 220
GEN_INF 6 0151 1 0647 31 9190 < 0001 *** 409 573 50 825 >999 999
RICEVAR -2 4202 0 8926 7 3525 0 0067 *** 0 089 0 015 0 511
RICE_INF -4 1526 0 7413 31 3811 < 0001 *** 0 016 0 004 0 067
YGINI_00 7 4457 3 3308 4 9970 0 0254 ** >999 999 2 503 >999 999
YGINI_00SQ -4 9686 3 7947 1 7144 0 1904 0 007 <0 001 11 808
lN_NEIGHY -0 5681 0 2506 5 1386 0 0234 ** 0 567 0 347 0 926
NEIGH_AGRI -0 4242 0 4226 1 0077 0 3154 0 654 0 286 1 498
Association of Predicted Probabilities and Observed Responses
Percent Concordant 71 5
Percent discordant 28 2
Percent Tied 0 3
C 0 717
27Causes of Hunger
Employment�CharacteristicsFamilies who are more likely to go hungry are those with many members engaged in agriculture, mining and services.
Note that the latter sectors do not appear in the previous model. Since the subsample is only the poor, workers in these sectors are probably informal workers.
If the head of household is employed in a private household and the spouse is employed in a private establishment, the higher the likelihood of going hungry.
On the other hand, having a permanent job or being employed by a single employer reduces the probability of being hungry.
Price�VolatilityThe family with the higher proportion of bought rice is less likely to be hungry. Other things remaining the same,
this variable could be capturing the extent of market participation of the household. Even if the household is agricultural, it could be that they do not plant rice for subsistence.
The impact of relative price movements is the same as above—higher general inflation increases the likelihood of going hungry, while higher inflation in the price of rice and higher variability reduces this likelihood.
Structural�FactorsA province with high income inequality is more likely to have more of the hungry poor. Although being in a rich
province or adjacent to one reduces this probability. This means that the advantages of a good trade and marketing infrastructure remain, but the poor is bound to be marginalized even more if there is severe inequality in the province.
Some regions appear to host a higher proportion of the hungry poor (compared to region 12): MIMAROPA, Western and Northern Mindanao, Davao region, ARMM and CARAGA. In contrast, a lower proportion of the hungry poor is observed in Cagayan Valley, Central Luzon and NCR.
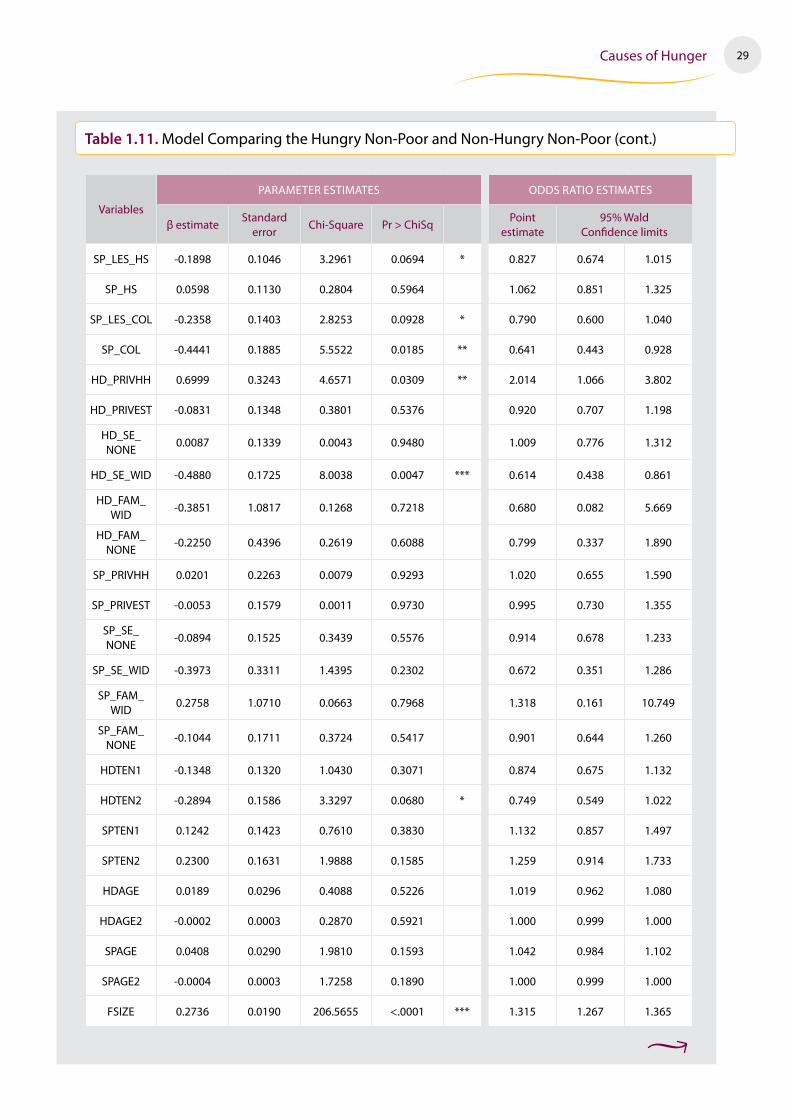
Comparing�the�Hungry�Nonpoor�vs.�Non-Hungry�NonpoorAmong the nonpoor, there are the hungry and non-hungry. In the following model, we seek to explain the distinction.
Perhaps there is some level of income that makes the household still vulnerable, despite being able to earn above the poverty line. We then expect factors that reflect differences in coping ability towards shocks and even differences in preferences to figure prominently in the model.
Family�CharacteristicsThe nonpoor with a bigger family size is more likely to go hungry, ceteris paribus. The other characteristics do not
significantly differ—dependency ratio, age of household head and spouse.
Education of parents does matter. The family whose parents have some college education is less likely to go hungry.
Employment�CharacteristicsA nonpoor family whose head is employed in a private household is more likely to go hungry. In contrast, someone
who is self-employed but with at least one employee is less likely to go hungry. Note that the latter category implies that the family business is able to generate surplus enough to employ others.
Tenure of employment cannot discriminate between the two groups, but sector of employment does. Agricultural and mining households are more likely to go hungry, although they are nonpoor. Note that these households are nonpoor, hence they earn decent returns for their labor. The feature that could be increasing their likelihood of going hungry is their vulnerability to shocks—higher probability of occurrence and less ability to cope with the shock. In contrast, a family with more members working in the financial sector is less likely to go hungry.

28 Right to Food Assessment Philippines 1
Table�1.11.�Model Comparing the Hungry Non-Poor and Non-Hungry Non-Poor
Variables
PARAMETER ESTIMATES OddS RATIO ESTIMATES
β estimateStandard
errorChi-Square Pr > ChiSq
Point estimate
95% Wald Confidence limits
Intercept 1 9511 4 6958 0 1726 0 6778
YR06 0 0051 0 1158 0 0020 0 9647 1 005 0 801 1 261
REG1 0 2744 0 2014 1 8562 0 1731 1 316 0 887 1 952
REG2 -0 4716 0 2231 4 4659 0 0346 ** 0 624 0 403 0 966
REG3 -1 0819 0 2842 14 4911 0 0001 *** 0 339 0 194 0 592
REG41 -0 3684 0 2768 1 7713 0 1832 0 692 0 402 1 190
REG42 0 3214 0 1921 2 7997 0 0943 * 1 379 0 946 2 010
REG5 -0 0817 0 2148 0 1447 0 7036 0 922 0 605 1 404
REG6 -0 4832 0 1972 6 0024 0 0143 ** 0 617 0 419 0 908
REG7 -0 3141 0 2029 2 3970 0 1216 0 730 0 491 1 087
REG8 0 0606 0 1836 0 1088 0 7415 1 062 0 741 1 523
REG9 -0 3696 0 2101 3 0929 0 0786 * 0 691 0 458 1 043
REG10 -0 0624 0 1935 0 1042 0 7469 0 939 0 643 1 373
REG11 -0 3587 0 1920 3 4897 0 0618 * 0 699 0 479 1 018
NCR -1 0086 0 3194 9 9710 0 0016 *** 0 365 0 195 0 682
CAR 0 4435 0 1980 5 0147 0 0251 ** 1 558 1 057 2 297
ARMM 0 5655 0 2421 5 4580 0 0195 ** 1 760 1 095 2 829
CARAGA 0 5222 0 2015 6 7161 0 0096 *** 1 686 1 136 2 502
Hd_lES_ElEM
-0 0056 0 1804 0 0010 0 9754 0 994 0 698 1 416
Hd_ElEM -0 1642 0 0926 3 1427 0 0763 * 0 849 0 708 1 017
Hd_lES_HS -0 2084 0 1096 3 6124 0 0573 * 0 812 0 655 1 007
Hd_HS -0 1392 0 1171 1 4127 0 2346 0 870 0 692 1 095
Hd_lES_COl
-0 4624 0 1483 9 7280 0 0018 *** 0 630 0 471 0 842
Hd_COl -0 2704 0 2085 1 6817 0 1947 0 763 0 507 1 148
SP_lES_ElEM
-0 2735 0 1778 2 3662 0 1240 0 761 0 537 1 078
SP_ElEM 0 1009 0 0987 1 0451 0 3066 1 106 0 912 1 342
29Causes of Hunger
Table�1.11.�Model Comparing the Hungry Non-Poor and Non-Hungry Non-Poor (cont )
Variables
PARAMETER ESTIMATES OddS RATIO ESTIMATES
β estimateStandard
errorChi-Square Pr > ChiSq
Point estimate
95% Wald Confidence limits
SP_lES_HS -0 1898 0 1046 3 2961 0 0694 * 0 827 0 674 1 015
SP_HS 0 0598 0 1130 0 2804 0 5964 1 062 0 851 1 325
SP_lES_COl -0 2358 0 1403 2 8253 0 0928 * 0 790 0 600 1 040
SP_COl -0 4441 0 1885 5 5522 0 0185 ** 0 641 0 443 0 928
Hd_PRIVHH 0 6999 0 3243 4 6571 0 0309 ** 2 014 1 066 3 802
Hd_PRIVEST -0 0831 0 1348 0 3801 0 5376 0 920 0 707 1 198
Hd_SE_NONE
0 0087 0 1339 0 0043 0 9480 1 009 0 776 1 312
Hd_SE_WId -0 4880 0 1725 8 0038 0 0047 *** 0 614 0 438 0 861
Hd_FAM_WId
-0 3851 1 0817 0 1268 0 7218 0 680 0 082 5 669
Hd_FAM_NONE
-0 2250 0 4396 0 2619 0 6088 0 799 0 337 1 890
SP_PRIVHH 0 0201 0 2263 0 0079 0 9293 1 020 0 655 1 590
SP_PRIVEST -0 0053 0 1579 0 0011 0 9730 0 995 0 730 1 355
SP_SE_NONE
-0 0894 0 1525 0 3439 0 5576 0 914 0 678 1 233
SP_SE_WId -0 3973 0 3311 1 4395 0 2302 0 672 0 351 1 286
SP_FAM_WId
0 2758 1 0710 0 0663 0 7968 1 318 0 161 10 749
SP_FAM_NONE
-0 1044 0 1711 0 3724 0 5417 0 901 0 644 1 260
HdTEN1 -0 1348 0 1320 1 0430 0 3071 0 874 0 675 1 132
HdTEN2 -0 2894 0 1586 3 3297 0 0680 * 0 749 0 549 1 022
SPTEN1 0 1242 0 1423 0 7610 0 3830 1 132 0 857 1 497
SPTEN2 0 2300 0 1631 1 9888 0 1585 1 259 0 914 1 733
HdAGE 0 0189 0 0296 0 4088 0 5226 1 019 0 962 1 080
HdAGE2 -0 0002 0 0003 0 2870 0 5921 1 000 0 999 1 000
SPAGE 0 0408 0 0290 1 9810 0 1593 1 042 0 984 1 102
SPAGE2 -0 0004 0 0003 1 7258 0 1890 1 000 0 999 1 000
FSIZE 0 2736 0 0190 206 5655 < 0001 *** 1 315 1 267 1 365

30 Right to Food Assessment Philippines 1
Table�1.11.�Model Comparing the Hungry Non-Poor and Non-Hungry Non-Poor (cont )
Variables
PARAMETER ESTIMATES OddS RATIO ESTIMATES
β estimateStandard
errorChi-Square Pr > ChiSq
Point estimate
95% Wald Confidence limits
YdEP_R 0 1902 0 2011 0 8944 0 3443 1 209 0 816 1 794
bUYRICE -0 0684 0 1460 0 2191 0 6397 0 934 0 701 1 243
AGRI 0 1984 0 0353 31 5645 < 0001 *** 1 219 1 138 1 307
MNG 0 2806 0 1666 2 8374 0 0921 * 1 324 0 955 1 835
MFG -0 0917 0 0724 1 6051 0 2052 0 912 0 792 1 051
EGW -0 0098 0 3524 0 0008 0 9779 0 990 0 496 1 976
CONST 0 1392 0 0862 2 6094 0 1062 1 149 0 971 1 361
TRAdE -0 0512 0 0518 0 9796 0 3223 0 950 0 858 1 052
TElCOM 0 0439 0 0763 0 3307 0 5653 1 045 0 900 1 213
FIN -0 2928 0 1631 3 2237 0 0726 * 0 746 0 542 1 027
SERV 0 0028 0 0568 0 0024 0 9611 1 003 0 897 1 121
GEN_INF 6 3380 2 0282 9 7654 0 0018 *** 565 662 10 621 >999 999
RICEVAR 0 4462 1 7505 0 0650 0 7988 1 562 0 051 48 285
RICE_INF -3 1983 1 5128 4 4696 0 0345 ** 0 041 0 002 0 792
YGINI_00 -19 8842 6 7371 8 7109 0 0032 *** <0 001 <0 001 0 001
YGINI_00SQ 23 9746 7 7753 9 5075 0 0020 *** >999 999 >999 999 >999 999
lN_NEIGHY -0 3816 0 4280 0 7951 0 3726 0 683 0 295 1 580
NEIGH_AGRI 0 5212 0 7081 0 5417 0 4617 1 684 0 420 6 747
Association of Predicted Probabilities and Observed Responses
Percent Concordant 80 4
Percent discordant 17 9
Percent Tied 1 6
C 0 812
Price�VolatilitySimilar to previous results, high overall inflation increases probability of being hungry. However, given two households
residing in two provinces with the same inflation rate, but with different rice price inflation rates, the one living in the province with the higher rice price inflation rate is less likely to go hungry. This demonstrates the more adverse effect of nonfood

31Causes of Hunger
inflation especially among the nonpoor households where a lot of these expenditures cannot be immediately reduced.
The impact of inequality is different from the previous results. It is nonlinear, where a higher level of inequality reduces the probability that a nonpoor household would go hungry; but at very high levels of inequality (representing about 2/3 of provinces) the probability then increases. It could mean that in low-inequality provinces, the threshold income in order not to go hungry is much lower. In contrast, in high-inequality provinces, this threshold income is much higher. The figures below illustrate this.
Figure 1.9 represents two provinces with low-level inequality. Province LA has much lower level inequality than province LB. If the threshold income is YT, then clearly this corresponds to a much lower probability for province LA.
Figure�1.9.�
LALB
F
YT
BA Cum Y
Figure 1.10 represents two provinces with high-level inequality. Province HA has much higher level inequality that province HB. This means that curve of the cumulative income distribution of HA intersects that of HB after a point. If the threshold income occurs after this point of intersection, then the probability that a nonpoor in HA will go hungry is much higher than in HB.
While the above discussion gives plausible explanations, it does not say why the threshold income would be pushed to higher levels in high-inequality provinces. Perhaps the standard of living is much higher to the extent that spending on convenience items becomes “necessary” (the norm, perhaps?).
Figure�1.10.�
HBHA
F
YT
BA
Cum Y
32 Right to Food Assessment Philippines 1
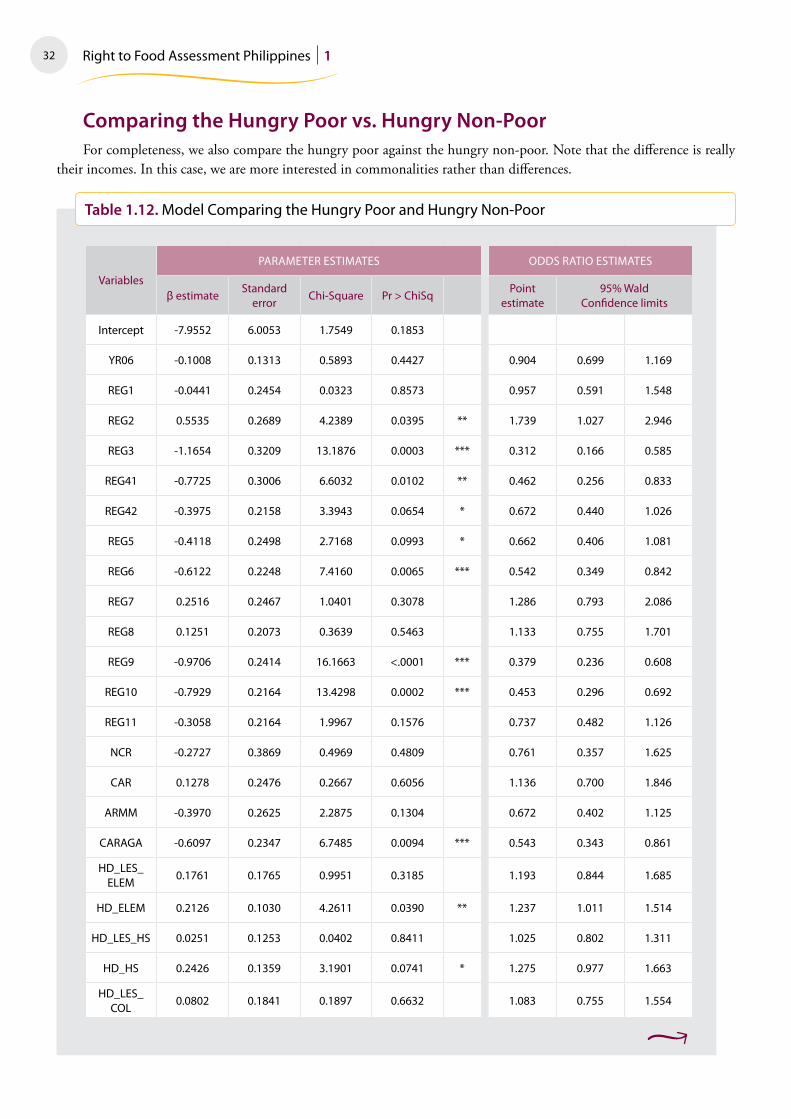
Comparing�the�Hungry�Poor�vs.�Hungry�Non-Poor�For completeness, we also compare the hungry poor against the hungry non-poor. Note that the difference is really
their incomes. In this case, we are more interested in commonalities rather than differences.
Table�1.12.�Model Comparing the Hungry Poor and Hungry Non-Poor
Variables
PARAMETER ESTIMATES OddS RATIO ESTIMATES
β estimateStandard
errorChi-Square Pr > ChiSq
Point estimate
95% Wald Confidence limits
Intercept -7 9552 6 0053 1 7549 0 1853
YR06 -0 1008 0 1313 0 5893 0 4427 0 904 0 699 1 169
REG1 -0 0441 0 2454 0 0323 0 8573 0 957 0 591 1 548
REG2 0 5535 0 2689 4 2389 0 0395 ** 1 739 1 027 2 946
REG3 -1 1654 0 3209 13 1876 0 0003 *** 0 312 0 166 0 585
REG41 -0 7725 0 3006 6 6032 0 0102 ** 0 462 0 256 0 833
REG42 -0 3975 0 2158 3 3943 0 0654 * 0 672 0 440 1 026
REG5 -0 4118 0 2498 2 7168 0 0993 * 0 662 0 406 1 081
REG6 -0 6122 0 2248 7 4160 0 0065 *** 0 542 0 349 0 842
REG7 0 2516 0 2467 1 0401 0 3078 1 286 0 793 2 086
REG8 0 1251 0 2073 0 3639 0 5463 1 133 0 755 1 701
REG9 -0 9706 0 2414 16 1663 < 0001 *** 0 379 0 236 0 608
REG10 -0 7929 0 2164 13 4298 0 0002 *** 0 453 0 296 0 692
REG11 -0 3058 0 2164 1 9967 0 1576 0 737 0 482 1 126
NCR -0 2727 0 3869 0 4969 0 4809 0 761 0 357 1 625
CAR 0 1278 0 2476 0 2667 0 6056 1 136 0 700 1 846
ARMM -0 3970 0 2625 2 2875 0 1304 0 672 0 402 1 125
CARAGA -0 6097 0 2347 6 7485 0 0094 *** 0 543 0 343 0 861
Hd_lES_ElEM
0 1761 0 1765 0 9951 0 3185 1 193 0 844 1 685
Hd_ElEM 0 2126 0 1030 4 2611 0 0390 ** 1 237 1 011 1 514
Hd_lES_HS 0 0251 0 1253 0 0402 0 8411 1 025 0 802 1 311
Hd_HS 0 2426 0 1359 3 1901 0 0741 * 1 275 0 977 1 663
Hd_lES_COl
0 0802 0 1841 0 1897 0 6632 1 083 0 755 1 554
33Causes of Hunger
Table�1.12.�Model Comparing the Hungry Poor and Hungry Non-Poor (cont )
Variables
PARAMETER ESTIMATES OddS RATIO ESTIMATES
β estimateStandard
errorChi-Square Pr > ChiSq
Point estimate
95% Wald Confidence limits
Hd_COl 1 1498 0 3284 12 2568 0 0005 *** 3 158 1 659 6 011
SP_lES_ElEM
-0 1759 0 1720 1 0452 0 3066 0 839 0 599 1 175
SP_ElEM 0 5398 0 1082 24 8886 < 0001 *** 1 716 1 388 2 121
SP_lES_HS 0 0045 0 1182 0 0015 0 9693 1 005 0 797 1 267
SP_HS 0 2489 0 1288 3 7350 0 0533 * 1 283 0 996 1 651
SP_lES_COl 0 1332 0 1756 0 5754 0 4481 1 143 0 810 1 612
SP_COl 0 6552 0 2605 6 3258 0 0119 ** 1 926 1 156 3 209
Hd_PRIVHH 0 0667 0 4086 0 0267 0 8703 1 069 0 480 2 381
Hd_PRIVEST -0 3591 0 1570 5 2276 0 0222 ** 0 698 0 513 0 950
Hd_SE_NONE
-0 5005 0 1569 10 1794 0 0014 *** 0 606 0 446 0 824
Hd_SE_WId -0 1569 0 2038 0 5929 0 4413 0 855 0 573 1 274
Hd_FAM_WId
-0 4080 1 1028 0 1369 0 7114 0 665 0 077 5 774
Hd_FAM_NONE
-0 9390 0 5970 2 4739 0 1158 0 391 0 121 1 260
SP_PRIVHH -1 0231 0 2544 16 1683 < 0001 *** 0 359 0 218 0 592
SP_PRIVEST -0 5407 0 1870 8 3579 0 0038 *** 0 582 0 404 0 840
SP_SE_NONE
-0 3328 0 1812 3 3724 0 0663 * 0 717 0 503 1 023
SP_SE_WId -0 0533 0 4070 0 0171 0 8958 0 948 0 427 2 105
SP_FAM_WId
-0 6405 1 2141 0 2783 0 5978 0 527 0 049 5 693
SP_FAM_NONE
-0 4634 0 1977 5 4939 0 0191 ** 0 629 0 427 0 927
HdTEN1 0 3270 0 1518 4 6424 0 0312 ** 1 387 1 030 1 867
HdTEN2 -0 2867 0 1762 2 6481 0 1037 0 751 0 532 1 060
SPTEN1 0 4460 0 1697 6 9033 0 0086 *** 1 562 1 120 2 179
SPTEN2 0 4295 0 1908 5 0675 0 0244 ** 1 537 1 057 2 233
HdAGE 0 0288 0 0323 0 7926 0 3733 1 029 0 966 1 097
HdAGE2 -0 0003 0 0003 1 1553 0 2824 1 000 0 999 1 000

34 Right to Food Assessment Philippines 1
Table�1.12.�Model Comparing the Hungry Poor and Hungry Non-Poor (cont )
Variables
PARAMETER ESTIMATES OddS RATIO ESTIMATES
β estimateStandard
errorChi-Square Pr > ChiSq
Point estimate
95% Wald Confidence limits
SPAGE 0 0283 0 0320 0 7828 0 3763 1 029 0 966 1 095
SPAGE2 -0 0001 0 0003 0 0875 0 7674 1 000 0 999 1 001
FSIZE -0 2054 0 0246 69 4197 < 0001 *** 0 814 0 776 0 855
YdEP_R -2 5489 0 2313 121 4043 < 0001 *** 0 078 0 050 0 123
bUYRICE 0 2717 0 1640 2 7446 0 0976 * 1 312 0 951 1 809
AGRI 0 0242 0 0380 0 4072 0 5234 1 025 0 951 1 104
MNG 0 2024 0 1714 1 3950 0 2376 1 224 0 875 1 713
MFG 0 2973 0 0812 13 4110 0 0003 *** 1 346 1 148 1 578
EGW 1 8081 0 5399 11 2151 0 0008 *** 6 099 2 117 17 571
CONST 0 6600 0 1043 40 0226 < 0001 *** 1 935 1 577 2 374
TRAdE 0 4950 0 0606 66 7123 < 0001 *** 1 641 1 457 1 847
TElCOM 0 7584 0 0930 66 5719 < 0001 *** 2 135 1 779 2 561
FIN 1 2681 0 2471 26 3315 < 0001 *** 3 554 2 190 5 769
SERV 0 5917 0 0728 65 9884 < 0001 *** 1 807 1 567 2 084
GEN_INF -3 8725 2 3709 2 6678 0 1024 0 021 <0 001 2 169
RICEVAR 4 5513 1 8760 5 8859 0 0153 ** 94 754 2 397 >999 999
RICE_INF 1 9698 1 6698 1 3916 0 2381 7 169 0 272 189 167
YGINI_00 -37 1968 7 3482 25 6239 < 0001 *** <0 001 <0 001 <0 001
YGINI_00SQ 37 3885 8 4581 19 5401 < 0001 *** >999 999 >999 999 >999 999
lN_NEIGHY 1 3912 0 5471 6 4654 0 0110 ** 4 020 1 376 11 747
NEIGH_AGRI 1 2410 0 9555 1 6870 0 1940 3 459 0 532 22 506
Association of Predicted Probabilities and Observed Responses
Percent Concordant 82 2
Percent discordant 17 4
Percent Tied 0 4
C 0 824
35Causes of Hunger
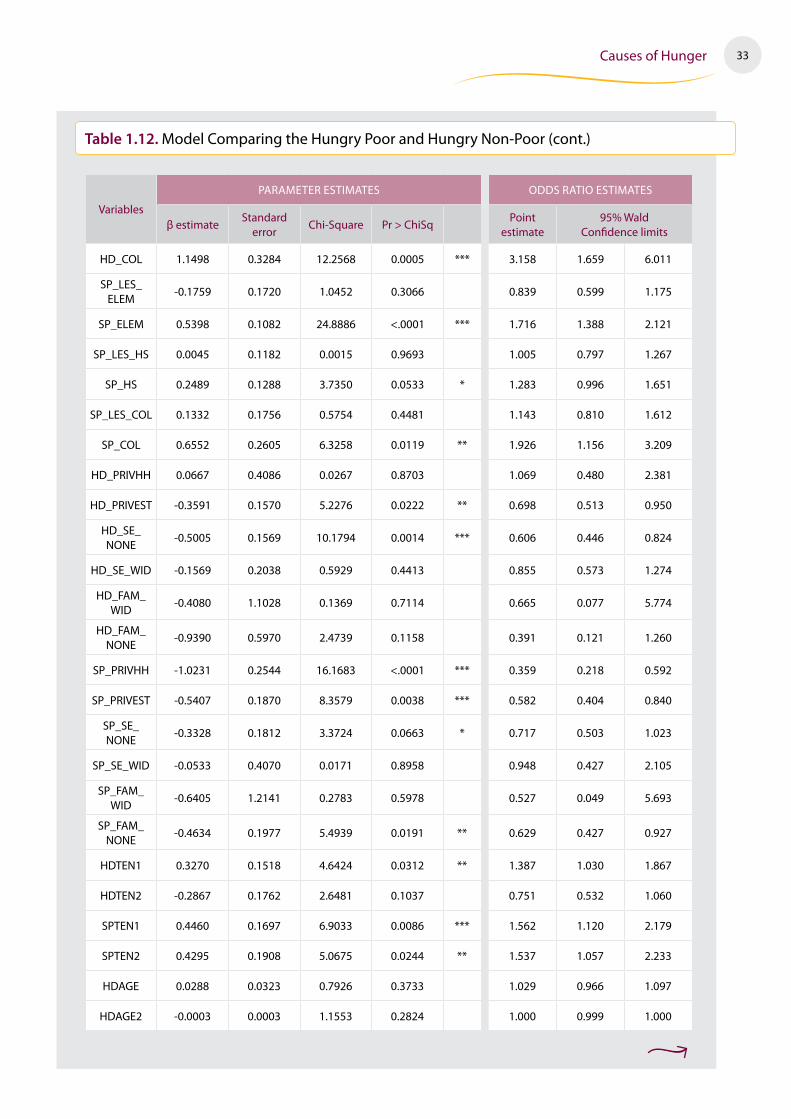
The model, in a way, supports earlier findings. We find that both types of families have the same age profile of parents. They would also have either very low education or have reached college but did not finish. Both families would have many working members engaged in agriculture or mining. They also face the same levels of general and rice price inflation. They also reside in provinces with almost the same proportion of agricultural households.
1.4� Concluding�RemarksWe conclude this component by synthesizing the findings and what it means for policy.
There are some regions that make for a higher probability of being hungry, ceteris paribus. Among the poor, those in Mindanao are more likely to go hungry. While among the nonpoor, those residing in ARMM, CARAGA and CAR are more likely to go hungry. The Mindanao regions are less likely to suffer from geoclimatic shocks, but most likely from man-made shocks, especially armed conflict. Trade and market infrastructure is also limited. In CAR, the latter would be the more plausible reason for the higher vulnerability.
Residing in a rich province or near one reduces the probability of going hungry. If there is a neighboring agricultural province, then so much the better. This should guide the development of regional urban centers that is strategically linked to the periphery. The objective is to stimulate trade and market linkages.
High inflation increases the vulnerability of households to hunger. In particular, high price of nonfood items relative to food implies that the terms of trade is against the producers of food. This means a lower return to agricultural labor; at the same time they will need to shell out more money to meet their nonfood needs. This is true even among the nonpoor, perhaps because a number of these nonfood spending have become “necessary conveniences.”
Households with parents who are younger and are less educated are also more likely to go hungry. Perhaps this reflects the low level of wealth build-up of these households, and therefore, their inability to cope with shocks. This supports the cash for work programs of government. In addition, saving should be encouraged.
Again, we should not forget that hyperinflation in food could also produce disastrous results. If the agricultural sector is not able to respond to the high prices by producing more, perhaps due to high input costs, then both agriculture and non-agriculture sectors suffer. What this means that agricultural productivity programs should still be pursued.
The objective is not to enable each household to produce its own food, but for the agriculture sector to produce surplus enough to trade with the domestic market and even the rest of the world.
If the working members of the household are employed in agriculture, mining, and certain types of trade activities, then the more likely that the household will go hungry. These sectors are confronted with volatility in output. Moreover, many of these are informal sector workers and therefore have poor access to social protection mechanisms. If the working member is employed by a single employer either for the long term or under a short term contract, then the likelihood of going hungry is reduced.
Anti-hunger programs should improve access to social protection mechanisms. Component 3 of this study explores the issue further.
Large households are more likely to go hungry. The likelihood increases if, in addition, the dependency ratio is high. Therefore, population management programs should be paramount in addressing the problem of hunger.

36 Right to Food Assessment Philippines 1
� AnnexA��–�Hunger�Incidence�by�Province,�2006
PROVINCE OVERAll, %SlIGHT TO PERHAPS
TRANSITORY, %MOdERATE, %
SEVERE TO CHRONIC, %
Tawi-Tawi 47 9 1 5 39 4 7 0
Zamboanga del Norte
47 1 3 4 25 4 18 4
Apayao 43 1 7 5 27 3 8 3
Camiguin 40 0 7 0 31 3 1 8
Surigao del Norte 38 6 3 3 28 4 6 9
lanao del Sur 36 5 4 0 30 5 1 9
Mountain Province 35 4 8 8 23 7 2 9
Maguindanao 32 8 4 4 24 3 4 1
Misamis Occidental 32 5 2 9 23 4 6 2
Oriental Mindoro 32 0 3 6 22 9 5 5
Masbate 30 7 1 5 21 7 7 5
Eastern Samar 30 4 4 8 19 5 6 2
Abra 29 4 3 0 20 4 6 0
Northern Samar 29 3 1 7 21 8 5 8
Negros Oriental 29 2 4 4 21 0 3 8
Agusan del Sur 27 6 1 9 17 9 7 8
Sulu 27 3 10 0 16 5 0 8
Surigao del Sur 26 5 2 3 19 1 5 0
Aklan 25 4 2 2 22 2 1 0
kalinga 25 1 4 0 15 5 5 6
lanao del Norte 25 0 2 4 18 5 4 1
davao Oriental 23 3 2 7 17 5 3 0
Samar (Western Samar)
23 2 2 6 16 0 4 6
bohol 22 1 3 3 14 4 4 4
Romblon 21 7 2 2 18 0 1 5
Camarines Sur 21 5 2 2 16 9 2 4
Palawan 21 3 2 3 14 6 4 4
davao 21 2 1 9 17 1 2 3
leyte 21 1 2 9 14 9 3 3
Occidental Mindoro 20 7 1 2 16 5 3 0
Cotabato (North Cotabato)
20 0 4 4 13 3 2 3
Antique 19 9 2 1 13 9 3 9
Quezon 18 7 1 4 15 8 1 5
Misamis Oriental 18 6 1 1 13 2 4 3
basilan 17 9 3 8 13 8 0 4
Albay 17 8 2 0 14 1 1 7
Saranggani 16 9 1 4 13 8 1 8
Agusan del Norte 16 3 2 0 10 9 3 3
Marinduque 16 2 0 0 14 3 1 9
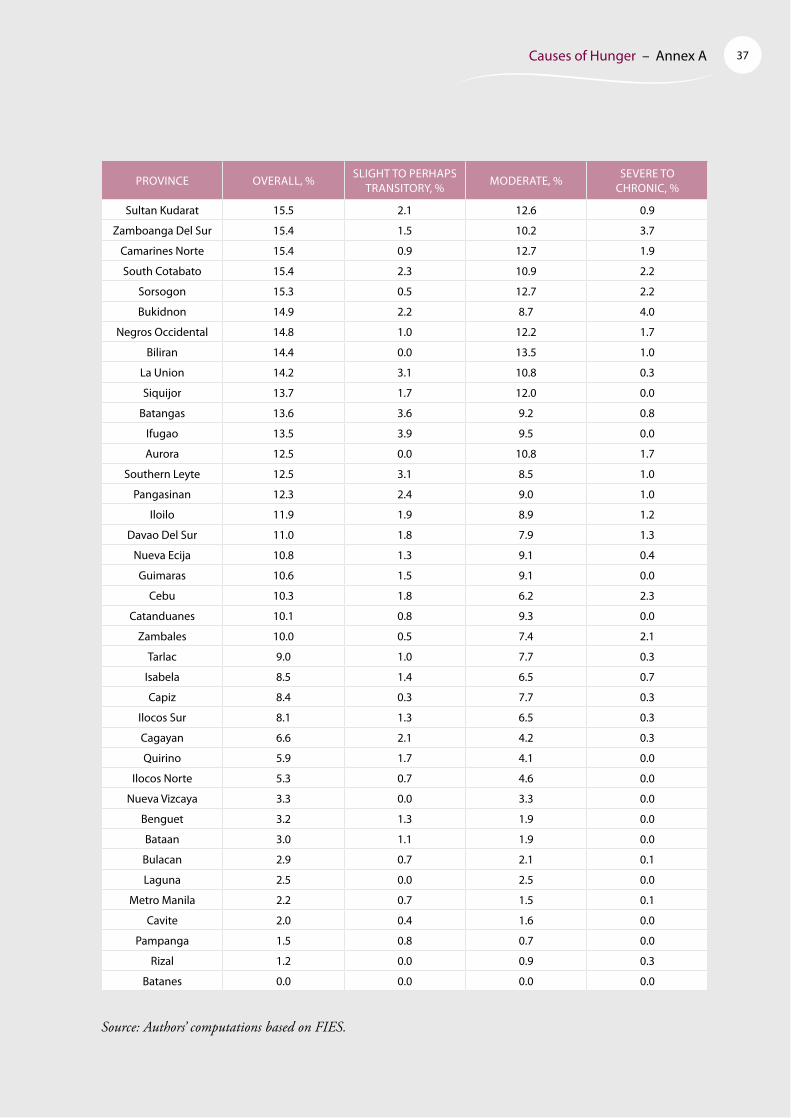
37Causes of Hunger – Annex A
PROVINCE OVERAll, %SlIGHT TO PERHAPS
TRANSITORY, %MOdERATE, %
SEVERE TO CHRONIC, %
Sultan kudarat 15 5 2 1 12 6 0 9
Zamboanga del Sur 15 4 1 5 10 2 3 7
Camarines Norte 15 4 0 9 12 7 1 9
South Cotabato 15 4 2 3 10 9 2 2
Sorsogon 15 3 0 5 12 7 2 2
bukidnon 14 9 2 2 8 7 4 0
Negros Occidental 14 8 1 0 12 2 1 7
biliran 14 4 0 0 13 5 1 0
la Union 14 2 3 1 10 8 0 3
Siquijor 13 7 1 7 12 0 0 0
batangas 13 6 3 6 9 2 0 8
Ifugao 13 5 3 9 9 5 0 0
Aurora 12 5 0 0 10 8 1 7
Southern leyte 12 5 3 1 8 5 1 0
Pangasinan 12 3 2 4 9 0 1 0
Iloilo 11 9 1 9 8 9 1 2
davao del Sur 11 0 1 8 7 9 1 3
Nueva Ecija 10 8 1 3 9 1 0 4
Guimaras 10 6 1 5 9 1 0 0
Cebu 10 3 1 8 6 2 2 3
Catanduanes 10 1 0 8 9 3 0 0
Zambales 10 0 0 5 7 4 2 1
Tarlac 9 0 1 0 7 7 0 3
Isabela 8 5 1 4 6 5 0 7
Capiz 8 4 0 3 7 7 0 3
Ilocos Sur 8 1 1 3 6 5 0 3
Cagayan 6 6 2 1 4 2 0 3
Quirino 5 9 1 7 4 1 0 0
Ilocos Norte 5 3 0 7 4 6 0 0
Nueva Vizcaya 3 3 0 0 3 3 0 0
benguet 3 2 1 3 1 9 0 0
bataan 3 0 1 1 1 9 0 0
bulacan 2 9 0 7 2 1 0 1
laguna 2 5 0 0 2 5 0 0
Metro Manila 2 2 0 7 1 5 0 1
Cavite 2 0 0 4 1 6 0 0
Pampanga 1 5 0 8 0 7 0 0
Rizal 1 2 0 0 0 9 0 3
batanes 0 0 0 0 0 0 0 0
Source: Authors’ computations based on FIES.
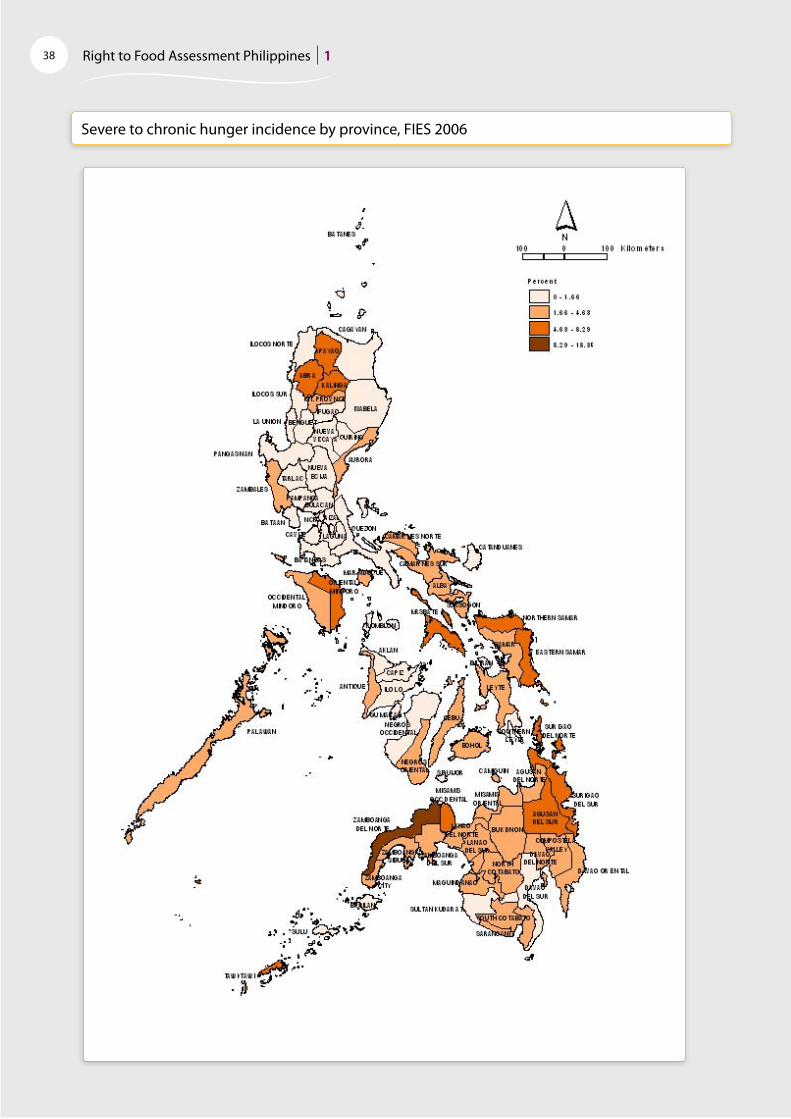
38 Right to Food Assessment Philippines 1
Severe to chronic hunger incidence by province, FIES 2006
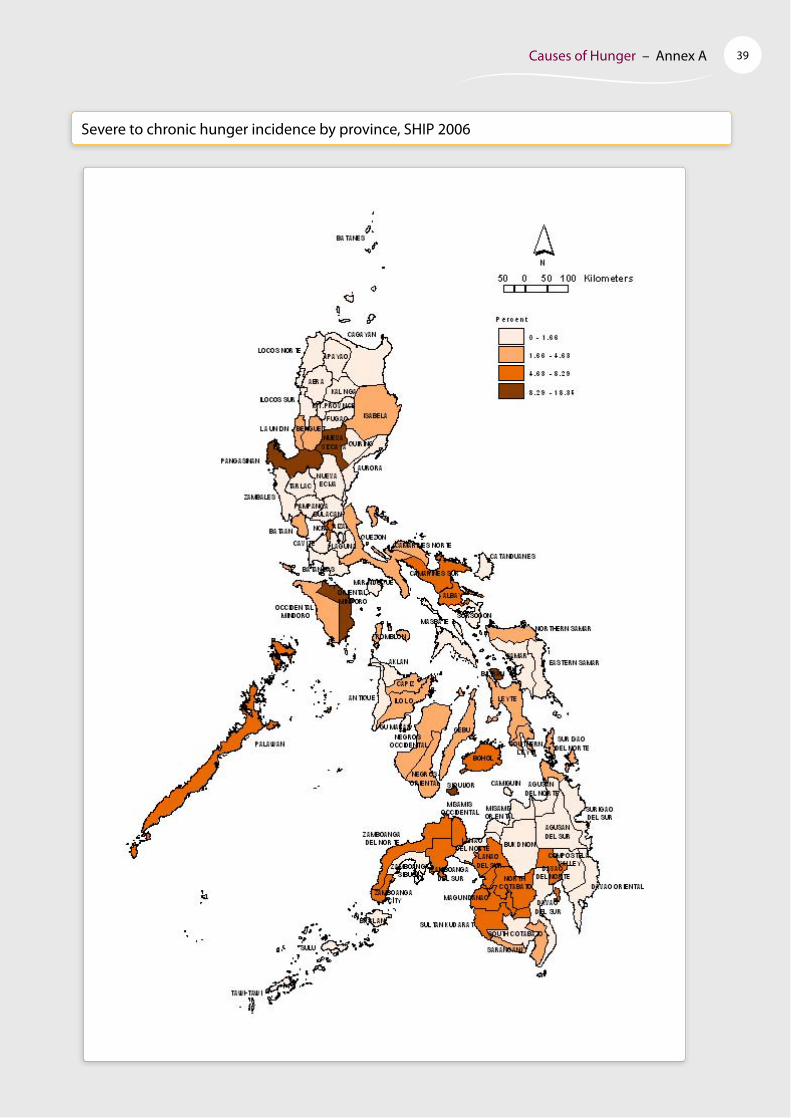
39Causes of Hunger – Annex A
Severe to chronic hunger incidence by province, SHIP 2006