Embed Size (px)
Citation preview
Modern Applied Science; Vol. 7, No. 1; 2013 ISSN 1913-1844 E-ISSN 1913-1852
Published by Canadian Center of Science and Education
1
Right-turn Bypass Lanes at Roundabouts: Geometric Schemes and Functional Analysis
Raffaele Mauro1 & Marco Guerrieri2 1 University of Trento, Department of Civil, Environmental and Mechanical Engineering, Trento, Italy 2 University of Enna “Kore”, Faculty of Engineering and Architecture, Enna, Italy
Correspondence: Marco Guerrieri, University of Enna “Kore”, Faculty of Engineering and Architecture, Via della Cooperazione, Enna Bassa 94100, Enna, Italy. Tel: 39-935-536-350. E-mail: [email protected]
Received: November 8, 2012 Accepted: December 3, 2012 Online Published: December 7, 2012
doi:10.5539/mas.v7n1p1 URL: http://dx.doi.org/10.5539/mas.v7n1p1
Abstract
Right-turn bypass lanes can be implemented in conventional and innovative roundabout intersections to increase the capacity and improve the global functional performances. The Right-turn bypass lanes (also called slip lanes) can be distinguished according to the planimetric layout and the entry control type (stop, yield slip or Free Flow acceleration lane). This paper presents a closed-form model for the estimation of capacity, delays and level of service of roundabout equipped with Right-turn bypass lanes, considering the effect of geometric slip lane schemes, control type, vehicular and pedestrian flow. In order to examine the traffic conditions which can benefit from slip lane roundabouts in terms of capacity and delays, compared to traditional schemes which have no additional lanes, a great number of analyses have been carried out by considering different O/D matrices and vehicle and pedestrian flow vectors. Such comparisons have been made by considering the control delays in function of different O/D matrices. Such O/D matrices describe the most significant situations of traffic demand which can be of interest for the road intersections under study.
Keywords: right-turn bypass lanes, geometric layout, capacity, delay and level of service
1. Introduction
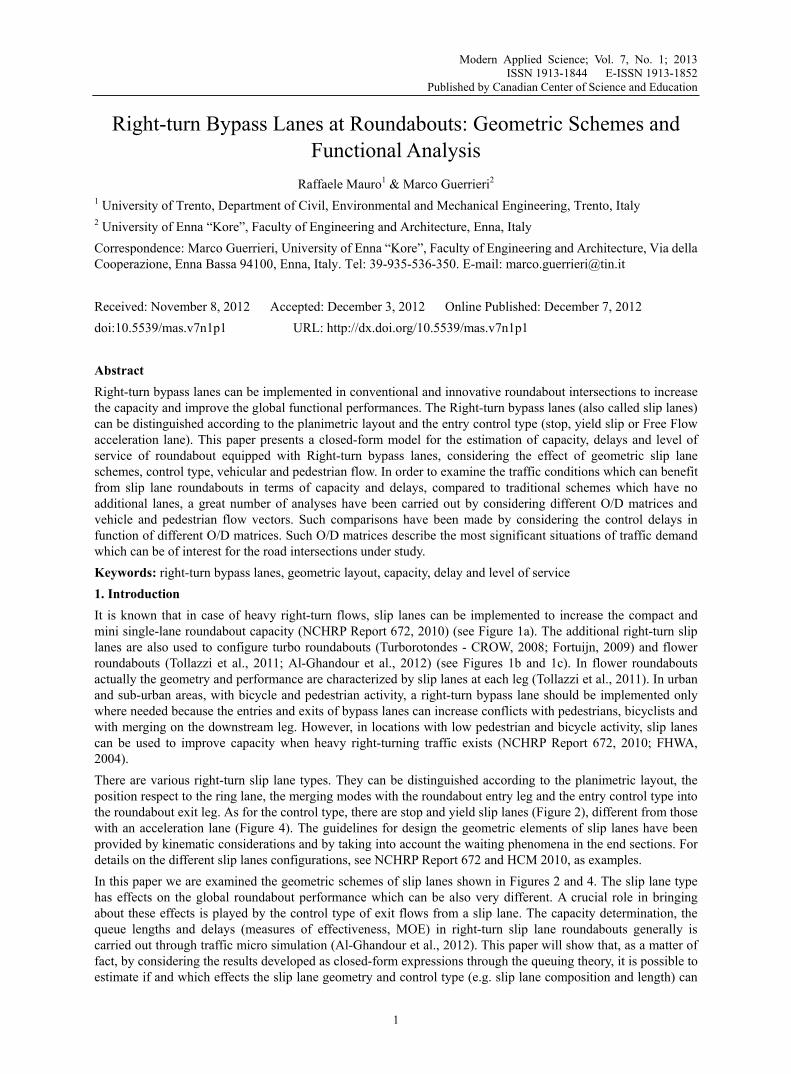
It is known that in case of heavy right-turn flows, slip lanes can be implemented to increase the compact and mini single-lane roundabout capacity (NCHRP Report 672, 2010) (see Figure 1a). The additional right-turn slip lanes are also used to configure turbo roundabouts (Turborotondes - CROW, 2008; Fortuijn, 2009) and flower roundabouts (Tollazzi et al., 2011; Al-Ghandour et al., 2012) (see Figures 1b and 1c). In flower roundabouts actually the geometry and performance are characterized by slip lanes at each leg (Tollazzi et al., 2011). In urban and sub-urban areas, with bicycle and pedestrian activity, a right-turn bypass lane should be implemented only where needed because the entries and exits of bypass lanes can increase conflicts with pedestrians, bicyclists and with merging on the downstream leg. However, in locations with low pedestrian and bicycle activity, slip lanes can be used to improve capacity when heavy right-turning traffic exists (NCHRP Report 672, 2010; FHWA, 2004).
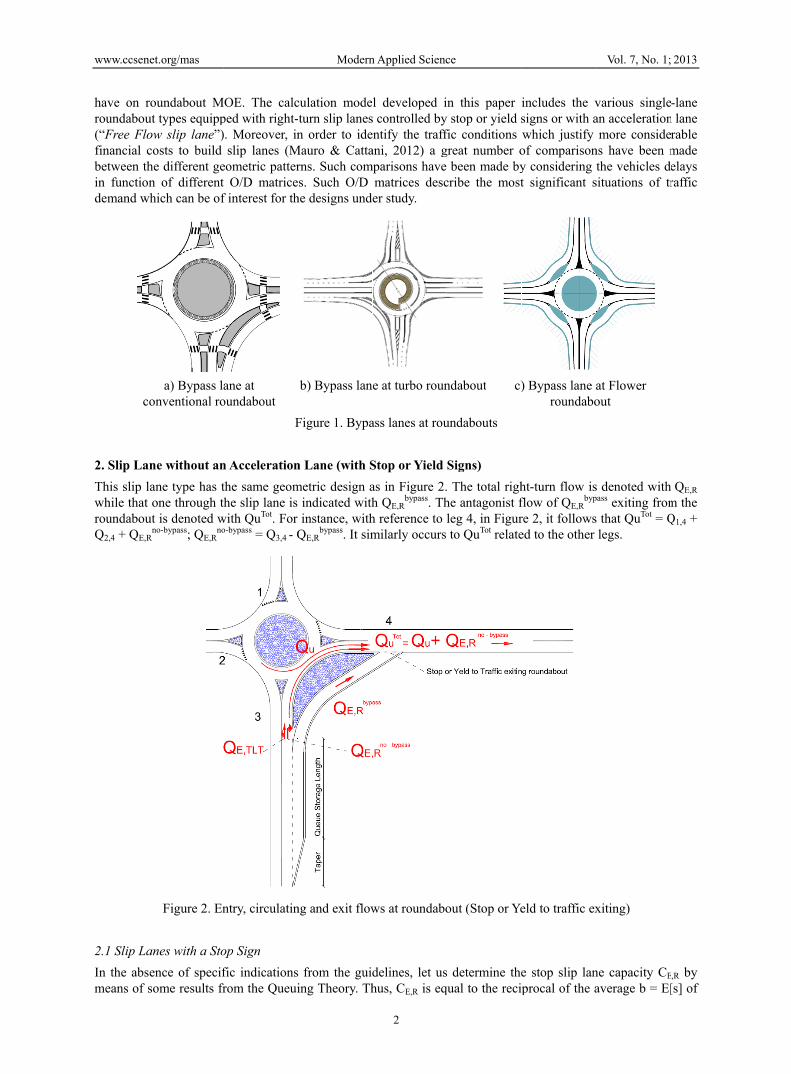
There are various right-turn slip lane types. They can be distinguished according to the planimetric layout, the position respect to the ring lane, the merging modes with the roundabout entry leg and the entry control type into the roundabout exit leg. As for the control type, there are stop and yield slip lanes (Figure 2), different from those with an acceleration lane (Figure 4). The guidelines for design the geometric elements of slip lanes have been provided by kinematic considerations and by taking into account the waiting phenomena in the end sections. For details on the different slip lanes configurations, see NCHRP Report 672 and HCM 2010, as examples.
In this paper we are examined the geometric schemes of slip lanes shown in Figures 2 and 4. The slip lane type has effects on the global roundabout performance which can be also very different. A crucial role in bringing about these effects is played by the control type of exit flows from a slip lane. The capacity determination, the queue lengths and delays (measures of effectiveness, MOE) in right-turn slip lane roundabouts generally is carried out through traffic micro simulation (Al-Ghandour et al., 2012). This paper will show that, as a matter of fact, by considering the results developed as closed-form expressions through the queuing theory, it is possible to estimate if and which effects the slip lane geometry and control type (e.g. slip lane composition and length) can
www.ccsen
have on rroundabou(“Free Flofinancial cbetween thin functiondemand w
c
2. Slip La
This slip lwhile that roundabouQ2,4 + QE,R
2.1 Slip La
In the absmeans of s
net.org/mas
roundabout Mut types equippow slip lane”)costs to build he different gen of different
which can be of
a) Bypass laonventional ro
ne without an
lane type has tone through t
ut is denoted wR
no-bypass; QE,Rno
Figure 2. En
anes with a Sto
ence of specifsome results fr
MOE. The calcped with right-). Moreover, in
slip lanes (Meometric pattert O/D matricef interest for th
ane at
oundabout
F
n Acceleration
the same geomthe slip lane is with QuTot. For o-bypass = Q3,4 - Q
ntry, circulatin
op Sign
fic indicationsfrom the Queui
Modern
culation modeturn slip lanesn order to ide
Mauro & Cattarns. Such coms. Such O/D
he designs unde
b) Bypass lan
Figure 1. Bypa
n Lane (with S
metric design aindicated withinstance, with
QE,Rbypass. It sim
ng and exit flow
s from the guiding Theory. Th
n Applied Scienc
2
l developed ins controlled byntify the traff
ani, 2012) a gmparisons have
matrices descer study.
e at turbo roun
ass lanes at rou
Stop or Yield
as in Figure 2.h QE,R
bypass. Thh reference to lmilarly occurs
ws at roundabo
delines, let ushus, CE,R is eq
ce
n this paper iy stop or yield sfic conditions great number o
been made bycribe the most
ndabout c)
undabouts
Signs)
The total righhe antagonist fleg 4, in Figurto QuTot relate
out (Stop or Ye
determine thequal to the recip
includes the vsigns or with awhich justify of comparisony considering t significant s
) Bypass lane aroundabo
ht-turn flow isflow of QE,R
byp
re 2, it followsed to the other
eld to traffic ex
e stop slip lanprocal of the a
Vol. 7, No. 1;
various singlean accelerationmore conside
ns have been mthe vehicles d
situations of tr
at Flower out
s denoted withpass exiting froms that QuTot = Qlegs.
xiting)
ne capacity CE
average b = E[
2013
-lane n lane rable made elays raffic
QE,R
m the Q1,4 +
E,R by [s] of
www.ccsenet.org/mas Modern Applied Science Vol. 7, No. 1; 2013
3
the service time s estimated at the merging slip lane section into the leg coming from the roundabout. In the event of Poisson vehicle arrivals for QE,R
bypass, any service time s and vehicle headways for the flow QuTot
distributed like a Gamma random variable with a parameter K (Mauro & Branco, 2012), according to P-K relationships (Pollaczek, 1930; Khinchine, 1932; Kleinlock, 1975), b = E[s] can be calculated as following:
01
0
( )
!( )
!
iKKQT
iiK
i
KQTe
ib T
KQTQ
i
(1)
where: T = critical gap [s]; Q = QuTot [veh/h]; K = 1 if 100 ≤ Q ≤ 300 veh/h; K = 2 if 400 ≤ Q ≤ 800 veh/h; K = 3 if 800 ≤ Q ≤ 1500 veh/h, K = 4 if 1500 < Q ≤ 1800 veh/h.
By means of (1) CE,R follows as:
,
01
0
1
( )
!( )
!
E R iKKQT
iiK
i
CKQT
ei
TKQT
Qi
(2)
The critical gap can be calculated by means of the following relation:
22
VT
a
(3)
where V is the vehicle speed on QuTot, a the acceleration by which QE,Rbypass vehicles enter into the flow QuTot;
is the safety time interval between the vehicles of this flow, equal to the Perception-Reaction Time =1 s. V can be calculated through the procedure shown in NCHRP Report 672 in function of deflection radius of the vehicle trajectories passing through ring lane R2 and coming from ring lane R3. For the dimensions of compact single-lane roundabouts considered in this paper, R2 and R3 are generally included in the intervals 12 m ≤ R2 ≤ 18 m and 23 m ≤ R3 ≤ 29 m. With R2 and R3 values included in the previous intervals, V determinations near to V = 30 km/h can be obtained. As for the vehicle merging manoeuvre of QE,R
bypass into the flow QuTot controlled by a stop sign, T is assumed as T = 5.5 s. By means of the values of V and previously indicated, with T = 5.5 s from (3) the acceleration a kept while merging can be obtained as follows a = 1.2 m/s2.
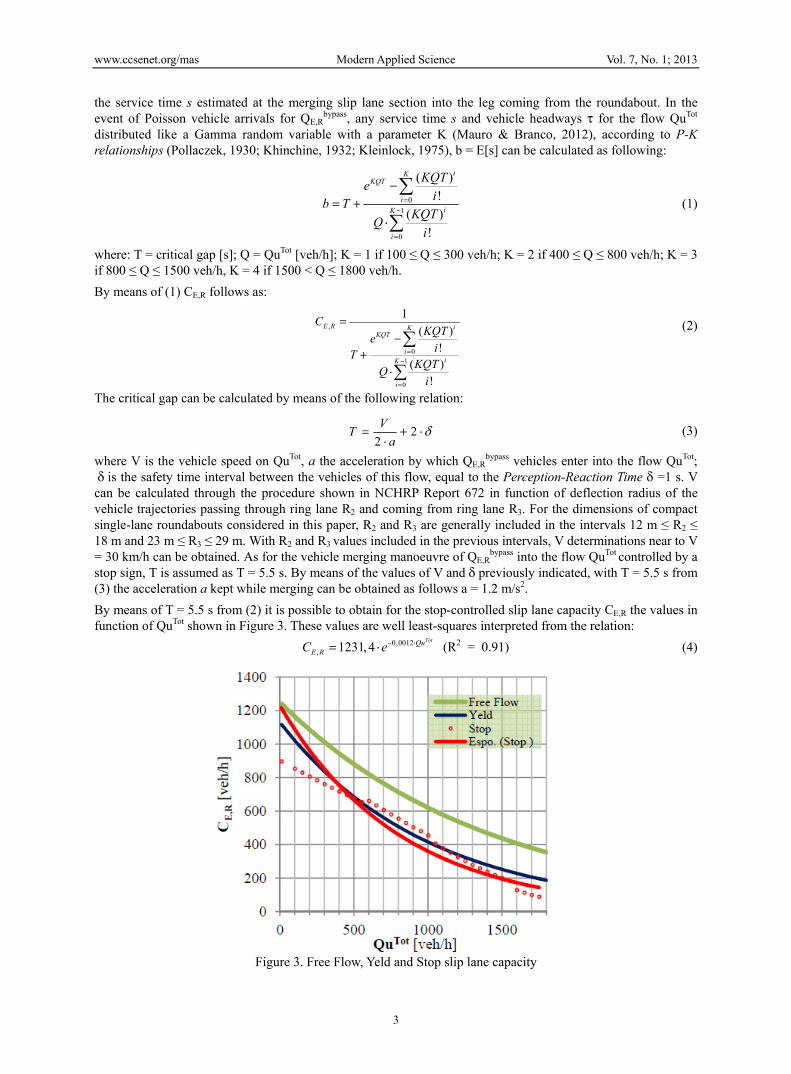
By means of T = 5.5 s from (2) it is possible to obtain for the stop-controlled slip lane capacity CE,R the values in function of QuTot shown in Figure 3. These values are well least-squares interpreted from the relation:
0,0012, 1231,4
TotQuE RC e (R2 = 0.91) (4)
Figure 3. Free Flow, Yeld and Stop slip lane capacity
www.ccsenet.org/mas Modern Applied Science Vol. 7, No. 1; 2013
4
2.2 Right-turn Yield Slip Lanes
In this case the geometric layout is similar to that of stop-controlled slip lanes (Figure 2); the capacity formula is described in NCHRP Report 672:
0,001, 1130
TotQuE RC e (5)
It is illustrated in Figure 3 along with the stop-controlled slip lane capacity. Figure 3 shows that the yield slip lane capacity is usually higher than that with a stop control.
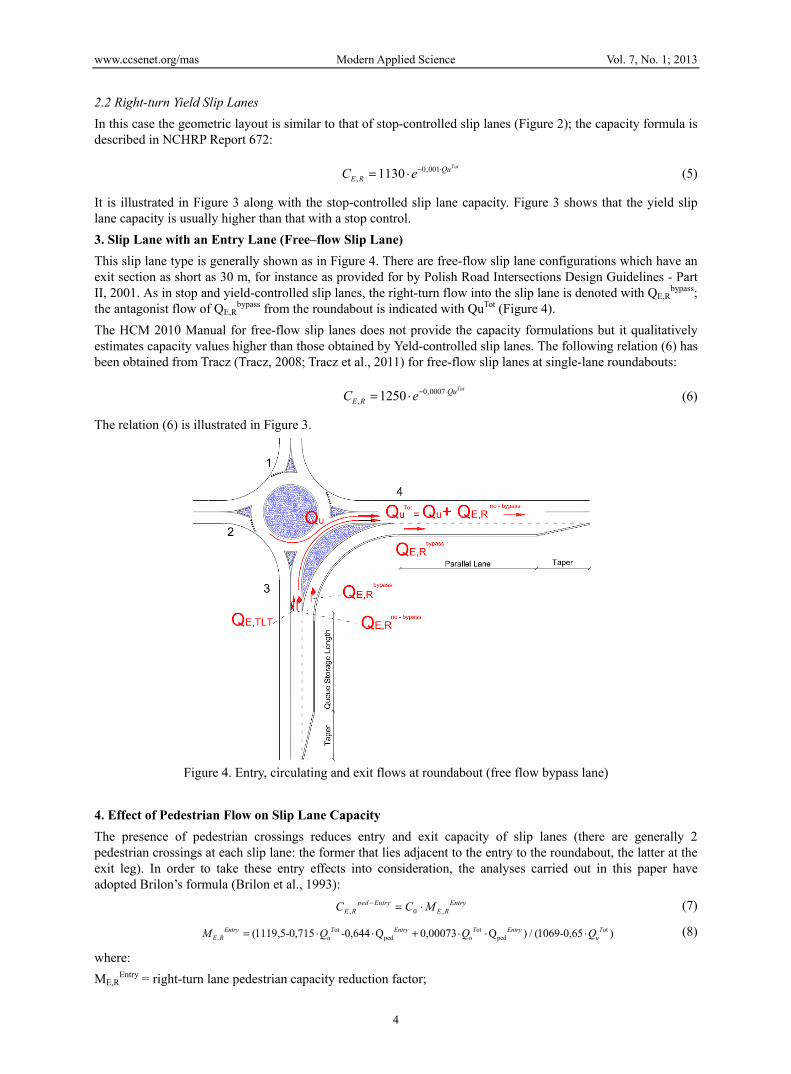
3. Slip Lane with an Entry Lane (Free–flow Slip Lane)
This slip lane type is generally shown as in Figure 4. There are free-flow slip lane configurations which have an exit section as short as 30 m, for instance as provided for by Polish Road Intersections Design Guidelines - Part II, 2001. As in stop and yield-controlled slip lanes, the right-turn flow into the slip lane is denoted with QE,R
bypass; the antagonist flow of QE,R
bypass from the roundabout is indicated with QuTot (Figure 4).
The HCM 2010 Manual for free-flow slip lanes does not provide the capacity formulations but it qualitatively estimates capacity values higher than those obtained by Yeld-controlled slip lanes. The following relation (6) has been obtained from Tracz (Tracz, 2008; Tracz et al., 2011) for free-flow slip lanes at single-lane roundabouts:
0,0007, 1250
TotQuE RC e (6)
The relation (6) is illustrated in Figure 3.
Figure 4. Entry, circulating and exit flows at roundabout (free flow bypass lane)
4. Effect of Pedestrian Flow on Slip Lane Capacity
The presence of pedestrian crossings reduces entry and exit capacity of slip lanes (there are generally 2 pedestrian crossings at each slip lane: the former that lies adjacent to the entry to the roundabout, the latter at the exit leg). In order to take these entry effects into consideration, the analyses carried out in this paper have adopted Brilon’s formula (Brilon et al., 1993):
, 0 ,ped Entry Entry
E R E RC C M (7)
ot ot ot, ped ped(1119,5-0,715 -0,644 Q 0,00073 Q ) / (1069-0,65 )Entry T Entry T Entry T
E R u u uM Q Q Q (8)
where:
ME,REntry = right-turn lane pedestrian capacity reduction factor;
www.ccsen
CE,R ped-Entry
C0= slip la
QpedEntry =
In order toand Mayco
where:
C ped-Entry =
vped = aver
B = length
C0= slip la
N = numbmedian lon
The presenleg from thdistinct rofollows on
net.org/mas
ry = by-pass cap
ane capacity as
pedestrian flow
o determine thock formula (M
= capacity in th
rage speed of t
h of a pedestria
ane capacity as
er of vehicles ngitudinal spac
nce of the twohe roundaboutad sections, ea
ne after anothe
pacity, impact
ssumed as equa
w at Entry [pe
he slip lane caMarlow & May
ped ExitC
he presence of
the pedestrian
an crossing [m
ssumed as equa
queuing in thece occupied by
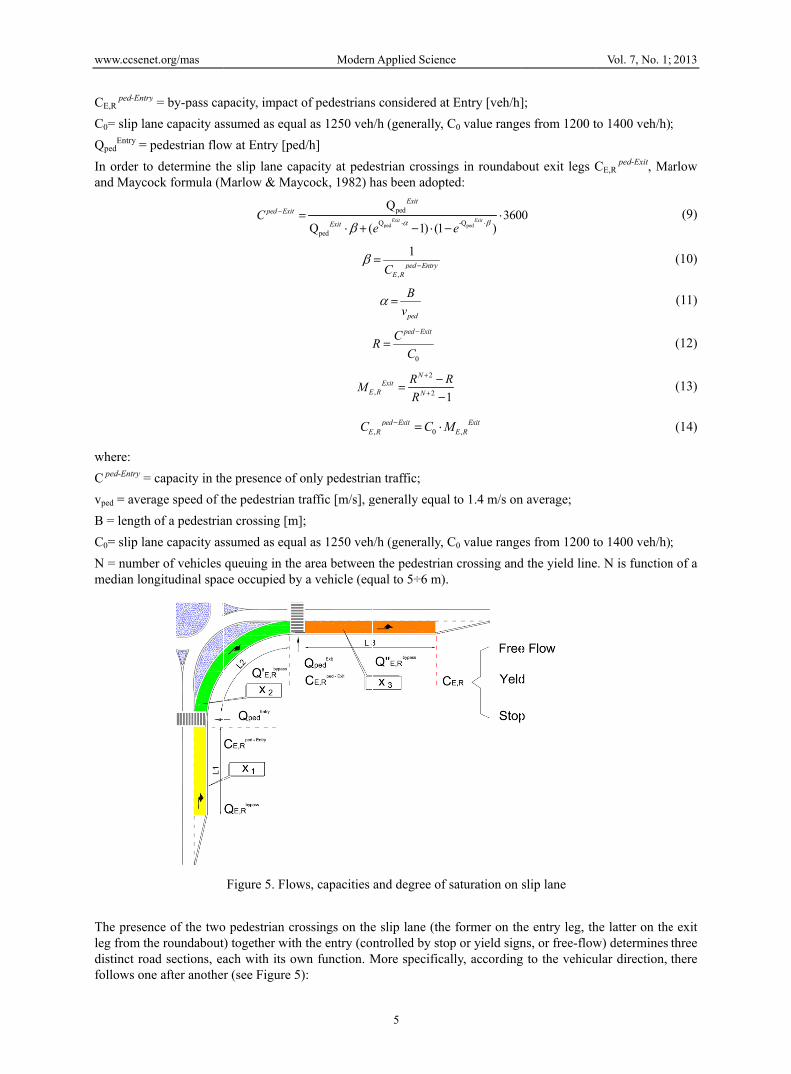
Figure 5. Flow
o pedestrian crt) together withach with its owr (see Figure 5
Modern
of pedestrians
al as 1250 veh
ed/h]
apacity at pedeycock, 1982) h
pedQ (Exit
R
EM
EC
only pedestria
traffic [m/s], g
m];
al as 1250 veh
e area betweeny a vehicle (eq
ws, capacities
rossings on theh the entry (cown function. M5):
n Applied Scienc
5
s considered at
h/h (generally,
estrian crossinhas been adopt
ped
ped
Q
Q
1) (1Exit
Exit
e
,
1ped Entry
E RC
ped
B
v
0
ped ExitCR
C
2
, 2
NExit
E R N
R R
R
, 0ped Exit
E R C M
an traffic;
generally equal
h/h (generally,
n the pedestrianqual to 5÷6 m).
and degree of
e slip lane (thentrolled by stoMore specifica
ce
t Entry [veh/h]
C0 value range
gs in roundabted:
ped-Q360
)Exit
e
1
R
,Exit
E RM
l to 1.4 m/s on
C0 value range
n crossing and.
saturation on
e former on thop or yield signally, according
];
es from 1200 t
out exit legs C
0
n average;
es from 1200 t
d the yield line
slip lane
he entry leg, thns, or free-flowg to the vehicu
Vol. 7, No. 1;
to 1400 veh/h)
CE,R ped-Exit, Ma
to 1400 veh/h)
e. N is function
he latter on thew) determines ular direction,
2013
;
arlow
(9)
(10)
(11)
(12)
(13)
(14)
;
n of a
e exit three there
www.ccsenet.org/mas Modern Applied Science Vol. 7, No. 1; 2013
6
• Section 1 (of length L1) with capacity CE,R ped-Entry, flow QE,R
bypass and saturation degree x1;
• Section 2 (of length L2) with capacity CE,R ped- Exit, flow Q’E,R
bypass and saturation degree x2;
• Section 3 (of length L3) with capacity CE,R, flow Q’’E,Rbypass and saturation degree x3;
Since the three sections are in sequence, the following conditions need to be verified:
,1
,
bypassE R
ped EntryE R
Qx
C (15)
Q’E,Rbypass = min (QE,R
bypass; CE,R ped-Entry ) (16)
,2
,
' bypassE R
ped ExitE R
Qx
C (17)
Q’’E,Rbypass = min (Q’E,R
bypass; CE,R ped-Exit ) (18)
,3
,
'' bypassE R
E R
Qx
C (19)
where CE,R is calculated by means of expressions (4), (5), (6) according to the slip lane control type. The degree of saturation in a slip lane (required for the estimation of the Total Entry Capacity) corresponds to the maximum value of x1, x2, x3:
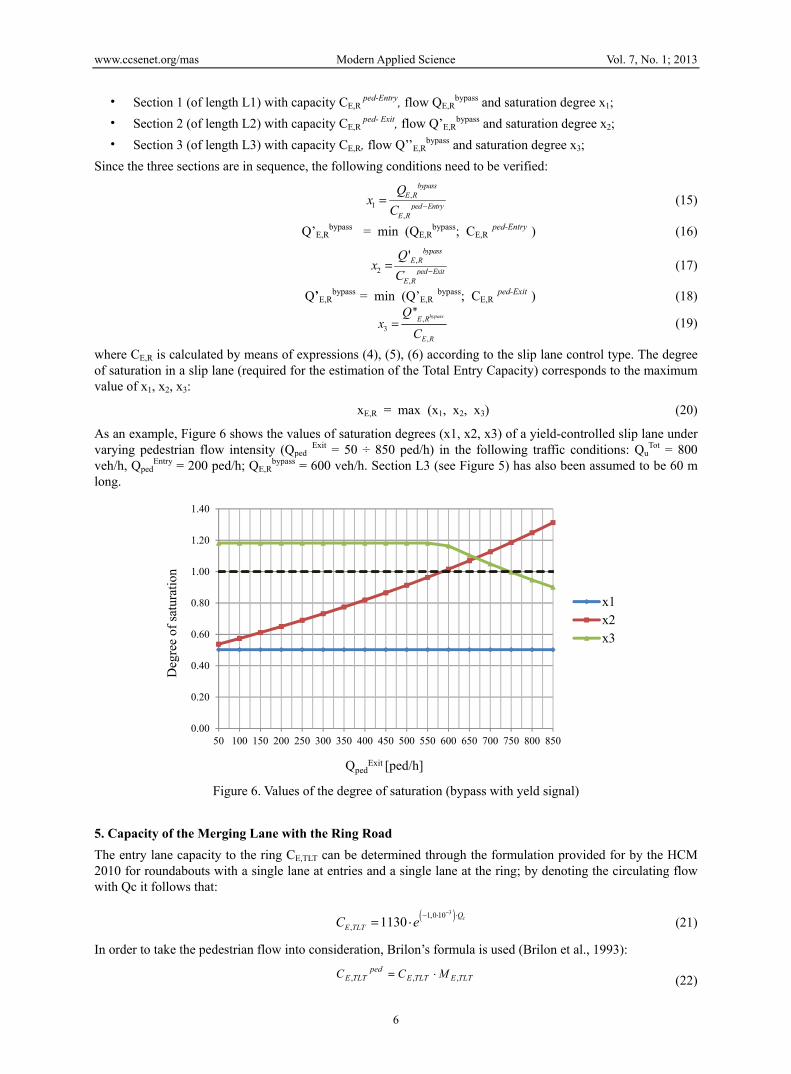
xE,R = max (x1, x2, x3) (20)
As an example, Figure 6 shows the values of saturation degrees (x1, x2, x3) of a yield-controlled slip lane under varying pedestrian flow intensity (Qped
Exit = 50 ÷ 850 ped/h) in the following traffic conditions: QuTot = 800
veh/h, QpedEntry = 200 ped/h; QE,R
bypass = 600 veh/h. Section L3 (see Figure 5) has also been assumed to be 60 m long.
Figure 6. Values of the degree of saturation (bypass with yeld signal)
5. Capacity of the Merging Lane with the Ring Road
The entry lane capacity to the ring CE,TLT can be determined through the formulation provided for by the HCM 2010 for roundabouts with a single lane at entries and a single lane at the ring; by denoting the circulating flow with Qc it follows that:
31,0 10
, 1130 cQ
E TLTC e (21)
In order to take the pedestrian flow into consideration, Brilon’s formula is used (Brilon et al., 1993):
TLTETLTEped
TLTE MCC ,,, (22)
0.00
0.20
0.40
0.60
0.80
1.00
1.20
1.40
50 100 150 200 250 300 350 400 450 500 550 600 650 700 750 800 850
Deg
ree
of s
atur
atio
n
QpedExit [ped/h]
x1x2x3
www.ccsenet.org/mas Modern Applied Science Vol. 7, No. 1; 2013
7
)0,65-1069/()Q0,00073Q0,644-0,715-1119,5( cpedcpedc, QQQM TLTE (23)
ME,TLT = through and left-turn lane pedestrian capacity reduction factor;
CE,TLT ped = through and left-turn lane vehicle capacity, impact of pedestrians considered [veh/h];
CE,TLT = through and left-turn lane vehicle capacity (no pedestrians crossing, only vehicles) [veh/h];
The respective saturation degree of a lane is given by:
,
, ,
,E TLT
no bypassE TLT E R
pedE TLT
Q Qx
C
(24)
6. Total Entry Capacity
After obtaining the entry lane capacity of a slip lane, by denoting the saturation degrees (entry flow/capacity ratio) with x, the entry capacity (CE
ped) can be estimated through the following relation (Mauro & Branco, 2010; Corriere & Guerrieri, 2012; Giuffrè et al., 2012):
, ,
, ,
( )
max[ ; ]E R E TLTped
EE R E TLT
Q QC
x x
(25)
Where QE,R, QE,TLT, xE,R, xE,TLT are respectively flows and degree of saturation at the two lanes of the entry E.
7. Determination of Delays, Levels of Service and Length of the Queue
Once the capacity and saturation degrees of entry lanes have been obtained, it is possible to determine the delays and the levels of service for each lane and the entry itself. To this end, the following relations contemplated by the Manual HCM 2010 can be applied, suitably modified to take any pedestrian flow into consideration:
,
,
, , , ,2,
, , , ,
3600( ) ( )
3600900 1 ( 1) 5 min[ ,1]
450E TLT
E TLT
ped pedE TLT E TLT E TLT E TLTped
E TLT ped ped ped pedE TLT E TLT E TLT E TLT
Q
QQ C C QD T
TC C C C
(26)
,
, , , , ,2,
, , , ,
3600( ) ( )
3600900 1 ( 1) 5 min[ ,1]
450
E Rped ped
E R E R E R E R E RpedE R ped ped ped ped
E R E R E R E R
Q
Q Q C C QD T
TC C C C
(27)
, , , ,
, ,
ped pedE R E R E TLT E TLTped
EE R E TLT
D Q D QD
Q Q
(28)
where DE,Rped, QE,R, DE,TLT
ped, QE,TLT are respectively delays and flow rates at the two lanes of the entry E. T is the reference time (T = 1 for 1-hour analysis; T = 0.25 for 15-minute analysis). The levels of service referred to the delay values obtained by means of the previous relations (26), (27) and (28) are shown in Table 1 (HCM, 2010).
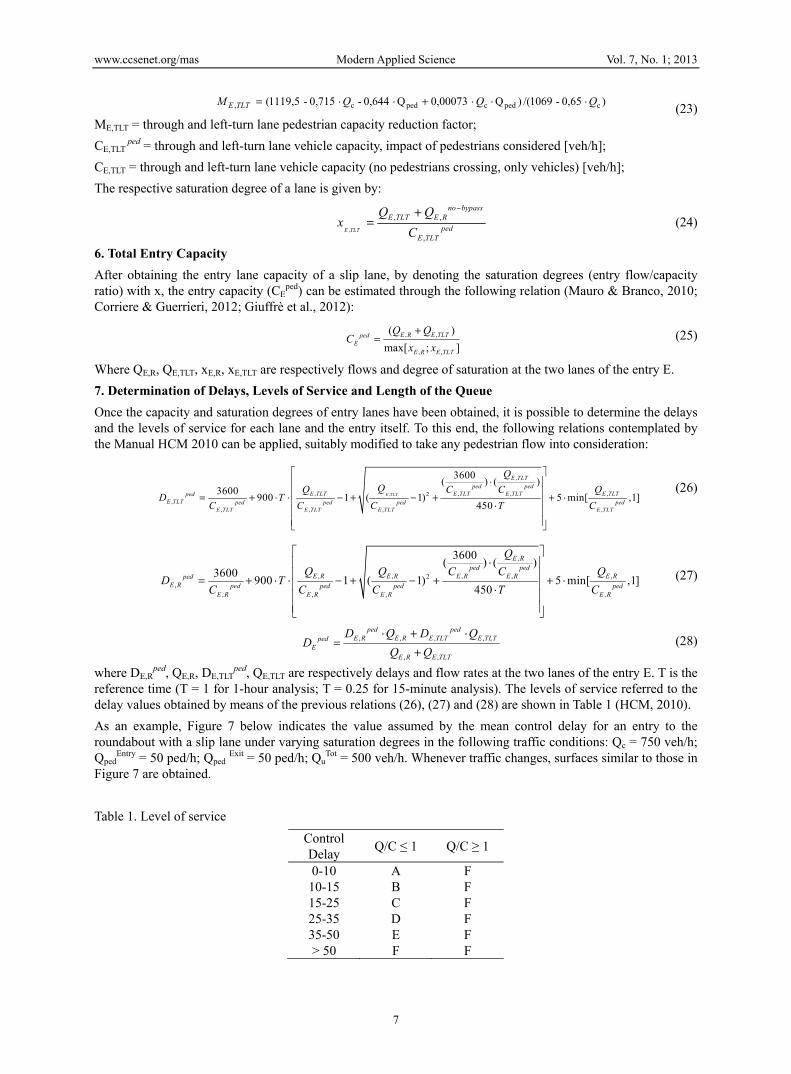
As an example, Figure 7 below indicates the value assumed by the mean control delay for an entry to the roundabout with a slip lane under varying saturation degrees in the following traffic conditions: Qc = 750 veh/h; Qped
Entry = 50 ped/h; Qped Exit = 50 ped/h; Qu
Tot = 500 veh/h. Whenever traffic changes, surfaces similar to those in Figure 7 are obtained.
Table 1. Level of service
Control Delay
Q/C ≤ 1 Q/C ≥ 1
0-10 A F 10-15 B F 15-25 C F 25-35 D F 35-50 E F > 50 F F
www.ccsen
8. Functio
In order tothan convematrices. Ilayout has
The geome
• Rou
• Rou
• Rou
• Con
• Con
• Con
In order to
• Equ
• Equ
• Equ
• Theent
• Theent
• Theentfoll
For each land (28). T
• O/D
net.org/mas
onal Compari
o identify the tentional roundIt is noteworththe same beha
etric layouts co
undabouts wit
undabouts wit
undabouts wit
nventional rou
nventional rou
nventional rou
o determine the
uation (4) for r
uation (5) for r
uation (6) for r
e formula sugtries and 1 lane
e formula sugtries and two la
e formulas sugtries and a doulowing:
layout under sThe traffic con
D Matrices - O
son
traffic conditiodabouts in termhy to point outaviour as in flo
ompared to on
th stop-control
th yield-contro
th Free-flow sl
undabouts with
undabouts with
undabouts with
e capacities, th
roundabouts w
roundabouts w
roundabouts w
ggested by thee at the ring – l
ggested by theanes at the ring
ggested by theuble lane at th
study the meannditions examin
Origin/destina
1
0
20
40
60
80
DE
[s/v
eh]
Modern
Figure 7. Ent
ons which makms of functiona
t that if there iower roundabo
ne another are t
led slip lanes (
olled slip lanes
lip lanes (at eac
h a single lane
h a single lane
h a double lane
he following fo
with a stop-con
with a yield-con
with a free-flow
e HCM 2010 Mlayout (1+1):
CE =
e HCM 2010 Mg – layout (1+2
CE =
e HCM 2010 he ring – layo
CE,R
CE,TLT
n control delayned are the fol
ation matrices
02
0,40,
60,8
n Applied Scienc
8
try mean contr
ke roundaboutsality, specific ais a right-turn
outs (see Figur
the following:
(at each leg);
(at each leg);
ch leg);
at entries and
at entries and
e at entries and
ormulations ha
ntrolled slip lan
ntrolled slip la
w slip lane;
Manual for co
= 1130·e-0,0001·Q
Manual for co2):
= 1130·e-0,007·Q
Manual for coout (2+2). For
= 1130·e-0,0007
= 1130·e-0,000
ys have been llowing:
of traffic flow
0
0,2 0
ce
ol delay
s with a right-tanalyses have b
slip lane at eare 1c).
a single lane a
a double lane
d a double lane
ave been used:
ne;
ane;
onventional ro
Qc
onventional ro
Qc
onventional ror the two lane
7·Qc 075·Qc
determined by
ws in percentag
0.2
0.4
0.6 0.
81
Qc = 750 vehQped
Entry = 50Qped
Exit = 50 Qu
Tot =500 v
turn slip lane mbeen carried ouach leg, the fu
at the ring – lay
at the ring – la
e at the ring – l
oundabouts wi
oundabouts wi
oundabouts wits at entries th
y employing E
ge terms - (the
h/h0 ped/h ped/h
veh/h
Vol. 7, No. 1;
more advantagut for differentunctional geom
yout (1+1);
ayout (1+2);
layout (2+2).
ith a single la
ith a single la
th a double lahe formulas ar
Equations (26)
e leg numerati
2013
geous t O/D
metric
ne at
(29)
ne at
(30)
ne at e the
(31)
(32)
(27)
on is
www.ccsenet.org/mas Modern Applied Science Vol. 7, No. 1; 2013
9
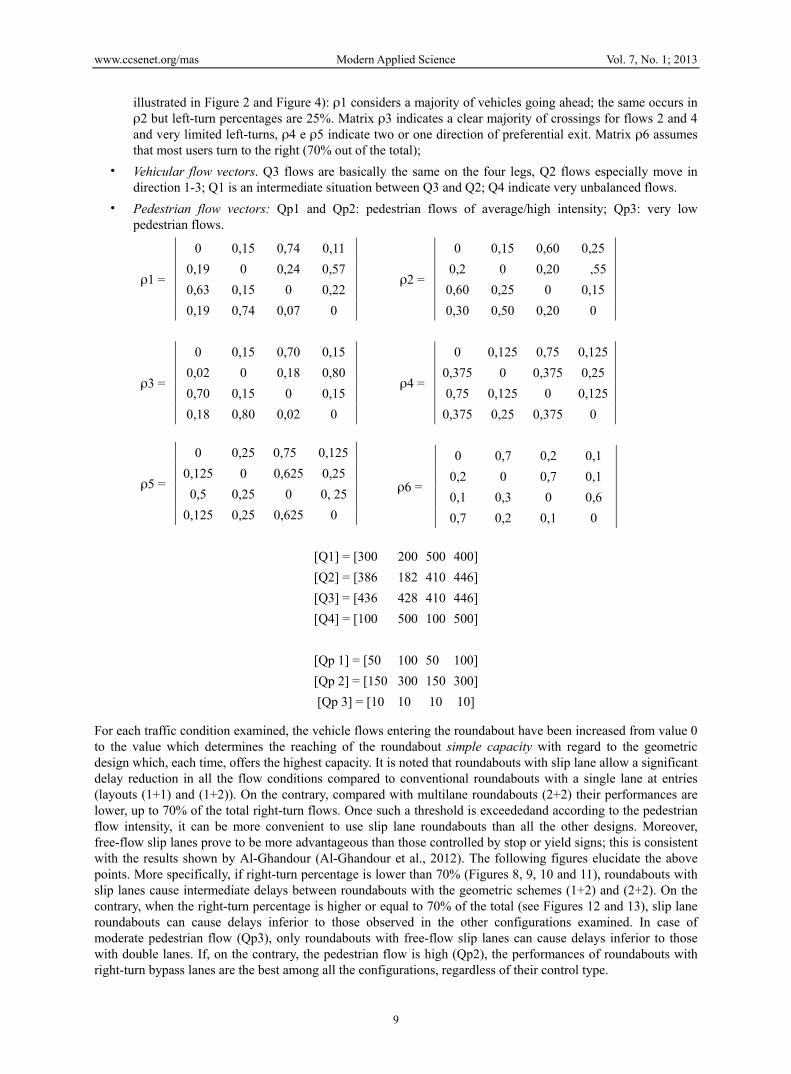
illustrated in Figure 2 and Figure 4): 1 considers a majority of vehicles going ahead; the same occurs in 2 but left-turn percentages are 25%. Matrix 3 indicates a clear majority of crossings for flows 2 and 4 and very limited left-turns, 4 e 5 indicate two or one direction of preferential exit. Matrix 6 assumes that most users turn to the right (70% out of the total);
• Vehicular flow vectors. Q3 flows are basically the same on the four legs, Q2 flows especially move in direction 1-3; Q1 is an intermediate situation between Q3 and Q2; Q4 indicate very unbalanced flows.
• Pedestrian flow vectors: Qp1 and Qp2: pedestrian flows of average/high intensity; Qp3: very low pedestrian flows.
1 =
0 0,15 0,74 0,11
0,19 0 0,24 0,57
0,63 0,15 0 0,22
0,19 0,74 0,07 0
2 =
0 0,15 0,60 0,25
0,2 0 0,20 ,55
0,60 0,25 0 0,15
0,30 0,50 0,20 0
3 =
0 0,15 0,70 0,15
0,02 0 0,18 0,80
0,70 0,15 0 0,15
0,18 0,80 0,02 0
4 =
0 0,125 0,75 0,125
0,375 0 0,375 0,25
0,75 0,125 0 0,125
0,375 0,25 0,375 0
5 =
0 0,25 0,75 0,125
0,125 0 0,625 0,25
0,5 0,25 0 0, 25
0,125 0,25 0,625 0
=
0 0,7 0,2 0,1
0,2 0 0,7 0,1
0,1 0,3 0 0,6
0,7 0,2 0,1 0
[Q1] = [300 200 500 400]
[Q2] = [386 182 410 446]
[Q3] = [436 428 410 446]
[Q4] = [100 500 100 500]
[Qp 1] = [50 100 50 100]
[Qp 2] = [150 300 150 300]
[Qp 3] = [10 10 10 10]
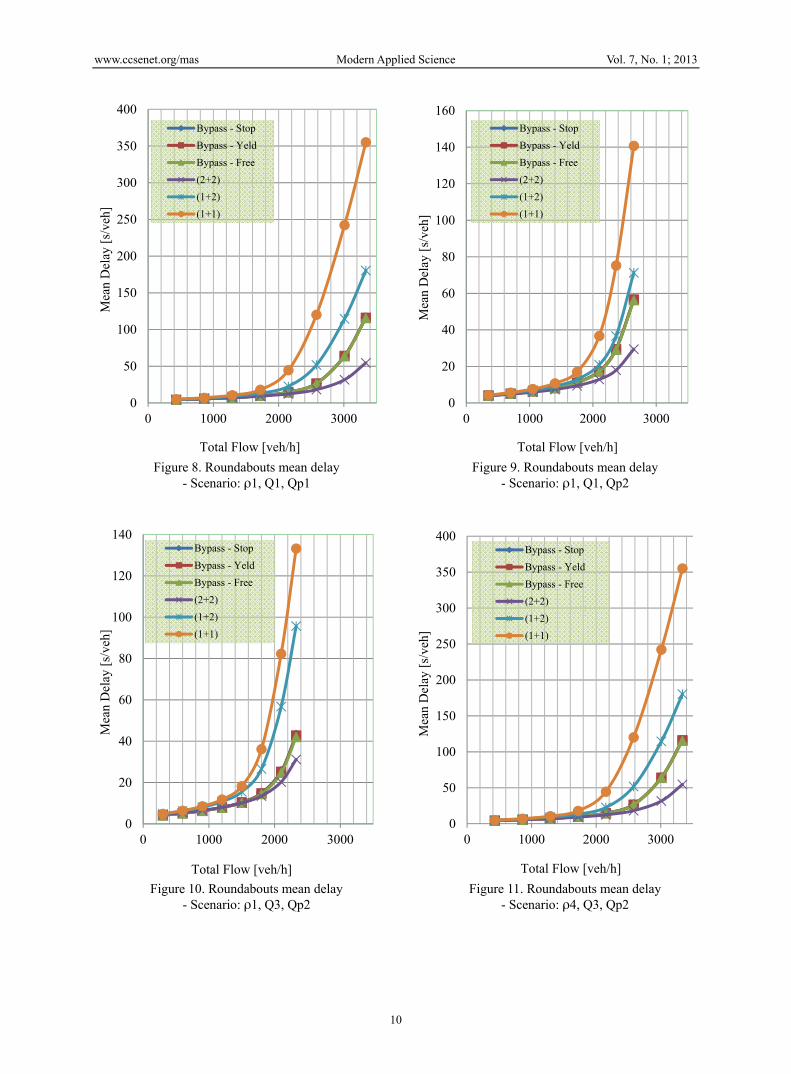
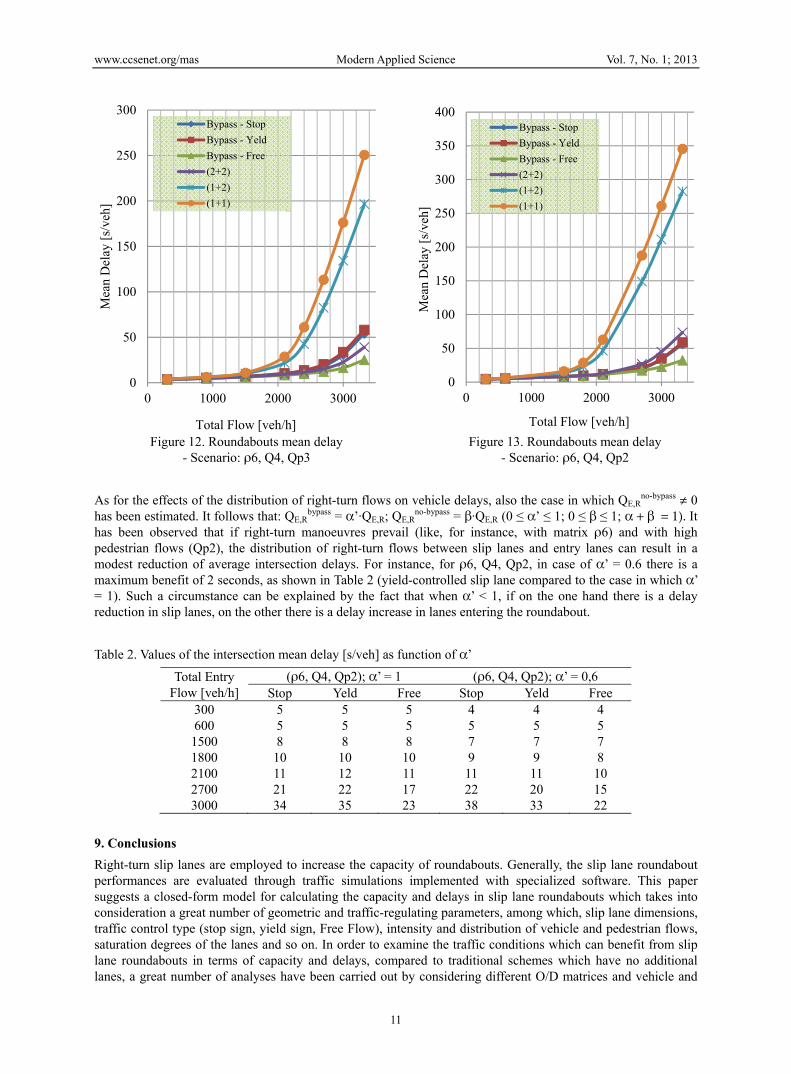
For each traffic condition examined, the vehicle flows entering the roundabout have been increased from value 0 to the value which determines the reaching of the roundabout simple capacity with regard to the geometric design which, each time, offers the highest capacity. It is noted that roundabouts with slip lane allow a significant delay reduction in all the flow conditions compared to conventional roundabouts with a single lane at entries (layouts (1+1) and (1+2)). On the contrary, compared with multilane roundabouts (2+2) their performances are lower, up to 70% of the total right-turn flows. Once such a threshold is exceededand according to the pedestrian flow intensity, it can be more convenient to use slip lane roundabouts than all the other designs. Moreover, free-flow slip lanes prove to be more advantageous than those controlled by stop or yield signs; this is consistent with the results shown by Al-Ghandour (Al-Ghandour et al., 2012). The following figures elucidate the above points. More specifically, if right-turn percentage is lower than 70% (Figures 8, 9, 10 and 11), roundabouts with slip lanes cause intermediate delays between roundabouts with the geometric schemes (1+2) and (2+2). On the contrary, when the right-turn percentage is higher or equal to 70% of the total (see Figures 12 and 13), slip lane roundabouts can cause delays inferior to those observed in the other configurations examined. In case of moderate pedestrian flow (Qp3), only roundabouts with free-flow slip lanes can cause delays inferior to those with double lanes. If, on the contrary, the pedestrian flow is high (Qp2), the performances of roundabouts with right-turn bypass lanes are the best among all the configurations, regardless of their control type.
www.ccsenet.org/mas Modern Applied Science Vol. 7, No. 1; 2013
10
Figure 8. Roundabouts mean delay - Scenario: 1, Q1, Qp1
Figure 9. Roundabouts mean delay - Scenario: 1, Q1, Qp2
Figure 10. Roundabouts mean delay - Scenario: 1, Q3, Qp2
Figure 11. Roundabouts mean delay - Scenario: 4, Q3, Qp2
0
50
100
150
200
250
300
350
400
0 1000 2000 3000
Mea
n D
elay
[s/
veh]
Total Flow [veh/h]
Bypass - Stop
Bypass - Yeld
Bypass - Free
(2+2)
(1+2)
(1+1)
0
20
40
60
80
100
120
140
160
0 1000 2000 3000M
ean
Del
ay [
s/ve
h]
Total Flow [veh/h]
Bypass - Stop
Bypass - Yeld
Bypass - Free
(2+2)
(1+2)
(1+1)
0
20
40
60
80
100
120
140
0 1000 2000 3000
Mea
n D
elay
[s/
veh]
Total Flow [veh/h]
Bypass - Stop
Bypass - Yeld
Bypass - Free
(2+2)
(1+2)
(1+1)
0
50
100
150
200
250
300
350
400
0 1000 2000 3000
Mea
n D
elay
[s/
veh]
Total Flow [veh/h]
Bypass - Stop
Bypass - Yeld
Bypass - Free
(2+2)
(1+2)
(1+1)
www.ccsenet.org/mas Modern Applied Science Vol. 7, No. 1; 2013
11
Figure 12. Roundabouts mean delay - Scenario: 6, Q4, Qp3
Figure 13. Roundabouts mean delay - Scenario: 6, Q4, Qp2
As for the effects of the distribution of right-turn flows on vehicle delays, also the case in which QE,Rno-bypass 0
has been estimated. It follows that: QE,Rbypass = ’·QE,R; QE,R
no-bypass = ·QE,R (0 ≤ ’≤ 1; 0 ≤ ≤ 1; It has been observed that if right-turn manoeuvres prevail (like, for instance, with matrix 6) and with high pedestrian flows (Qp2), the distribution of right-turn flows between slip lanes and entry lanes can result in a modest reduction of average intersection delays. For instance, for 6, Q4, Qp2, in case of ’ = 0.6 there is a maximum benefit of 2 seconds, as shown in Table 2 (yield-controlled slip lane compared to the case in which ’ = 1). Such a circumstance can be explained by the fact that when ’ < 1, if on the one hand there is a delay reduction in slip lanes, on the other there is a delay increase in lanes entering the roundabout.
Table 2. Values of the intersection mean delay [s/veh] as function of ’
Total Entry Flow [veh/h]
(6, Q4, Qp2); ’ = 1 (6, Q4, Qp2); ’ = 0,6 Stop Yeld Free Stop Yeld Free
300 5 5 5 4 4 4 600 5 5 5 5 5 5 1500 8 8 8 7 7 7 1800 10 10 10 9 9 8 2100 11 12 11 11 11 10 2700 21 22 17 22 20 15 3000 34 35 23 38 33 22
9. Conclusions
Right-turn slip lanes are employed to increase the capacity of roundabouts. Generally, the slip lane roundabout performances are evaluated through traffic simulations implemented with specialized software. This paper suggests a closed-form model for calculating the capacity and delays in slip lane roundabouts which takes into consideration a great number of geometric and traffic-regulating parameters, among which, slip lane dimensions, traffic control type (stop sign, yield sign, Free Flow), intensity and distribution of vehicle and pedestrian flows, saturation degrees of the lanes and so on. In order to examine the traffic conditions which can benefit from slip lane roundabouts in terms of capacity and delays, compared to traditional schemes which have no additional lanes, a great number of analyses have been carried out by considering different O/D matrices and vehicle and
0
50
100
150
200
250
300
0 1000 2000 3000
Mea
n D
elay
[s/
veh]
Total Flow [veh/h]
Bypass - Stop
Bypass - Yeld
Bypass - Free
(2+2)
(1+2)
(1+1)
0
50
100
150
200
250
300
350
400
0 1000 2000 3000
Mea
n D
elay
[s/
veh]
Total Flow [veh/h]
Bypass - Stop
Bypass - Yeld
Bypass - Free
(2+2)
(1+2)
(1+1)
www.ccsenet.org/mas Modern Applied Science Vol. 7, No. 1; 2013
12
pedestrian flow vectors. The results of the analyses show that roundabouts with right-turn bypass lane lead to a significant delay reduction in any flow condition compared to conventional roundabouts with one lane at entries ((1+1) or (1+2) layouts). Compared to multilane roundabouts (2 ring lanes + 2 entry lanes), slip lane roundabouts cause more serious delays, in the case of right-turn flows up to 70% of the total. When such a threshold is exceeded slip lane roundabouts appear to be more convenient than any other design, in that the average vehicle delays decrease in a more and more marked manner in the presence of the same traffic volume. Moreover, among the slip lane types, those with a free-flow lane are more advantageous than those with a stop or yield sign. Finally, we have observed that the distribution of right-turn flows between a slip lane and a lane entering the roundabout (’ < 1) can cause a slight reduction in the average intersection delays; this exclusively happens when the right-turn percentage is higher than 70%.
References
Al-Ghandour, M., Schroeder, B., Rasdorf, W., & Williams, B. (2012). Delay Analysis of Single-Lane Roundabout with a Slip Lane under Varying Exit Types. Experimental Balanced Traffic Volumes, and Pedestrians: Using Microsimulation, TRB, Annual Meeting.
Brilon W., Stuwe B., & Drews O. (1993). Sicherheit und Leistungsfähigkeit von Kreisverkehrsplätzen. Institute for Traffic Engineering, Ruhr Universität, Bochum (Deutschland).
Corriere, F., & Guerrieri, M. (2012). Performance analysis of basic turbo-roundabout in urban context. Procedia - Social and Behavioral Sciences, 53(3), 622-632. http://dx.doi.org/10.1016/j.sbspro.2012.09.912
FHWA. (2004). Pedestrian Safety Guide and Countermeasure Selection System (PEDSAFE). Improved Right-Turn Slip-Lane Design. Report No. FHWA-SA-04-003.
Fortuijn, L. G. H. (2009). Turbo Roundabouts: Estimation of Capacity. Transportation Research Record, 2130(2009), 83-92. http://dx.doi.org/10.3141/2130-11
Giuffrè, O., Granà, A., & Marino, S. (2012). Comparing Performances of Turbo-roundabouts and Double-lane Roundabouts. Modern Applied Science, 6(10), 70-79. http://dx.doi.org/10.5539/mas.v6n10p70
HCM. (2010). Highway Capacity Manual (ed.). Transportation Research Board, TRB.
Khintchine, A. Y. (1932). Mathematical theory of a stationary queue. Matematicheskii Sbornik, 39(4).
Kleinlock, L. (1975). Queuing Systems, I. New York: John Wiley and Sons.
Mauro, R., & Branco, F. (2010). Comparative Analysis of Compact Multilane Roundabouts and Turbo-Roundabouts. Journal of Transportation Engineering, 136(4), 316-322. http://dx.doi.org/10.1061/(ASCE)TE.1943-5436.0000106
Mauro, R., & Cattani, M. (2012). Functional and Economic Evaluations for Choosing Road Intersection Layout. Promet–Traffic & Transportation, 24(5). http://dx.doi.org/10.7307/ptt.v24i5.1180
Mauro, R., & Branco, F. (2012). Two Vehicular Headways Time Dichotomic Models. Modern Applied Science, 6(12), 1-12. http://dx.doi.org/10.5539/mas.v6n12p1
Marlow, M., & Maycock, G. (1982). The Effect of Zebra Crossings on Junction Entry Capacities. Report SR 742, Transport and Road Research Laboratory (TRRL), Crowthorne, Berkshire, England.
NCHRP Report 672. (2010). Roundabouts: An Informational Guide - Second Edition, TRB.
Pollaczek, F. (1930). Über eine Aufgabe der Wahrscheinlichkeitstheorie. Mathematische Zeitschrift.
Tollazzi, T., Renčelj, M., & Turnšek, S. (2011). New Type of Roundabout: Roundabout with “Depressed” Lanes for Right Turning - “Flower Roundabout”. Promet – Traffic & Transportation, 23(5), 353-358.
Tracz, M. (2008). Analysis of Small Roundabouts’ Capacity. National roundabout conference, Kansas City, Missouri.
Tracz, M., Chodur, J., & Ostrowsk, K. (2011). Roundabouts Country report - Poland. 6th International Symposium on Highway Capacity and Quality of Service, Stockholm.
Turborotondes, CROW publicatie 257, April 2008.
Wytyczne Projektowania Skrzyzowan Drogowych, Czesc II. (2001). Warszawa (Road intersections design guidelines - Part II).


![Why Roundabouts? [Infographic]](https://img.pdfslide.net/doc/110x75/5479635fb479599f098b4744/why-roundabouts-infographic.jpg)