Embed Size (px)
Citation preview

Copyright © 2018, Rightmove plc. Released 16th April. For media enquiries and interviews please contact the Rightmove press office: T | 020 7087 0605 M | 07894 255295 or E | [email protected]
Rightmove House Price IndexThe largest monthly sample of residential property prices
April 2018National edition

Copyright © 2018, Rightmove plc. Released 16th April. For media enquiries and interviews please contact the Rightmove press office: T | 020 7087 0605 M | 07894 255295 or E | [email protected]
• Prices of new-to-the-market property rise by modest 0.4% (+£1,228) this month, but enough to push the national average to a new record of £305,732
• Surpasses previous national high of £304,943 set in July 2017 by 0.3%, with six out of eleven regions also hitting new peaks
• Record monthly visits to Rightmove in March indicate strong interest in property, though the subdued 1.6% annual rate of price increase warns that many buyers are increasingly price sensitive
• On average sellers are achieving 96.7% of their final asking price, a gap of just over £10,000 on the current national asking price, though this varies by region, location and property
National average asking prices
Month Avg. asking price Monthly change Annual change Index
April 2018 £305,732 +0.4% +1.6% 236.4
March 2018 £304,504 +1.5% +2.1% 235.4
National average asking prices by market sector (excluding Inner London)
Sector April 2018 March 2018 Monthly change Annual change
First-time buyers £190,643 £189,840 +0.4% +2.2%
Second-steppers £273,698 £272,031 +0.6% +2.7%
Top of the ladder £541,993 £537,171 +0.9% +0.9%
Price of property coming to market reaches record high
2
Rightmove measured 114,276 asking prices this month, circa 90% of the UK market. The properties were put on sale by estate agents from 11th March 2018 to 7th April 2018 and advertised on Rightmove.co.uk.
£220,000
£230,000
£240,000
£250,000
£260,000
£270,000
£280,000
£290,000
£300,000
£310,000
£320,000
Apr-13 Oct-13 Apr-14 Oct-14 Apr-15 Oct-15 Apr-16 Oct-16 Apr-17 Oct-17 Apr-18
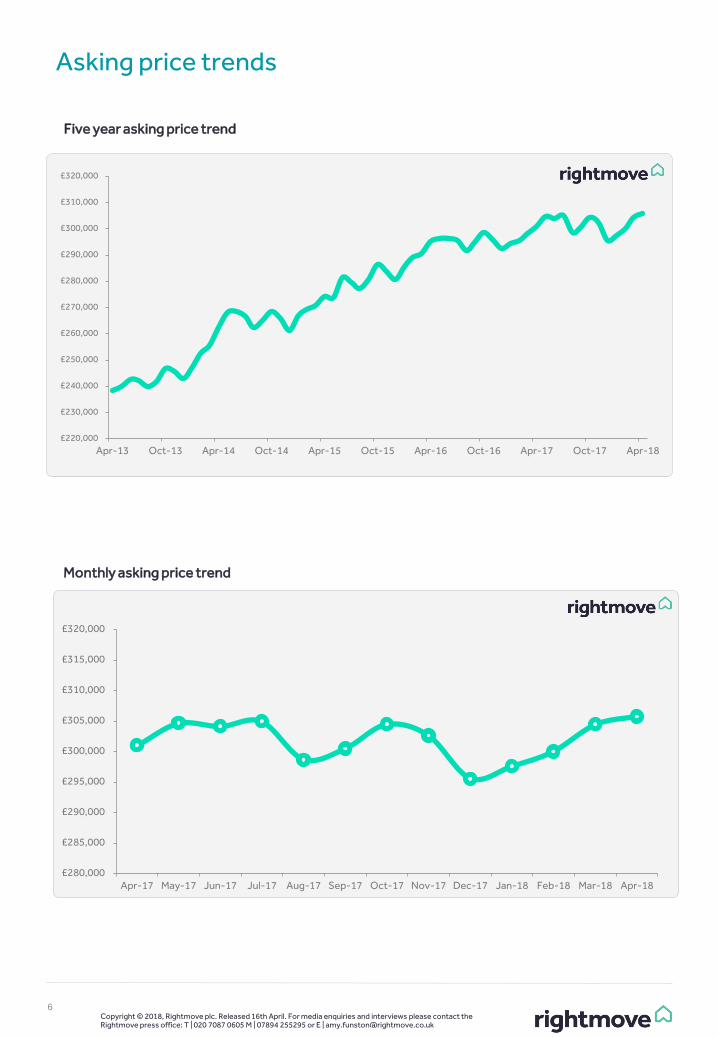
Five year asking price trend

Copyright © 2018, Rightmove plc. Released 16th April. For media enquiries and interviews please contact the Rightmove press office: T | 020 7087 0605 M | 07894 255295 or E | [email protected]
The national average asking price of new-to-the-market property has hit a new record of £305,732. This is £789 (+0.3%) higher than the previous record of £304,943 set nine months ago, in July 2017. Record visits to the Rightmove website in March indicate strong interest in property, though the subdued annual rise of 1.6% shows that many buyers are increasingly price sensitive.
Miles Shipside, Rightmove director and housing market analyst comments: “Home buyers are seeing average asking prices at their highest ever level with upwards price pressure getting stronger the further away you move from London. However, higher prices stretch buyers’ willingness to pay or ability to afford them. This month’s increase of 0.4% is the lowest at this time of year since 2008, though the subdued figure could partly be a re-balancing from the seasonally large 1.5% rise the previous month. The earlier Easter Bank Holidays and heavy snow disrupting property marketing will also have an effect on like-for-like comparisons with last year.”
March was the busiest month ever on the Rightmove website with over 142 million visits, showing that interest in property remains robust. However, different parts of the country and different sectors continue to operate at different speeds. The North West has the strongest annual rate of price increase (+4.3%) and is one of six out of eleven regions that have hit new records. The others are the East Midlands (+4.2%), Yorkshire & the Humber (+2.7%), South West (+2.6%), Wales (+2.4%), and the East of England (+1.2%). Typical first-time-buyer properties with two bedrooms or fewer are up by 2.2% average year-on-year, while the sector favoured by second-steppers, mainly comprising three-bedroom properties, sees a 2.7% rise. In contrast, the more expensive top of the ladder category, typically detached with four bedrooms or more, has a more muted annual rate of increase of 0.9% and is still behind its peak set in October 2017 (£542,347).
Shipside observes: “In the more popular locations and for the property with the right specifications, buyer demand is helping to push prices higher. A lack of choice is nudging prices up to test the ceiling of what the market will pay. It’s not rampant price inflation, and buyers can easily spot a speculative price and ignore a property that is out of line with others nearby, and is also likely to be out of kilter with their pocket.”
Rightmove analysis shows that the actual selling price being achieved nationally is 96.7% of the final asking price. Based on the current new seller asking price of £305,732, this would mean an average difference of over £10,000 (3.3%), indicative of some sellers demanding unrealistically high asking prices. Nationally this percentage gap has increased from 2.8% to 3.3% over the past two years, evidence of a more challenging market in some locations.
At a regional level there have been some interesting and greater shifts. In the West Midlands, the price achieved has risen from 96.4% of the final asking price in 2014 to 97.5% in 2018, making it the strongest region outside Scotland for achieving near asking price. In London, sellers were achieving 98.9% of the asking price back in 2014, and that has fallen to 95.6% this year, meaning a current difference of over £27,000 on the new seller average asking price in the capital of £628,039. Vibrant Scotland has the smallest difference with sellers achieving 99.4% of the final asking price, but its different selling system is an influence here. We stress that these are just averages and should not be treated as a rule of thumb that buyers should expect off any property up for sale. Many properties still sell for the asking price or even over if sought-after or attractively priced in the first place.
Shipside advises: “The average gap of over £10,000 between the final asking price and the price the home actually sells for is a national average and can only be tracked on properties that have actually sold. Property that is over-priced and has not yet sold may need to be priced more attractively in order to attract a buyer in the first place. As a buyer, doing your research before you decide what to offer is essential, as the market is often hyper-local with prices depending on local supply and demand and how sensible sellers and their agents are with their asking prices. As a seller, if your property is initially over-priced, you may find it much harder to achieve a sale at any price as increasingly price-sensitive buyers might just ignore it.”
3
Overview
“A lack of choice is nudging prices up to test the ceiling of what the market will pay. It’s not rampant price inflation, and buyers can easily spot a speculative price and ignore a property that is out of line with others nearby, and is also likely to be out of kilter with their pocket.” Miles Shipside, Rightmove director and housing market analyst

Copyright © 2018, Rightmove plc. Released 16th April. For media enquiries and interviews please contact the Rightmove press office: T | 020 7087 0605 M | 07894 255295 or E | [email protected]
4
Agents’ views
Mark Manning, Director of Manning Stainton in Leeds, Harrogate, Wetherby and Wakefield said: “Our sales numbers have been a little weaker which may be down in part to the weather but also might be because the price of property coming to market continues to be pushed that little higher with each month that passes and in some cases simply too high. With new buyer registrations also higher over the first three months it is more than likely that the latter is the case as buyers remain cautious of overpaying for their next property. We have continued to see strong growth in the number of new first-time buyers with a 15% increase compared to last year and not surprisingly further upward movement in our average house price with the biggest rises in the in the middle market and those looking for family homes near good schools which remain in short supply.”
Lucy Pendleton, Co-Founder Director of independent estate agents James Pendleton in South London, said: “We are always telling vendors to be realistic and price their property keenly to fuel interest. However, many don’t, and this is a favourite way for vendors to shoot themselves in the foot. The difference between asking and sold price proves just how many houses have been priced badly recently and that always happens when we see a shift from a sellers’ to a buyers’ market in London. Many sellers could have improved the amount paid for their homes if they had encouraged more viewings on day one, rather than going for gold with an over-ambitious ticket price. Being in denial about this means you will only deny yourself the best possible price for your property.”
David Plumtree, Connells Group Estate Agency Chief Executive, says: “Following a brisk start to the year with applicant registrations in January exceeding those levels seen in January 2017, buyer sentiment weakened as the quarter progressed. The adverse weather may have contributed to this, but it is clear to see that market conditions have somewhat ‘softened’ due in part to affordability concerns. We do, however, expect market conditions to show improvement, as is traditional at this time of year, and saw some signs of resurgence over Easter and therefore anticipate a stronger Spring period. It remains a sellers’ market with an imbalance between buyer demand and available stock - lack of stock continues to be an issue for our branches.”
Difference from final asking price to sold price

Copyright © 2018, Rightmove plc. Released 16th April. For media enquiries and interviews please contact the Rightmove press office: T | 020 7087 0605 M | 07894 255295 or E | [email protected]
5
Average time to sell and stock
60
5554 55 55
5758
59
62
67
72
65
61
40
45
50
55
60
65
70
75
80
Mar-17 Apr-17 May-17 Jun-17 Jul-17 Aug-17 Sep-17 Oct-17 Nov-17 Dec-17 Jan-18 Feb-18 Mar-18
Average 'time to sell' (no. of days) - National
4547
49 50 50 50 49 4847
43 42 4345
0
10
20
30
40
50
60
Mar-17 Apr-17 May-17 Jun-17 Jul-17 Aug-17 Sep-17 Oct-17 Nov-17 Dec-17 Jan-18 Feb-18 Mar-18
Average stock per agent (including Under Offer/Sold STC)
Copyright © 2018, Rightmove plc. Released 16th April. For media enquiries and interviews please contact the Rightmove press office: T | 020 7087 0605 M | 07894 255295 or E | [email protected]
6
Asking price trends
£220,000
£230,000
£240,000
£250,000
£260,000
£270,000
£280,000
£290,000
£300,000
£310,000
£320,000
Apr-13 Oct-13 Apr-14 Oct-14 Apr-15 Oct-15 Apr-16 Oct-16 Apr-17 Oct-17 Apr-18
Five year asking price trend
£280,000
£285,000
£290,000
£295,000
£300,000
£305,000
£310,000
£315,000
£320,000
Apr-17 May-17 Jun-17 Jul-17 Aug-17 Sep-17 Oct-17 Nov-17 Dec-17 Jan-18 Feb-18 Mar-18 Apr-18
Monthly asking price trend

Copyright © 2018, Rightmove plc. Released 16th April. For media enquiries and interviews please contact the Rightmove press office: T | 020 7087 0605 M | 07894 255295 or E | [email protected]
7
Asking price trends
0.9%1.2%
-0.2%
0.3%
-2.1%
0.6%
1.3%
-0.6%
-2.3%
0.7% 0.8%
1.5%
0.4%
-3.0%
-2.5%
-2.0%
-1.5%
-1.0%
-0.5%
0.0%
0.5%
1.0%
1.5%
2.0%
Apr-17 May-17 Jun-17 Jul-17 Aug-17 Sep-17 Oct-17 Nov-17 Dec-17 Jan-18 Feb-18 Mar-18 Apr-18
% monthly change in average asking prices

Copyright © 2018, Rightmove plc. Released 16th April. For media enquiries and interviews please contact the Rightmove press office: T | 020 7087 0605 M | 07894 255295 or E | [email protected]
Regional trends
8
Copyright © 2018, Rightmove plc. Released 16th April. For media enquiries and interviews please contact the Rightmove press office: T | 020 7087 0605 M | 07894 255295 or E | [email protected]
Transport for London zonesAvg. priceApr 2018
Avg. priceMar 2018
Monthly change
Avg. priceApr 2017
Annual change
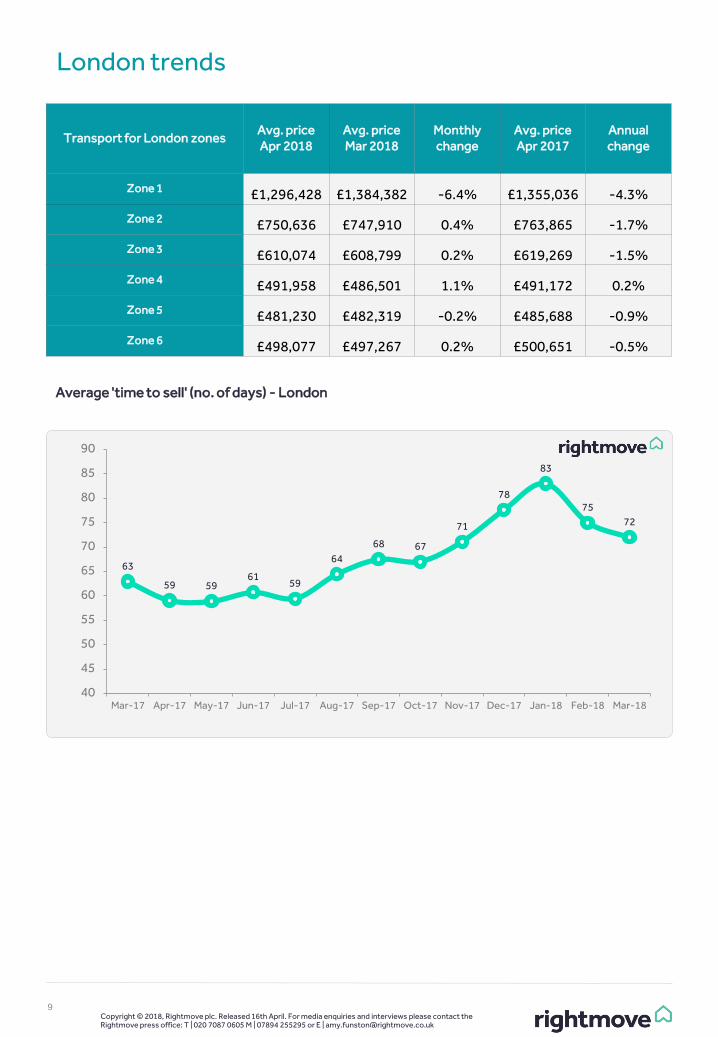
Zone 1 £1,296,428 £1,384,382 -6.4% £1,355,036 -4.3%
Zone 2 £750,636 £747,910 0.4% £763,865 -1.7%
Zone 3 £610,074 £608,799 0.2% £619,269 -1.5%
Zone 4 £491,958 £486,501 1.1% £491,172 0.2%
Zone 5 £481,230 £482,319 -0.2% £485,688 -0.9%
Zone 6 £498,077 £497,267 0.2% £500,651 -0.5%
9
London trends
63
59 5961
59
64
68 67
71
78
83
75
72
40
45
50
55
60
65
70
75
80
85
90
Mar-17 Apr-17 May-17 Jun-17 Jul-17 Aug-17 Sep-17 Oct-17 Nov-17 Dec-17 Jan-18 Feb-18 Mar-18
Average 'time to sell' (no. of days) - London

Copyright © 2018, Rightmove plc. Released 16th April. For media enquiries and interviews please contact the Rightmove press office: T | 020 7087 0605 M | 07894 255295 or E | [email protected]
10
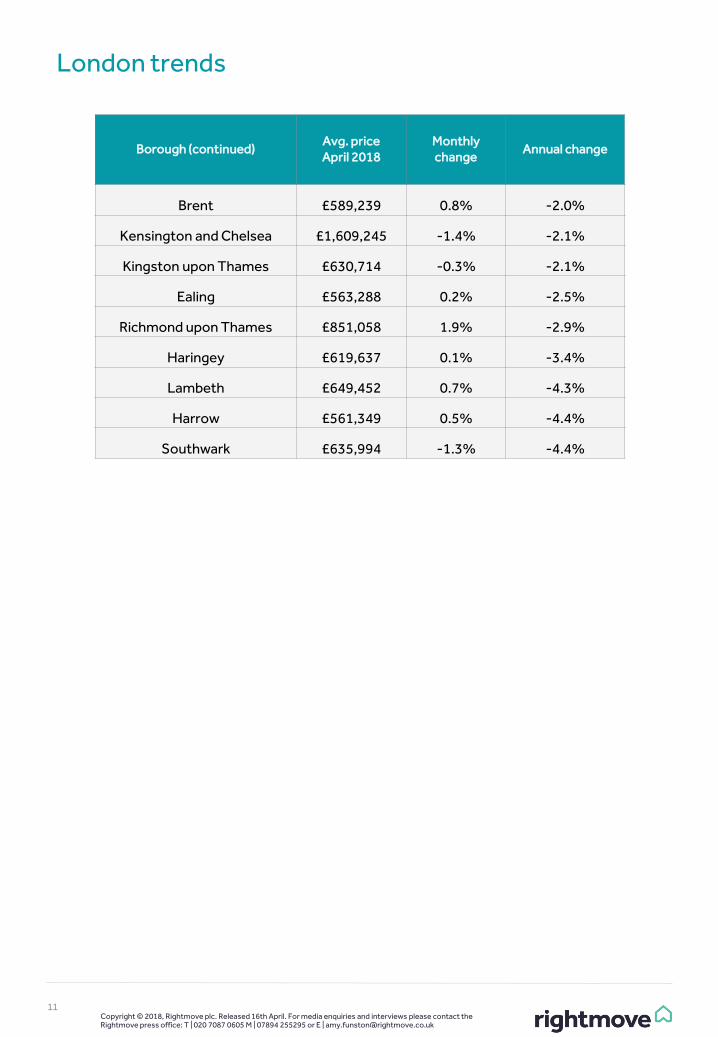
London trendsBorough data is based on a three month rolling average and can be used as an indicator of overall price trends in each borough over time. It is not directly comparable with the overall London monthly figures.
BoroughAvg. priceApril 2018
Monthly change Annual change
Bexley £409,236 -0.2% 2.0%
Barking and Dagenham £315,858 0.4% 2.0%
Barnet £661,456 0.0% 1.8%
Hounslow £559,981 0.0% 1.7%
Greenwich £455,404 0.9% 1.4%
Waltham Forest £491,468 1.4% 0.8%
Redbridge £455,279 0.3% 0.7%
Havering £408,643 -0.2% 0.6%
Bromley £540,364 0.5% 0.3%
Hillingdon £497,865 0.4% 0.2%
Croydon £444,477 0.2% 0.1%
Enfield £463,208 1.5% 0.0%
Hackney £663,456 -0.1% 0.0%
Camden £1,004,381 0.5% -0.2%
Sutton £470,055 0.4% -0.6%
Islington £780,608 1.6% -0.8%
Merton £656,808 0.1% -1.0%
Lewisham £476,782 0.1% -1.2%
Westminster £1,461,058 -0.2% -1.2%
Wandsworth £817,928 0.3% -1.3%
Newham £411,668 -0.5% -1.8%
Hammersmith and Fulham £943,120 -0.7% -2.0%
Tower Hamlets £591,309 -0.8% -2.0%
Boroughs continued overleaf
Copyright © 2018, Rightmove plc. Released 16th April. For media enquiries and interviews please contact the Rightmove press office: T | 020 7087 0605 M | 07894 255295 or E | [email protected]
11
London trends
Borough (continued)Avg. priceApril 2018
Monthlychange
Annual change
Brent £589,239 0.8% -2.0%
Kensington and Chelsea £1,609,245 -1.4% -2.1%
Kingston upon Thames £630,714 -0.3% -2.1%
Ealing £563,288 0.2% -2.5%
Richmond upon Thames £851,058 1.9% -2.9%
Haringey £619,637 0.1% -3.4%
Lambeth £649,452 0.7% -4.3%
Harrow £561,349 0.5% -4.4%
Southwark £635,994 -1.3% -4.4%

Copyright © 2018, Rightmove plc. Released 16th April. For media enquiries and interviews please contact the Rightmove press office: T | 020 7087 0605 M | 07894 255295 or E | [email protected]
12
Editor’s notes
About the Index:
The Rightmove House Price Index methodology was updated in January 2018. The report now includes data for Scotland and a number of measures have been refined. The stock per agent figure now calculates the average based on the number of properties an agent has on Rightmove each day across the month, rather than the average of the total number of properties each agent advertised in the month. London asking prices are now broken down into travel zones. For the purpose of historical comparisons, the historical figures have been restated based on the new methodology.
The Index includes asking price breakdowns in the housing market to offer trends at three different sectors of the market: first-time buyer, second-stepper and top of the ladder. Inner London prices have been excluded from this categorisation as the normal housing ladder is not really applicable.
Advertising property for over 90% of all UK estate agents, Rightmove is in a unique position to identify any immediate changes in the market. Rightmove’s House Price Index is compiled from the asking prices of properties coming onto the market via over 13,000 estate agency branches listing on Rightmove.co.uk. Rather than being a survey of opinions as with some other indices, it is produced from factual data of actual asking prices of properties currently on the market. The sample includes up to 200,000 homes each month – representing circa 90% of the market, the largest and most up-to-date monthly sample of any house price indicator in the UK. The Index differs from other house price indicators in that it reflects asking prices when properties first come onto the market, rather than those recorded by lenders during the mortgage application process or final sales prices reported to the Land Registry. In essence, Rightmove’s Index measures prices at the very beginning of the home buying and selling process while other indices measure prices at points later in the process. Having a large sample size and being very up-to-date, the Rightmove Index has established itself as a reliable indicator of current and future trends in the housing market.
Rightmove measured 114,276 asking prices this month, circa 90% of the UK market. The properties were put on sale by estate agents from 11th March 2018 to 7th April 2018 and advertised on Rightmove.co.uk.
Market sectors explained:
First-time buyer: This figure represents the typical property a first-time buyer would purchase, covering all two bed properties and smaller that come to market (houses and flats).
Second-stepper: This figure represents the typical property of a person moving from their first home, covering all three and four bed properties that come to market (houses and flats) excluding four bed detached houses.
Top of the ladder: This figure represents asking prices at the top end of the market, covering all five bed properties and above (houses and flats), as well as four bed detached houses.
About Rightmove.co.uk:
Rightmove.co.uk is the UK’s leading property website, displaying details of homes for sale or rent to the largest online audience. It is consistently ranked the number one property website in the UK (source: Experian Hitwise). It has circa 90% of all properties for sale and at any time displays a stock of over one million properties to buy or rent. The Rightmove.co.uk site attracts over 130 million visits from home movers each month with time on site averaging over one billion minutes per month (Rightmove data, July 2017).