Embed Size (px)
Citation preview

Research Collection
Doctoral Thesis
Polymer immobilization to metal oxide substrates throughcatechol derivatives as surface anchors
Author(s): Malisova, Barbora
Publication Date: 2010
Permanent Link: https://doi.org/10.3929/ethz-a-006253027
Rights / License: In Copyright - Non-Commercial Use Permitted
This page was generated automatically upon download from the ETH Zurich Research Collection. For moreinformation please consult the Terms of use.
ETH Library

DISS. ETH NO. 19307
Polymer Immobilization to Metal Oxide Substrates
through Catechol Derivatives as Surface Anchors
A dissertation submitted to
ETH Zurich
for the degree of
Doctor of Sciences
presented by
Barbora Malisova
Master, University of Chemistry & Technology (VSCHT), CZ
Born on April 20, 1979
citizen of Czech Republic
accepted on recommendation of
Prof. Dr. Marcus Textor, examiner
Prof. Dr. Karl Gademann, co-examiner
Prof. Dr. Markus Niederberger, co-examiner
Dr. Stefan Zürcher, co-examiner
2010


For my family


"Science is like sex: sometimes something useful comes out,
but that is not the reason we are doing it."
Richard P. Feynman


v
Acknowledgement
This work would not have been possible without the help of many people. At this point
I would like to thank all of them who contributed to this work and supported me during
the last few years.
First, I would like to thank Prof. Dr. Marcus Textor for giving me the opportunity to
work in his group as well as to learn a new single-molecule force technique at
Northwestern University in US and for supervising my thesis.
I would like to thank my supervisors Dr. Stefan Zürcher, Dr. Samuele Tosatti and Prof.
Dr. Karl Gademann for their helpful advice and input for my work: Karl and Stefan for
their help in synthesis, and Samuele together with Stefan for introducing me to the XPS
and for corrections of my thesis and/or paper writing.
I also would like to thank Prof. Dr. Markus Niederberger who accepted being a co-
examiner of my thesis and Prof. Dr. Jörg Löffler representing the Department of
Materials.
Many thanks go to Prof. Dr. Phillip Messersmith and Dr. Haeshin Lee from
Northwestern University for their support during my stay at NU and for introducing me
into the topic of single-molecule spectroscopy.
I would like to thank also Prof. Dr. Manfred Heuberger who contributed in the final
discussions and data interpretation of my AFM project as well as Dr. Jan Koutnik for
consulting the data analysis and introducing me to the Mathematica software for data
evaluation.
In addition, I would like to thank Dr. Yann Bethuel for his help in synthesis during the
initial stage of my thesis and J.-Y. Wach for synthesizing some of the molecules I used
in this work.

vi
I would like to thank Esther Stähli and Josephine Bear for taking care of all the
administrative affairs and Tomas Bartos for technical support.
A warm thank you goes to Sina Saxer, Christian Zink and Esther Amstad for being such
great office mates: Esther, almost invisible through all her multi-collaborations, but very
nice when you managed to catch her; Zink, always happy when distracted with
(non-)scientific questions and always glad to help. A special thank you to Sina, who was
my (almost) everyday support, not only in work related issues. She always found time
for discussions and encouragement, and through her many words, she was very often
right.
A big thank you goes to all my former and current colleagues for their support and the
very friendly atmosphere. I enjoyed a lot working with you and also spending time “out
of the lab” with you, including coffee breaks, partying, skiing, badminton, relaxing spa
and so on. Although I am not mentioning everybody by name, I would like to thank
every single member (from the old and present days) for making the LSST such a
unique and great group.
I should not forget my friends “out of ETH” and my Czech friends who have never “let
me go” and managed to keep me close to them during the whole time
Finally, my biggest thanks go to my wonderful parents for their love and unconditional
support during all these years as well as to my great sisters and my brother-in-law for
giving me the confidence, encouragement and continuous support. Thank you for
everything you have done for me!

Abstract
vii
Abstract
There is a general interest and need for surface modifications for tailoring the properties
of materials devices and providing additional functionalities. This covers applications
such as lubrication, corrosion protection as well as biomedical applications. For the later
one of the important areas covers approaches to generate biocompatible surfaces by
controlling non-specific protein adsorption. Examples of applications include blood-
contacting devices such as stents, biosensors in genomics, proteomics and glycomics, as
well as the stabilization (dispersion) of micro- and nanoparticles for drug delivery or
medical imaging, providing longer circulation times in the body.
Polymeric films are particularly attractive for providing non-fouling properties to
surfaces. Among others, poly(ethylene glycol), PEG, has been widely used for this
purpose due to its known outstanding properties, low toxicity and immunogenicity.
Frequently used methods for the immobilization of polymers to metals, oxides or
polymeric substrates (via thiols, phosph(on)ates, silanes or polyelectrolyte interactions)
are, however, limited in terms of substrate choice and/or binding strength that can be
achieved. The method used in this thesis combines two approaches inspired by
adhesives and chelators found in mussels and cyanobacteria, respectively. In the first
case, mussel adhesive proteins are known to contain high proportion of 3,4-dihydroxy
phenylalanine (DOPA) that play an essential role in the adhesion of the mussel to a
variety of substrate types, while in the latter case, cyanobacteria, use highly specialized
siderophores (anachelin) to strongly coordinate Fe(III) ions in (sea) water.
Building upon published work, we have aimed first to search for catechol derivatives
that potentially show a higher affinity for surfaces than the reference DOPA anchor. Our
interests further focused on a better understanding of the binding mechanism of
different functionalized catechol derivatives on selected metal oxides with the aim of

Abstract
viii
finding design rules for catechol-based anchors with higher binding strength for three
important substrates, titanium oxide, niobium oxide and silicon oxide or glass.
To this end, we synthesized a set of PEG-polymers differing in their catechol binding
sites (chemical structure, acidity and charge). Their adsorption and stability properties
together with the ability to resist protein adsorption were analyzed by variable angle
spectroscopic ellipsometry (VASE), X-ray photoelectron spectroscopy (XPS) and
ultraviolet-visible spectroscopy (UV-VIS) while different polymer adsorption
parameters, pH and temperature of the assembly solution as well as different substrates
were investigated.
Our results showed that an increased acidity of the catecholic hydroxy groups improves
molecular coverage and stability of the monomolecular adlayers when exposed to buffer
solution for up to 24 h. mPEG-anacat and mPEG-nitrodopamine proved to be
particularly attractive polymers in the terms of high PEG brush density and stability
against oxidation in solution when compared to DOPA controls. A certain drawback of
the former one is its demanding multiple-step synthesis. In general, adsorption
conditions (pH and temperature of assembly solution) strongly influenced surface
coverage. For high surface coverage, a pH of the assembly solution that is close to pKa
(dissociation of the first hydroxy group) of the catechol and the isoelectric point (IEP)
of the substrate, and a temperature close to the cloud point temperature, TCP, were
shown to be optimal. We have also noticed a subtle dependence of the cloud-point
temperature to both, the type of catechol derivative and the pH buffer system.
The resistance of the PEGylated surfaces to full serum protein adsorption correlated
quantitatively with the PEG surface density confirming the importance of high PEG
surface density (brush conformation) for the generation of non-fouling surfaces.
Our studies of PEG polymers having two catechol anchors demonstrated, that an
optimum conformation (three-dimensional structure) of the molecules is crucial for the
establishment of multivalent surface binding and exploitation of improved stability in
comparison to the mono-catechol polymers.
In the last part of the thesis we have used atomic force microscopy (AFM) to study
single molecule interaction of selected catechols on TiO2. We have managed to
optimize the sample preparation protocols (surface modification of SiO2 wafer,
presenting the catechols and interacting with TiO2-coated AFM tips) allowing us to

Abstract
ix
perform multiple force-distance (F-D) measurements resulting in the recording of single
molecules bond rupture events with a probability of ~ 10 %. Assuming a reasonable
length for the bond between the catechol and Ti ion, the data analysis revealed bond
energies that were lower when compared to published data. A possible reason for this
finding could be some indication in the force histograms for two different binding states
of the catechol, e.g. mono and bidentate conformation as has been proposed in the
literature based on other information.


xi
Summary
Die Mӧglichkeit, durch Oberflächenmodifikationen Änderungen der
Materialeigenschaften hervorzurufen oder zusätzliche Funktionen zu generieren, sind
von grossem Interesse und umfassen ein grosses Anwendungsfeld, zum Beispiel im
Zusammenhang mit Schmiermitteln, Korrosionsschutz bis zu biomedizinischen
Anwendungen. Bei den letzteren wird vor allem versucht, biologisch verträgliche
Oberflächen zu erzeugen, unter anderem durch eine veerbesserte Kontrolle
unspezifischer Proteinadsorption. Beispiele sind medizintechnische Geräte, welche in
Kontakt mit dem Blutkreislauf stehen, wie Stents, Biosensoren wie auch die
Stabilisierung von Mikro- und Nanopartikeln für Anwendungen im Bereich des Drug
Delivery oder medizinischer Bildgebung, mit dem Ziel verlängerter Blutzirkulationszeit.
Um eine Resistenz gegen unspezifische Proteinadsorption zu erreichen, sind
Polymerbeschichtungen besonders gut geeignet. Neben anderen Polymeren wird
hauptsächlich Polyethylenglykol (PEG) für diesen Zweck eingesetzt, da es
hervorragende Eigenschaften aufweist, wie niedrige Toxizität und Immunogenität.
Häufig benutzte Methoden zur Oberflächenimmobilisierung auf Metall-, Oxid- oder
Polymersubstraten (via Thiol-, Phosph(on)at- und Silanchemie oder elektrostatischer
Wechselwirkungen) sind jedoch beschränkt in der Substratwahl und/oder der Stabilität
und Stärke der Bindung. Der Ansatz, der in dieser Arbeit verfolgt wurde, kombiniert
zwei von der Natur inspirierte Ansätzen, abgeleitet von Muscheln und Cyanobakterien.
Im ersten Fall ist bekannt, dass das Muscheladhäsionsprotein einen hohen prozentualen
Anteil an 3,4-Dihydroxy-phenylalanin (DOPA) besitzt, welches für die Adhäsion der
Muscheln auf verschiedenen Substratoberflächen eine entscheidende Rolle spielt. Im
andere Fall nutzen Cyanobakterien hoch spezifische Siderophore, um Eisen (III) Ionen
in Meerwasser stark zu binden.

Summary
xii
Im ersten Schritt wurde nach Catecholderivaten gesucht, welche möglicherweise eine
höhere Affinität für Oberflächen aufweisen als das Referenzmolekül DOPA. Zusätzlich
galt unser Interesse dem besseren Verständnis des Bindungsmechanismus der
verschiedenen DOPA Derivate auf ausgesuchten Metalloxidoberflächen. Des weiteren
sollten Designkriterien gefunden werden für Catechol-basierte Anker-Gruppen mit
erhöhter Bindungsstärke zu drei wichtigen Substraten: Titanoxid, Nioboxid,
Siliziumoxid bzw. Glas.
Zu diesem Zweck wurden PEG-basierte Polymere mit unterschiedlichen
Catecholderivaten bezüglich chemische Struktur, Azidität und Ladung synthetisiert. Ihre
Adsorption, Stabilität und die Resistenz gegen Proteinadsorption wurden mittels
Ellipsometrie (VASE), Röntgen-Photoelektronenspektroskopie (XPS) und UV-Vis-
Spektroskopie (UV-VIS) untersucht, wobei der Einfluss von verschiedenen Parametern
wie pH und Temperature der Adsorptionslösung, sowie Art des Substrats systematisch
untersucht wurde.
Unsere Resultate zeigen, dass eine Erhöhung der Azidität der Hydroxygruppen am
Brenzcatechin die molekulare Flächenbedeckung und die Stabilität der
monomolekularen Schichten verbessert. Besonders mPEG-Anacat und mPEG-
Nitrodopamin zeigten die besten Ergebnisse in Bezug auf die erreichte PEG-
Schichtdicke und Resistenz gegenüber unerwünschter Oxidation in Lösung. Ein
Nachteil ist die mehrstufige Synthese von Anacat. Im allgemeinen hängt die
Oberflächenbedeckung stark von den Adsorptionsbedingungen ab (pH und Temperatur
der Adsorptionslösung). Für eine dichte Oberflächenbedeckung war ein pH-Wert
optimal, welcher nahe dem pKa des Catechols (Dissoziationskonstante der ersten
Hydroxygruppe) und dem isoelektrischer Punkt (IEP) des Substrates lag. Des weiteren
wurde festgestellt, dass die unterschiedlichen Catecholderivate einen Einfluss auf die
PEG Cloud-point Temperatur haben.
Die Resistenz der mit PEG modifizierten Oberflächen gegenüber Proteinadsorption
korrelierte quantitativ mit der PEG Oberflächendichte, was die Wichtigkeit von hohen
PEG-Oberflächendichten (Bürsten-Konformation) für die Reduktion unspezifischer
Proteinadsorption belegt.
Unsere Studien von PEG Polymeren mit zwei Catecholankergruppen zeigen, dass eine
optimale Konformation (dreidimensionale Anordnung) der Moleküle entscheidend ist,
Summary
xiii
um multivalente Oberflächenbindungen eingehen und die Oberflächenstabilität
verbessern zu können, im Vergleich zu Monocatechol Polymeren.
Im letzten Teil der Arbeit wurden mittels AFM Wechselwirkungen zwischen einzelnen
ausgewählten Catecholen und TiO2 untersucht. Wir konnten die Probenherstellung
(Oberflächenmodifikation der SiO2 Wafer-Proben) in der Art optimieren, dass mehrere
Kraft-Distanz (F-D) Messungen durchgeführt werden konnten, die zu Bindungsbruch
führten (Wahrscheinlichkeit eines solchen Ereignisses ~ 10 %). Unter Annahme einer
realistischen Bindungslänge der Titan-Sauerstoff Bindung zwischen der
Titanoxidoberfläche und dem Catechol-Molekül, ergab die Datenanalyse niedrigere
Bindungsenergien verglichen mit publizierten Werten. Der Grund für die Abweichung
könnte in der Präsenz von zwei verschiedenen Kraftverteilungen sein, welche einem
ein- und zweizähnigen Bindungsmechanismus für die Catechole auf TiO2 entspricht, der
auch in der Literatur vorgeschlagen wurde.


xv
Table of Contents
Chapter 1 Introduction 1
1.1 Surface modifications .............................................................................................. 1
1.1.1 Surface modification techniques .................................................................. 1
1.1.2 Non-fouling surfaces .................................................................................... 3
1.1.3 Non-fouling polymers .................................................................................. 4
1.1.4 Polymeric brush surfaces ............................................................................. 4
1.2 Catechols .................................................................................................................. 6
1.2.1 Inspiration .................................................................................................... 7
1.2.2 The use of catechols as anchors ................................................................. 10
1.2.3 Catechol binding on TiO2 .......................................................................... 12
1.3 Single force measurements/Binding Energy .......................................................... 14
1.3.1 Surface force techniques ............................................................................ 14
1.3.2 Bond strength ............................................................................................. 15
Chapter 2 Scope and Outline of the thesis 19
Chapter 3 Materials and Methods 21
3.1 Materials ................................................................................................................ 21
3.1.1 Chemicals ................................................................................................... 21
3.1.2 Substrates ................................................................................................... 23
3.2 Surface modification .............................................................................................. 24
3.2.1 Adsorption and stability studies ................................................................. 24

Table of Content
xvi
3.2.2 Binding strength studies (AFM) ................................................................. 25
3.3 Bulk Characterization ............................................................................................. 26
3.3.1 Proton nuclear magnetic resonance spectroscopy (1H-NMR) ................... 26
3.3.2 UV-VIS Spectroscopy ................................................................................ 26
3.4 Surface characterization ......................................................................................... 26
3.4.1 Variable Angle Spectroscopic Ellipsometry (VASE) ................................ 26
3.4.2 X-ray Photoelectron Spectroscopy (XPS) .................................................. 29
3.4.3 Atomic Force Microscopy (AFM) ............................................................. 31
3.4.4 Single molecule force spectroscopy by AFM ............................................ 34
Chapter 4 Synthesis 37
4.1 Experimental .......................................................................................................... 41
Chapter 5 Influence of adsorption parameters and chemistry of binding groups on
adlayer thickness, stability and protein resistance 53
5.1 Properties of the PEG-catechol derivatives ............................................................ 54
5.2 Polymer adsorption study ....................................................................................... 57
5.2.1 Polymer film thickness as a function of pH of the assembly solution and
type of substrate ..................................................................................................... 58
5.2.2 Polymer adsorption as a function of temperature ....................................... 60
5.2.3 Effect of polymer structure- multicatechol binding ................................... 61
5.3 Serum adsorption on the polymer-coated substrates .............................................. 62
5.4 Discussion .............................................................................................................. 67
5.4.1 Cloud Point Temperatures of the Polymers ............................................... 67
5.4.2 Polymer Adsorption Studies ....................................................................... 68
5.4.3 Serum adsorption ........................................................................................ 74
Chapter 6 Binding strength study 77
6.1 Background ............................................................................................................ 79

Table of Content
xvii
6.2 Protocol optimization ............................................................................................. 79
6.2.1 Ellipsometry results (standard/control tests) .............................................. 80
6.2.2 AFM results (standard/control tests) .......................................................... 82
6.3 Results: Single force measurements ...................................................................... 83
6.3.1 DHPAA (viii), Anacat (ix) ......................................................................... 84
6.4 Control measurements ........................................................................................... 91
6.4.1 DHPAA (viii) at pH 6, (prepared by approach B) ..................................... 91
6.4.2 DHPAA (viii) prepared by approach A ..................................................... 91
6.4.3 DOPA (x): comparison between approach A and B .................................. 92
6.5 Discussion .............................................................................................................. 94
6.5.1 Prove of single molecule interaction ......................................................... 94
6.5.2 Force measurements .................................................................................. 96
Chapter 7 Conclusion and Outlook 105
Appendix 109
References 113
Curriculum Vitae 125


1
Chapter 1
Introduction
1.1 Surface modifications
Surface coatings represent a convenient and economically sustainable approach to
provide a material with additional properties and functionalities than the ones provided
by the bulk material [1]. Beside classical paint and lacquers, thin polymer coatings are
becoming more and more popular in fields such as particle, lubrication, corrosion
protection as well as drug delivery systems, biosensors and biomedical implants [2-5].
1.1.1 Surface modification techniques
Polymeric thin coatings can be generated by a number of techniques that differ in the
way how chains are attached (grafting to and grafting from approaches) and/or in the
interaction between its binding site and the surface (physi- and chemisorption) [6-9],
(Figure 1).
To construct a highly dense polymer brush on the surface, surface initiated
polymerization (SIP) called grafting-from can be applied [10]. This way the polymer is
directly generated in situ at the surface starting from an immobilized initiator site
(a surface is covered with an initiator for surface-induced polymerization reactions,
monomers in solution are reacting to form covalently bound polymer chains). One
popular and successful method to do so is via radical chain initiation [11-12] This

Introduction
2
approach can however lead to an unknown structure of the generated film, is difficult to
control (which results in high polydispersity) and characterize and in most cases
requires the use of organic solvents. A second technique called grafting-to relies on the
adsorption of pre-synthesized, functionalized polymers directly onto a surface using an
anchoring group through physi- or chemisorption. This approach generally results in
lower brush densities compared to the grafting-from technique, but on the other hand
allows having very low polydispersity. Depending on the nature of the polymer, this
technique allows the adsorption from aqueous solution and the characterization of the
adsorbed layer is generally easier, thanks to the known structure of the molecules or
polymers to be adsorbed. Physisorption is immobilization of (block-co)polymers
through hydrophobic-hydrophobic interaction (solvent is a precipitant for one part of the
blocks, thus directing this block to adsorb on the surface) [13-15] or through
electrostatic interaction between a charged polymer and opposite charged surface (weak
non-covalent interactions) [16-17]. An obvious limitation of this technique is the
restricted substrate choice and also the binding strength. Both can be improved by
attaching the polymer covalently to the surface, for example using aldehyde-
functionalized layers deposited by plasma techniques onto the substrate surface [18].
Chemisorption involves covalent or coordinative binding of end-functionalized
polymers to surfaces, e.g. immobilization of silanes to OH functionalized surfaces [19]
or binding of amine functionalized polymers to aldehyde-functionalized surfaces and
subsequent reduction of the metastable imines to secondary amines [18]. Examples
includes self-assembled monolayers that are particularly attractive due to their ability to
form a chemically well-controlled, structurally defined interface, which offers, for
instance, the possibility of inhibiting nonspecific biomolecular adsorption (preparation
of non-fouling surfaces) [20-22].

Introduction
3
In solution
On the surface
A) Chemisorption B) Physisorption
“grafting to”“grafting from”
Figure 1. Different ways of surface modifications: A) Polymer immobilization on the surface by
chemisorption- covalent or coordinative bonds form between the polymer binding sites and the surface.
B) Copolymer attached by physisorption (e.g. through hydrophobic-hydrophobic interactions). The chains
can either be formed by a “grafting from” process, where polymerization can take place starting from the
surface, or directly by “grafting-to” technique.
1.1.2 Non-fouling surfaces
Preparation of surfaces where nonspecific bio-molecular adsorption is inhibited or
greatly reduced (so called “non-fouling” surfaces) have found wide-spread use in
biomedical and biotechnological applications ranging from cell culture substrates to
contact lenses and catheters [23] [24]. Biofilm formation upon adhesion of cells,
bacteria, algae and other biological entities (biofouling) on various substrates could
affect functionality, durability and reliability of a material or device. Indeed, biofouling
causes problems in many areas, e.g. it is associated with contamination in food
processing, corrosion in aqueous media or adverse biological reactions (encapsulation,
inflammation) when medical devices come into contact with biological media [25-26].
Most of bioadhesion processes are initiated by adsorption of proteins onto the substrate.

Introduction
4
Thus eliminating non-specific protein adsorption is of essential importance to reduce
biofouling.
1.1.3 Non-fouling polymers
A common surface modification method to inhibit biofouling exploits immobilization of
non-interactive (antifouling) polymers on biomaterial surfaces, including poly-/oligo-
saccharides (e.g. chitosan and dextran) [27-28], nonionic (poly(acrylamide),
PAAM [29], poly(vinylpyrrolidone, PVP) [30-31], zwitterionic (sulfobetaine and
phosphobetaine) [32] and peptidomimetic polymers [33] as well as polymer mimics of
phospholipids [34]. These non-fouling polymers have a few properties in common
regarding their physiochemical properties- they are hydrophilic, overall uncharged and
highly hydrated polymers [21, 35]. The efficiency in minimizing protein-surface
interaction is further correlated to their ability to screen electrostatic interactions and
exert steric repulsion [17, 35]. This requires appropriate polymer architecture (chains to
be organized in a brush like conformation) with appropriate grafting density and chain
length [36-37].
Among those polymers, poly(ethylene glycol) (PEG) became one of the most prominent
materials in biotechnology and biomedical research to render surfaces resistant against
non-specific protein adsorption and cell adhesion [38]. Due to its outstanding properties
including neutrality, solubility in water as well as many other organic solvents, low
toxicity and immunogenicity it has been widely used for ultrathin as well as ultrathick
(e.g. plasmapolymerization) coatings.
PEG has been linked to metal, oxide or polymer substrates via thiols (on silver and
gold) [9], phosph(on)ates (on metal oxides) [39-40], silanes [41-42] or polyelectrolyte
interactions [6]. In addition to this toolbox of surface immobilization schemes a more
recent approach uses catechol derivatives. This approach is further discussed in the
following paragraph ( X1.2XX).
1.1.4 Polymeric brush surfaces
Depending on the adsorption condition (e.g. solvent type and quality, salt, temperature),
affinity of the binding sites to the surface and packing density on the surface the
polymer chains can appear in/form of different conformations: iA) “pancake” and

Introduction
5
iB) "mushroom" conformation, ii) interacting “mushroom” and iii) brush conformation,
( XFigure 2X). The different regimes are defined by the ratio L/2Rg, where L is the average
distances between PEG chains and Rg the polymer’s radius of gyration (~ distance from
the center of the mass where all the mass of the molecule could be placed to produce the
same momentum of rotation) [43-44]. At distances greater than the polymer size
(L/2Rg > 1) the chains are isolated and they form a so called “pancake” conformation
(polymer chains laying flat on the surface if there is a strong interaction between
polymer and surface) or “mushroom conformation” (polymer chains do not have an
affinity to the surface). At higher densities (L/2Rg approaching 1) the chains start to
interact with each other corresponding to the “mushroom-to-brush” transition. If
L/2Rg < 1, strong interaction causes stretching of individual chains away from the
surface corresponding to the formation of a “brush”.
i)
A
iii)ii)
B
Rg L
L/2Rg > 1 L/2Rg = 1 L/2Rg < 1
Figure 2. Polymer surface conformations: Different conformations of polymers at surfaces: iA) “pancake”
conformation of a single adsorbed chain; iB) “mushroom” conformation; ii) interacting “mushroom”
conformation; iii) “brush” conformation for high grafting densities.
Chain conformation/density is one of the essential aspects of non-fouling surface
preparation, as mentioned in the previous paragraph (X1.1.2 X). Apart form a grafting to
approach it can be achieved by exploitation of the unusual temperature dependence of
the molecular interactions between PEG and water. Indeed, while completely soluble in
water at low temperature, PEG looses its solubility at elevated temperatures. This effect
has been described in literature as “cloud point” [45-47]. The cloud point (CP), or lower
critical solution temperature (LCST), of PEG depends on molecular weight,

Introduction
6
concentration and pH. Increasing salt concentration can greatly lower the CP (usually
> 100°C in water). Among others [48-49], Kingshott and Griesser [36] have
demonstrated that cloud point conditions (higher temperature and high salt
concentration of the assembly solution) during PEG-aldehyde grafting to aminated
surfaces results in higher surface coverage exploiting the partial collapse of PEG due to
the inverse solubility/temperature relationship of this polymer in aqueous media (XFigure
3X). Upon return to good solvent conditions (room temperature, lower, e.g., physiological
salt concentration), the PEG chains become rehydrated resulting in a more densely
packed, brush-like monolayer in comparison to a surface prepared without cloud-point
conditions.
Physiological conditions
“Cloud point” conditions
Back to physiological conditions
i iiiii
Figure 3. Cloud point vs. physiological conditions for polymer adsorption: i) adsorption of PEG under
physiological conditions; ii) adsorption of PEG under “cloud point” conditions; iii) rehydration of PEG
upon change from “cloud point” to physiological conditions- this may result in partial loss of molecules,
the degree depends on the adhesion strength to the substrate.
1.2 Catechols
Catechols (derivatives of pyrocatechol, also known as 1,2-dihydroxybenzene, XFigure 4X)
have been presented as promising adhesives in surface modification, employing the
hydroxy groups and/or the free electrons from the aromatic ring [50-51].

Introduction
7
Figure 4. Structure of catechol (1,2-dihydroxybenzene or 1,2-benzenediol).
Catechol derivatives can differ in their overall charge pattern related to a pH dependent
charge (~ deprotonation of hydroxyl groups) as well as the presence of a permanent
charge (an example of catechol carrying a permanent charge is a catechol derivative
with a tertiary ammonium cation).
The dissociation of the hydroxyl groups is related to their acidity defined by the pKa
values (dissociation of the first hydroxy group). Catecholic -OH-groups have the special
property of being much more acidic (lower pKa) than other hydroxyl groups such as
alcohols or sugars, where hydroxyl groups do not dissociate at physiological pH [52-
53]. Moreover this can be further influenced by substitution on the aromatic ring by
various side groups [54].
The use of these compounds as anchoring groups has been inspired by the strong, wet
adhesion systems developed by nature, especially mussels- known to be able to adhere
in water to a variety of substrates, as well as siderophores from bacteria, low molecular
weight ligands that capture Fe(III) ions from the environment (biomimetic approach).
Catechol containing molecules are biologically important, e.g. in form of
catecholamines, they function as neurotransmitters and are of pharmacological use in
different areas (hypertension, Parkinson’s disease, breast cancer) [55].
1.2.1 Inspiration
Mussel-adhesive proteins (MAPs)
Mussels are known to be able to strongly attach to many different kinds of surfaces and
under wet (sea water) conditions by secreting proteinaceous glue, called mussel
adhesive proteins (MAPs). These proteins (consisting of tandem repeating sequences of
approximately 5-15 amino acids) have been found to contain up to 30 mol % of amino
acid 3,4-dihydroxyphenylalanine (DOPA) Figure 5. The high amount of DOPA in the
MAPs has been found to contribute to the sticking (and cross-linking) ability of the

Introduction
8
marine adhesives (this process might be supported by involvement of L-lysine and other
polar residues) [56-59].
HO
HO
NH2
O OH
Figure 5. L-DOPA, a non-proteinogenic amino acid as part of MAPs [56].
Waite has summarized possible catechol interactions (shown in FFigure 6): i) hydrogen
bond formation (with the ability to compete with water molecules), ii) formation of
metal-ligand complexes, iii) Michael-type addition after catechol oxidation (compounds
derived from o-quinone and a primary amine) and iv) formation of quinhydrone
complexes largely stabilized by π- π-interactions [57, 60-61].
Figure 6. Proposed possible catechol interactions [57]: i) hydrogen bond formation (0.25 – 0.29 nm),
ii) formation of metal-ligand complexes (e.g. Fe ‒ O: 0.20 nm, Co ‒ O: 0.19 nm, iii) Michael-type
addition after catechol oxidation (compounds derived from o-quinone and a primary amine, 0.13 –
0.15 nm), iv) formation of quinhydrone complexes (0.30 – 0.32 nm).
He further predicted DOPA residues to be responsible for i) chemisorption of the
polymers (isolated protein sequences from MAPs) to surfaces and ii) cross-linking of
the adhesive [61], which was confirmed by Deming [58, 62-63] by preparation of
synthetic polymers mimicking the MAPs (containing DOPA). It was further shown that
a high proportion of unoxidized DOPA in proteins may be essential for strong

Introduction
9
chemisorption to polar surfaces. Its oxidation leads to 2 scenarios: i) high oxidation to
cross-links results into interfacial failure but high cohesive strength while ii) low DOPA
oxidation results in better adhesion [64]. Possible quinone reactions involved in mussel
adhesion are summarized in Figure 7 [58, 60-61, 63-64].
Figure 7. Possible quinone hypothetical adhesion, oxidation and cross-linking reaction pathways for
peptidyl DOPA and DOPA ortho-quinone residues (Illustration adopted from Demming et al. [63]).
Cyanobacteria & Siderophores
Siderophores are low molecular weight molecules, evolutionarily developed by
microorganism (such as bacteria and fungi) to strongly capture Fe ions [65-67]. As iron
is an essential nutrient for all bacteria, its availability is one of the limiting factors for
bacterial growth [68]. The insolubility of ferric oxides and hydroxide limits the
concentration of Fe3+ (the free aqueous ion), that are moreover toxic in that form. For
surface ocean water total soluble iron concentration is only 2 . 10-11 - 10 . 10-10 M [69-
70]. In contrast, the required level of sufficient supply for most organisms is at a
concentration of about 10-7 M to 10-5 M. Bacteria overcome this by creating ferric
siderophore complexes that facilitate the iron uptake to the organisms. The general
mechanism is initiated when the ferric siderophore-complex binds to the receptor
Introduction
10
protein on the microbial cell surface. In many cases the whole Fe-siderophore complex
is actively transported across the cell membrane and once in the cytoplasm of the cell,
the Fe3+-siderophore complex is usually reduced to Fe2+ to release the iron. In fungi and
other eukaryotes, the Fe-siderophore complex may be extracellularly reduced to Fe2+.
The chelating moieties are often catecholate derivatives.
One of the well described microorganisms secreting siderophores are cyanobacteria
(often referred to as blue-green algae). These photoautotrophs secret, apart from
siderophores, many metabolites thought to provide an advantage over competing
organisms, e.g. toxins or metabolites directed towards competing photosynthetic
species.
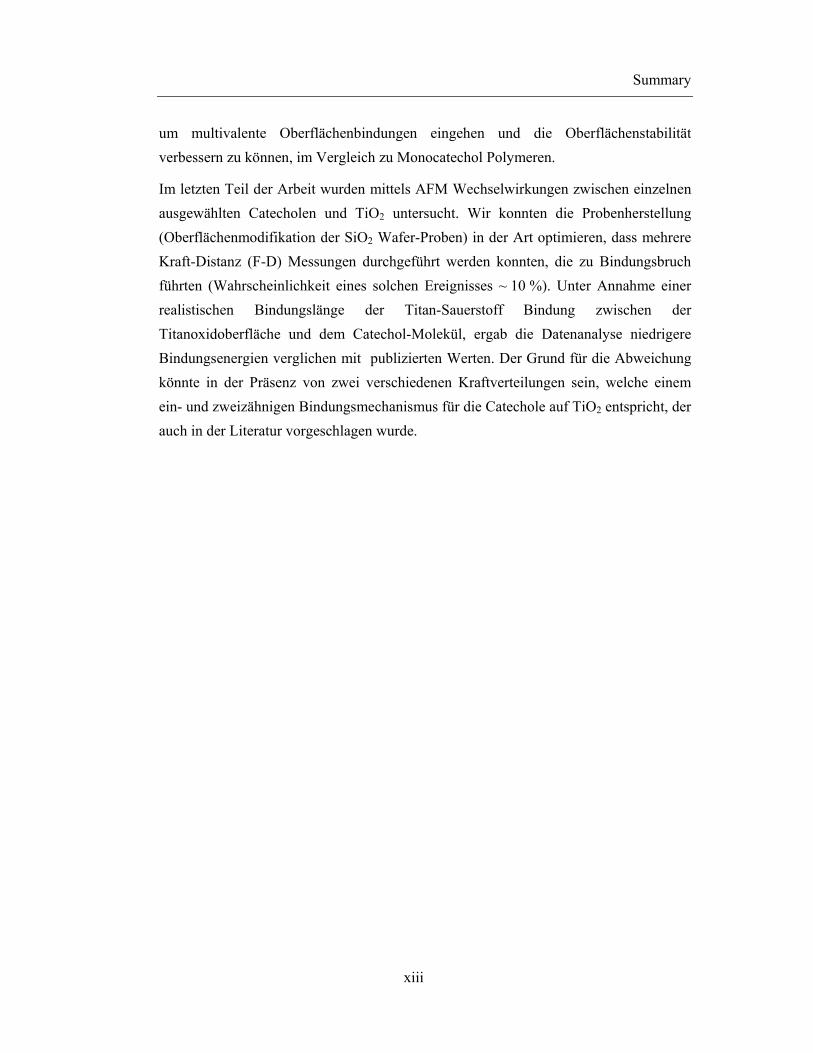
A siderophore secreted by cyanobacteria is called Anachelin and features a 3,4-
dihydroxyquinolinium subunit involved in Fe(III) chelating (Figure 8 X).
HO
HO
HN
O
NH
HN
NH3C CH3
HOO
NH
O
OH
OHOH OH OH
NHO
OH
O
HO
HO
HN
O
NH
HN
NH3C CH3
HOO
NH
O
OH
OHOH OH OH
NHO
OH
O
anachelin
Anacat
Figure 8. Anachelin presented in cyanobacteria; anacat; (picture reproduced with permission of Prof. Karl
Gademann).
1.2.2 The use of catechols as anchors
The non-proteinogenic aminoacid 3,4-dihydroxyphenylalanine (DOPA) has attracted
substantial attention in the context of its binding ability to substrates of different
chemistry. The use of this compound as an anchoring group was inspired by nature,

Introduction
11
especially mussels (X1.2.1XX), as it was found to be one of the binding elements of MAPs.
Its commercial availability additionally increased the interest to use it for synthetic
purposes.
PEG
Figure 9. mPEG-catechol derivative.
Messersmith et al. has first used DOPA as an anchoring group for the surface
immobilization of PEG (Figure 9). He has shown that these conjugates adsorb on the
TiO2 surfaces when using at least two catechols [48, 71]. The adlayer stability further
increased when three repeating DOPA units were used as a multiple adhesion foot and
such adlayers were capable of imparting non-fouling character to the surfaces (Figure
10X). Similar results as when using the multiple attachment were achieved when these
were combined with positively charged groups such as lysine [72].
HN
O
OO
H3C O
O
CH2
OH
OH
HN
O
OO
H3C NH
CH2
OH
OH
O CH2
HO
OH
O
O
HN
O
OO
H3C NH
CH2
OH
OH
O CH2
HO
OH
O
HN
O
CH2
OH
OH
O
n nn
Figure 10. mPEG-DOPA(1-3) polymer conjugates tested by Messersmith [71].
More recent work reported results for a new class of copolymer poly(L-lysine)-graft-
(3,4-dihydroxyphenylacetic acid, poly(ethylene glycol), (PLL-g-(DHPAA; PEG), which
combines the advantages of a poly(electrolyte) (attractive electrostatic interaction
between charged polymer and substrate having opposite charges) and the expected long-
term stability of the multivalent catechol-surface anchorage concept [73].

Introduction
12
Our approach follows a new biomimetic strategy based on anacat, a derivative of the
growth factor anachelin secreted by Cyanobacteria (XFigure 8 X). This metabolite (a so
called siderophore) is postulated to have a biological activity as a ligand that efficiently
binds to iron (III) ions for the purpose of iron acquisition (presented in previous
paragraph X1.2.1 XX). Because of its strong binding forces we became interested in using this
structure as the basis for our design of synthetic coatings.
Compared to DOPA, the catechol derivative anacat shows higher stability towards
oxidation and polymerization, an additional aspect that could prove useful in the future
application of anacat-functionalized molecules.
At physiological conditions most metal oxide surfaces are negatively charged (Nb2O5,
TiO2, SiO2, etc.) and thus electrostatic repulsion may impede adsorption processes and
decrease the stability of adsorbed molecules. By preparing the positively charged
catechol derivative anacat and its coupling with methoxy terminated PEG (mPEG) we
expected to eliminate electrostatic repulsion by the negatively charged metal oxide
surface and increase the stability of adsorbed molecules.
A certain drawback of the anacat route is the more demanding nine-step synthesis
compared to the commercially available DOPA compound.
The efficiency of all coating methods strongly depends on various parameters, such as
substrate and polymer type, solvent choice, polymer concentration, adsorption time,
temperature and pH, all of which need explicit consideration when designing polymers
and surface-active molecules.
1.2.3 Catechol binding on TiO2
Coordination properties on different metals and metal oxides (e.g. Cu2+, Fe3+, Mn2+,
Mn3+, Ti3+, Ti4+, Zn2+, Nb2O5, TiO2) and interactions with polymers (PTFE, PS, PDMS)
for various catechols have been studied [59, 74-75]. Among others, TiO2 has been
drawing attention as an interesting material used for metallic medical implants and
optical sensors, photocatalyst or, as a corrosion protective and optical coating. It exists
in three mineral forms- anatase, rutile and brookite, where rutile is the most common in
nature and is consider to be the thermodynamic stable phase under ambient conditions.
In their crystal structure, the titanium atom is surrounded by six oxygen atoms in a more
or less distorted octahedral configuration. They differ in the Ti-O bond length (1.9 -

Introduction
13
2.0 Å) as well as in the bond angle [76]. Only the first two forms (anatase and rutile)
are involved in TiO2 applications (and additionally, were studied with surface science
techniques).
Many theoretical studies were made focusing on interactions of molecules with TiO2
surfaces [75, 77-79]. Redfern et al. [80] used modeling/theoretical calculations (ab initio
molecular orbital theory and density functional theory, DFT) to study catechol and
water interactions with TiO2, following up previous investigations. In his calculation he
included Ti=O defect sites present on the surface. The scheme of possible
scenarios/situations is summarized in Figure 11.
molecular dissociative
mono- bi-
Figure 11. Possible catechol- TiO2 interactions.
Molecules having -OH groups such as catechols were proposed to adsorb on the surface
either by molecular (hydrogen bonded) adsorption or by dissociative (coordinative)
adsorption. The former one involves formation of Van der Waals complex with
hydrogen bonds. Dissociative adsorption concerns dissociation of catechol –OH bond,
where the remaining oxygen bonds to surface Ti to form a monodentate structure. By
dissociation of both –OH groups bidentate bridging between two surface Ti atoms can
occur [80]. Elimination of H2O at the defect Ti=O sites leads to bidentate structure with
two chemical bonds from catechol to one surface titanium.

Introduction
14
In a further theoretical study on dopamine-TiO2 complex formations the binding
energies of the molecular complex was calculated to be ~ 22 kcal/mol, the bidentate
structure 25 – 30 kcal/mol and the monodentate binding energies varied between 4 -
20 kcal/mol. Bridging bidentate structure was thus more stable than the monodentate,
but less stable then bidentate on one Ti atom.
Diebold combined the theoretical studies (DFT) with experimental (scanning tunneling
microscopy - STM, photoemission) to investigate the adsorption properties of catechol
on TiO2 surface [81-82]. She proposed coordination schemes, comprising either
monodentate only (one of the two catechol OH groups dissociates and binds to a metal
cation, whereas the second OH group forms a H-bond to the next catechol neighbor) or
mixed monodentate-bidentate molecules (both OH groups dissociate and become
coordinated to two adjacent metal cations). One structure can easily convert into the
other one and contrariwise.
1.3 Single force measurements/Binding Energy
1.3.1 Surface force techniques
In biology a major interest to understand fundamental physical basis of biological
interactions (e.g. between biological receptor molecules and their ligands) initialized the
rapid development of several force – measuring techniques. They are often suited for
different force regimes (different magnitudes or length scales) or time scale. Among
others, atomic force microscopy (AFM) and surface force apparatus (SFA) are currently
the most versatile in the terms of surface force and separation measurements, as they
can be used over a large range [83]. AFM together with laser optical
tweezer (LOT) [84] and biomembrane force (~ bioforce) probe (BFP) [85] are the
techniques the most used for direct measurements of single bond strength. In AFM the
force is sensed by deflection of a thin silicon nitride cantilever whereas in BFP the force
is sensed by axial displacement of a glass microsphere glued to the pole of a
micropipette-pressurized membrane capsule and in LOT the force is sensed by the
displacement of a microsphere trapped in a narrowly focused beam of a laser light. In
each case the probes represents a very soft spring (spring constant from < 1 pN / nm to
1 nN / nm) ensuring high sensitivity to force.

Introduction
15
1.3.2 Bond strength
In equilibrium condition, the maximum force Fmax that a bond can withstand without
rupturing defines its strength, thus being related to the maximum slope of the potential
energy function E(D) by Fmax = (- dE/dD)max, as illustrated in Figure 12A) [86]. In the
absence of an external force, bond dissociation will be thermally activated
(spontaneous).
A) B)
Figure 12. The effect of applied mechanical force F on the potential energy surface of an isolated
bond (adopted from Leckband et al. [86]). A) Equilibrium interaction force and energy profiles; B)
Simple intermolecular potential characterized by a single energy minimum and maximum. The
mechanical potential - FD tilts the potential and lowers the activation barrier to E’act = (Eact - FDts), where
Dts is the effective length of the bond at the transition state (ts).
Bell predicted [87] that the bond strengths depend not only on the equilibrium energy or
force function but also on the temperature and the timescale of the measurement. A
typical energy landscape for a bond is shown in Figure 12B. To the left of the transition
state (ts) the bond is considered associated and to the right dissociated.
Application of a constant force - F to the bond creates an additional potential that will
tilt the intermolecular potential by an amount – FD and thus lowers the activation
barrier to Eact - FDts (Figure 12B) [87]. This will affect the lifetime of the bond. In other
words, under external force, barriers in the energy landscape will be lowered (the bond

Introduction
16
length xb times the force applied) and bond lifetime shortens (~ dissociation time/rate
varies with applied force).
By extension of this theory for reaction kinetics, Evans and Ritchie predicted bond
strength dependence on loading rate (Figure 13) [87-89].
A) B)
Figure 13. (A) Illustration (adopted from Evans et al., [89]) of rupture forces predicted for bonds over
time and force in mechanical probe tests. Loaded by a ramp of force, the off rate increases steadily, but
the likelihood of bond survival decreases simultaneously. Thus, the frequency of failure can reach a
maximum at some time equivalent to force; the peak defines the bond strength f*. (B) Rupture events
plotted versus instantaneous force; rupture force distributions shift with loading rate rf.
In the prototypical experiment, a cantilever functionalized with a single-molecule of
interest is allowed to interact with a surface-bound receptor. At low loading rates, the
bond survives a longer time, but dissociates at a lower force than a more quickly loaded
bond. The kinetic dissociation rate constant, kD, is given by:
Tk
E
DD
b
et
k
1
Equation i
where tD is the diffusive relaxation time of the bond, EB is the height of the energy
barrier of the bond, kB is the Boltzmann constant, and T is the temperature. The
determination of tD was refined by Evans [68]. Equation i predicts that if the energy
barrier is reduced due to application of a force to the bond, the dissociation of the bond
will occur more quickly. Additionally, it predicts that a linear rise in force results in an
exponential rise in the dissociation rate constant, kD. When a bond is stressed using the

Introduction
17
AFM, a ramping force is applied, requiring a more complex analysis. Evans showed the
average failure force, F, for a bond loaded at a rate, r, to be
Tkk
x
x
Tkr
x
Tk
x
Tkk
r
x
TkF b
bb
b
b 00
lnlnln Equation ii
where the loading rate of the bond is r = k . v (units of force/time) and kD is the zero
force dissociation constant [70]. The loading rate can be varied in order to determine xb
and kD from a fit of Equation ii, by plotting F against ln(loading rate). Eb, can be
approximated using Equation i by assuming a value for tD, from molecular dynamics
calculations [70].
Single molecule method
Studying of bond strength (e.g. between biological receptor molecules and their ligands)
became a very appealing topic. Several aspects have to be taken into account when
preparing single F-D measurements. Hinterdorfer et al. proposed the following most
important points for sample preparation [90-91]: i) surface density of the molecule
studied had to be sufficiently low to ensure single-molecule interactions elimination of
multiple bond formation and ii) avoiding fracture of parts of the molecules which are
not of interest (~ binding of the molecules to the surface has to be stronger than the
intermolecular force being studied). Additionally, for single F-D measurements
preferentially cantilevers with low k (spring const), (0.01-0.1 N/m) and short length are
recommended, exhibiting lower force noise.
Even when explored over a wide range of loading rates and assured that only single
bonds are being tested, the measurements of strength vs. loading rate are susceptible to
subtle effects coming up mechanics and chemical linkage to the bond. Thus the entire
process of sample preparation, data acquisition and analysis is crucial for correct
interpretation of results.


19
Chapter 2
Scope and Outline of the thesis
This study was motivated by the major interest and need for convenient surface
modification techniques using self-assembly approaches for applications where ultrathin
coatings with non-fouling properties are required. Poly(ethylene glycol), (PEG), was
chosen as the polymer in view of its well documented properties and relevance as a
polymer widely used in the biointerface community.
The approach chosen in this thesis for the immobilization of PEG chains by the
grafting-to technique are based on catechol derivatives. Catechols have attracted great
interest in the past decade, since they constitute an important aspect of water-resistant
adhesives developed by nature, in particular mussel adhesive proteins (MAPs) and
siderophores in cyanobacteria that have developed highly efficient binding moieties
(chelates) for complexation of iron(III) ions.
The aim of this thesis is to (a) search for catechol derivatives that potentially show a
higher affinity for surfaces and (b) contribute to a better understanding of the binding
mechanism of different functionalized catechol derivatives on selected metal oxides.
For this purpose we synthesized a matrix of PEG-catechols and investigated their
molecular assembly properties, surface coverage, stability and resistance to non-specific
blood serum adsorption as a function of the type of catechol as well as assembly
conditions (type of buffer, temperature and pH). The following catechol derivatives
were investigated: DOPA (iv) as the reference molecule previously studied by different
groups; anacat (i), a binding group found in bacterial siderophores; dopamine (ii) being

Chapter 2. Scope and outline of the thesis
20
a control molecule commercially available as well as mimosine (iii), nitrodopamine (v)
having more acidic –OH groups compared to other catechols used, catechols vi and vii
having tertiary and quaternary amine groups both being an intermediate product on the
synthesis rout of anacat, the former one being a binding anchor in prepared bivalent
PEG derivative having 2 of these catechols, the later one being an alternative to anacat
having similarly a permanent positive charge. Three types of substrates were selected:
titanium oxide (TiO2) and niobium oxide (Nb2O5) in view of their favorable optical
properties and use in the field of evanescent-field-based optical sensors and their
importance as passive layer on biocompatible metallic implants, and additionally silicon
oxide as a standard low-cost material.
The thesis is organized as follows:
in Chapter 3, the materials (polymers, buffers, substrates) and techniques used in this
work are presented: nuclear magnetic resonance (NMR) to determine composition and
purity of the polymers, variable angle spectroscopic ellipsometry (VASE) for the
measurement of layer thickness, X-ray photoelectron spectroscopy (XPS) for layer
composition, ultraviolet-visible optical spectroscopy (UV-VIS) for cloud point
determination of the PEG-catechols, and atomic force microscopy (AFM), for binding
strength studies.
The synthesis and characterization of the catechol binding groups used for this study as
well as their coupling to PEG is described in Chapter 4.
In Chapter 5, the assembly of the different PEG-catechol derivatives on TiO2, Nb2O5
and SiO2 surfaces under various adsorption parameters (pH, temperature) are presented,
followed by tests of polymer layer stability and their ability of the PEG to eliminate or
reduce the coated surfaces from non-specific protein adsorption in contact with full
human serum.
The development of the methodology, optimized protocols and results from the study of
the force of single catechols binding events towards TiO2 surface measured by atomic
force spectroscopy (AFM) and calculations of the binding energy (EB) are presented in
Chapter 6.
Chapter 7 summarizes the main findings of this work and puts them in context with
previously reported results. Suggestions for possible future studies are made.

21
Chapter 3
Materials and Methods
3.1 Materials
All glassware used for surface modification was cleaned in “piranha solution”
(H2SO4 : H2O2 = 7 : 3; Fluka/Merk) and extensively rinsed with ultra pure water
(MQ water: purified with a water treatment apparatus from Millipore; ≥ 18.2 MΩ cm,
total organic content ≤ 5 ppb).
Standard reagents and chemicals were purchased from Merk, Darmstadt, Germany or
Sigma-Aldrich, Buchs, Switzerland.
3.1.1 Chemicals
Catechols
The catechol derivative anacat (i) was synthesized as described [92]. Dopamine (ii),
mimosine (iii), L-DOPA (iv) and 2-(3,4-dihydroxyphenyl)acetic acid (DHPAA) (viii)
were purchased from Fluka, Acros or ABCR. Nitrodopamine (v) [93-95] and catechol
with tertiary amine (vi), catechol with quaternary amine (vii) [96], anacat-COOH (ix)
were synthesized by Zürcher (SuSoS AG, Switzerland) and Wach (University of Basel,
Switzerland) respectively. N-Boc-DOPA (x) [97] was synthesizes by H. Lee
(Northwestern University, Illinois)
(Note: mimosine is, strictly speaking, not a catechol derivative, but the latter term is
used in the loose form for all five polymers used in this work).

Materials and Methods
22
PEG-polymers
The polymers mPEG-anacat (1), mPEG-dopamine (2), mPEG-mimosine (3), mPEG-
dopa (4), mPEG-nitrodopamine (5), mPEG-catechol with tertiary amine (6), mPEG-
catechol with quaternary amine (7), mPEG-di-dopamine (8) and mPEG-di-catechol with
tertiary amine (9) were prepared by coupling of the corresponding amine of the catechol
derivatives (i)-(vii), with activated N-hydroxysuccinimidyl propionate-activated
poly(ethylene glycol) (mPEG-ASA) (Nektar, USA, Mw = 5000 (xi), or
synthesized (xii)) as previously described [96, 98-99].
The synthesis of polymers (v), (xii), (3), (5) and (6), (7), (9), (ix) were performed by
Stefan Zürcher (SuSoS AG, Switzerland) [99] and Jean-Yves Wach (University of
Basel, Switzerland) respectively [96].
mPEG-NHS (LaysanBio, USA, Mw = 2000) and F-moc-PEG-NHS (Jenkem, USA,
Mw = 3400) were used for AFM-sample modifications (upon silanization).
Synthesis of all molecules is described in details in Chapter 4.
Buffers
For the polymer adsorption studies at different pH conditions, the following
buffers (0.1 M) were used: i) pH 6.0: N-morpholinopropanesulfonic acid (MOPS)
(Sigma); ii) pH 2: glycine (Fluka) and citric acid (Fluka); iii) pH 4: potassium hydrogen
phthalate tablets (Fluka) and citric acid (Fluka); iv) pH 7.4: N-(2-
hydroxyethyl)piperazine-N’-(2-ethanesulfonic acid) (HEPES) (Fluka); v) pH 9: boric
acid (Fluka).
All buffers used in the polymer adsorption step were formulated with additional
0.6 M NaCl and 0.6 M K2SO4 (high salt buffers used for cloud-point-condition
grafting). After adsorption, HEPES buffer with a physiologic total ionic strength of
160 mM (HEPES 2: 10 mM HEPES + 150 mM NaCl, pH 7.4) was used for
incubation/stability measurements [71].
All binding strength (Atomic Force Microscopy (AFM)) experiments were conducted in
MQ water or water buffered with 50 mM Tris- buffer (Alfa Aesar, pH < 8).

Materials and Methods
23
3.1.2 Substrates
Three different substrates were used for polymer adsorption studies: (i) silicon wafers
(Si-Mat Silicon Materials Landsberg/Germany) used as supplied and oxygen plasma
cleaned resulting in well-defined, natural SiO2 layer; (ii) silicon wafers coated by
reactive magnetron sputtering (PSI Villigen, Switzerland, high purity Ti and Nb targets)
with 15 nm or 20 nm titanium oxide (TiO2) and (iii) silicon wafers coated with 20 nm
niobium oxide (Nb2O5). All wafers were then cut into 1cm x 1cm pieces and cleaned
using toluene (HPLC quality, ≥ 99.99 % (v/v), Fluka), 2 x 10 min ultrasonication and 2-
propanol (≥ 99.9 %, MERK), 2 x 7 min ultrasonication, dried under a stream of nitrogen
and finally cleaned in O2 plasma (Harrick Scientific Corporation, PCS Ossining, NY)
for 3 min to remove adventitious contamination from the surface. The cleaned
substrates were immediately measured by ellipsometry before exposed to the self-
assembly solutions.
The following surfaces were used for binding strength studies: i) silicon nitride tip
(Si3N4, DNP-(S), Veeco, Santa Barbara, CA) used as supplied and/or coated by
ii) reactive magnetron sputtering (PSI Villigen, Switzerland, high purity Ti target) with
10 nm titanium oxide (TiO2); iii) e-beam evaporation (Leybold Univex 500) with 20 –
30 nm titanium (Ti) (http://www.first.ethz.ch/infrastructure/equipment/pvdm);
iv) silicon wafers (Si-Mat Silicon Materials Landsberg/Germany) used as supplied
and/or coated by v) reactive magnetron sputtering (as described before) with 20 nm
TiO2; in both cases the wafers were cut into 1 cm x 1 cm pieces. Si-wafers and
Si3N4 substrates were cleaned in “piranha solution” for 30 min, rinsed with MQ water
and dried with nitrogen. Ti and TiO2 substrates were cleaned using toluene and 2-
propanol, dried under a stream of nitrogen and finally cleaned in O2 plasma as
previously described.

Materials and Methods
24
3.2 Surface modification
3.2.1 Adsorption and stability studies
Polymer coating
Different polymer adsorption conditions were used varying substrates, pH, and
temperature (adsorption/desorption results as a function of polymer concentration are
accessible in Appendix. The cleaned substrates (TiO2, Nb2O5, SiO2) were placed into
glass vials with 1 mL of 0.1 mg/mL solutions of polymers 1-9 in high salt buffers
adjusted to the required pH. After 4 h incubation at the respective temperature (25°C,
50°C, 65°C, 80°C and 90°C), the resulting surfaces were shortly rinsed with water and
dried with a stream of nitrogen. Adsorbed polymer thickness was measured by variable
angle spectroscopic ellipsometry (VASE) and further analyzed by X-ray photoelectron
spectroscopy (XPS). In order to test the stability of the polymeric monolayers in
physiological salt conditions, samples were then stored for 24 h in 1 mL HEPES 2
buffer solution, subsequently rinsed with water, blown dry with a stream of nitrogen and
then again analyzed as before.
Adsorption of serum to metal oxide surfaces
Before exposure to reconstituted lyophilized human serum (150 µl Precinorm U Control
Serum dissolved in MQ water, Roche Diagnostics, Switzerland), the PEG-coated
samples were immersed for 2 min in 1 mL HEPES 2 buffer solution for rehydration of
PEG chains. After 20 min serum exposure, 1 mL of HEPES 2 was added to the serum
solution to dilute the concentration. The substrates were removed from the well and
extensively rinsed with MQ water and subsequently dried under a stream of nitrogen
and analyzed as before. The ability of the polymer coatings to render surfaces protein
resistance was calculated from ellispometry data, using the increase of adlayer thickness
after serum adsorption. For certain cases these results were compared to values
calculated from XPS data using the difference of nitrogen atomic percentage before and
after the serum test.

Materials and Methods
25
3.2.2 Binding strength studies (AFM)
Surface preparation
For binding strength studies two surface modification approaches were used: A) silicon
nitride (Si3N4) tip modification and/or B) silicon wafers modification. Before
modification, Si-wafers and Si3N4 tips were cleaned in “piranha solution”
(H2SO4 : H2O2 = 7 : 3; Fluka/Merk) for 30 min and rinsed with MQ water and dried
with nitrogen. Cleaned samples were subsequently silanized using 3 different ways:
i) silanization from solution where samples were transferred into 20 % (vol / vol) 3-
aminopropyltrimethoxysilane (APTMS) in toluene (Aldrich) for 30 min; [100]
ii) silanization from vapor phase where samples were placed in a desiccator with 10 μL
of APTMS, and evacuated for 1 - 25 h, [101] or iii) silanization using
glycidyloxipropyltrimethoxysilane (GOPTS) (ABCR) at a concentration of 5 μL / cm2
incubated for 1 h, avoiding exposure to the atmosphere by assembling two slides face-
to-face [41, 102].
The silanization step was terminated by rinsing samples with toluene and additional
ultrasonication in toluene for 1 min (only wafer samples), followed by rinsing with MQ
water and drying with nitrogen. The aminated samples were then functionalized with a
mixture of methoxy-PEG-N-hydroxysuccinimide (mPEG-NHS; JenKem Technology
USA, Mw = 2000) and Fmoc-PEG-N-hydroxy succinimide (Fmoc-PEG-NHS;
LaysanBio, Inc., Mw = 3400) at a Fmoc-PEG-NHS / mPEG-NHS ratio of 1 : 30 to
1 : 90. The PEG functionalization was performed at a total PEG concentration of
1.2 mM in 50 mM borate buffer/0.6 M K2SO4, pH 7.8 at room temperature for 6 h
Fmoc-protecting groups were then cleaved by treating the samples in 20 % piperidine
(vol / vol in N-methyl-2-pyrrolidone, (NMP), Acros) for 1 min, followed by rinsing
with NMP and coupling of DHPAA (viii), anacat-COOH (ix) or N-Boc-DOPA (x) to
the liberated amine. The following conditions were used for the catechol coupling:
(4 mM) catechol solution in NMP with 10 μL of diisopropylethylamine (Sigma-
Aldrich), activated by (Benzotriazol-1-yloxytris(dimethylamino)phosphonium
hexafluorophosphate (BOP) (Novabiochem) and hydroxybenzotriazole (HOBt)
(Novabiochem); (in the molar ratio catechol : BOP : HOBt = 1 : 1 : 1). The use of
excess mPEG-NHS during PEG functionalization served to limit the number of catechol
residues on the samples, facilitating single-molecule force measurements. Each

Materials and Methods
26
modification step was controlled by VASE on wafer samples during the protocol-
optimization procedure. Silanization and PEGylation steps were additionally controlled
by XPS (data not shown). Force measurements after silanization, PEGylation and
finally catechol coupling steps were performed by AFM.
3.3 Bulk Characterization
3.3.1 Proton nuclear magnetic resonance spectroscopy (1H-NMR)
Synthesized molecules were characterized with nuclear magnetic resonance
spectroscopy (NMR) (300 MHz or 400 MHz; Bruker) and elemental analysis.
3.3.2 UV-VIS Spectroscopy
Determination of Cloud Points: mPEG-catechol derivatives (1-5) were dissolved in the
respective buffers and different pH (see below) at a concentration of 0.1 mg/mL.
Solutions were warmed up from 25 °C to 99 °C at a rate of 1 °C/min while recording
the absorption at 350 nm using a Cary 1E UV-Visible spectrophotometer (Varian AG,
Cary IE). The cloud point was taken as the onset of a sharp increase in absorption [103].
3.4 Surface characterization
3.4.1 Variable Angle Spectroscopic Ellipsometry (VASE)
Adsorption and stability studies
Ellipsometry (VASE) is an optical analysis technique based on the change of light
polarization state typically upon reflection (possibly also upon transmission). It is an
indirect method, providing information that allows determining physical properties of
materials (layer thicknesses, refractive indexes, absorption coefficients) while
measuring the complex ratio, ρ, which can be expressed through two angles Ψ and Δ,
related to the total reflection coefficients Rp and Rs for p- and s-polarized light.

Materials and Methods
27
i
s
p eR
R)tan( Equation 1
Ψ represents the relative attenuation of the p- and s–polarized components (change in
amplitude), while Δ represents the relative phase shifts and is thus the parameter
sensitive to the layer thickness:
s
p
R
Rtan ri Equation 2
where δ is the phase shift between the p- and the s-component of the light (i refers to the
incoming and r to the reflected beam).
From these parameters thickness and optical constants such as the refractive index n and
the extinction coefficient k can be deduced, by applying an adequate layer model, which
considers the optical constants and thickness parameters of all individual layers of the
sample including the correct layer sequence. A widely used model to characterize
insulators (such as metal oxides) is the Cauchy equation
42)(
nn
n
CBAn Equation 3
where An, Bn, Cn are Cauchy’s coefficients and λ the wavelength.
Using a regression analysis, unknown optical constants and/or thickness parameters are
varied (in the expected range for all the layers) and ellipsometric parameters Ψ and Δ
are calculated. The best fit of the calculated values to the experimental data provides the
result values of the parameters of interest (~constants and thickness parameters of the
sample).

Materials and Methods
28
Light sourceXe lamp
DetectorCCD camera
sample
polarizer
rotating compensator
analyzer
random polarization
linear polarization
elliptical polarization,
rotating
altered elliptical polarization, rotating
linear polarization,varying amplitude
Figure 14. Instrumental set up of an ellipsometry experiment.
A schematic set up of an ellipsometry experiment is shown in Figure 14. The light
source (Xe lamp in case of M-2000FTM, J. A. Woollam Co., Inc.) emits a light which is
linearly polarized by a polarizer. A rotating compensator (retarder, quarter wave plate)
induces a phase shift and hence converts the beam into light with a rotating elliptical
polarization. Upon reflection from the sample, the polarization changes (because s- and
p- components are reflected differently from the surface) and gets polarized again by an
analyzer. The resulting light is a linearly polarized beam of oscillating amplitude
(induced by the rotation of the ellipse). This beam reaches the detector where the
incoming intensities over time is recorded and further used to reconstruct the shape of
the ellipse.
Experimental
The thickness of i) metal oxide on wafers as well as the adsorbed polymer layers before
and after HEPES incubation and finally after serum exposure (during adsorption and
stability studies) and ii) the thickness of SiO2 on Si-wafers before and after silanization
as well as after following PEGyation (during binding strength studies) was measured in
air with the M-2000FTM variable angle spectroscopic ellipsometer (J. A. Woollam Co.,
Inc.). The measurements were done at angles of 65°, 70° and 75° relative to the surface
normal under ambient conditions in the spectral range of 370 - 1000 nm. Ellipsometry
data were fitted with multilayer models using the custom analysis software
(WVASE 32) and a Cauchy model (An = 1.45, Bn = 0.01, Cn = 0) to obtain the dry

Materials and Methods
29
thickness of the adsorbed polymer and serum layer [71]. The thickness results reported
represent an average of at least 2 replicate measurements on 6 different samples.
3.4.2 X-ray Photoelectron Spectroscopy (XPS)
X-ray photoelectron spectroscopy (XPS) is a surface sensitive high vacuum technique
used to determine the chemical composition of surfaces. The sample is bombarded by
an X-ray beam with a defined energy hν, causing electrons to be emitted due to the
photoelectric effect. If the energy of the incoming photons is sufficiently high (such as
overcoming the binding energy EB of the electrons and the work function Ф of the
spectrometer, i.e. the potential barrier that must be overcome to remove an electron
from the Fermi level of a specimen to the vacuum level) the electrons escape from the
material with a finite kinetic energy Ekin and are detected with an analyzer. Ekin is given
by
Bkin EhE Equation 4
Mg Kα or Al Kα are generally used as a X-ray source, with energies of 1253.6 eV and
1486.6 eV, respectively.
The peak areas IA are proportional, among other factors, to the number of atoms A per
volume unit NA of the probed sample volume
sinAAAAA TNI Equation 5
where σA is the photoelectric cross section (the probability that an incident photon will
generate a photoelectron from a given subshell), TA is the transmission function of the
instrument (the ratio of the number of electrons at a given energy transmitted through
the spectrometer to the number entering the aperture of the analyzer at the same
energy), λA is the inelastic mean-free path of an electron and θ is the take-off angle of
the collected electrons. A schematic scheme of an XPS set up is shown in Figure 15.

Materials and Methods
30
Electrostatic lenses
Detector
Samplee-
Photon
Slit
Hemispherical analyzer
Slit
Aperture
X-raysource
Figure 15. Schematic scheme of an X-ray photoelectron spectrometer (XPS).
Experimental
XPS data were acquired on a SIGMA 2 Probe Thermo XPS (Thermo Fisher Scientific,
UK). The instrument was equipped with a multichannel detector (7 channels) and an
Alpha 110 hemispherical analyzer and was operated at a base pressure ≤ 10-7 Pa. All
spectra were acquired at 300 W with an Al Kα X-ray source (1486.6 eV) with large
analysis area (400 μm). The instrument was run in a standard lens mode at 90° to the
surface normal. Survey and high-resolution detail spectra (C 1s, N 1s, O 1s, Ti 2p) were
recorded with 1 eV/step, 50 ms, 50 eV pass energy and 0.1 eV/step, 50 ms, 25 eV pass
energy, respectively. Recorded spectra were referenced to the aliphatic hydrocarbon C
1s signal at 285.0 eV. Data were analyzed using the program CasaXPS
[Version 2.3.15dev52 www.casaxps.com]. The signals were fitted using Gaussian-
Lorentzian functions and Marquardt-Levenberg optimization algorithm following
Shirley iterative background subtraction. Apparent normalized atomic concentrations
were calculated using published ionization cross sections [104], transmission function
and attenuation length, assuming a homogenous surface model.

Materials and Methods
31
3.4.3 Atomic Force Microscopy (AFM)
Atomic force microscopy (AFM) [105] is a high resolution (~ atomic) type of scanning
probe microscopy, designed to provide topographical analysis, applicable to both
conducting and non-conducting surfaces. The basic imaging is very simple: a cantilever
with a sharp tip (probe) scans a sample beneath attached to a piezoelectronic positioner.
When the tip is brought into proximity with a sample surface, forces F (e.g. Van der
Waals, capillary forces, chemical bonding, electrostatic forces) between the two lead to
a deflection of the spring (cantilever) according to Hooke’s law:
xkF Equation 6
where F is the force between the tip and the sample, k is the spring constant and x the
displacement directly proportional to stress.
The deflection is typically measured using a laser spot reflected from the top of the
cantilever surface into an array of photodiodes. Usually a feedback loop is employed to
adjust the deflection (piezo moves the sample in z direction) to maintain a constant
force between the tip and the sample; corresponding movements of the piezoelectric
positioner generates the image. A schematic principle of an AFM is presented in Figure
16, showing a sensitive spring to determine the force, a piezoelectric crystal to alter the
separation of the tip and the surface.
Depending on the application, the AFM can operate in number of modes to obtain
topographic and force information. In general, possible imaging modes are divided into
contact modes (sensing repulsive forces) and a variety of non-contact modes (sensing
attractive forces) where the cantilever is vibrated.

Materials and Methods
32
Laser
Sample
Mirror
Tip
Cantilever
XYZ Piezoelectric
Scanner
Photodetector
Figure 16. Schematic diagram of an AFM.
A schematic of the raw data obtained for a force measurement is shown in Figure 17.
Tip-surface interaction forces are directly measured as a function of the gap between the
tip and the sample, resulting in force-distance (F-D) curve (attraction & retraction of tip
from surface while a deflection of the cantilever is monitored as a function of
piezoelectric displacement).

Materials and Methods
33
12
3
7
6
12
3
4
Piezo movement (μm)
For
ce (
nN)
5
Figure 17. Typical deflection signal/piezo trace: 1) cantilever and sample are well separated and thus no
interaction is measured; 2) cantilever and tip approaches resulting in jump into contact; 3) cantilever and
tip in contact; 4) retraction of cantilever; 5) hysteresis due to the adhesion between the two surfaces;
6) the removal force exceeds and the 2 surfaces separate (e.g. bond break); 7) separation of cantilever and
sample.
Experimental
All data were collected on an Asylum MFP-3D AFM instrument (Asylum Research,
Santa Barbara, CA). The cantilever inverse optical lever sensitivity (InvOLS) was
determined on a hard surface (TiO2) as a slope of deflection voltage (change due to the
cantilever deflection) versus the z-piezo movement. The spring constants k of individual
cantilevers (DNP-(S), Veeco, Santa Barbara, CA) were calibrated based on the thermal
noise spectrum using the Asylum software [106]. The tip was lowered with at a constant
rate to a surface in a maximum load of 14 nN, maintained for 1 s in contact to allow
catechol interaction to the surface to form, and finally retracted at the same rate as
lowered while force versus extension was recorded (F-D curves, Figure 17). The
progress of silicon wafer or/and Si3N4 tip functionalization (silanization, PEGylation
and finally catechol coupling) was confirmed/controlled by the appearance of
characteristic force signals at each step in the protocol-optimization procedure.).The
reversible nature of the interaction between a single catechol and the Ti surface allowed
us to construct a histogram of bond dissociation forces extracted from many F–D
curves. All algorithms were implemented using Wolfram Mathematica 7.0. The F-D
measurements were performed at several loading rates (Dynamic Force Experiments).

Materials and Methods
34
The actual loading rate r was directly determined from each individual F–D curve as
follows: vectors within the distance < 4 nm from the force peak minimum were taken
near the rupture point and fitted by linear least-square fit. The slope of the final
line (ΔF/Δx) multiplied by piezo-transducer ramp rate (velocity v) gave the actual
loading rate [86].
3.4.4 Single molecule force spectroscopy by AFM
The bond dissociation energy was calculated from the loading rate dependence of the
pull-off force [107]. The relationship between force F and loading rate r is given by
Tkk
x
x
Tkr
x
Tk
x
Tkk
r
x
TkF b
bb
b
b 00
lnlnln Equation 7
where xb is the bond length, kT is the thermal energy (~ 4.11 · 10-21 J) and ko the
reaction rate, given by
Tk
Eb
ek
0 Equation 8
where ν is the molecular vibration frequency (~ 1010 s–1) and Eb is the bond dissociation
energy.

Materials and Methods
35
-2 -1 0 1 2 3 4 5 6 70
200
400
600
800
1000
1200
y = 32.05 x + 674.66
intercept "b"
Forc
e(pN
)
ln(load rate)
slope "a"
Figure 18. An example of force vs. ln(loading rate) plot [97] with the linear fit showing the slope a and
intercept b.
Because Equation 7 is linear in ln(r) (Figure 18), a plot of F vs. ln(r) would have a
slope a, intercept b and an independent variable x of
ax
Tk
b
xr ln bTkk
x
x
Tk
o
b
b
ln Equation 9
and thus ko can be also expressed as
a
ba
ek
ln
0 Equation 10
Bond dissociation energy Eb is finally given by
0ln
kTkEB
Equation 11


37
Chapter 4
Synthesis
Catechols (derivatives of pyrocatechol, also known as 1,2-dihydroxybenzene) have been
presented as promising adhesives in surface modification, employing the hydroxy
groups and/or the free electrons from the aromatic ring. These polar molecules differ in
their overall charge as well as in the acidity of the hydroxyl groups defined by the pKa
values (dissociation of the first hydroxy group). Catecholic OH-groups have the special
property of being much more acidic (lower pKa) than other hydroxyl groups such as
alcohols or sugars [53, 108-109], where hydroxyl groups are quite inert and do not
dissociate at physiological pH. Moreover this can be further influenced due to various
side groups. Many studies have been performed proposing different ways of their
reactivity (listing metal chelation, imine formation, oxidation, quinone and Michael
adduct formation or coupling oxidation via radical processes) [61, 63]. The reactivity of
the catechols to be used in surface modifications, however can act also as a drawback.
When oxidized molecules became inert towards metal surfaces, or on the other hand,
upon polymerization, catechols can form multilayers (difficult to control). Sensitivity to
oxidation is related again to the structure and the presence of substituents on the
aromatic ring.
As previously mentioned, catechol derivatives have been shown to be a useful tool for
surface functionalization. Messersmith has used L-DOPA for this purpose, preparing
PEGylated oligomers (mPEG-dopax, x = 1-3; [71]) as well as peptidomimetic polymers
consisting of poly-N-substituted glycine oligomers (polypeptoids) conjugated to
Synthesis
38
biomimetic adhesive polypeptides (polymer (DOPA-Lys)n, [72]. The multiple
attachment sites are favorable for an efficient immobilization, however there is a risk of
formation of chain loops or tails extending into the solution and potentially interacting
with other molecules or particles. Additionally, such molecules are often synthetically
difficult to prepare and require multistep synthesis.
We focused our attention to single functional groups as anchors having advantages e.g.
for surface modification and stabilization of nanoparticles or colloidal solutions in the
sense that the dimension of the anchor group remains relatively small (in comparison to
the size of typical nanoparticles, 10 – 100 nm) but results nevertheless in fairly strong
surface binding. For the first part of the study (Chapter 5) we focused on amine
functionalized catechol derivatives as they allow convenient coupling to activated
mPEG-carboxylic acids (mPEG-NHS), Figure 19.

Synthesis
39
Figure 19. mPEG(5 kDa)-catechol derivatives investigated in this work: mPEG-anacat (1), mPEG-
dopamine (2), mPEG-mimosine (3), mPEG-dopa (4), mPEG-nitrodopamine (5), mPEG-catechol with
tertiary amine (6), mPEG-catechol with quaternary ammonium cation (7), mPEG-di-dopamine (8),
mPEG-di-catechol with tertiary amine (9).
The single DOPA (iv) anchor has been shown to be not efficient in surface attachment.
At least 2 or even 3 molecules of DOPA are needed in order to achieve a stable
adhesion. We proposed that we can overcome this limitation by introducing a new
anchor, anacat (i), based on the iron chelator anacheline [110-111]. Apart from better
stability towards oxidation, this derivative carries a permanent positive charge, believed
to increase its stability when used towards negatively charged metal oxide surfaces, and
having a rather low pKa value compared to other catechol derivatives, favorable for
catechol-metal oxide attachment. The drawback of this molecule is its complicated 9-
step synthesis [92, 98] (Figure 20). Therefore, we turned our attention to compound vi,

Synthesis
40
which is available from DOPA by a shorter synthetic route [96]. By N-methylation of vi
we introduced a permanent, pH-independent positive charge, resulting compound vii.
As another potential alternative having similar properties as anacat (i) we synthesized
nitrodopamine (v), also available in a shorter synthetic route [93-94]. We hypothesized
that the electron withdrawing group on the catechol ring ensures its stability towards
oxidation and increases the acidity of the –OH group. The catechols dopamine (ii)
mimosine (iii), L-DOPA (iv) are commercially available.
Figure 20. Synthesis of Boc-anacat: a) Boc2O, NaOH, dioxane; b) 1: i-BuOCOCl, N-methylmorpholine;
2: HN(CH3)2; 3: BnBr, Cs2CO3; c) 1: TFA, CH2Cl2; 2: BH3.THF, THF; 3: Boc2O, NaOH, dioxane; d) H2,
Pd/C. MeOH. AcOH; e) Dianisyltelluriumoxide, CH2Cl2.
In order to further increase the binding strength, different strategies to prepare "double-
feet" compounds were described in the paper from Wach et al. (Figure 22 - Figure 23).
The polymers mPEG-anacat (1), mPEG-dopamine (2), mPEG-mimosine (3), mPEG-
dopa (4), mPEG-nitrodopamine (5), mPEG-catechol with tertiary amine (6), mPEG-
catechol with quaternary amine (7), mPEG-di-dopamine (8) and mPEG-di-catechol with
tertiary amine (9) were prepared by coupling of the corresponding amine of the catechol
derivatives (i)-(vii), di-dopamine and di-catechol derivative, with activated N-
hydroxysuccinimidyl poly(ethylene glycol) (mPEG, Mw = 5000) as previously
described [96, 98-99].
The synthesis of polymers (xii), (3), (5) with catechol derivative v and polymers (6),
(7), (9) with corresponding catechol derivatives vi, vii, ix, di-catechol derivative, were

Synthesis
41
performed by Stefan Zürcher (SuSoS AG, Switzerland) [99] and Jean-Yves Wach
(University of Basel, Switzerland) respectively [96].
Binding strength study (Chapter 6) required COOH-catechol derivatives due to coupling
to the free amino group of PEG (after cleaving 9-fluorenylmethyloxycarbonyl
protective group; Fmoc-group) (Figure 21). Catechol DHPAA (viii) was chosen in a
view of its simple availability (custom supply). Catechol derivatives anacat-COOH (ix)
and N-Boc-DOPA (x) [97] were synthesized by Wach (University of Basel,
Switzerland) and by H. Lee (Northwestern University, Illinois), respectively.
Figure 21. Catechol derivatives DHPAA (viii), anacat-COOH (ix) and DOPA-Boc (x) used for binding
strength study (AFM).
4.1 Experimental
Standard chemicals and reagents were purchased from Merk, Darmstadt Germany, or
Sigma-Aldrich, Buchs, Switzerland without further purification, unless stated else way.
Solvents for work-up and chromatography were technical quality, solvents for chemical
reactions were puriss quality. Non-aqueous reactions were run in dry glassware under
Ar or N2. Concentration under reduced pressure was done by rotary evaporation at
40 °C. Reaction yields are based on purified and dried compounds. Analytical thin layer
chromatography (TLC) was performed on Merck silica gel 60 F254 plates (0.25 mm
thickness) pre-coated with a fluorescent indicator. The developed plates were examined
under UV light and stained with ceric ammonium molybdate (CAM) or with KMnO4
followed by heating. Flash chromatography was performed using silica gel 60 (230 -
240 mesh) from Fluka. Synthesized molecules were characterized with nuclear
magnetic resonance (NMR) (Bruker, 300 MHz or 400 MHz; chemical shift δ given
in ppm) and elemental analysis

Synthesis
42
anacat (i) [92, 98]
L-DOPA (iv) (1 g, 5.07 mmol) was dissolved in dioxane (8 mL). A 1 N solution of
NaOH (5 mL) to adjust the pH to 9 - 10 and water (5 mL) were added while the solution
turned orange. The Di-tert-butyl dicarbonate (BOC2O, 1.22 g, 5.58 mmol, 1.1 eq.)
dissolved in dioxane (2 mL) was added, the pH monitored and readjusted to 9 – 10 with
1 M NaOH if necessary and stirred at RT overnight. The suspension was evaporated
under reduced pressure and acidified to pH 2 (1 N HCl). The resulting suspension was
extracted 4 times with ethyl acetate. The organic phases were combined, dried with
MgSO4, filtered and the solvent was evaporated under reduced pressure. The crude
reaction product A resulting in a brown slurry was directly used for the next reaction
step without further purification.
The brown slurry A was dissolved in 10 mL of tetrahydrofuran (THF) and cooled to –
40 °C (using liquid N2 and acetonitrile). N-methylmorpholine (0.6 mL) and
isobutylchloroformate (iBuOCOCl; 0.72 mL, 5.6 mmol, 1.1 eq) were added and stirred
for 30 minutes while still being cooled. After this step, a solution of dimethylamine in
THF (7.6 mL, 15.2 mmol, 3 eq.) was added and the reaction mixture was stirred at RT
overnight. The solvent was then removed under reduced pressure and the residue
dissolved in ethyl acetate. The organic phase was washed three times with 10 % citric
acid, three times saturated NaHCO3 and three times saturated NaCl. The organic phase
was dried with MgSO4, filtered and the solvent was evaporated under reduced pressure.
Recrystallisation from ethyl acetate gave 0.63 mg (2.238 mmol, 39 %) of colorless
crystalline solid directly used in next step without further purification. This solid was
dissolved in acetone (17 mL) and CsCO3 (2.19 mg, 3 eq.) was added. The reaction
mixture was stirred at RT for 15 minutes (until the color turned red), then benzyl
bromide (0.8 mL, 3 eq.) was added. The mixture was refluxed for 4 h (boiling point of
acetone = 56 °C), then the solvent was evaporated under reduced pressure. The residue
was taken up into ethyl acetate and washed 3 x with 10 % citric acid, 3 x with saturated
solution of NaHCO3, 2 x with water and 2 x with saturated NaCl. The organic phase
was then dried with MgSO4, filtered and evaporated under reduced pressure. The
product was purified by flash chromatography (ethyl acetate : hexane = 1 : 1) to get
0.616 g of B (63 %). 1H NMR (CDCl3, 300 MHz, ppm): 1.43 (s, 9H), 2.47 (s, 3H), 2.76
(s, 3H), 2.80-2.90 (m, 2H), 4.73-4.74 (m, 1H), 5.12 (s, 2H), 5.13 (s, 2H), 5.38-5.41 (m,
1H), 6.67-6.70 (m, 1H), 6.83-6.85 (m, 2H), 7.26-7.47 (m, 10H).

Synthesis
43
B (0.616 g, 1.2 mmol) was dissolved in CH2Cl2 (5 mL) and cooled to 0 °C. Then
trifluoroacetic acid (TFA, 5 mL) was added and stirred for 1 h while being cooled and
another 1 h at RT. The reaction mixture was then neutralized (1 M NaOH) and extracted
with ethyl acetate. The combined organic phases were dried over MgSO4, filtered and
evaporated under reduced pressure. This deprotected amine was directly used without
further purification in the next step, being dissolved in TMF (3.3 mL). The solution was
cooled to 50 °C and BH3 . THF (3.5 mL, 3 eq.) was added dropwise and refluxed
overnight. After cooling down to 0 °C, HCl (3 M) was used to adjust the pH for 2-3.
The mixture was concentrated under reduced pressure and the pH was then adjusted by
6 N NaOH to 14. After extraction with ethyl acetate (3 x) the organic phase was dried
over MgSO4, filtered and evaporated under reduces pressure. Resulting diamine was
used without further purification in next step being dissolved in a mixture of
dioxane/water (1 : 1; 3.3 mL). NaOH (1 M, 1.36 mL, 1.26 mmol ~ 1.05 eq.) was added
and afterwards Boc2O (0.31 g, 1.44 mmol ~ 1.2 eq.). The reaction mixture was stirred at
RT overnight. The mixture was then concentrated under reduced pressure and the
residual water extracted 3 x with ethyl acetate. The collected organic phases were dried
over MgSO4, filtered and evaporated under reduces pressure. This product was then
purified by flash chromatography (CH2Cl2 / MeOH = 1 : 1) to give C (0.118 g, 20 %).
1H NMR (CDCl3, 300 MHz, ppm): d = 1.46 (s, 9H), 2.11-2.13 (m, 1H), 2.19 (s, 6H),
2.70-2.77 (m, 1H), 2.84-2.90 (m, 1H), 3.81 (m, 1H), 4.72 ( m, 1H), 5.14 (s, 2H), 5.16 (s,
2H), 6.70-6.73 (m, 1H), 6.84-6.90 (m, 2H), 7.26-7.49 (m, 10H).
Compound C (97 mg, 0.197mmol) was dissolved in MeOH (2 mL) and acetic acid
(18 μL). The solution was flushed 3 x with argon and Pd / C (10 %) was added. The
reaction mixture was flushed with H2 and stirred at RT for 4 h. Pd / C was filtered over
celite and the solvent was removed under reduced pressure. The resulting compound vi
was used without further purification in next step, being dissolved in CH2Cl2 (2 mL).
Dianisyltelluriumoxide (0.0773 g, 1.1 eq.) (synthesis protocol described below) was
added and the reaction mixture was stirred at RT for 3 h while the color turned red. The
organic phase was extracted 3 x with water and the water phase was then washed 5 x
with CH2Cl2. Lyophilisation gave 36 mg (60 %) of Boc-anacat (i). Elemental Analysis
for C16H25N2O4+ (Mw = 309.18) in weight %, found (calculated): C: 55.04 % (55.73 %),
H: 7.00 % (7.31 %), N: 7.66 % (8.12 %), O: 21.63 % (18.56 %), Cl: 8.67 % (10.28 %);
1H NMR (D2O, 300 MHz, ppm): d = 1.46 (s, 9H), 2.76-3.12 (m, 3 H), 3.56 (s, 3H), 3.60
(s, 3 H), 3.85-3.89 (m, 1H), 4.34 (s, 1 H), 6.78 (s, 1 H), 7.21 (s, 1H).
Synthesis
44
Dianisyltelluriumoxide [112-113]
TeCl4 (25 g, 0.13 mol) was added into a dry flask and anisole (methoxybenzen) (60 mL,
0.55 mol) was added. The reaction mixture was first heated up to 160 °C and stirred for
6 h, then cooled down to RT and the solvent was removed under reduced pressure. The
resulting crude dianisyltelluriumdichloride was stirred at 95 °C for 1 h in NaOH (5 %,
300 mL). After cooling to 0 °C the white-yellow solid was filtered off, washed with
cold water (3 x 3-mL) and dried under high vacuum (& P2O5) to give
dianiyltelluriumoxide (18.4 g, 71 %). 1H NMR (CDCl3, 300 MHz, ppm): d = 3.83 (s,
6H), 6.87-6.90 (m, 4H), 7.71-7.74 (m, 4H).
mPEG-anacat (1)
Boc-anacat (i) (prepared according to Gademann et al. [92, 98, 114]) (36 mg, 117 μmol)
was dissolved at 0 °C (ice-bath) in HCl (4 M) in dioxane (0.5 mL). The reaction mixture
was stirred at 0 °C under Ar. After 30 minutes a yellow-orange precipitate started to
form. After 1.5 h at 0 °C the reaction mixture was warmed up to room temperature
(10 min). The solvent was removed under reduced pressure and the resulting off-white
powder was dried under high vacuum. The residue was suspended in DMF (1 mL) and
CH2Cl2 (5 mL) and N-methylmorpholine (257 μL) was added. Additional DMF (5 mL)
was added and the reaction mixture was stirred for 15 minutes until an orange-yellow
solution resulted. mPEG-ASA (xii) (300 mg, ca. 58 μmol) was added in one portion and
the orange-yellow solution was stirred at RT under Ar in the dark for 18 h. The reaction
mixture was then filtered, and diluted with 50 mL diethylether. The solution was
allowed to stand for 30 minutes at 4 °C, after which a precipitate formed. The

Synthesis
45
precipitate was filtered and washed extensively with diethylether. The product was
dried under high vacuum to give 1 (264 mg, ca 52.5 μmol, 50 % based on (i) resp. 90 %
based on PEG-ASA) as orange solid. Elemental Analysis for C242H477N2O118
(Mw = 5304) in weight %, found (calculated): C: 53.63 % (54.80 %), H: 8.90 %
(9.08 %), N: 0.69 % (0.53 %), O: 35.56 % (35.59 %).
PEG-dopamine (2)
Dopamine hydrochloride (ii) (50 mg, 0.26 mmol) and N-methylmorpholine (50 μL)
were dissolved in ethanol (20 mL). mPEG-ASA (xi) (1.34 g, ca. 0.26 mmol) was added
together with chloroform (5 mL) and stirred at RT for 2.5 h. The crude reaction mixture
was evaporated to about 10 - 15 mL and diethylether (40 mL) was added. The solution
was allowed to stand for 30 minutes at 4 °C, and then at -20 °C overnight, after which a
white precipitate formed. The precipitate was filtered and washed extensively with
diethylether. The product was dried under high vacuum to give 2 (1.21 g, ca 0.19 mmol,
74 %) as a white solid. Elemental Analysis for C240H473N1O118, Mw = 5262 in weight %,
found (calculated): C: 54.40 % (54.78 %), H: 8.83 % (9.08 %), N: 0.29 % (0.27 %),
O: 36.11 % (35.88 %).
mPEG-mimosine (3)1
Mimosine (iii) (10 mg, 0.05 mmol) was dissolved in sodiumborate buffer (5 mL,
50 mM, pH 8.4). mPEG-ASA (xi) (252 mg, ca. 0.05 mmol) was added and the resulting
mixture was stirred at room temperature for 16 h after which time a HCl solution
1 Synthesized by S. Zürcher

Synthesis
46
(0.5 mL, 2 N) was added. The compound was extracted into chloroform and the
combined organic phases were dried with MgSO4. After reducing the solvent to 5 mL
on a rotary evaporator, diethylether (40 mL) was added. The solution was allowed to
stand for 30 minutes at 4 °C, and then at -20 °C overnight, after which a white
precipitate formed. The precipitate was filtered and washed extensively with
diethylether. The product was dried under high vacuum to give 3 (220 mg,
ca 0.04 mmol, 85 %) as a white solid. Elemental Analysis for C240H473N2O120,
m.w.: 5303 in weight %, found (calculated): C: 54.23 % (54.32 %), H: 9.04 % (8.97 %),
N: 0.32 % (0.53 %), O: 36.19 % (36.18 %).
mPEG-DOPA (4)
L-DOPA (iv) (20 mg, 0.1 mmol) was dissolved in sodiumborate buffer (4 mL, 50 mM,
pH 8.4) under nitrogen. mPEG-ASA (xi) (500 mg, ca. 0.1 mol) was added and the
resulting mixture was stirred at RT overnight under Ar. A solution of HCl (about
0.5 mL, 2 N) was added to adjust the pH to acidic. The compound was extracted into
chloroform (4 times) and the combined organic phases were dried over MgSO4, filtered
and the solvent was reduced to 10 mL on rotary evaporator (under reduced pressure).
Diethylether (40 mL) was added. The solution was allowed to stand for 30 minutes at
4 °C, and then at -20 °C overnight, after which a white precipitate formed. The
precipitate was filtered and washed extensively with diethylether. The product was
dried under high vacuum to give 4 (335 mg, ca 0.063 mmol, 68 %) as a white solid.
Elemental Analysis for C241H474N1O120, Mw = 5302 in weight %, found (calculated):
C: 54.52 % (54.56 %), H: 8.84 % (8.99 %), N: 0.28 % (0.26 %), O: 36.18 % (36.19 %).

Synthesis
47
Nitrodopamine (v)1 [93-94]
Dopamine hydrochloride (ii) (1.90 g, 10 mmol) and sodium nitrite (1.52 g, 22 mmol)
were dissolved in water (25 mL) and cooled down to 0 ºC. Sulfuric acid (17.4 mmol in
10 mL water) was added slowly to the mixture and a yellow precipitate was formed.
After stirring at room temperature overnight the precipitate was filtered and
recrystallized from water. The product was dried under high vacuum to give
nitrodopamine (v) as the hemi-sulfate salt 6-nitro-3-hydroxytyramine hemi-sulfate salt),
(1.389 g, 58 %). 1H NMR (D2O, 300 MHz, ppm): 7.62 (s, 1H nitrodopamine), 6.83 (s,
1H nitrodopamine), 3.24 (t, 2H CH2), 3.12 (t, 2H CH2). Elemental Analysis for
C16H22N4O12S in weight% found (calculated): C: 38.01 % (38.87 %); H: 4.48 %
(4.48 %); N: 11.10 % (11.33 %); S: 6.89 % (6.49 %).
mPEG-COOH1
mPEG-OH (50 g, 10 mmol; Fluka, m.w.: 5000 in weight %) and KOH (14 g,
0.26 mmol) were dissolved in 250 mL water. KMnO4 (4.74 g, 30 mmol) was added and
the reaction mixture was stirred overnight. The resulting brown suspension (MnO) was
filtered over celite and 44 mL of concentrated HCl (37%) was added to the filtrate. The
product was extracted into chloroform followed by drying with MgSO4. After reducing
the volume by evaporation, diethylether was added until the solution became turbid.
The solution was stored in the fridge overnight and the precipitate mPEG-COOH (vi)
was filtered and dried under high vacuum (33.8 g, 6.76 mmol, 68 %). 1H NMR (CDCl3,
300 MHz, ppm): 4.19 (s, 2H, O-CH2-COO), 3.57-3.9 (m, -CH2CH2O-), 3.4 (s, 3H,
-OCH3).

Synthesis
48
mPEG-ASA (xii)1
mPEG-COOH (vi) (33.8 g, 6.76 mmol) in CH2Cl2 (200 mL) with addition of 13 g
molecular sieves (3 Å spheres, Fluka) was stirred overnight in CH2Cl2 (200 mL) to
remove residual water. 1,3-dicyclohexylcarbodiimide (DCC; 2.09 g, 10.14 mmol) and
N-hydroxysuccinimide (NHS; 1.17 g, 10.14 mmol) were added and the suspension was
stirred overnight. Resulting N,N-dicyclohexylurea (DCU) was filtered off over celite.
The volume of the solvent was reduced to about 50 mL with a rotary evaporator and
then diethylether added until the solution became turbid. The solution was stored in the
fridge overnight and the resulting precipitate filtered and dried at high vacuum to give
30.65 g of mPEG-ASA (vii) (6.13 mmol, 91 %). 1H NMR (CDCl3, 300 MHz, ppm):
4.55 (s, 2H, O-CH2-COO), 3.57-3.9 (m, -CH2CH2O-), 3.4 (s, 3H, -OCH3), 2.89 (s, 4H,
succinimide).
mPEG-nitrodopamine (5)1
Nitrodopamine (v)1, (30 mg, 0.1 mmol) and N-methylmorpholine (20 mL) were
dissolved in a mixture of ethanol (10 mL) and chloroform (2 mL). mPEG-ASA
(500 mg, 0.1 mmol) was added and the mixture stirred at room temperature overnight.
The crude reaction mixture was filtered over celite, washed with chloroform and the
clear yellow solution evaporated to dryness. The product was dried under high vacuum
to give 428 mg (0.08 mmol, 80 %) as a yellow-greenish solid. 1H NMR (CDCl3,
300 MHz, ppm): 7.70 (s, 1H, nitrodopamine), 6.83 (s, 1H, nitrodopamine), 3.98 (s, 2H,
O-CH2-CON), 3.57 - 3.9 (m, -CH2CH2O-), 3.4 (s, 3H, -OCH3). Elemental Analysis for
C240H470N2O120, m.w.: 5000, in weight % found (calculated): C: 54.05 % (54.35 %),
H: 8.98 % (8.93 %), N: 0.52 % (0.53 %), O: 36.15 %, (36.20 %).

Synthesis
49
mPEG-di-methylamine catechol (6)2
Compound vi2 (Figure 22), (14 mg, 30 mmol, 3.0 eq.), prepared by J.-Y. Wach as
described before, according to a published protocol [92, 96], was dissolved in CH2Cl2
(1 mL), cooled at 0 °C under N2, and TFA (1 mL) was added drop wise. The solution
was stirred for 1 h at 0 °C and for 1 h at RT. The solvent was removed and the residue
was dissolved in toluene and concentrated. The residue was dissolved in CH2Cl2/DMF
1:1 (1 mL) under N2. N-methylmorpholine (NMM, 50 mL) was added dropwise and the
solution was stirred at RT for 15 min. mPEG-SPA (50 mg, 10 mmol, 1.0 eq.) was added
and the solution was stirred for 14 h at RT under N2. The solution was filtered, diluted
with Et2O (30 mL), and stored at 4 °C for 4 h. Filtration and purification by
chromatography on Sephadex LH-20 (MeOH) gave 6 (22 mg, 4 mmol, 44 %).
Tri-methylammonium catechol (vii)2
Synthesis of molecule vii was done by J.-Y. Wach as publishedn[96]. Compound vi2
(Figure 22),(44 mg, 0.14 mmol, 1.0 eq.) was dissolved in CH2Cl2/MeOH 2:1 (1 mL).
MeI (44 mL, 0.71 mmol, 5.0 eq.) was added and the solution was stirred at RT for 6 h
under N2, The solvent was removed under reduced pressure to give compound vii
(62 mg, 0.14 mmol, 97 %).1H NMR (CD3OD, 400 MHz): d=1.36–1.39 (s, 9H; Boc
rotamers), 2.61–2.74 (m, 2 H), 3.17 (s, 9 H), 3.49 (m, 2H), 4.20–4.23 (m, 1H), 6.59 -
6.61 (m, 1 H), 6.72–6.74 ppm (m, 2H); 13C NMR (CD3OD, 100 MHz): d = 27.5, 27.6
(Boc rotamers), 40.7, 48.4, 54.8, 73.8, 79.5, 115.6, 116.8, 123.2, 132.0, 144.6, 145.8,
155.6 ppm; HRMS: m/z: calcd for C17H29N2O4 [M+H]+: 325.2122; found: 325.2127.
mPEG-tri-methylammonium catechol (7)2
Synthesis of molecule 7 was done by J.-Y. Wach as published [96]. Compound vii
(Figure 22), (9 mg, 30 mmol, 3.0 eq.), prepared by J.-Y. Wach as described above,
according to a published protocol[96], was dissolved in CH2Cl2 (1 mL), cooled at 0 °C
under N2, and TFA (1 mL)´was added drop wise. The solution stirred for 1 h at 0 °C and
for 1 h at RT. The solvent was removed and the residue was dissolved in toluene and
concentrated. The residue was dissolved in CH2Cl2/DMF 1:1 (1 mL) under N2.
NMM (50 mL) was added dropwise and the solution was stirred at RT for 15 min.
2 Synthesized by J.-Y. Wach
Synthesis
50
mPEG-SPA (50 mg, 10 mmol, 1.0 eq.) was added and the solution was stirred for 14 h
at RT under N2. The solution was filtered, diluted with Et2O (30 mL), and stored at 4 °C
for 4 h. Filtration and purification by chromatography on Sephadex LH-20 (MeOH)
gave 7 (32 mg, 6 mmol, 64 %).
Di-catechol linker 2
Compound vi (Figure 22), (250 mg, 0.81 mmol, 1.0 eq.), prepared by J.-Y. Wach as
described above, according to a published protocol [92], was suspended in
CH2Cl2 (4 mL) and cooled to 0 °C under N2. TFA (2 mL) was added dropwise and the
solution stirred at 0 °C for 1 h and at RT for 1 h. The reaction mixture was then
concentrated, redissolved in toluene (1 mL), concentrated, and dried under high
pressure. The residue was dissolved in CH2Cl2 (10 mL) before Et3N (450 mL, 4.0 eq.)
and HOBt (130 mg, 1.2 eq.) were added and the solution was stirred for 5 min at RT.
EDC·HCl (165 mg, 1.2 eq.) and a solution of BOC-L-DOPA (259 mg, 1.1 eq.) in
CH2Cl2 (3 mL) were added. The solution was stirred at 0 °C for 1 h and at RT for 18 h
under N2 in the dark. The reaction mixture was concentrated, diluted with Et2O and
washed with 1 M HCl (2 x 10 mL), saturated NaHCO3 (2 x 10 mL) and brine (10 mL).
The organic layer was dried (MgSO4), concentrated, and the residue purified by
chromatography on SiO2 (CH2Cl2/MeOH 8:1) to give di-catechol linker (287 mg,
0.63 mmol, 54 %).
mPEG-di-methyl-di-amino-di-catechol (9)2
Di-catechol linker2 (Figure 22), (15 mg, 30 mmol, 3.0 eq.) was dissolved in
CH2Cl2 (1 mL), cooled at 0 °C under N2, and TFA (1 mL) was added dropwise. The
solution stirred for 1 h at 0 °C and for 1 h at RT. The solvent was removed and the
residue was dissolved in toluene and concentrated. The residue was dissolved in
CH2Cl2/DMF 1:1 (1 mL) under N2. NMM (50 mL) was added dropwise and the solution
stirred at RT for 15 min. mPEG-SPA (50 mg, 10 mmol, 1.0 eq.) was added and the
solution was stirred for 14 h at RT under N2. The solution was filtered, diluted with
Et2O (30 mL), and stored at 4 °C for 4 h. Filtration and purification by chromatography
on Sephadex LH-20 (MeOH) gave 9 (30 mg, 6 mmol, 60 %).
Synthesis
51
Figure 22. Synthesis of mPEG-catechol derivatives 6, 7 and 9 made by J.-Y.Wach [96].
mPEG-di-dopamine (8)
Figure 23. Preparation of mPEG di-dopamine 8: a) dopamine hydrochloride, NEt3, HOBt, EDC, 14 h, RT
b) MeOH, Pd / C, 3 h; c) mPEG-SPA, CH2Cl2 / DMF 1 : 1, RT.
Z-Glu (281 mg, 1.0 mmol, 1.0 eq.) was dissolved in CH2Cl2 (5 mL) and cooled to 0 °C
(ice bath). Et3N (1.533 mL, 11 mmol, 11 eq.) was added than sequentially HOBt
(297 mg, 2.2 mmol, 2.2 eq.), EDC hydrochloride (427 mg, 2.2 mmol, 2.2 eq.), and
dopamine hydrochloride (217 mg, 2.2 mmol, 2.2 eq.). The reaction mixture was stirred
at 0 °C for 1 h and then allowed to warm to RT and stirred for 16 h. The solvent was

Synthesis
52
evaporated under reduced pressure and citric acid (10 %) and ethyl acetate were added
for extraction. The organic phase were dried over MgSO4, filtered and evaporated under
reduces pressure (183 mg, 30 %).
Resulting di-dopamine derivative (70 mg, 0.127 mmol) was dissolved in methanol
(5 mL) and flushed 6 x with N2. Pd / C was subsequently added and flushed 8 x with H2.
The reaction mixture was stirred at RT for 3 h and then filtered over celite to give di-
dopamine derivative with free –NH2 group (48 mg, 115 mmol). 44 mg (105 mmol) of
this compound was dissolved in CH2Cl2 and DMF (1 : 1; 5 mL) and mPEG-ASA (xi)
(300 mg, 0.06 mmol, 0.6 eq.) was added and stirred under N2 overnight. After addition
of diethyl ether a precipitate formed (while storing at 4 °C). It was filtered and purified
on Sephadex (LH-20, MeOH) column to give 200 mg (12 μmol) of mPEG-di-
dopamine (8).
Anacat-COOH (ix)2
HN
N OH
OH
H3C CH3
Boc
i
HN
N OH
OH
H3C CH3
ix
OHO
O
Anacat-COOH (ix) was prepared by J.-Y. Wach from anacat hydrochloride obtained
from i after Boc removal with HCl in dioxane (100mg, 0.408mmol, 1.0 eq) as described
above, was mixed with MeOH (2 mL), triethylamine (NEt3) (132 μL, 0.951 mmol,
2.0 eq), 4-dimethylaminopyridine (DMAP) (2 mg, cat.) and succinic anhydride
(190 mg, 1.904 mmol, 4.0 eq) and the reaction mixture was heated to 50°C. After 4 h.
the mixture was cooled to RT, filtered over celite and concentrated with a rotary
evaporator. The crude product was purified by C18 cartridge using MeOH, to give
99 mg (0.320 mmol, 67% yield) of anacat-COOH (ix).

53
Chapter 5
Influence of adsorption
parameters and chemistry of
binding groups on adlayer
thickness, stability and protein
resistance
Poly(ethylene glycol) (PEG, 5 kDa) catechol derivatives have been investigated in terms
of their spontaneous surface assembly from aqueous solution, adlayer stability, and
resistance to nonspecific blood serum adsorption as a function of the type of catechol-
based anchor, assembly conditions (buffer, temperature, pH), and type of substrate
(SiO2, TiO2, Nb2O5). We provided evidence that electrostatic interactions as well as
variation in the acidity of their hydroxyl groups defined by the pKa values (dissociation
of the first catechol hydroxy group), pH and temperature of the assembly solution,
substrate type and its pH-dependent isoelectric point influences the assembly and
binding stability of the adsorbed PEG.
Variable-angle spectroscopic ellipsometry (VASE) was used for layer thickness
evaluation, X-ray photoelectron spectroscopy (XPS) for layer composition, and
ultraviolet-visible optical spectroscopy (UV-vis) for cloud point determination.

Adsorption parameters and chemistry of binding groups
54
PEG
Catechol derivatives
Substrate • Isoelectric point
• Temperature• Salt concentration
• Charge• pKa
• pH of solution
Adsorption
parameters
Material
Characteristics
Figure 24. Schematic summary of adsorption parameters and physicochemical properties for mPEG-
catechol polymers studied in this work.
5.1 Properties of the PEG-catechol derivatives
Nine mPEG-catechol derivatives (1 - 9; Figure 19; Chapter 4) differing in their
electronic and charge pattern as well as in the number of catechol binding sites were
synthesized in order to probe quantitatively the effect of different physicochemical
properties of the catechol derivatives (pKa values, charge), structure
(multivalency ~ multicatechol binding) and assembly parameters (buffer, pH, T) on
their adsorption behavior from aqueous solutions as well as stability on TiO2, Nb2O5
and SiO2 substrates (Figure 24).
PEG-anachelin conjugate 1 is characterized by its catechol moiety, which is structurally
similar to the iron chelator anacheline [111] (more in Chapter 1). It has a permanent
positive charge, which was expected to increase the affinity of this compound to
negatively charged surfaces, compared to control compounds 2 and zwitterionic 3. The
DOPA conjugate (4), a key elements of MAP sequences [9, 48, 56, 59, 71, 115-116]
(more in Chapter 1), was prepared according to the literature as a reference
molecule [71]. mPEG-nitrodopamine (5) was synthesized primarily to test the
hypothesis whether a significantly lower pKa of its catechol hydroxy group (as a
Adsorption parameters and chemistry of binding groups
55
consequence of the strong electron withdrawing NO2 group) would alter the assembly
properties and stability of the adsorbed monolayers in comparison to the non-substituted
members (2 and 4) of the series. In addition, we prepared mPEG-catechols 6 and 7
having tertiary and quaternary amine grops. Polymer 6 represents a parent monovalent
version for PEG-di-catechol 9, whereas 7 was designed as an alternative to mPEG-
anacat 1 (both, 1 and 7, carry a permanent positive charge) accessible through a more
convenient synthetic route compared to 1. The main difference of 7 compared to 1 is,
that the ammonium group in 7 is not conjugated with the aromatic ring of the catechol
and therefore not greatly influencing the oxidation stability and pKa compared to
unsubstituted catechols. mPEG-di-catechol polymers 8 and 9 (with their parent
monocatechol versions, 2 and 6) were designed in view of the expected increased
surface binding strength as a consequence of dicatechol rather than monocatechol
coordination to the metal oxide surface [71].
The acid-base dissociation equilibrium constants for the first (pKa1) and second (pKa2)
catecholic hydroxy groups for polymers 1 - 5 are listed in Table 1 for the “free” (not
PEG-conjugated) catechol derivatives (i-v) used in this work as anchorage moieties, as
well as pKa3 and pKa4 corresponding to acid-base dissociation equilibrium constants for
the amino and carboxyl groups. The presence of a quaternary ammonium cation in i
increases the acidity of the first catecholic –OH group (pKa = 7.53), while –NO2
substitution in v (pKa = 6.31) and nitrogen as part of the aromatic ring (iii, pKa = < 2.1)
further increase acidity. The acidity of amino groups increases with the additional
presence of carboxyl groups (iii, iv); however, after coupling with PEG they are
converted into an amide group and thus are not protonated in the compounds 1-5 studied
for adsorption. Upon coupling with PEG no significant change of pKa1 and pKa2 is
expected, whereas the acidity of the carboxy group [117] in 3 and 4 is expected to
increase to > 3.5.

Adsorption parameters and chemistry of binding groups
56
Table 1. pKa1 and pKa2 values for the dissociation constants of the catechol –OH groups and pKa3 and pKa4
values for the dissociation constants of the –NH3+ and –COOH groups, respectively, of the five different
catechol derivatives examined in this work (i – v); values were either taken from literature or determined
in this worka, in both cases by acid-base titration. bEstimated value of the carboxy group after PEGylation
of the amino group [117].
Structure Molecule pKa1
(-OH)
pKa2
(-OH)
pKa3
(-NH3+)
pKa4
(-COOH)
HO
HO
HN O
ON
H3C CH3 i
Anacata 7.53 n.d. - -
HO
HO
NH3+
ii
Dopamine [52] 9.05 11.98 10.52 -
N
HO
NH3+
CO2H iii
HO
Mimosine [118] < 2.1 9.2 7.2
2.1/
(3.5 - 4)b
HO
HO
NH3+
CO2Hiv
DOPA [109] 9.96 12.14 8.76
2.29/
(3.5 - 4)b
HO
HO NO2
NH3+
v
Nitrodopaminea 6.31 n.d. n.d. -
In order to study the temperature effect on polymer assembly, we measured the cloud
point temperature, TCP, for the PEG-catechol derivatives 1 - 5 and the reference mPEG-
5000 by UV/VIS spectroscopy (Table 2), (more about cloud point in Chapter 1).
Appropriate buffers in combination with salt addition (0.6 M NaCl and 0.6 M K2SO4)
that are known to lower the cloud point temperature [45] were chosen for the five
different pH values investigated (Chapter 3). Substitution of PEG with different
catechol derivatives lead to different TCP values even though the PEG molecular weight
is the same for all compounds studied. Additionally, we found that pH and the type of
buffer significantly affected the TCP.

Adsorption parameters and chemistry of binding groups
57
Table 2. Cloud point (TCP) values of PEG polymers measured by UV/VIS spectroscopy at different pH
values using different buffer systems (0.1 M: N-morpholinopropanesulfonic acid (MOPS), citric acid,
potassium hydrogen phthalate tablets, N-(2-hydroxyethyl)piperazine-N’-(2-ethanesulfonic acid)
(HEPES), boric acid) with salt addition (0.6 M NaCl and 0.6 M K2SO4) to each one. Values of at least 2
independent measurements taken.
Solution pH 2.0 4.0 4.0 6.0 7.4 9.0
Buffers citric acid
(*) phthalate
citric acid
(*) MOPS HEPES boric acid
Polymers TCP (°C)
mPEG-5000 89 ± 1 60 ± 1 74 ± 1 79 ± 1 82 ± 1 82 ± 2
mPEG-anacat (1) 58 ± 1 65 ± 1 65 ± 1 81 ± 1
mPEG-dopamine (2) 76 ± 1 55 ± 1 64 ± 1 62 ± 1 61 ± 1 75 ± 1
mPEG-mimosine (3) 56 ± 1 69 ± 1 61 ± 1 86 ± 1
mPEG-dopa (4) 58 ± 1 72 ± 1 75 ± 1 72 ± 1
mPEG-
nitrododopamine (5) 55 ± 1 60 ± 1 57 ± 4 63 ± 2
(*) citric acid is a triprotic acid and buffers in different pH ranges.
5.2 Polymer adsorption study
The concentration of the polymers in the assembly solution was kept constant at
0.1 mg/mL (data related to the effect of concentration effect on adsorption/desorption
for polymers 1, 2, 5 are available in Appendix), using a buffer, typical for “cloud point
adsorption” (more in Chapter 1), containing 0.6 M NaCl and 0.6 M K2SO4 (MOPS) and
adsorption time of 4 h. We tested the influence of pH, substrate isoelectric point,
adsorption temperature and type of anchor (including multicatechol binding effect) on
i) adlayer thickness, ii) the stability of the adsorbed layer after immersion in
physiological buffer solution (10 mM HEPES, 150 mM NaCl, pH 7.4) for 24 h, and

Adsorption parameters and chemistry of binding groups
58
iii) resistance of the stability-tested surfaces toward non-specific adsorption of proteins.
All thickness measurements were performed by ellipsometry (Figure 25).
VASE
XPS
VASE
XPS
VASE
XPS
VASE
&
XPS
Polymer solution at physiological conditions
Adsorption in “Cloud point”
conditions
Incubation in physiological conditions
Bare substrate
Serum incubation
Figure 25. Schematic steps of surface modification and characterization techniques used.
5.2.1 Polymer film thickness as a function of pH of the assembly
solution and type of substrate
As a first parameter of this study we varied the pH during adsorption of the mPEG-
catechol compounds, using the appropriate buffers (pH of 2, 4, 6, 7.4, and 9; Table 2) in
combination with salt addition. The experiments were carried out on TiO2, Nb2O5 and
SiO2 substrates. Beside structural differences, the oxide substrates vary mainly in their
corresponding isoelectric points (IEP). These values can widely vary depending on
sample preparation and also on purity of the materials [119-120]. For our study, the
following IEP values were used: TiO2 ~ 6, Nb2O5 ~ 4 and SiO2 ~ 2. The results of the
adsorption experiments as a function of pH together with the results after samples
incubation in physiological buffer (after 24 h) are plotted in Figure 26. The use of citric
acid as buffer for pH 4 led to zero adsorption in all cases, likely a consequence of the
strong complexation ability of this chelate, competing with the catechol–substrate
complex formation. Polymer film formation was observed for 1, 2 and 5, however,

Adsorption parameters and chemistry of binding groups
59
when performed from phthalate buffer; therefore, only the latter values (obtained at
pH 4 in phthalate buffer) are plotted in Figure 26.
Figure 26. Polymer thickness of the five different mPEG-catechol derivatives as a function of pH,
measured by ellipsometry. 1) TiO2, 2) Nb2O5, 3) SiO2 substrates. A) Polymer thickness measured directly
after adsorption (under cloud point conditions at various pH); B) after incubation of the coated samples in
physiological buffer for 24 h. The pKa1 values of (non-pegylated) catechol-derivatives are indicated in 1A
and 1B with the following symbols: 1) , 2) , 3) , 4) , 5) . The isoelectric points (IEP) of the
three substrates are shown as a line in each corresponding figure.

Adsorption parameters and chemistry of binding groups
60
For TiO2 as the substrate, ellipsometric layer thickness values for 1, 4 and 5 adsorbed at
pH 6 showed a maximum, directly after adsorption (22 ± 2 Å, 14 ± 3 Å, 34 ± 7 Å,
respectively) as well as after 24 h buffer incubation at 150 mM ionic strength and
pH 7.4 (15 ± 2 Å, 4 ± 2 Å and 13 ± 3 Å, respectively). Polymer 3 reached similar
adlayer thicknesses for both adsorption at pH 4 (19 ± 1 Å) and pH 6 (19 ± 2 Å), which
were reduced after 24 h incubation to thicknesses of 2 ± 1 Å and 4 ± 1 Å, respectively.
Polymer 2 showed its adsorption maximum at approx. pH 7.4 (34 ± 3 Å before and
23 ± 3Å after incubation).
Layer thicknesses above 20 Å for Nb2O5 substrates were found for adsorption at pH 4
for polymer 3 and 5 (21 ± 4 Å and 23 ± 2 Å, respectively); however after incubation,
only 0 ± 1 Å and 9 ± 1 Å remained for polymer 3 and 5, respectively. The
corresponding values for polymers 1 and 2 were maximal at pH 6 both before (18 ± 2 Å,
18 ± 1 Å, respectively) and after incubation (9 ± 2 Å and 10 ± 2 Å, respectively). Very
low polymer adsorption was measured for 4 across the whole pH range studied (below
3 Å). For both TiO2 and Nb2O5 substrates, polymer adsorption was very low when
performed at either pH 2 or pH 9.
Polymer adsorption on SiO2 substrates was in general very low (below 4 Å) for all
5 polymers in the range of pH tested, with a slightly higher value at pH 2.
Polymer 7 was tested as an alternative to polymer 1 having likewise a permanent
positive charge. The adsorption and stability measurements on TiO2 at pH 6 gave
similar results for both molecules before incubation (25 ± 3 and 22 ± 2 Å) as well as
after incubation in physiological buffer (17 ± 3 and 15 ± 2 Å).
5.2.2 Polymer adsorption as a function of temperature
Next, we tested the effect of adsorption temperature on polymer layer thickness limiting
the study to TiO2 as this substrate had shown the most promising results in terms of
polymer adsorption and incubation stability of the coated samples. The experiments
were carried out at pH 6 and the temperature was varied between 25 °C and 93 °C.
These data are shown in Figure 27, plotted as a function of the difference between
adsorption (T) and cloud point temperature (TCP), (T- TCP). They indicated an increase
of layer thickness with elevated temperature, with a maximum at temperatures close to
the respective cloud point temperatures. The adsorption maxima for 1 - 5 were found to

Adsorption parameters and chemistry of binding groups
61
correspond to thickness values before incubation of 31 ± 3 Å, 43 ± 3 Å, 24 ± 2 Å,
32 ± 4 Å, and 34 ± 7 Å respectively, and 15 ± 3 Å, 23 ± 3 Å, 5 ± 2 Å, 13 ± 4 Å and
18 ± 2 Å, respectively, after incubation.
Figure 27. Ellipsometric thickness values for polymers 1 - 5 adsorbed at pH 6 on TiO2 substrates as a
function of the difference of adsorption temperature (T) and cloud point temperature (TCP), (T - TCP).
A line indicates T = TCP. A) Thickness measured directly after adsorption; B) After immersion in
physiological buffer solution for 24 h at room temperature.
5.2.3 Effect of polymer structure- multicatechol binding
In an additional study we tested the effect of multiple attachment sites for mPEG-
polymers. The study was carried out on TiO2 surfaces, at pH 6 and temperature of
50 °C. The data for mPEG-di-catechol derivatives 8 and 9 and the control polymer 6 are
shown in Figure 28. mPEG-di-dopamine (8) displayed the highest adsorbed mass
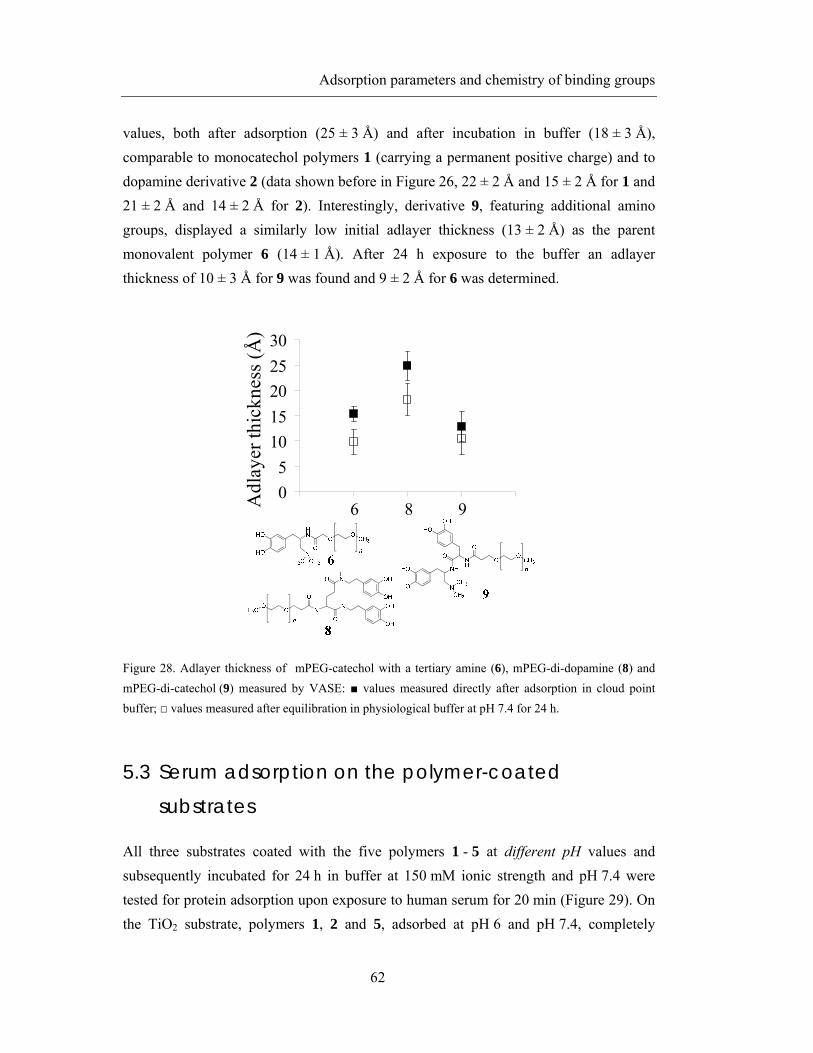
Adsorption parameters and chemistry of binding groups
62
values, both after adsorption (25 ± 3 Å) and after incubation in buffer (18 ± 3 Å),
comparable to monocatechol polymers 1 (carrying a permanent positive charge) and to
dopamine derivative 2 (data shown before in Figure 26, 22 ± 2 Å and 15 ± 2 Å for 1 and
21 ± 2 Å and 14 ± 2 Å for 2). Interestingly, derivative 9, featuring additional amino
groups, displayed a similarly low initial adlayer thickness (13 ± 2 Å) as the parent
monovalent polymer 6 (14 ± 1 Å). After 24 h exposure to the buffer an adlayer
thickness of 10 ± 3 Å for 9 was found and 9 ± 2 Å for 6 was determined.
0
5
10
15
20
25
30
0 1 2 3 4
Adl
ayer
thic
knes
s (Å
) .
6 98
Figure 28. Adlayer thickness of mPEG-catechol with a tertiary amine (6), mPEG-di-dopamine (8) and
mPEG-di-catechol (9) measured by VASE: values measured directly after adsorption in cloud point
buffer; values measured after equilibration in physiological buffer at pH 7.4 for 24 h.
5.3 Serum adsorption on the polymer-coated
substrates
All three substrates coated with the five polymers 1 - 5 at different pH values and
subsequently incubated for 24 h in buffer at 150 mM ionic strength and pH 7.4 were
tested for protein adsorption upon exposure to human serum for 20 min (Figure 29). On
the TiO2 substrate, polymers 1, 2 and 5, adsorbed at pH 6 and pH 7.4, completely

Adsorption parameters and chemistry of binding groups
63
inhibited serum adsorption within the sensitivity of the ellipsometry technique
(approx. 1 Å)3. None of the polymers was similarly efficient when applied to the Nb2O5
substrates, an observation that correlates with the overall lower thickness values of the
polymer films measured for Nb2O5 compared to TiO2 substrates. Also, the very low
polymer thickness values measured on the SiO2 substrate naturally resulted in high
adsorbed serum mass (21 ± 1 – 27 ± 5 Å), not much lower than serum thickness found
for the bare, clean SiO2 surface (35 ± 1 Å).
3 TiO2 substrate coated with polymer 7 (alternative to polymer 1) at cloud point buffer of pH 6 and
subsequently incubated in physiological buffer for 24 h showed a very low increase of adlayer thickness
when exposed to serum for 20 min, similar to results obtained for molecule 1 (2.49 ± 2.32 Å and
0.34 ± 1.56 Å).
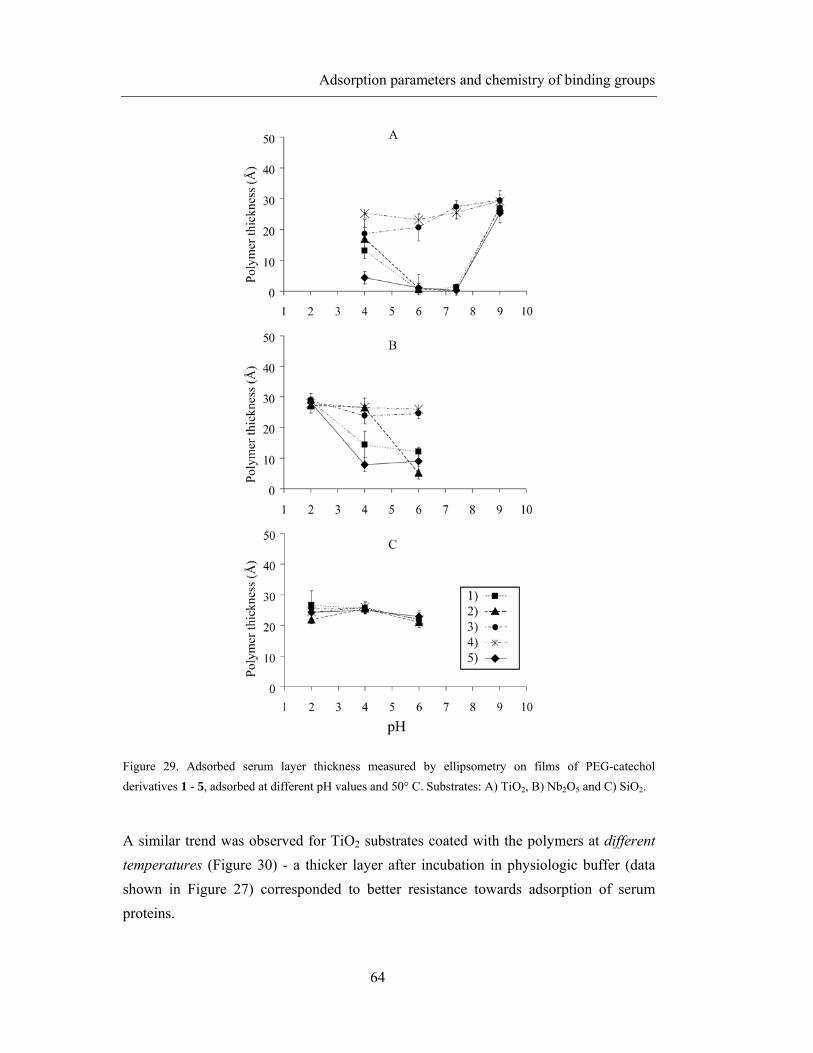
Adsorption parameters and chemistry of binding groups
64
Figure 29. Adsorbed serum layer thickness measured by ellipsometry on films of PEG-catechol
derivatives 1 - 5, adsorbed at different pH values and 50° C. Substrates: A) TiO2, B) Nb2O5 and C) SiO2.
A similar trend was observed for TiO2 substrates coated with the polymers at different
temperatures (Figure 30) - a thicker layer after incubation in physiologic buffer (data
shown in Figure 27) corresponded to better resistance towards adsorption of serum
proteins.

Adsorption parameters and chemistry of binding groups
65
Figure 30. Adsorbed serum layer thickness measured by ellipsometry on films of PEG-catechol
derivatives 1 - 5, adsorbed at pH 6 and different temperature (T) on TiO2, plotted as function of the
difference of adsorption temperature (T) and cloud point temperature (TCP), (T - TCP). A line indicates
T = TCP.
Surprisingly, the mPEG-di-catechol polymer coating (9) was inefficient in reducing
protein adsorption (serum thickness of 15.19 ± 2.80 Å) in contrast to the mPEG-di-
dopamine (8) (serum thickness of 1.76 ± 0.97 Å) as well as to the parent polymer 6
(serum thickness of 3.52 – 3.54 Å), that showed a significantly better performance in
this respect when adsorbed at pH 6, (plot shown in Appendix, Figure 52).
In addition to the ellipsometry data presented thus far, XPS measurements were
performed prior to and after exposure to serum on the different polymer-coated samples.
The increase in adlayer thickness due to serum adsorption was used to indicate the
serum thickness. These values are expressed in Table 3 as a percentage of the values
determined for a bare TiO2 under the same conditions (100 % reference) and were
compared to values calculated from XPS data using the difference of nitrogen atomic
percentage before and after the serum test (Table 3).

Adsorption parameters and chemistry of binding groups
66
Table 3. Ellipsometric thickness of the adsorbed serum layer, taken as the difference between the total
(polymer + serum) thickness after serum adsorption and the thickness of the polymer film for polymers
1 - 9 (column 1). The values are for TiO2 substrates, polymer adsorption at 50°C and pH 6. Serum
adsorption in % of the thickness measured on the bare and polymer coated TiO2 surface is shown in
column 2. Serum thickness on the bare TiO2 served as a reference value (~ 100 %). Column 3 lists values
for the adsorbed serum layer thickness measured by XPS and estimated in percentage using the difference
of nitrogen atomic percentage before and after the serum test (accuracy approx. 10 % relative). The bare
TiO2 control surface was again used as a reference value (~ 100 %). Values shown as ≤ 5 % are below the
detection limit of the ellipsometry technique.
Surface/Polymer
Thickness
increase (Å)
after serum
exposure
Adsorbed
serum layer
in % (VASE)
Adsorbed
serum layer
in % (XPS)
TiO2 31.2 ± 2.4 100 100
mPEG-anacat (1) 0.3 ± 1.6 ≤ 5 8
mPEG-dopamine (2) 0.8 ± 1.7 ≤ 5 11
mPEG-mimosine (3) 20.7 ± 4.4 66 ± 14 71
mPEG-dopa (4) 23.1 ± 1.9 74 ± 6 86
mPEG-nitrodopamine (5) 1.1 ± 1.6 ≤ 5 11
mPEG-di-methylamine catechol (6) 3.5 ± 3.3 11 ± 1 26
mPEG-tri-methylammoniumcatechol (7) 2.49 ± 2.3 8 ± 7 12
mPEG-di-dopamine (8) 1.8 ± 1.0 6 ± 3 3
mPEG-di-methyl-di-amino-di-catechol (9) 15.2 ± 2.8 49 ± 9 56

Adsorption parameters and chemistry of binding groups
67
Although the serum adsorption data of the ellipsometric and XPS study show the same
trend, there is a significant difference, with the ellipsometry data (except for 9) being
systematically lower than the XPS data. With the former technique the thickness
difference before/after serum adsorption is measured, not distinguishing between the
type of adsorbed molecules. This method is expected to underestimate serum adsorption
if interfacial processes occur where polymers become exchanged by proteins, an effect
discovered by Vroman [121] for the exchange of pre-adsorbed small proteins by larger
ones in solution. XPS, on the other hand, detects differences in the protein-specific
nitrogen signal intensity and thus provides more accurate data on adsorbed protein
layer, but this technique is also much more time-consuming.
5.4 Discussion
In the present ellipsometry (VASE) and X-ray photoelectron spectroscopy (XPS) study,
the effect of different adsorption parameters (polymer concentration, temperature, ionic
strength, and pH of the aqueous assembly solution) have been investigated in terms of
their influence on the adsorption of the five PEG (5 kDa)-catechol derivatives (1 - 5).
Control polymers 6 and 7 were tested as an alternative to polymer 1, having no
permanent charge (6) or also a permanent positive change (7) but being easier to
synthesize. The effect of multiple attachment sites (multicatechol binding) was shown
with mPEG-polymers 8 and 9, with the control parent single derivative 6. Titanium
oxide served as substrate in view of its relevance in both the biomaterial (titanium
implants), photocatalysis, and pigment field; furthermore, niobium oxide (Nb2O5) and
silicon oxide (SiO2) were used, covering a range of IEP values. The objectives of this
study was to (a) define the optimum adsorption conditions for maximal surface
coverage (and therefore PEG chain surface density); (b) determine the stability of the
molecular adlayers by exposing them to a buffer solution for 24 h; and (c) explore to
what extent the type of catechol/substituents as well as the number of attachment sites
influenced adsorption and stability of the assembled monolayer.
5.4.1 Cloud Point Temperatures of the Polymers
The technique of cloud point grafting requires an optimum choice of assembly solution
temperature T. Our results demonstrate (Table 2) that substitution of PEG affects the

Adsorption parameters and chemistry of binding groups
68
cloud point temperature TCP, possibly related to differences in the substituent’s charge
and electronic structure of the aromatic ring resulting in different solubility and
aggregation properties. The pH of the assembly solution affects TCP as well (Table 2);
however, no systematic correlation, e.g., with charge, could be established. Possibly, the
type of buffer has a stronger effect than pH. This is particularly evident in the
comparison between citrate and phthalate at the same pH of 4 where the measured TCP
is consistently higher when citric acid is used as a buffer compared to phthalate. The
higher TCP is expected to lead to PEG chains that are less collapsed for a given
temperature affecting negatively the achievable grafting density. In addition, the
triprotic chelate competes with the catechols for surface adsorption sites, explaining the
overall low adsorption when using this buffer system.
5.4.2 Polymer Adsorption Studies
Effect of Polymer Type
An initial idea for our study of adsorption and stability properties of the PEG-catechol
derivatives was based on the assumption of structural differences of the catechol head
groups resulting in a certain overall charge pattern. Polymer 1 (together with control
polymer 7) possesses a permanent positive charge, while 2 is neutral at physiological
pH and polymers 3 and 4 are zwitterionic and negative, respectively, as their carboxylic
groups get deprotonated. By extending the number of studied molecules by an
additional neutral polymer 5, the effect of the catechol acidity can be judged in more
detail (next paragraph). Adsorption and stability properties of molecules 6 and 7,
synthesized as alternative polymers to 1 and 2, possessing non-permanent (6) and
permanent charge (7) confirmed favorable effect of a positively charged binding group
on polymer thickness when adsorbed on negatively charged substrates. Furthermore
increasing the number of the binding groups (as in molecules 8 and 9) allowed us to
discuss also the effect of stability increase due to multicatechol binding [71] (later
paragraph).
Effect of Adsorption pH and Substrate Choice
The adsorption properties of the polymers tested are significantly dependent on the pH
during adsorption (Figure 26), which controls the charge of the catechols as well as the

Adsorption parameters and chemistry of binding groups
69
charge density of the substrate. The pH dependence is greatly influenced by the
dissociation constants (pKa) of the catechols as well as by the isoelectric point (IEP) of
the substrate. The observed different thickness values of the five polymers can, in the
first approach, be correlated with the different acidity of their anchoring groups. For
example, nitrodopamine (v) is about 10 times more acidic than anacat (i) and
almost 1000 times more than dopamine (ii) and dopa (iv), resulting in a higher
concentration of dissociated molecules to interact with the substrate at a given pH.
Furthermore, maximum adsorption was found to occur at pH close to the IEP for most
polymers tested (Figure 26). This rule has been predicted for systems where the pKa
value is higher than the IEP, based on a ligand-exchange model [122] and related to the
equilibrium constant for catechol-surface complex formation [53]. The observed shift in
adsorption maximum toward pH values above the IEP for polymer 2 adsorbed on TiO2
and Nb2O5 is probably related to the fact that the catechol derivative ii is much less
resistant to oxidation and polymerization [99, 123] in comparison to ring-substituted
catechols such as anacat (i) or nitrodopamine (v); the former is therefore more prone to
formation of polymerized structures in solution that would be expected to result in the
formation of thicker layers.
Only polymer 3 possesses a pKa1 value (< 2.1) that is lower than the adsorption pH
values tested in this work (pKa1). For this case, the optimum adsorption pH would be
expected to occur at a pH close to the pKa1 of its polymer, as was predicated earlier for
single catechols (not coupled to PEG) [53]. Instead, we observed the maximum in layer
thickness for 3 on TiO2 and Nb2O5 at pH 4. This pH is close to the pKa1 of the
carboxylic acid group, which is expected to be around 4 in mPEG-mimosine. As
carboxylic acids are known to weakly bind to metal oxide surfaces [124-125] we
assume that the carboxylic acid of the mPEG-mimosine (3) is either involved in the
binding to the surface or stabilizes the formed adlayer through intermolecular hydrogen
binding.
The overall lower polymer thickness observed on Nb2O5 compared to TiO2 must be due
to different affinity of catechols toward the substrates. In order to further unravel how
the different catechol binding groups affect the layer thickness of polymers (1 - 5) on
TiO2, Nb2O5, and SiO2, assembled at 50 °C and pH 6, the latter are plotted in Figure 31
as a function of the difference of pKa and IEP of the substrates. At a given pH, an
increase of polymer layer thickness was observed when the pKa1 value of the catecholic

Adsorption parameters and chemistry of binding groups
70
-OH group was close to the IEP of the substrate. In the case of mPEG-mimosine (3), the
pKa2 value was taken into account, as the first -OH group is already fully deprotonated
in the pH range tested leading to a stabilized resonance structure, and thus, adsorption
properties will be mainly affected by the dissociation of the second -OH group.
An increase in both adsorbed mass and layer stability for polymers and substrates tested
was observed for decreasing values of (pKa - IEP) (Figure 31). Moreover, the overall
highest polymer thickness values were obtained for mPEG-nitrodopamine (5) on TiO2
adsorbed at 50 °C and pH 6 (Figure 26) (with the exception of PEG-dopamine (2)
adsorbed at pH 7.4 on TiO2, which is probably related to its lower resistance against
oxidation in solution). The optimum pH value for mPEG-nitrodopamine adsorption is
close to both the pKa1 of the polymer (pKa1 = 6.31) and the IEP of the substrate
(IEP = 6). For these conditions, the favorable adsorption properties are probably related
to an optimum ratio between protonated/deprotonated catechol molecules and -OH
surface density of the substrate.
Multicatechol binding
The observed increase of adlayer thickness for mPEG-di-dopamine polymer (8)
compared to its PEG-mono-catechol version, mPEG-dopamine (2) corresponded with
published results on mPEG-DOPA1-3, adsorbed on titanium oxide [71]. In contrast, di-
amino dopamine polymer 9 performed poorly, with layer thicknesses similar to its
monovalent counterpart 6. A likely reason for these findings is steric hindrance (di-
methylamino group in 9 might separate the catechol units spatially) expected for
molecule 9, when compared with 8, is the reason for the observed lower adlayer
thickness. Molecular modeling results support this view, in which the dimethylamino
group in 9 appears to separate the catechol units spatially and thus prevent multivalent
attachment (data not shown).

Adsorption parameters and chemistry of binding groups
71
Figure 31 Ellipsometric thickness values for polymers 1 - 5 adsorbed on TiO2, Nb2O5 and SiO2 at 50 °C
and pH 6 expressed as a function of the difference of the catechol pKa values and the substrate IEP, (pKa –
IEP). A) Thickness measured directly after adsorption; B) after immersion in physiological buffer
solution for 24 h.
Effect of Adsorption Temperature
Another significant parameter for the adsorption process is the assembly temperature.
One aspect is the adsorption kinetics for which higher temperature is expected to be
favorable. Our results demonstrate that there is an optimum temperature in terms of
maximal adsorbed mass, and this maximum is close to the TCP (Figure 27). This
dependence is likely to reflect the radius of gyration of PEG decreasing with
temperature and resulting in increased molecular density of the assembled layers
(“cloud point grafting” effect). Additionally, for temperatures above the TCP, molecular
aggregation in solution and their deposition can result in the formation of thicker
coatings (additional physisorption of molecules). Upon rinsing and incubation for 24 h,

Adsorption parameters and chemistry of binding groups
72
a substantial loss of layer thickness is observed, especially for thick initial films (Figure
27). This could be either due to desorption of loosely bound, physisorbed polymers or,
alternatively, a result of desorption of chemisorbed polymers as a consequence of
swelling/rehydration and increased steric repulsion upon changing from cloud point
condition (MOPS buffer) to physiological buffer conditions and room temperature. If
we assume the latter to be the case, we can estimate the corresponding average distances
between PEG chains, L, and compare it to the polymer’s radius of gyration, Rg, using
the molecular spacing parameter L/2Rg, that describes the overlap of the tethered chains
as described originally by deGennes [43-44]. For 5 kDa PEG, the Rg was calculated to
be 2.8 nm according to published light scattering measurements [126]. The average area
(A) occupied by a single PEG molecule on the surface can then be expressed as
A = Mρdryh NA
where M is the molecular weight of the PEG chain, ρ dry the density of the dry PEG
layer (assumed to be constant at 1/1024 gÅ-3), h the thickness of the PEG layer (Å), and
NA Avogadro’s number.
The lateral distance L between PEG chains, assuming a hexagonal PEG chain packing,
then becomes
L 2A
3
L values for polymers 1 - 9 before and after 24 h incubation, calculated from the
ellipsometric thickness values, are summarized in Table 4 together with the respective
L/2Rg values.

Adsorption parameters and chemistry of binding groups
73
Table 4. Experimental polymer thickness values on TiO2 before and after buffer incubation for 24 h, and
calculated average PEG chain distances L and L/2Rg ratios for polymers 1 - 9. The data for 1 - 5 refer to
assembly conditions (pH, temperature, cloud point buffer) that result in maximum layer thickness. The
data for 6 - 9 refer to assembly in cloud point buffer at pH 6 and 50°C, as no other conditions were tested.
Polymer
type
Maximal
initial
thickness
[nm]
Thickness
after
incubation
[nm]
L
initial
[nm]
L
after
incubation
[nm]
L/2Rg
initial
L/2Rg
after
incubation
1 3.1 1.5 1.76 2.5 0.31 0.44
2 3.3 2.3 1.71 2.1 0.30 0.36
3 2.5 0.5 1.97 4.5 0.35 0.79
4 3.2 1.3 1.74 2.7 0.31 0.48
5 3.4 1.3 1.67 2.7 0.30 0.48
6 1.5 1.0 2.50 3.1 0.44 0.55
7 2.5 1.7 1.97 2.4 0.35 0.42
8 1.3 1.0 2.0 2.3 0.35 0.41
9 2.5 1.8 2.7 3.1 0.49 0.54
At L/2Rg values greater than 1, surface-bound PEG chains are isolated (so-called
“mushroom” regime). As the surface density of the adsorbed PEG-molecules increases,
the value of L/2Rg approaches 1.0, neighboring chains start interacting with each other
(“mushroom-to brush” transition). Values of L/2Rg below 0.5 are characteristic of a
dense brush-like structure of the surface-bound chains [6]. The L/2Rg values after
incubation (Table 3) demonstrate that, with the exception of polymer 3 (mPEG-
mimosine), the PEG chain architecture is in the brush regime or close to the mushroom-
brush transition if applying the suitable conditions
Adsorption parameters and chemistry of binding groups
74
5.4.3 Serum adsorption
Independent of polymer type and adsorption condition, a polymer adlayer-thickness of
at least 10 Å was found to be necessary to prevent substrates from adsorbing proteins
upon exposure to serum as shown in the plot of serum thickness as a function of
polymer adlayer thickness, measured by ellipsometry (Figure 32A). The PEG surface
coverage minimally required for non-fouling surface properties can also be correlated
with the transition from mushroom to brush regime (Figure 32B). A value L/2Rg of
≤ 0.5 is required to obtain a fully protein resistant coating, a finding that is in a good
agreement with previously published data [6, 71].

Adsorption parameters and chemistry of binding groups
75
various substrates, T, pH (polymer adsb.),KARLs
-505
10152025303540
0 5 10 15 20 25 30Polymer thickness (Å)
Seru
m th
ickn
ess
(Å)
.
A
-505
10152025303540
0.0 0.5 1.0 1.5 2.0L/2Rg
Seru
m th
ickn
ess
(Å) B
Figure 32. Adsorbed serum thickness values: A) as a function of the thickness of the different polymers
1 - 9 previously adsorbed on TiO2, Nb2O5 and SiO2 at various pH and adsorption temperatures, measured
by ellipsometry; B) as a function of the ratio L/2Rg describing the average spacing between the PEG
chains in relation to the radius of gyration of PEG. As the PEG-chain surface density progresses from the
“mushroom” (L/2Rg > 1) to the dense “brush” regime (L/2Rg < 0.5), the amount of serum adsorbed
decreases sharply.
The negative values obtained in some cases for the serum thickness are thought to be
due to some minor additional desorption of polymer during the serum exposure test.
Partial polymer replacement with serum was also detected by XPS as shown in Table 3.


77
Chapter 6
Binding strength study
In Chapter 5 we have discussed the effect of different parameters on adsorption and
stability properties of mPEG-catechol derivatives. In the current chapter we aimed to
experimentally and directly measure the differences in the binding strength of catechol
anchoring groups (exhibiting differences in the chemical structure, acidity and overall
charge), using single-molecule force spectroscopy [90-91, 127-129]. The interaction
(binding strength) between the catechols DHPAA (viii), anacat-COOH (ix), DOPA-
BOC (x) (Figure 33) towards TiO2 surface was measured by atomic force
microscopy (AFM) [97]. In the first part of this chapter the optimization of the surface
modification protocol is presented for tip and substrate, followed by the results obtained
and the discussion.
Figure 33. Catechol derivatives DHPAA (viii), anacat-COOH (ix) and DOPA-Boc (x) used for binding
strength studis (AFM).

Binding strength study
78
The choice for the molecule ix was driven by the previous results of mPEG-anacat (i)
(Chapter 5), where its adsorption and stability properties on TiO2, together with mPEG-
nitrodopamine, (v), were shown to be superior at most conditions tested compared to
other molecules used for the study. Catechol DHPAA (viii) was chosen in a view of its
commercial availability allowing for a sufficient number of control experiments for
protocol optimization and also its properties expected to be similar to DOPA-BOC (x).
This molecule was chosen as a reference to compare to already published results [97].
Molecules DHPAA (viii) and DOPA-Boc (x) allow a direct coupling of the catechols to
the PEG (used as a linker to attach the catechols to a surface) via their –COOH group.
For that purpose a derivative of anacat (i) anacat-COOH (ix), had to be synthesized.
Two approaches were followed for this investigation: surface (chemical) modification
of Si3N4 AFM cantilevers (approach A) [97] and surface modification of Si wafers
(approach B) (Figure 34). The advantage of the first one (approach A) might be the high
curvature of the cantilever tip (radius of ≈ 25 nm) where the catechol is attached via
PEG. Together with the high flexibility of the long PEG, this increases the probability
that only one catechol can bind at the same pull-off distance. The advantage of the
approach B is that other analytical techniques (e.g. fluorescence, XPS, VASE) can be
used to control directly each surface modification step. Also preparation of these
samples is easier compared to approach A, in a view of frequent loss (breaking) of the
sample during handling the fragile cantilever.
O-C
H3
O-C
H3
OHHO
O-C
H3
O-C
H3
OCH3
OCH3
CH 3O
CH 3O
TiO2 Si wafer
Si3N4TiO2
O-C
H3
O-C
H3
OHHO
O-C
H3
O-C
H3
OCH3
OCH3
CH 3O
CH 3O
TiO2 Si wafer
Si3N4TiO2
Figure 34. Schematic drawing of the catechol-functionalized AFM tip (left; approach A) and catechol-
functionalized wafer (right; approach B) used in the AFM force spectroscopy study.

Binding strength study
79
Poly(ethylene glycol) (PEG) was used as a linker (attached to the surface via silanes)
and a back-filling molecule to isolate the contribution of the catechol. Two types of
PEG were used which differed in their end groups: 1) a methoxy group (mPEG-NHS)
which provided a non-interactive background during the F-D measurements and ii) a 9-
fluorenylmethyloxycarbonyl (Fmoc-PEG-NHS) which provided a site for catechol
coupling after cleaving the Fmoc-group from Fmoc-PEG. We have previously tested the
coupling reaction between the catechol and PEG in solution (reaction scheme in
Appendix) giving a confidence of an efficient coupling.
In order to ensure a single molecule (catechol) interaction with a Ti-coated tip a ratio of
mPEG-NHS/Fmoc-PEG-NHS with much lower fraction of Fmoc-PEG-NHS was used
(30 : 1 to 90 : 1).
6.1 Background
Atomic force microscopy (AFM) has been shown to be an effective force spectroscopic
method to measure the strength of various covalent as well as non-covalent bonds [130-
131]. Messersmith and coworkers used this technique to study interactions of single
DOPA residues with organic and inorganic surfaces using chemically modified tips
(approach A) [97]. They first determined the average DOPA-Ti bond rupture force at
several loading rates and then calculated the bond dissociation energy and the bond
length from the linear fit of the data plotted as rupture force vs. ln(loading rate) (Chapter
3, Equation 7-Equation 11). The published value was 22.2. kcal/mol for the dissociation
energy assuming a Ti-catechol bond length of 2.16 Å . This work served us as a starting
basis for our investigation.
6.2 Protocol optimization
Sample preparation (surface modification) for F-D measurements was done in 3 steps:
i) silanization (3 protocols tested), ii) PEGylation and iii) cleavage of the Fmoc-group
followed by coupling of the catechol molecule (Figure 35). In order to develop an
efficient and reliable modification protocol, various conditions were tested on Si-wafers.
The change in adlayer thickness after each modification step was measured by

Binding strength study
80
ellipsometry (VASE) and control AFM force-distance measurements were done in
parallel.
Si waferSi wafer Si wafer
Figure 35. Scheme of sample modification: silicon wafer after silanization with APTMS, a) mPEG-NHS
and Fmoc-PEG-NHS coupling; b) Fmoc-deprotection; c) catechol coupling.
6.2.1 Ellipsometry results (standard/control tests)
First, three different silanization procedures were tested: i) silanization from solution (3-
aminopropyltrimethoxysilane, APTMS, in toluene) [100], ii) vapor silanization
(APTMS) [101] and iii) “face-to-face” technique (~ silanization avoiding exposure to
the atmosphere by assembling two slides face-to-face) [41, 102], (protocol described in
Chapter 3). The results are summarized in Table 5.

Binding strength study
81
Table 5. Adlayer thicknesses of silane- layers prepared at different conditions (second column), and
thickness of an additional layer of PEG using 100 % FmocPEG (third column) or 100 % mPEG (forth
column), measured by VASE.
Adlayer thickness [Å]
Silanization process Silanes 100 %
Fmoc-PEG-NHS
100 %
mPEG-NHS
From solution (30 min) 324.9 ± 46.5 - -
From vapour (1.5 h) 7.5 ± 1.5 19.7 ± 3.3 12.3 ± 2.2
From vapour (1 + 1 h) 7.5 ± 1.8 - -
From vapour (1 + 15 h) 7.4 ± 0.9 - -
From vapour (1 + 24 h) 10.5 ± 2.5 - -
“face-to-face” 0.0 ± 0.1 - -
Silanization from solution gave an adlayer thickness of more than 300 Å that
extensively exceeds a value expected for a silane monolayer (< 10 Å). Using
silanization in the vapour phase, an adlayer thickness of 7.5 Å was measured for an
evaporation time of 1.5 – 15 h with a small increase in adlayer thickness after 24 h
(10.5 Å). “Face-to-face” technique failed completely to provide any silane coating
(adlayer thickness of 0 Å).
In the following step conditions typical for “cloud point adsorption” (50 mM borate
buffer/0.6 M K2SO4, pH 7.8 at room temperature, 6 h), were used for PEG coupling at
polymer concentration of 1.2 mM resulting in increase of layer thickness of 19.7 Å for
Fmoc-PEG-NHS (3.4 kDa) and 12.3 Å for mPEG-NHS (2 kDa), providing an efficient
coverage of the wafer to shield the SiO2 - TiO2 interaction (between coated wafer and
AFM tip). Finding the optimum mPEG-NHS / Fmoc-PEG-NHS ratio with the aim of
obtaining a single molecule interaction was tested by AFM.

Binding strength study
82
6.2.2 AFM results (standard/control tests)
Control AFM F-D measurements were performed to monitor the different surface
modification steps on Si-wafer using a Ti-coated silicon nitride AFM tip (Figure 36).
No interaction (adhesion) between the clean Ti-coated tip and clean Si-wafer was
detected during cantilever approach (red curve, A) nor during cantilever retraction
(black curve, A). Typical F-D traces after silanization step (curve B) show a snap-on
during cantilever approach (red curve) and a large force (~ 6 nN) upon pull off (black
curve B), that are suggestive of electrostatic interaction between the positively charged
amine functionalized wafer and negatively charged oxide tip. The electrostatic
interactions were attenuated by inert grafted PEG layers. F-D curves typical for a
catechol-functionalized wafer at a very low catechol concentration (mPEG : Fmoc-PEG
= 60 : 1, curve C) suggest a single catechol - TiO2 interaction. At higher catechol
concentration (decreased ratio mPEG : Fmoc-PEG) multiple catechol – TiO2 interaction
during cantilever retraction can clearly been recognized. An example of F-D measured
for a maximum catechol concentration (100 % Fmoc-PEG,) is curve D (black curve). At
full PEG-coverage but in the absence of catechol, no interaction was observed
(curve E). The F-D measurements of catechols were performed in Tris buffer (50 mM)
at pH 7.7 to prevent oxidation of catechols.

Binding strength study
83
100 50 0 -50 -100 -150 -200 -250 -300-15
-10
-5
0
5
10
15
20
B)
For
ce [
nN]
Piezo Movement [nm]
approach retraction
A)
C)
D)
E)
Figure 36. Atomic force microscopy (AFM) force–distance (F–D) traces of Ti-coated silicon nitride AFM
tips on chemically modified Si-wafer: A) representative F–D trace of a clean tip and wafer without
chemical modification, B) representative F–D trace from an amine-functionalized wafer (~ after
silanization step), C) and D) are typical F-D curves from catechol functionalized wafer at a very low
catechol concentration (mPEG : Fmoc PEG = 60 : 1, curve C) and at maximum catechol concentration
(100 % Fmoc-PEG, curve D); E) is a representative F–D trace from a mPEG-modified wafer
(no catechol).
6.3 Results: Single force measurements
The F-D measurements for DHPAA (viii) and anacat-COOH (ix) (for samples prepared
by approach B) on TiO2 were performed at 4 different loading rates. These F-D curves
measured at a particular loading rate, where a single adhesion event with the same
history [128] appeared (Figure 36C), were subsequently analyzed. A histogram of bond
dissociation forces was extracted from the data and the mean of the histogram was
plotted as a data point in a force vs. ln(loading rate) plot. The same procedure was
repeated at different 3 loading rates, which gives additional data points in the plot.
Linear curve fit of the data (taking into account also standard deviations) were analyzed
with the function F = a . x + b, with a slope a, intercept b and an independent
variable x (Chapter 3, Equation 7 - Equation 10; Figure 18). Based on this evaluation,
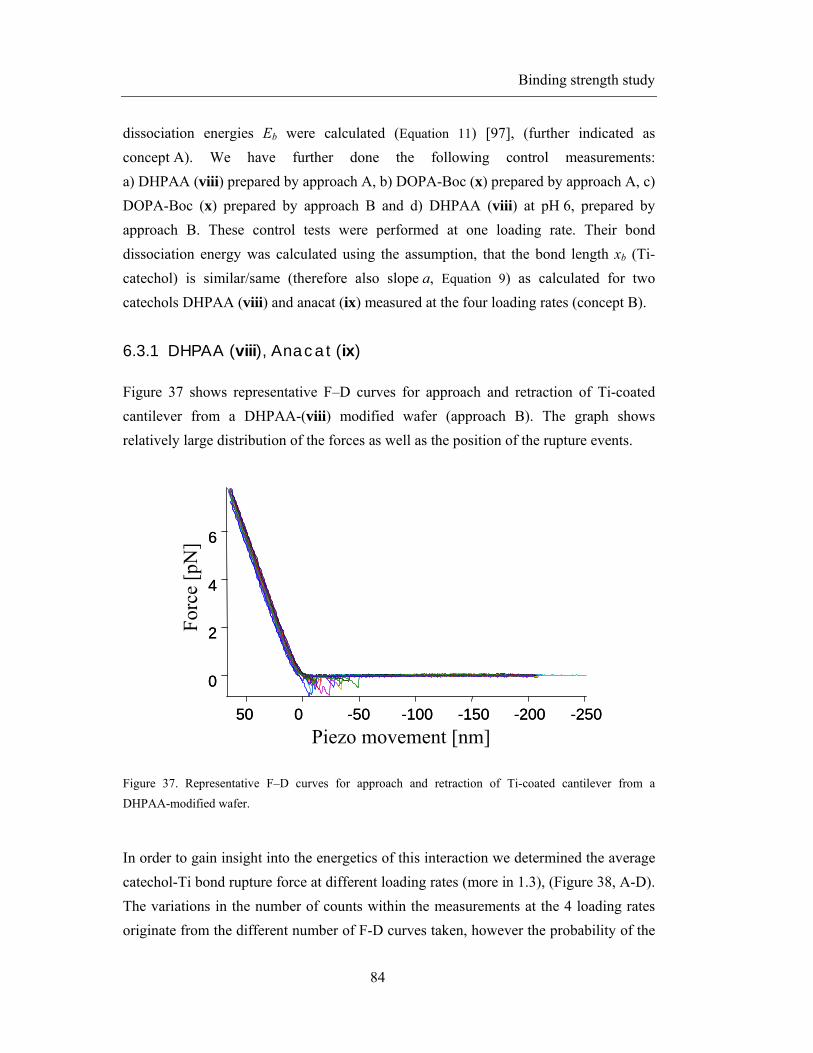
Binding strength study
84
dissociation energies Eb were calculated (Equation 11) [97], (further indicated as
concept A). We have further done the following control measurements:
a) DHPAA (viii) prepared by approach A, b) DOPA-Boc (x) prepared by approach A, c)
DOPA-Boc (x) prepared by approach B and d) DHPAA (viii) at pH 6, prepared by
approach B. These control tests were performed at one loading rate. Their bond
dissociation energy was calculated using the assumption, that the bond length xb (Ti-
catechol) is similar/same (therefore also slope a, Equation 9) as calculated for two
catechols DHPAA (viii) and anacat (ix) measured at the four loading rates (concept B).
6.3.1 DHPAA (viii), Anacat (ix)
Figure 37 shows representative F–D curves for approach and retraction of Ti-coated
cantilever from a DHPAA-(viii) modified wafer (approach B). The graph shows
relatively large distribution of the forces as well as the position of the rupture events.
6
4
2
0
-250-200-150-100-50050
6
4
2
0
-250-200-150-100-50050
Piezo movement [nm]
For
ce [
pN]
Figure 37. Representative F–D curves for approach and retraction of Ti-coated cantilever from a
DHPAA-modified wafer.
In order to gain insight into the energetics of this interaction we determined the average
catechol-Ti bond rupture force at different loading rates (more in 1.3), (Figure 38, A-D).
The variations in the number of counts within the measurements at the 4 loading rates
originate from the different number of F-D curves taken, however the probability of the

Binding strength study
85
events was similar in all cases (~10 %). The total mean of the forces measured at
loading rates of 1.4 ± 3.0 nN/s (A), 30.6 ± 1.7 nN/s (B), 54.2 ± 1.9 nN/s (C) and
197.7 ± 2.4 nN/s (D) were 431 ± 220 pN, 451 ± 205 pN, 432 ± 239 pN, 415 ± 144 pN,
respectively. The data were plotted as force vs. ln(loading rate), (Figure 38E).

Binding strength study
86
Force [pN]Force [pN]
Cou
nts
Cou
nts
A B
DC
-3 -2 -1 0 1 2 3 4 5 6 70
100
200
300
400
500
600
700
800
900
1000
For
ce [
pN]
ln(loading rate)
E
Figure 38. Histograms of pull-off force values for DHPAA (viii)–Ti obtained with two different AFM tips
at loading rates of 1.4 ± 3.0 nN/s (A), 30.6 ± 1.7 nN/s (B), 54.2 ± 1.9 nN/s (C) and 197.7 ± 2.4 nN/s (D).
Mean forces calculated from a minimum of 14 adhesion events were 431 ± 220 pN (A),
451 ± 205 pN (B), 432 ± 239 pN (C), 415 ± 144 pN (D), (43 / 126 / 158 / 14 counts); E: Force vs.
ln(loading rate) plot of mean values recorded with two different tips used (), only one tip () or (),
with their linear fitting.

Binding strength study
87
The plot force vs. ln(loading rate), (more precisely its linear fit) of the forced measured
with both AFM tips reveals surprisingly only a weak dependency on ln(loading rate).
However, excluding the data point corresponding to the lowest counts (at the highest
loading rate we obtained only 14 counts) gives the expected trend of an increased force
at higher loading rates. By evaluating the data for the two tips separately, we obtained
this trend for the first tip without any constraints and also for the second tip when
excluding the data point with the lowest counts.
Also in the case of anacat (ix), F-D measurements of catechol-functionalized wafers
were performed at four different loading rates. The results are summarized in Figure
39. The mean forces calculated from a minimum of 30 adhesion events were 448 ± 202
pN (A), 514 ± 246 pN (B), 568 ± 262 pN (C), 580 ± 333 pN (D) for loading rates of
2.0 ± 1.9 nN/s, 27.4 ± 2.1 nN/s, 54.7 ± 2.0 nN/s and 192.7 ± 2.4 nN/s, respectively. The
data were plotted as force vs. ln(loading rate), (Figure 39E).

Binding strength study
88
Force [pN]Force [pN]
Cou
nts
Cou
nts
A B
DC
-2 -1 0 1 2 3 4 5 6 70
100
200
300
400
500
600
700
800
900
1000
For
ce (
pN)
ln(loading rate)
E
Figure 39. Histograms of pull-off force values for anacat (ix) - Ti obtained with a single AFM tip at
loading rates of 2.0 ± 1.9 nN/s (A), 27.4 ± 2.1 nN/s (B), 54.7 ± 2.0 nN/s (C) and 192.7 ± 2.4 nN/s (D).
Calculated mean forces were 448 ± 202 pN, 514 ± 246 pN, 568 ± 262 pN, 580 ± 333 pN
(141 / 119 / 30 / 79 counts). Force vs. ln(loading rate) plot with linear fit (E).

Binding strength study
89
Binding energy (Eb) and bond length (xb) based on measured data (Concept A)
For both molecules (viii and ix) bond dissociation energy Eb and bond length xb were
calculated based on slope a and intercept b of the linear fit plot (using Equation 7 -
Equation 11, Chapter 3). The data are summarized in Table 6.
Table 6. Binding energies Eb and a xb calculated for DHPAA (viii) and anacat (ix) from the slope a and
the intercept b of the linear fit of the corresponding “Force vs. ln(loading rate)” plot.
* Binding energy calculated from linear fit the data set without the point having the
lowest counts.
Analysis of anacat (ix) provided an Eb of 7.5 kcal/mol (~ 0.32 eV) and the bond length
of 1.33 ± 3.1 Å. In case of DHPAA (viii), Eb could not be calculated based on all data
measured (using two AMF tips due to a negative value of the slope a in the linear fit).
We therefore calculated the Eb from a linear fit excluding the lowest counts (expected to
be the least accurate compared to others). This analysis revealed an Eb of 89.8 kcal/mol
(~ 3.89 eV) and xb of 14.78 ± 143.18 Å. Analysis a single tip provided a value for Eb of
5.5 kcal/mol and xb of 1.55 ± 3.1 Å.
The big differences between the calculated values are due to the large standard
deviations in the slopes a that is directly related to xb (a = kT / xb; Chapter 3), and also
to Eb, although indirectly. Obviously (due to the large standard deviations) xb cannot be
Molecules Eb and xb from measured values
(Concept A)
Binding energy Bond length
[kcal/mol] [eV] [Å]
Anacat (ix) 7.5 0.32 1.33 ± 3.1
DHPAA (viii)
(edited*) 89.8 3.89 14.78 ± 143.18
DHPAA (viii)
(one tip) 5.5 0.24 1.55 ± 3.1

Binding strength study
90
determined with sufficient accuracy from force vs. ln(loading rate) plots in this case.
Calculation of Eb by this approach will not give any statistically correct values (even the
magnitude of the calculated Eb could markedly differ). This makes it impossible to
compare datasets from different molecules without making further assumptions. For
better data comparison, we recalculated again the Eb for DHPAA (viii) based on the
slope a from anacat analysis as representative with the highest count numbers and thus
expected to be the most accurate value for xb.
Binding energy (Eb) based on fixed bond length (xb) calculated from anacatat data
(Concept B)
The Eb for DHPAA (viii) was recalculated based on the slope a from anacat analysis as
representative with the highest count numbers.
The Eb values obtained by this approach were 5.7 kcal/mol, 6.2 kcal/mol and
4.5 kcal/mol, respectively, for DHPAA data measured by both tips, data where lowest
counts point was excluded and data from just one tip (Table 7).
Table 7. DHPAA (viii) binding energies Eb calculated from anacat data, using the xb value calculated
form its force vs. ln(loading rate) plot, (Concept B).
Molecules
Eb based on anacat (ix)
measured data
(Concept B).
[kcal/mol] [eV]
DHPAA (viii) 5.7 0.25
DHPAA (viii)
(edited*) 6.2 0.27
DHPAA (viii)
(one tip) 4.5 0.19
* Binding energy calculated from linear fit from the data set without the point having
the lowest counts.

Binding strength study
91
6.4 Control measurements
For the following Eb data evaluation the approach of using the xb reference value
calculated form the force vs. ln(loading rate) plot of anacat (ix) was applied data as a
reference, Concept B.
6.4.1 DHPAA (viii) at pH 6, (prepared by approach B)
Since our measured values were lower than those published by Messersmith et al., we
additional measured the adhesive interaction of DHPAA (viii) at pH 6 (instead of
pH 7.7), to exclude oxidation as a possible reason for the discrepancy (oxidation is pH
dependent and less likely at lower pH). The F-D measurement performed at loading rate
of 22.8 ± 1.68 nN/s gave a mean force of 391 ± 154 pN, (Figure 40). The Eb calculated
was 6.0 kcal/mol (~ 0.26 eV).
Force (pN)
Cou
nts
Figure 40. Force histogram of DHPAA (viii) at pH 6 obtained with a single AFM tip (at loading rate
22.8 ± 1.68 nN/s the mean force measured was 391 ± 154 pN, (88 counts)).
6.4.2 DHPAA (viii) prepared by approach A
For comparison purpose, we followed the surface modification of Si3N4 AFM
cantilevers (approach A) using the same protocol as previously published [97]. The
histogram of forces for DHPAA (viii) modified tip (approach A) measured at loading
rate of 8.0 ± 1.7 nN/s is shown in Figure 41, giving a mean force value of 276 ± 116 pN.

Binding strength study
92
The calculated Eb was 3.4 kcal/mol (~ 0.15 eV). The difficulty of this approach is the
sample preparation procedure (reproducibility) requiring high numbers of cantilevers
and basically no possibility to directly control the quality of surface modification.
Force [pN]
Cou
nts
Figure 41. Force histogram of DHPAA (viii) prepared by approach A (~ tip modification); at loading rate
8.0 ± 1.7 nN/s, the mean force measured was 276 ± 116 pN, (34 counts).
6.4.3 DOPA (x): comparison between approach A and B
For the direct comparison (/control) with data published by Messersmith et al. [97] we
measured DOPA (x) prepared with the same approach as published
(approach A ~ surface tip functionalization, Figure 42), as well as by approach B
(~ wafer functionalization, Figure 43). The mean force value for the former was
191 ± 51 pN, measured at loading rate of 17.3 ± 1.7 nN/s, and the Eb calculated
was 2.4 kcal/mol (~ 0.11 eV). The mean force value for the approach B was
350 ± 110 pN, measured at loading rate of 26.6 ± 1.8 nN/s, and the Eb calculated
was 4.1 kcal/mol (~ 0.18 eV).

Binding strength study
93
Force [pN]
Cou
nts
Cou
nts
Figure 42. Force histogram of DOPA (x) modified tips (approach A), (34 counts): at loading rate
20.2 ± 1.6 nN/s mean force value measured was 274 ± 150 pN.
Cou
nts
Force [pN]
Figure 43. Force histogram of DOPA (x) modified wafer (approach B), (17 counts): at loading rate
26.6 ± 1.8 nN/s the means force value was 350 ± 110 pN).

Binding strength study
94
Table 8. Binding energies Eb for control measurements calculated based on anacat as a reference data
(Concept B).
Molecules
Eb based on anacat
measured data
(Concept B)
[kcal/mol] [eV]
DHPAA (viii)
pH 6 6.0 0.26
DHPAA (viii)
(approach A) 3.4 0.15
DOPA (x)
(approach A) 2.4 0.11
DOPA (x)
(approach B) 4.1 0.18
6.5 Discussion
6.5.1 Prove of single molecule interaction
Several features of the observed F–D curves are remarkable and provide convincing
evidence for a reversible single molecule interaction. First, the essential features of the
F–D curves were observed repeatedly (Figure 37) during multiple pull-off experiments
performed with the same tip/wafer, indicating that the interaction between catechol and
the surface was both- reversible (i.e., could be repeatedly re-bound and re-pulled).
Second, the mean stretched length of PEG extrapolated from the F–D curves
(36 ± 16 nm, calculated from all anacat measurements, > 300 counts; Figure 44) is
consistent with the expected 37 nm contour length of a PEG chain with a molecular
weight of 3.4 kDa used in this study.

Binding strength study
95
distance [nm]C
ount
s
Figure 44. Histogram of stretched PEG length extrapolated from F-D curves (anacat).
A reason for the relatively large data scattering is probably related to a thermal drift
(a drawback of the modification approach B). It can result a change of position/area
analyzed by the AFM tip while monitoring of F-D curves, requiring inspection of
different spots and thus it might be possible that the molecule is attached under a
different distance and also that not the same catechol will be attached, (Figure 45). The
other reason might be that the molecules attached to the tip from different position,
simply based on their distribution on the surface.
O-C
H3
O-C
H3
O-C
H3
O-C
H3
Si wafer
TiO2
O-C
H3
O-C
H3
O-C
H3
O-C
H3
TiO2
O-C
H3
O-C
H3
O-C
H3
O-C
H3
O-C
H3
Figure 45. Possible source of data scattering originating from variations in position/distance of the
catechol-Ti bond rupture.

Binding strength study
96
6.5.2 Force measurements
We have measured force values that were lower than those published by Messersmith et
al. [97]. We are therefore, in the following paragraphs, discussing different possible
explanations for this observation: i) oxidation of the catechol, ii) concept of data
evaluation, iii) sample preparation approach and iv) binding mechanism.
Oxidation of the catechol
Fist we wanted to test whether oxidation of the catechol could be the reason to account
for this, since oxidized catechols show much lower affinity to metal oxide surfaces [97].
At higher pH part of the catechols become deprotonated, which makes them very
sensitive towards oxidation by O2, compared to lower pH values where these molecules
are known to be more stable. Therefore we tested adhesion forces of DHPAA (wafer
functionalization, approach B) at pH 6 (Figure 40). The control F-D measurements,
however did not confirm oxidation to be the cause the differences in the results. Eb
values calculated by concept B from force measurements at standard condition (pH 7.7;
Eb = 0.25 eV; Table 7) and at the control pH (pH 6, Eb = 0.26 eV; Table 8) were not
significantly different.
Concept of data evaluation
In order to directly compare our data with the data published for DOPA, we have
recalculated the Eb using a fixed-reference bond length xb (~ 2.16 Å) as it was also used
in the publication of Messersmith et al. [97], (concept C). This reference value fits to
both xb values measured for anacat (ix) and DHPAA (ix) (data in Table 6) within
statistical uncertainty.
To justify the use of the reference xb value for calculating the Eb, we plotted a curve
based on a fixed value for the slope a (calculated from the reference value of
xb = 2.16 A; Equation 9), for our anacat (ix) data as well as for the reference DOPA (x)
results previously published (Figure 46). In both cases, it is possible to plot a curve that
is passing through the data points within their standard deviations.
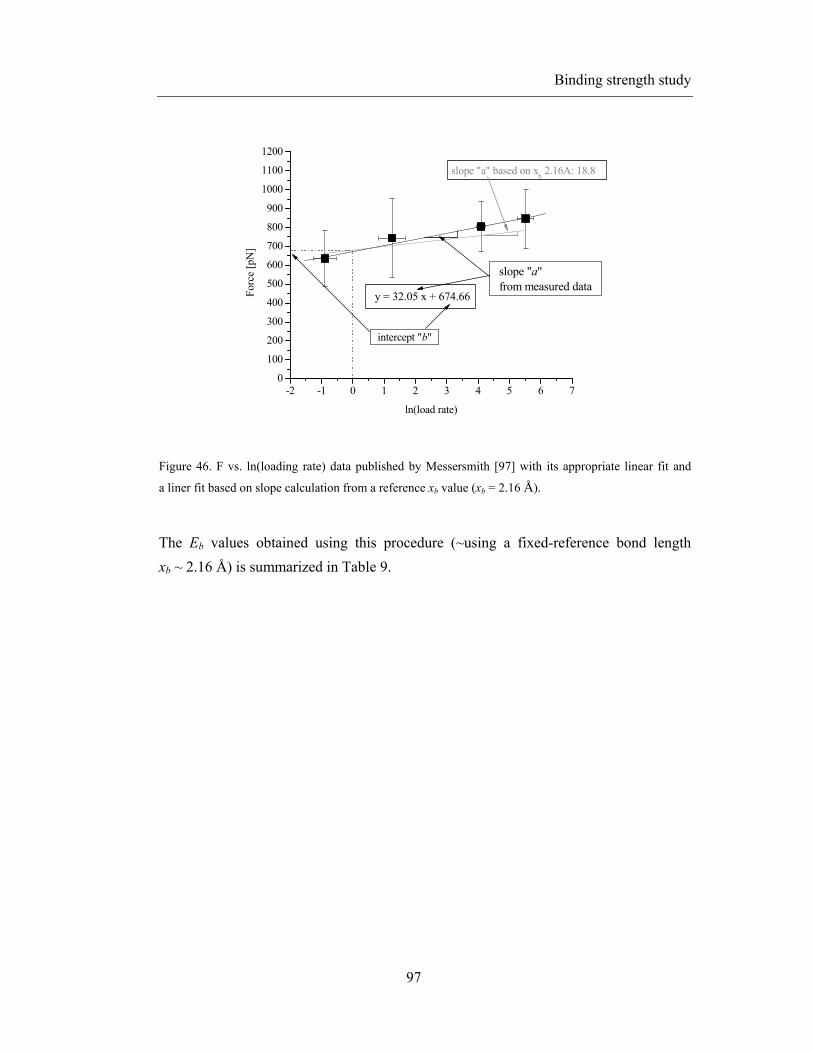
Binding strength study
97
-2 -1 0 1 2 3 4 5 6 70
100
200
300
400
500
600
700
800
900
1000
1100
1200
y = 32.05 x + 674.66
intercept "b"
For
ce [
pN]
ln(load rate)
slope "a"from measured data
slope "a" based on xb 2.16A: 18.8
Figure 46. F vs. ln(loading rate) data published by Messersmith [97] with its appropriate linear fit and
a liner fit based on slope calculation from a reference xb value (xb = 2.16 Å).
The Eb values obtained using this procedure (~using a fixed-reference bond length
xb ~ 2.16 Å) is summarized in Table 9.

Binding strength study
98
Table 9. Binding energies Eb calculated for molecules studied, together with reference values for DOPA
published by Messersmith [97], based on a reference xb value for the bond length, (Concept C).
Molecules
Eb based on reference value
xb ~ 2.16 Å [97]
(Concept C)
[kcal/mol] [eV]
anacat (ix) 13.5 ± 2.1 0.58 ± 0.09
DHPAA (viii) 10.5 ± 3.8 0.46 ± 0.17
DHPAA (viii)
(edited*) 11.1 ± 1.1 0.48 ± 0.09
DHPAA (viii)
pH 6 9.3 ± 1.3 0.41 ± 0.06
DHPAA (viii)
(approach A) 6.4 ± 1.5 0.28 ± 0.07
DOPA (x)
(approach A) 5.3 ± 1.5 0.23 ± 0.06
DOPA (x)
(approach B) 8.4 ± 1.6 0.36 ± 0.07
DOPA (x)
(Messersmith [97]) 21.2 ± 1.0 0.92 ± 0.059
* Binding energy calculated from linear fit from the data set without including data with
the lowest counts.
The Eb values calculated this way (by Concept C) were higher for all cases compared to
the values using the approach based on direct measurement xb through evaluation of the
force vs. ln(loading rate) data (Concept A). However, none of our results (including our
best candidate, anacat (ix)) reached the Eb of DOPA, published by Messersmith.

Binding strength study
99
Contrary to these published results, Wang et al. performed a study of adhesion
mechanism of polymers on a solid surface measuring the forces of copolymer with free
catechol groups (AFM), poly(dopamine methacrylamide)-co-(buthylamine
methacrylamide) on Ti surface [132]. The force values measured by AFM were lower
when compared to our data (typically around 67 pN, with one exception when force of
300 – 400 pN was measured for one data set). The difference in adhesion forces
between single catechol groups at the end of PEG chains and many catechol groups in
the copolymer chains was not explained. This particular case, when higher forces were
obtained, was measured on catechol modified samples/wafers (approach A) compared
to tip modification (approach B) when the low forces were measured.
Sample preparation approach
We were curious to know whether if the inverted modification set up could be the
reason for the differences in the data. The AFM tip has a radius around 25 nm, On the
coated surface, the repulsive forces of neighboring mPEG molecules to the PEG
carrying the catechol is expected to be higher (effective density of the PEG chains) on
the wafer then on the curved tip, resulting in a lower force needed to break the catechol-
Ti bond. However, this is in contrary to what we have observed with our measurements:
the final Eb calculated based on samples prepared by set up B (wafer modification) was
higher than when using set up A (tip modification), although we have to admit that we
would need a higher number of collected data to prove this hypothesis. Additionally, we
do not see any evidence of the contributing repulsive forces during the F-D
measurements. As it is shown in Figure 36 (curve C), the force is back to 0 pN before
reaching the single bond-breaking event.
Binding mechanism
We further considered another possible explanation for the data variation based on
published studies on binding mechanisms of catechols to metal cations of metal oxide
surfaces. Different binding schemes were proposed including monodentate and
bidentate molecules and their Eb were estimated using different methods (e.g. density
functional theory calculations, [80-82], more in Chapter 1).
In a first step we tried to increase the statistics by plotting data from all four loading
rates used for F-D measurements of A) DHPSS (viii) and B) anacat (ix), (Figure 47).

Binding strength study
100
Force [pN]
Cou
nts
Force [pN]
A B
Figure 47. Total histograms including data from all four loading rates used for F-D measurements
of A) DHPSS (viii) and B) anacat (ix).
Histograms in Figure 47 appear having very similar profile. In both cases the histograms
shows a “tail” on the high force side. However, this cannot be easily related to the
presence of two peaks. It rather confirms what has been published, i.e., that the force
measured is expected to increase with the loading rate. This effect might be more
evident for the higher loading rates and therefore would appear as the “tail” in our plot.
In order to look for traces indicating the different bindings, we had a closer look on the
shape of the histograms. We normalized the histograms for DHPAA (viii) and
anacat (ix) data, to the same probability (each histogram divided by the number of
counts), (Figure 48 and Figure 49). This allowed us to directly compare their shape.

Binding strength study
101
Force [pN]Force [pN]
%%
A B
DC
Figure 48. Normalized histograms for DHPAA (viii) measured at 4 different loading rates:
1.4 ± 3.0 nN/s (A), 30.6 ± 1.7 nN/s (B), 54.2 ± 1.9 nN/s (C) and 197.7 ± 2.4 nN/s (D).
In the case of DHPPA there is some indication for the presence of two peaks; however it
is difficult to reveal from the data any significant trend. When looking at the normalized
data for anacat (ix), (Figure 39), this situation looks slightly different.

Binding strength study
102
Force [pN]Force [pN]
%A B
DC
A
C
BA
C D
BA
C
%
Figure 49. Normalized histograms for anacat (ix) measured at 4 different loading rates:
2.0 ± 1.9 nN/s (A), 27.4 ± 2.1 nN/s (B), 54.7 ± 2.0 nN/s (C) and 192.7 ± 2.4 nN/s (D).
The data indicate some evidence for the presence of two peaks. We followed this
hypothesis also because of a good evidence in the literature for the presence of both
binding modes [65, 81]. We indicate in Figure 49 the position of the two peaks (only an
estimation without analytical calculation). The position of the first peak (mean force
values) appears to not change very much with loading rate. In contrast the second peak
location depends on the loading rate. In the F vs. ln(lading rate) plot, the slope for the
first peak data would then be similar to the one based on all experimental data, whereas
the slope of the second peak will be much steeper. When this would be put into account
for the further calculations of the Eb values it would result in two different binding
energy regimes.
In order to obtain a reasonable guess for the Eb values using this approach, we would,
however, need many more additional experiments to achieve better statistics.
Additionally, our earlier adsorption studies based on VASE measurements (Chapter 5)
showed superior adsorption and stability results for mPEG-anacat (1). The (albeit weak)

Binding strength study
103
indication of a second binding state with higher binding energy could therefore be
interpreted as indicating a mixed mono and bidentate binding regime for anacat, but
mostly monodentate binding for the other two catechols. This interpretation, although
hypothetical, would be in agreement with the experimental findings in Chapter 5, which
show a stronger interaction of the mPEG-anacat (1) molecules with TiO2 compared to
the reference DOPA case (shown to be the most stable).
An important aspect when comparing results obtained from the VASE experiments and
those measured by AFM is the difference in the stage in which the molecule is situated
during data acquisition. Ellipsometry experiments are carried in equilibrium in the first
step, followed by the adlayer stability tests (dissociation of adsorbed molecule). The
results of the adsorption and stability tests cover statistically sufficient number of data
or single events (experiments), in relation to not only the number of samples, but also in
the terms of averaging the results over a relatively large sample area and high number of
the molecules adsorbed. In contrast the binding strength study (AFM) refers to a single
binding event; the two different situations are clearly not directly comparable, neither
from a thermodynamic nor kinetic point of view restricted to the desire single molecular
set up.


105
Chapter 7
Conclusion and Outlook
We have tested on three different, application-relevant substrates a series of five
assembly systems based on PEG (5 kDa) functionalized with single catechol-related
anchorage groups. Additionally two other PEG-single catechol derivatives used as
alternatives and control. Substitution at the catechol group that increases the acidity of
the catecholic hydroxy groups was shown to improve molecular coverage and stability
of the monomolecular adlayers when exposed to buffer solution for 24 h. mPEG-
nitrodopamine was found to be a particularly attractive polymer, in the combination of
PEG brush density achieved, and resistant to undesirable oxidation in solution. Not
surprisingly and largely in qualitative agreement with published results for related
chemical systems, adsorption conditions (pH and temperature of assembly solution)
strongly influence surface coverage; preferentially for high surface coverage, pH of the
assembly solution is close to pKa of the catechol and the isoelectric point (IEP) of the
substrate, and temperature close to the cloud point temperature TCP (in high-salt buffer),
thus exploiting the reduced radius of gyration of PEG at cloud point conditions. More
subtle effects are shown to be relevant as well for the polymer-specific optimization of
assembly conditions, in particular, the dependence of the cloud point temperature on
both the type of catechol derivative and the pH buffer system.
The resistance of the PEGylated surfaces to full serum protein adsorption correlated
quantitatively with the PEG surface density confirming earlier work that PEG brush

Conclusion and Outlook
106
conditions are required for non-fouling performance in contact with complex protein
solutions.
A disadvantage of the catechol-derived binding concept is the low affinity to silica and
glass. However, application is certainly not restricted to titania and niobia, as many
transition metal oxides/ceramics are known to form strong bonds with such chelates as
well as with non-transition metal oxides such as alumina [133-135].
We have further tested two PEG polymers each having two catechol anchors. The
results suggested that the increase of the number of binding groups per PEG chain can
be favorable for the adsorption and stability. However the right three-dimensional
arrangement of the molecules is important to obtain strong binding to the surface. The
stability of PEG-catechol adlayers can be further improved by the use of multiple
catechol anchorage moieties e.g. in combination with electrostatics as was demonstrated
by Saxer et al. [33, 71, 136].
In the last part of the thesis we have optimized the protocol for single molecule studies
allowing investigation of bond strength. Beside clear advantages (simple sample
handling and possibility of additional control test using different techniques), the sample
preparation using an approach where SiO2 wafers were modified, rather than AFM tips,
seemed to carry a drawback in the data acquisition related to a larger data scattering
than when using the later one. However, when comparing with published data [97], also
the tip-modification technique did not show an optimal/precise results that would allow
a straight forward calculation of the binding strength. In both cases an assumption of a
bond length had to be taken in account to correct on the high standard deviations in both
of the techniques.
The binding forces measured by AFM for the tested molecules appeared lower than
published values, resulting as well in lower binding energies calculated. Nevertheless
when the different proposed binding schemes for catechol-TiO2 surfaces were taken in
consideration (mono- and bidentate) the data interpretation could be extended. In the
case of anacat (viii) expected to bind stronger than the DHPAA (viii), two distribution
of forces were revealed suggesting/confirming that the molecule can bind either in
mono- or a bidentate conformation. This in addition gave another explanation for the
high standard deviation in the force-distance measurements. Furthermore, calculation of
the binding energies for the two situations could give more accurate (reasonable) Eb
values.

Conclusion and Outlook
107
However, in order to follow the data analysis properly resulting in correct data
interpretation and calculations, additional experiments, that will increase the statistics,
are needed. We believe that the presence of the different catechol attachment will be
then of a significant evidence.
Another option that would allow a more extensive interpretation of the AFM data is
using this technique in combination with computational modeling (e.g. molecular
modeling in the form of molecular force-field simulations [137]). Such a “hybrid”
analysis technique can combine a feasible experimental data and numerical data. Thus
the advantage of this is, apart from lowering of material costs, that less measurement are
needed.


109
Appendix
Adsorption results as a function of polymer
concentration
In order to reduce the amount of polymer needed and to reduce the immersion time to
equilibrate the surfaces for subsequent protein resistance tests, polymer adsorption as
function of polymer concentration was investigated for 1, 2 and 5 (Figure 50).
Furthermore desorption/stability properties of adsorbed polymer 2 incubated in
physiological buffer (Figure 51) were tested.

Appendix
110
Figure 50. Adlayer thickness of (A) PEG-anacat (1), (B) PEG-dopamine (2) and (C) PEG-
nitrodopamine (5) as a function of polymer concentration; First () directly after adsorption (4 h, 50 °C,
pH 6, 0.1 M MOPS buffer 0.6 M NaCl and 0.6 M K2SO4); Further () after immersion in physiological
buffer solution for 24 h.

Appendix
111
Figure 51. Ellipsometric thickness values of PEG-dopamine (2) layers deposited from different
concentrations (1 mg/mL (), 0.5 mg/mL (), 0.2 mg/mL (), 0.1 mg/mL (), 0.05 mg/mL () and
0.01 mg/mL ()) as a function of incubation time in physiological buffer solution. Polymer 2 was
previously adsorbed during 4 h on TiO2 at pH 6 at 50 °C.
Testing Protein resistance of polymers 6 - 9
-10
0
10
20
30
40
50
0 1 2 3 4
Seru
m th
ickn
ess
(Å) .
6 98polymers
Figure 52. Protein resistance of mPEG-catechol with tertiary amine (6), mPEG-di-dopamine (8) and
mPEG-di-catechol (9) measured by VASE as an increase of layer thickness after immersion in full human
serum.

Appendix
112
Additional prove of polymer adsorption of samples modified at all conditions described
above was performed by XPS. Ratio of C(PEG)/Ti as a function of polymer thickness
confirms that the adlayer thickness measured by VASE corresponds to the polymer
adsorbed (and not a possible contamination), (Figure 53).
Figure 53. C(PEG)/Ti ratio (signals measured by XPS) as a function of polymer thickness (VASE).
Test of coupling reaction between mPEG-NH2 (2 kDa)
and DHPAA (viii)
Coupling between mPEG-NH2 and DHPAA (viii) used for tip modification (Chapter 6)
was first tested in solution. DHPAA (viii) (3.36 mg, 0.02 mmol) was dissolved in
NMP (5 mL). BOP (8.85 mg, 1 eq.), mPEG-NH2 (40 mg, 1 eq.), HOBt (2.7 mg, 1 eq.)
and finally DIPEA (~10 μL) were added and stirred for 20 h. The reaction mixture was
then purified by dialysis (Specheri MW 1000). Lyophylization gave 10 mg (25 %) of
mPEG-DHPAA.

113
References
1. Dalsin, J.L. and P.B. Messersmith, Bioinspired antifouling polymers. Materials
Today, 2005. 8(9): p. 38-46.
2. Raviv, U., et al., Lubrication by charged polymers. Nature, 2003. 425(6954): p.
163-165.
3. Wu, P. and D.W. Grainger, Drug/device combinations for local drug therapies and
infection prophylaxis. Biomaterials, 2006. 27(11): p. 2450-2467.
4. Bretagnol, F., et al., Surface functionalization and Patterning techniques to design
interfaces for biomedical and biosensor applications. Plasma Process. Polym.,
2006. 3(6-7): p. 443-455.
5. Cropek, D., et al., Selective Photocatalytic Decomposition of Nitrobenzene Using
Surface Modified TiO2 Nanoparticles. J. Phys. Chem. C, 2008. 112(22): p. 8311-
8318.
6. Pasche, S., et al., Poly(L-lysine)-graft-poly(ethylene glycol) assembled
monolayers on niobium oxide surfaces: A quantitative study of the influence of
polymer interfacial architecture on resistance to protein adsorption by ToF-SIMS
and in situ OWLS. Langmuir, 2003. 19(22): p. 9216-9225.
7. Lee, J.H., Y.M. Ju, and D.M. Kim, Platelet adhesion onto segmented polyurethane
film surfaces modified by addition and crosslinking of PEO-containing block
copolymers. Biomaterials, 2000. 21(7): p. 683-691.
8. Advincula, R.C., Surface initiated polymerization from nanoparticle surfaces. J.
Dispers. Sci. Tech., 2003. 24(3-4): p. 343-361.
9. Rundqvist, J., J.H. Hoh, and D.B. Haviland, Poly(ethylene glycol) self-assembled
monolayer island growth. Langmuir, 2005. 21(7): p. 2981-2987.
10. Ma, H.W., et al., "Non-fouling" oligo(ethylene glycol)-functionalized polymer
brushes synthesized by surface-initiated atom transfer radical polymerization.
Advanced Materials, 2004. 16(4): p. 338-341.

References
114
11. Lazos, D., S. Franzka, and M. Ulbricht, Size-selective protein adsorption to
polystyrene surfaces by self-assembled grafted poly(ethylene glycols) with varied
chain lengths. Langmuir, 2005. 21(19): p. 8774-84.
12. Kwon, O.H., et al., Graft copolymerization of polyethylene glycol methacrylate
onto polyethylene film and its blood compatibility. Journal of Applied Polymer
Science, 1999. 71(4): p. 631-641.
13. Lee, J.H., J. Kopecek, and J.D. Andrade, Protein-Resistant Surfaces Prepared by
Peo-Containing Block Copolymer Surfactants. Journal of Biomedical Materials
Research, 1989. 23(3): p. 351-368.
14. Amiji, M. and K. Park, Prevention of Protein Adsorption and Platelet-Adhesion on
Surfaces by Peo Ppo Peo Triblock Copolymers. Biomaterials, 1992. 13(10): p.
682-692.
15. Green, R.J., et al., A surface plasmon resonance study of albumin adsorption to
PEO-PPO-PEO triblock copolymers. Journal of Biomedical Materials Research,
1998. 42(2): p. 165-171.
16. Huang, N.P., et al., Poly(L-lysine)-g-poly(ethylene glycol) layers on metal oxide
surfaces: Surface-analytical characterization and resistance to serum and
fibrinogen adsorption. Langmuir, 2001. 17(2): p. 489-498.
17. Kenausis, G., et al., Poly(L-lysine)-g-poly(ethylene glycol) layers on metal oxide
surfaces: Attachment mechanism and effects of polymer architecture on resistance
to protein adsorption. J. Phys. Chem. B, 2000. 104(14): p. 3298-3309.
18. Blattler, T.M., et al., High salt stability and protein resistance of poly(L-lysine)-g-
poly(ethylene glycol) copolymers covalently immobilized via aldehyde plasma
polymer interlayers on inorganic and polymeric substrates. Langmuir, 2006.
22(13): p. 5760-5769.
19. Lee, S.W. and P.E. Laibinis, Protein-resistant coatings for glass and metal oxide
surfaces derived from oligo(ethylene glycol)-terminated alkyltrichlorosilanes.
Biomaterials, 1998. 19(18): p. 1669-1675.
20. Senaratne, W., L. Andruzzi, and C.K. Ober, Self-Assembled Monolayers and
Polymer Brushes in Biotechnology: Current Applications and Future
Perspectives. Biomacromolecules, 2005. 6(5): p. 2427-2448.

References
115
21. Ostuni, E., et al., Self-assembled monolayers that resist the adsorption of proteins
and the adhesion of bacterial and mammalian cells. Langmuir, 2001. 17(20): p.
6336-6343.
22. Ulman, A., Formation and structure of self-assembled monolayers. Chemical
Reviews, 1996. 96(4): p. 1533-1554.
23. Castner, D.G. and B.D. Ratner, Biomedical surface science: Foundations to
frontiers. Surface Science, 2002. 500(1-3): p. 28-60.
24. Bruinsma, G.M., H.C. van der Mei, and H.J. Busscher, Bacterial adhesion to
surface hydrophilic and hydrophobic contact lenses. Biomaterials, 2001. 22(24):
p. 3217-3224.
25. Wisniewski, N. and M. Reichert, Methods for reducing biosensor membrane
biofouling. Colloids Surf. B, 2000. 18(3-4): p. 197-219.
26. Hall-Stoodley, L., J. Costerton, and P. Stoodley, Bacterial biofilms: From the
natural environment to infectious diseases. Nat. Rev. Microbiol., 2004. 2(2): p.
95-108.
27. Ruegsegger, M.A. and R.E. Marchant, Student research award in the doctoral
degree candidate category, 27th annual meeting of the Society for Biomaterials,
St. Paul, MN, April 24-29, 2001 - Reduced protein adsorption and platelet
adhesion by controlled variation of oligomaltose surfactant polymer coatings. J.
Biomed. Mater. Res., 2001. 56(2): p. 159-167.
28. Perrino, C., et al., A biomimetic alternative to poly(ethylene glycol) as an
antifouling coating: Resistance to nonspecific protein adsorption of poly(L-
lysine)-graft-dextran. Langmuir, 2008. 24(16): p. 8850-8856.
29. Barber, T.A., et al., Peptide-modified p(AAm-co-EG/AAc) IPNs grafted to bulk
titanium modulate osteoblast behavior in vitro. Journal of Biomedical Materials
Research Part A, 2003. 64A(1): p. 38-47.
30. Rovira-Bru, M., F. Giralt, and Y. Cohen, Protein adsorption onto zirconia
modified with terminally grafted polyvinylpyrrolidone. J. Colloid Interf. Sci.,
2001. 235(1): p. 70-79.
31. Konradi, R., et al., Poly-2-methyl-2-oxazoline: A peptide-like polymer for protein-
repellent surfaces. Langmuir, 2008. 24(3): p. 613-616.

References
116
32. Zhang, Z., et al., Superlow fouling sulfobetaine and carboxybetaine polymers on
glass slides. Langmuir, 2006. 22(24): p. 10072-10077.
33. Statz, A.R., et al., New peptidomimetic polymers for antifouling surfaces. J. Am.
Chem. Soc., 2005. 127(22): p. 7972-7973.
34. Lewis, A.L., L.A. Tolhurst, and P.W. Stratford, Analysis of a phosphorylcholine-
based polymer coating on a coronary stent pre- and post-implantation.
Biomaterials, 2002. 23(7): p. 1697-1706.
35. Holmlin, R., et al., Zwitterionic SAMs that resist nonspecific adsorption of protein
from aqueous buffer. Langmuir, 2001. 17(9): p. 2841-2850.
36. Kingshott, P., H. Thissen, and H.J. Griesser, Effects of cloud-point grafting, chain
length, and density of PEG layers on competitive adsorption of ocular proteins.
Biomaterials, 2002. 23(9): p. 2043-2056.
37. Jeon, S., et al., Protein surface interactions in the presence of polyethylene
oxide.1. Simplified theory. J Colloid. Interf. Sci., 1991. 142(1): p. 149-158.
38. Zalipsky, S. and J.M. Harris, Introduction to chemistry and biological applications
of poly(ethylene glycol). Poly(Ethylene Glycol), 1997. 680: p. 1-13.
39. Zoulalian, V., et al., Functionalization of titanium oxide surfaces by means of
poly(alkyl-phosphonates). J. Phys. Chem. B, 2006. 110(51): p. 25603-25605.
40. Spori, D.M., et al., Influence of alkyl chain length on phosphate self-assembled
monolayers. Langmuir, 2007. 23(15): p. 8053-8060.
41. Piehler, J., et al., A high-density poly(ethylene glycol) polymer brush for
immobilization on glass-type surfaces. Biosensors & Bioelectronics, 2000. 15(9-
10): p. 473-481.
42. Papra, A., N. Gadegaard, and N.B. Larsen, Characterization of ultrathin
poly(ethylene glycol) monolayers on silicon substrates. Langmuir, 2001. 17(5): p.
1457-1460.
43. de Gennes, P.G., Conformations of Polymers Attached to an Interface.
Macromolecules, 1980. 13(5): p. 1069-1075.
44. Sofia, S.J., V. Premnath, and E.W. Merrill, Poly(ethylene oxide) Grafted to Silicon
Surfaces: Grafting Density and Protein Adsorption. Macromolecules, 1998.
31(15): p. 5059-5070.

References
117
45. Kjellander, R. and E. Florin, Water structure and changes in thermal stability of
the system poly(ethylene oxide)–water. J. Chem. Soc., Faraday Trans. 1, 1981. 77:
p. 2053-2077.
46. Florin, E., R. Kjellander, and J.C. Eriksson, Salt Effects on the Cloud Point of the
Poly(Ethylene Oxide) + Water-System. Journal of the Chemical Society-Faraday
Transactions I, 1984. 80: p. 2889-2910.
47. Bailey, F.E. and C.R. W., Some Properties of Poly(ethy1ene oxide)’ in Aqueous
Solution. Journal of Applied Polymer Science, 1959. 1(1): p. 56-62.
48. Dalsin, J.L., et al., Mussel adhesive protein mimetic polymers for the preparation
of nonfouling surfaces. J. Am. Chem. Soc., 2003. 125(14): p. 4253-4258.
49. Unsworth, L.D., et al., In situ neutron reflectometry investigation of gold-
chemisorbed PEO layers of varying chain density: relationship of layer structure
to protein resistance. J Colloid Interface Sci, 2006. 296(2): p. 520-6.
50. Araujo, P.Z., P.J. Morando, and M.A. Blesa, Interaction of catechol and gallic acid
with titanium dioxide in aqueous suspensions. 1. Equilibrium studies. Langmuir,
2005. 21(8): p. 3470-3474.
51. Connor, P.A., K.D. Dobson, and A.J. Mcquillan, New Sol-Gel Attenuated Total-
Reflection Infrared Spectroscopic Method for Analysis of Adsorption at Metal-
Oxide Surfaces in Aqueous-Solutions - Chelation of Tio2, Zro2, and Al2o3
Surfaces by Catechol, 8-Quinolinol, and Acetylacetone. Langmuir, 1995. 11(11):
p. 4193-4195.
52. Ishimitsu, T., S. Hirose, and H. Sakurai, Microscopic acid dissociation-constants
of 3,4-dihydroxyphenylamine (dopamine). Chem. Pharm. Bull., 1978. 26(1): p. 74-
78.
53. Hidber, P., T. Graule, and L. Gauckler, Influence of the dispersant structure on
properties of electrostatically stabilized aqueous alumina suspensions. J. Eur.
Ceram. Soc., 1997. 17(2-3): p. 239-249.
54. Ahnoury, M., et al., Brominated phenylalanines. B. Soc. Chim. Belg. , 1974. 83(3-
4): p. 117-132.
55. Avdeef, A., et al., Coordination Chemistry of Microbial Iron Transport
Compounds .9. Stability-Constants for Catechol Models of Enterobactin. Journal
of the American Chemical Society, 1978. 100(17): p. 5362-5370.

References
118
56. Waite, J.H. and M.L. Tanzer, Polyphenolic substance of Mytilus-edulis - novel
adhesive containing L-DOPA and hydroxyproline. Science, 1981. 212(4498): p.
1038-1040.
57. Waite, J.H., Natures underwater adhesive specialist. Int. J. Adhes. Adhes., 1987.
7(1): p. 9-14.
58. Yu, M.E., J.Y. Hwang, and T.J. Deming, Role of L-3,4-dihydroxyphenylalanine in
mussel adhesive proteins. J. Am. Chem. Soc., 1999. 121(24): p. 5825-5826.
59. Sever, M.J., et al., Metal-mediated cross-linking in the generation of a marine-
mussel adhesive. Angew. Chem. Int. Edit., 2004. 43(4): p. 448-450.
60. Waite, J.H., The Dopa Ephemera - a Recurrent Motif in Invertebrates. Biological
Bulletin, 1992. 183(1): p. 178-184.
61. Waite, J., The phylogeny and chemical diversity ofquinone-tanned gluesand
varnishes. Comp. Biochem. Phys. B, 1990. 97(1): p. 19-29.
62. Yu, M. and T.J. Deming, Synthetic Polypeptide Mimics of Marine Adhesives.
Macromolecules, 1998. 31(15): p. 4739-45.
63. Deming, T.J., Mussel byssus and biomolecular materials. Current Opinion in
Chemical Biology, 1999. 3(1): p. 100-105.
64. Waite, J.H., Adhesion a la Moule. Integrative and Comparative Biology, 2002.
42(6): p. 1172-1180.
65. Raymond, K.N., E.A. Dertz, and S.S. Kim, Enterobactin: An archetype for
microbial iron transport. P. Natl. Acad. Sci. USAA, 2003. 100(7): p. 3584-3588.
66. Drechsel, H. and G. Jung, Peptide siderophores. J. Pept. Sci., 1998. 4(3): p. 147-
181.
67. Kellersc, W., V. Prelog, and H. Zahner, Siderochrome ( Naturliche Eisen(3)-
Trihydroxamat-Komplexe ). Fort. Chem. Org. Nat., 1964. 22: p. 279-322.
68. Morel, F.M.M. and N.M. Price, The biogeochemical cycles of trace metals in the
oceans. Science, 2003. 300(5621): p. 944-947.
69. Holt, P.D., et al., Iron(III) coordination chemistry of alterobactin A: A siderophore
from the marine bacterium Alteromonas luteoviolacea. Inorganic Chemistry,
2005. 44(21): p. 7671-7677.

References
119
70. Miethke, M. and M.A. Marahiel, Siderophore-based iron acquisition and
pathogen control. Microbiology and Molecular Biology Reviews, 2007. 71(3): p.
413-+.
71. Dalsin, J.L., et al., Protein resistance of titanium oxide surfaces modified by
biologically inspired mPEG-DOPA. Langmuir, 2005. 21(2): p. 640-646.
72. Statz, A., A. Barron, and P. Messersmith, Protein, cell and bacterial fouling
resistance of polypeptoid-modified surfaces: effect of side-chain chemistry. Soft.
Matter., 2008. 4(1): p. 131-139.
73. Saxer, S., et al., Macromolecules, 2010. 43(2): p. 1050-1060.
74. Lee, H., et al., Mussel-Inspired Surface Chemistry for Multifunctional Coatings.
Science, 2007. 318(5849): p. 426-430.
75. Rodriguez, R., M. Blesa, and A. Regazzoni, Surface complexation at the TiO2
(anatase) aqueous solution interface: Chemisorption of catechol. J. Colloid Interf
Sci., 1996. 177(1): p. 122-131.
76. Diebold, U., The surface science of titanium dioxide. Surface Science Reports,
2003. 48(5-8): p. 53-229.
77. Rajh, T., et al., Surface restructuring of nanoparticles: An efficient route for
ligand-metal oxide crosstalk. Journal of Physical Chemistry B, 2002. 106(41): p.
10543-10552.
78. Vittadini, A., et al., Structure and energetics of water adsorbed at TiO2 anatase
(101) and (001) surfaces. Physical Review Letters, 1998. 81(14): p. 2954-2957.
79. Persson, P., R. Bergstrom, and S. Lunell, Quantum chemical study of
photoinjection processes in dye-sensitized TiO2 nanoparticles. J Phys Chem B,
2000. 104(44): p. 10348-10351.
80. Redfern, P.C., et al., Computational studies of catechol and water interactions
with titanium oxide nanoparticles. Journal of Physical Chemistry B, 2003.
107(41): p. 11419-11427.
81. Li, S.C., et al., Correlation between Bonding Geometry and Band Gap States at
Organic-Inorganic Interfaces: Catechol on Rutile TiO2(110). J. Am. Chem. Soc.,
2009. 131(3): p. 980-984.
82. Li, S.C., et al., Hydrogen bonding controls the dynamics of catechol adsorbed on a
TiO2(110) surface. Science, 2010. 328(5980): p. 882-4.

References
120
83. Binnig, G., C.F. Quate, and C. Gerber, Atomic force microscope. Phys Rev Lett,
1986. 56(9): p. 930-933.
84. Ashkin, A., Forces of a Single-Beam Gradient Laser Trap on a Dielectric Sphere
in the Ray Optics Regime. Biophysical Journal, 1992. 61(2): p. 569-582.
85. Evans, E., K. Ritchie, and R. Merkel, Sensitive Force Technique to Probe
Molecular Adhesion and Structural Linkages at Biological Interfaces. Biophysical
Journal, 1995. 68(6): p. 2580-2587.
86. Leckband, D. and J. Israelachvili, Intermolecular forces in biology. Q Rev
Biophys, 2001. 34(2): p. 105-267.
87. Bell, G.I., Models for Specific Adhesion of Cells to Cells. Science, 1978.
200(4342): p. 618-627.
88. Hanggi, P., P. Talkner, and M. Borkovec, Reaction-Rate Theory - 50 Years after
Kramers. Reviews of Modern Physics, 1990. 62(2): p. 251-341.
89. Evans, E. and K. Ritchie, Dynamic strength of molecular adhesion bonds.
Biophysical Journal, 1997. 72(4): p. 1541-1555.
90. Hinterdorfer, P., et al., Detection and localization of individual antibody-antigen
recognition events by atomic force microscopy. Proc Natl Acad Sci U S A, 1996.
93(8): p. 3477-81.
91. Hinterdorfer, P. and Y.F. Dufrene, Detection and localization of single molecular
recognition events using atomic force microscopy. Nature Methods, 2006. 3(5): p.
347-355.
92. Gademann, K., et al., Biomimetic total synthesis and antimicrobial evaluation of
anachelin H. J. Org. Chem., 2007. 72(22): p. 8361-8370.
93. Napolitano, A., et al., A new oxidation pathway of the neurotoxin 6-
aminodopamine - isolation and characterization of a dimer with a tetrahydro[3,4a]
iminoethanophenoxazine ring-system. Tetrahedron, 1992. 48(39): p. 8515-8522.
94. Ranganathan, S. and N. Tamilarasu, The transformation of
dihydroxyphenylalanine (DOPA) to metal uptake systems and ionophores. J.
Indian. Chem. Soc., 1999. 76(11-12): p. 727-731.
95. Malisova, B., et al., Poly(ethylene glycol) Adlayers Immobilized to Metal Oxide
Substrates Through Catechol Derivatives: Influence of Assembly Conditions on
Formation and Stability. Langmuir, 2010. 26(6): p. 4018-4026.
References
121
96. Wach, J.Y., et al., Protein-Resistant Surfaces through Mild Dopamine Surface
Functionalization. Chem. Eur. J., 2008. 14(34): p. 10579-10584.
97. Lee, H., N.F. Scherer, and P.B. Messersmith, Single-molecule mechanics of
mussel adhesion. Proc Natl Acad Sci U S A, 2006. 103(35): p. 12999-13003.
98. Gademann, K., Mechanistic studies on the tyrosinase-catalyzed formation of the
anachelin chromophore. Chembiochem, 2005. 6(5): p. 913-919.
99. Zürcher, S., et al., Biomimetic surface modifications based on the cyanobacterial
iron chelator anachelin. J. Am. Chem. Soc., 2006. 128(4): p. 1064-1065.
100. Howarter, J.A. and J.P. Youngblood, Optimization of silica silanization by 3-
aminopropyltriethoxysilane. Langmuir, 2006. 22(26): p. 11142-7.
101. Szili, E.J., et al., Generation of a stable surface concentration of amino groups on
silica coated onto titanium substrates by the plasma enhanced chemical vapour
deposition method. Applied Surface Science, 2009. 255(15): p. 6846-6850.
102. Bhatia, S.K., et al., Use of Thiol-Terminal Silanes and Heterobifunctional
Crosslinkers for Immobilization of Antibodies on Silica Surfaces. Analytical
Biochemistry, 1989. 178(2): p. 408-413.
103. Cunliffe, D., et al., Thermoresponsive surface-grafted poly(N-
isopropylacrylamide) copolymers: Effect of phase transitions on protein and
bacterial attachment. Langmuir, 2003. 19(7): p. 2888-2899.
104. Scofield, J.H., Hartree-Slater subshell photoionization cross-sections at 1254 and
1487eV. J. Electron. Spectrosc., 1976. 8(2): p. 129-137.
105. Ralston, J., et al., Atomic Force Microscopy and Direct Surface Force
Measurements. Pure Appl. Chem., 2005. 77(12): p. 2149-2170.
106. Hutter, J., L., Bechhoefer, J., Calibration of atomic-force microscope tips. Rev.
Sci. Instrum., 1993. 64: p. 1868-1873.
107. Evans, E., Energy landscapes of biomolecular adhesion and receptor anchoring at
interfaces explored with dynamic force spectroscopy. Faraday Discuss, 1998(111):
p. 1-16.
108. Martin, R.B., Zwitterion Formation Upon Deprotonation in L-3,4-
Dihydroxyphenylalanine and Other Phenolic Amines. Journal of Physical
Chemistry, 1971. 75(17): p. 2657-&.
References
122
109. Ishimitsu, T., S. HIROSE, and H. SAKURAI, Microscopic acid dissociation-
constants of 3,4-dihydroxyphenylpropionic acid and related compounds, and 3,4-
dihydroxyphenylalanine (DOPA). Talanta, 1977. 24(9): p. 555-560.
110. Gademann, K. and Y. Bethuel, A biomimetic route to the peptide alkaloid
anachelin. Angew. Chem. Int. Edit., 2004. 43(25): p. 3327-3329.
111. Beiderbeck, H., et al., Bacterial constituents part XCI - Anachelin, the siderophore
of the cyanobacterium Anabaena cylindrica CCAP 1403/2A. Z. Naturforsch. C,
2000. 55(9-10): p. 681-687.
112. Bergman, J., R. Carlsson, and B. Sjoberg, Biaryls from Simple Arenes Via
Organotellurium Intermediates - 4,4'-Dimethoxy-1,1'-Biphenyl. Organic
Syntheses, 1988. 50-9: p. 468-471.
113. Ley, S.V., C.A. Meerholz, and D.H.R. Barton, Diaryl Telluroxides as New Mild
Oxidizing Reagents. Tetrahedron, 1981. 37: p. 213-223.
114. Lee, G., et al., Molecular identity of a pan cancer marker, CA215. Cancer Biology
& Therapy, 2008. 7(12): p. 2007-2014.
115. Xu, C.J., et al., Dopamine as a robust anchor to immobilize functional molecules
on the iron oxide shell of magnetic nanoparticles. J. Am. Chem. Soc., 2004.
126(32): p. 9938-9939.
116. Fan, X.W., et al., Biomimetic anchor for surface-initiated polymerization from
metal substrates. J. Am. Chem. Soc., 2005. 127(45): p. 15843-15847.
117. Niyazkhonov, T., A.Y. Veveris, and L.B. Kuznetsova, Potentiometric Analysis of
Amino-Acid Mixtures with Their N-Tretbutoxycarbonyl Derivatives in the Mixed-
Solvent Media. Khim. Prir. Soedin., 1983(4): p. 496-499.
118. Spenser, I.D. and A.D. NOTATION, A synthesis of mimosine. Can. J. Chem.,
1962. 40(7): p. 1374-1379.
119. Parks, G.A., Isoelectric points of solid hydroxides and aqueous hydroxo complex
systems. Chem. Rev., 1965. 65(2): p. 177-198.
120. Kosmulski, M., The pH-dependent surface charging and the points of zero charge.
J. Colloid Interface Sci., 2002. 253(1): p. 77-87.
121. Vroman, L. and A.L. Adams, Findings with Recording Ellipsometer Suggesting
Rapid Exchange of Specific Plasma Proteins at Liquid/Solid Interfaces. Surf. Sci.,
1969. 16: p. 438-446.

References
123
122. Kummert, R. and W. Stumm, The Surface Complexation of Organic-Acids on
Hydrous Gamma-Al2o3. J. Colloid. Interf. Sci., 1980. 75(2): p. 373-385.
123. Marumo, K. and J.H. Waite, Optimization of Hydroxylation of Tyrosine and
Tyrosine-Containing Peptides by Mushroom Tyrosinase. Biochimica Et
Biophysica Acta, 1986. 872(1-2): p. 98-103.
124. Folkers, J.P., et al., Self-Assembled Monolayers of Long-Chain Hydroxamic
Acids on the Native Oxides of Metals. Langmuir, 1995. 11(3): p. 813-824.
125. Ting, G.G., et al., Study on the Formation of Self-Assembled Monolayers on Sol-
Gel Processed Hafnium Oxide as Dielectric Layers. Langmuir, 2009. 25(4): p.
2140-2147.
126. Kawaguchi, S., et al., Aqueous solution properties of oligo- and poly(ethylene
oxide) by static light scattering and intrinsic viscosity. Polymer, 1997. 38(12): p.
2885-2891.
127. Ludwig, M., et al., AFM, a tool for single-molecule experiments. Applied Physics
a-Materials Science & Processing, 1999. 68(2): p. 173-176.
128. Evans, E., Probing the relation between force - Lifetime - and chemistry in single
molecular bonds. Annual Review of Biophysics and Biomolecular Structure,
2001. 30: p. 105-128.
129. Beyer, M.K. and H. Clausen-Schaumann, Mechanochemistry: The mechanical
activation of covalent bonds. Chemical Reviews, 2005. 105(8): p. 2921-2948.
130. Dammer, U., et al., Specific antigen/antibody interactions measured by force
microscopy. Biophysical Journal, 1996. 70(5): p. 2437-2441.
131. Schmidt, J.J., X.Q. Jiang, and C.D. Montemagno, Force tolerances of hybrid
nanodevices. Nano Letters, 2002. 2(11): p. 1229-1233.
132. Wang, J.J., et al., Influence of Binding-Site Density in Wet Bioadhesion. Advanced
Materials, 2008. 20(20): p. 3872-3876.
133. Studart, A.R., E. Amstad, and L.J. Gauckler, Colloidal stabilization of
nanoparticles in concentrated suspensions. Langmuir, 2007. 23(3): p. 1081-1090.
134. Amstad, E., et al., Surface Functionalization of Single Superparamagnetic Iron
Oxide Nanoparticles for Targeted Magnetic Resonance Imaging. Small, 2009.
5(11): p. 1334-1342.

References
124
135. Amstad, E., et al., Ultra-stable Iron Oxide Nanoparticle Colloidal Suspensions
Using Dispersants with Catechol Derived Anchor Groups. Nano Letters., 2009.
9(12): p. 4042-4048.
136. Saxer, S., et al., Macromolecules, 2010. 43(2): p. 1050-1060.
137. Brough, B., et al., Evaluation of synthetic linear motor-molecule actuation
energetics. Proceedings of the National Academy of Sciences of the United States
of America, 2006. 103(23): p. 8583-8588.

125
Curriculum Vitae
PERSONAL
Name: Barbora Malisova
Date of Birth: April 20, 1979
Nationality: Czech Republic
Present Address: Heinrichstrasse 87
CH-8005 Zürich, Switzerland
EDUCATION AND PRACTICAL EXPERIENCE
2005 – 2010 Doctoral Student at the Laboratory for Surface Science and
Technology, Department of Materials, Swiss Federal Institute of
Technology (ETH) in Zürich, Switzerland
1998 – 2004 Study program Chemistry and Technology of food, focus on
chemistry of natural substances, University of Chemistry and
Technology (VSCHT) in Prague, CZ
2003 Internship at Ian Wark Research Institute (IWRI) in Adelaide,
South Australia (6 month)
2001 – 2002 Exchange year at the Department of Food Industry and
Agriculture, National Institute of Polytechnic (ENSAIA), Nancy,
France
1991 – 1998 Gymnasium in Prague, CZ, focus on natural science
Curriculum Vitae
126
PUBLICATIONS RELATED TO THIS THESIS
Journal articles
2010 Poly(ethylene glycol) Adlayers Immobilized to Metal Oxide Substrates
Through Catechol Derivatives: Influence of Assembly Conditions on
Formation and Stability
B. Malisova, S. Tosatti, M. Textor, K. Gademann and S. Zürcher
Langmuir, 2010, 26(6), p: 4018-4026.
2008 Protein-Resistant Surfaces through Mild Dopamine Surface
Functionalization
J-Y. Wach, B. Malisova, S. Bonazzi, S. Tosatti, M. Textor, S. Zürcher and
K. Gademann
Chem. Eur. J., 2008, 14, p:10579 – 10584.
2006 Biomimetic surface modifications based on the cyanobacterial iron chelator
anachelin
S. Zürcher, D.Wäckerlin, Y. Bethuel, B. Malisova, M. Textor, S. Tosatti and
K. Gademann
J. Am. Chem. Soc., 2006. 128(4), p. 1064-1065.
ORAL AND POSTER PRESENTATIONS
2010 Nanobio Conference, Zürich, Switzerland; Poster presentation
Catechol Derivatives as a Tool for Polymer Immobilization to Metal Oxide
Substrates: Influence of Assembly Conditions on Formation and Stability
B. Malisova, K. Gademann, S. Zürcher, S. Tosatti, M. Textor
2009 Materials Colloquium, ETH Zurich, Switzerland; Oral presentation
Surface Modificationsby the Use of PEG-catechol Derivatives
B. Malisova, K. Gademann, S. Zürcher, S. Tosatti, M. Textor

Curriculum Vitae
127
2007 SAOG-GSSI Meeting, Fribourg, Switzerland; Oral presentation
Biomimetic Surface Modifications Based on the Cyanobacterial Iron Chelator
Anachelin
B. Malisova, M. Textor, S. Tosatti, S. Zürcher, K. Gademann
2007 Biosurf VII, Zürich, Switzerland; Poster presentation
Adsorption of poly(ethylene glycol (PEG) catechol derivatives on metal oxide
surfaces. Influence of pH, pKa and IEP on the adsorption and stability of these
polymer adlayers,
B. Malisova, S. Zürcher, S. Tosatti, K. Gademann, M. Textor
2007 GRC Organic Thin Films, Aussois, France; Poster presentation
Influence of pH and pKa on the adsorption and stability of catechol
basedpoly(ethyleneglycol)(PEG) adlayerson metal oxide surfaces.
B. Malisova, S. Zürcher, S. Tosatti, K. Gademann, M. Textor
2006 1st MRC Graduate Symposium, Zürich, Switzerland, Poster presentation
Surface Modification by the Use of Tailor-Made Biomimetic Amphiphiles
B. Malisova, D. Wäckerlin, Y. Bethuel, K. Gademann, S. Zürcher, S. Tosatti,
M. Textor