Embed Size (px)
Citation preview

Research Collection
Doctoral Thesis
Bacterial chitin and amino-compound degradation in twocontrasting lakes
Author(s): Köllner, Krista Elisabeth
Publication Date: 2012
Permanent Link: https://doi.org/10.3929/ethz-a-007606480
Rights / License: In Copyright - Non-Commercial Use Permitted
This page was generated automatically upon download from the ETH Zurich Research Collection. For moreinformation please consult the Terms of use.
ETH Library

DISS. ETH NO. 20685
BACTERIAL CHITIN AND AMINO-COMPOUND DEGRADATION IN TWO CONTRASTING LAKES
A dissertation submitted to
ETH ZURICH
for the degree of
Doctor of Sciences
presented by
KRISTA ELISABETH KÖLLNER
Dipl.-Ing., Vienna University of Technology, Austria
born January 24th 1980
citizen of Austria
accepted on the recommendation of
Prof. Dr. Josef Zeyer, examiner
Dr. Helmut Bürgmann, co-examiner
Prof. Dr. Hans-Peter Grossart, co-examiner
2012


I
TABLE OF CONTENTS
Summary ......................................................................................................................1
Zusammenfassung .......................................................................................................3
1. Introduction ...................................................................................................5
1.1. Motivation .......................................................................................................5
1.2. Chitin and chitin degradation ..........................................................................7
1.3. Peptidoglycan .................................................................................................9
1.4. Degradation indices ......................................................................................11
1.5. Lake ecosystem .............................................................................................12
1.6. Study sites .....................................................................................................14
1.7. Molecular methods .......................................................................................15
1.8. Objectives and outline of the thesis ..............................................................17
2. Bacterial chitin hydrolysis in two lakes of contrasting trophic statuses21
2.1. Abstract .........................................................................................................22
2.2. Introduction ...................................................................................................22
2.3. Methods ........................................................................................................24
2.3.1. Sampling sites ........................................................................................24
2.3.2. Sampling water and sediments ..............................................................25
2.3.3. Zoo- and phytoplankton communities ....................................................25
2.3.4. Zooplankton chitin .................................................................................26
2.3.5. Chemical analysis ..................................................................................26
2.3.6. Chitinase activity ...................................................................................27
2.3.7. DNA extraction ......................................................................................29
2.3.8. Amplification and quantification of chitinase gene fragments ..............30
2.4. Results ...........................................................................................................31
2.4.1. Biogeochemistry of lake water columns ................................................31
2.4.2. Biogeochemistry of sediment profiles ....................................................33
2.4.3. Zoo- and phytoplankton community composition ..................................34
2.4.4. Zoo and- phytoplankton biomass ...........................................................34

Table of contents
II
2.4.5. Zooplankton chitin .................................................................................35
2.4.6. Zooplankton chitin biomass compared to TOC and GlcN concentrations
............................................................................................................ 35
2.4.7. Zooplankton chemistry...........................................................................36
2.4.8. Chitinase activity ...................................................................................36
2.4.9. Chitinase gene copies ............................................................................38
2.4.10. Correlations between chitinase activity, chiA abundance, and
biogeochemical parameters ...................................................................41
2.5. Discussion .....................................................................................................43
2.5.1. Sources of chitin and glucosamine in freshwater lakes .........................43
2.5.2. Chitinolytic activity and populations in freshwater lakes .....................44
3. Rare bacterial community members dominate the functional trait of
chitin hydrolysis in freshwater lakes .......................................................................47
3.1. Abstract .........................................................................................................48
3.2. Introduction ...................................................................................................48
3.3. Methods ........................................................................................................51
3.3.1. Sampling ................................................................................................51
3.3.2. DNA extraction ......................................................................................52
3.3.3. 454 pyrosequencing ...............................................................................52
3.3.4. Data pre-processing and analysis of 16S rRNA gene sequences ..........54
3.3.5. Data pre-processing and analysis of chiA sequences ............................55
3.4. Results ...........................................................................................................56
3.4.1. Bacterial community structure ..............................................................56
3.4.2. OTU-based diversity analyses of 16S rRNA gene and chitinase
sequences ...............................................................................................58
3.4.3. Similarity of 16S rRNA gene and chitinase OTUs between diverse lake
habitats ..................................................................................................62
3.4.4. Chitinases detected in diverse lake habitats ..........................................63
3.5. Discussion .....................................................................................................67

Table of content
III
4. Impact of amino compounds and organic matter degradation state on
the vertical structure of lacustrine bacteria ...........................................................73
4.1. Abstract .........................................................................................................74
4.2. Introduction ...................................................................................................74
4.3. Methods ........................................................................................................77
4.3.1. Sampling sites ........................................................................................77
4.3.2. Sampling ................................................................................................77
4.3.3. Chemical analysis ..................................................................................77
4.3.4. Amino acid analysis ...............................................................................78
4.3.5. Degradation index .................................................................................78
4.3.6. Amino sugar analysis .............................................................................78
4.3.7. Chlorin Index .........................................................................................78
4.3.8. Bacterial cell counts ..............................................................................79
4.3.9. DNA extraction ......................................................................................79
4.3.10. Amplification of ribosomal intergenic spacer fragments ......................79
4.3.11. Binning ...................................................................................................80
4.3.12. Statistical analysis .................................................................................80
4.4. Results ...........................................................................................................83
4.4.1. Richness and community structure of free-living and particle-associated
bacteria ..................................................................................................83
4.4.2. Amino acids ...........................................................................................85
4.4.3. Amino sugars .........................................................................................86
4.4.4. Chlorin Index .........................................................................................87
4.4.5. Explanatory variables with the strongest influence on between- and
within-lake variability of the bacterial community structure ................88
4.4.6. Bacterial cell abundance .......................................................................92
4.4.7. Multiple regression analysis ..................................................................93
4.5. Discussion .....................................................................................................96
5. Contribution of bacterial cells to lacustrine organic matter based on
amino sugars and D-amino acids ...........................................................................101
5.1. Abstract .......................................................................................................102
Table of contents
IV
5.2. Introduction .................................................................................................102
5.3. Methods ......................................................................................................104
5.3.1. Sampling sites ......................................................................................104
5.3.2. Sampling ..............................................................................................104
5.3.3. Chemical analysis of water samples ....................................................105
5.3.4. Chemical analysis of particulate organic matter ................................106
5.3.5. Bacterial cell counts ............................................................................108
5.4. Results .........................................................................................................108
5.4.1. Physico-chemical characterization of the water columns ...................108
5.4.2. Total amino sugar concentrations .......................................................110
5.4.3. Amino sugars in POM .........................................................................112
5.4.4. D-Amino acids in POM .......................................................................115
5.4.5. Bacterial cell counts ............................................................................116
5.5. Discussion ...................................................................................................117
5.5.1. Origin and transformation processes of amino sugars in the water
column..................................................................................................117
5.5.2. Contribution of bacterial cells to the organic carbon pool in the water
column..................................................................................................119
5.5.3. Effects of trophic status and redox conditions on amino sugar
transformation and bacterial contributions to the organic carbon pool
.......................................................................................................... 122
6. Conclusions and outlook ..........................................................................125
6.1. Sites and significance of chitin hydrolysis .................................................125
6.2. Bacterial chitinases .....................................................................................126
6.3. Organic matter degradation indices and bacterial dynamics ......................128
6.4. Bacterial contribution to organic matter .....................................................129
References ................................................................................................................131
Acknowledgments ...................................................................................................153
1
SUMMARY
One crucial function of aquatic bacteria is the degradation of recalcitrant
organic matter, which is not readily assimilable by aquatic organisms of higher
trophic levels. Via its incorporation as bacterial biomass, carbon and nutrients are
reintroduced into the aquatic food web. For instance, the function of breaking down
the biopolymer chitin in aquatic ecosystems is mainly assigned to bacteria. Chitin is a
homopolymer of the amino sugar N-acetylglucosamine and is synthesized as
structural component by fungi, arthropods, and algae. The total aquatic annual chitin
production is estimated at 1010 to 1012 kg chitin year-1. If this huge amounts of
insoluble carbon and nitrogen were not converted to biologically useful material, the
hydrosphere would get depleted of these elements. Compared to the number of studies
in marine systems, studies on the degradation of freshwater chitin are rare. This thesis
aimed to study the role of lacustrine bacteria in the degradation of particulate amino
compounds focusing on the hydrolysis of chitin. Two temperate lakes distinguishing
themselves by their trophic and redox statuses were selected as study sites: Lake
Brienz is oligotrophic and fully oxic while Lake Zug is eutrophic and partially anoxic.
In chapter 2, the the main sites of chitin hydrolysis were studied by measuring
the turnover rates of the chitin analog methylumbelliferyl-N,N’-diacetylchitobioside
(MUF-DC) and the presence of chitinase genes (chiA) in zooplankton, the water
columns, and the upper seven centimeter of the sediments. The zooplankton and the
sediments were identified as the main sites of chitin hydrolysis. Although no
chitinolytic activity could be measured in the lake water columns, significant chiA
copy numbers were detectable, especially in the oligotrophic water column. These
findings suggest a higher significance of chitin as bacterial growth substrate in the
oligotrophic than in the eutrophic system and that the chitinolytic activity is mainly
associated with particulate fractions providing the free-living bacterial communities
with chitin hydrolysis products.
In order to identify the chitinolytic bacteria in samples for which high chiA
concentrations were detected, high-throughput sequencing of chiA and 16S rRNA
gene fragments was applied (chapter 3). The results revealed distinct diversity and
distribution of bacterial chitinases between lakes and habitats, which suggests that the
chitinolytic bacteria are a functional group that is strongly shaped by the
environmental parameters and ecological conditions of its habitat. The detected

Summary
2
chitinases could be assigned to chitinases of Stenotrophomonas maltophilia,
Janthinobacterium lividum and Actinobacteria. However, the predominant chitinases
of Lake Zug represent a novel bacterial chitinase lineage. Concluding from the
abundance of the potentially chitinolytic bacteria in the total bacterial communities,
i.e., the number 16S rDNA sequences detected, the chitinolytic bacteria appeared as
rare members of the bacterial communities in the diverse lake habitats. Their presence
is proposed to be essential for the functional trait of chitin degradation in freshwater
lakes.
In chapter 4, the influence of degradation state and composition of particulate
organic matter on the structural shifts of the total bacterial communities was studied.
For this purpose, changes in the composition of the free-living and particle-associated
bacteria along the lake water columns were analyzed. Whereas amino compound
based degradation indices performed less well as indicators for bacterioplankton
dynamics, the Chlorin Index, a measure for the degradation state of particulate
organic matter from primary production, was identified as one of the main predictors
of the vertical shifts in the abundance and composition of bacterioplankton.
In chapter 5, the proportion of organic matter originating from bacteria
themselves was estimated using cell counts and the bacterial amino biomarkers
muramic acid and D-amino acids. The results consistently showed a higher proportion
of bacterial derived organic carbon in oligotrophic Lake Brienz compared to eutrophic
Lake Zug. Furthermore, higher turnover rates of particulate amino sugars were
detected in Lake Brienz.
In conclusion, this thesis revealed a higher significance of bacteria for the
degradation and transformation of particulate amino compounds in an oligotrophic
than in a eutrophic lake. In particular, the amino sugar polymer chitin was found as a
relatively more important growth substrate in the oligotrophic system, where other
readily available organic substrates are scarce. Its hydrolysis appeared restricted to a
limited number of bacterial chitinases, which are assumed to be crucial for the
recycling of carbon and nitrogen bound as chitin. Future studies surveying a wide
range of lakes could show if similar chitinolytic bacteria are distributed between
systems of similar trophic state and if the functional trait of chitin hydrolysis is
generally more significant in oligotrophic compared to eutrophic systems.

3
ZUSAMMENFASSUNG
In Gewässerökosystemen spielen Bakterien eine bedeutende Rolle im Abbau
von organischem Material, das für höhere aquatische Organismen nicht assimilierbar
ist. Basierend auf dem Abbau des organischen Materials wird neue bakterielle
Biomasse aufgebaut und Kohlenstoff und Nährstoffe wieder in die aquatische
Nahrungskette eingeführt. Beispielsweise wird die Funktion der Abbaus von Chitin in
Gewässerökosystemen hauptsächlich Bakterien zugeordnet. Chitin ist ein
Homopolymer des Aminozuckers N-Acetylglucosamin und kommt als
Strukturelement in Pilzen, Arthropoden und Algen vor. Die jährliche
Chitinproduktion in aquatischen Systemen wird auf 1010 bis 1012 kg geschätzt.
Würden diese enormen Mengen an unlöslichem Kohlenstoff und Stickstoff nicht zu
biologisch nützlichem Material umgewandelt, würde die Hydrosphäre an diesen
Elementen verarmen. Verglichen mit der Anzahl von Studien in marinen Systemen,
sind Studien über den Chitinabbau in Süßwassersystemen selten. Ziel dieser Arbeit
war es, die Rolle von Bakterien für den Abbau von partikulären Aminoverbindungen
in Seen zu untersuchen, wobei der Fokus auf die Hydrolyse von Chitin gesetzt wurde.
Es wurden zwei Seen mit unterschiedlichen Nährstoffgehalten und Redoxpotentialen
beprobt: Der Brienzersee als oligotropher sauerstoffreicher See und der eutrophe
Zugersee, der anoxisches Tiefenwasser aufweist.
In Kapitel 2 dieser Arbeit wurden die Umsatzrate des Chitin-Analogon
Methylumbelliferyl-N, N'-diacetylchitobioside (MUF-DC) und ein für bakterielle
Chitinase kodierendes Gen (chiA) in Zooplankton, in der Wassersäule und den
Sedimenten gemessen. Obwohl keine MUF-DC Umsatzrate in der Wassersäule beider
Seen gemessen werden konnte, wurden signifikante chiA Kopienzahlen detektiert,
insbesondere in der oligotrophen Wassersäule. Die Ergebnisse lassen auf eine höhere
Bedeutung von Chitin als bakterielles Substrat im nährstoffärmeren See schliessen
und dass die Hydrolyse hauptsächlich an partikulärem Material (Zooplankton,
Sedimente) stattfindet wobei die Produkte des Chitinabbaues auch von den
planktonischen Bakterien genutzt werden können.
Die chitinabbauenden Bakterien wurden mittels Sequenzierung der bakterielle
16S rDNA und des chiA Gens in Proben mit hoher chiA Konzentration identifiziert
(Kapitel 3). Die detektierten bakteriellen Chitinasen zeigten unterschiedliche
Diversität und Verbreitung zwischen den Seen und den See-Habitaten, was auf eine

Introduction
4
stark von den Umweltbedingungen und der Habitatcharakteristik abhängende
Verteilung der chitinabbauenden Bakterien schliessen lässt. Die bakteriellen
Chitinasen konnten bekannten Chitinasen von Stenotrophomonas maltophilia,
Janthinobacterium lividum und Actinobacteria zugeordnet werden. Die im Zugersee
vorherrschenden bakterielle Chitinase wurde als bisher unbekannte Chitinase
identifiziert. Die Abundanz der mittels den chiA Sequenzen identifizierten
potentiellen chitinabbauenden Bakterien in den bakteriellen Gesamtgemeinschaften
(16S rDNA Sequenzen) zeichnete nur einige wenige bakterielle Arten in der
Gesamtgemeinschaft mit der Funktion des Chitinabbaues aus.
In Kapitel 4 wurde die Bedeutung der Qualität (Abbaugrad) von partikulärem
organischen Material in der Wassersäule auf die Veränderung der Zusammensetzung
der planktonischen und partikel-assoziierten bakteriellen Gemeinschaften untersucht.
Die auf den Abbau von Aminoverbindungen basierenden Abbauindizes konnten nicht
als Indikatoren für die vertikale Dynamik der Bakteriengemeinschaften identifiziert
werden. Jedoch der Chlorin Index, ein Mass für den Abbaugrad von während der
Photosynthese aufgebauten organischen Materials, zeigte sich als guter Indikator für
die bakteriellen Dynamiken in beiden Seen.
Basierend auf Bakterien-Zellzahlen und den Amino-Biomarkern
Muraminsäure und D-Aminosäuren wurde der Anteil des organischen Materials
gebunden als bakterielle Biomasse abgeschätzt (Kapitel 5). Der Anteil an
organischem Kohlenstoff aus bakterieller Biomasse war generell höher im
nährstoffarmen Brienzersee. Darüber hinaus zeigte sich ein höherer Umsatz der
partikulären Aminozucker im Brienzersee.
Zusammenfassend zeigt diese Arbeit eine höhere Bedeutung von Bakterien für
den Abbau und die Umwandlung von partikulären Aminoverbindungen im
oligotrophen Seesystem. Insbesondere Chitin konnte als signifikantes Substrat im
Brienzersee, der sich durch eine niedrige Konzentration an leicht verfügbarem
organischen Material ausweist, identifiziert werden. Für die Funktion des
Chitinabbaues und damit des Recyclings von als Chitin gebundenen Kohlenstoff und
Stickstoff scheint eine begrenzte Anzahl von bakteriellen Chitinasen verantwortlich.
Zukünftige Studien an einer Vielzahl von Seen unterschiedlicher Charakteristik
könnten eine Verteilung ähnlicher chitinabbauender Bakteriengemeinschaften
zwischen Systemen ähnlichen Nährstoffgehaltes und eine generell höhere Bedeutung
des bakteriellen Chitinabbaues in oligotrophen Seesystemen zeigen.

5
1. INTRODUCTION
1.1. Motivation
A crucial function of aquatic bacteria and microorganisms in general is the
decomposition of organic matter and the resulting recycling of nutrients and carbon
(Azam et al. 1983, Sherr and Sherr 1991). Approximately 30-60% of the planktonic
primary production is mineralized by heterotrophic bacteria (Biddanda et al. 1994,
Del Giorgio et al. 1997). In aquatic ecosystems, primary producers like algae and
cyanobacteria produce organic compounds by photosynthetic carbon fixation (Fig. 1).
Eukaryotic microorganisms such as flagellates graze on small-sized primary
producers and on heterotrophic bacteria. The flagellates are in turn preyed upon by
microzooplankton such as ciliates. Larger zooplankton feeds on the microzooplankton
and phytoplankton, which transfers the organic matter from primary production up the
food web. After an organism’s death and processes like cell senescence, but also
through bacterial lysis (e.g., after viral infection), exudation of exopolymers from
phytoplankton, and excretion of waste products (e.g., fecal pellets, exuviae), large
amounts of particulate and dissolved organic matter are released into the aquatic
environment. A high fraction (~50%) of the aquatic organic material consists of
polymeric, high molecular weight compounds, which are not readily assimilable by
aquatic organisms of higher trophic levels (Allen 1976, Benner et al. 1992, Tulonen et
al. 1992). Heterotrophic bacteria are able to decompose this recalcitrant organic
matter and reintroduce it into the aquatic food web via its incorporation as bacterial
biomass (microbial loop) (Middelboe et al. 1995). In particular, bacteria are able to
degrade the polymeric, high molecular weight compounds to their monomers, which
can easily be transported across cell membranes. For instance, the function of
breaking down the biopolymer chitin, which is composed of the amino sugar
glucosamine (Fig. 2), is mainly assigned to bacteria (Zobell and Rittenberg 1937,
Cottrell and Kirchman 2000, Beier and Bertilsson 2011). Chitin is synthesized as
structural component by a wide range of aquatic organisms and, therefore, highly
abundant in aquatic ecosystems (Cauchie 2002).

Introduction
6
Bacteria build up new biomass and are, therefore, themselves sources of
complex organic matter. For instance, the structural component of the bacterial cell
wall consists of peptidoglycan, which is unique to bacteria. Peptidoglycan is made up
of a polysaccharide of amino sugars (ASs) cross-linked by short peptides consisting of
alternating D- and L-amino acids (AAs) (Fig. 3). Another large component of
polymeric, high molecular weight organic matter is represented by proteins. Proteins
are the major nitrogenous compounds in all living organisms and built up from L-AAs.
Fig. 1. Fate of organic nitrogen compounds in an aquatic ecosystem focusing on the bacterial degradation of chitin. Bacteria not only degrade organic matter, they build up new biomass and are, therefore, themselves, source of organic matter. AAs, amino acids; ASs, amino sugars; GlcNAc, N-acetylglucosamine; GlcN, glucosamine.
The production, degradation and preservation of amino compounds by aquatic
biota may impact both global carbon and nitrogen cycles. Organic matter which is not
1.2 Chitin and chitin degradation
7
decomposed in the water column is deposited in the sediments and mineralized by the
sedimentary microorganisms or buried. Studies on the role of lakes and reservoirs as
carbon sinks have shown that inland waters store organic carbon more efficiently
compared to marine systems (Mulholland and Elwood 1982, Dean and Gorham 1998).
The high carbon burial efficiency of lake sediments compared to marine sediments
was attributed to the higher input of allochthonous organic matter to lakes and was
shown to be strongly negatively related to the oxygen exposure time (Sobek et al.
2009). As anoxic bottom-water is more prevalent in lakes than in oceans, the organic
carbon preservation is favored in lake sediments (Battin et al. 2009). The high organic
carbon burial efficiency, together with reviews of data for CO2 and CH4 emission
from lakes and reservoirs have led to a revised view of inland waters as active
components of the global carbon cycle rather than passive pipes that transport carbon
to the oceans (Cole et al. 2007, Battin et al. 2009, Tranvik et al. 2009, Bastviken et al.
2011).
The aim of this thesis was to study the role of bacteria in the degradation of
particulate amino compounds in a fully oxic, oligotrophic lake compared to a partially
anoxic, eutrophic lake. The focus was mainly set on the bacterial hydrolysis of chitin.
To estimate the proportion of bacterial derived organic matter in the lakes under study,
bacterial amino biomarkers abundant in the unique bacterial cell wall polymer
peptidoglycan were used. In the following chapters, chitin, the unique bacterial cell
wall polymer peptidoglycan, and various parameters indicating degradation of organic
matter are introduced. The lake ecosystem in general, the study sites and the methods
which were applied to analyze the lacustrine bacterial communities are also described.
1.2. Chitin and chitin degradation
Chitin is a homopolymer of β-1,4-linked N-acetylatedglucosamine (GlcNAc)
residues (Fig. 2), which can be arranged in antiparallel (α), parallel (β), or mixed (γ)
strands. The antiparallel α configuration of the GlcNAc strands is the most tightly
packed and most commonly found structure of chitin in organisms, probably as it is
more difficult to break down (Gooday 1990). Except for the chitin of diatoms, known
as chitan, chitin is always found crosslinked to other structural components (glucans,
proteins) (Smucker 1991). The degree of deacetylation can also vary from 0 to 100%
(chitosan) (Gooday 1990).

Introduction
8
Fig. 2. Chemical structure of chitin.
Chitin synthesis is widely distributed among phyla. It is a structural
component of the cell wall of fungi and the exoskeleton of invertebrates but is also
found in protozoa (Mulisch 1993) and algae (Herth 1978, Kapaun and Reisser 1995).
With the exception of Streptomyces spore walls, chitin was not found in prokaryotes
(Gooday 1990). Chitin is one of the most abundant biopolymers on earth. The annual
production and the steady state amount in the biosphere is on the order of 1012 to 1014
kg (Jeuniaux and Voss-Foucart 1991, Poulicek et al. 1998). On the basis of literature
data on chitin production of arthropods, the total annual chitin production in aquatic
environments was estimated at 2.8 x 10¹⁰ kg chitin year−1 for freshwater ecosystems
and 1.3 x 10¹² kg chitin year−1 for marine ecosystems (Cauchie 2002). But also algae
are supposed to constitute a major source of chitin in an aquatic system during algal
blooms. In the diatom Thalassiosira fluviatilis, e.g., chitan was found to represent 31-
38% of the total cell mass (including the silica) (McLachlan et al. 1965).
Not only phyto- and zooplankton and insect carcasses, but also zooplankton
molting (exuviae) and excretion of fecal pellets (peritrophic membranes) contribute to
the production of huge amounts of chitinous particles in the water column (Turner
2002). These chitinous particles are part of the marine or lake snow which was shown
to represent a hotspot of particulate organic matter solubilization (Simon et al. 1993,
Grossart and Simon 1998a, b).
If this enormous quantity of carbon and nitrogen bound in form of insoluble
chitin was not converted to assimilable material, the hydrosphere would be depleted
of these elements in decades (Keyhani and Roseman 1999). Zobell and Rittenberg

1.3 Peptidoglycan
9
(1937) identified bacteria able to hydrolyze chitin in the sea (Zobell and Rittenberg
1937). Meanwhile, in aquatic ecosystems chitinolytic bacteria were reported among
Firmicutes, α-, β-, γ-Proteobacteria, Bacteroidetes (Flavobacteria, Cytophaga), and
Actinobacteria (Cottrell and Kirchman 2000, Cottrell et al. 2000, Xiao et al. 2005,
Brzezinska and Donderski 2006).
After adhering to the polymeric substrate, chitinolytic bacteria express a
multitude of enzymes and other proteins required for its catabolism (Keyhani and
Roseman 1999). The hydrolysis of the β-(1,4)-glycosidic bonds between the GlcNAc
residues is accomplished by extracellular chitinases (EC 3.2.1.14) (Henrissat 1991).
The end products of chitin degradation in the chitinolytic pathway are monomers and
dimers of GlcNAc, which can be catabolized in the cytoplasm to fructose-6-P, acetate
and NH3 (Bassler et al. 1991, Keyhani and Roseman 1999) (Fig. 1).
Based on amino acid similarities chitinases are classified into family 18 and
family 19 chitinases (Henrissat 1991). Family 19 chitinases were formerly thought to
be constricted to plant origin, but have since also been found in various Streptomyces
species and other bacteria (Watanabe et al. 1999, Kong et al. 2001, Honda et al. 2008).
Family 18 chitinases are classified into groups A, B, and C according to amino acid
sequence similarities within their catalytic domains (Watanabe et al. 1993). The
expression of multiple chitinases from different chitinase genes and the synergistic
properties of multiple chitinases have been described for several bacteria (Saito et al.
1999, Suzuki et al. 2002, Orikoshi et al. 2005). The ability to express multiple
chitinases is specifically relevant given the great structural diversity of chitin. Svitil et
al. (1997) found at least 10 different chitinolytic enzymes excreted by Vibrio harveyi
depending on the source of chitin - squid pen (β-chitin), snow crab (α-chitin),
colloidal, regenerated or glycol chitin (Svitil et al. 1997).
1.3. Peptidoglycan
The unique bacterial cell wall biopolymer peptidoglycan consists of a
repeating disaccharide, β-1,4-bonded GlcNAc and N-acetylmuramic acid, the latter
amino sugar is unique to bacteria (Schleifer and Kandler 1972). In Gram-negative
bacteria peptidoglycan comprises less than 10% of the cell wall, whereas it can
constitute up to 70% of the cell wall of Gram-positive bacteria (Schleifer and Kandler
1972). The polysaccharide chains are cross-linked by small peptides consisting of
Introduction
10
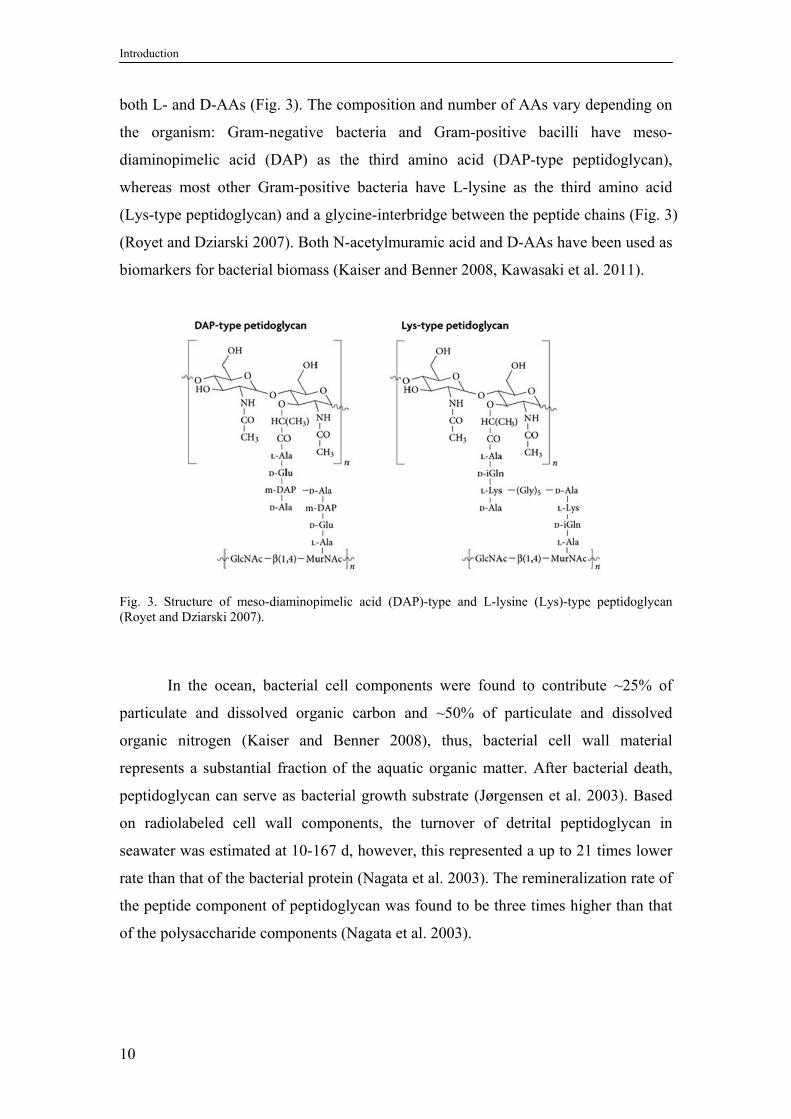
both L- and D-AAs (Fig. 3). The composition and number of AAs vary depending on
the organism: Gram-negative bacteria and Gram-positive bacilli have meso-
diaminopimelic acid (DAP) as the third amino acid (DAP-type peptidoglycan),
whereas most other Gram-positive bacteria have L-lysine as the third amino acid
(Lys-type peptidoglycan) and a glycine-interbridge between the peptide chains (Fig. 3)
(Royet and Dziarski 2007). Both N-acetylmuramic acid and D-AAs have been used as
biomarkers for bacterial biomass (Kaiser and Benner 2008, Kawasaki et al. 2011).
Fig. 3. Structure of meso-diaminopimelic acid (DAP)-type and L-lysine (Lys)-type peptidoglycan (Royet and Dziarski 2007).
In the ocean, bacterial cell components were found to contribute ~25% of
particulate and dissolved organic carbon and ~50% of particulate and dissolved
organic nitrogen (Kaiser and Benner 2008), thus, bacterial cell wall material
represents a substantial fraction of the aquatic organic matter. After bacterial death,
peptidoglycan can serve as bacterial growth substrate (Jørgensen et al. 2003). Based
on radiolabeled cell wall components, the turnover of detrital peptidoglycan in
seawater was estimated at 10-167 d, however, this represented a up to 21 times lower
rate than that of the bacterial protein (Nagata et al. 2003). The remineralization rate of
the peptide component of peptidoglycan was found to be three times higher than that
of the polysaccharide components (Nagata et al. 2003).

1.4 Degradation indices
11
1.4. Degradation indices
As some amino compounds are preferentially degraded, particular amino
compounds become enriched compared to others during organic matter degradation.
Therefore, the relative abundance of specific AAs and ASs and ratios thereof can be
used to determine the diagenetic state of particulate organic matter (Lee and Cronin
1984, Haake et al. 1992, Haake et al. 1993, Dauwe and Middelburg 1998). For
instance, in marine organic matter enriched in chitin, ratios between the ASs
glucosamine (GlcN) and galactosamine (GalN) of > 8 and decreasing GlcN:GalN
ratios during biodegradation were detected (Müller et al. 1986, Liebezeit 1993,
Benner and Kaiser 2003). The ASs GlcN and GalN are more resistant to
decomposition than AAs (Dauwe and Middelburg 1998) and particulate organic
matter was found enriched in AAs relative to ASs during decomposition in marine
water columns (Ittekkot et al. 1984, Müller et al. 1986, Haake et al. 1992). Among
AAs, particular AAs are preferentially degraded. For instance, in marine particulate
matter, the AAs glycine, serine, and threonine were found enriched in degraded
material relative to apparently more labile AAs, such as the AAs tyrosine,
phenylalanine, and glutamic acid (Lee and Cronin 1984, Dauwe and Middelburg 1998,
Dauwe et al. 1999).
Based on observed systematic changes in the mole percent contribution of
AAs with progressive degradation of marine particulate matter, the degradation index
DI was developed (Dauwe and Middelburg 1998, Dauwe et al. 1999). The DI is
calculated based on the first axis of a principle component analysis of mole
percentages of the detected particulate protein AAs. For marine particulate matter
highest DI values (+1) were found for fresh, unaltered organic matter (plankton
samples) and decreasing DI values (towards negative values) for altered and
refractory material (Dauwe et al. 1999). More recent studies indicate that the DI is
most applicable to record later stages of organic matter decay in sediments (Meckler
et al. 2004, Unger et al. 2005).
A different measure for the degradation state of organic matter from primary
production is the Chlorin Index (CI) introduced by Schubert et al. (2005). It is based
on fluorescence measures of chlorophyll pigments in a sample. The CI is defined as
the fluorescence intensity of chemically modified chlorophyll (acidified with 25%
hydrochloric acid) divided by the fluorescence intensity of the non-acidified original
Introduction
12
chlorophyll extract. The CI of fresh chlorophyll a is 0.2 and increases up to unity for
highly degraded organic matter from primary production. The CI has been proven to
be a powerful tool to characterize the initial stages of organic matter decay in lakes
(Meckler et al. 2004, Bechtel and Schubert 2009).
1.5. Lake ecosystem
Lakes are inland water bodies and are extremely diverse in size and character.
The deepest lake is Lake Baikal with a maximum depth of 1’637 m. On earth, there
are estimated 304 million natural lakes (including natural ponds ≥ 0.001 km2), the
majority of which are small water bodies – only 17’357 lakes have a surface area of at
least 10 km2 (Downing et al. 2006). Lakes and ponds together constitute about 2.8%
of the non-oceanic land area (Downing et al. 2006). In contrast, marine systems cover
about 71% of the earth’s surface and contain about 97% of the earth’s water (Hughes
1999). The oceans generate 32% of the earth’s net primary production. In comparison,
freshwater systems generate about 3% of the earth’s net primary production and
represent only 0.009% of the earth’s total water (Hughes 1999). The net primary
production is the gross primary production (photosynthetic assimilation of
atmospheric CO2) minus respiratory losses.
A significant feature of lakes is the vertical stratification of physicochemical
conditions, at least during a certain period of the year. Most temperate lakes are
thermally stratified during the summer months (Fig. 4). The warmer, low density
surface waters, the epilimnion, overlie the cooler, denser waters of the hypolimnion
below. The epilimnion and the hypolimnion are separated by a thermocline, which
constitutes a steep temperature gradient that exists in the middle zone of the lake, the
metalimnion. Waters within the epilimnion are turbulently mixed by wind action. The
upper water layers of the water column receive the most sunlight and, therefore, the
phytoplankton is concentrated in the surface waters. The photosynthetic activities of
the phytoplankton together with O2 diffusion from the atmosphere cause the surface
water layers to be well oxygenated. In contrast, the hypolimnion develops stagnant
conditions and becomes depleted in oxygen due to microbial decomposition of
organic material sedimenting from the surface layers. In productive, e.g., eutrophic,
lakes the hypolimnion may become anoxic during the later stages of stratification
(summer) because of the high rate of microbial respiration (Sigg et al. 1991). Many

1.5 Lake ecosystem
13
highly productive deep lakes are permanently stratified, known as meromictic lakes.
But meromixis also occurs due to water density differences caused by a steep gradient
in salt concentrations (chemocline). For instance, the monimolimnion, i.e., the dense
bottom stratum that does not intermix with the water above, of the alpine Lake
Cadagno constantly receives salt-rich water from subaquatic springs, whereas the
water layers above are fed by electrolyte-poor surface water (Del Don et al. 2001).
The stratification of temperate lakes typically breaks down in the fall as surface
temperatures cool and the lake circulates from top to bottom, which may result in a re-
oxygenation of the former hypolimnion and the oxidation of reduced compounds. In
winter, inverse stratification may occur, with colder water or ice overlying warmer
and denser waters below. The next lake turnover occurs in spring, when the lake’s
surface is warmed up, breaking up temperature differences again and the lake water
column mixes from top to bottom.
Fig. 4. Seasonal stratification in temperate lakes.
Compared to oceans, many lakes, especially small lakes, receive high loadings
of organic matter from the surrounding landscape (allochthonous organic matter)
(Wetzel 1995). Thus, system respiration exceeds gross primary production in many
lakes (Cole et al. 2000) and allochthonous carbon was found to significantly
contribute to lacustrine food webs. 13C dynamics of two American lakes indicated 40-
55% of particulate organic carbon and 22-50% of zooplankton carbon derived from
terrestrial sources (Pace et al. 2004). Allochthonous material often has a higher degree
of recalcitrance compared to the endogenously produced (autochthonous) organic
matter (Hanson et al. 2011). The high input of allochthonous organic matter was also
found one significant reason for the higher organic carbon burial efficiency in lake
sediments compared to marine sediments (Sobek et al. 2009). The high organic
carbon burial efficiency observed in lakes has contributed to a revised view of inland
waters as active components of the global carbon cycle (Cole et al. 2007).
Introduction
14
The distinct characteristics of marine and freshwater systems may explain the
evolution of bacterial clades restricted to either freshwater or marine habitats (Methe
et al. 1998, Glöckner et al. 2000, Zwart et al. 2002). A fundamental difference in the
microbiology is the prominence of β-Proteobacteria in freshwater versus their near
absence from the oceans. Zwart et al. (2002) suggested salinity, which would require
multiple adaptions to maintain effective osmotic regulation and protein conformation,
as the main determinant for this finding (Zwart et al. 2002). This is supported by a
recent study which identified salinity as the major driver not only for the distribution
of bacterial communities but also of bacterial chitinase proteins (Beier et al. 2011).
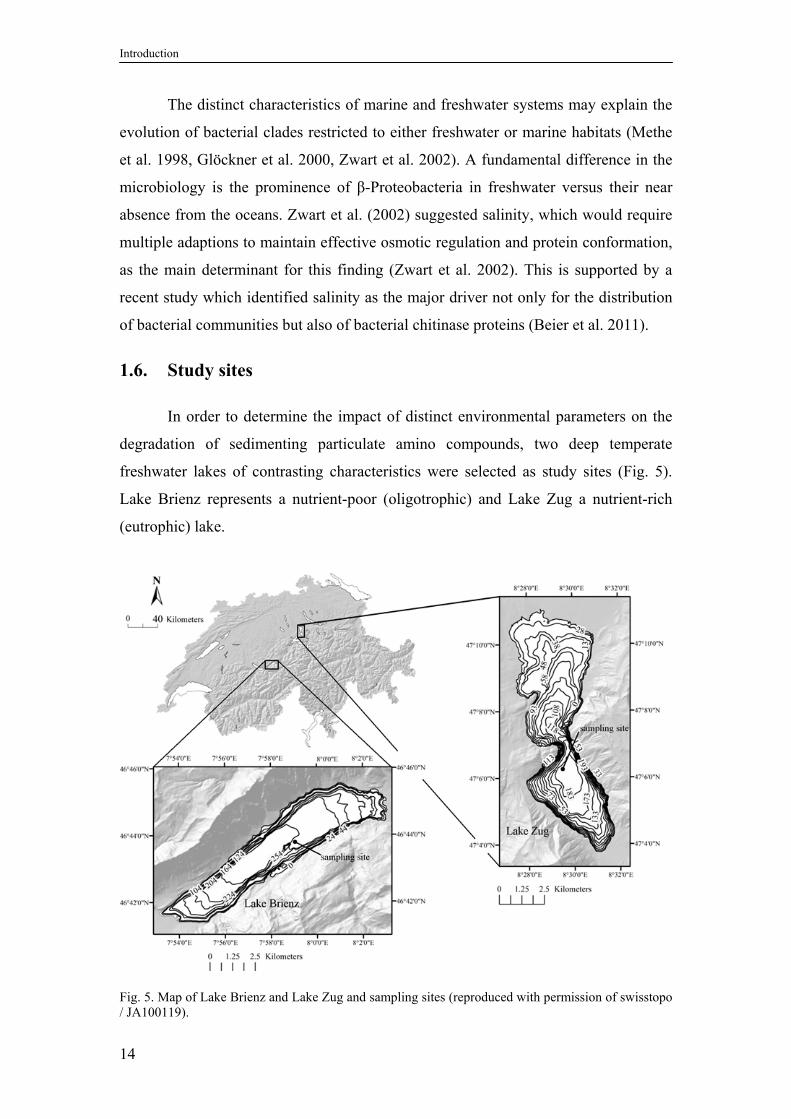
1.6. Study sites
In order to determine the impact of distinct environmental parameters on the
degradation of sedimenting particulate amino compounds, two deep temperate
freshwater lakes of contrasting characteristics were selected as study sites (Fig. 5).
Lake Brienz represents a nutrient-poor (oligotrophic) and Lake Zug a nutrient-rich
(eutrophic) lake.
Fig. 5. Map of Lake Brienz and Lake Zug and sampling sites (reproduced with permission of swisstopo / JA100119).

1.7 Molecular methods
15
Besides the distinct trophic statuses, Lake Brienz has a fully oxic water column,
whereas the sampled Southern Basin of Lake Zug is permanently stratified
(meromictic) with a deep anoxic water body. Lake Zug lacks of large in- and outflows
which results in a long mean water residence time of approximately 14 years (Moor et
al. 1996). In contrast, Lake Brienz is drained by the major rivers Aare and Lütschine,
which enter the lake at opposite ends. However, recent studies on the lipid biomarker
composition of the particulate organic matter in the water column and of the organic
matter in the sediments revealed that the organic matter in Lake Brienz mostly derives
from autochthonous sources like algae, zooplankton and bacteria (Bechtel and
Schubert, 2009 a, b). Overall these two lakes represent end members in the trophic
state of deep lakes in Switzerland. Choosing these lakes should allow to also
determine the range of the processes studied in detail in this thesis.
In this thesis, microbial and biogeochemical data were linked to elucidate if
the distinct trophic and redox statuses of the lakes result in distinct dynamics of
bacterial organic matter transformation. The bacteria involved in the degradation and
transformation of particulate amino compounds, in particular the amino sugar polymer
chitin, were analyzed using molecular methods.
1.7. Molecular methods
Comparing the number of microbial cells cultivated on growth medium plates
with total direct microscopic counts revealed high discrepancies, known as the “great
plate count anomaly”, and indicated that only less than 1% of the bacteria in nature
can be cultivated (Staley and Konopka 1985, Amann et al. 1995). The advent of
molecular biology which targets the ubiquitous cell macromolecules, RNA or DNA,
was a great step to gain a more complete picture of the microbial diversity in an
environment. Molecular microbial biologists frequently use the ribosomal 16S rRNA
molecule as a general microbial marker, as it is present in high copy numbers in all
prokaryotes, contains conserved and variable regions and large 16S rRNA sequence
databases are available for comparison and phylogenetic analysis (Hugenholtz 2002).
Analysis of functional genes has elucidated the ecological role of the observed
organisms in an ecosystem (Costello and Lidstrom 1999, Minz et al. 1999, Cébron et
al. 2004).

Introduction
16
In this thesis, the molecular fingerprinting technique Automated Ribosomal
Intergenic Spacer Analysis (ARISA) was applied to follow the dynamics of the
bacterial community structure along the lake water columns. The internal transcribed
spacer (ITS) regions between the 16S and 23S ribosomal genes have a higher
heterogeneity in both length and nucleotide sequence compared to the flanking genes
and are, therefore, suitable for high resolution profiling of microbial communities
(Nocker et al. 2007). ARISA detects the species-specific length variation of amplified
ITS fragments by using an automated sequencing system.
In order to quantify the genetic potential of the bacterial communities to
degrade chitin, quantitative real-time PCR (qPCR) was applied. In contrast to
conventional PCR, real-time PCR allows for the detection of the accumulation of
amplified DNA product as the PCR reaction progresses, in “real time” (Higuchi et al.
1992, Higuchi et al. 1993). For this purpose, DNA-binding dyes and fluorescently
labeled sequence-specific primers or probes are used. Real-time PCR is performed
with thermal cyclers which are equipped with fluorescence detection modules. The
fluorescence, which is detected after each temperature cycle, is proportional to the
amount of amplified product. The cycle number at which enough amplified product
accumulates to yield a detectable fluorescent signal is known as threshold cycle, or CT.
The reaction has a low, or early, CT if a large amount of template, and on the other
hand a high, or late, CT if a small amount of template is present at the start of the
reaction. Thus, the CT value can be used to calculate the initial amount of DNA
template present in a sample.
In order to analyze the diversity and richness of both the total and the
potentially chitinolytic bacterial communities in the diverse lake habitats under study,
barcoded 454 pyrosequencing of 16S rRNA and chitinase gene fragments were
applied, respectively. 454 pyrosequencing is a high-throughput sequencing technique,
which provides unprecedented sampling depth and has successfully been applied for
high resolution of species diversity but also for the analysis of specific protein
encoding genes (Sogin et al. 2006, Lüke and Frenzel 2011, Beier et al. 2012). During
454 pyrosequencing DNA fragments are bound to beads and are amplified by
emulsion PCR resulting in millions of DNA copies per bead (Margulies et al. 2005).
The beads are separated in wells of a fibre-optic slide and the DNA is sequenced by
pyrophosphate sequencing (Ronaghi et al. 1998). Attached sample-specific barcoding

1.8 Objectives and outline of the thesis
17
adapters allow for tracing the source of the DNA sequences in pooled PCR products
(Meyer et al. 2008).
1.8. Objectives and outline of the thesis
This thesis was part of the interdisciplinary project “Degradation and
transformation of lacustrine organic nitrogen compounds: microbiology and
biogeochemistry” (SNF grants K-23K1-118111 and 200020_134798). The general
objective of the project was to better understand the formation and degradation of
organic nitrogen compounds in lakes and the involvement of bacteria in these
transformation processes.
The focus of the biogeochemical part of the project was to study the fate of the
amino compounds ASs and AAs and the proportion of bacterial biomass on the
lacustrine organic matter using amino biomarkers (D-AAs and muramic acid) and
bacterial cell counts. The microbial part of this thesis focused on the bacterial
degradation of the amino sugar polymer chitin. The sites and significance of chitin
hydrolysis were investigated in the two contrasting deep freshwater lakes, Lake
Brienz and Lake Zug, which were sampled at two different seasons, spring and fall.
Chitin production in the lakes was estimated from the biomasses of crustaceans and
diatoms, which were assumed to be the main sources of lacustrine chitin. The identity
of the potential chitinolytic bacterial consortia were determined on the sites of chitin
synthesis (zooplankton), in the lake water and the sediments, where chitin is deposited.
In order to investigate if the degradation of amino compounds and organic matter
from primary production along the lake water columns is accompanied by bacterial
community composition dynamics, the vertical shifts of the total bacterial
communities were studied and related to various degradation parameters.
The thesis is structured into four main chapters which elucidate the
significance of lacustrine bacteria as decomposer of complex organic matter focusing
on the amino sugar polymer chitin.

Introduction
18
Chapter 2: Bacterial chitin hydrolysis in two lakes with contrasting trophic
statuses
In order to investigate the main sites of lacustrine chitin hydrolysis, the
turnover rate of the chitin analog methylumbelliferyl-N,N’-diacetylchitobioside
(MUF-DC) and the presence of chitinase genes (chiA) in zooplankton, water collected
along the entire water columns, and the sediments of Lake Brienz and Lake Zug were
measured. The results were linked to concentrations of chitin’s monomer GlcN
detected in the diverse samples and lake habitats and to concentrations of organic
carbon and nitrogen to estimate the significance of chitin as carbon and nitrogen
source. Chitin production in the lakes was estimated from zooplankton (crustaceans)
and diatom biomasses.
Chapter 3: Rare bacterial community members dominate the functional trait of
chitin hydrolysis in freshwater lakes
In order to identify the chitinolytic bacterial consortia on the sites of chitin
synthesis (zooplankton), in the water and its sink, i.e., the sediments, 454
pyrosequencing of 16S rRNA and chiA genes was applied on selected samples for
which high chiA gene abundance was detected.
Chapter 4: Impact of amino compounds and organic matter degradation state on
the vertical structure of lacustrine bacteria
The vertical shifts in the composition of the free-living and particle-associated
bacterial communities were analyzed in the water columns of Lake Brienz and Lake
Zug via the DNA fingerprinting method automated ribosomal intergenic spacer
analysis (ARISA). The observed patterns were linked to physico-chemical parameters
and to various parameters indicating particulate organic matter degradation state and
composition. The statistical method of ordination analysis in combination with
forward selection was used to extract the environmental variables with the strongest
influence on the vertical bacterial community composition dynamics.

1.8 Objectives and outline of the thesis
19
Chapter 5: Contribution of bacterial cells to lacustrine organic matter based on
amino sugars and D-amino acids
In order to study the fate of particulate ASs, the concentrations of particulate
GlcN, GalN, muramic acid, and mannosamine were measured along the water
columns of Lake Brienz and Lake Zug. The contribution of bacterial cells to the
organic carbon in the lakes were estimated using the amino biomarkers muramic acid
and D-AAs. The results were compared to estimates using bacterial cell counts.


2. BACTERIAL CHITIN HYDROLYSIS IN TWO
LAKES OF CONTRASTING TROPHIC STATUSES
Krista E. Köllner, Dörte Carstens, Esther Keller, Francisco Vazquez, Carsten J.
Schubert, Josef Zeyer and Helmut Bürgmann
accepted Applied Environmental Microbiology
doi: 10.1128/AEM.06330-11
Contributions of the authors:
The paper was written by Krista Köllner and corrected by Helmut Bürgmann. The
sampling was done by Dörte Carstens and Krista Köllner. Krista Köllner conducted
the chitinase activity measurements, the quantitative chitinase gene detection (qPCR),
analysis and interpretation of the data. Dörte Carstens did the biogeochemical analysis.
Esther Keller analyzed the zooplankton and phytoplankton communities of Lake Zug.
Francisco Vazquez provided technical support for all the analyses and samplings.
Carsten Schubert significantly contributed to the conception of the study and data
interpretation. Josef Zeyer added significant contribution to the interpretation of the
data. Helmut Bürgmann significantly contributed to the conception, the design, and
the interpretation of the presented study.

Bacterial chitin hydrolysis in two lakes of contrasting trophic statuses
22
2.1. Abstract
Chitin, which is a biopolymer of the amino sugar glucosamine (GlcN), is
highly abundant in aquatic ecosystems and its degradation is assigned a key role in the
recycling of carbon and nitrogen. In order to study the significance of chitin
decomposition in two temperate freshwater lakes of contrasting trophic and redox
conditions, we measured the turnover rate of the chitin analog methylumbelliferyl-
N,N’-diacetylchitobioside (MUF-DC) and the presence of chitinase genes (chiA) in
zooplankton, water, and sediment samples. In contrast to the eutrophic and partially
anoxic lake, chiA gene fragments were detectable throughout the oligotrophic water
column and chiA copy numbers per ml of water were up to 15 times more abundant
than in the eutrophic waters. For both lakes highest chiA abundance was found in the
euphotic zone - the main habitat of zooplankton, but also the site of production of
easily degradable algal chitin. The bulk of chitinase activity was measured in
zooplankton samples and the sediments, where recalcitrant chitin is deposited. Both,
chiA abundance and chitinase activity correlated well with organic carbon, nitrogen,
and concentrations of particulate GlcN. Our findings show that chitin, although its
overall contribution to total organic carbon was small (~0.01-0.1%), constituted an
important microbial growth substrate in these temperate freshwater lakes, particularly
where other easily degradable carbon sources were scarce.
2.2. Introduction
Chitin is a homopolymer of β-1,4-linked N-acetylated glucosamine (GlcNAc).
It is a structural component of the cell wall of fungi and the exoskeleton of
invertebrates but is also found in protozoa (Mulisch 1993) and algae (Herth 1978,
Kapaun and Reisser 1995). Due to its wide distribution chitin is, after cellulose, the
second most abundant biopolymer on earth (Kirchner 1995). The annual production
and the steady state amount in the biosphere is on the order of 1012 to 1014 kg
(Jeuniaux and Voss-Foucart 1991, Poulicek et al. 1998). On the basis of literature data
on chitin production of arthropods, the total annual chitin production in aquatic
environments was estimated to 2.8 x 10¹⁰ kg chitin year−1 for freshwater ecosystems
and to 1.3 x 10¹² kg chitin year−1 for marine ecosystems (Cauchie 2002). The role of
chitin as a significant component of the aquatic carbon and nitrogen budget was

2.2 Introduction
23
studied extensively during the 1990s, but almost exclusively in estuarine and marine
environments (Gooday 1990, Poulicek and Jeuniaux 1991, Boyer 1994, Keyhani and
Roseman 1999, Kirchman and White 1999). Studies on the bacterial chitin
degradation in lake water are rare (Miyamoto et al. 1991, Donderski and Brzezinska
2003, LeCleir and Hollibaugh 2006, Beier 2010).
Not only phyto- and zooplankton and insect carcasses, but also zooplankton
molting (exuviae) and excretion of fecal pellets (peritrophic membranes) contribute to
the production of huge amounts of chitinous particles in the water column (Weiss et al.
1996). These chitinous particles are part of the marine or lake snow which was shown
to represent a hotspot of particulate organic matter solubilization (Simon et al. 1993,
Grossart and Simon 1998a, b). In the ocean, chitinolytic bacteria were found to be
responsible for the hydrolysis of chitin (Zobell and Rittenberg 1937, Kirchner 1995).
After adhering to the polymeric substrate, chitinolytic bacteria express a multitude of
enzymes and other proteins required for its catabolism (Keyhani and Roseman 1999).
The hydrolysis of the β-(1,4)-glycosidic bonds between the GlcNAc residues is
accomplished by extracellular chitinases (EC 3.2.1.14) (Henrissat 1991). The end
products of chitin degradation in the chitinolytic pathway are monomers and dimers
of GlcNAc, which can be catabolized in the cytoplasm to fructose-6-P, acetate and
NH3 (Bassler et al. 1991, Keyhani and Roseman 1999).
Based on amino acid similarities chitinases are classified into family 18 and
family 19 chitinases (Henrissat 1991). Family 19 chitinases were formerly thought to
be constricted to plant origin, but have since also been found in various Streptomyces
species and other bacteria (Reynolds 1984, Tang et al. 2006, Beier 2010). However,
most information on bacterial diversity and distribution in diverse environments is
available for family 18 group A chitinases (Svitil et al. 1997, Cottrell et al. 2000,
LeCleir et al. 2004, Hobel et al. 2005, Hjort et al. 2010, Lindsay et al. 2010).
In the present study we aimed to identify the main sites of chitin hydrolysis
and the significance of chitin as a bacterial substrate in two temperate freshwater lakes
with contrasting trophic and redox conditions. For this purpose, we analyzed the
chitinase activity and the abundance of bacterial chitinase genes (chiA) in zooplankton,
water from ten different depths, and sediment samples of oligotrophic Lake Brienz
(LB) and eutrophic Lake Zug (LZ). The lakes were sampled in spring and fall 2009.

Bacterial chitin hydrolysis in two lakes of contrasting trophic statuses
24
2.3. Methods
2.3.1. Sampling sites
The characteristics of the study sites are listed in Table 1. LB is an
oligotrophic peri-alpine lake located 70 km southeast of Bern, Switzerland. The lake
is fully oxic throughout the year. The catchment of the lake is drained by the two main
inflows Aare and Lütschine, which together transport an annual average of 3 x 10⁸ kg
suspended material into LB (Finger et al. 2006). Both, the hydrological regime and
the suspended particle load of the river Aare, are influenced by hydropower
operations. The continuous supply of suspended glacial particles, causing reduced
light penetration, together with the scarcity in nutrients have led to an unusually low
phytoplankton biomass (on average < 10 g m-2) (Finger et al. 2007, Guthruf et al.
2009).
LZ is a eutrophic sub-alpine lake 30 km South of Zurich, Switzerland. The
lake consists of two basins: A shallow (40-60 m depth) North Basin and a 200 m deep
South Basin. The South Basin is meromicitc with mixing depths that do not exceed
100 m. Together with the eutrophic status of LZ, this leads to seasonally anoxic
conditions in a depth of 140-160 m and permanent anoxia below (Moor et al. 1996,
Meckler et al. 2004).
Table 1. Characteristics of study sites
Property Lake Brienz
Lake Zug
South Basin Reference(s)
Position 46°43' N, 7°58' E 47°7' N, 8°29' E
Elevation (m) 564 414
Surface area (km2) 29.8 16 (Moor et al. 1996, Guthruf et al. 2009)
Maximum depth (m) 259 200 (Moor et al. 1996, Guthruf et al. 2009)
Volume (km3) 5.15 2.0 (Moor et al. 1996, Guthruf et al. 2009)
Primary inflow Aare, Lütschine Rigiaa
Primary outflow Aare -
Mean hydraulic
residence time (yr)
2.7 14 (Moor et al. 1996, Guthruf et al. 2009)
Trophic status Oligotrophic Eutrophic
Oxygen status Oxic Anoxic below
140 - 160 m
(Moor et al. 1996)

2.3 Methods
25
2.3.2. Sampling water and sediments
LB was sampled mid of May and mid of September 2009 in the central part of
its basin at position 46°43'18''N/7°58'27''E. LZ was sampled end of March and end of
October 2009 in the South Basin at position 47°6'1''N/8°29'4''E.
Profiles of temperature, oxygen (O2), and conductivity were taken with a
CTD-profiler (Seabird SBE19, Sea-Bird Electronics, Inc., Bellevue, WA). Based on
the temperature and O2 profiles determined (Fig. 6), water was sampled from ten
depths using a Niskin water sampler, filled into autoclaved 1 liter glass bottles and
transported cool and dark to the laboratory. We sampled LB at 5, 10, 20, 30, 40, 70,
100, 150, 200 m, and 240 m water depth, and LZ at 5, 10, 15, 25, 60, 80, 100, 130,
170, and 190 m water depth.
Particulate organic matter (POM) from the same depths was sampled on 0.7
μm glass fiber filters (Whatman Inc., Florham Park, NJ) with in situ pumps (McLane
Research Laboratories Inc., Falmouth, MA) until filters were clogged.
Sediment cores were recovered from the two sampling sites using a gravity
corer (Kelts et al. 1986). The first five (spring) to seven (fall) centimeters of each core
were sliced at intervals of one centimeter. Subsamples of each layer were processed
for microbiological and biogeochemical analysis (see below).
2.3.3. Zoo- and phytoplankton communities
Zooplankton samples were taken with a 95 µm double closing net (Bürgi and
Züllig 1983) from 0-100 m (2 replicates) and preserved in 2% formaldehyde.
Phytoplankton was sampled with an integrated sampler according to Schroeder
(Schröder 1969) from 0-20 m (2 replicates). Lugol-fixed phytoplankton species were
counted quantitatively using the technique of Utermöhl on an inverted microscope
(Utermöhl 1958). Crustacean species and their development stages were enumerated
under a binocular dissecting microscope at 10x–75x. Phyto- and zooplankton biomass
fresh weights were calculated from mean cell/organism dimensions of each species
(Bürgi et al. 1985, Guthruf et al. 2009). For LB these analyses were carried out at the
Laboratory for Water and Soil Protection of Canton of Bern.

Bacterial chitin hydrolysis in two lakes of contrasting trophic statuses
26
120 130 140 150 160 170
0
20
40
60
80
100
120
140
160
180
200
220
240
260
4 6 8 10 12 14
Specific conductivity (µS cm-1)
Dep
th (
m)
LB May 09Temperature (°C), oxygen (mg liter-1)
Temperature
Oxygen
Specificconductivity
120 130 140 150 160
0
20
40
60
80
100
120
140
160
180
200
220
240
260
2 7 12 17
Specific conductivity (µS cm-1)
Dep
th (
m)
LB Sep 09Temperature (°C), oxygen (mg liter-1)
210 220 230 240 250 260 270
0
20
40
60
80
100
120
140
160
180
200
0 2 4 6 8 10 12 14
Specific conductivity (µS cm-1)
De
pth
(m
)
LZ Oct 09Temperature (°C), oxygen (mg liter-1)
210 220 230 240 250 260
0
20
40
60
80
100
120
140
160
180
200
0 2 4 6 8 10
Specific conductivity (µS cm-1)
Dep
th (
m)
LZ Mar 09Temperature (°C), oxygen (mg liter-1)
C
A B
D
Fig. 6. Profiles of temperature, oxygen, and conductivity of the water columns of Lake Brienz (LB) sampled in May (A) and September 2009 (B) and of Lake Zug (LZ) sampled in March (C) and October 2009 (D). Dots along the oxygen profile depict sampled water depths.
2.3.4. Zooplankton chitin
The chitin biomass in LB and LZ was calculated from zooplankton biomass
and body chitin content published by Cauchie (Cauchie 2002), which were 4.3% and
9.8% of dry weight for lentic branchiopoda and copepoda, respectively.
2.3.5. Chemical analysis
The zooplankton, water, and the sediment samples were subdivided for
microbiological and chemical analyses.
Dissolved organic carbon (DOC) and dissolved nitrogen (DN) concentrations
in lake water were determined after filtration through a 0.2 μm Supor membrane filter

2.3 Methods
27
(Pall Corporation, Port Washington, NY). DOC and total organic carbon (TOC) were
measured by high temperature catalytic oxidation (720°C) with a Shimadzu TOC-V
CPH (Shimadzu Scientific Instruments, Kyoto, Japan). The total nitrogen (TN)
content and DN were determined with a Shimadzu TOC-V CPH / TNM1.
Phosphate ( 34PO ) concentrations were determined following filtration
through 0.45 μm cellulose acetate filters (Schleicher & Schuell GmbH, Dassel,
Germany). 34PO was determined photometrically with the molybdenum blue method
according to Vogler (Vogler 1965).
Concentrations of GlcN in zooplankton samples, in POM, and in the sediments
were measured with a slightly modified method after Zhang and Amelung (Zhang and
Amelung 1996) with a derivatization step after Guerrant and Moss (Guerrant and
Moss 1984), and myo-inositol (Aldrich) as internal standard. Filters were treated with
10 ml of 6 M HCl for 10 h at 100°C, which should ensure complete hydrolysis of
biopolymers of GlcN, including chitin and peptidoglycan, in which it occurs in its N-
acetylated form (GlcNAc). Hydrolysis causes deacetylation and, thus, concentrations
of GlcN are the sum of both forms, GlcN and GlcNAc. The gas chromatography (GC)
system was equipped with a flame ionization detector (HRGC 5160, Carlo Erba
Instruments, Milan, Italy), a split-splitless injector and a VF-5 MS column (60 m, 0.25
mm inner diameter and 0.25 μm film thickness). The injector temperature was 250°C
and the temperature of the detector was 300°C. Hydrogen was used as carrier gas with
a flow rate of 2 ml min-1. The temperature profile was: 120°C to 200°C at 20°C min-1,
200°C to 250°C at 2°C min-1, 250°C to 270°C at 20°C min-1 held 10 min at 270°C. A
GlcN standard (D-glucosamine, Sigma-Aldrich Chemie GmbH, Buchs, Switzerland)
was also derivatized and used for quantification.
2.3.6. Chitinase activity
Chitinase activity was determined on water, sediment, and zooplankton
sampled in fall 2009 using the chitin substrate analog methylumbelliferyl-N,N’-
diacetylchitobioside (MUF-DC, Sigma-Aldrich) according to (LeCleir and Hollibaugh
2006) and (Kirchman and White 1999) with slight modifications. Referring to the
manufacturer’s instructions, MUF-DC was dissolved in 100% dimethyl formamide
(DMF) to a final concentration of 5 mM (stock solution).

Bacterial chitin hydrolysis in two lakes of contrasting trophic statuses
28
In a preliminary test, the effect of substrate concentration was determined by
incubating LZ surface waters and mixed LZ sediment samples (0-5 cm) with six
different MUF-DC concentrations (1, 5, 10, 50, 100, and 300 µM) at 20°C and 4°C,
respectively. In addition, we tested DMF for inhibitory effects on Streptomyces
griseus chitinase (Sigma). DMF was found to linearly inhibit activity, up to 80% at
6% DMF, the concentration in the highest MUF-DC concentration (300 µM) used in
the assay. Therefore, we adjusted the concentration of DMF for all assays to 6%.
Water samples were filled into 50 ml centrifuge tubes (Greiner Bio-One,
Frickenhausen, Germany) and mixed with formalin to a final concentration of 0.25%
to prevent microbial growth (Hood 1991). The influence of 0.25% formalin on the
fluorescence of released MUF and on the activity of Streptomyces griseus chitinase
was tested in preliminary experiments. No significant effects were found. Formalin-
fixed water samples were stored cold and dark until assayed (within 4 h after sample
collection).
Sediment samples (0.5 g) and 1.48 ml of autoclaved, 0.2 µm-filtered and
formalin-treated (0.25%) lake water were well mixed and assayed within 12 h of
sample collection.
Water and sediment samples were amended with aliquots of the MUF-DC
stock solution and incubated at 4 and 20°C, which corresponds to the minimum and
maximum temperature measured in the water column of both lakes over a year. As in
situ temperatures for different samples differ from the incubation temperatures (Fig. 6)
and sediments were analyzed as slurries, our data (Fig. 9 and Fig. 10) are potential
chitinase activity rates. After incubation for between 1 and 3 h, the reactions were
stopped in aliquots of 100 and 150 µl of water and sediment-in-water-suspension by
adding 10 and 15 µl of ammonium glycine buffer (pH 10.5) (Daniels and Glew 1984),
respectively. Fluorescence of free methylumbelliferone (MUF) was measured in the
water samples and sediment supernatants at 360 nm excitation and 460 nm emission
using a Synergy HT microplate reader (Bio-Tek Instruments, Inc., Winooski, VT).
Samples were shaken (300 rpm) between measurements.
Zooplankton was killed by 3% hydrochloric acid and washed with autoclaved
and 0.2 µm-filtered lake water. 0.05 g of zooplankton were suspended in 2 ml 0.25%
formalin-treated, autoclaved, and 0.2 µm-filtered lake water. After adding an aliquot
of the MUF-DC stock solution, samples were incubated and processed as described

2.3 Methods
29
for the sediments. Sediments were measured repeatedly up to 11 h, zooplankton up to
9 h, and water up to 100 h.
Positive controls were assayed in autoclaved, 0.2 µm-filtered and formalin-
treated (0.25%) lake water and in autoclaved sediments containing aliquots of MUF-
DC stock solution and Streptomyces griseus chitinase. In addition negative controls
without Streptomyces griseus chitinase were run to test for abiotic degradation of
MUF-DC.
2.3.7. DNA extraction
Autoclaved glass bottles (1 liter) were filled with water samples and
transported on ice and in the dark to the laboratory. About five liters of water from
each sampled depth were filtered through a 5 µm isopore membrane filter (Millipore,
Billerica, MA) and a 0.2 µm polycarbonate filter (Whatman) each 142 mm in
diameter, connected in series. The filters were frozen in liquid nitrogen immediately
after filtration and stored at -80°C until DNA extraction. For extraction, a filter
segment (1/4) was cut into small pieces using sterile scissors and mixed with 0.2 g of
glass beads (0.1 g of 106 µm and 0.1 g of 150-212 µm glass beads, Sigma-Aldrich) in
a 2 ml screw cap tube (Brand GmbH & Co KG, Wertheim, Germany). 1.4 ml of ice-
cold extraction buffer (Hönerlage et al. 1995) were added. Cells were disrupted in a
FastPrep-24 bead-beating system (MP Biomedicals, Solon, OH) by beating twice for
40 s at 4 m s-1, placing tubes on ice in between. Bead-beating was followed by a
freeze-thaw cycle in liquid nitrogen. The supernatant was treated with 50 µg ml-1
RNase A (Sigma-Aldrich) for 30 min at 37°C and extracted with an equal volume
phenol-chloroform-isoamylalcohol (25:24:1) (pH 8) (Sigma-Aldrich). After
precipitation with one volume of isopropanol, the pelleted DNA was dissolved in
Tris-EDTA (pH 8) buffer and stored at -80°C.
For extraction of sediment and zooplankton 0.5 g and 0.05 g sample,
respectively, were mixed with ice-cold 1.4 ml nucleic acid extraction buffer
(Hönerlage et al. 1995). Samples were frozen in liquid nitrogen and stored at -80°C
until DNA extraction. After thawing 0.25 g sterile 0.1 mm Zirconia beads (Biospec
Products Inc., Bartlesville, OK) were added and samples were processed on a vortex
adaptor (MoBio Laboratories, Inc., Carlsbad, CA) for 1 min at maximum speed. DNA
extraction was performed as for the water filters.

Bacterial chitin hydrolysis in two lakes of contrasting trophic statuses
30
The quality of DNA extracts was checked by agarose gel (1%) electrophoresis.
Extracted DNA was quantified by fluorescence spectroscopy using the Quant-iT
PicoGreen dsDNA Assay Kit (Molecular Probes, Eugene, OR) and a Synergy HT
microplate reader (Bio-Tek Instruments).
The reproducibility of the applied DNA extraction protocols was tested on
quadruplicate samples of sediment slurries and on four ¼ segments of 0.2 µm
polycarbonate filters, one for each lake.
2.3.8. Amplification and quantification of chitinase gene fragments
We used the primer pair chif2 (GACGGCATCGACATCGATTGG) and chir
(CSGTCCAGCCGCGSCCRTA), which were reported to target chitinase family 18
group A (chiA) gene fragments from a broad range of chitinolytic bacteria previously
(Xiao et al. 2005). The performance and specificity of chiA PCR primers were tested
on spring water samples (LB 10 m, LB 240 m, LZ 10 m, and LZ 190 m).
Each PCR reaction (20 µl) contained: 10 µl 2x Power SYBR Green PCR
Master Mix (Applied Biosystems, Foster City CA), 0.4 µl of each primer (10 µM,
Microsynth, Balgach, Switzerland), 2 µl BSA (10 mg ml-1, Sigma-Aldrich) and 5 µl
template diluted in nuclease free water (Qiagen GmbH, Hilden, Germany).
Amplification was performed in a 7500 Fast Real-Time PCR System (Applied
Biosystems) with PCR conditions consisting of an initial denaturation step at 95°C for
10 min followed by 35 cycles of denaturation at 95°C for 30 s, annealing at 65°C for
60 s, and extension at 72°C for 30 s followed by melting-curve analysis.
PCR resulted in products yielding a single sharp band of the expected size of
~430 bp in gel electrophoresis (data not shown). To evaluate the specificity of the
chiA PCR primers, we constructed clone libraries from the spring water samples. PCR
products of chitinase gene fragments from samples were cloned into the pGEM-T
vector by using the pGEM-T Easy Vector System according to the instructions of the
manufacturer (Promega). Screening of the clone libraries constructed from these
samples resulted in 15 different RFLP types among 71 screened plasmids. We
sequenced 1-5 clones of each RFLP type, 31 clones in total (sequencing by
Microsynth AG, Balgach, Switzerland). All sequences could be assigned to chitinases,
indicating a high specificity of the PCR protocol (unpublished data).
In preliminary experiments, the PCR amplification was assayed in four-fold
serial dilutions of total DNA extracts in nuclease free water (Qiagen) to determine the

2.4 Results
31
effect of inhibiting contaminants. For instance, according to the resulting copy
numbers, we assayed lake sediments in 64-fold dilutions, as they gave comparable,
but slightly higher (~13%) chiA copy numbers compared to 16-fold diluted templates
while results dropped off significantly for the 256-fold dilution (~40%). Four-fold
dilution of zooplankton samples, 16-fold, and 64-fold dilutions of water and sediment
samples, respectively, were applied in the final analysis. Therefore, different amounts
of genomic DNA template were used in qPCR, i.e., less than 5 ng DNA for LB
samples and ~10-20 ng DNA for LZ samples. Additionally, results of quadruplicate
analysis of DNA extraction yields showed high standard deviations for water filters,
up to 31%. For sediment slurries the standard deviation was 6%.
2.4. Results
2.4.1. Biogeochemistry of lake water columns
(i) Oxygen. The temperature, O2, and conductivity profiles for both lakes
sampled in spring and fall are shown in Fig. 6. In both seasons the water column of
LB was fully oxic. For LZ anoxic conditions were measured below 130 m (O2 < 0.1
mg liter-1), a shallower depth than reported previously (Moor et al. 1996, Meckler et al.
2004).
(ii) Organic carbon. In LZ waters, the TOC concentrations were roughly
three to four times higher compared to LB waters (Fig. 7A) and ranged from 1.86 to
2.54 mg C liter-1 (error of measurement is 0.20 mg C liter-1). The DOC values ranged
between 1.80 ± 0.20 mg C liter-1 (March 2009; 170 m) and 2.40 ± 0.20 mg C liter-1
(October 2009; 5 m). For LB the DOC concentrations were below or close to the
detection limit of 0.50 mg C liter-1 in both seasons.
(iii) Nitrogen. The TN and the DN concentrations were below the detection
limit of 0.50 mg N liter-1, except for LZ waters in spring (data not shown).
(iv) Phosphate. The 34PO concentrations were below 5 µg P liter-1 for all
sampled water depths of LB, with the exception of the 5 m and the 20 m surface water
depths sampled in September 2009 (Fig. 7C). For LZ the 34PO concentrations
increased with water depth. The concentrations ranged from 3.8 ± 0.5 µg P liter-1
(October 2009; 15 m) to 217 ± 0.5 µg P liter-1 (October 2009; 190 m).
(v) Glucosamine. For both lakes, concentrations of particulate GlcN were
highest in the euphotic zone and decreased with depth (Fig. 7D). The highest value of

Bacterial chitin hydrolysis in two lakes of contrasting trophic statuses
32
70.6 nmol liter-1 was measured in the 5 m water depth of LZ sampled in March 2009.
For LB, the GlcN concentrations were roughly one order of magnitude lower
compared to LZ.
C
A B
D
Fig. 7.Water column properties of Lake Brienz (LB) sampled in May and September 2009 and of Lake Zug (LZ) sampled in March and October 2009 as a function of depth. (A) TOC ± 0.2 mg C liter-1, (B) ± 0.02 mg N liter-1, (C) ± 0.5 µg P liter-1, errors given are standard deviations of measurement, (d) particulate glucosamine (GlcN) in nmol liter-1 of water. Standard deviation of GlcN measurement was below 10%. Bold dashed lines mark border between oxic and anoxic water body of LZ.
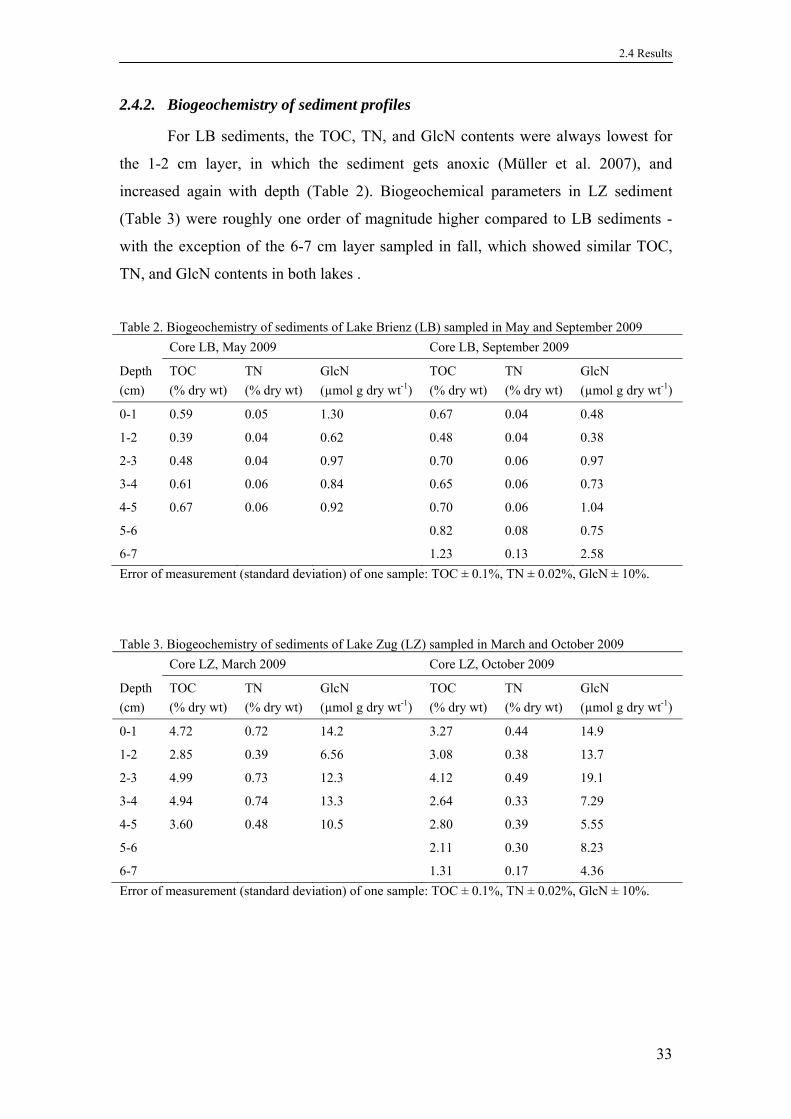
2.4 Results
33
2.4.2. Biogeochemistry of sediment profiles
For LB sediments, the TOC, TN, and GlcN contents were always lowest for
the 1-2 cm layer, in which the sediment gets anoxic (Müller et al. 2007), and
increased again with depth (Table 2). Biogeochemical parameters in LZ sediment
(Table 3) were roughly one order of magnitude higher compared to LB sediments -
with the exception of the 6-7 cm layer sampled in fall, which showed similar TOC,
TN, and GlcN contents in both lakes .
Table 2. Biogeochemistry of sediments of Lake Brienz (LB) sampled in May and September 2009
Core LB, May 2009 Core LB, September 2009
Depth
(cm)
TOC
(% dry wt)
TN
(% dry wt)
GlcN
(µmol g dry wt-1)
TOC
(% dry wt)
TN
(% dry wt)
GlcN
(µmol g dry wt-1)
0-1 0.59 0.05 1.30 0.67 0.04 0.48
1-2 0.39 0.04 0.62 0.48 0.04 0.38
2-3 0.48 0.04 0.97 0.70 0.06 0.97
3-4 0.61 0.06 0.84 0.65 0.06 0.73
4-5 0.67 0.06 0.92 0.70 0.06 1.04
5-6 0.82 0.08 0.75
6-7 1.23 0.13 2.58
Error of measurement (standard deviation) of one sample: TOC ± 0.1%, TN ± 0.02%, GlcN ± 10%.
Table 3. Biogeochemistry of sediments of Lake Zug (LZ) sampled in March and October 2009
Core LZ, March 2009 Core LZ, October 2009
Depth
(cm)
TOC
(% dry wt)
TN
(% dry wt)
GlcN
(µmol g dry wt-1)
TOC
(% dry wt)
TN
(% dry wt)
GlcN
(µmol g dry wt-1)
0-1 4.72 0.72 14.2 3.27 0.44 14.9
1-2 2.85 0.39 6.56 3.08 0.38 13.7
2-3 4.99 0.73 12.3 4.12 0.49 19.1
3-4 4.94 0.74 13.3 2.64 0.33 7.29
4-5 3.60 0.48 10.5 2.80 0.39 5.55
5-6 2.11 0.30 8.23
6-7 1.31 0.17 4.36
Error of measurement (standard deviation) of one sample: TOC ± 0.1%, TN ± 0.02%, GlcN ± 10%.
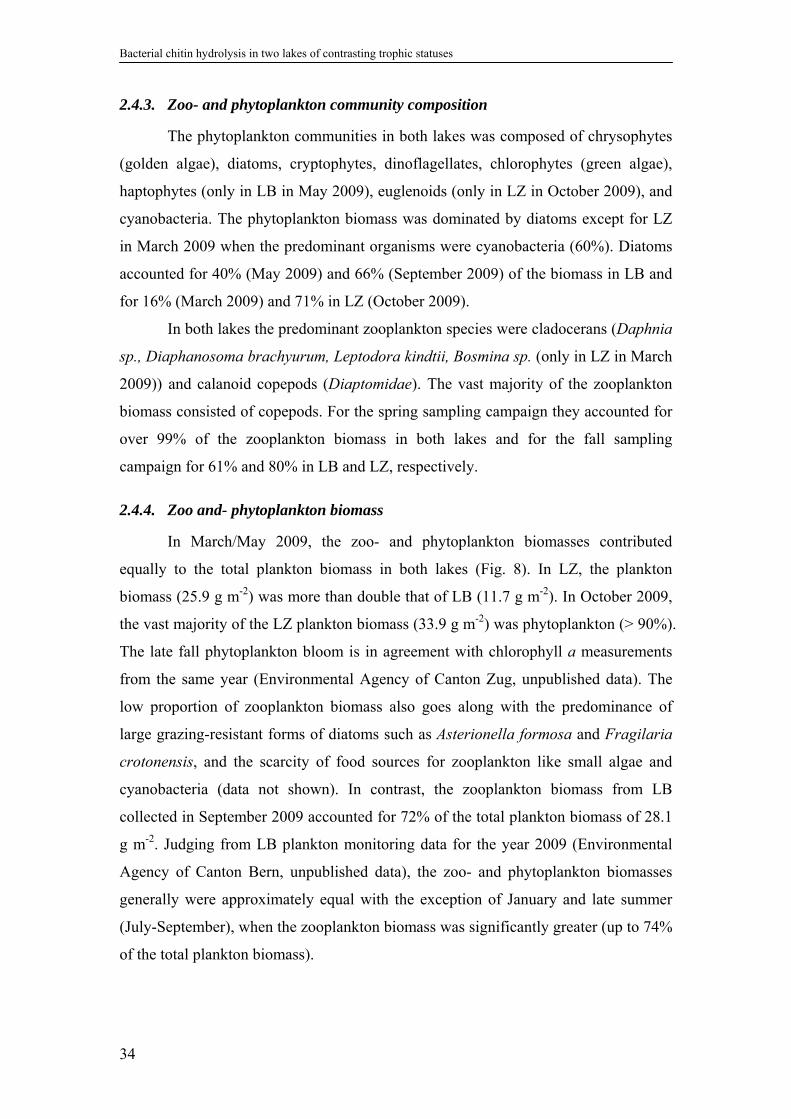
Bacterial chitin hydrolysis in two lakes of contrasting trophic statuses
34
2.4.3. Zoo- and phytoplankton community composition
The phytoplankton communities in both lakes was composed of chrysophytes
(golden algae), diatoms, cryptophytes, dinoflagellates, chlorophytes (green algae),
haptophytes (only in LB in May 2009), euglenoids (only in LZ in October 2009), and
cyanobacteria. The phytoplankton biomass was dominated by diatoms except for LZ
in March 2009 when the predominant organisms were cyanobacteria (60%). Diatoms
accounted for 40% (May 2009) and 66% (September 2009) of the biomass in LB and
for 16% (March 2009) and 71% in LZ (October 2009).
In both lakes the predominant zooplankton species were cladocerans (Daphnia
sp., Diaphanosoma brachyurum, Leptodora kindtii, Bosmina sp. (only in LZ in March
2009)) and calanoid copepods (Diaptomidae). The vast majority of the zooplankton
biomass consisted of copepods. For the spring sampling campaign they accounted for
over 99% of the zooplankton biomass in both lakes and for the fall sampling
campaign for 61% and 80% in LB and LZ, respectively.
2.4.4. Zoo and- phytoplankton biomass
In March/May 2009, the zoo- and phytoplankton biomasses contributed
equally to the total plankton biomass in both lakes (Fig. 8). In LZ, the plankton
biomass (25.9 g m-2) was more than double that of LB (11.7 g m-2). In October 2009,
the vast majority of the LZ plankton biomass (33.9 g m-2) was phytoplankton (> 90%).
The late fall phytoplankton bloom is in agreement with chlorophyll a measurements
from the same year (Environmental Agency of Canton Zug, unpublished data). The
low proportion of zooplankton biomass also goes along with the predominance of
large grazing-resistant forms of diatoms such as Asterionella formosa and Fragilaria
crotonensis, and the scarcity of food sources for zooplankton like small algae and
cyanobacteria (data not shown). In contrast, the zooplankton biomass from LB
collected in September 2009 accounted for 72% of the total plankton biomass of 28.1
g m-2. Judging from LB plankton monitoring data for the year 2009 (Environmental
Agency of Canton Bern, unpublished data), the zoo- and phytoplankton biomasses
generally were approximately equal with the exception of January and late summer
(July-September), when the zooplankton biomass was significantly greater (up to 74%
of the total plankton biomass).
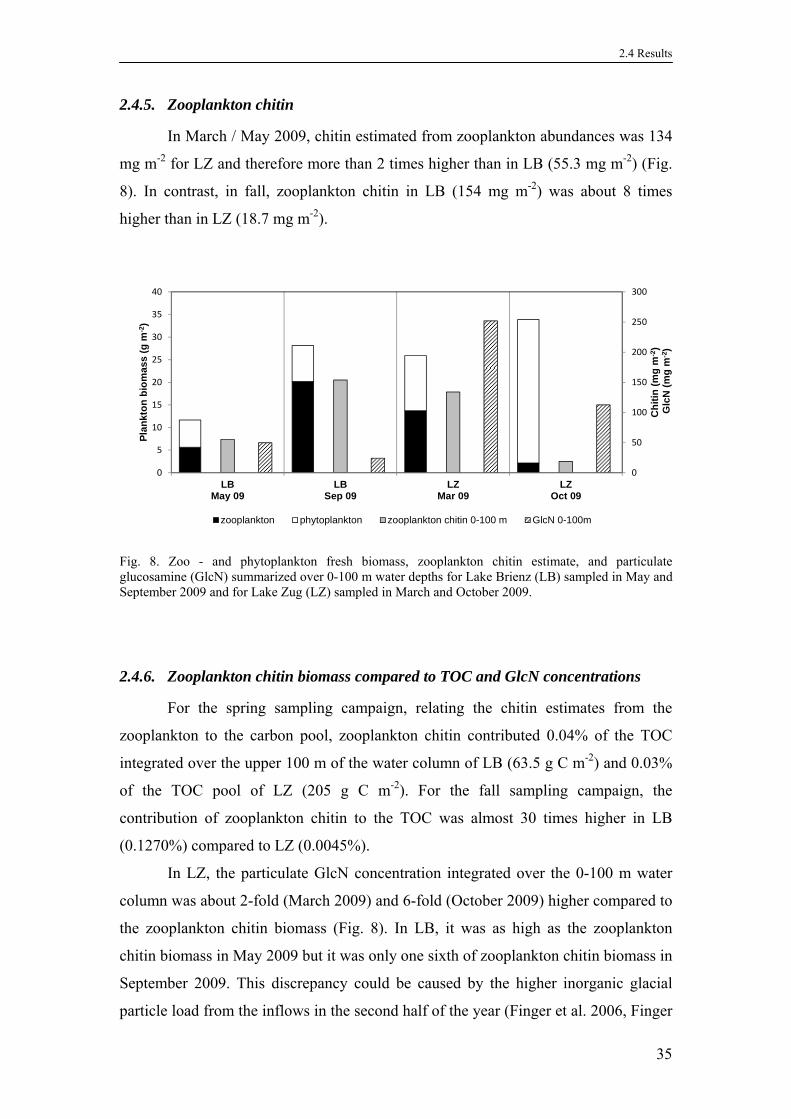
2.4 Results
35
2.4.5. Zooplankton chitin
In March / May 2009, chitin estimated from zooplankton abundances was 134
mg m-2 for LZ and therefore more than 2 times higher than in LB (55.3 mg m-2) (Fig.
8). In contrast, in fall, zooplankton chitin in LB (154 mg m-2) was about 8 times
higher than in LZ (18.7 mg m-2).
0
50
100
150
200
250
300
0
5
10
15
20
25
30
35
40
LBMay 09
LBSep 09
LZMar 09
LZOct 09
Ch
itin
(m
g m
-2)
Glc
N (
mg
m-2
)
Pla
nkt
on
bio
mas
s (g
m-2
)
zooplankton phytoplankton zooplankton chitin 0-100 m GlcN 0-100m
Fig. 8. Zoo - and phytoplankton fresh biomass, zooplankton chitin estimate, and particulate glucosamine (GlcN) summarized over 0-100 m water depths for Lake Brienz (LB) sampled in May and September 2009 and for Lake Zug (LZ) sampled in March and October 2009.
2.4.6. Zooplankton chitin biomass compared to TOC and GlcN concentrations
For the spring sampling campaign, relating the chitin estimates from the
zooplankton to the carbon pool, zooplankton chitin contributed 0.04% of the TOC
integrated over the upper 100 m of the water column of LB (63.5 g C m-2) and 0.03%
of the TOC pool of LZ (205 g C m-2). For the fall sampling campaign, the
contribution of zooplankton chitin to the TOC was almost 30 times higher in LB
(0.1270%) compared to LZ (0.0045%).
In LZ, the particulate GlcN concentration integrated over the 0-100 m water
column was about 2-fold (March 2009) and 6-fold (October 2009) higher compared to
the zooplankton chitin biomass (Fig. 8). In LB, it was as high as the zooplankton
chitin biomass in May 2009 but it was only one sixth of zooplankton chitin biomass in
September 2009. This discrepancy could be caused by the higher inorganic glacial
particle load from the inflows in the second half of the year (Finger et al. 2006, Finger

Bacterial chitin hydrolysis in two lakes of contrasting trophic statuses
36
et al. 2007), which caused a higher turbidity in the surface waters (AWA Amt für
Wasser und Abfall). As a consequence, the primary production maximum was shifted
to a lower water depth of 2.5 m compared to May 2009 when it was observed at a
water depth of 5 m (Carstens et al. 2012). Since the shallowest in situ pumping was
performed at 5 m, the fall sampling probably missed a significant proportion or even
the maximum of the zooplankton biomass in the surface waters of LB.
2.4.7. Zooplankton chemistry
The GlcN content of zooplankton sampled in fall accounted for 69.6 ± 4.5 and
for 94.8 ± 7.1 µmol g-1 dry wt in LB and LZ, respectively, and was, therefore, about
one third higher in the zooplankton of LZ. The results for the TOC, TN, and GlcN
content of zooplankton samples are summarized in Table 4.
Table 4. Zooplankton chemistry, chitinase activity, and chiA copies on zooplankton samplesa
Chitinase gene copy no.
Site TOC
(% dry wt)
TN
(% dry wt)
GlcN
(µmol
g dry wt-1)
Chitinase activity at 4°C
(nmol MUFb h-1
g dry wt-1)
(chiA copies
mg dry wt-1)
(chiA copies
ng DNA-1)
LB 52.1 ± 0.7 8.77 ± 0.09 69. 6 ± 4.5 26.0 ± 4.4 1 600 ± 705 1.39 ± 0.61
LZ 42.4 ± 0.7 9.00 ± 0.24 94. 8 ± 7.1 50.4 ± 9.3 5 726 ± 578 13.9 ± 1.4 aThe errors given are standard deviations of triplicate measurements of one sample. bMUF, fluorescent methylumbelliferone released after the hydrolysis of the chitin substrate analog methylumbelliferyl-N,N’-diacetylchitobioside.
2.4.8. Chitinase activity
The effect of the substrate concentration on chitinase activity was tested in LZ
surface waters and mixed sediment slurries. For the sediment samples, MUF-DC
turnover was found highest (2.63 ± 0.22 nmol h-1 g dry sediment-1) at a substrate
concentration of 50 µM (Fig. 9) and dropped at 100 and 300 µM. For the water
samples the chitinase activity was below the limit of detection for all substrate
concentrations even after 4 days of incubation. For negative controls, no turnover
rates could be detected, which implies that only biotic degradation of MUF-DC was
detected during the incubation.

2.4 Results
37
Fig. 9. Effect of substrate concentration (1, 5, 10, 50, 100, 300 µM MUF-DC) on chitinase activity in mixed LZ sediment slurries (0-5 cm) assayed at 4°C. The error bars indicate standard deviations of triplicate samples from one sediment core sampled in the fall.
We assayed the sediments and zooplankton from both lakes sampled in fall 2009 with
50 µM MUF-DC at 4°C and 20°C. MUF-DC turnover rates at 20°C were roughly
one-third higher than at 4°C for the zooplankton samples of both lakes and up to 3-
and 8-fold higher for LB and LZ sediments, respectively. For reasons of simplicity,
only the data for 4°C are discussed and shown in Table 4 and Fig. 10.
(i) Zooplankton. Chitinase activity on LZ zooplankton was about double that
measured for LB zooplankton on a dry weight basis (Table 4).
(ii) Sediment. Chitinase activity (at 4°C) in LB sediments ranged from 0.08
(1-2 cm) to 0.69 nmol MUF h-1 g dry wt-1 (6-7 cm) and in LZ sediments from 0.59 (5-
6 cm) to 5.10 nmol MUF h-1 g dry wt-1 (0-1 cm) (Fig. 10). Comparing the two lake
systems, LZ’s chitinase activity per gram dry sediment was up to 40 times higher than
that measured in LB sediments, but decreased with depth and converged on LB’s
values in the 5-6 and 6-7 cm layer (Fig. 10). However, normalized to the GlcN
concentrations, the chitinase activities were in the same range for both lakes, with no
clear depth-related trend (data not shown).
Normalized to the TOC, TN, and GlcN contents, the chitinase activities were
in the same order of magnitude as the values measured for zooplankton (data not
shown).

Bacterial chitin hydrolysis in two lakes of contrasting trophic statuses
38
0
1
2
3
4
5
6
7
0 1 2 3 4 5 6
Dep
th (
cm)
Chitinase activity(nmol MUF h-1 g dry wt-1)
LB Sep 09
LZ Oct 09
Fig. 10. Chitinase activities in the upper 7 centimeter of Lake Brienz (LB) and Lake Zug (LZ) sediment relative to sediment dry weight in fall 2009 at 4°C. MUF, fluorescent methylumbelliferone released after the hydrolysis of the chitin substrate analog methylumbelliferyl-N,N’-diacetylchitobioside. The error bars represent standard deviations of triplicate measurements of one sample.
2.4.9. Chitinase gene copies
(i) Water. For the 0.2-5 µm water fractions of LZ, specific chiA fragments
could be amplified only for the 5 m and the 10 m water depths sampled in spring and
for the 5 m to 25 m water depths sampled in fall (Fig. 11). In comparison, the chiA
gene copies detected per ml of water were 2 to 15 times higher in the surface waters
of LB, with the exception of the 10 m water depth of LZ in October 2009 (272 ± 17
chiA copies ml-1). The maximum chiA concentration in LB waters (340 ± 7 chiA
copies ml-1) was measured in the 5 m water depth in May 2009. In LB, the chiA gene
was detected at all depths. For the ≥ 5 µm fractions, we got no specific chiA signals
for LB. ChiA was detected in the surface water depths of LZ in this fraction.
However, concentrations were up to 20 times lower than for the 0.2-5 µm fractions
(data not shown).

2.4 Results
39
Fig. 11. chiA gene copy number in the water columns of Lake Brienz (LB) and Lake Zug (LZ). (A) chiA copies per ml of water. (B) chiA copies per ng extracted DNA. (C) chiA copies per pmol GlcN. (D) chiA copies per µg TOC. The error bars represent standard deviations of triplicate measurements of one sample.
(ii) Sediment. In LB sediment, the lowest chiA content was measured in the 1-
2 cm layer, increasing again with depth below this layer, as observed for the chitinase
activity (Fig. 10 and Fig. 12A). In May 2009, the highest chiA content of 87.0 ± 9.2
chiA copies mg dry wt-1 was measured in the 0-1 cm sediment layer and in September
2009 in the 6-7 cm layer (363 ± 49 chiA copies mg dry wt-1). The chiA content in the
0-1 cm layer of LZ sediment was about 2 (October 2009) to 10 times (March 2009)
higher than that of LB on a dry weight basis. Normalized to the GlcN (Fig. 12C),
TOC (Fig. 12D), and TN (data not shown) contents of the sediment, the chiA copy
numbers were higher in LB, with few exceptions.
Since the efficiency of any nucleic acid extraction method from environmental
samples is less than 100% and we did not use an internal standard to correct for this,
the absolute copy numbers of chiA were likely underestimated. Variable extraction
efficiencies may affect comparisons between different sample types. Therefore, chiA
copy numbers normalized to the amount of DNA used in the PCR are shown in Fig.
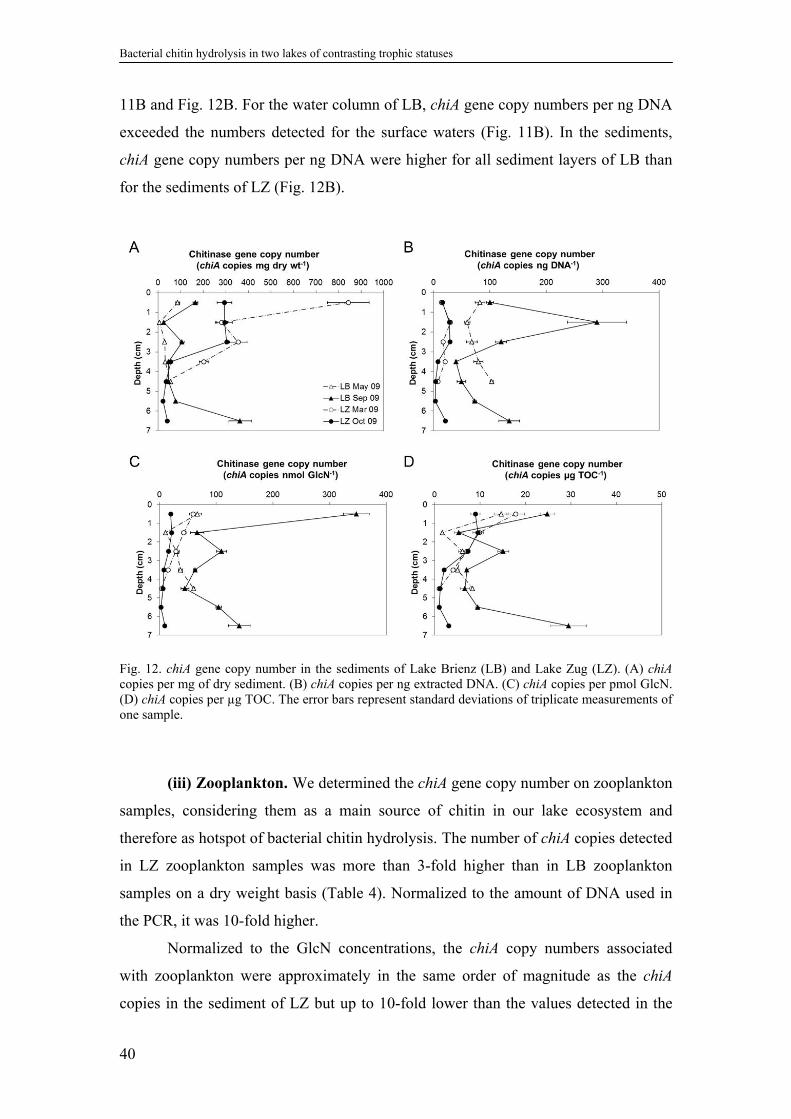
Bacterial chitin hydrolysis in two lakes of contrasting trophic statuses
40
11B and Fig. 12B. For the water column of LB, chiA gene copy numbers per ng DNA
exceeded the numbers detected for the surface waters (Fig. 11B). In the sediments,
chiA gene copy numbers per ng DNA were higher for all sediment layers of LB than
for the sediments of LZ (Fig. 12B).
Fig. 12. chiA gene copy number in the sediments of Lake Brienz (LB) and Lake Zug (LZ). (A) chiA copies per mg of dry sediment. (B) chiA copies per ng extracted DNA. (C) chiA copies per pmol GlcN. (D) chiA copies per µg TOC. The error bars represent standard deviations of triplicate measurements of one sample.
(iii) Zooplankton. We determined the chiA gene copy number on zooplankton
samples, considering them as a main source of chitin in our lake ecosystem and
therefore as hotspot of bacterial chitin hydrolysis. The number of chiA copies detected
in LZ zooplankton samples was more than 3-fold higher than in LB zooplankton
samples on a dry weight basis (Table 4). Normalized to the amount of DNA used in
the PCR, it was 10-fold higher.
Normalized to the GlcN concentrations, the chiA copy numbers associated
with zooplankton were approximately in the same order of magnitude as the chiA
copies in the sediment of LZ but up to 10-fold lower than the values detected in the

2.4 Results
41
sediment from LB (Fig. 12C). Compared to the results for the water columns, the chiA
concentrations normalized to GlcN were 100- to 1000-fold lower in zooplankton
samples from LZ and LB, respectively (Fig. 11C).
2.4.10. Correlations between chitinase activity, chiA abundance, and
biogeochemical parameters
(i) Water. For both sampling campaigns, the chiA copies detected in the water
column of LB and the GlcN concentration were highly significantly correlated (P <
0.01; n = 10) (Table 5).
(ii) Sediment. For both lake sediments, the chiA content and the chitinase
activity correlated highly significantly (P < 0.01; n = 7) (Table 5). For the LB core
sampled in fall, significant correlations were found between the chiA copy number
and the GlcN, TOC, and TN contents. In spring, these correlations were not
significant, except for the correlation between chiA copy number and GlcN. Chitinase
activity and GlcN, TOC, and TN concentrations also correlated significantly for the
fall cores from both lakes, but in LZ, the correlation was not as highly significant as in
LB sediments.
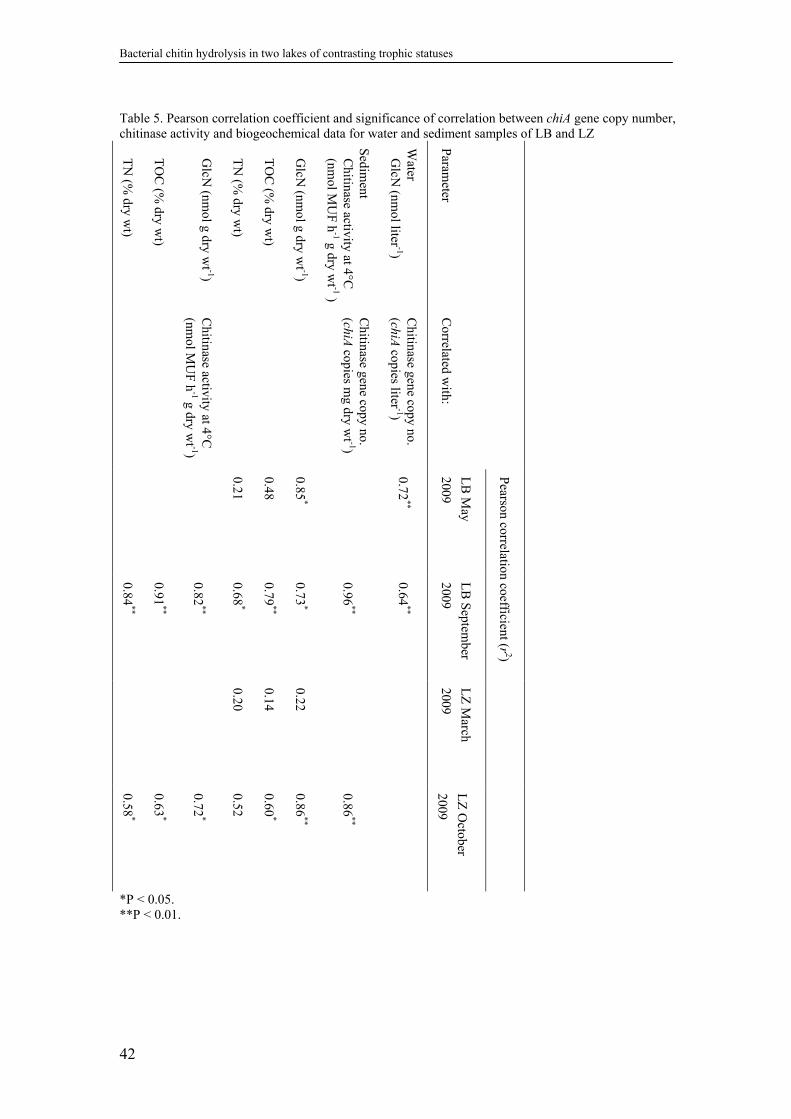
Bacterial chitin hydrolysis in two lakes of contrasting trophic statuses
42
Table 5. Pearson correlation coefficient and significance of correlation between chiA gene copy number, chitinase activity and biogeochemical data for water and sediment samples of LB and LZ
TN
(% dry w
t)
TO
C (%
dry wt)
GlcN
(nmol g dry w
t -1)
TN
(% dry w
t)
TO
C (%
dry wt)
GlcN
(nmol g dry w
t -1)
Sedim
ent C
hitinase activity at 4°C
(nmol M
UF
h-1 g dry w
t -1 )
Water
GlcN
(nmol liter -1)
Param
eter
Chitinase activity at 4°C
(nm
ol MU
F h
-1 g dry wt -1)
Chitinase gene copy no.
(chiA copies m
g dry wt -1)
Chitinase gene copy no.
(chiA copies liter -1)
Correlated w
ith:
0.21
0.48
0.85*
0.72**
LB
May
2009
Pearson correlation coefficient (r
2)
0.84**
0.91**
0.82**
0.68*
0.79**
0.73*
0.96**
0.64**
LB
Septem
ber
2009
0.20
0.14
0.22
LZ
March
2009
0.58*
0.63*
0.72*
0.52
0.60*
0.86**
0.86**
LZ
October
2009
*P < 0.05. **P < 0.01.
2.5 Discussion
43
2.5. Discussion
2.5.1. Sources of chitin and glucosamine in freshwater lakes
Chitin was reported to be produced in high amounts in aquatic ecosystems
previously (Poulicek et al. 1998, Cauchie 2002). The mean chitin standing biomass
from marine planktonic crustaceans (copepods, cladocerans, and decapod larvae) was
calculated to 26.3 mg m-2 (Jeuniaux and Voss-Foucart 1991), which is in the same
order of magnitude as the zooplankton chitin biomass we estimated for our two
different lacustrine ecosystems. Our results also agree with the results from a study on
chitin dynamics in a mesotrophic bog and a hypereutrophic lake, in which the chitin
biomass (from crustaceans) fluctuated between 2 and 200 mg m-2 (Miyamoto et al.
1991). The available data thus points to similar chitin biomass in marine and
lacustrine ecosystems, with considerable local and seasonal variability.
However, zooplankton is not the only chitin source in an aquatic ecosystem. It
is known that chitin is also produced by protozoa, fungi, and algae, especially by
diatoms (Herth 1978, Bartnicki-Garcia and Lippman 1982, Mulisch 1993). Diatom
chitin, known as chitan, can amount to a significant constituent of the cellular
biomass. For the diatom Thalassiosira fluviatilis, e.g., chitan was found to represent
31-38% of the total cell mass (McLachlan et al. 1965). In contrast, Smucker reported
only 7% and found significant differences between various diatom species (ranging
from 2 to 10% of dry wt) (Smucker 1991). However, he attributed this discrepancy
also to chitan losses due to the extraction method that had been used. To our
knowledge, chitin content estimates for diverse algal species are not available in the
literature, and a calculation of phytoplankton chitin, analogous to the one provided for
zooplankton chitin, is thus currently not feasible. As a rough estimate, assuming a
chitan content between 5% and 30% of dry diatom biomass and a mean dry weight of
300 pg per diatom cell (Reynolds 1984), diatom chitin would constitute 102 to 610
mg m-2 for LB in May 2009, 177 to 1061 mg m-2 for LB in September 2009, 261 to
1568 mg m-2 for LZ in March 2009, and 503 to 3015 mg m-2 for LZ in October 2009.
Thus, significant amounts of chitin, exceeding the zooplankton contribution, may
have been produced by this source. This may also explain our observations in LZ,
where the particulate GlcN pool (0-100 m) was indeed found to be higher than the
zooplankton chitin (Fig. 8).
Bacterial chitin hydrolysis in two lakes of contrasting trophic statuses
44
GlcN is not only the main constituent of the biopolymer chitin, but together
with muramic acid (MurA), also forms the disaccharide backbone of the bacterial cell
wall polymer peptidoglycan. Based on measurements of MurA concentrations
Carstens et al. determined the contribution of bacterial cells to the particulate GlcN
(Carstens et al. 2012). Bacteria-derived GlcN accounted for up to 26% and 34% of
total GlcN in the euphotic zone of LZ and LB, respectively. Compared to the water
column of LZ the proportions of bacterial GlcN were higher in the water column of
LB with a maximum of 94% at 200 m sampled in fall 2009.
2.5.2. Chitinolytic activity and populations in freshwater lakes
Several studies on chitinase activity in aquatic environments have been published,
mainly for marine and estuarine water and sediments, which applied a wide range of
substrate concentrations, ranging from 20 nM to 5 mM (Hoppe 1983, Hood 1991,
Smith et al. 1992, Vrba et al. 1996, Kirchman and White 1999, Bowman et al. 2003,
Mudryk and Skórczewski 2004). This makes the determination of substrate saturation
curves for the environment under study crucial. We found an optimum substrate
concentration of 50 µM for the lake sediments, whereas no chitinase activity could be
measured in the water at any substrate concentration. Using a comparable approach
(using 20 µM MUF-GlcNAc), Martinez et al. (1996) could not detect any chitinase
activity in seawater (Martinez et al. 1996). In contrast, in alkaline hypersaline Mono
Lake turnover rates for 10 µM MUF-DC in water and sediment samples were 1000-
fold higher compared to the chitinase activities of the sediments analyzed in the
present study (LeCleir and Hollibaugh 2006). However, Mono Lake is an
environment extremely rich in chitin from shrimp exuvia and carcasses. The lack of
detection in the water samples of our lake ecosystems indicates that chitinase activity
was mostly associated with particles. In aquatic environments aggregates are known
as hotspots of exoenzymatic activities (Smith et al. 1992, Grossart and Simon 1998a).
Chitinase activity, in particular, was reported to be mainly associated with particulate
fractions previously, e.g., they were found associated with the > 3 µm or the 2-100
µm particle size class (Hoppe et al. 1998, Richardot et al. 1999). Similarly, we found
significant activity in the water only on the zooplankton samples, i.e. the > 95 µm
fraction. Particle - associated microbes have the advantage to benefit directly from the
soluble oligomers produced by chitin hydrolysis. However, planktonic bacteria can

2.5 Discussion
45
also profit from chitin hydrolysis products, which has been shown recently for
members of planktonic freshwater Actinobacteria (Beier and Bertilsson 2011).
By chiA-specific quantitative PCR we could confirm the presence of
chitinolytic bacteria in zooplankton, sediment, and the 0.2-5 µm water fractions. The
chiA abundance normalized to any parameter (DNA, GlcN, TOC) that was associated
with the 0.2-5 µm water fraction was significantly higher than what was detected in
the zooplankton samples, which we had assumed to contain high concentrations of
chitinolytic bacteria. The access to zooplankton chitin (α-chitin) is probably hindered
by cross-linked structural components such as glycans and proteins. These have to be
degraded by different microbial communities initializing the decomposition of
zooplankton carcasses (Gooday 1990, Tang et al. 2006, Tang et al. 2009). However,
we did not analyze the fraction of eukaryotic DNA in the DNA extracts to normalize
the results to only bacterial DNA, which could change the described ratios.
The bacterial degradation of chitin is known to be highly regulated (33).
Therefore, the detection of bacterial chiA gene copy numbers only indicates the
presence of bacteria capable of chitin degradation and is not a direct measure for
active chitin hydrolysis, i.e., chitinase activity. However, in the present study chiA
gene abundance in sediments was highly correlated to chitinase activity, and the
increased abundance of the chiA gene in the water column of LB, where chitin had a
higher contribution to the carbon pool, also indicates a relationship of gene abundance
and chitin degradation. The higher prominence of chitin as a bacterial substrate in
oligotrophic compared to eutrophic lakes has also been shown in culture-dependent
analyses of chitinolytic bacteria in Polish lakes (Donderski 1984, Donderski and
Brzezinska 2003).
In conclusion, significant correlations between chiA gene abundance, chitinase
activity and biogeochemical data evidenced the contribution of chitin to the carbon
and nitrogen budget in the lake sediments, in particular for the oligotrophic system,
LB (Table 5). We therefore assign chitin a role as a significant microbial growth
substrate in temperate freshwater lakes, especially where other easily degradable
carbon sources are scarce.


3. RARE BACTERIAL COMMUNITY MEMBERS
DOMINATE THE FUNCTIONAL TRAIT OF CHITIN
HYDROLYSIS IN FRESHWATER LAKES
Krista E. Köllner and Helmut Bürgmann
Manuscript
Contributions of the authors:
The manuscript was written by Krista Köllner and corrected by Helmut Bürgmann.
Krista Köllner conducted the DNA extraction and the amplification of 16S rRNA
gene and chitinase gene fragments subjected to 454 pyrosequencing. Krista Köllner
performed the analysis and interpretation of the data in collaboration with Helmut
Bürgmann.

Rare bacterial community members dominate the functional trait of chitin hydrolysis in freshwater lakes
48
3.1. Abstract
Currently, little is known about the identity and ecology of freshwater
chitinolytic bacteria, which play a key role in the hydrolysis of chitin. In a recent
study in two freshwater lakes with contrasting trophic status, we found remarkably
high chiA gene copy numbers in the oligotrophic compared to the eutrophic water
column. However, for both lakes the chitinolytic activity was only detected in
zooplankton and sediment samples. For the present study, we characterized
potentially chitinolytic bacteria by 454 pyrosequencing of the chiA diversity in
zooplankton, water, and surficial sediments of both lakes. The abundance of the
potentially chitinolytic bacteria was related to the bacterial community composition
analyzed by 454 pyrosequencing of the 16S rRNA gene. The dominant pelagic
bacteria in both lakes were Actinobacteria. However, except for one water sample,
chitinases associated with actinobacterial chitinases were only abundant in the
sediments and the zooplankton sample of the oligotrophic lake. The predominant
chitinase sequence in the water of this lake matched that of Stenotrophomonas
maltophilia. As it was not abundant in the particulate samples, Stenotrophomonas
maltophilia may rather be involved in scavenging chitin hydrolysis products released
to the water column. In the eutrophic lake a single phylogenetically unidentified
chitinase lineage was dominant in all three habitats. Other abundant sequences were
associated with chitinases of the β-Proteobacteria and Actinobacteria. Although, the
total diversity of the detected chitinase sequences was striking, the bulk of chitin
hydrolysis appeared to be associated with a few dominant species that varied by
environment.
3.2. Introduction
Chitin is synthesized as a structural component by many organisms, for
instance by fungi, arthropods, and algae (Gooday 1990). Thus, chitin is one of the
most abundant biopolymers on earth (Gooday 1990). In aquatic ecosystems, chitin
synthesis is estimated at 1010 to 1012 kg chitin year-1 (Cauchie 2002). Chitin is a
highly insoluble polymer of N-acetylglucosamine and prior to assimilation, it has to
be hydrolyzed to soluble oligomers and dimers of N-acetylglucosamine (Keyhani and
Roseman 1999). In aquatic ecosystems, the ability to hydrolyze chitin is mainly

3.2 Introduction
49
attributed to bacteria and accomplished by chitinases (EC 3.2.1.14) (Zobell and
Rittenberg 1937, Boyer 1994).
Bacterial chitinases are mainly family 18 glycoside hydrolases (Henrissat
1999). However, family 19 glycoside hydrolases were also detected for Streptomyces
spp. and a couple of other bacterial species (Watanabe et al. 1999, Kong et al. 2001,
Honda et al. 2008). Family 18 chitinases are classified into groups A, B, and C
according to amino acid sequence similarities within their catalytic domains
(Watanabe et al. 1993). Bacterial chitinases are highly diverse and the apparent
phylogeny of chitinase gene sequences was found not to correspond to the 16S rRNA
gene based phylogeny (Cottrell et al. 2000, Xiao et al. 2005). This discrepancy is
attributed to lateral gene transfer between organisms, which is probably also the
reason for the detection of multiple chitinase genes in a single species (Saito et al.
1999, Cottrell et al. 2000, Karlsson and Stenlid 2009). The expression of multiple
chitinases from different chitinase genes empowers an organism to hydrolyze chitin
efficiently and the synergistic properties of multiple chitinases have been described
elsewhere (Saito et al. 1999, Suzuki et al. 2002, Orikoshi et al. 2005). The ability to
express multiple chitinases is specifically relevant given the structural diversity of
chitin (α-, β-, γ-arrangement of N-acetylglucosamine strands, variation in the degree
of deacetylation, cross-linking to other structural components such as glucans and
proteins (Gooday 1990)) and guarantees the efficient utilization of the provided form
of chitin (Svitil et al. 1997).
Among the multiple chitinases group A chitinases were shown to be expressed
in the largest amounts and to be the most active enzyme toward insoluble chitin
(Suzuki et al. 2002, Orikoshi et al. 2005). Thus, most studies on the diversity and
distribution of bacterial chitinases in diverse environments have been focused on
family 18 group A chitinases (Cottrell et al. 2000, Ramaiah et al. 2000, Hobel et al.
2005, Lindsay et al. 2010). The dominance of group A chitinase (chiA) genes in
aquatic environments was recently demonstrated by Beier et al. (Beier et al. 2011).
Compared to the number of studies on bacterial chitinases in marine and saline
ecosystems (Svitil and Kirchman 1998, Cottrell and Kirchman 2000, Ramaiah et al.
2000, LeCleir et al. 2004, LeCleir et al. 2007, Beier et al. 2011) the number of studies
on bacterial chitinases in freshwater ecosystems is low and mostly focused on
environments with extreme characteristics (Hobel et al. 2005, Xiao et al. 2005,
LeCleir et al. 2007). Bacterial chitinases present in freshwater ecosystems have been
Rare bacterial community members dominate the functional trait of chitin hydrolysis in freshwater lakes
50
reported to be related to Firmicutes, β- and γ-Proteobacteria, Bacteroidetes
(Flavobacteria, Cytophaga), and Actinobacteria (Hobel et al. 2005, Xiao et al. 2005,
Beier and Bertilsson 2011).
Based on 16S rRNA gene approaches, β-Proteobacteria and Actinobacteria
were identified as predominant bacterial groups in freshwater lakes (Hiorns et al.
1997, Glöckner et al. 2000, Humbert et al. 2009, Oh et al. 2011). Actinobacteria have
previously been described as efficient chitinolytic agents in soil habitats, in particular
the genus Streptomyces (Metcalfe et al. 2002, Bhattacharya et al. 2007, Hjort et al.
2010). However, a recent study, which reports the consumption of chitin hydrolysis
products by Actinobacteria without being actively involved in the hydrolysis of chitin,
did not find evidence for a role of this group as key players for the hydrolysis of chitin
in freshwater lakes (Beier and Bertilsson 2011).
In a previous study, we investigated the chiA gene abundance and the chitin
turnover in zooplankton, the water column and the sediments of oligotrophic Lake
Brienz (LB) and eutrophic, partially anoxic Lake Zug (LZ) (Köllner et al. 2012).
Chitinase activity was found in the sediments and associated with zooplankton. In the
oligotrophic water column, a significantly higher abundance of chiA genes was
detected compared to the eutrophic waters of LZ. For the sediments of both lakes,
significant correlations between chiA gene abundance and chitin turnover were
detected. Based on these findings and the literature we postulated that the sites of
chitinolytic activity would harbor a high diversity of chitinolytic bacteria and would
therefore yield diverse chitinase sequences. Our previous work also raised the
question whether the potentially chitinolytic planktonic bacterial community (0.2 to 5
µm fraction) consist largely of microbes detaching from chitin-containing particles
and would therefore show similarity to the composition of the zooplankton associated
community. Alternatively these bacteria could be organisms with a planktonic
lifestyle that may primarily profit from the uptake of chitin hydrolysis products as
proposed for planktonic Actinobacteria (Beier and Bertilsson 2011). Based on our
knowledge on the global distribution of freshwater taxa (Glöckner et al. 2000, Zwart
et al. 2002), we further hypothesized that similar chitinolytic bacterial assemblages
would be present in both lakes.
In order to test these hypotheses and to reveal the key players for the
hydrolysis of chitin in the diverse habitats of freshwater lakes, we applied 454
pyrosequencing of 16S rRNA and chiA genes on selected samples, for which high
3.3 Methods
51
chiA gene abundance was detected previously (Köllner et al. 2012). The study extends
knowledge of chitinase diversity in temperate freshwater lakes, and present the first
dataset combining information about different habitats relevant to chitin degradation
within the same freshwater system.
3.3. Methods
3.3.1. Sampling
The sampling procedure and the characteristics of the sampled lakes are
described in detail elsewhere (Köllner et al. 2012). Briefly, LB is an oligotroph, fully
oxic lake with a maximum depth of 259 m and was sampled in mid-May and mid-
September 2009. The South Basin of eutrophic LZ is meromictic and anoxic below
130 m. It has a maximum depth of 200 m. LZ was sampled end of March and end of
October 2009. For each lake, water was sampled from ten different depths at the
deepest point of the basin. Sediment cores were recovered from the two sampling sites
using a gravity corer. The cores were sliced at intervals of 1 centimeter and the
homogenized subsamples were stored at -80°C until processing. Zooplankton and
phytoplankon were sampled during the fall sampling campaigns.
For 454 pyrosequencing of chiA gene sequences we selected samples, for
which high chiA gene abundance was detected via quantitative PCR previously
(Köllner et al. 2012). For LZ, we selected the 5-m and the 10-m water layers sampled
in March and October 2009, respectively. For LZ, the number of chiA genes was
below the limit of detection below the surface waters (Köllner et al. 2012). In the LB
water column, chiA maxima were measured in the 5-m water layer for both samplings,
in May and September 2009. High chiA gene abundance was also observed in the
hypolimnion of LB, where it peaked in the 150-m water layer sampled in May 2009
and the 200-m water layer sampled in September 2009. Zooplankton from the fall
sampling campaigns and the surficial (0 to 1 cm) sediments of both lakes and both
sampling campaigns were also included. The same samples were also subjected to
pyrosequencing of 16S rRNA genes. In addition, the 80-m water sample as
representative for the oxic hypolimnion of LZ and the 170-m water depth as
representative for the anoxic waters of LZ, both sampled in fall, were also subjected
to 454 pyrosequencing of 16S rRNA genes. The description of the samples subjected
to 454 pyrosequencing and the corresponding abbreviations are listed in Table 6.

Rare bacterial community members dominate the functional trait of chitin hydrolysis in freshwater lakes
52
Table 6. List of samples subjected to 454 pyrosequencing targeting the V1-V2 hypervariable regions of the 16S rRNA gene and the chitinase family 18 group A gene (chiA)
Sample ida Sample description Target
LBS 5 m 5 m water depth of LB in May 2009 16S rRNA, chiA
LBS 150 m 150 m water depth of LB in May 2009 16S rRNA, chiA
LBF 5 m 5 m water depth of LB in September 2009 16S rRNA, chiA
LBF 200 m 200 m water depth of LB in September 2009 16S rRNA, chiA
LZS 5 m 5 m water depth of LZ in March 2009 16S rRNA, chiA
LZF 10 m 10 m water depth of LZ in October 2009 16S rRNA, chiA
LZF 80 m 80 m water depth of LZ in October 2009 16S rRNA
LZF 170 m 170 m water depth of LZ in October 2009 16S rRNA
LBS Sed Surficial (0 to 1 cm) sediments of LB in May 2009 16S rRNA, chiA
LBF Sed Surficial (0 to 1 cm) sediments of LB in September 2009 16S rRNA, chiA
LZS Sed Surficial (0 to 1 cm) sediments of LZ in March 2009 16S rRNA, chiA
LZF Sed Surficial (0 to 1 cm) sediments of LZ in October 2009 16S rRNA, chiA
LZF Zoo Zooplankton ≥ 95 µm of LZ in October 2009 16S rRNA, chiA
LBF Zoo Zooplankton ≥ 95 µm of LB in September 2009 16S rRNA, chiA
a LB, Lake Brienz, LZ, Lake Zug. S, Spring sampling, F, Fall sampling
3.3.2. DNA extraction
Total bacterial DNA from zooplankton (≥ 95 µm), water, and sediment
samples were extracted as described previously (Köllner et al. 2012).
3.3.3. 454 pyrosequencing
Titanium Fusion Primers were used to amplify the 16S rRNA gene
hypervariable V1-V2 region (Escherichia coli positions 27-338) from 14 samples
(Table 6): The forward sequencing primer (454A)B-338R (5’-
CGTATCGCCTCCCTCGCGCCATCAGACGATCGTCATGCTGCCTCCCGTAGG
AGT-3’) consisted of the Titanium primer A sequence and one of 14 unique eight-
base barcode (bold, italics) followed by a linker (italics) and the template-specific
sequence (underlined). The reverse primer (454B)-27F (5’-
CTATGCGCCTTGCCAGCCCGCTCAGTCAGAGTTTGATCCTGGCTCAG-3’)
consisted of the Titanium primer B sequence, a linker (italics) and the template-
specific sequence (underlined).
The 14 unique barcode sequences (one for each sample) were taken from
(Hamady et al. 2008) and selected to maximize all way dissimilarity between
3.3 Methods
53
barcodes. Additionally, the primers were checked for secondary structures formation
on http://eu.idtdna.com/Scitools/Applications/unafold/.
The PCR reaction mix contained 1x PCR buffer (Promega, Madison, WI), 0.2
µM of each primer (Microsynth, Balgach, Switzerland), 0.2 mM of each dNTP
(Promega), 3 mM MgCl2, (Microsynth), 0.5 g l-1 bovine serum albumin (Sigma-
Aldrich Chemie GmbH, Switzerland), 1 U Taq polymerase (Promega), and nuclease
– free water (Qiagen AG, Switzerland) in a final volume of 50 µl. The PCR cycling
regime consisted of an initial denaturation step at 94°C for 4 min followed by 30
cycles of denaturation at 94°C for 1 min, annealing at 55°C for 1 min, and extension
at 72°C for 2 min and ending with an extension step at 72°C for 10 min.
For the specific amplification of chiA gene fragments of an expected size of
430 bp, Titanium Fusion Primers carrying chiA – specific primers (Xiao et al. 2005)
were used: The forward primer (454B)B-chir (5’-
CTATGCGCCTTGCCAGCCCGCTCAGACGATCGTTCCSGTCCAGCCGCGSCC
RTA-3’) consisted of the Titanium primer B sequence, one unique barcode (bold,
italics), a linker (italics) and the chir sequence (underlined). The same barcode
sequences as for the amplification of the 16S rRNA gene fragments were used. The
reverse primer (454A)-chif2 (5’-
CGTATCGCCTCCCTCGCGCCATCAGCAGACGGCATCGACATCGATTGG-3’)
consisted of the Titanium primer A sequence, a linker (italics) and the template-
specific sequence (underlined). Each chiA PCR reaction contained 1 x PCR buffer
(Promega), 0.2 µM of each primer (Microsynth), 0.2 mM of each dNTP (Promega),
1.5 mM MgCl2, (Microsynth), 1 g l-1 bovine serum albumin (Sigma), 2 U Taq
polymerase (Promega), 2 (water samples) or 10 ng (sediment and zooplankton
samples) template, and nuclease – free water (Qiagen) in a final volume of 50 µL.
The chiA PCR cycling regime consisted of an initial denaturation step at 95°C for 5
min followed by 35 cycles of denaturation at 94°C for 50 s, annealing at 65°C for 60 s,
and extension at 72°C for 90 s and ending with an extension step at 72°C for 10 min.
Each sample was subjected to amplification of 16S rRNA and chiA gene
fragments in triplicate. The PCR products were separated on a 2% agarose gel and the
specific DNA fragments excised. The triplicate gel slices were pooled and cleaned
using the Wizard SV gel and PCR Clean-up system (Promega) according to the
manufacturer’s instructions. Cleaned products were quantified on a Nanodrop ND-
1000 spectrophotometer (NanaDrop products (NanoDrop Technologies (Thermo
Rare bacterial community members dominate the functional trait of chitin hydrolysis in freshwater lakes
54
Fisher Scientific), Wilmington, DE). The 14 16S rRNA gene subsamples, each
containing 200 ng of DNA, and the 12 chiA subsamples, each containing 120 ng of
DNA, were combined, giving two amplicon pools. The amplicon mixes were further
cleaned by gel purification and subsequently sequenced by Microsynth using Roche’s
454 Titanium sequencing platform. The 16S rRNA amplicon pool was sequenced on
3/16 run (expected number of reads: 72’000) and the chiA amplicon pool was
sequenced on 1/16 run (expected number of reads: 24’000).
3.3.4. Data pre-processing and analysis of 16S rRNA gene sequences
76’278 16S rRNA gene sequences - the median sequence length was 356
bases - were trimmed using mothur 1.21.1 (Schloss et al. 2009): The sequences were
screened for the barcode and the 338R primer sequence (forward primer). Sequences
carrying homopolymers of more than 8 bases in length or ambiguous bases or low
quality sequences with an average quality score below 25 were removed. 68’724
sequences passed this quality screening, i.e., ~90% of the original dataset, and 48’155
sequences were unique. The unique sequences were aligned against a SILVA-based
bacterial reference alignment provided by www.mothur.org. Sequences were screened
for correct position (end of the sequence at aligned position 6333) and maximum
overlap, and columns containing only gaps were removed. Subsequently the
alignment was minimized to the overlapping sequence space. Preclustering was used
to reduce sequence noise (Huse et al. 2010). Next, sequences containing chimeras
were scrapped. After phylogenetic classification using the mothur-formatted RDP
taxonomy training set (http://www.mothur.org/wiki/RDP_reference_files), sequences
assigned to Archaea (70 sequences) and sequences originating from chloroplasts
(2’588 sequences) were excluded from further analysis. With this final pre-processing
step the dataset still contained ~70% of the original dataset, i.e., 54’854 sequences.
After computation of the distance matrix, the 16S rRNA sequences were clustered
into operational taxonomic units (OTUs) using the average neighbor algorithm and
sequence similarity cutoff of 97%, which was used as a proxy for species boundaries
(Stackebrandt and Goebel 1994). Based on the 97% similarity OTU definitions,
rarefaction curves and various diversity and richness metrics were calculated. The
percentage of coverage was calculated by Good’s method with the formula [1– (n/N)]
x 100, where n is the number of OTUs in a sample represented by one sequence
(single-read OTUs) and N is the total number of sequences in that sample (Good
3.3 Methods
55
1953). For similarity analysis of bacterial communities between samples,
dendrograms were constructed based on 16S rRNA gene OTUs. Bray-Curtis (Bray
and Curtis 1957) and Yue & Clayton theta (Yue and Clayton 2005) similarity
coefficients were applied.
3.3.5. Data pre-processing and analysis of chiA sequences
21‘890 chiA sequences – the median sequence length was 432 bases - were
trimmed using mothur. The sequences were screened for presence of forward and
reverse primer motifs and sequences without match to both were removed. Any
sequences containing homopolymers of more than 8 bases in length or ambiguous
bases or low quality sequences that have an average quality score below 25 were
likewise excluded from further analyses. 11’062 putative chiA sequences passed this
quality screening. The sequences were translated in all three forward reading frames.
The amino acid sequences were subjected to a BLASTP search (Altschul et al. 1997)
against the protein database refseq_protein provided by http://blast.ncbi.nlm.nih.gov/
using the BLOSUM62 matrix and an E-value threshold of 1e-7. Only continuous
amino acid sequences (no stop codons), which showed an alignment length of at least
100 amino acids and a percentage of identity of at least 45% with the reference
sequences, were kept in the dataset. In a second step the 9’716 amino acid sequences
which met these quality criteria, were blasted against a reference protein database
containing 88 bacterial chitinase sequences spanning a broad range of taxa, applying
the same screening criteria as above. Finally, 9’700 sequences showed alignments to
bacterial chitinases in the refseq-protein database and exceeded the screening
thresholds. The corresponding nuclecotide sequences were selected from the original
chiA pyrosequencing dataset and the unique sequences (4’076) filtered using mothur.
The nucleotide sequences were aligned and used as seed alignment for the amino acid
sequences. The alignments were created with the program HMMer v2.3 (Eddy 1998).
Distance matrices were generated in Phylip format using ARB (Ludwig et al. 2004).
OTU-based analyses were performed analogous to the analysis of the 16S rRNA gene
sequences described above. As there exist contradicting reports regarding the
correlation between the 16S rRNA phylogeny and the phylogeny of bacterial
chitinases (Cottrell et al. 2000, Ramaiah et al. 2000, Xiao et al. 2005), the results were
evaluated for different sequence similarity levels of 95%, 90%, and 80%. A neighbor-
joining tree with the unique chitinase sequences (3’062) and 88 reference sequences
Rare bacterial community members dominate the functional trait of chitin hydrolysis in freshwater lakes
56
was constructed using ARB (Ludwig et al. 2004). Reference sequences were selected
from GenBank to represent chitinases commonly described in the literature and
according to BLASTP hits obtained for chitinases found in this study. Closely related
sequences were grouped and the grouped sequences compared to the OTUs formed at
the different sequence similarity levels. The majority of sequences that clustered in
distinct branches in the ARB tree were also assigned to a specific OTU at each of the
different sequence similarity levels used for OTU definition. For reasons of
simplicity, results of chitinase sequence analysis are only shown for OTUs based on a
sequence similarity level of 90%.
De novo phylogenetic trees, which contained sequences of abundant chitinase
OTUs and a subset of reference sequences, were constructed using the program Mega
5.05. Abundant OTUs were defined as OTUs, which comprised > 3% of the
sequences relative to the total chitinase sequence pool obtained for the respective
sample. The sequences were aligned by ClustalW and phylogenetic trees were
constructed based on the neighbor-joining, the maximum-parsimony, and the
maximum likelihood method.
3.4. Results
3.4.1. Bacterial community structure
In total, 76’278 pyrosequencing reads of the V1-V2 region of the 16S rRNA
gene were obtained from the different lakes and lake habitats (water, sediment, and
zooplankton). Of this initial sequence pool, 54’854 high quality bacterial sequences
were retained for analysis and assigned to bacterial phyla. For the water samples of
LB and the oxic water samples of LZ, the dominant bacterial group was
Actinobacteria (34% to 66% of all sequences) (Fig. 13). The second most abundant
group was β-Proteobacteria (14% to 27%). Other abundant sequences belonged to the
groups Bacteroidetes (up to 14%), α-Proteobacteria (up to 12%), and Cyanobacteria
(up to 6%). γ-Proteobacteria became more abundant in the hypolimnion samples of
LB (up to 8%) and LZ and in the anoxic water sample (LZF 170 m, 10%). The most
abundant bacterial group for LZF 170 m was the β-Proteobacteria (38%), of which
67% were Burkholderiales, followed by Actinobacteria (27%) and Bacteroidetes
(12%). Burkholderiales was the most abundant order within the β-Proteobacteria for
all lake habitats.

3.4 Results
57
In the sediment samples of LB, the dominant bacterial clade was the β-
Proteobacteria (25% for both LBS and LBF), followed by the α-Proteobacteria (13%
(LBS) and 16% (LBF)). Other abundant bacterial groups were γ-Proteobacteria,
Acidobacteria, Bacteroidetes, and δ-Proteobacteria. In the sediment samples of LZ,
the dominant bacterial clades were the δ-Proteobacteria (22% (LZS) and 25% (LZF)),
the Bacteroidetes (20% for both LZS and LZF) and the Firmicutes (8% (LZS) and
14% (LZF)).
Bacterial sequences obtained for the zooplankton sample of LB were
dominated by Bacteroidetes (47%). In the zooplankton sample from LZ one quarter of
the bacterial sequences belonged to Cyanobacteria and the other sequences were
equally distributed over Alpha- (18%), Betaproteobacteria (12%), Gamma- (15%), δ-
Proteobacteria (10%), and Bacteroidetes (12%).
In contrast to the water samples, Actinobacteria were underrepresented in the
sediments. They comprised only 3 to 5% of the obtained 16S rRNA gene sequences.
Only two reads, one in LBS Sed and one in LZF Sed, were assigned to the genus
Streptomyces, which is assigned a central role as chitin degrader in soil habitats and
was also detected in Antarctic lake sediments (Xiao et al. 2005, Bhattacharya et al.
2007, Hjort et al. 2010, Nazari et al. 2011). However, within the Bacteroidetes high
numbers of Flavobacteria sequences were detected, in particular for the zooplankton
of LB, for which 41% of the 16S rRNA gene sequences were of the family
Flavobacteriaceae. In all other samples, Flavobacteria represented from 1 to 7%
(LZF Zoo) of the 16S rRNA gene sequences. Cytophaga sequences only comprised 1
to 4% of the 16S rRNA gene pool obtained for the diverse lake habitats.
Flavobacteria together with Cytophaga are thought to play a crucial role in the
hydrolysis of chitin in aquatic environments (Cottrell and Kirchman 2000, Beier and
Bertilsson 2011). The most abundant taxonomic family within the Bacteroidetes in
the hypolimnion and the surficial sediments of LB, for which high chiA gene
abundances were detected in a previous study (Köllner et al. 2012), was the
Chitinophagaceae.
For the well-known chitinolytic families Vibrionaceae (Svitil et al. 1997) and
Enterobacteriaceae (Suzuki et al. 2002) of the class γ-Proteobacteria, only two and
three reads, respectively, were detected. Aeromonadaceae (Lan et al. 2006) was only
associated with LBF Zoo (3%) and Alteromonadaceae (Tsujibo et al. 1992) only with
the sediments (~1% of the 16S rRNA gene sequence pool). In the present study most

Rare bacterial community members dominate the functional trait of chitin hydrolysis in freshwater lakes
58
of the γ-Proteobacteria sequences were obtained for the Xanthomonadaceae.
Chitinolytic species belonging to Xanthomonadaceae have been described for lake
sediments and soils (Metcalfe et al. 2002, Xiao et al. 2005, Hjort et al. 2010). Other
chitinolytic bacteria described previously for freshwater belong to the phylum
Firmicutes, e.g, Bacillus spp. (Hobel et al. 2005, Brzezinska and Donderski 2006).
Sequences assigned to Firmicutes presented 3 to 14% of the total 16S rRNA gene
sequence pool in the surficial sediments of both lakes and in zooplankton of LBF
(3%), but were less present in the water samples. The most abundant class within the
Firmicutes was however not Bacilli but Clostridia, which were prominent in the
sediments (up to 12%). Chitinolytic Clostridia are known, although not commonly
described for aquatic ecosystems (Timmis et al. 1974, Morimoto et al. 1999).
Fig. 13. Bacterial phyla in water, sediment, and zooplankton samples of Lake Brienz (LB) and Lake Zug (LZ). For abbreviations and description of the analyzed samples see Table 6. For phylogenetic classification the mothur-formatted RDP taxonomy training set (http://www.mothur.org/wiki/RDP_reference_files) was used.
3.4.2. OTU-based diversity analyses of 16S rRNA gene and chitinase sequences
Distance matrices were generated for the 16S rRNA gene and the chitinase
protein sequences using mothur and ARB (Phylip-formatted), respectively, and used
to group 16S rRNA gene and chitinase sequences into OTUs. At a sequence similarity
level of 97% (species level, (Stackebrandt and Goebel 1994)), 8’573 16S rRNA OTUs

3.4 Results
59
were present in the complete dataset. 6’153 OTUs, i.e., 72%, were single-read OTUs.
6’934 OTUs, i.e., 81%, were unique to a single sample. The highest number of unique
OTUs (1’597 OTUs) was found in LBF Sed.
The affiliation of chitinase sequences to OTUs at the sequence similarity
levels of 95%, 90%, and 80% was compared to phylogeny observed in a neighbor-
joining tree constructed with ARB from an alignment of 3’062 unique chitinase
sequences. The majority of sequences that clustered in distinct branches in the ARB
tree were also assigned to a specific OTU at each of the different sequence similarity
levels used for OTU definition. At a sequence similarity level of 90%, 273 chitinase
OTUs were detected. 163 OTUs, i.e. 60%, were single-read OTUs. 198 OTUs, i.e.,
73%, were unique to a sample. As for the 16S rRNA gene sequences, by far the
highest number of unique OTUs (71 OTUs) was found in LBF Sed.
For the 16S rRNA gene sequences, Good’s coverage was > 90% for the water
samples and the zooplankton sample of LB. For the zooplankton sample of LZ, the
coverage was 80%.
For the chitinase sequences, Good’s coverage was > 95% for the water
samples and the zooplankton sample of both lakes although a mere 49 chitinase
sequences was obtained for the zooplankton sample of LB.
For both the 16S rRNA gene and the chitinase sequences, the lowest Good’s
coverage values were obtained for the sediment samples, especially for LB, which
were < 60% for the 16S rRNA gene and < 87% for the chitinase sequences. Thus, the
interpretation of the 16S rRNA gene and chitinase sequences for the sediments and
the chitinase sequences for the zooplankton sample of LB was done with caution as
the number of obtained sequences was too low to fully represent the diversity in the
sampled population. Rarefaction curves for the 16S rRNA gene sequences and for the
chitinase sequences are shown in Fig. 14.

Rare bacterial community members dominate the functional trait of chitin hydrolysis in freshwater lakes
60
Fig. 14. R
arefaction curves for the 16S rR
NA
gene sequences at a sequence similarity level of 97%
(A) and for the chitinase
sequences at a sequence similarity level of 90%
(B) obtained for the w
ater, sediment, and zooplankton sam
ples of Lake B
rienz (LB
) and L
ake Zug (L
Z). W
ater samples w
ere plotted as light grey lines, LB
Sed as thin dashed lines, L
Z S
ed as thick dashed lines, LB
F
Zoo as thin black lines, and L
ZF
Zoo as thick black lines. A
low num
ber of chitinase sequences were obtained from
sample L
BF Z
oo (49), and the corresponding rarefaction curve is therefore not visible on the scale used. F
or abbreviations and description of the sam
ples see Table 6.
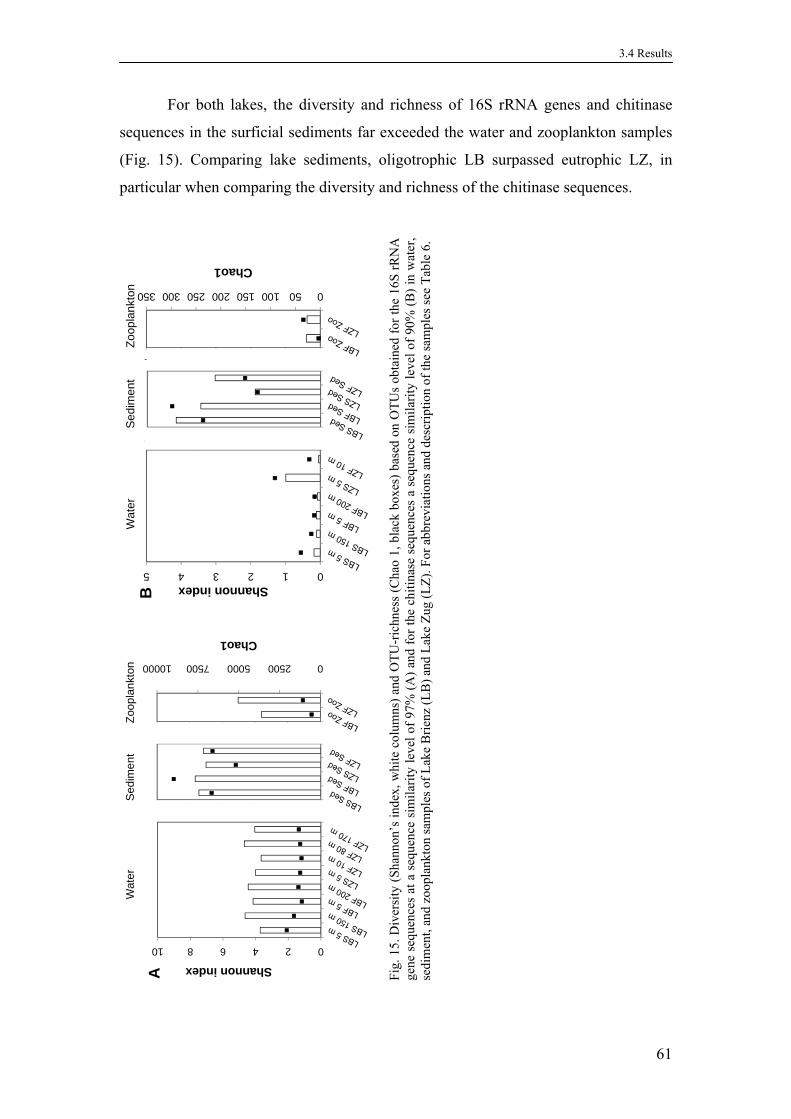
3.4 Results
61
For both lakes, the diversity and richness of 16S rRNA genes and chitinase
sequences in the surficial sediments far exceeded the water and zooplankton samples
(Fig. 15). Comparing lake sediments, oligotrophic LB surpassed eutrophic LZ, in
particular when comparing the diversity and richness of the chitinase sequences.
025005000750010000
0246810
Chao1
0246810
Shannon indexA
0246810
Wat
erS
edim
ent
Zoo
plan
kton
050100150200250300350
012345
Chao1
012345Shannon index
B
012345
Wat
erS
edim
ent
Zoo
plan
kton
Fig
. 15.
Div
ersi
ty (
Sha
nnon
’s i
ndex
, whi
te c
olum
ns)
and
OT
U-r
ichn
ess
(Cha
o 1,
bla
ck b
oxes
) ba
sed
on O
TU
s ob
tain
ed f
or th
e 16
S r
RN
A
gene
seq
uenc
es a
t a
sequ
ence
sim
ilari
ty l
evel
of
97%
(A
) an
d fo
r th
e ch
itina
se s
eque
nces
a s
eque
nce
sim
ilari
ty l
evel
of
90%
(B
) in
wat
er,
sedi
men
t, an
d zo
opla
nkto
n sa
mpl
es o
f L
ake
Bri
enz
(LB
) an
d L
ake
Zug
(L
Z).
For
abb
revi
atio
ns a
nd d
escr
iptio
n of
the
sam
ples
see
Tab
le 6
.

Rare bacterial community members dominate the functional trait of chitin hydrolysis in freshwater lakes
62
3.4.3. Similarity of 16S rRNA gene and chitinase OTUs between diverse lake
habitats
In order to compare the similarity of bacterial communities and chitinases
between diverse lake habitats, cluster analyses were performed based on chitinase and
16S rRNA gene OTU abundance data. The Bray-Curtis and the Yue & Clayton theta
similarity coefficients featured essentially identical topologies. The dendrograms
based on the Bray-Curtis similarity coefficient are shown in Fig. 16. Based on 16S
rRNA gene OTU abundance data, the hypolimnion samples from LB in spring and
fall were most similar and grouped with the oxic hypolimnion sample of LZ (Fig.
16A).
Fig. 16. Dendrogram showing the similarity of 16S rRNA gene (A) and of chitinase (B) sequences between water, sediment, and zooplankton samples of Lake Brienz (LB) and Lake Zug (LZ) using shared OTUs for a sequence similarity level of 97% and 90%, respectively.
3.4 Results
63
The anoxic communities of the 170 m sample of LZ were distinct from the rest of the
water samples. For both lakes, the bacterial communities associated with the
zooplankton and the sediment samples appeared to be distinct from the water samples,
whereas the sediments of the same lake but from different seasons were grouped. In
comparison, based on chitinase data, the sediment of LZ sampled in spring shared
more OTUs with the spring surface water than with the sediment sampled in fall (Fig.
16B). For LZ, the most similar samples were the zooplankton and the surface water
sampled in fall.
3.4.4. Chitinases detected in diverse lake habitats
While the total diversity across all samples was considerable, only a few
OTUs dominated the chitinase libraries for each individual sample. Fig. 17 shows the
distribution of abundant chitinase OTUs. Abundant OTUs were defined as OTUs,
which comprised > 3% of the sequences relative to the total chitinase sequence pool
obtained for the respective sample. 17 OTUs, which together accounted for 93% of
the obtained chitinase sequences, achieved dominance according to this definition.
Just two OTUs, i.e., OTU1, which was found predominant for the water samples of
LB, and OTU2, which was found predominant in all habitats of LZ, together made up
86% of all sequences. However, the different library sizes and the varying coverage of
the libraries are not considered in this perspective.
In all the LB water samples, 98% to 99% of the sequences were allocated to
OTU1. Sequences of OTU1 could be assigned to a chitinase A sequence of the
bacterial strain Stenotrophomonas maltophilia K279a (Fig. 18) sharing 87% to 100%
sequence identity according to BLASTP. OTU1 also made up 12% of the chitinase
sequences in the LZS 5-m water sample, but was not detected in any other LZ sample
nor in the LB sediment and zooplankton samples. 16S rRNA gene sequences assigned
to Stenotrophomonas were only detected in LB samples, except for one and two reads
in LZS 5-m water and LZS sediment, respectively. The highest number of
Stenotrophomonas sequences was obtained for the 5-m water sample of LBF (3% of
the 16S RNA gene sequences obtained).

Rare bacterial community members dominate the functional trait of chitin hydrolysis in freshwater lakes
64
0%
10%
20%
30%
40%
50%
60%
70%
80%
90%
100%
Pro
po
rtio
ns
ZooplanktonWater Sediment
Others
OTU17
OTU16
OTU15
OTU14
OTU13
OTU12
OTU11
OTU10
OTU9
OTU8
OTU7
OTU6
OTU5
OTU4
OTU3
OTU2
OTU1
Fig. 17. Proportions of abundant chitinase OTUs for a sequence similarity level of 90% of water, sediment, and zooplankton samples of Lake Brienz (LB) and Lake Zug (LZ). Abundant OTUs were defined as OTUs, which comprised > 3% of the sequences relative to the total chitinase sequence pool obtained for the respective sample. For abbreviations and description of the analyzed samples see Table 6.
80% to 99% of the sequences in the surface water samples and the
zooplankton sample of LZ were allocated to OTU2. OTU2 was the most abundant
OTU also for the surficial sediments sampled in spring and fall, where it made up
65% and 41% of the sequences, respectively. Sequences of OTU2 were found to be
most similar to Bacilli chitinases, but with less than 50% sequence identity according
to BLASTP search against the protein database refseq_protein provided by
http://blast.ncbi.nlm.nih.gov/. Thus, this OTU likely represents a novel bacterial
chitinase lineage. For the zooplankton sample of LB, a mere 49 chitinase sequences
were obtained. 45 were assigned to one unique OTU, i.e., OTU3, and the allocated
sequences showed up to 79% similarity with actinobacterial chitinases according to
BLASTP.
De novo phylogenetic trees were constructed with sequences representing each
of the 17 abundant chitinase OTUs, related reference sequences according to
BLASTP hits and reference chitinases commonly described for diverse environments.
3.4 Results
65
Neighbor-joining, maximum-likelihood and maximum-parsimony algorithms resulted
in essentially identical topologies. The neighbor-joining tree is shown in Fig. 18. The
chitinase sequences were placed into three major clusters which were also observed in
the ARB tree with the 3’062 unique chitinase sequences. In cluster I mainly chitinases
detected for the water and sediment samples of LB, including OTU1, were grouped
with known chitinases of the Xanthomonadaceae, specifically Stenotrophomonas.
Cluster II contained OTU2, the predominant chitinase in the zooplankton, water, and
sediment samples of LZ. In cluster III chitinases detected for the sediments of both
lakes were grouped with known chitinases from Actinobacteria. Analyzing the
affiliation of chitinases sequences that were present with more than 5 sequences per
OTU and sample, instead of a detected proportion of > 3% per sample, additional
chitinases affiliated with chitinases of Janthinobacterium lividum and of
Micromonosporaceae were detected (Fig. 18). Less than 1% of the 16S rRNA gene
samples obtained for a sample were assigned to the genus Janthinobacterium
(maximum of 16 reads for LBS Sed). However, within the the oxic water samples the
proportion of Burkholderiales was highest for the 5-m water samples of LBS (23%)
and LZS (19%) (Fig. 18).
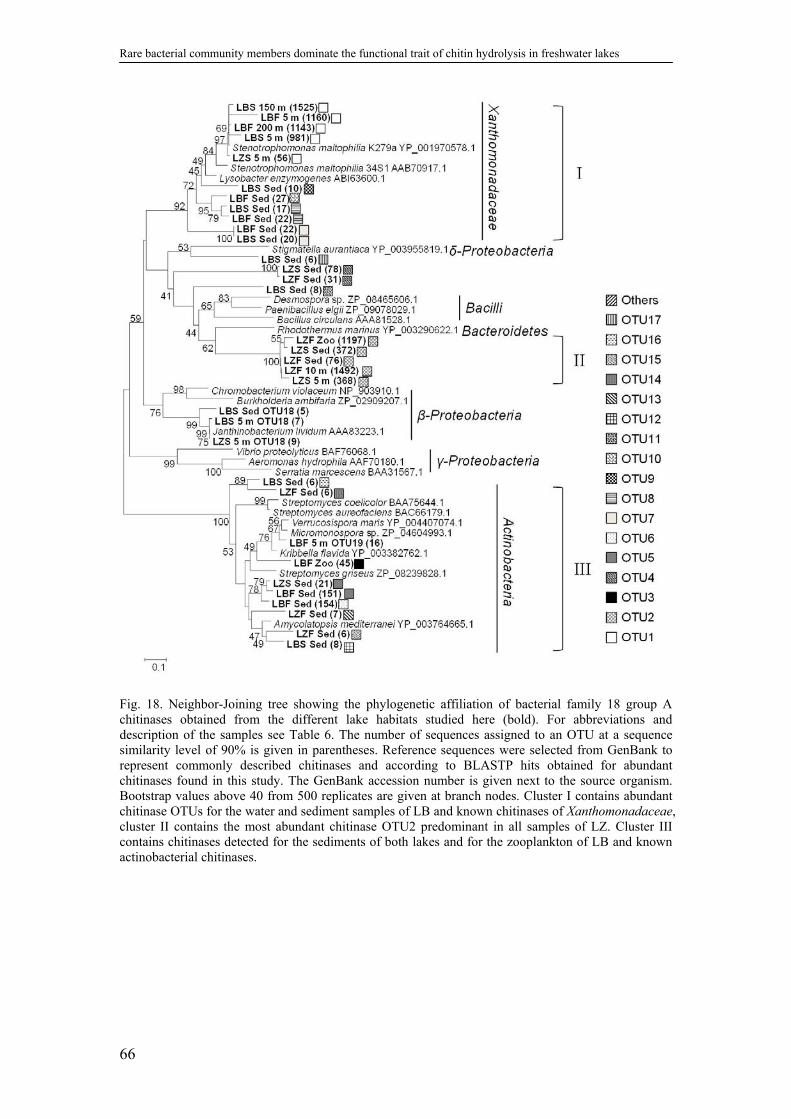
Rare bacterial community members dominate the functional trait of chitin hydrolysis in freshwater lakes
66
Fig. 18. Neighbor-Joining tree showing the phylogenetic affiliation of bacterial family 18 group A chitinases obtained from the different lake habitats studied here (bold). For abbreviations and description of the samples see Table 6. The number of sequences assigned to an OTU at a sequence similarity level of 90% is given in parentheses. Reference sequences were selected from GenBank to represent commonly described chitinases and according to BLASTP hits obtained for abundant chitinases found in this study. The GenBank accession number is given next to the source organism. Bootstrap values above 40 from 500 replicates are given at branch nodes. Cluster I contains abundant chitinase OTUs for the water and sediment samples of LB and known chitinases of Xanthomonadaceae, cluster II contains the most abundant chitinase OTU2 predominant in all samples of LZ. Cluster III contains chitinases detected for the sediments of both lakes and for the zooplankton of LB and known actinobacterial chitinases.

3.5 Discussion
67
3.5. Discussion
In agreement with previous studies of diverse freshwater ecosystems and the
suggested global distribution of freshwater bacterial clades (Glöckner et al. 2000,
Zwart et al. 2002, Humbert et al. 2009, Vaz-Moreira et al. 2011), the dominant
bacteria in the two contrasting lakes were Actinobacteria, β-Proteobacteria and
Bacteroidetes. The bacterial communities sampled from the same water layer, i.e.,
epilimnion versus hypolimnion, but in different seasons were similar, with the anoxic
water sample of LZ harbouring a unique bacterial community (Fig. 13 and Fig. 16).
Water-layer-specific bacterioplankton communities were also observed for ARISA
profiles of 16S rRNA gene fragments (Köllner et al., submitted). The spatial habitat
heterogeneity – light-, temperature-, and oxygen-gradients, availability of organic
matter and nutrients – was the main determinant shaping the bacterial communities in
the lake water.
In contrast to the shared pattern of bacterial phyla in the water samples of the
two studied lakes, the potential for chitin hydrolysis seemed to be mainly restricted to
a single, but different, group of chitinases specific for each lake. The predominant
group of chitinases in the waters of LB (OTU1) showed high similiarity and for some
sequences even identity to a chitinase A sequenced from Stenotrophomonas
maltophilia K279a. Stenotrophomonas maltophilia strains were found to be prominent
colonizers of chitin residues in soil, excreting a high level of chitinase (Krsek and
Wellington 2001).
Another less abundant group of chitinases (< 3%) in the surface waters of both
lakes could be identified as chitinases of Janthinobacterium lividum of the order
Burkholderiales (Fig. 18). Burkholderiales was the most abundant order within the β-
Proteobacteria for all lake habitats. In enrichment experiments on zooplankton chitin
in surface water of LB and LZ, the enriched bacterial species were also assigned to
families of the Burkholderiales, i.e., Comamonadaceae and Oxalobacteraceae, to the
latter Janthinobacterium lividum belongs to (Wunderlin 2009). The detected
chitinases appeared to originate from rare species in the bacterial communities of the
diverse lake habitats, only up to 1 and 3% of the 16S rRNA sequences obtained were
assigned to the genera Janthinobacterium and Stenotrophomonas, respectively.
However, chitinase sequences assigned to Janthinobacterium lividum and
Rare bacterial community members dominate the functional trait of chitin hydrolysis in freshwater lakes
68
Stenotrophomonas maltophilia were also detected in Antarctic lake sediments (Xiao
et al. 2005) and freshwater hot springs (Hobel et al. 2005).
In contrast to LB, the predominant group of bacterial chitinases in the water
samples of LZ was also predominant in the zooplankton sample and the surficial
sediments, and is thus more likely to represent a key player for chitin degradation in
this lake. This group of chitinases could not be assigned to known bacterial chitinases.
The sequences branched closest to a chitinase found in a species of the phylum
Bacteroidetes (Fig. 18), but the similarity was low (36%).
In the sediment of LB sampled in fall, the majority of the chitinase sequences
(51%) were allocated to actinobacterial chitinases (Fig. 18). Actinobacterial chitinases
were also found in the surface water sample of LB in fall, however, they constituted a
minor fraction (< 3%) compared to the total number of chitinase sequences detected
for this sample and were not detected in the other water samples. The lack of
actinobacterial chitinases in the lake water samples was contrary to our expectations.
Actinobacteria are known as important chitinolytic agents especially for soil habitats
(Metcalfe et al. 2002, Bhattacharya et al. 2007) and chitinolytic Actinobacteria were
also isolated from lake sediments (Xiao et al. 2005). Since Actinobacteria were, in
agreement with previous findings (Glöckner et al. 2000, Humbert et al. 2009),
abundant in the studied lakes according to our 16SrRNA gene based analysis, we
expected to detect actinobacterial chitinases in the water samples of both lakes, but
this was not the case. In accordance with the observed lack of actinobacterial
chitinases in the water samples, a recent study provided evidence of commensal
planktonic Actinobacteria in lakes lacking the ability to hydrolyze chitin but profiting
from the chitin hydrolysis products supplied by other bacterial groups (Beier and
Bertilsson 2011). Beier et al. suggested Flavobacteria as significant chitinolytic
agents in freshwater lakes as they were observed in dense clusters on chitin particles
(Beier and Bertilsson 2011).
Whereas the predominant chitinases in the water columns were distinct
between LB and LZ, some chitinase OTUs detected for the sediments were assigned
to similar actinobacterial chitinases (Fig. 18), despite of the contrasting sediment
properties. Apart from the contrasting trophic levels of the water columns the 0- to 1-
cm sediment layer of LB is still oxic (Müller et al. 2007), whereas the LZ sediments
are anoxic. However, for the sediments of both lakes, chitinase activity was detected
in a previous study, in contrast to the water samples, for which the chitinase activity
3.5 Discussion
69
was below the limit of detection (Köllner et al. 2012). In the sediments, elevated
concentrations of chitin of diverse origin - detrital material originating from algae
(diatoms) and arthropods (insects and crustaceans), crustacean molts and shed insect
exoskeletons – are expected to be deposited. In general, sediments (as well as soils)
harbor a far larger microbial diversity compared to aquatic habitats (Torsvik et al.
2002). Accordingly, it is not surprising that the highest diversity of bacterial
chitinases was detected in the sediments of the studied lakes.
However, for the diverse lake habitats studied here, the ability to hydrolyze
chitin seemed to be dominated by a restricted number of bacterial species. Moreover,
the presented evidence suggests that chitinolytic agents were comparatively rare
members of the total bacterial communities detected in the diverse lake habitats, at
least for oligtrophic LB as we could not assign the predominant chitinases of LZ to a
bacterial species. Pronounced dominance of single chitinolytic phylotypes was
observed both in zooplankton and water samples. This is in agreement with results
from a recent publication that showed that in microcosm experiments with lake water,
the absence of a certain species was correlated with a loss of the function of chitin and
cellulose degradation (Peter et al. 2011). This would indicate that planktonic
freshwater bacterial communities themselves harbor a limited diversity of chitinolytic
bacteria. Probably, a much higher number of organisms are able to metabolize the
hydrolysis products released to the water column by chitinases acting on chitinous
particles settling through the water column. It is intriguing in this respect that the
dominant group of water column chitinases in LZ also dominated the zooplankton-
associated library, while this was not the case in LB. In LB the water-dominant OTU1
was abundant neither in sediment nor in the zooplankton sample, the main sites of
chitinolytic activity (Köllner et al. 2012). The importance of bacterial attachment to
and from particles, e.g., zooplankton, has been demonstrated, so one would expect a
certain overlap in species composition (Grossart et al. 2010). For LZ, up to 14 and
25% of the chitinase OTUs detected in the sediment (spring) and the zooplankton
sample, respectively, were also detected in the surface waters (Fig. 16B). In contrast
however, in LB the dominant Stenotrophomonas-like chitinases which were not
detected in the zooplankton sample must belong to organisms with a different
ecological strategy. It is possible that the host organisms are profiting from chitinase
hydrolysis products released elsewhere rather than being directly involved in chitin
degradation, similar to what has been reported for Actinobacteria (Beier and

Rare bacterial community members dominate the functional trait of chitin hydrolysis in freshwater lakes
70
Bertilsson 2011). Further research is required to determine the cause of these
contrasting results.
Of course, as with all PCR-based analyses, preferential amplification of
specific DNA fragments could have influenced the low evenness and diversity of
chitinase sequences observed in this study. This is a caveat inherent also to 454
pyrosequencing (Vaz-Moreira et al. 2011) and results should not be interpreted
quantitatively without extreme caution. However, the observed differences between
the studied environments are so pronounced that we do not consider it likely that they
are based on methodological artifacts. Another limitation is the relatively short read
length of the current 454 pyrosequencing methodology (300 to 500 bp), which
implicates a lower level of phylogenetic resolution compared to clone libraries of
larger gene fragments, e.g. from near full-length rRNA gene amplification. On the
other hand, even large clone libraries (100s of clones) generally fail to recover the
total diversity of the targeted microbial communities (Pearce 2008, Jones et al. 2009)
and are furthermore very time-consuming and laborious. The merits of 454
pyrosequencing lie in the detection of a high number of sequences and rare sequences
with a comparatively small expense of time and labor. However, the bioinformatics
required for analysis, specifically of functional gene sequences, is currently not trivial.
Sequences of bacterial chitinases are highly diverse probably due to lateral
gene transfer between organisms (Hunt et al. 2008). Thus, it is impossible to amplify
all the bacterial chitinases with a single pair of PCR primers. Previous studies on
bacterial chitinases targeted subsets of bacterial chitinases by using specific PCR
primers or combined sets of different primer pairs (Cottrell et al. 2000, Williamson et
al. 2000, Hobel et al. 2005). We applied a primer pair, which was reported to target
chitinase family 18 group A (chiA) gene fragments from a broad range of chitinolytic
bacteria, including species of Actinobacteria, β- and γ-Proteobacteria and the
Cytophaga-Flavobacterium-Bacteroides group (Xiao et al. 2005), and the capacity to
amplify a broad range of chitinase genes was confirmed by our findings. However, we
cannot exclude that the applied primer pair failed at or negatively biased the
amplification of significant groups of bacterial chitinases, e.g., flavobacterial
chitinases.
To summarize, whereas the two contrasting lakes shared the predominant
bacterial classes, the diversity and distribution of the detected bacterial chitinases
were found to be distinct between lakes and habitats. This suggests that the

3.5 Discussion
71
chitinolytic bacteria are a functional group that is strongly shaped by the
environmental parameters and ecological conditions of its habitat. Whereas the
detected chitinases in the diverse lake habitats of LB could be assigned to chitinases
of Stenotrophomonas maltophilia, Janthinobacterium lividum and Actinobacteria, the
predominant group of chitinases in LZ could not be assigned to known bacterial
chitinases. Future work has to isolate the chitinolytic bacteria or obtain genomic
information by other means. In conclusion, as a restricted number of bacterial
chitinases, which were assigned to rare members of the bacterial communities in the
diverse lake habitats, was detected. We propose that their presence is essential for the
functional trait of chitin hydrolysis in freshwater lakes.


4. IMPACT OF AMINO COMPOUNDS AND ORGANIC
MATTER DEGRADATION STATE ON THE VERTICAL
STRUCTURE OF LACUSTRINE BACTERIA
Krista E. Köllner, Dörte Carstens, Carsten J. Schubert, Josef Zeyer, and Helmut
Bürgmann
submitted to Aquatic Microbial Ecology
Contributions of the authors:
The manuscript was written by Krista Köllner. Krista Köllner did the microbial and
the statistical analyses and the interpretation of the data. Dörte Carstens measured the
concentrations of amino compounds, analyzed the CI (based on chlorophyll) and the
DI (based on protein amino acids) and contributed to the interpretation of the data.
Carsten Schubert and Josef Zeyer significantly contributed to the interpretation of the
data and corrected the manuscript. Helmut Bürgmann corrected the manuscript and
significantly contributed to the conception and the interpretation of the presented
study.
Impact of amino compounds and organic matter degradation state on the vertical structure of lacustrine bacteria
74
4.1. Abstract
In order to determine how concentration, composition, and degradation state
of particulate organic matter (POM) influence lacustrine bacteria, we analyzed the
changes in bacterial abundance and community structure along the water columns of
two contrasting deep lakes, both located in Switzerland. Lake Brienz is oligotrophic
and fully oxic while Lake Zug is eutrophic and partially anoxic. Automated ribosomal
intergenic spacer analysis was conducted for free-living (> 0.2, < 5 µm) and particle-
associated (> 5 µm) bacteria. Cluster analysis showed that the lakes comprised
distinct bacterial communities (BCs). However, the BCs of both lakes were structured
with depth. For the free-living BCs, redundancy analysis and forward selection of
explanatory variables identified the Chlorin Index, an indicator for the degradation
state of primary produced POM, and temperature as the main environmental
determinants of the vertical community shifts. In contrast, the particle-associated BCs
appeared less influenced by the POM degradation state and more directly affected by
seasonal dynamics. For both bacterial size fractions, other degradation indices such as
the ratios between particulate amino acids and particulate amino sugars performed
less well as predictors for the BC structure. For both lakes, the bacterial cell number
correlated significantly with the concentrations of particulate amino compounds and
the Chlorin Index. The present study shows that not only the amount of organic
matter, but also its degradation state shape the abundance and composition of lake
bacterioplankton.
4.2. Introduction
One of the big challenges in aquatic microbial ecology is to derive the most
important environmental factors that structure the bacterial community composition
(BCC) and to relate the BCC dynamics to specific ecosystem functions. This is a
prerequisite for creating predictive aquatic ecosystem models. Culture-independent
molecular methods have facilitated the characterization of bacterial communities (BCs)
in lakes over the last decades (Hiorns et al. 1997, Casamayor et al. 2000, Lindström
2000, Van Der Gucht et al. 2001, Zwart et al. 2002, Yannarell and Triplett 2004,
Newton et al. 2011). By now, several studies are available that have determined
environmental factors that constrain the BCC in these freshwater systems. For

4.2 Introduction
75
instance, the availability of nutrients and organic carbon (Yannarell and Triplett 2004)
and the physicochemical characteristics of a lake, such as pH, temperature (Methé &
Zehr 1999, Lindström et al. 2005, Rösel et al. 2012), and oxygen concentrations
(Shade et al. 2008) have been reported to shape the BCC. Biotic factors such as
bacterivorous grazing, phage dynamics, and phytoplankton succession have also been
demonstrated to determine BCC (Jürgens et al. 1999, Šimek et al. 2001, Kent et al.
2004, Kent et al. 2006, Salcher et al. 2011, Zeng et al. 2012).
A crucial function of aquatic bacteria is the degradation of organic matter and
the resulting recycling of nutrients and carbon (Azam et al. 1983, Sherr and Sherr
1991). 30-60% of the planktonic primary production is mineralized by heterotrophic
bacteria (Biddanda et al. 1994, Del Giorgio et al. 1997). In aquatic environments, the
organic matter is divided into dissolved organic matter (DOM) and particulate organic
matter (POM). In lakes, the POM fraction is estimated to contribute approximately
10% of the total organic matter and mainly consists of polymeric, high molecular
weight compounds (Siuda and Chróst 2002). Amino sugars (ASs) and amino acids
(AAs) are building blocks of a number of these biopolymers. Among these
biopolymers are proteins, polysaccharides exuded from phytoplankton (Giroldo et al.
2003) and chitin, which is synthesized by diverse aquatic organisms (crustaceans,
fungi, diatoms).
ASs and AAs have been used to indicate the quality and origin of POM. For
instance, the relative abundance of specific particulate ASs and AAs can indicate the
degradation state of POM (Lee and Cronin 1984, Haake et al. 1992, Dauwe and
Middelburg 1998). In a previous study on the lakes studied here (see below), the
ratios between the particulate ASs glucosamine (GlcN) and galactosamine (GalN)
showed a strong decline below the zone of primary production (Carstens et al. 2012).
This finding was related to a shift from the AS signature of organisms of higher
trophic levels in the euphotic zone towards the signal of heterotrophic microorganisms
and progressing diagenesis. Relative to ASs, AAs are preferentially utilized and, thus,
the ratios between AAs and ASs decrease during microbial decomposition (Dauwe
and Middelburg 1998, Davis et al. 2009).
A different measure for the degradation state of primary produced pigment
related POM is the Chlorin Index (CI) introduced by Schubert et al. (2005). The CI
increases for degraded material and has proven to be a powerful tool to characterize

Impact of amino compounds and organic matter degradation state on the vertical structure of lacustrine bacteria
76
the initial stages of diagenesis in lakes (Meckler et al. 2004, Schubert et al. 2005,
Bechtel and Schubert 2009).
Organic particles were identified as hot spots of microbial activity. Particle-
associated bacteria were shown to hydrolyze more organic matter than they take up
and, thus, they are considered to provide significant growth substrates for free-living
bacteria in the surrounding waters (Smith et al. 1992, Grossart and Simon 1998a). As
specific bacterial guilds are specialized in the degradation of certain substrates (Peter
et al. 2011), it would be expected that organic matter quality and composition have a
strong impact on the structure of BCs. Shifts in freshwater BCC related to organic
matter quality have been shown previously (Crump et al. 2003, Roiha et al. 2011).
Recently published studies on diverse temperate lakes revealed distinct dynamics of
particle-associated (> 5 µm) and free-living (> 0.2, < 5 µm) BCs in relation to biotic
and abiotic factors (Allgaier et al. 2007, Parveen et al. 2011, Rösel et al. 2012).
However, at present our understanding of the interactions between organic matter and
BCC during the sedimentation process in deeper lakes is very limited.
In the present study, we analyzed the vertical changes in bacterial assemblages
by automated ribosomal intergenic spacer analysis (ARISA) in two contrasting deep
lakes distinguishing themselves by their nutrient loads and redox conditions. The two
lakes sampled in spring and fall 2009 are Lake Brienz (LB, oligotrophic, fully oxic)
and Lake Zug (LZ, eutrophic, partially anoxic), both located in Switzerland. We
separated the free-living and the particle-associated BCs via serial filtration through
5.0 and 0.2 µm pore size filters. Bacterial cell numbers were determined along the
lake water column via flow cytometry. The BCC patterns were linked to bulk
parameters such as total organic carbon (TOC), oxygen (O2), pH, temperature (T), and
to various parameters indicating POM degradation state and composition, i.e., the CI
and the abundance and ratios of specific particulate amino compounds.
We hypothesize that shifts in the composition and degradation state of POM in
a lake water column are accompanied by shifts in bacterial abundance and BCC.
Further we hypothesize that distinct environmental parameters shape the BCs in an
oligotrophic, fully oxic water column compared to a eutrophic, partially anoxic water
column. Finally, different structure-function relationships are expected for particle-
associated versus free-living BCs.

4.3 Methods
77
4.3. Methods
4.3.1. Sampling sites
The characteristics of the lakes are described in detail elsewhere (Köllner et al.
2012). Briefly, LB is an oligotroph, fully oxic lake with a maximum depth of 259 m.
The South Basin of eutrophic LZ is meromictic and anoxic below 130 m. It has a
maximum depth of 200 m. Results for basic chemical and physical parameters, with
the exception of alkalinity, ion concentrations, and pH, were reported previously
(Carstens et al. 2012, Köllner et al. 2012) and are shown in Fig. 6 and Table 9.
4.3.2. Sampling
The sampling procedure is described in detail elsewhere (Köllner et al. 2012).
Briefly, LB was sampled in mid-May and mid-September 2009 and the South Basin
of LZ was sampled end of March and end of October 2009. Based on T and O2
profiles (Fig. 6), water from LB was sampled at depths of 5, 10, 20, 30, 40, 70, 100,
150, 200, and 240 m and from LZ at 5, 10, 15, 25, 60, 80, 100, 130, 170, and 190 m.
For both lakes the samples were collected over the deepest point of the basin. For AA,
AS, and CI analyses (described below) POM from the same depths was sampled onto
two stacked precombusted glass fiber filters (nominal pore size 0.7 μm, 142 mm
diameter; Whatman Inc., Florham Park, NJ) with in-situ pumps (McLane Research
Laboratories Inc., Falmouth, MA) until filters were clogged.
4.3.3. Chemical analysis
Concentrations of TOC and total nitrogen (TN) were measured as described
previously (Köllner et al. 2012). Total phosphorus (TP) concentrations were
determined photometrically in unfiltered water samples with the molybdenum blue
method of Vogler (1965). Alkalinity was analyzed by titration with 0.1 N HCl to pH
4.3 with an automatic titration system (716 DMS Titrino, Metrohm AG, Zofingen,
Switzerland). For determination of chloride ( lC ), nitrate ( 3NO ), and sulfate ( 2
4SO )
concentrations, aliquots were filtered through cellulose acetate filters with 0.45 µm
pore size (Whatman). Analysis was performed using a Metrohm ion chromatograph
(3.2 mM Na2CO3/1.0 mM NaHCO3 buffered solution, 0.7 ml min-1 flow rate) and a
Metrohm Anion Metrosep A Supp 5 column. Concentrations of the base cations
calcium (Ca2+), magnesium (Mg2+), and sodium (Na+) were also measured with a

Impact of amino compounds and organic matter degradation state on the vertical structure of lacustrine bacteria
78
Metrohm ion chromatograph (1.7 mM nitric acid/0.7 mM dipicolinic acid eluant, 0.9
ml min-1 flow rate) equipped with a Metrohm Metrosep C4 column.
4.3.4. Amino acid analysis
The concentrations of 14 particulate protein AAs, alanine (Ala), glycine (Gly),
threonine (Thr), serine (Ser), valine (Val), leucine (Leu), isoleucine (Ile), proline
(Pro), aspartic acid (Asp), methione (Met), glutamic acid (Glu), phenlyalanine (Phe),
tyrosine (Tyr), lysine (Lys), and the two nonprotein AAs γ-aminobutyric acid (γ-aba)
and ornithine (Orn) were measured. For this purpose, one quarter of each 0.7 µm filter
was hydrolyzed with 6 mol l-1 HCl for 20 hours at 110°C under N2. Prior to
hydrolysis, L-norleucine (Sigma) was added as internal standard. The samples were
processed as described previously for the analysis of particulate D-AAs (Carstens et
al. 2012). A standard mixture of AAs with known concentration (AA S-18 (Sigma),
L-norleucine (Sigma), ornithine (Sigma), γ-aba (Sigma)) was also derivatized and
injected on the GC for quantification.
4.3.5. Degradation index
The degradation index (DI) was calculated based on the first axis of a principle
component analysis (PCA) of mole percentages of the detected particulate protein
AAs according to Dauwe et al. (1999).
4.3.6. Amino sugar analysis
Concentrations of the particulate ASs, GlcN, mannosamine (ManN), GalN,
and muramic acid (MurA) on 0.7 µm filters were analyzed according to the method of
Zhang & Amelung (1996) and Guerrant & Moss (1984) with slight modifications as
described previously (Carstens et al. 2012).
4.3.7. Chlorin Index
The CI was determined on aliquots of the 0.7 µm filters as described
elsewhere (Schubert et al. 2005, Bechtel and Schubert 2009). Briefly, the filters were
extracted with acetone 3 times and the fluorescence was measured at an excitation
wavelength of 428 nm and an emission wavelength of 671 nm. The extracts were
acidified with 100 µl of 25% HCl and the fluorescence was measured again. The
fluorescence intensity of the acidified sample was divided by the fluorescence

4.3 Methods
79
intensity of the non-acidified original extract which is defined as the CI. The CI of
fresh chlorophyll a is 0.2 and increases for degraded organic matter up to unity.
4.3.8. Bacterial cell counts
Bacterial cells were counted using flow cytometry as described previously
(Carstens et al. 2012).
4.3.9. DNA extraction
To separate the free-living and the particle-associated BCs about five liters of
water from each sampled depth were filtered through a 5.0 µm isopore membrane
filter (Millipore, Billerica, MA) and a 0.2 µm polycarbonate filter (Whatman), each
142 mm in diameter, connected in series and processed for DNA extraction as
described previously (Köllner et al. 2012).
The quality of DNA extracts was checked by agarose gel (1%) electrophoresis.
Extracted DNA was quantified by fluorescence spectroscopy using the Quant-iT
PicoGreen dsDNA Assay Kit (Molecular Probes) and a Synergy HT microplate reader
(Bio-Tek Instruments Inc., Winooski, VT).
4.3.10. Amplification of ribosomal intergenic spacer fragments
The ARISA-PCR mixture (50 µl) contained 1 x PCR buffer (Promega,
Madison, WI), 2.5 mmol l-1 MgCl2 (Promega), 0.25 mmol l-1 of each dNTP
(Promega), 0.25 g l-1 bovine serum albumin (Sigma), 10 ng of extracted DNA, 400
nmol l-1 of primers (Microsynth, Balgach, Switzerland) 1406f (5’-
TGYACACACCGCCCGT-3’) and 23r (5’-GGGTTBCCCCATTCRG-3’) targeting
bacterial 16S rRNA genes (Lane 1991), and 1.25 U Taq polymerase (Promega). The
forward primer was labeled at the 5’ end with fluorescent dye 6-FAM (Yannarell et al.
2003). ARISA PCR was performed on a Techne TC-512 thermocycler (Witec AG,
Littau, Switzerland) as described previously (Yannarell et al. 2003). The size and
quality of the PCR product was checked by agarose gel (2%) electrophoresis. Each
PCR sample was subjected to capillary electrophoresis on a ABI Prism 3130xl genetic
analyzer (Applied Biosystems, Foster City, CA) as follows: 1 µl of ARISA-PCR
product was added to a master mix containing 0.5 µl of internal size standard LIZ
1200 (20–1200 bp) (GeneScan, Applied Biosystems) and 9 µl of deionized Hi-Di
formamide (Applied Biosystems), denatured for 3 min at 95°C and placed on ice
Impact of amino compounds and organic matter degradation state on the vertical structure of lacustrine bacteria
80
immediately for at least 5 min. The ARISA-PCR products were separated by capillary
electrophoresis on 50 cm capillaries using the POP-7 polymer and the following run
parameters: 15 kV (run voltage), 2.4 kV (injection voltage), 20 s (injection time), and
60°C (oven temperature). Electropherograms were analyzed using GeneMapper
software v 4.0 (Applied Biosystems). The minimum peak height was 150 fluorescence
units for the sample signal and 15 fluorescence units for the Liz standard signal. The
capillary electrophoresis was performed with triplicate ARISA-PCR samples of the
particle-associated BCs and quadruplicate ARISA-PCR samples of the free-living
BCs.
4.3.11. Binning
ARISA fragments between 390 and 1250 bp in size were analyzed using
published R (R Development Core Team 2009) binning scripts (Ramette 2009). Only
peaks with relative fluorescence intensity values of > 0.09% and a consistent presence
in two (particle-associated) to three (free-living) ARISA-PCR replicates were
included in further analyses. In order to determine the best window size (WS) the
automatic R binning script, available online (http://www.mpi-
bremen.de/en/Software_2.html), was applied to replicates of at least one
representative sample (highest number of ARISA fragments) for each sampling and
both bacterial size fractions. The correlation between the replicates and the respective
number of operational taxonomic units (OTUs) for a series of WS values (0.5, 1, 1.5,
2, 3, 4, and 5 bp) and a shift value (Sh) of 0.1 bp was calculated. As a compromise
between high resolution and high similarity between sample replicates, a WS of 3 bp
was used for the OTU binning algorithm for ARISA profiles from both the free-living
and the particle-associated BCs.
4.3.12. Statistical analysis
All statistical analyses were performed using the statistical software R version
2.14.0 (R Development Core Team 2009) with packages VEGAN (Oksanen et al.
2011) and BIODIVERSITY R (Kindt and Coe 2005). For cluster analysis, average
linkage of hierarchical cluster analysis was used with the distance among
communities calculated as Bray-Curtis distances. Prior to principal component
analysis (PCA) and redundancy analysis (RDA), the ARISA OTU data were
Hellinger-transformed (Legendre and Gallagher 2001, Ramette 2007) and
4.3 Methods
81
environmental data were z-standardized to offset different units and scales. The
environmental variables used for PCA and RDA and their corresponding
abbreviations are given in Table 7. RDA is a multivariate multiple linear regression
followed by a PCA of the response matrix of fitted values (Borcard 2011). For each
RDA, the adjusted r2 ( 2adjr ) was calculated based on Ezekiel’s formula (Ezekiel 1930),
which adjusts the r2 value according to the number of parameters in the model as an
increased number of variables inflates r2 (Peres-Neto et al. 2006).
For variable reduction and in order to create an efficient model from the most
significant explanatory variables, forward selection of constraints using the
forward.sel function of the R package packfor (Dray et al. 2009) and VEGAN’S
ordistep function were applied. With forward.sel, variables are included stepwise in
the explanatory model, starting with the variable which explains most of the variance
(partial r2) of the response data (ARISA data) and has a significant contribution to the
model (p < 0.05). The test of significance is a permutation test by partial RDA. The
forward selection stops after the significant variable by which the 2adjr of the global
model was exceeded has been added. The ordistep function was also used for forward
variable selection. This algorithm alternates between stepwise addition and deletion of
explanatory variables until the model is stable. Models were tested by permutation
analysis (1000 iterations).
In order to compare ARISA OTUs of the free-living and the particle-
associated BCs multiple response permutation procedure (MRPP) was computed
using the R package VEGAN.
Environmental variables, which showed correlation to bacterial cell counts
with a r2 of ≥ 0.60 and a p-value of ≤ 0.05 for at least two sampling dates were
included as explanatory variables for cell counts in multiple regression analysis using
R.

Impact of amino compounds and organic matter degradation state on the vertical structure of lacustrine bacteria
82
Table 7. Environmental variables used for ordination analysis and their corresponding abbreviations
Variable Abbreviation
Total organic carbona TOC
Total nitrogena TN
Ratio between total organic carbon and total nitrogena C/N
Total phosphorusa TP
Nitratea 3NO
Sulfatea 2
4SO
Calciuma 2Ca
Sodium Na
Chloride lC
Magnesium 2Mg
Alkalinitya -
Oxygena O2
pHa -
Temperaturea T
Particulate glucosaminea GlcN
Particulate mannosaminea ManN
Particulate galactosaminea GalN
Particulate muramic acida MurA
Particulate glutamic acida, b Glu
Ratio between particulate glucosamine and particulate galactosaminea GlcN/GalN
Sum of particulate amino acid concentrations divided by the sum
of particulate amino sugar concentrationsa
AAs/ASs
Chlorin Indexa CI aParameters used for redundancy analysis (RDA). bAs strong correlation between the various AAs was observed (Fig. 22), Glu was used as representative of the 14 protein AAs measured. For abbreviations of other individual AAs evaluated in this study see chapter “Amino acid analysis” and http://www.ncbi.nlm.nih.gov/Class/MLACourse/Modules/MolBioReview/iupac_aa_abbreviations.html.

4.4 Results
83
4.4. Results
4.4.1. Richness and community structure of free-living and particle-associated
bacteria
Based on the number of detected ARISA OTUs, the richness was not
significantly different between the two lakes, whether considering the free-living or
the particle-associated BCs (t-test, α = 0.05, p = 0.80 (free-living) and p = 0.60
(particle-associated)). When performing a pairwise comparison per sampling depth
(separately for each sampling date and lake), the richness of the free-living BCs was
significantly higher compared to the particle-associated BCs (pairwise t-test, α = 0.05,
p < 0.0001) with the exception of LZ in October (t-test, α = 0.05, p = 0.08). The
number of ARISA OTUs per profile ranged from 48 ± 1 to 75 ± 2 and from 21 ± 1 to
69 ± 1 for the free-living and the particle-associated BCs, respectively.
The cluster analysis of the ARISA profiles of free-living BCs grouped LB and
LZ into separate clusters (Fig. 19). Within the LB cluster, the hypolimnion was
distinct from the epilimnion. The LB hypolimnion cluster included the 70 to 240 m
water depth of the spring sampling and the 40 to 240 m water depth of the fall
sampling. This finding is in good agreement with the recorded conductivity-
temperature-depth profiles (Fig. 6A,B): In spring, T was constantly 5°C below a water
depth of 70 m while in fall T was constantly 6°C below a water depth of 40 m. The
second largest cluster was formed by the oxic waters of LZ. The 25 m water depth
sampled in October was distinct from the epilimnion and grouped with the water
depths sampled along the oxycline of LZ (see Fig. 6C,D). The anoxic water layers of
LZ formed an outgroup.
As observed for the free-living BCs, the particle-associated BCs of LB and LZ
were distinct (Fig. 20). However, further subclustering was determined by sampling
date and not by sampled habitat (Fig. 19).
The MRPP test showed that for both lakes the particle-associated BCs were
significantly different from the free-living BCs (mean distance within groups = 0.58,
mean distance between groups = 0.79). The BCs appeared more similar within the
free-living fraction (LB: δ = 0.41, LZ: δ = 0.57) than within the particle-associated
fraction (LB: δ = 0.63, LZ: δ = 0.71). The significance of the delta scores based on
999 permutations was 0.001.

Impact of amino compounds and organic matter degradation state on the vertical structure of lacustrine bacteria
84
Fig. 19. Dendrogram of Hellinger-transformed ARISA data of free-living BCs. Water of Lake Brienz (LB, triangles) was sampled in May and September 2009 and of Lake Zug (LZ, circles) in March and October 2009 based on T and O2 profiles (see Fig. 6). Symbol colors indicate grouping by season and water layer, i.e., for LB epi- and hypolimnion and for LZ, oxic, oxycline, and anoxic water layers. Hierarchical cluster analysis was performed using average linkage, and Bray–Curtis distances were calculated from ARISA peak abundance.

4.4 Results
85
Fig. 20. Dendrogram of Hellinger-transformed ARISA data of particle-associated BCs. Water of Lake Brienz (LB, triangles) was sampled in May and September 2009 and of Lake Zug (LZ, circles) in March and October 2009 based on T and O2 profiles (see Fig. 6). Symbol colors indicate grouping by season and water layer, i.e., for LB epi- and hypolimnion and for LZ, oxic, oxycline, and anoxic water layers. Hierarchical cluster analysis was performed using average linkage, and Bray–Curtis distances were calculated from ARISA peak abundance.
4.4.2. Amino acids
AA concentrations are shown in Table 10. For both lakes and sampling dates,
the protein AA concentrations decreased with water depth with a slight increase just
above the sediments. For both lakes the most abundant protein AAs were the acidic
Impact of amino compounds and organic matter degradation state on the vertical structure of lacustrine bacteria
86
AAs Glu (up to 473 nmol l-1) and Asp (up to 393 nmol l-1) and the neutral AAs Leu
(up to 309 nmol l-1), Ala (up to 287 nmol l-1), and Gly (up to 239 nmol l-1). Maximum
AA concentrations were measured for the 5 m water depth of LZ sampled in October.
The protein AA concentrations of LZ were two- to ten-fold higher than for LB.
Minimum concentrations (< 1 nmol l-1) were measured for the sulfuric AA Met and
the aromatic AA Tyr for both lakes and sampling dates.
As Ala could not be detected for the 10 m, the 150 m and the 240 m water
depth of LB in September, the DI was not calculated for these samples (Fig. 21A). In
May, the DI showed a trend towards lower values with depth, which would indicate a
degradation of sedimenting material (Dauwe et al. 1999). For LZ, the DI did not
follow a conclusive pattern (Fig. 21E). Therefore, the DI values were not used for
further data interpretation.
The concentrations of the nonprotein AAs γ-aba and Orn were below the limit
of detection for approximately half of the 40 water samples. The determined
contribution of the nonprotein AAs to the AA pool were ≤ 1 mol%, with the exception
of Orn for LB September, which reached up to ~5 mol% in the 70 m water depth.
Therefore, the concentrations of nonprotein AAs were not used for further data
interpretation.
4.4.3. Amino sugars
As reported previously, for both lakes and sampling dates the most abundant
AS was GlcN, followed by GalN (Carstens et al. 2012). The AS concentrations
strongly declined below the zone of primary production. The GlcN concentrations of
LZ ranged from 2.78 (October, 100 m) to 70.6 nmol l-1 (March, 5 m) and were lower
in fall than in spring (Carstens et al. 2012, Köllner et al. 2012). The AS concentrations
of LB were also lower in fall compared to spring and were roughly one order of
magnitude lower than in LZ.
GlcN/GalN has been proposed as an indicator for organic matter degradation,
as decreasing GlcN/GalN values were reported to go along with organic matter
degradation (Benner and Kaiser 2003, Davis et al. 2009). We observed highest
GlcN/GalN values in the surface waters and lower GlcN/GalN values for samples
from deeper waters (Fig. 21B,F; see also Carstens et al. 2012), which would be in line
with degradation.

4.4 Results
87
Relative to AAs, ASs are more resistant to degradation. Therefore, the values
for AAs/ASs are expected to decrease during decomposition in the water column
(Dauwe and Middelburg 1998). For both lakes, the AAs/ASs values showed highest
values in the surface waters (Fig. 21C,G). The AAs/ASs values also showed
considerable variation by season in the hypolimnion of each lake.
4.4.4. Chlorin Index
For both lakes and sampling dates, the CI values increased with depth,
indicating degradation of primary produced pigment related POM during
Fig
. 21
. D
egra
datio
n in
dice
s ba
sed
on (
A,
E)
the
abun
danc
e of
pro
tein
am
ino
acid
s (D
I);
(B,
F)
ratio
s be
twee
n gl
ucos
amin
e an
d ga
lact
osam
ine
(Glc
N/G
alN
);
(C,
G)
ratio
s be
twee
n to
tal
amin
o ac
ids
and
tota
l am
ino
suga
rs
(AA
s/A
Ss)
; an
d (D
, H
) th
e C
hlor
in I
ndex
(C
I) f
or t
he w
ater
col
umns
of
Lak
e B
rien
z (L
B)
sam
pled
in
May
and
Se
ptem
ber
2009
and
of
Lak
e Z
ug (
LZ
) sa
mpl
ed in
Mar
ch a
nd O
ctob
er 2
009.

Impact of amino compounds and organic matter degradation state on the vertical structure of lacustrine bacteria
88
sedimentation (Fig. 21D,H; see also Carstens et al. 2012). Comparing lakes, the CI
values for LZ were not significantly higher than for LB except when only the values
for the spring samplings were compared (t-test, α = 0.05, p = 0.01).
4.4.5. Explanatory variables with the strongest influence on between- and within-
lake variability of the bacterial community structure
In total, we assembled and evaluated 35 variables, which included
concentrations of TOC, TN, TP, ions, alkalinity, pH, T, O2, concentrations of ASs and
protein AAs, ratios thereof and the CI to determine their influence on the BC
structures. As a first step, PCA was performed on this initial set of environmental
variables. The circle of equilibrium contribution identified TP, TOC, ions, alkalinity,
O2, and T as the variables contributing most to the ordination graph (Fig. 22). The two
lakes were clearly separated, which reflects the high concentrations of ions, TOC, and
TP of LZ and the high 24SO and O2 concentrations of LB. The 5 m to 25 m and the 5
m to 15 m water layers of LZ sampled in spring and fall, respectively, segregated
from the main LZ cluster (Fig. 22).
Fig. 22. PCA on 35 environmental variables and circle of equilibrium contribution which highlights the variables contributing significantly to the ordination, i.e., variables that have vectors outside of the equilibrium circle. The first two axes represent 78.7% of the variance. For abbreviations used see Table 7. Water samples from Lake Brienz are symbolized by triangles and Lake Zug by circles. For color code see Fig. 19 or Fig. 20.

4.4 Results
89
The 5 m and the 10 m water samples from fall plot outside of the equilibrium circle.
This is mainly due to the high AS and AA concentrations in the surface waters of LZ.
Fig. 22 further illustrates the high degree of overall correlation between the various
amino compounds measured, as well as their distinctness from bulk parameters such
as TN and TOC.
Based on the observed collinearities between various amino acids and between
various ions measured, the RDA was performed with a reduced set of 19 explanatory
variables, TOC, TN, TP, 3NO , 2
4SO , Ca2+, alkalinity, O2, pH, T, GlcN, ManN, GalN,
MurA, Glu - as representative for all AAs -, GlcN/GalN, C/N, AAs/ASs, and the CI.
The variables used for RDA and their corresponding abbreviations are listed in Table
7. As the anoxic communities of LZ followed a very different dynamic (Fig. 19 & Fig.
20), particular trends between the different BCs of the two lakes may be obscured in
the RDA. In the following section mainly the results for the RDA of the oxic water
samples are described. The RDAs including also the anoxic water samples are shown
in Fig. 24.
The RDA models with the full set of 19 explanatory variables were significant
(p < 0.001, no of permutations = 1000) for both the free-living ( 2adjr = 0.70) and the
particle-associated community data ( 2adjr = 0.70). For further variable reduction and in
order to create an efficient model from the most significant explanatory variables, we
applied forward selection of constraints using the forward.sel function of the R
package packfor (Dray et al. 2009) and VEGAN’S ordistep function (Oksanen et al.
2011). Both functions selected a reduced set of nine explanatory variables for the
RDA of the fee-living BC data (Fig. 23A). The parsimonious RDA indicated that
within-lake variability was best explained by the variables T, 3NO , and CI.
For the particle-associated BCs, the same nine explanatory variables as for the
fee-living BCs and additionally pH were selected (Fig. 23B). pH was strongly
correlated with axis 2, which indicates its influence on the seasonal variation of the
particle-associated BCC. In contrast to the fee-living BCs, the CI only had a very
weak impact on the particle-associated BCC. The separation of the particle-associated
BCs of LZ and LB along the first axis and of the sampling seasons along the second
axis was preserved in the RDA comprising also the anoxic water samples (Fig. 24B).

Impact of amino compounds and organic matter degradation state on the vertical structure of lacustrine bacteria
90
In the RDA plot with the free-living BCs including the anoxic water samples,
the oxic samples of LB and LZ were grouped in closer proximity compared to the
anoxic samples of LZ (Fig. 24A). The anoxic BCs formed an outgroup as already
shown by cluster analysis (Fig. 19).
Fig. 23. R
DA
triplots of Hellinger-transform
ed AR
ISA data of (A
) free-living and (B) particle-associated B
Cs and constraining environm
ental variables. O
nly oxic water sam
ples were plotted. F
or the RD
A w
ith the free-living BC
s the first two canonical axes explain 37.5%
of the total variance of the data. F
or the RD
A w
ith the particle-associated BC
s the first two canonical axes explain 40.1%
of the total variance of the data. W
ater samples from
Lake B
rienz are symbolized by triangles and L
ake Zug by circles. For color code see F
ig. 19 or Fig. 20.

4.4 Results
91
Reflecting the main differences between the two lakes (Fig. 22), the BCs of
LB were always correlated to high 24SO , O2, and
3NO concentrations, and the BCs
of LZ were always correlated to high alkalinity, C/N, TOC, and TP concentrations
(Fig. 23A,B & Fig. 24A,B).
Fig
. 24
. R
DA
tri
plot
s of
Hel
ling
er-t
rans
form
ed A
RIS
A d
ata
of (
A)
free
-liv
ing
and
(B)
part
icle
-ass
ocia
ted
bact
eria
l co
mm
uniti
es a
nd
cons
trai
ning
env
iron
men
tal v
aria
bles
. The
fir
st tw
o ca
noni
cal a
xes
expl
ain
39.2
% a
nd 3
0.6%
of
the
tota
l var
ianc
e of
the
free
-liv
ing
and
the
part
icle
-ass
ocia
ted
bact
eria
l com
mun
ity d
ata,
res
pect
ivel
y. W
ater
sam
ples
fro
m L
ake
Bri
enz
are
sym
boliz
ed b
y tr
iang
les
and
Lak
e Z
ug b
y ci
rcle
s. C
olor
cod
ing
is id
entic
al to
Fig
. 19
and
Fig
. 20.

Impact of amino compounds and organic matter degradation state on the vertical structure of lacustrine bacteria
92
4.4.6. Bacterial cell abundance
The highest bacterial cell counts were detected in the epilimnion of LZ (Fig.
25). In LZ, in which the TOC concentrations were three- to four-fold higher compared
to the oligotrophic LB (Table 9), the number of bacterial cells correlated significantly
with the TOC concentrations ((p < 0.05, n = 10, Table 8). For both lakes and sampling
dates, the bacterial cell counts were also significantly correlated with T and alkalinity
(p < 0.05, n = 10). For both lakes, the bacterial cell number correlated significantly
with C/N and the degradation index CI (p < 0.05, n = 10), with higher cell numbers
corresponding to less degraded organic matter. However, for LB in May, the bacterial
cell counts correlated only weakly with the CI (r2 = 0.36, p = 0.07, n = 10). We further
found significant correlations (p < 0.05, n = 10) between the bacterial abundance and
the concentration of all the detected protein AAs, except for Lys of LB in May and
Ala, Gly, and Lys of LB in September. In Table 8 correlations are only shown for Glu
as a representative of all AAs. Correlation of cell numbers with concentrations of ASs
was less consistent. Only for LB in May, significant correlations were found between
bacterial abundance and all of the detected ASs (Table 8). The bacterial cell counts
also correlated significantly with the TOC concentration for this sampling date (r2 =
0.72, p < 0.01, n = 10).
Fig. 25. Bacterial cell counts in the water column of Lake Brienz (LB) sampled in May and September 2009 and in the water column of Lake Zug (LZ) sampled in March and October 2009.
4.4 Results
93
Table 8. Pearson correlation coefficient (r2) and significance of correlation between bacterial cell counts and biogeochemical data measured in the water columns of Lake Brienz (LB) sampled in May and September 2009 and of Lake Zug (LZ) sampled in March and October 2009
Parameter LB May LB Sep LZ Mar LZ Oct
Depth 0.61** 0.50* 0.68** 0.18
TOC 0.72** 0.33 0.57* 0.85**
3NO 0.01 0.92** 0.53* 0.86**
O2 0.00 0.71** 0.66** 0.19
pH 0.19 0.94** 0.56* 0.49*
T 0.55* 0.95** 0.76** 0.73**
Alkalinity 0.71** 0.96** 0.52* 0.61**
GlcN 0.54* 0.61* 0.36 0.61*
ManN 0.46* 0.82* 0.39 0.52*
GalN 0.56* 0.38 0.42* 0.41*
MurA 0.47* 0.25 0.08 0.65*
CI 0.36 0.68** 0.77** 0.76**
C/N 0.57* 0.60** 0.53* 0.97**
GlcN/GalN 0.53* 0.01 0.28 0.45*
Glu 0.49* 0.71** 0.78** 0.69**
*p < 0.05 **p < 0.01
4.4.7. Multiple regression analysis
Multiple regression analysis was performed with the variables Glu, C/N, CI,
GlcN, alkalinity, T, O2, 3NO , TOC, and water depth, for which significant
correlations of r2 ≥ 0.60 and a p-value of ≤ 0.05 with the bacterial cell abundance
were found for at least two sampling dates. Glu was chosen as representative for all
AAs. Multiple regression analysis with these ten variables suggested best four-
variable model TOC- 3NO -GlcN-CI and best three-variable models GlcN-CI-C/N and
TOC-CI-Glu. The suggested variables TOC, 3NO , GlcN, CI, C/N, and Glu all
contributed significantly to the models (p < 0.01).

Impact of amino compounds and organic matter degradation state on the vertical structure of lacustrine bacteria
94
Table 9. Basic chemical and physical parameters and concentrations of particulate amino sugars of Lake Brienz sampled in May and September 2009 and Lake Zug sampled in March and October 2009. GlcN: glucosamine; ManN: mannosamine; GalN: galactosamine; MurA: muramic acid
October 2009
March 2009
September 2009
May 2009
Sampling date
190 170
130 100
80 60
25 15 10 5 190
170 130 100 80 60 25 15
10 5 240 200 150
100 70 40 30 20 10 5 240 200 150 100 70
40 30 20 10 5 (m
) D
epth
1.94 1.94
1.95 1.89
1.88 1.89
1.99 2.37 2.54 2.43 1.97
1.86 2.00 1.89 2.06 2.04 2.09 2.16
2.37 2.14 0.51 0.55 0.49
0.53 0.52 0.61 0.57 0.74 0.77 0.55
0.54 0.59 0.57 0.52 0.56
0.78 0.65 0.85 0.74 0.62
(mg l l -1)
TO
C
0.27 0.29
0.44 0.50
0.50 0.50
0.51 0.26 0.25 0.23 0.49
0.49 0.56 0.58 0.59 0.54 0.53 0.52
0.55 0.55 0.43 0.43 0.41
0.44 0.45 0.42 0.39 0.36 0.34 0.34
0.41 0.37 0.42 0.39 0.40
0.40 0.38 0.42 0.47 0.40
TN
0.03 0.15
0.36 0.46
0.44 0.43
0.43 0.06 0.02 0.02 0.31
0.32 0.36 0.41 0.38 0.35 0.32 0.31
0.29 0.30 0.40 0.40 0.39
0.40 0.39 0.39 0.34 0.31 0.29 0.27
0.40 0.40 0.40 0.40 0.39
0.41 0.41 0.40 0.40 0.41
NO
3
230 167
172 158
115 95.2
86.7 39.1 42.2 25.0 194
184 159 126 93.7 82.1 78.2 81.7
75.3 77.1 45.1 21.8 23.8
26.8 27.5 63.6 39.4 54.2 33.8 19.9
5.96 4.63 5.06 5.14 5.21
5.88 7.01 7.33 8.22 7.13
(µg l l -1)
TP
5.32 5.52
5.54 5.62
5.61 5.70
5.16 5.41 5.15 5.33 6.43
6.37 6.45 6.53 6.54 6.54 6.52 6.48
6.47 6.52 10.6 10.5 10.6
10.0 10.4 10.3 9.67 9.58 9.35 8.76
11.1 11.0 11.0 11.0 10.9
11.0 11.1 11.0 11.3 11.0
(mg l l -1)
SO4
6.21 6.32
6.38 6.26
6.49 6.64
5.93 6.44 6.36 6.29 6.07
6.19 6.36 6.49 6.57 6.46 5.47 6.52
6.51 6.32 0.78 0.78 0.75
0.74 0.91 0.69 0.58 0.59 0.50 0.53
0.82 0.96 0.79 0.80 0.85
0.83 0.86 0.86 0.83 0.89
Cl -
4.44 4.07
4.11 3.94
4.22 4.02
3.89 4.02 4.19 4.40 3.95
3.97 4.06 4.14 4.16 4.01 4.15 4.15
4.12 4.26 0.47 0.58 0.47
0.55 0.53 0.35 0.43 0.29 0.28 0.27
0.73 0.71 0.59 0.87 1.08
0.69 0.86 0.66 0.77 0.76
Na
+
40.8 36.9
39.1 38.9
37.0 28.6
30.2 31.8 30.4 27.2 41.8
41.4 41.3 40.5 39.4 38.9 39.0 38.8
39.0 39.0 27.6 25.5 28.6
26.0 26.2 28.5 28.1 24.1 24.0 23.2
27.2 26.9 27.4 27.0 27.0
29.6 30.8 27.3 28.0 29.3
Ca
2+
8.08 7.45
7.79 7.30
8.02 7.75
7.14 7.52 7.49 7.66 7.00
6.88 7.54 7.27 6.70 6.74 6.96 6.75
6.55 7.22 2.80 2.71 2.97
2.73 2.47 2.49 2.28 2.17 2.09 1.89
3.70 3.59 3.89 3.61 3.58
3.80 3.93 3.68 3.98 3.65
Mg
2+
2.76 2.71
2.71 2.69
2.61 2.59
2.56 2.32 2.27 2.25 2.78
2.77 2.74 2.69 2.64 2.60 2.61 2.61
2.62 2.58 1.55 1.54 1.53
1.53 1.53 1.51 1.41 1.36 1.28 1.24
1.52 1.52 1.50 1.50 1.50
1.52 1.52 1.54 1.56 1.55
(mm
ol l -1) A
lkalinity
0.58 0.96
0.93 3.47
6.21 7.37
7.68 6.53 9.97 10.0 0.80
0.75 1.46 4.24 7.03 8.86 10.2 10.3
10.3 10.3 10.9 11.2 11.0
10.9 11.2 10.9 10.5 10.7 10.5 10.4
11.2 10.9 11.8 12.1 12.2
11.6 11.3 11.4 12.0 11.6
(mg l -1)
O2
7.16 7.21
7.23 7.29
7.36 7.4
7.42 7.45 8.11 8.14 7.94
7.93 7.39 8.06 8.11 8.34 8.44 8.46
8.38 8.43 7.83 7.84 7.85
7.86 7.84 7.87 7.91 7.92 7.95 8.01
7.84 8.04 8.09 8.12 8.09
8.09 8.14 8.19 8.21 7.88
pH
10.3 6.26
5.89 2.78
3.90 2.96
6.58 8.02 35.6 21.6 12.7
10.7 10.2 12.0 11.0 8.53 14.2 12.3
19.1 70.6 1.89 1.10 0.68
0.87 0.65 0.98 0.77 3.95 2.83 3.68
1.18 0.69 0.77 0.70 1.15
2.57 3.85 4.61 13.9 8.42
(nmol l -1)
GlcN
0.24 0.46
0.06 0.08
0.10 0.19
0.21 0.14 2.64 2.47 0.88
0.93 0.80 0.18 0.96 0.26 1.04 0.90
0.85 2.38 0.19 0.16 0.09
0.06 0.06 0.12 0.53 0.53 0.70 0.65
0.14 0.07 0.06 0.11 0.07
0.09 0.20 0.61 1.90 1.01
ManN
3.64 2.09
2.42 1.17
1.75 1.38
2.49 2.79 9.33 2.77 4.54
3.88 4.37 3.63 5.38 3.12 3.49 5.46
7.88 10.8 0.38 0.45 0.24
0.31 0.24 0.32 0.28 2.19 0.72 1.53
0.46 0.27 0.31 0.27 0.33
0.65 1.15 1.21 2.49 2.55
GalN
0.38 0.44
0.61 0.3
0.35 0.74
0.27 2.09 5.38 3.31 3.41
1.27 0.73 0.99 0.61 0.93 0.91 0.62
1.21 4.21 0.72 1.03 0.37
0.25 0.14 0.36 0.63 0.48 0.85 0.91
0.39 0.06 0.08 0.19 0.1
0.49 0.92 0.99 2.26 2.88
MurA

4.4 Results
95
Table 10. Concentrations of particulate amino acids of Lake Brienz sampled May and September 2009 and Lake Zug sampled in March and October 2009. For abbreviations of individual amino acids see http://www.ncbi.nlm.nih.gov/Class/MLACourse/Modules/MolBioReview/iupac_aa_abbreviations.html
Orn
(n
mol
l-1)
bd
1.71
bd
bd
bd
bd
bd
bd
bd
bd
1.59
3.
32
0.86
0.
80
1.80
2.
96
bd
0.95
0.
84
0.63
bd
bd
bd
bd
1.1
bd
bd
1.19
bd
0.
31
bd
bd
2.13
bd
bd
bd
0.86
1.
19
bd
bd
γ-ab
a
bd
bd
0.71
bd
0.14
0.
05
0.09
bd
0.
13
bd
0.57
bd
bd
bd
bd
0.
58
bd
bd
0.22
bd
bd
bd
bd
bd
0.49
0.
43
1.50
0.
95
0.57
0.
48
0.92
4.
76
1.02
bd
0.26
0.
12
0.48
0.
98
bd
bd
Lys
44.3
22
.8
12.0
2.96
9.
29
0.11
3.
60
bd
3.11
3.34
17
.7
bd
8.36
2.
52
13.8
bd
2.
01
bd
bd
4.43
16
4
20.9
11
1 43
.2
34.3
10
.1
bd
31.7
12
.1
36.5
18
3 17
6 10
6
9.08
9.
06
2.23
7.
02
26.7
21
.7
45.9
Tyr
15.7
14
.8
7.59
4.23
4.
40
2.54
1.
32
1.37
1.
52
1.62
5.
98
4.23
3.
39
1.29
2.
44
0.75
1.
70
0.62
2.
29
2.14
27
.3
20.9
43
.3
15.1
0.
94
1.51
9.
93
0.22
3.
25
7.77
96
.0
80.1
34
.9
5.78
1.
44
1.00
1.
07
0.57
9.
65
17.2
Phe
24.5
21
.5
12.6
7.90
6.
17
3.44
2.
71
2.45
2.
91
3.90
17
.4
17.9
8.
23
4.04
8.
70
3.71
3.
88
3.18
5.
02
5.59
10
0
91.7
63
.3
21.6
17
.7
9.40
12
.7
11.5
13
.6
16.2
13
4 11
8 55
.1
10.5
5.
47
4.24
7.
65
14.9
17
.3
33.3
Glu
90.1
61
.9
41.0
24.0
21
.0
9.91
9.
37
7.33
8.
16
12.3
65
.3
32.0
32
.2
12.7
37
.5
10.0
13
.7
6.65
14
.8
17.9
25
1
216
192
82.6
43
.3
26.2
51
.2
42.2
35
.4
38.9
47
3 34
4 12
7
36.0
17
.8
13.7
25
.2
52.5
46
.1
90.7
Met
5.38
7.
84
2.89
2.37
2.
24
1.08
0.
58
0.79
0.
97
1.11
3.
16
2.41
2.
81
1.37
2.
49
0.52
1.
38
1.17
1.
24
2.43
34
.4
26.6
70
.7
5.75
2.
30
1.54
bd
0.
54
0.79
1.
68
53.3
43
.8
13.8
2.74
1.
28
1.45
1.
36
1.07
3.
30
7.75
Asp
67.5
49
.5
32.4
22.3
17
.6
7.78
6.
62
5.50
6.
59
9.13
39
.8
25.7
26
.2
9.90
19
.8
6.17
9.
90
5.77
11
.9
18.1
14
9
157
157
58.8
23
.7
22.4
42
.6
33.2
30
.6
28.8
39
3 28
7 93
.9
29.3
14
.0
12.2
19
.1
43.3
36
.5
71.1
Pro
38.8
30
.6
20.7
10.5
9.
39
2.8
4.46
2.
27
4.10
5.13
18
.3
14.5
12
.7
4.83
9.
65
8.56
3.
82
5.36
5.
73
5.46
13
1
57.0
14
5 41
.6
17.7
13
.9
26.0
18
.6
19.2
26
.4
197
165
72.2
18.3
9.
25
9.91
10
.4
19.5
23
.8
47.0
Ile
31.6
23
.6
15.2
8.42
7.
43
4.45
2.
90
2.31
2.
75
4.51
15
.1
7.42
9.
14
3.11
4.
66
1.87
2.
66
2.18
3.
68
2.43
80
.1
71.9
55
.0
30.2
9.
91
8.61
16
.7
14.8
14
.9
16.5
14
7 14
7 66
.1
14.2
8.
19
7.77
4.
67
12.0
22
.2
40.8
Leu
63.9
56
.6
34.6
19.8
16
.3
8.23
6.
08
5.68
6.
31
8.64
33
.8
21.2
17
.0
6.32
8.
57
4.63
5.
99
5.33
6.
64
6.37
19
9
165
133
64.4
25
.7
23.4
34
.9
30.6
31
.2
37.8
30
9 26
3 11
7
27.4
14
.4
13.3
12
.5
27.9
35
.7
71.1
Val
41.4
24
.1
18.6
12.5
11
.9
4.60
2.
88
4.01
3.
63
4.58
17
.0
12.3
17
.4
5.09
5.
67
1.61
3.
49
2.64
4.
93
9.48
50
.3
41.4
73
.7
33.8
6.
29
12.7
22
.6
10.1
14
.7
14.6
97
.4
58.2
25
.5
11.6
5.
36
7.50
8.
56
29.6
13
.2
29.1
Ser
42.4
20
.4
19.1
11.8
8.
74
5.45
3.
04
2.82
3.
11
4.74
19
.1
1.03
6.
48
1.63
5.
12
1.62
1.
92
0.83
2.
83
0.68
73
.7
57.5
59
.1
39.9
7.
16
9.67
17
.2
16.3
17
.5
23.0
18
3 18
4 83
.8
20.3
9.
70
11.4
3.
50
11.9
24
.3
41.8
Thr
39.0
26
.2
19.5
13.1
11
.1
5.62
3.
03
3.95
4.
00
5.36
13
.1
6.72
13
.5
2.87
3.
80
1.25
2.
46
1.66
4.
06
7.91
56
.6
49.0
64
.9
34.6
7.
86
11.9
22
.3
12.9
17
.2
16.1
11
3 80
.7
33.6
11.9
6.
86
7.36
7.
16
15.1
15
.3
29.8
Gly
91.0
50
.8
45.0
28.1
19
.9
9.80
6.
56
7.08
5.
51
8.46
22
.8
bd
18.9
1.
06
8.35
3.
57
5.05
0.
35
3.80
1.
00
139
94.2
14
9 90
.0
15.3
23
.9
41.6
28
.8
35.6
48
.5
239
203
80.2
34.7
14
.5
16.5
10
.8
27.9
33
.7
55.9
Ala
112
65.2
49
.2
29.2
19
.0
11.4
6.
26
5.80
4.
82
8.17
38
.3
bd
5.38
1.
01
13.0
9.
09
3.26
bd
1.
56
bd
113
58.3
12
4 11
3 9.
08
23.1
36
.5
24.0
33
.9
58.2
28
7 24
9 98
.5
36.7
16
.5
25.0
3.
65
13.6
38
.9
62.7
Dep
th
(m)
5 10
20
30
40
70
100
150
200
240
5 10
20
30
40
70
100
150
200
240
5 10
15
25
60
80
100
130
170
190
5 10
15
25
60
80
100
130
170
190
Sam
plin
g da
te
May
200
9 Se
ptem
ber
2009
M
arch
200
9
Oct
ober
200
9

Impact of amino compounds and organic matter degradation state on the vertical structure of lacustrine bacteria
96
4.5. Discussion
A lake water column is characterized by strong depth-related gradients, many
of which are autocorrelated. This is due to the strong effect of underlying physical
conditions, e.g. the thermal stratification of the lake, the downward movement of
sedimenting material, and the limitation of primary productivity to the upper water
layers. Hence, for the identification of the environmental variables that drive vertical
bacterial dynamics, care has to be taken. In this study, we have used a stepwise
reduction of variable complexity aided by forward selection to extract the set of
environmental variables with the strongest influence on the BCC dynamics. Further,
we analyzed both full and partial datasets, e.g. separate analysis of the oxic/anoxic
water body, to confirm consistency of trends. Finally, we evaluated the probable
causality of the considered variables.
CI was consistently found to be strongly associated with the within-lake
variation of the free-living BCCs (Fig. 23A & Fig. 24A). This was the case in both
lakes despite the contrasting nutrient and redox conditions. For both lakes and
samplings, the CI increased along the water column towards the lake sediments (Fig.
21D,H; see also Carstens et al. 2012), indicating POM degradation of sedimenting
material. The CI was established as a reliable and simple tool for the characterization
of the diagenetic state of POM for marine and lake habitats (Meckler et al. 2004,
Schubert et al. 2005, Bechtel and Schubert 2009).
CI was not by itself a particularly good predictor for bacterial abundance
(Table 8), but multiple regression indicated that it contributes significantly to
explaining the variance of the bacterial abundance in the lake water columns. CI may
be a particularly good indicator for the influence of organic matter on the abundance
and composition of bacterioplankton since it is based on the degradation of
chlorophyll and thus directly linked to the main source of degradable organic matter
in the studied lakes, i.e., phytoplankton. Similarly, Rösel & Grossart (2012) associated
increased bacterial abundance following after phytoplankton spring blooms with
higher abundance of algal detritus (Rösel and Grossart 2012).
The abundance of specific particulate AAs, in particular the nonprotein AAs γ-
aba and Orn, which are the degradation products of protein AAs (Lee and Cronin
1982), GlcN/GalN and AAs/ASs performed less well as predictors for BCC dynamics
in relation to POM degradation in the lake water column. High GlcN/GalN values in
4.5 Discussion
97
the surface waters of both lakes reflect synthesis of GlcN (Fig. 21B,F; Carstens et al.
2012). The GlcN/GalN values declined below the zone of primary production. As ASs
are more resistant to degradation than AAs (Dauwe & Middelburg 1998), the values
for AAs/ASs were found to be highest for the lake epilimnia and stabilized at low
values in the deep waters (Fig. 21C,G). The GlcN/GalN and the AAs/ASs patterns
indicate that within the water column, the degradation dynamics of particulate amino
compounds were mainly restricted to the surface waters.
However, significant correlations between the bacterial cell abundance and the
abundance of particulate amino compounds were found in the water columns of both
lakes. Particulate amino compounds are not only significant growth substrates for
particle-associated BCs, which accomplish the hydrolysis of POM, but also for the
free-living bacteria in the surrounding water profiting from the hydrolysis products
(Grossart and Simon 1998a, Beier and Bertilsson 2011).
Other abiotic factors with a strong impact on the BCC were T and O2. For LZ,
the composition of free-living BCs varied according to the O2 gradient (Fig. 19, Fig.
23A & Fig. 24). As expected, the anoxic hypolimnion of LZ harbored a unique BC
(Fig. 19 & Fig. 20). As bacteria in this region will have to rely on anaerobic
respiration and fermentation, it is to be expected that only few organisms with highly
flexible metabolism will thrive both above and below the oxycline.
Eliminating LZ’s anoxic waters from the analysis, T was found the second-
best explanatory variable associated with the within-lake variation of the free-living
BCC, in particular for LB since LZ was not thermally stratified during the sampling in
March (see Fig. 6C). The T effect probably reflects the physical and biological
structure of the lake, rather than it being a direct influence by itself: warm and light
zone of primary production in the surface waters versus dark and cold hypolimnion,
the zone of detrital matter turnover. T has previously been demonstrated as a
significant variable reflecting the variance between epilimnion and hypolimnion BCs
(Shade et al. 2008).
In comparison to the free-living BCs, the particle-associated BCs were more
variable in their composition and influenced by different environmental variables. The
CI was replaced by pH as the best explanatory parameter for within-lake variation of
the particle-associated BCC. pH has previously been identified as an important driver
of biogeochemical transformations and as cause of shifts in lake BCC (Lindström
2000, Yannarell and Triplett 2005).
Impact of amino compounds and organic matter degradation state on the vertical structure of lacustrine bacteria
98
The stronger impact of seasonal dynamics on particle-associated BCs
compared to free-living BCs is in good agreement with recently published studies on
the dynamics of these bacterial groups in lakes located in Germany (Rösel et al. 2012,
Rösel and Grossart 2012). The pronounced seasonal dynamics of particle-associated
BCs were linked to their tighter coupling to phyto- and zooplankton as they found
particle-associated bacterial species strongly correlated to algal species and
zooplankton biomass (Rösel et al. 2012). In the lakes presented here, LZ’s zoo- and
phytoplankton differed substantially between the spring and the fall sampling, both in
biomass and composition (Köllner et al. 2012) while it remained more constant in LB.
This may be reflected in the stronger separation of seasonal clusters for the particle-
associated BCs of LZ (Fig. 23B). The influence of seasonal phytoplankton
successions on the BCC was shown previously as different algal species are sources
for different types of substrates utilized by the bacterioplankton (Lindström 2001,
Crump et al. 2003, Eiler and Bertilsson 2007, Šimek et al. 2011).
The > 5 µm fraction probably also comprises the preferred food particle size
of grazers like nanoflagellates and ciliates since smaller bacterial species appeared
more stable against grazing pressure (Salcher et al. 2010). Therefore, BCs in the > 5
µm fractions are probably more closely associated with the seasonal dynamics of
these biota.
The BCs in the two contrasting lakes selected for this study were clearly
separated (Fig. 23A,B). Concentrations of TOC, TP, 24SO ,
3NO , O2 and alkalinity
best explained this distinction. Gradients of TOC together with primary productivity
were suggested previously as fundamental determinants of freshwater BCC dynamics
(Yannarell and Triplett 2004, Allgaier and Grossart 2006) as these parameters
integrate over the sources of energy used by bacteria for growth. For LZ, which had
three to four times higher TOC concentrations than LB, the number of bacterial cells
correlated significantly with the concentrations of TOC also in the depth gradient
(Table 8) and highly significantly with the concentrations of DOC (data not shown
because for LB most values were below or close to the detection limit of 0.50 mg l-1).
The application of PCR-based techniques has its limitations, e.g., the
preferential and nonspecific amplifications of DNA fragments probably leads to a
biased representation of the BCs when applying molecular fingerprinting tools such as
ARISA (Suzuki and Giovannoni 1996, Wang and Wang 1997, Sipos et al. 2007).

4.5 Discussion
99
However, ARISA was previously demonstrated to be a reliable method for exploring
temporal and spatial dynamics of BCs in freshwater ecosystems (Fisher and Triplett
1999, Yannarell et al. 2003, Shade et al. 2008). Additionally, it was used for the
determination of environmental driving forces determining freshwater BCC
(Yannarell and Triplett 2004, 2005, Shade et al. 2010). Therefore, we feel confident
that the determined shifts in ARISA profiles mirror the differences in BCC in the
lakes studied here.
In conclusion, the present study shows that not only the availability (TOC,
GlcN, AA), but also the degradation state of organic matter (CI) drive the abundance
and composition of lacustrine bacterioplankton. In the present study, CI, pH, and T
were identified as the main environmental factors that shape the BCC in the depth
gradient of two contrasting deep freshwater lakes. Particle-associated BCs appeared to
be more variable in their composition and more directly affected by seasonal
dynamics. These findings fit well to previous long-term studies of particle-associated
bacteria in temperate lakes. Thus, future studied on the environmental factors shaping
the vertical dynamics of lacustrine BCs should be analyzed on separated bacterial size
fractions. We further recommend to include the CI as a proxy for organic matter
degradation state in future investigations on the ecology of lacustrine bacteria.


5. CONTRIBUTION OF BACTERIAL CELLS TO
LACUSTRINE ORGANIC MATTER BASED ON AMINO
SUGARS AND D-AMINO ACIDS
Dörte Carstens, Krista E. Köllner, Helmut Bürgmann, Bernhard Wehrli and
Carsten J. Schubert
accepted Geochimica et Cosmochimica Acta
doi: 10.1016/j.gca.2012.04.052
Contributions of the authors:
The paper was written by Dörte Carstens. The sampling was done by Dörte Carstens
and Krista Köllner. Dörte Carstens did the biogeochemical analysis and interpretation
of data. Krista Köllner measured the cell counts and contributed to the interpretation
of the data. Bernhard Wehrli added significant contribution to the interpretation of the
data. Helmut Bürgmann significantly contributed to the conception of the study.
Carsten Schubert significantly contributed to the conception, the design, and the
interpretation of the presented study.
Contribution of bacterial cells to lacustrine organic matter based on amino sugars and D-amino acids
102
5.1. Abstract
Amino sugars (ASs), D-amino acids (D-AAs) and bacterial cell counts were
measured in two Swiss lakes to study the contribution of bacterial cells to organic
matter (OM) and the fate of ASs and bacterial amino biomarkers during OM
degradation. Concentrations of individual ASs (glucosamine, galactosamine, muramic
acid and mannosamine) in the particulate and total OM pools were analyzed in water-
column profiles of Lake Brienz (oligotrophic and oxic throughout the entire water
column) and Lake Zug (eutrophic, stratified and permanently anoxic below 170 m) in
spring and in fall. Generally, carbon-normalized AS concentrations decreased with
water depth, indicating the preferential decomposition of ASs. For Lake Brienz the
relative loss of particulate ASs was higher than in Lake Zug, suggesting enhanced AS
turnover in an oligotrophic environment. AS ratio changes in the water column
revealed a replacement of plankton biomass with OM from heterotrophic
microorganisms with increasing water depth. Similar to the ASs, highest carbon
normalized D-AA concentrations were found in the upper water column with
decreasing concentrations with depth and an increase close to the sediments. In Lake
Zug, an increase in the percentage of D-AAs also showed the involvement of bacteria
in OM degradation. Estimations of OM derived from bacterial cells using cell counts
and the bacterial biomarkers muramic acid and D-AAs gave similar results. For Lake
Brienz 0.2-14% of the organic carbon pool originated from bacterial cells, compared
to only 0.1-5% in Lake Zug. Based on our estimates, muramic acid appeared
primarily associated with bacterial biomass and not with refractory bacterial
necromass. Our study underscores that bacteria are not only important drivers of OM
degradation in lacustrine systems, they also represent a significant source of OM
themselves, especially in oligotrophic lakes.
5.2. Introduction
In nature, bacteria are key drivers for organic matter (OM) cycling. In the
oceans about 50% of the planktonic primary production is processed through the
microbial loop (Ducklow 2000). Fresh OM has high carbon-normalized yields of
amino acids (AAs), neutral sugars, and amino sugars (ASs) (Cowie and Hedges 1992;
Benner and Kaiser 2003). During OM decomposition, heterotrophic bacteria
5.2 Introduction
103
preferentially utilize these reactive organic components (Cowie and Hedges 1992,
Wakeham et al. 1997, Amon et al. 2001). While AAs have been widely measured in
marine and lacustrine systems (Lee and Cronin 1982, Dauwe et al. 1999, Rosenstock
and Simon 2001), only a few studies in aquatic science focus on ASs (Benner and
Kaiser 2003, Fernandes et al. 2006, Tremblay and Benner 2009), despite the fact that
they are considered to play a significant role in the nutrient cycle of aquatic systems
(Nedoma et al. 1994, Vrba et al. 1997, Benner and Kaiser 2003). An abundant
biopolymer consisting of ASs is chitin, a homopolymer of N-acetyl-D-glucosamine.
The total annual chitin production in aquatic environments was estimated to 2.8 × 10¹⁰
kg chitin yr−1 in freshwater systems and to 1.3 × 10¹² kg chitin yr−1 for marine
ecosystems (Cauchie 2002). Up to 10% of the marine bacterial community could be
sustained by chitin (Kirchman and White 1999). Other sources of ASs are
polysaccharides, glycoproteins, and glycolipids that are common to many organisms
(Sharon 1965). During degradation of OM, the AS composition changes e.g. the ratio
between glucosamine (GlcN) and galactosamine (GalN) decreases with progressing
degradation (Benner and Kaiser 2003, Davis et al. 2009). Besides being actively
involved in OM degradation, bacteria themselves build up new biomass. The bacterial
cell wall polymer peptidoglycan comprises GlcN and muramic acid (MurA), an AS
that is unique to bacteria. As peptidoglycan is recycled within 10-167 d after organism
death (Nagata et al. 2003), MurA can serve as a valuable biomarker for living bacteria
and recent bacterial necromass (Moriarty 1975, Benner and Kaiser 2003, Niggemann
and Schubert 2006). Another group of organic molecules which mainly derive from
bacterial membranes are D-amino acids (D-AAs) which can amount to 1-3% of the
dry weight of bacterial cells (Salton 1994). By analyzing these biomarkers, the
contribution of bacteria to the OM pool has been studied in marine environments
(McCarthy et al. 1998, Ogawa et al. 2001, Kaiser and Benner 2008), estuaries
(Bourgoin and Tremblay 2010), and rivers (Tremblay and Benner 2009).
It is well known that redox conditions have a direct effect on bacterial
metabolism and consequently on the transformation pathways for specific organic
compounds (Sun et al. 2002). For instance, studies on OM degradation processes
showed more rapid degradation under oxic than under anoxic conditions (Harvey et al.
1995, Nguyen and Harvey 1997, Hedges et al. 1999). Most of these studies report on
incubation experiments and concentrate on the degradation of OM in marine systems;
field studies in lacustrine systems are rare.

Contribution of bacterial cells to lacustrine organic matter based on amino sugars and D-amino acids
104
This study aimed to estimate the contribution of bacterial cells to the OM pool
in lacustrine systems with different trophic level and to investigate whether relations
exist between nutrient status of a lake, preservation conditions, and AS compositional
changes during OM degradation. Therefore, two contrasting lakes (oligotrophic and
fully oxic versus eutrophic, stratified, and anoxic) in central Switzerland were
investigated. Concentrations of single particulate ASs (PAS), particulate D-AA, and
total ASs (TAS) were analyzed in the water columns of Lake Brienz and Lake Zug in
two seasons. Bacterial cell counts were compared to quantitative estimates on the
contribution of bacterial cells to OM based on the bacterial biomarkers MurA, D-
alanine (D-Ala), and D-glutamic acid (D-Glx).
5.3. Methods
5.3.1. Sampling sites
Lake Brienz is a peri-alpine lake located in the northern ranges of the Swiss
Alps, with a surface area of 29.8 km2 (Fig. 5). It has a maximum depth of 259 m and a
volume of 5.2 km3. The catchment of the lake is drained by the two main inflows, the
Aare and the Lütschine, which together transport an annual average of 300,000 tons of
suspended material into Lake Brienz (Finger et al. 2006). In contrast to the particle
load, the nutrient input is low, resulting in an oligotrophic state of the lake. Lake
Brienz was sampled in the central part at position 46°43'18''N/7°58'27''E where the
lake has a depth of 250 m in May and September 2009.
Lake Zug is a eutrophic sub-alpine lake in central Switzerland about 30 km
south of Zurich. Its maximum depth is 198 m and the volume of the lake is 3.2 km3
with a surface area of 38.4 km2. Samples were taken in March and October 2009 at
the deepest point of the lake at position 47°6'1''N/8°29'4''E. The sampling site is
located in the meromictic southern basin of Lake Zug, where permanently anoxic
conditions prevail below 170 m (Mengis et al. 1997).
5.3.2. Sampling
Water samples were taken with Niskin bottles in ten depths distributed over
the entire water column (Lake Brienz: 5, 10, 20, 30, 40, 70, 100, 150, 200 and 240 m;
Lake Zug: 5, 10, 15, 25, 60, 80, 100, 130, 170 and 190 m). The samples were split
into separate aliquots for microbial and geochemical analyses. Water samples for the

5.3 Methods
105
microbial analysis were filled into autoclaved glass bottles (1 L) and transported cool
and in the dark to the laboratory. For the analysis of TAS, a sample aliquot was
poisoned with saturated HgCl2 solution and stored at -20 °C until further processing.
Particulate matter (POM) was sampled at the same water depths with in situ
pumps (McLane) onto two stacked precombusted glass fiber filters (GF/F filters, 142
mm diameter) with a nominal pore size of 0.7 μm (Whatman) until filters were
clogged. Between 23 to 45 L of water were filtered in Lake Zug, whereas for Lake
Brienz between 27 and 106 L were filtered. The filters were frozen directly after
sampling and kept at -20 °C until analysis.
A 95 μm double closing net (Bürgi and Züllig 1983) was used to take an
integrated plankton sample from 0-100 m water depth. The plankton samples were
preserved in 2% formaldehyde.
Profiles of temperature, oxygen and conductivity were taken at each sampling
campaign with a CTD-profiler (Seabird SBE19).
Primary productivity was estimated using the 14C-bicarbonate incubation
method (Steeman-Nielsen 1952). For 13 water depths between 0 and 25 m, 120 mL of
water were inoculated with 15 μCi NaH14CO3. The Duran bottles were then incubated
in situ for 3 h between 11:00 and 14:00 CET at the according water depths where the
samples had been recovered. Afterwards, the samples were processed following the
acid bubbling method of Gächter and Marès (1979). Therefore, the samples were split
into two aliquots and the radioactivity of the added inorganic carbon was measured in
one aliquot directly with a liquid scintillation spectrometer (TRICARB, Packard). The 14C activity of the organic substances built up during incubation was measured in the
second aliquot after removal of the non-incorporated 14C by acidification and
bubbling. The carbon assimilation rate was calculated as the fraction of incorporated 14C multiplied by the total dissolved inorganic carbon, which was determined from
alkalinity and pH measurements according to Rodhe (1958).
5.3.3. Chemical analysis of water samples
Total organic carbon (TOC) and nitrogen (TN) concentrations of the water
samples were measured by high temperature catalytic oxidation using a Shimadzu
TOC-V CPH / TNM1 analyzer with a measurement error of 0.2 mg L-1 and a
detection limit of 0.5 mg L-1.

Contribution of bacterial cells to lacustrine organic matter based on amino sugars and D-amino acids
106
Total amino sugar (TAS) concentrations in the water were measured using the
method of Kaiser and Benner (2000). Due to low TAS concentrations, it was
necessary to pre-concentrate the water samples. Thus, 45 mL of the water samples
were lyophilized and redissolved in 2 mL of 3 mol L-1 HCl (Merck). For hydrolysis,
the samples were flushed with nitrogen and kept 5 hours at 100 °C. After adding the
internal standard 3-amino-3-deoxy-glucose hydrochloride for quantification (prepared
from 3-acetamido-3-deoxy-D-glucose, TRC), the samples were neutralized with an
AG11 A8 resin (50-100 mesh; Bio-Rad) and desalted with an AG50 X8 resin (200-
400 mesh; Bio-Rad) for GlcN, GalN and mannosamine (ManN). The clean-up
procedure for MurA was performed separately with AG50 X8 resin (100-200 mesh;
Bio-Rad). Subsequently, ASs were separated using a metal-free high performance
liquid chromatography system (Jasco) with a PAD ED50 detector (Dionex), equipped
with a gold working electrode and a pH Ag/AgCl reference electrode. A CarboPac
PA1 column (250 mm × 4 mm inner diameter; Dionex) with a CarboPac PA1 guard
column (50 mm × 4 mm inner diameter; Dionex) was used. For the separation of
GlcN, GalN and ManN the eluent was 12 mmol L-1 NaOH under isocratic conditions
with a flow rate of 1 mL min-1. The separation of MurA was conducted at the same
flow rate but with 99.6 mmol L-1 NaOH and 100 mmol L-1 sodium acetate as eluent
under isocratic conditions. After hydrolysis, ASs are in the deacetylated form. This is
the form which was used for calculation of AS yields. As ASs occur in nature
commonly in the acetylated form, the presented calculations might underestimate AS
carbon by up to 25% (Benner and Kaiser 2003). The relative standard error of the
measurement was <13% for all measured ASs. The plankton samples were analyzed
with the same procedure.
5.3.4. Chemical analysis of particulate organic matter
For the particulate amino sugar (PAS) analysis, one quarter of each filter was
hydrolyzed with 6 mol L-1 HCl for 10 hours at 100 °C under N2. Based on earlier
experiments of Klauser (2007) this procedure gave highest yields. The hydrolyzate
was then processed following a slightly modified method after Zhang and Amelung
(1996) including a derivatization step according to Guerrant and Moss (1984) and
with myo-inositol (Aldrich) as internal standard. 1 μL of the derivatized extract was
injected into a GC system equipped with a flame ionization detector (HRGC 5160,
Carlo Erba Instruments), a split-splitless injector and a VF-5 MS column (60 m, 0.25
5.3 Methods
107
mm inner diameter and 0.25 μm film thickness; Varian). The injector temperature was
250 °C and the temperature of the detector was 300 °C. Hydrogen was used as carrier
gas with a flow rate of 2 mL min-1. The following temperature program was used:
from 120 °C to 200 °C at 20 °C min-1, from 200 °C to 250 °C at 2 °C min-1, and from
250 °C to 270 °C at 20 °C min-1 held 10 minutes at 270 °C. For quantification
standards of D-GlcN (Sigma), D-ManN (Aldrich), D-GalN (Fluka), MurA (Sigma)
and myo-inositol (Aldrich) were derivatizated and measured on the GC system. The
PAS concentrations were normalized to the amount of filtered water. The relative
standard errors of triplicate analysis were 3-7% for GalN and GlcN and 11-19% for
ManN and MurA.
For the analysis of particulate D-AAs, one quarter of each filter was
hydrolyzed with 6 mol L-1 HCl for 20 hours at 110 °C under N2. Prior to hydrolysis,
L-norleucine (Sigma) was added as internal standard. After drying under vacuum at
40 °C, samples were redissolved in 0.01 mol L-1 HCl and processed according to Popp
et al. (2007). In brief, samples were purified by cation-exchange chromatography
(Dowex 50W X8 resin, 200-400 mesh; BioRad) as described by Metges et al. (1996).
After the purification step, samples were reacidified with 0.02 mol L-1 HCl at 110 °C
for 5 min. Samples were then esterified with acidified isopropanol (4:1
isopropanol:acetyl chloride; Sigma Aldrich and Fluka) at 110 °C for 60 min and
derivatized with 3:1 dichloromethane:trifluoroacetic anhydride (LabScan and Fluka)
at 100 °C for 15 min to form trifluoroacetic amino acid esters. After drying, further
purification was achieved by redissolving the sample in 1:2 chloroform
(Mallinckrodt):phosphate-buffer (KH2PO4 + Na2HPO4 (both Fluka) in nanopure water,
pH 7), shaking it vigorously and transferring the chloroform phase into a separate vial.
Afterwards, the acylation step was repeated. The derivatized samples were dried,
dissolved in ethyl acetate (Merck) and analyzed on a GC system with a flame
ionization detector (Shimadzu) and a Chirasil-L-Val column (25 m, 0.25 μm inner
diameter and 0.12 μm film thickness; Varian) using the following temperature settings:
injector 180 °C, detector 280 °C, oven program: 80 °C held 5 min, 3.5 °C min-1 to
120 °C held 3 min, 4 °C min-1 to 152 °C held 3 min, 5 °C min-1 to 195 °C held 10 min.
The flow rate was 0.5 mL min-1. Known amounts of D-Ala and D-Glx (Sigma)
standards were derivatized and measured for quantification. D-AA concentrations
were corrected for racemization during hydrolysis following Kaiser and Benner
(2005). They determined the hydrolysis-induced racemization of free AAs and

Contribution of bacterial cells to lacustrine organic matter based on amino sugars and D-amino acids
108
proteins. Average percentages of single D-enantiomers (%D = 100 × D/(D+L))
produced during acid hydrolysis of the L-enantiomers in those experiments were used
for correction of natural samples and were the following for D-Ala and D-Glx: 1.2%
and 2.0%, respectively (Kaiser and Benner 2005). The relative standard errors of
measurement were 4% for D-Ala and 9% for D-Glx.
Chlorin concentrations were measured on the POM samples using the
procedure described by Schubert et al. (2005). The ratio of the fluorescence intensity
of the acidified sample to the fluorescence intensity of the non-acidified original
extract represents the Chlorin-Index (CI), which serves as a proxy for OM freshness
(Schubert et al. 2005). The value of the CI for fresh chlorophyll a is 0.2 and increases
up to unity for highly degraded organic material.
5.3.5. Bacterial cell counts
Bacterial cells were counted using flow cytometric measurements as described
by Hammes et al. (2008). Briefly, bacterial cells were stained with 10 μL mL-1 SYBR
Green I (1:100 dilution in dimethyl sulfoxide; Molecular Probes) and incubated in the
dark for 15 min at room temperature. The measurements were carried out on a
CyFlow Space instrument (Partec) with a 200 mW laser, emitting light at a fixed
wavelength of 488 nm and a volumetric counting hardware. At a wavelength of 520
(±20) nm, green fluorescence was determined and red fluorescence above 630 nm.
The flow rate was 200 mL min-1. For data analysis the Flowmax software (Partec) was
used. Samples were diluted with cell-free water so that the measured concentration
was between 20 and 500 events sec-1. The standard error of triplicate measurements
was <10%.
5.4. Results
5.4.1. Physico-chemical characterization of the water columns
The water column of Lake Brienz was fully oxic in spring and in fall with
values between 7.3 and 10.2 mg L-1 (Fig. 26). TOC concentrations varied between 0.5
and 0.9 mg L-1 in spring and in fall, showing highest values in the upper water layers
(Fig. 26). The TN concentrations in Lake Brienz were below the detection limit of 0.5
mg N L-1 throughout the water column in both seasons. In spring, the areal primary
production was estimated at 22 mg C m-2 h-1, where the depth of maximum primary
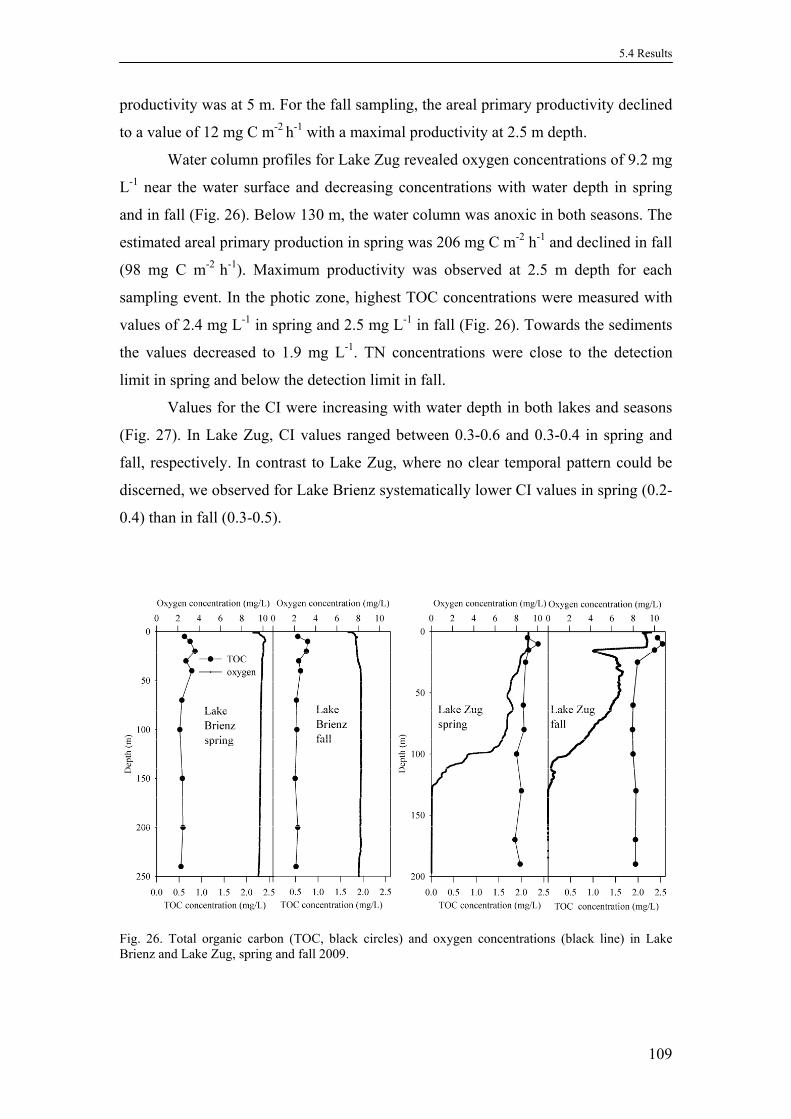
5.4 Results
109
productivity was at 5 m. For the fall sampling, the areal primary productivity declined
to a value of 12 mg C m-2 h-1 with a maximal productivity at 2.5 m depth.
Water column profiles for Lake Zug revealed oxygen concentrations of 9.2 mg
L-1 near the water surface and decreasing concentrations with water depth in spring
and in fall (Fig. 26). Below 130 m, the water column was anoxic in both seasons. The
estimated areal primary production in spring was 206 mg C m-2 h-1 and declined in fall
(98 mg C m-2 h-1). Maximum productivity was observed at 2.5 m depth for each
sampling event. In the photic zone, highest TOC concentrations were measured with
values of 2.4 mg L-1 in spring and 2.5 mg L-1 in fall (Fig. 26). Towards the sediments
the values decreased to 1.9 mg L-1. TN concentrations were close to the detection
limit in spring and below the detection limit in fall.
Values for the CI were increasing with water depth in both lakes and seasons
(Fig. 27). In Lake Zug, CI values ranged between 0.3-0.6 and 0.3-0.4 in spring and
fall, respectively. In contrast to Lake Zug, where no clear temporal pattern could be
discerned, we observed for Lake Brienz systematically lower CI values in spring (0.2-
0.4) than in fall (0.3-0.5).
Fig. 26. Total organic carbon (TOC, black circles) and oxygen concentrations (black line) in Lake Brienz and Lake Zug, spring and fall 2009.

Contribution of bacterial cells to lacustrine organic matter based on amino sugars and D-amino acids
110
Fig. 27. Profiles of GlcN:GalN ratios and Chlorin-Indices (CI) in the particulate matter of Lake Brienz and Lake Zug, spring and fall 2009.
5.4.2. Total amino sugar concentrations
In Lake Brienz, TAS concentrations of the unfiltered water were below the
detection limit in all samples. TAS concentrations in Lake Zug (Table 11) were higher
than in studied open marine systems e.g. Pacific Ocean; Benner and Kaiser (2003),
but were similar, for example to values found in Lake Murray (South Carolina, USA;
Kawasaki and Benner (2006)). Carbon-normalized TAS concentrations in Lake Zug
were highest in the upper water layers (Fig. 28). In spring, the TAS yields decreased
slightly with depth. For MurA yields in spring a strong decrease below 5 m water
depth and a strong increase just above the sediments were observed. In fall, a marked
decline below 15 m was measured for all ASs. The contribution of TAS to TOC was
0.9 to 1.6% in spring and 0.6 to 2.7% in fall (Table 11). GlcN was the most abundant
AS, contributing 52-68% to the TAS pool, followed by GalN (31-45%). MurA
accounted for 0.2-1.5% of TAS. The GlcN:GalN ratios of the unfiltered water had
values of 1.2-2.2 in spring and 1.2-1.8 in fall pointing to a bacterial origin of the ASs
and diagenetic alteration (data not shown).

5.4 Results
111
Table 11. Molar particulate and total amino sugar concentrations in Lake Zug, spring and fall 2009
%T
OC
as
TH
AS
1.60
1.08
1.61
1.31
1.31
1.00
1.00
1.15
0.90
0.91
2.47
2.70
2.43
1.29
1.15
1.01
0.60
1.00
1.11
1.25
Mur
A
tota
l
(nm
ol L
-1)
4.4
1.2
1.4
1.2
1.3
1.2
1.5
1.5
1.3
3.8
4.3
5.2
4.1
1.8
0.7
1.3
1.6
1.4
0.7
1.6
Gal
N
tota
l
168.
7
148.
5
190.
1
156.
6
162.
1
130.
0
105.
1
115.
8
99.7
99.7
367.
0
358.
6
353.
2
122.
6
125.
4
90.8
69.1
108.
3
124.
0
103.
9
Man
N
tota
l
bd
19.8
29.0
24.6
7.7
bd
8.5
16.5
bd
bd
26.2
32.9
17.7
1.7
14.4
1.0
4.3
11.3
13.2
1.9
Glc
N
tota
l
299.
3
187.
3
261.
6
196.
6
201.
3
155.
1
147.
4
185.
5
130.
8
143.
6
434.
5
553.
1
419.
6
228.
4
161.
6
168.
5
80.4
149.
1
161.
7
229.
8
%T
OC
as
PA
S
0.30
0.09
0.07
0.07
0.05
0.06
0.07
0.06
0.07
0.08
0.09
0.16
0.04
0.04
0.02
0.02
0.02
0.03
0.04
0.05
Mur
A
PO
M
(nm
ol L
-1)
4.2
1.2
0.6
0.9
0.9
0.6
1.0
0.7
1.3
3.4
3.3
5.4
2.1
0.3
0.7
0.3
0.3
0.6
0.4
0.4
Gal
N
PO
M
10.8
7.9
5.5
3.5
3.1
5.4
3.6
4.4
3.9
4.5
2.8
9.3
2.8
2.5
1.4
1.8
1.2
2.4
2.1
3.6
Man
N
PO
M
2.4
0.9
0.9
1.0
0.3
1.0
0.2
0.8
0.9
0.9
2.5
2.6
0.1
0.2
0.2
0.1
0.1
0.1
0.5
0.2
Glc
N
PO
M
70.6
19.1
12.3
14.2
8.5
11.0
12.0
10.2
10.7
12.7
21.6
35.6
8.0
6.6
3.0
3.9
2.8
5.9
6.3
10.3
TO
C
(μm
ol L
-1)
178
198
180
175
170
172
158
167
155
165
203
212
197
165
157
156
157
163
162
162
Dep
th
(m)
Lak
e Z
ug s
prin
g 5 10
15
25
60
80
100
130
170
190
Lak
e Z
ug f
all 5 10
15
25
60
80
100
130
170
190
Abbreviations used: TOC, total organic carbon; POM, particulate organic matter; GlcN, glucosamine; ManN, mannosamine; GalN, galactosamine; MurA, muramic acid; PAS, particulate amino sugars; THAS, total hydrolysable amino sugars; bd, below detection limit.

Contribution of bacterial cells to lacustrine organic matter based on amino sugars and D-amino acids
112
Fig. 28. Carbon-normalized total amino sugar (TAS) yields in Lake Zug, spring and fall 2009.
5.4.3. Amino sugars in POM
The PAS concentrations were approximately one order of magnitude higher in
Lake Zug than in Lake Brienz in both seasons (see Table 11 and Table 12). Lake Zug
had particulate GlcN concentrations between 8.5 and 70.6 nmol L-1 in spring with the
highest value in 5 m depth and the lowest value in 60 m depth. In fall, the
concentrations were systematically lower with values between 2.8 and 35.6 nmol L-1.
Also in Lake Brienz highest concentrations were found in the upper water layers (2.9
nmol L-1 in spring and 0.9 nmol L-1 in fall). Lowest concentrations were in both
seasons 0.7 nmol L-1 in the lower water column. Similar to the TAS, the PAS carbon-
normalized concentrations were highest in the upper water layers (Fig. 29). For both
lakes and seasons, a steep decline in the PAS yields could be observed below 10 m
water depth. In spring and in fall, we observed an increase in MurA concentrations
close to the sediments in Lake Brienz. A similar feature was also observed in Lake
Zug, but only during the spring sampling. In Lake Brienz, PAS comprised 0.01-0.2%
of the TOC. For Lake Zug the contribution of PAS to the TOC pool was slightly
higher (0.02-0.3% of the TOC, Table 11). Generally, GlcN was the most abundant
PAS in all samples with yields between 1.2-18.7 nmol (mg C)-1 in Lake Brienz and
between 2.8 and 35.6 nmol (mg C)-1 in Lake Zug. GlcN comprised 35-70 mol% of
PAS in Lake Brienz and 56-80 mol% of PAS in Lake Zug. GalN represented the
second largest PAS fraction followed by MurA, except for the lower water column of
Lake Brienz in fall (below 100 m), in spring the 5 m sample in Lake Brienz and in fall
the 5 m sample in Lake Zug where the MurA concentrations were higher than those of

5.4 Results
113
Table 12. Molar particulate amino sugar concentrations in Lake Brienz, spring and fall 2009 Depth TOC GlcN ManN GalN MurA %TOC (m) (umol L-1) POM POM POM POM as
(nmol L-1) PAS Lake Brienz spring
5 52 8.4 1.0 2.6 2.9 0.19 10 62 13.9 1.9 2.5 2.3 0.21 20 71 4.6 0.6 1.2 1.0 0.07 30 54 3.9 0.2 1.1 0.9 0.07 40 65 2.6 0.1 0.7 0.5 0.04 70 47 1.2 0.1 0.3 0.1 0.02
100 43 0.7 0.1 0.3 0.2 0.02 150 48 0.8 0.1 0.3 0.1 0.02 200 49 0.7 0.1 0.3 0.1 0.01 240 45 1.2 0.1 0.5 0.4 0.03
Lake Brienz fall 5 46 3.7 0.7 1.5 0.9 0.09
10 64 2.8 0.7 0.7 0.9 0.05 20 62 3.9 0.5 2.2 0.5 0.07 30 48 0.8 0.5 0.3 0.6 0.03 40 51 1.0 0.1 0.3 0.4 0.02 70 43 0.7 0.1 0.2 0.1 0.02
100 44 0.9 0.1 0.3 0.3 0.02 150 41 0.7 0.1 0.2 0.4 0.02 200 46 1.1 0.2 0.4 1.0 0.04 240 43 1.9 0.2 0.4 0.7 0.05
Abbreviations used: TOC, total organic carbon; POM, particulate organic matter; GlcN, glucosamine; ManN, mannosamine; GalN, galactosamine; MurA, muramic acid; bd = below detection limit.
GalN. ManN was the least abundant AS. GlcN:GalN ratios ranged between 1.8 and
5.6 in Lake Brienz and between 2.0 and 6.6 in Lake Zug (Fig. 27). Highest
GlcN:GalN ratios were generally observed in the upper water column, with
decreasing values towards the sediments, with the exception of the 240 m sample in
Lake Brienz in fall, which is most likely an outlier, as the GlcN:GalN ratio can not be
explained by resuspension from sediments, which had a GlcN:GalN ratio of 1.9 at the
surface (data not shown) and another source of GlcN can be excluded.
In Lake Zug, PAS contributed between 3 to 9% to the TAS concentration in
spring, except for the 5 m water sample, where it contributed up to 18%. In fall, the
relative contribution of PAS to the total AS pool was strongly reduced when
compared to the spring profile (by ~50% for all water depths and by 80% in the
surface water).

Contribution of bacterial cells to lacustrine organic matter based on amino sugars and D-amino acids
114
Fig. 29. Carbon-normalized particulate amino sugar (PAS) yields in Lake Brienz and Lake Zug, spring and fall 2009.
The AS compositions of the plankton >95 μm were quite similar in both lakes
with comparatively high yields of GlcN (> 150 nmol (mg C)-1, Table 13). GlcN:GalN
ratios were 6.2 for Lake Brienz and 9.7 for Lake Zug.
Table 13. Elemental and amino sugar composition of the plankton >95 μm
C N GlcN GalN ManN (%) (%) (nmol/mgC) (nmol/mgC) (nmol/mgC) Lake Brienz 52.1 9.0 164.4 26.6 2.4 Lake Zug 42.4 8.8 223.9 23.0 2.7
Abbreviations used: C, carbon content; N, nitrogen content; GlcN, glucosamine; GalN, galactosamine; ManN, mannosamine.

5.4 Results
115
5.4.4. D-Amino acids in POM
In spring, the range of molar concentrations of D-Ala were similar in both
lakes with values between 0.4 and 8.5 nmol L-1 in Lake Brienz and 1.2 and 6.4 nmol
L-1 in Lake Zug (Table 14). Highest concentrations were found in the upper water
layers. D-Glx concentrations were in both lakes lower with 0.1-0.9 nmol L-1 and 1.5-
4.7 nmol L-1 in Lake Brienz and Lake Zug, respectively. D-AA concentrations
decreased with water depth. In fall, the concentrations in the upper water layers were
similar to the spring sampling, but in the lower water column concentrations were
lower. Below 130 m, a subtle increase in D-Ala was observed in Lake Zug for the
spring and fall sampling. This was also the case for the 240 m depth in Lake Brienz in
spring. D-AA concentrations were below the detection limit in almost all of the fall
samples of Lake Brienz (Table 14). The patterns of the molar L-Ala and L-Glx
concentrations looked similar to those of the D-AAs with high concentrations in the
upper water layers, decreasing concentrations below the zone of primary productivity
and an increase just above the sediments. In spring, the L-AA concentrations were in
the same range in both lakes but with higher concentrations in Lake Zug. In fall, the
L-AA concentrations were almost one order of magnitude higher in Lake Zug than in
Lake Brienz.
D-AA carbon normalized concentrations are illustrated in Fig. 30. For Lake
Brienz in spring the pattern was similar to that of MurA. Also in Lake Zug the yields
were highest in the upper water layers. In fall, a decrease in D-AA yields with depth
Fig. 30. Carbon-normalized particulate D-amino acid (D-AA) yields in Lake Brienz and Lake Zug, spring and fall 2009.

Contribution of bacterial cells to lacustrine organic matter based on amino sugars and D-amino acids
116
and a slight increase above the sediments was observed. For the spring sampling there
was no consistent trend with depth in Lake Zug. The percentage of D-AAs (%D = 100
× (D/(D+L)); with D: molar concentration of D-AAs and L: molar concentration of
the corresponding L-AAs) was 2.4-8.5% for the spring sampling in Lake Brienz and
in Lake Zug 1.9-9% and 1.1-4.9% in spring and in fall, respectively (Table 14).
Table 14. Molar particulate D-amino acid and corresponding L-amino acid concentrations and percentages of D-AAs (%D) in Lake Brienz and Lake Zug, spring and fall 2009
%D
7.4 -
5.1 - - - - - - -
1.1
1.5
2.5
2.6
1.9
3.0
4.9
2.5
2.9
3.3
L-G
lx
(nm
ol L
-1)
65.3
32.0
32.2
12.7
37.5
10.0
13.7
6.6
14.8
17.9
469.
3
341.
7
124.
7
36.0
17.8
13.7
25.4
52.5
46.2
91.4
D-G
lx
bd bd bd bd bd bd bd bd bd bd 3.8
2.4
2.5 bd 0.1 bd bd bd bd bd
L-A
la
35.4 bd 5.1
1.0
13.0 9.1
3.3 bd 1.6 bd
282.
1
242.
1
95.3
34.9
15.9
24.3 3.5
13.2
37.7
60.7
D-A
la
fall
2.8 bd 0.3 bd bd bd bd bd bd bd
fall
4.7
6.5
3.2
1.9
0.6
0.7
0.2
0.3
1.1
2.1
%D
3.3
4.8
2.2
8.5
2.3
4.5
2.9
3.4
2.4
4.4
1.9
3.3
3.6
3.4
8.2
9.0
7.9
5.0
9.0
6.6
L-G
lx
(nm
ol L
-1)
163.
3
111.
5
74.2
43.8
38.2
17.8
16.9
13.2
14.7
22.0
248.
2
212.
5
187.
0
80.8
40.2
24.4
48.2
40.6
33.0
36.8
D-G
lx
0.4
0.9
0.3 bd bd 0.2
0.1
0.1
0.1
0.3
2.7
3.8
4.8
1.8
3.1
1.7
3.0
1.6
2.4
2.1
L-A
la
103.
2
57.5
46.8
26.7
17.8
10.3
5.7
5.2
4.4
7.1
108.
8
53.1
117.
6
108.
1
7.9
20.4
32.6
22.2
30.1
53.9
D-A
la
8.6
7.6
2.4
2.5
1.3
1.1
0.6
0.6
0.4
1.0
4.3
5.3
6.5
4.7
1.2
2.7
4.0
1.7
3.9
4.3
Dep
th (
m)
Lak
e B
rien
z
spri
ng 5 10 20 30 40 70 100
150
200
240
Lak
e Z
ug
spri
ng 5 10 15 25 60 80 100
130
170
190
Abbreviations used: D-Ala, D-alanine; L-Ala, L-alanine; D-Glx, D-glutamic acid; L-Glx, L-glutamic acid; %D = 100 × (D/(D+L)); bd = below detection limit.
5.4.5. Bacterial cell counts
In both lakes, bacterial cell counts were in the same order of magnitude
(3.8x10⁸ - 2.9x10⁹ cells L-1); however, Lake Zug exhibited higher counts. The highest
bacterial abundances were detected in the epilimnion, i.e. the zone of primary
production (Fig. 31). The bacterial cell counts decreased with water depth. In Lake
Brienz surface water, bacterial cell counts were higher in spring than in fall. Between
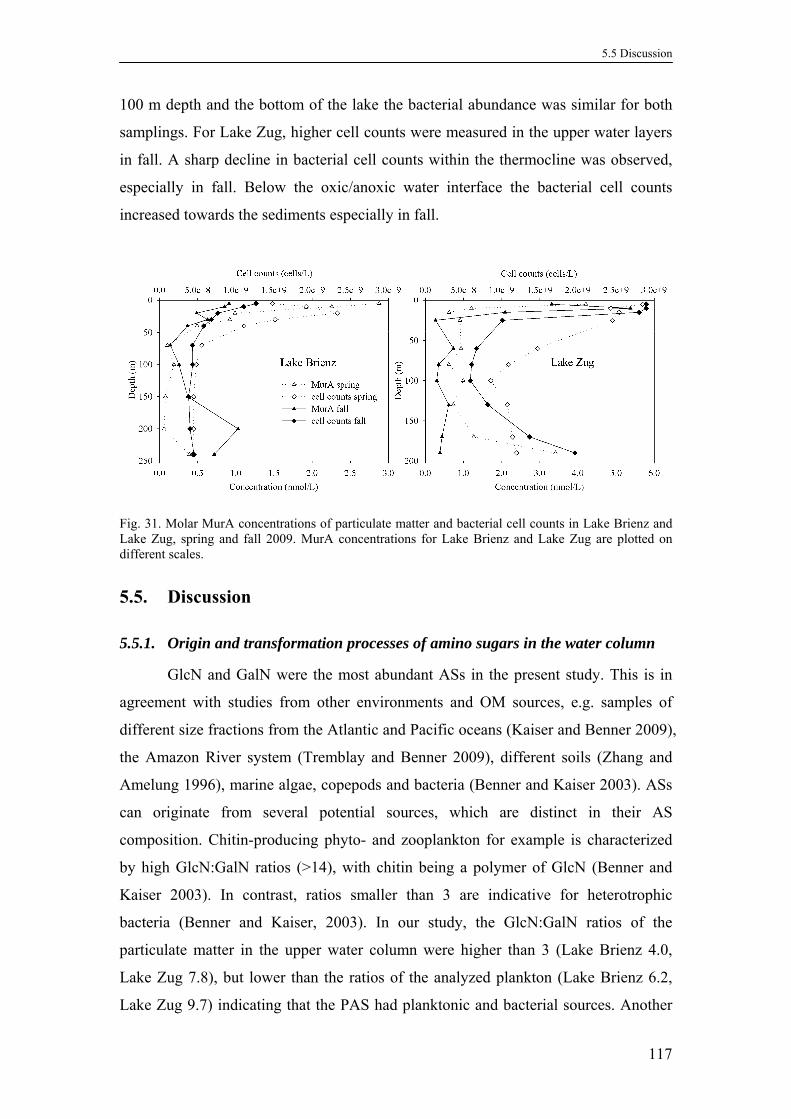
5.5 Discussion
117
100 m depth and the bottom of the lake the bacterial abundance was similar for both
samplings. For Lake Zug, higher cell counts were measured in the upper water layers
in fall. A sharp decline in bacterial cell counts within the thermocline was observed,
especially in fall. Below the oxic/anoxic water interface the bacterial cell counts
increased towards the sediments especially in fall.
Fig. 31. Molar MurA concentrations of particulate matter and bacterial cell counts in Lake Brienz and Lake Zug, spring and fall 2009. MurA concentrations for Lake Brienz and Lake Zug are plotted on different scales.
5.5. Discussion
5.5.1. Origin and transformation processes of amino sugars in the water column
GlcN and GalN were the most abundant ASs in the present study. This is in
agreement with studies from other environments and OM sources, e.g. samples of
different size fractions from the Atlantic and Pacific oceans (Kaiser and Benner 2009),
the Amazon River system (Tremblay and Benner 2009), different soils (Zhang and
Amelung 1996), marine algae, copepods and bacteria (Benner and Kaiser 2003). ASs
can originate from several potential sources, which are distinct in their AS
composition. Chitin-producing phyto- and zooplankton for example is characterized
by high GlcN:GalN ratios (>14), with chitin being a polymer of GlcN (Benner and
Kaiser 2003). In contrast, ratios smaller than 3 are indicative for heterotrophic
bacteria (Benner and Kaiser, 2003). In our study, the GlcN:GalN ratios of the
particulate matter in the upper water column were higher than 3 (Lake Brienz 4.0,
Lake Zug 7.8), but lower than the ratios of the analyzed plankton (Lake Brienz 6.2,
Lake Zug 9.7) indicating that the PAS had planktonic and bacterial sources. Another
Contribution of bacterial cells to lacustrine organic matter based on amino sugars and D-amino acids
118
reason of lower GlcN:GalN ratios in the particulate matter is biodegradation of the
planktonic matter which coincides with decreasing GlcN:GalN ratios (Liebezeit 1993,
Benner and Kaiser 2003). Based on the 1:1 ratio of GlcN and MurA in peptidoglycan
(Schleifer and Kandler 1972) we calculated the percentage of GlcN derived from
bacterial peptidoglycan (GlcNpeptidoglycan(%) = 100 - (cGlcN-cMurA)/cGlcN × 100, with
cGlcN and cMurA being the molar concentrations of GlcN and MurA). Based on this
equation, in the uppermost water layer of Lake Brienz, bacterial cell walls contributed
34% of the particulate GlcN in spring and 25% in fall. In contrast, in Lake Zug these
fractions of bacterial cell wall derived GlcN were smaller, 6% and 15%, respectively.
However, the ratios of GlcN:GalN in the POM decreased with water depth and had
values smaller than 3 in both lakes and seasons. This indicates a shift from a
planktonic AS signature towards the signal of heterotrophic microorganisms and
progressing diagenesis (Ogawa et al. 2001, Benner and Kaiser 2003, Kawasaki and
Benner 2006). For Lake Zug also an increase in %D from the upper water layers to
the anoxic zone was observed. An increase in %D with water depth was also found
e.g. in the St. Lawrence Estuary by Bourgoin and Tremblay (2010) and indicates
bacterial degradation of POM. In Lake Brienz no consistent trend in %D was
observed. Progressive degradation of sinking OM is also indicated by an increase in
CI values with water depth. During the fall sampling, degradation seemed to be
enhanced in Lake Brienz, as the CI gradient was more pronounced (Fig. 27). At the
same time the GlcN:GalN ratios were lower in the upper water column compared to
spring, indicating a higher contribution of bacteria to the particulate matter and a
direct link between bacterial build-up and organic matter freshness. In Lake Zug, a
somewhat different pattern was observed: CI values in the upper water column were
higher and GlcN:GalN ratios smaller in spring than in fall.
In contrast to the PAS composition, the TAS pool comprised a rather small
proportion of MurA in Lake Zug. The contribution of particulate MurA to the total
MurA concentration reached 45 to 98% in spring. Whereas particulate GlcN and GalN
contributed only up to 23% and 6% to the total GlcN and GalN concentrations,
respectively. This agrees with findings from Benner and Kaiser (2003) from the
Pacific Ocean, where MurA yields were higher in POM than in DOM samples.
Furthermore, Nedoma et al. (1994) could not detect MurA in the dissolved form in
freshwater environments and Jørgensen et al. (2008) found only insignificant
concentrations of dissolved MurA in Mono Lake, but high concentrations of 25-75

5.5 Discussion
119
nM in the unfiltered water. These findings indicate that MurA is rather associated
with particulate matter than dissolved in the water. Interestingly, the molar MurA
concentrations were in some POM samples higher than GalN concentrations. These
results differ from findings from Benner and Kaiser (2003) as they found low MurA
concentrations compared to GalN in POM samples. However, also in Lake Lugano
higher MurA than GalN concentrations were measured in some POM samples
(Klauser 2007), thus, this could be a feature of lacustrine AS compositions.
5.5.2. Contribution of bacterial cells to the organic carbon pool in the water
column
Higher bacterial cell counts in the eutrophic Lake Zug compared to the
oligotrophic Lake Brienz are in accordance with a survey of Chróst and Siuda (2006)
who studied 19 lakes along a trophic gradient from meso/oligotrophic to
hypereutrophic status. They found higher bacterial abundances in lakes with higher
trophic levels and a strong relation between primary productivity and bacterial
production. This coincides with high bacterial cell counts in the water layers of
primary productivity in Lake Brienz and Lake Zug. In Lake Zug, the bacterial cell
counts increased below the oxic/anoxic interface, highlighting the suboxic/anoxic
zone in the water column as a hot spot of microbial activity. An increase in bacterial
abundance was also observed in deep anoxic water layers of Mono Lake and the
Black Sea (Humayoun et al. 2003, Morgan et al. 2006, Jørgensen et al. 2008).
In order to estimate the proportion of OM derived from bacterial cells in the
water columns, we used two different approaches – an estimate based on average
carbon content per cell and an estimate based on MurA, D-Ala and D-Glx
concentrations. First, we calculated the bacterial carbon by multiplying the bacterial
cell counts with an average carbon content of bacterial cells obtained from the
literature. Measured average carbon contents of bacteria vary with cell size,
environment and species. For prokaryotic cells in aquatic environments an average
carbon content of 14 fg C cell-1 was determined by Fagerbakke et al. (1996). In
marine systems, the carbon content of bacterial cells is, on average, 12.4 fg C cell-1 for
the open ocean and 30.2 fg C cell-1 for pelagic coastal marine bacteria (Fukuda et al.
1998). Estimating the bacterial contribution to OM in an estuary, Bourgoin and
Tremblay (2010) used an average bacterial cell carbon content of 11 fg C cell-1
(determined by Kawasaki et al. 2008). Applying this smallest value of 11 fg C cell-1,
Contribution of bacterial cells to lacustrine organic matter based on amino sugars and D-amino acids
120
we obtained as a minimum estimation that 0.8-3% and 0.3-1.5% of the carbon in Lake
Brienz and in Lake Zug, respectively, derived from living cells, with higher fractions
in the upper water column and for the spring sampling (Table 15).
Estimating the contribution of bacteria to OM in natural environments is
associated to numerous uncertainties considering the diversity of bacteria and
variations in the reactivity of biomarkers (Tremblay and Benner 2009). Nevertheless,
MurA has been used as a marker for living bacteria or rather recent bacterial
necromass. Mimura and Romano (1985) determined a strong correlation between
MurA and bacterial counts in marine water samples and concluded that MurA can be
used as an indicator for bacterial biomass. D-Ala and D-Glx also have a bacterial
origin and thus have been used to estimate bacterial contribution to the organic carbon
pool (e.g. Tremblay and Benner 2009; Bourgoin and Tremblay 2010; Kawasaki et al.
2011). Hence, in a second approach to assess organic carbon derived from bacterial
cells, we used the concentrations of MurA, D-Ala and D-Glx according to the
following equation (assuming that all bacteria were retained by the filter):
Bacterial C (%) = biomarkersample / biomarkerbacteria * 100 Equation 1
with biomarkersample being the measured particulate carbon-normalized yields of
MurA, D-Ala or D-Glx, respectively, and biomarkerbacteria an average carbon-
normalized yield of the biomarker from bacterial cells given in the literature (Kaiser
and Benner, 2008). Depending on the bacterial assemblage, the range of the average
bacterial MurA content is rather large. Gram-positive bacteria have a thicker cell wall
than Gram-negative bacteria and therefore higher MurA contents (Schleifer and
Kandler 1972). The average MurA yield for marine bacteria is 12.6 nmol (mg C)-1
(Benner and Kaiser 2003). For soil and freshwater heterotrophic bacteria Kaiser and
Benner (2008) determined a mean of 42.3 nmol MurA (mg C)-1. Using this value in
our study, we estimated (Eq. 1) organic carbon fractions derived from bacterial cells
in the range of 0.2-11% and 0.3-5% for Lake Brienz and Lake Zug, respectively
(Table 15). For the estimation of bacterial carbon contribution based on D-AAs,
carbon-normalized yields of D-Ala and D-Glx published by Bourgoin and Tremblay
(2010) (based on data of Kaiser and Benner 2008 and Tremblay and Benner 2009) for
soil and freshwater bacteria were used (92.2 nmol D-Ala (mg C)-1 and 61.4 nmol D-

5.5 Discussion
121
Glx (mg C)-1). With this approach we obtained similar contributions of particulate
bacterial matter to the TOC (Table 15). These estimates were in spring between 0.7
and 14.4% for Lake Brienz and 0.6 and 3.5% for Lake Zug. Highest estimates were
obtained for the upper water layers. Generally, our estimates for the bacterial derived
carbon fraction for the two studied lakes are lower than estimates from the ocean,
where Kaiser and Benner (2008) could show that ~25% of the POM and DOM have a
bacterial origin. This discrepancy can partly be explained by different methods used
and the uncertainties of the approaches. First of all, the POM in the study of Kaiser
and Benner (2008) had a size of 0.1-60 μm. The POM we sampled with GF/F filters
had a size of >0.7 μm. In an experiment with marine bacteria these filters let through
on average 25% of bacteria (Gasol and Morán 1999). Although we used stacked
Table 15. Comparison of the contribution of bacterial cells to total organic carbon estimated for Lake Brienz and Lake Zug, using four different approaches (see text), spring and fall 2009
Depth % TOC from bacterial cells
estimated based on % TOC from bacterial cells
estimated based on (m) D-Ala D-Glx MurA cell counts D-Ala D-Glx MurA cell counts
Lake Brienz spring fall
5 14.4 0.8 11.0 2.7 - - 3.9 2.5 10 10.7 1.9 7.2 3.0 - - 2.6 1.6 20 2.9 0.4 2.7 2.9 0.4 - 1.6 1.1 30 4.0 - 3.3 2.4 - - 2.6 1.3 40 1.7 - 1.5 1.5 - - 1.4 1.0 70 2.1 0.6 0.4 1.0 - - 0.6 0.9
100 1.1 0.3 0.9 1.1 - - 1.1 0.9 150 1.0 0.2 0.3 0.8 - - 1.8 0.9 200 0.7 0.2 0.2 0.8 - - 4.5 0.8 240 2.0 0.9 1.7 0.9 - - 3.3 1.0
Lake Zug spring fall
5 2.1 2.0 4.7 1.5 2.0 2.4 3.2 1.7 10 2.3 2.5 1.2 1.1 2.6 1.4 5.0 1.6 15 3.1 3.5 0.7 1.3 1.4 1.7 2.1 1.7 25 2.3 1.4 1.0 1.3 1.0 - 0.3 0.7 60 0.6 2.4 1.1 0.8 0.3 0.1 0.9 0.5 80 1.4 1.3 0.7 0.6 0.4 - 0.4 0.5
100 2.2 2.5 1.2 0.5 0.1 - 0.4 0.4 130 0.9 1.3 0.9 0.6 0.2 - 0.7 0.6 170 2.2 2.0 1.6 0.7 0.6 - 0.5 1.0 190 2.3 1.7 4.1 0.7 1.1 - 0.5 1.4
Abbreviations used: D-Ala, D-alanine; D-Glx = D-glutamic acid; MurA, muramic acid.
filters, which slightly reduced the pore size, a certain fraction of bacteria was not
retained by the filters, leading to an underestimation of organic carbon derived from

Contribution of bacterial cells to lacustrine organic matter based on amino sugars and D-amino acids
122
bacterial cells. Another uncertainty of the biomarker approach is the assumption that
the biomarker yields of cultured bacteria represent also natural bacterial assemblages
(Tremblay and Benner 2009; Kaiser and Benner 2008). By the same token, different
bacterial cells sizes were not considered and probably also led to an underestimation
of the carbon fraction derived from bacterial cells, as for example bacterial cells are
larger in anoxic waters (Cole et al. 1993). Moreover, our study represents a minimum
estimation of bacterial derived organic carbon as we investigated only the bacterial
carbon derived from bacterial cells; dissolved organic carbon released from bacterial
cells e.g. during growth, viral lysis and grazing was not included. However, the close
agreement between the here-presented estimates based on bacterial cell counts, D-
AAs and MurA not only provides confidence with regard to our assessment, it also
suggests that MurA is a marker for bacterial cells rather than for refractory bacterial
detritus. This somewhat stands in contrast to findings from the deep ocean, where
Benner and Kaiser (2003) found that 10-15% of the MurA in POM samples is
associated with intact bacterial cells, while a large fraction of MurA appears to be
related to bacterial detritus. An explanation for these differences might be the greater
water depth of the sampling sites in the ocean and the longer residence times of the
particulate matter in the water column.
5.5.3. Effects of trophic status and redox conditions on amino sugar
transformation and bacterial contributions to the organic carbon pool
The different nutrient levels of the studied lakes are reflected in a 10-fold
higher primary productivity in the eutrophic Lake Zug (in spring 206 mg C m-2 h-1)
compared to the oligotrophic Lake Brienz (in spring 22 mg C m-2 h-1). Higher
productivity resulted in higher absolute PAS concentrations in Lake Zug compared to
Lake Brienz. However, PAS yields had comparable values. Similar AS composition
in the upper water layers probably derived from similar plankton communities as in
both lakes the zooplankton was dominated by cladocernas and calanoid copepods and
in fall diatoms were in both lakes the predominant phytoplankton species (Köllner et
al. 2012). Below the zone of primary production, the biomass is degraded and the AS
composition has a bacterial imprint (e.g. GlcN:GalN ratios). In Lake Brienz, the
carbon-normalized PAS decrease from the surface water to the deep water column
was greater than in Lake Zug. The contribution of PAS to the TOC pool, from surface
to bottom waters, decreased by 83% and 72% in spring and by 47% and 42% in fall

5.5 Discussion
123
for Lake Brienz and Lake Zug, respectively. This finding suggests a more pronounced
degradation of the AS pool and a higher turnover of OM under oligotrophic
conditions. This observation may not only be restricted to ASs. Moreover, enhanced
degradation of particulate fatty acids and neutral lipids under oligotrophic conditions
in Lake Brienz compared to the eutrophic Lake Lugano were reported by Bechtel and
Schubert (2009). The more enhanced degradation in oligotrophic systems might be
due to smaller particles sizes in oligotrophic systems and therefore longer residence
times in the water column (Stable 1984).
Interestingly, in both lakes the amino sugar yields stayed rather constant below
the epilimnion (<30 m depth in Lake Brienz and <15m in Lake Zug). Hence, an
immediate effect of changing redox conditions in the Lake Zug water column on the
PAS composition was not observed. This could be explained by a short residence time
of the particles in the anoxic zone or preservation of the OM under anoxic conditions.
Another reason for the absence of a decrease in AS yields could be the presence of
chemotrophic bacteria which built up new bacterial biomass during e.g. denitrification
and therefore counterbalance the loss of ASs during degradation or directly use the
ASs. However, the influence of redox conditions on the degradation of ASs has to be
studied in more detail, as in our study only three samples in each season were taken
from the anoxic water column.
A slight increase in AS, L- and D-AA concentrations, %D and cell counts
right above the sediments was measured in both lakes and seasons which might derive
from resuspension of sediments as a result of the formation of a benthic boundary
layer (BBL). In these layers, which originate from intense mixing associated with
seiching motions above the sediments, the concentration of organic particles is higher
than above the BBL and serve therefore as zones of biogeochemical transformations
(Gloor et al. 1994).
It has been shown in studies from lakes and reservoirs that in oligotrophic
systems microbial biomass and heterotrophic microbial activity are relatively more
important than in eutrophic systems (Biddanda et al. 2001, Cotner and Biddanda 2002,
Caston et al. 2009). This can be explained by a better adaptation to low nutrient
availability and a closer connection of autotrophic and heterotrophic processes in the
euphotic zone (Cotner and Biddanda 2002). We also observed that bacteria, overall,
comprise a slightly greater proportion of the OM in the oligotrophic Lake Brienz than
in the eutrophic Lake Zug. This is also consistent with the GlcN:GalN ratios, which –
Contribution of bacterial cells to lacustrine organic matter based on amino sugars and D-amino acids
124
especially in fall – are lower in Lake Brienz than in Lake Zug. Furthermore, the
fraction of GlcN derived from peptidoglycan is larger in Lake Brienz than in Lake
Zug. These findings combined indicate enhanced transformation and therefore higher
utilization of the primary produced organic carbon by bacteria in the oligotrophic
Lake Brienz.

125
6. CONCLUSIONS AND OUTLOOK
This thesis elucidates the role of bacteria as degraders, but also as significant
contributors of particulate organic matter in two lakes of contrasting trophic statuses.
The focus was set on the bacterial degradation of the biopolymer chitin, which is
synthesized in large amounts in aquatic ecosystems. Below, the main findings are
summarized and aspects for further investigations are suggested.
6.1. Sites and significance of chitin hydrolysis
In chapter 2, the sites of chitin production (zooplankton) and the sediments
were identified as the main sites of chitin hydrolysis. In the lake water columns, no
chitinase activity could be measured. However, significant chitinase gene (chiA)
concentrations were detected in the lake waters, in particular in the oligotrophic water
column of Lake Brienz. In Lake Brienz with its unusually low primary production (<
10 g m-2 algal biomass), chitin appears to have a higher significance as growth
substrate as other easily degradable substrates are scarce in contrast to eutrophic Lake
Zug. This finding is supported by the results of a study conducted within this thesis, in
which surface water samples of Lake Brienz, meso-oligotrophic Lake Lucerne, and
Lake Zug were enriched with crab shell chitin (Wunderlin 2009). The maximum chiA
concentrations, which were detected after two weeks of incubation, were measured for
Lake Brienz, followed by Lake Lucerne and were lowest for Lake Zug. In order to test
if bacterial communities of nutrient depleted lakes in general show a higher potential
of chitin hydrolysis, future studies on the degradation of lacustrine chitin should
include additional lakes of different trophic statuses.
In addition to significant correlations between parameters of chitin degradation
(chiA gene abundance, chitinase activity) and carbon, nitrogen, and glucosamine
(GlcN) concentrations in the sediments, in Lake Brienz’s water column the chiA
concentrations correlated significantly (P < 0.01, n=10) with concentrations of GlcN
at both sampling dates. In the water column of Lake Zug, for which chiA gene
Conclusions and outlook
126
abundance could only be detected for the surface waters, high chiA gene abundance
was correlated with detected GlcN maxima on the respective sampling
date. However, another significant source of GlcN is the bacterial cell wall polymer
peptidoglycan. If measures of chitin turnover are related to the abundance of its
monomer GlcN, it is suggested that bacterial derived GlcN is estimated on the basis of
the 1:1 ratio of GlcN and muramic acid in peptidoglycan. Additionally, methods to
quantify chitin in an aquatic ecosystem should be evaluated and the results of both
approaches compared. For instance, the method developed by Montgomery and
Kirchman (1994), which uses fluorescently or radioactively labeled wheat germ
agglutinin, which binds to three consecutive N-acetylglucosamine residues, could be
tested.
The lack of chitinase activity but detectable chiA abundance in the water
samples of both lakes would indicate that free-living bacteria profit from the chitin
hydrolysis products than being actively involved in the hydrolysis of chitin. This
conclusion is based on the assumption that a bacterial species, which possesses the
genetic tools for chitin hydrolysis (chiA) is also able to assimilate the products of
chitin hydrolysis. The very low chiA copy numbers detected in the > 5 µm water
fractions (see results in chapter 2) could point to a very small guild of chitinolytic
bacteria associated with this particulate fraction, which releases chitin hydrolysis
products in the surrounding waters of which the free-living bacterial communities
could profit. In order to test for chitinase active particle size fractions in the water,
future investigations should assay additional size fractions similar to Hoppe (1983).
Furthermore, chitinase positive size fractions should be subjected to DNA sequencing
to characterize the chitinases associated with the particulate fractions.
6.2. Bacterial chitinases
In chapter 3, the group of bacterial chitinases, which was found most abundant
in the epi- and hypolimnic waters of Lake Brienz was not detected for the chitinase
positive zooplankton (> 95 µm). This finding would point to planktonic bacteria not
associated with chitin particles profiting from the chitinolytic activity of a different
bacterial population. Such a commensal lifestyle was recently proposed for planktonic
Actinobacteria (Beier and Bertilsson 2011). In contrast, in Lake Zug, the same
bacterial chitinase associated with chitinase-active sites was also abundant in the

Conclusions and outlook
127
waters, which could indicate that in Lake Zug, the particle-associated chitinolytic
bacteria sustain their free-living non-chitinase-active subpopulation. Such a ecological
strategy was observed for cells of a strain of the marine bacterium Pseudoalteromonas
sp. (Baty et al. 2000). Further research is needed to evaluate the distinct ecological
role of particle-associated chitinolytic bacteria in lakes of contrasting trophic statuses.
In general, for both lakes and diverse lake habitats (zooplankton, water,
sediment), a restricted number of bacterial chitinases, which were assigned to
apparently rare members of the bacterial communities was detected. It can be assumed
that their presence is essential for the functional trait of chitin hydrolysis in freshwater
lakes. In order to detect additional significant chitinases in future studies, different
subsets of primer pairs specific for particular groups of bacteria, which were detected
via 454 pyrosequencing of the 16S rRNA gene, could be designed and applied. For
instance, in the water column of Lake Brienz, apart from the surface waters, the chiA
gene abundance peaked in the 150 m and the 200 m water layer sampled in May and
September, respectively. In these water layers, Chitinophagaceae were substantially
more abundant compared to the other lake habitats. Members of this family could be
significant for the hydrolysis of detrital chitin in Lake Brienz.
Some chitinases detected in the surface water samples of Lake Brienz and
Lake Zug were assigned to known chitinases of β-Proteobacteria (Janthinobacterium
lividum). Bacterial species, which became abundant during chitin enrichment
experiments conducted within this thesis (Wunderlin 2009) were also identified as β-
Proteobacteria belonging to the Burkholderiales (Comamonadaceae) and
Neisseriales (Neisseriaceae) (Köllner unpublished data). They became abundant due
to the chitin enrichment and were not detected in the initial bacterial community by
DGGE fingerprinting (Wunderlin 2009). This would support that rare members of the
bacterial community are responsible for the hydrolysis of freshwater chitin as
discussed above. However, chitinases from Comamonadaceae and Neisseriaceae
could not be detected in the zooplankton samples (chapter 3) although they were
detected as members of the total bacterial communities associated with zooplankton -
in the zooplankton sample of Lake Brienz, Comamonadaceae made up 20% of the
sequences. In a study on the bacterial diversity associated with freshwater copepods,
β-Proteobacteria (Neisseriaceae, Comamonadaceae, Oxalobacteraceae) were the
most abundant bacteria next to Bacteroidetes (Grossart et al. 2009). In order to
examine if these groups of bacteria are significant for the degradation of lacustrine

Conclusions and outlook
128
zooplankton chitin, future studies could include laboratory experiments similar to
Tang et al. (2006). The bacterial phyla which colonize and decompose the
zooplankton carcasses could be identified by combining microscopic and molecular
analytical methods. Application of MAR-FISH using specific probes targeting the
identified bacteria would show the consumption of chitin or products of chitin
hydrolysis. This approach would also provide quantitative estimates on the abundance
of these bacteria in the lakes under study and was successfully applied previously
(Cottrell and Kirchman 2000, Beier and Bertilsson 2011).
The predominant chitinase detected for the water samples of Lake Brienz
could be identified as a known chitinase from Stenotrophomonas maltophilia, whereas
the predominant chitinase in Lake Zug appeared to present a novel bacterial chitinase
lineage (chapter 3). In future experiments, the cultivation of chitinolytic bacteria from
Lake Zug on chitin extracted from autochthonous zooplankton and analysis of the
associated chitinases could probably identify this chitinase lineage. Additionally,
water samples from the hypolimnion of Lake Brienz, for which high chiA gene
abundance was detected via quantitative PCR (chapter 2), could be subjected to
enrichment experiments. As diatoms could also be a significant source of freshwater
chitin (Smucker 1991), it could also be tried to culture chitinolytic bacteria on chitin
extracted from diatoms. With this experiment it could be tested if the chitinolytic
consortia on diatom chitin are 1) different from those determined on zooplankton
chitin and/or 2) grow faster as this chitin type is not cross-linked to other structural
components and represents the more open β-form (compared to the tightly packed α-
chitin of crustaceans). In order to identify the bacterial species grown on these
autochthonous chitin sources, samples could be subjected to cloning and sequencing.
6.3. Organic matter degradation indices and bacterial dynamics
In both lakes, the free-living (> 0.2, < 5 µm) and the particle-associated (> 5
µm) total bacterial communities showed structural shifts along the lake water columns
(chapter 4). It was hypothesized that these vertical shifts are accompanied by shifts in
the composition and degradation state of particulate organic matter. Whereas amino
compound based degradation indices performed less well as indicators for the
bacterioplankton dynamics, the Chlorin Index was identified as one of the main
predictors for the abundance and composition of bacterioplankton in the water

Conclusions and outlook
129
columns of both lakes. The Chlorin Index is a degradation index based on the
degradation state of chlorophyll, and, therefore, directly linked to a significant source
of growth substrates for lacustrine heterotrophic bacteria, i.e., organic matter
produced by phytoplankton. Thus, the CI appeared as a good indicator for the
succession of bacterial communities in lakes.
However, for the analysis of the CI and the individual particulate amino
compounds, organic matter was collected on filters with a pore size of 0.7 µm. In
future investigations, shifts in the community structure and abundance of bacteria
should additionally be analyzed for the 0.7 µm water fraction in order to derive
correlations between bacterioplankton dynamics and the quality and quantity of amino
compounds detected for this size fraction. To follow the seasonality of organic matter
degradation patterns in relation to seasonal dynamics of the bacterial community
structure, the lakes should be sampled more frequently. In particular, the dynamics
close to chlorophyll a or primary productivity maxima and afterwards should also be
determined to record maxima in production of organic matter and the fate of detrital
matter thereafter. The response of the bacterial community structure could be
reflected by appearing and disappearing of particular bacterial species which can be
identified by cloning and sequencing.
6.4. Bacterial contribution to organic matter
Applying bacterial cell counts and the bacterial amino biomarkers muramic
acid and D-amino acids, the proportion of bacterial derived organic carbon was
consistently higher in the oligotrophic water column of Lake Brienz than in the
eutrophic water column of Lake Zug. Higher turnover rates of particulate amino
sugars in Lake Brienz point to a more pronounced degradation of particulate organic
matter from primary production in Lake Brienz than in Lake Zug. These findings are
in accordance with relatively higher bacterial metabolism and higher fractions of
particulate carbon, nitrogen and phosphorus as bacterial biomass in oligotrophic
compared to eutrophic freshwater systems (Biddanda et al. 2001, Caston et al. 2009).
This can be explained by a better adaption of bacteria too low nutrient availability, for
instance, bacteria can outcompete phytoplankton for inorganic nutrients, due to their
large cell surface to volume ratios (Currie and Kalff 1984), whereas in eutrophic

Conclusions and outlook
130
systems, bacteria were shown to underlie a greater grazing pressure and increased
viral mortality (Sanders et al. 1992, Weinbauer et al. 1993).
However, the biomarker content differs between bacterial species and cell
sizes and also between cultured and natural bacteria (Kaiser and Benner 2008).
Therefore, future studies should include microscopic analysis (DAPI, FISH) or special
flow cytometry applications to determine the size and shape of bacterial cells, which
could increase the accuracy of the estimated bacterial derived organic matter
(Hammes and Egli 2010).
In conclusion, higher potential of chitin hydrolysis and higher contribution to
the carbon and nitrogen budget in oligotrophic Lake Brienz than in eutrophic Lake
Zug pointed to a higher significance of chitin as growth substrate in systems where
more readily available organic substrates are scarce. Supportingly, higher turnover
rates of particulate amino sugars were detected in Lake Brienz. A restricted number of
bacterial chitinases, which were distinct between the two lakes, appeared to be
responsible for the functional trait of chitin hydrolysis. The higher proportion of
bacterial derived organic carbon underscores the higher significance of bacteria for
nutrient and carbon flow in oligotrophic freshwater systems.
Future studies including additional lakes of contrasting trophic state could
reveal the higher importance of heterotrophic bacteria for the recycling of recalcitrant
organic matter in oligotrophic systems as a general feature. In particular, it could be
investigated if chitinolytic bacteria are generally higher abundant in oligotrophic than
in eutrophic lakes and if similar bacterial chitinases are distributed between systems
of similar trophic state.
131
REFERENCES
Allen H.L. (1976) Dissolved organic matter in lakewater: characteristics of molecular weight size fractions and ecological implications. Oikos 27:64-70
Allgaier M., Brückner S., Jaspers E., and Grossart H.P. (2007) Intra- and inter-lake variability of free-living and particle-associated Actinobacteria communities. Environmental Microbiology 9:2728-2741
Allgaier M., and Grossart H.P. (2006) Seasonal dynamics and phylogenetic diversity of free-living and particle-associated bacterial communities in four lakes in northeastern Germany. Aquatic Microbial Ecology 45:115-128
Altschul S.F., Madden T.L., Schäffer A.A., Zhang J., Zhang Z., Miller W., and Lipman D.J. (1997) Gapped BLAST and PSI-BLAST: A new generation of protein database search programs. Nucleic Acids Research 25:3389-3402
Amann R.I., Ludwig W., and Schleifer K.H. (1995) Phylogenetic identification and in situ detection of individual microbial cells without cultivation. Microbiological Reviews 59:143-169
Amon R.M.W., Fitznar H., and Benner R. (2001) Linkages among the bioreactivity, chemical composition, and diagenetic state of marine dissolved organic matter. Limnology and Oceanography 46:287-297
AWA Amt für Wasser und Abfall, Gewässer- und Bodenschutzlabor GBL, Bern (2009) Brienzersee Tiefenprofile 2009. http://www.bve.be.ch/bve/de/index/wasser/wasser/gewaesserqualitaet/Seen/brienzersee.assetref/content/dam/documents/BVE/AWA/de/GBL/Brienzersee/Tiefenprofile%202009.pdf.
Azam F., Fenchel T., Field J.G., Gray J.S., Meyer-Reil L.A., and Thingstad F. (1983) The ecological role of water-column microbes in the sea. Marine Ecology Progress Series 10:257-263
Bartnicki-Garcia S., and Lippman E. (1982) Fungal cell wall composition. In: A.J. Laskin, and H.A. Lechevalier (Eds.) CRC Handbook of Microbiology, 2nd Edn. CRC Press, Boca Raton, FL, pp. 229-252
Bassler B.L., Yu C., Lee Y.C., and Roseman S. (1991) Chitin utilization by marine bacteria: Degradation and catabolism of chitin oligosaccharides by Vibrio furnissii. Journal of Biological Chemistry 266:24276-24286
Bastviken D., Tranvik L.J., Downing J.A., Crill P.M., and Enrich-Prast A. (2011) Freshwater methane emissions offset the continental carbon sink. Science 331:50
Battin T.J., Luyssaert S., Kaplan L.A., Aufdenkampe A.K., Richter A., and Tranvik L.J. (2009) The boundless carbon cycle. Nature Geoscience 2:598-600

References
132
Baty A.M., Eastburn C.C., Diwu Z., Techkarnjanaruk S., Goodman A.E., and Geesey G.G. (2000) Differentiation of chitinase-active and non-chitinase-active subpopulations of a marine bacterium during chitin degradation. Applied and Environmental Microbiology 66:3566-3573
Bechtel A., and Schubert C.J. (2009) Biogeochemistry of particulate organic matter from lakes of different trophic levels in Switzerland. Organic Geochemistry 40:441-454
Beier S. (2010) Bacterial degradation and use of chitin in aquatic habitats. Ph.D. thesis. Uppsala University, Sweden.
Beier S., and Bertilsson S. (2011) Uncoupling of chitinase activity and uptake of hydrolysis products in freshwater bacterioplankton. Limnology and Oceanography 56:1179-1188
Beier S., Jones C.M., Mohit V., Hallin S., and Bertilsson S. (2011) Global phylogeography of chitinase genes in aquatic metagenomes. Applied and Environmental Microbiology 77:1101-1106
Beier S., Mohit V., Ettema T.J.G., Östman O., Tranvik L.J., and Bertilsson S. (2012) Pronounced seasonal dynamics of freshwater chitinase genes and chitin processing. Environmental Microbiology 14:2467-2479
Benner R., and Kaiser K. (2003) Abundance of amino sugars and peptidoglycan in marine particulate and dissolved organic matter. Limnology and Oceanography 48:118-128
Benner R., Pakulski J.D., McCarthy M., Hedges J.I., and Hatcher P.G. (1992) Bulk chemical characteristics of dissolved organic matter in the ocean. Science 255:1561-1564
Bhattacharya D., Nagpure A., and Gupta R.K. (2007) Bacterial chitinases: Properties and potential. Critical Reviews in Biotechnology 27:21-28
Biddanda B., Opsahl S., and Benner R. (1994) Plankton respiration and carbon flux through bacterioplankton on the Louisiana shelf. Limnology and Oceanography 39:1259-1275
Biddanda B.A., Ogdahl M., and Cotner J.B. (2001) Dominance of bacterial metabolism in oligotrophic relative to eutrophic waters. Limnology and Oceanography 46:730-739
Borcard D., Gillet, G., Legendre, P. (2011) Numerical Ecology with Redn. Springer New York
Bourgoin L.H., and Tremblay L. (2010) Bacterial reworking of terrigenous and marine organic matter in estuarine water columns and sediments. Geochimica et Cosmochimica Acta 74:5593-5609
References
133
Bowman J.P., McCammon S.A., Gibson J.A.E., Robertson L., and Nichols P.D. (2003) Prokaryotic metabolic activity and community structure in antarctic continental shelf sediments. Applied and Environmental Microbiology 69:2448-2462
Boyer J.N. (1994) Aerobic and anaerobic degradation and mineralization of 14C-chitin by water column and sediment inocula of the York River estuary, Virginia. Applied and Environmental Microbiology 60:174-179
Bray J.R., and Curtis J.T. (1957) An ordination of the upland forest communities of southern Wisconsin. Ecological Monographs 27:325-349
Brzezinska M.S., and Donderski W. (2006) Chitinolytic bacteria in two lakes of different trophic status. Polish Journal of Ecology 54:295-301
Bürgi H.R., Weber P., and Bachmann H. (1985) Seasonal variations in the trophic structure of phyto-and zooplankton communities in lakes in different trophic states. Schweizerische Zeitschrift für Hydrologie 47:197-224
Bürgi H.R., and Züllig H. (1983) Eine neue Netzgarnitur mit Kipp-Schliessmechanismus für quantitative Zooplanktonfänge in Seen. Schweizerische Zeitschrift für Hydrologie 45:505-507
Carstens D., Köllner K.E., Bürgmann H., Wehrli B., and Schubert C.J. (2012) Contribution of bacterial cells to lacustrine organic matter based on amino sugars and D-amino acids. Geochimica et Cosmochimica Acta 89:159-172
Casamayor E.O., Schäfer H., Bañeras L., Pedrós-Alió C., and Muyzer G. (2000) Identification of and spatio-temporal differences between microbial assemblages from two neighboring sulfurous lakes: Comparison by microscopy and denaturing gradient gel electrophoresis. Applied and Environmental Microbiology 66:499-508
Caston C.B., Nowlin W.H., Gaulke A., and Vanni M.J. (2009) The relative importance of heterotrophic bacteria to pelagic ecosystem dynamics varies with reservoir trophic state. Limnology and Oceanography 56:2143-2156
Cauchie H.M. (2002) Chitin production by arthropods in the hydrosphere. Hydrobiologia 470:63-96
Cébron A., Coci M., Garnier J., and Laanbroek H.J. (2004) Denaturing gradient gel electrophoretic analysis of ammonia-oxidizing bacterial community structure in the lower seine river: Impact of paris wastewater effluents. Applied and Environmental Microbiology 70:6726-6737
Chróst R.J., and Siuda W. (2006) Microbial production, utilization, and enzymatic degradation of organic matter in the upper trophogenic layer in the pelagial zone of lakes along a eutrophication gradient. Limnology and Oceanography 51:749-762

References
134
Cole J.J., Pace M.L., Caraco N.F., and Steinhart G.S. (1993) Bacterial biomass and cell size distributions in lakes: More and larger cells in anoxic waters. Limnology and Oceanography 38:1627-1632
Cole J.J., Pace M.L., Carpenter S.R., and Kitchell J.F. (2000) Persistence of net heterotrophy in lakes during nutrient addition and food web manipulations. Limnology and Oceanography 45:1718-1730
Cole J.J., Prairie Y.T., Caraco N.F., McDowell W.H., Tranvik L.J., Striegl R.G., . . . Melack J. (2007) Plumbing the global carbon cycle: Integrating inland waters into the terrestrial carbon budget. Ecosystems 10:171-184
Costello A.M., and Lidstrom M.E. (1999) Molecular characterization of functional and phylogenetic genes from natural populations of methanotrophs in lake sediments. Applied and Environmental Microbiology 65:5066-5074
Cotner J.B., and Biddanda B.A. (2002) Small players, large role: Microbial influence on biogeochemical processes in pelagic aquatic ecosystems. Ecosystems 5:105-121
Cottrell M.T., and Kirchman D.L. (2000) Natural assemblages of marine proteobacteria and members of the Cytophaga-Flavobacter cluster consuming low- and high-molecular-weight dissolved organic matter. Applied and Environmental Microbiology 66:1692-1697
Cottrell M.T., Wood D.N., Yu L., and Kirchman D.L. (2000) Selected chitinase genes in cultured and uncultured marine bacteria in the α- and γ-subclasses of the Proteobacteria. Applied and Environmental Microbiology 66:1195-1201
Cowie G.L., and Hedges J.I. (1992) Sources and reactivities of amino acids in a coastal marine environment. Limnology and Oceanography 37:703-724
Crump B.C., Kling G.W., Bahr M., and Hobbie J.E. (2003) Bacterioplankton community shifts in an Arctic lake correlate with seasonal changes in organic matter source. Applied and Environmental Microbiology 69:2253-2268
Currie D.J., and Kalff J. (1984) The relative importance of bacterioplankton and phytoplankton in phosphorus uptake in freshwater. Limnology & Oceanography 29:311-321
Daniels L.B., and Glew R.H. (1984) β-D-glucosidases in tissue. In: H.U. Bergmeyer (Ed.) Methods of Enzymatic Analysis. John Wiley & Sons, New York, pp. 217-226
Dauwe B., and Middelburg J.J. (1998) Amino acids and hexosamines as indicators of organic matter degradation state in North Sea sediments. Limnology and Oceanography 43:782-798
Dauwe B., Middelburg J.J., Herman P.M.J., and Heip C.H.R. (1999) Linking diagenetic alteration of amino acids and bulk organic matter reactivity. Limnology and Oceanography 44:1809-1814
References
135
Davis J., Kaiser K., and Benner R. (2009) Amino acid and amino sugar yields and compositions as indicators of dissolved organic matter diagenesis. Organic Geochemistry 40:343-352
Dean W.E., and Gorham E. (1998) Magnitude and significance of carbon burial in lakes, reservoirs, and peatlands. Geology 26:535-538
Del Don C., Hanselmann K.W., Peduzzi R., and Bachofen R. (2001) The meromictic alpine Lake Cadagno: Orographical and biogeochemical description. Aquatic Sciences 63:70-90
Del Giorgio P.A., Cole J.J., and Cimbleris A. (1997) Respiration rates in bacteria exceed phytoplankton production in unproductive aquatic systems. Nature 385:148-151
Donderski W. (1984) Chitinolytic bacteria in water and bottom sediments of two lakes of different trophy. Acta Microbiologica Polonica 33:163-170
Donderski W., and Brzezinska M.S. (2003) The utilization of N-acetyloglucosamine and Chitin as sources of carbon and nitrogen by planktonic and benthic bacteria in Lake Jeziorak. Polish Journal of Environmental Studies 12:685-692
Downing J.A., Prairie Y.T., Cole J.J., Duarte C.M., Tranvik L.J., Striegl R.G., . . . Middelburg J.J. (2006) The global abundance and size distribution of lakes, ponds, and impoundments. Limnology and Oceanography 51:2388-2397
Dray S., Legendre P., and Blanchet G. (2009) packfor: Forward Selection with permutation (Canoco p.46). [Cited 15 March 2011.] Available from URL: http://R-Forge.Rproject.org/projects/sedar/.
Eddy S.R. (1998) Profile hidden Markov models. Bioinformatics 14:755-763
Eiler A., and Bertilsson S. (2007) Flavobacteria blooms in four eutrophic lakes: Linking population dynamics of freshwater bacterioplankton to resource availability. Applied and Environmental Microbiology 73:3511-3518
Ezekiel M. (1930) Methods of Correlational Analysisedn. John Wiley & Sons, New York
Fagerbakke K.M., Heldal M., and Norland S. (1996) Content of carbon, nitrogen, oxygen, sulfur and phosphorus in native aquatic and cultured bacteria. Aquatic Microbial Ecology 10:15-27
Fernandes L., D'Souza F., Matondkar S.G.P., and Bhosle N.B. (2006) Amino sugars in suspended particulate matter from the Bay of Bengal during the summer monsoon of 2001. Journal of Earth System Science 115:363-370
Finger D., Bossard P., Schmid M., Jaun L., Müller B., Steiner D., . . . Wüest A. (2007) Effects of alpine hydropower operations on primary production in a downstream lake. Aquatic Sciences 69:240-256
References
136
Finger D., Schmid M., and Wüest A. (2006) Effects of upstream hydropower operation on riverine particle transport and turbidity in downstream lakes. Water Resources Research 42:W08429
Fisher M.M., and Triplett E.W. (1999) Automated approach for ribosomal intergenic spacer analysis of microbial diversity and its application to freshwater bacterial communities. Applied and Environmental Microbiology 65:4630-4636
Fukuda R., Ogawa H., Nagata T., and Koike I. (1998) Direct determination of carbon and nitrogen contents of natural bacterial assemblages in marine environments. Applied and Environmental Microbiology 64:3352-3358
Gächter R., and Marès A. (1979) Comments to the acidification and bubbling method for determining phytoplankton production. OIKOS 33:69-73
Gasol J.M., and Morán X.A.G. (1999) Effects of filtration on bacterial activity and picoplankton community structure as assessed by flow cytometry. Aquatic Microbial Ecology 16:251-264
Giroldo D., Henriques Vieira A.A., and Paulsen B.S. (2003) Relative increase of deoxy sugars during microbial degradation of an extracellular polysaccharide released by a tropical freshwater Thalassiosira sp. (Bacillariophyceae). Journal of Phycology 39:1109-1115
Glöckner F.O., Zaichikov E., Belkova N., Denissova L., Pernthaler J., Pernthaler A., and Amann R. (2000) Comparative 16S rRNA analysis of lake bacterioplankton reveals globally distributed phylogenetic clusters including an abundant group of Actinobacteria. Applied and Environmental Microbiology 66:5053-5065
Gloor M., Wüest A., and Münnich M. (1994) Benthic boundary mixing and resuspension induced by internal seiches. Hydrobiologia 284:59-68
Good I.J. (1953) The population frequencies of species and the estimation of population parameters. Biometrika 40:237-264
Gooday G.W. (1990) The ecology of chitin degradation. Advances in Microbial Ecology 11:387-430
Grossart H.-P., Dziallas C., and Tang K.W. (2009) Bacterial diversity associated with freshwater zooplankton. Environmental Microbiology Reports 1:50-55
Grossart H.P., Dziallas C., Leunert F., and Tang K.W. (2010) Bacteria dispersal by hitchhiking on zooplankton. Proceedings of the National Academy of Sciences of the United States of America 107:11959-11964
Grossart H.P., and Simon M. (1998a) Bacterial colonization and microbial decomposition of limnetic organic aggregates (lake snow). Aquatic Microbial Ecology 15:127-140
References
137
Grossart H.P., and Simon M. (1998b) Significance of limnetic organic aggregates (lake snow) for the sinking flux of particulate organic matter in a large lake. Aquatic Microbial Ecology 15:115-125
Guerrant G.O., and Moss C.W. (1984) Determination of monosaccharides as aldononitrile, O-methyloxime, alditol, and cyclitol acetate derivatives by gas chromatography. Analytical Chemistry 56:633-638
Guthruf K., Maurer V., Pokorni B., and Zeh M. (2009) Entwicklung des Phyto- und Crustaceenzooplanktons Brienzersee. AWA Amt für Wasser und Abfall, Gewässer- und Bodenschutzlabor GBL, Bern. http://www.fr.ch/sen/files/pdf1/planktonbericht_2009.pdf.
Haake B., Ittekkot V., Honjo S., and Manganini S. (1993) Amino acid, hexosamine and carbohydrate fluxes to the deep subarctic Pacific (Station P). Deep-Sea Research Part I 40:547-560
Haake B., Ittekkot V., Ramaswamy V., Nair R.R., and Honjo S. (1992) Fluxes of amino acids and hexosamines to the deep Arabian Sea. Marine Chemistry 40:291-314
Hamady M., Walker J.J., Harris J.K., Gold N.J., and Knight R. (2008) Error-correcting barcoded primers for pyrosequencing hundreds of samples in multiplex. Nature Methods 5:235-237
Hammes F., Berney M., Wang Y., Vital M., Köster O., and Egli T. (2008) Flow-cytometric total bacterial cell counts as a descriptive microbiological parameter for drinking water treatment processes. Water Research 42:269-277
Hammes F., and Egli T. (2010) Cytometric methods for measuring bacteria in water: advantages, pitfalls and applications. Analytical and Bioanalytical Chemistry 397:1083-1095
Hanson P.C., Hamilton D.P., Stanley E.H., Preston N., Langman O.C., and Kara E.L. (2011) Fate of allochthonous dissolved organic carbon in lakes: A quantitative approach. PLoS ONE 6
Harvey H.R., Tuttle J.H., and Bell J.T. (1995) Kinetics of phytoplankton decay during simulated sedimentation: Changes in biochemical composition and microbial activity under oxic and anoxic conditions. Geochimica et Cosmochimica Acta 59:3367-3377
Hedges J.I., Hu F.S., Devol A.H., Hartnett H.E., Tsamakis E., and Keil R.G. (1999) Sedimentary organic matter preservation: A test for selective degradation under oxic conditions. American Journal of Science 299:529-555
Henrissat B. (1991) A classification of glycosyl hydrolases based on amino acid sequence similarities. Biochemical Journal 280:309-316
Henrissat B. (1999) Classification of chitinases modules. In: P. Jollès, and R.A.A. Muzzarelli (Eds.) Chitin and Chitinases. Birkhäuser Verlag, Basel, Switzerland, pp. 137-156
References
138
Herth W. (1978) A special chitin-fibril-synthesizing apparatus in the centric diatom Cyclotella. Naturwissenschaften 65:260
Higuchi R., Dollinger G., Walsh P.S., and Griffith R. (1992) Simultaneous amplification and detection of specific DNA sequences. Biotechnology 10:413-417
Higuchi R., Fockler C., Dollinger G., and Watson R. (1993) Kinetic PCR: Real time monitoring of DNA amplification reactions. Biotechnology 11:1026-1030
Hiorns W.D., Methé B.A., Nierzwicki-Bauer S.A., and Zehr J.P. (1997) Bacterial diversity in Adirondack Mountain lakes as revealed by 16S rRNA gene sequences. Applied and Environmental Microbiology 63:2957-2960
Hjort K., Bergström M., Adesina M.F., Jansson J.K., Smalla K., and Sjöling S. (2010) Chitinase genes revealed and compared in bacterial isolates, DNA extracts and a metagenomic library from a phytopathogen-suppressive soil. FEMS Microbiology Ecology 71:197-207
Hobel C.F.V., Marteinsson V.T., Hreggvidsson G.Ó., and Kristjánsson J.K. (2005) Investigation of the microbial ecology of intertidal hot springs by using diversity analysis of 16S rRNA and chitinase genes. Applied and Environmental Microbiology 71:2771-2776
Honda Y., Taniguchi H., and Kitaoka M. (2008) A reducing-end-acting chitinase from Vibrio proteolyticus belonging to glycoside hydrolase family 19. Applied Microbiology and Biotechnology 78:627-634
Hönerlage W., Hahn D., and Zeyer J. (1995) Detection of mRNA of nprM in Bacillus megaterium ATCC 14581 grown in soil by whole-cell hybridization. Archives of Microbiology 163:235-241
Hood M.A. (1991) Comparison of four methods for measuring chitinase activity and the application of the 4-MUF assay in aquatic environments. Journal of Microbiological Methods 13:151-160
Hoppe H.G. (1983) Significance of exoenzymatic activities in the ecology of brackish water: measurements by means of methylumbelliferyl-substrates. Marine Ecology Progress Series 11:299-308
Hoppe H.G., Giesenhagen H.C., and Gocke K. (1998) Changing patterns of bacterial substrate decomposition in a eutrophication gradient. Aquatic Microbial Ecology 15:1-13
Hugenholtz P. (2002) Exploring prokaryotic diversity in the genomic era. Genome Biology 3:Reviews:0003
Hughes R.M. (1999) Aquatic ecosystem. In: D.E. Alexander, and R.W. Fairbridge (Eds.) Encyclopedia of Environmental Science. Kluwer Academic Publishers, Dordrecht
References
139
Humayoun S.B., Bano N., and Hollibaugh J.T. (2003) Depth distribution of microbial diversity in Mono Lake, a meromictic soda lake in California. Applied and Environmental Microbiology 69:1030-1042
Humbert J.F., Dorigo U., Cecchi P., Le Berre B., Debroas D., and Bouvy M. (2009) Comparison of the structure and composition of bacterial communities from temperate and tropical freshwater ecosystems. Environmental Microbiology 11:2339-2350
Hunt D.E., Gevers D., Vahora N.M., and Polz M.F. (2008) Conservation of the chitin utilization pathway in the Vibrionaceae. Applied and Environmental Microbiology 74:44-51
Huse S.M., Welch D.M., Morrison H.G., and Sogin M.L. (2010) Ironing out the wrinkles in the rare biosphere through improved OTU clustering. Environmental Microbiology 12:1889-1898
Ittekkot V., Degens E.T., and Honjo S. (1984) Seasonality in the fluxes of sugars, amino acids, and amino sugars to the deep ocean: Panama basin. Deep Sea Research Part A, Oceanographic Research Papers 31:1071-1083
Jeuniaux C., and Voss-Foucart M.F. (1991) Chitin biomass and production in the marine environment. Biochemical Systematics and Ecology 19:347-356
Jones R.T., Robeson M.S., Lauber C.L., Hamady M., Knight R., and Fierer N. (2009) A comprehensive survey of soil acidobacterial diversity using pyrosequencing and clone library analyses. ISME Journal 3:442-453
Jørgensen N.O.G., Engel P., Jellison R., and Hollibaugh J.T. (2008) Contribution of bacterial cell wall components to DOM in alkaline, hypersaline Mono Lake, California. Geomicrobiology Journal 25:38-55
Jørgensen N.O.G., Stepanaukas R., Pedersen A.G.U., Hansen M., and Nybroe O. (2003) Occurrence and degradation of peptidoglycan in aquatic environments. FEMS Microbiology Ecology 46:269-280
Jürgens K., Pernthaler J., Schalla S., and Amann R. (1999) Morphological and compositional changes in a planktonic bacterial community in response to enhanced protozoan grazing. Applied and Environmental Microbiology 65:1241-1250
Kaiser K., and Benner R. (2000) Determination of amino sugars in environmental samples with high salt content by high-performance anion-exchange chromatography and pulsed amperometric detection. Analytical Chemistry 72:2566-2572
Kaiser K., and Benner R. (2005) Hydrolysis-induced racemization of amino acids. Limnology and Oceanography: Methods 3:318-325
Kaiser K., and Benner R. (2008) Major bacterial contribution to the ocean reservoir of detrital organic carbon and nitrogen. Limnology and Oceanography 53:99-112

References
140
Kaiser K., and Benner R. (2009) Biochemical composition and size distribution of organic matter at the Pacific and Atlantic time-series stations. Marine Chemistry 113:63-77
Kapaun E., and Reisser W. (1995) A chitin-like glycan in the cell wall of a Chlorella sp. (Chlorococcales, Chlorophyceae). Planta 197:577-582
Karlsson M., and Stenlid J. (2009) Evolution of family 18 glycoside hydrolases: Diversity, domain structures and phylogenetic relationships. Journal of Molecular Microbiology and Biotechnology 16:208-223
Kawasaki N., and Benner R. (2006) Bacterial release of dissolved organic matter during cell growth and decline: Molecular origin and composition. Limnology and Oceanography 51:2170-2180
Kawasaki N., Benner R., Nagata T., and Ogawa H. (2008) Contributions of living bacteria and bacterial detritus to suspended POC in the North Pacific Gyre (poster). American Society of Limnology and Oceanography’s Ocean Sciences Meeting, Orlando (FL).
Kawasaki N., Sohrin R., Ogawa H., Nagata T., and Benner R. (2011) Bacterial carbon content and the living and detrital bacterial contributions to suspended particulate organic carbon in the North Pacific Ocean. Aquatic Microbial Ecology 62:165-176
Kelts K., Briegel U., Ghilardi K., and Hsu K. (1986) The limnogeology-ETH coring system. Schweizerische Zeitschrift für Hydrologie 48:104-115
Kent A.D., Jones S.E., Lauster G.H., Graham J.M., Newton R.J., and McMahon K.D. (2006) Experimental manipulations of microbial food web interactions in a humic lake: Shifting biological drivers of bacterial community structure. Environmental Microbiology 8:1448-1459
Kent A.D., Jones S.E., Yannarell A.C., Graham J.M., Lauster G.H., Kratz T.K., and Triplett E.W. (2004) Annual patterns in bacterioplankton community variability in a humic lake. Microbial Ecology 48:550-560
Keyhani N.O., and Roseman S. (1999) Physiological aspects of chitin catabolism in marine bacteria. Biochimica et Biophysica Acta 1473:108-122
Kindt R., and Coe R. (2005) Tree diversity analysis. A manual and software for common statistical methods for ecological and biodiversity studies, World Agroforestry Centre (ICRAF), Nairobi
Kirchman D.L., and White J. (1999) Hydrolysis and mineralization of chitin in the Delaware Estuary. Aquatic Microbial Ecology 18:187-196
Kirchner M. (1995) Microbial colonization of copepod body surfaces and chitin degradation in the sea. Helgol. Meeresunters. 49:201-212
Klauser L.V. (2007) Distribution of amino sugars in a lacustrine and a marine anoxic environment. Dissertation ETH Zurich.
References
141
Köllner K.E., Carstens D., Keller E., Vazquez F., Schubert C.J., Zeyer J., and Bürgmann H. (2012) Bacterial Chitin Hydrolysis in Two Lakes with Contrasting Trophic Statuses. Applied and Environmental Microbiology 78:695-704
Kong H., Shimosaka M., Ando Y., Nishiyama K., Fujii T., and Miyashita K. (2001) Species-specific distribution of a modular family 19 chitinase gene in Burkholderia gladioli. FEMS Microbiology Ecology 37:135-141
Krsek M., and Wellington E.M.H. (2001) Assessment of chitin decomposer diversity within an upland grassland. Antonie van Leeuwenhoek, International Journal of General and Molecular Microbiology 79:261-267
Lan X., Zhang X., Hu J., and Shimosaka M. (2006) Cloning, expression, and characterization of a chitinase from the chitinolytic bacterium Aeromonas hydrophila strain SUWA-9. Bioscience, Biotechnology and Biochemistry 70:2437-2442
Lane D.J. (1991) 16S/23S rRNA sequencing. In: E. Stackebrandt, and M. Goodfellow (Eds.) Nucleic Acid Techniques in Bacterial Systematics John Wiley & Sons, New York, pp. 115-175
LeCleir G.R., Buchan A., and Hollibaugh J.T. (2004) Chitinase gene sequences retrieved from diverse aquatic habitats reveal environment-specific distributions. Applied and Environmental Microbiology 70:6977-6983
LeCleir G.R., Buchan A., Maurer J., Moran M.A., and Hollibaugh J.T. (2007) Comparison of chitinolytic enzymes from an alkaline, hypersaline lake and an estuary. Environmental Microbiology 9:197-205
LeCleir G.R., and Hollibaugh J.T. (2006) Chitinolytic bacteria from alkaline hypersaline Mono Lake, California, USA. Aquatic Microbial Ecology 42:255-264
Lee C., and Cronin C. (1982) The vertical flux of particulate organic nitrogen in the sea: decomposition of amino acids in the Peru upwelling area and the equatorial Atlantic. Journal of Marine Research 40:227-251
Lee C., and Cronin C. (1984) Particulate amino acids in the sea: Effects of primary productivity and biological decomposition Journal of Marine Research 42:1075-1097
Legendre P., and Gallagher E.D. (2001) Ecologically meaningful transformations for ordination of species data. Oecologia 129:271-280
Liebezeit G. (1993) Amino sugars in Bransfield Strait and Weddell Sea sediments. Senckenbergiana maritima 23:29-35
Lindsay E.A., Colloff M.J., Gibb N.L., and Wakelin S.A. (2010) The abundance of microbial functional genes in grassy woodlands is influenced more by soil nutrient enrichment than by recent weed invasion or livestock exclusion. Applied and Environmental Microbiology 76:5547-5555

References
142
Lindström E.S. (2000) Bacterioplankton community composition in five lakes differing in trophic status and humic content. Microbial Ecology 40:104-113
Lindström E.S. (2001) Investigating influential factors on bacterioplankton community composition: Results from a field study of five mesotrophic lakes. Microbial Ecology 42:598-605
Ludwig W., Strunk O., Westram R., Richter L., Meier H., Yadhukumar A., . . . Schleifer K.H. (2004) ARB: A software environment for sequence data. Nucleic Acids Research 32:1363-1371
Lüke C., and Frenzel P. (2011) Potential of pmoA amplicon pyrosequencing for methanotroph diversity studies. Applied and Environmental Microbiology 77:6305-6309
Margulies M., Egholm M., Altman W.E., Attiya S., Bader J.S., Bemben L.A., . . . Rothberg J.M. (2005) Genome sequencing in microfabricated high-density picolitre reactors. Nature 437:376-380
Martinez J., Smith D.C., Steward G.F., and Azam F. (1996) Variability in ectohydrolytic enzyme activities of pelagic marine bacteria and its significance for substrate processing in the sea. Aquatic Microbial Ecology 10:223-230
McCarthy M.D., Hedges J.I., and Benner R. (1998) Major bacterial contribution to marine dissolved organic nitrogen. Science 281:231-234
McLachlan J., McInnes A.G., and Falk M. (1965) Studies on the chitan (chitin: poly-N-acetylglucosamine) fibers of the diatom Thalassiosira fluviatilis Hustedt. Canadian Journal of Botany 43:707–713
Meckler A.N., Schubert C.J., Cowie G.L., Pfeiffer S., and Dittrich M. (2004) New organic matter degradation proxies: Valid in lake systems? Limnology and Oceanography 59:2023-2033
Mengis M., Gächter R., Wehrli B., and Bernasconi S. (1997) Nitrogen elimination in two deep eutrophic lakes. Limnology and Oceanography 42:1530-1543
Metcalfe A.C., Krsek M., Gooday G.W., Prosser J.I., and Wellington E.M.H. (2002) Molecular analysis of a bacterial chitinolytic community in an upland pasture. Applied and Environmental Microbiology 68:5042-5050
Metges C.C., Petzke K.J., and Hennig U. (1996) Gas chromatography/ combustion/isotope ratio mass spectrometric comparison of N-acetyl- and N-pivaloyl amino acid esters to measure 15N isotopic abundances in physiological samples: A pilot study on amino acid synthesis in the upper gastro-intestinal tract of minipigs. Journal of Mass Spectrometry 31:367-376
Methe B.A., Hiorns W.D., and Zehr J.P. (1998) Contrasts between marine and freshwater bacterial community composition: Analyses of communities in Lake George and six other Adirondack lakes. Limnology and Oceanography 43:368-374

References
143
Meyer M., Stenzel U., and Hofreiter M. (2008) Parallel tagged sequencing on the 454 platform. Nature Protocols 3:267-278
Middelboe M., Sondergard M., Letarte Y., and Borch N.H. (1995) Attached and free-living bacteria - production and polymer hydrolysis during a diatom bloom. Microbial Ecology 29:231-248
Mimura T., and Romano J.C. (1985) Muramic acid measurements for bacterial investigations in marine environments by high-pressure liquid chromatography. Applied and Environmental Microbiology 50:229-237
Minz D., Flax J.L., Green S.J., Muyzer G., Cohen Y., Wagner M., . . . Stahl D.A. (1999) Diversity of sulfate-reducing bacteria in oxic and anoxic regions of a microbial mat characterized by comparative analysis of dissimilatory sulfite reductase genes. Applied and Environmental Microbiology 65:4666-4671
Miyamoto S., Yamamoto H., and Seki H. (1991) Chitin dynamics in the freshwater environment. Biochemical Systematics and Ecology 19:371-377
Moor H.C., Schaller T., and Sturm M. (1996) Recent changes in stable lead isotope ratios in sediments of Lake Zug, Switzerland. Environmental Science and Technology 30:2928-2933
Morgan J.A., Quinby H.L., and Ducklow H.W. (2006) Bacterial abundance and production in the western Black Sea. Deep-Sea Research Part II 53:1945-1960
Moriarty D.J.W. (1975) A method for estimating the biomass of bacteria in aquatic sediments and its application to trophic studies. Oecologia 20:219-229
Morimoto K., Karita S., Kimura T., Sakka K., and Ohmiya K. (1999) Sequencing, expression, and transcription analysis of the Clostridium paraputrificum chiA gene encoding chitinase ChiA. Applied Microbiology and Biotechnology 51:340-347
Mudryk Z.J., and Skórczewski P. (2004) Extracellular enzyme activity at the air-water interface of an estuarine lake. Estuarine, Coastal and Shelf Science 59:59-67
Mulholland P.J., and Elwood J.W. (1982) The role of lake and reservoir sediments as sinks in the perturbed global carbon cycle. Tellus 34:490-499
Mulisch M. (1993) Chitin in protistan organisms, distribution, synthesis and deposition. European Journal of Protistology 29:1-18
Müller B., Finger D., Sturm M., Prasuhn V., Haltmeier T., Bossard P., . . . Wüest A. (2007) Present and past bio-available phosphorus budget in the ultra-oligotrophic Lake Brienz. Aquatic Sciences 69:227-239
Müller P.J., Suess E., and Ungerer C.A. (1986) Amino acids and amino sugars of surface particulate and sediment trap material from waters of the Scotia Sea. Deep-Sea Research 33:819-838

References
144
Nagata T., Meon B., and Kirchman D.L. (2003) Microbial degradation of peptidoglycan in seawater. Limnology and Oceanography 48:745-754
Nazari B., Saito A., Kobayashi M., Miyashita K., Wang Y., and Fujii T. (2011) High expression levels of chitinase genes in Streptomyces coelicolor A3(2) grown in soil. FEMS Microbiology Ecology 77:623-635
Nedoma J., Vrba J., Hejzlar J., Simek K., and Straskrabova V. (1994) N-acetylglucosamine dynamics in freshwater environments: Concentration of amino sugars, extracellular enzyme activities, and microbial uptake. Limnology and Oceanography 39:1088-1100
Newton R.J., Jones S.E., Eiler A., McMahon K.D., and Bertilsson S. (2011) A guide to the natural history of freshwater lake bacteria. Microbiology and Molecular Biology Reviews 75:14-49
Nguyen R.T., and Harvey H.R. (1997) Protein and amino acid cycling during phytoplankton decomposition in oxic and anoxic waters. Organic Geochemistry 27:115-128
Niggemann J., and Schubert C.J. (2006) Sources and fate of amino sugars in coastal Peruvian sediments. Geochimica et Cosmochimica Acta 70:2229-2237
Nocker A., Burr M., and Camper A.K. (2007) Genotypic microbial community profiling: A critical technical review. Microbial Ecology 54:276-289
Ogawa H., Amagai Y., Koike I., Kaiser K., and Benner R. (2001) Production of refractory dissolved organic matter by bacteria. Science 292:917-920
Oh S., Caro-Quintero A., Tsementzi D., DeLeon-Rodriguez N., Luo C., Poretsky R., and Konstantinidis K.T. (2011) Metagenomic insights into the evolution, function, and complexity of the planktonic microbial community of Lake Lanier, a temperate freshwater ecosystem. Applied and Environmental Microbiology 77:6000-6011
Oksanen J., Blanchet F.G., Kindt R., Legendre P., O'Hara R.B., Simpson G.L., . . . and Wagner H. (2011) vegan: community ecology package. In: R Package Version 2.14-0.
Orikoshi H., Nakayama S., Miyamoto K., Hanato C., Yasuda M., Inamori Y., and Tsujibo H. (2005) Roles of four chitinases (ChiA, ChiB, ChiC, and ChiD) in the chitin degradation system of marine bacterium Alteromonas sp. strain O-7. Applied and Environmental Microbiology 71:1811-1815
Pace M.L., Cole J.J., Carpenter S.R., Kitchell J.F., Hodgson J.R., Van De Bogert M.C., . . . Bastviken D. (2004) Whole-lake carbon-13 additions reveal terrestrial support of aquatic food webs. Nature 427:240-243
Parveen B., Reveilliez J.P., Mary I., Ravet V., Bronner G., Mangot J.F., . . . Debroas D. (2011) Diversity and dynamics of free-living and particle-associated Betaproteobacteria and Actinobacteria in relation to phytoplankton and zooplankton communities. FEMS Microbiology Ecology 77:461-476

References
145
Pearce D.A. (2008) Biodiversity of the bacterioplankton in the surface waters around Southern Thule in the Southern Ocean. Antarctic Science 20:291-300
Peres-Neto P.R., Legendre P., Dray S., and Borcard D. (2006) Variation partitioning of species data matrices: Estimation and comparison of fractions. Ecology 87:2614-2625
Peter H., Beier S., Bertilsson S., Lindström E.S., Langenheder S., and Tranvik L.J. (2011) Function-specific response to depletion of microbial diversity. ISME Journal 5:351-361
Popp B., Graham B., Olson R., Hannides C., Lott M., López-Ibarra G., . . . Frey B. (2007) Insight into the trophic ecology of yellowfin tuna, Thunnus albacares, from compound-specific nitrogen isotope analysis of proteinaceous amino acids. In: T. Dawson, and R. Siegwolf (Eds.) Stable Isotopes as Indicators of Ecological Change. Elsevier, pp. 173-190
Poulicek M., Gaill F., and Goffinet G. (1998) Chitin biodegradation in marine environments. ACS Symposium Series 707:163-210
Poulicek M., and Jeuniaux C. (1991) Chitin biodegradation in marine environments: An experimental approach. Biochemical Systematics and Ecology 19:385-394
R Development Core Team (2009) R: A language and environment for statistical computing. R foundation for statistical computing, Vienna, Austria. ISBN 3-900051-07-0, http://www.r-project.org
Ramaiah N., Hill R.T., Chun J., Ravel J., Matte M.H., Straube W.L., and Colwell R.R. (2000) Use of a chiA probe for detection of chitinase genes in bacteria from the Chesapeake Bay. FEMS Microbiology Ecology 34:63-71
Ramette A. (2007) Multivariate analyses in microbial ecology. FEMS Microbiology Ecology 62:142-160
Ramette A. (2009) Quantitative community fingerprinting methods for estimating the abundance of operational taxonomic units in natural microbial communities. Applied and Environmental Microbiology 75:2495-2505
Reynolds C.S. (1984) The ecology of freshwater phytoplankton. Cambridge University Press, Cambridge, United Kingdom.
Richardot M., Debroas D., Thouvenot A., Romagoux J.C., Berthon J.L., and Devaux J. (1999) Proteolytic and glycolytic activities in size-fractionated surface water samples from an oligotrophic reservoir in relation to plankton communities. Aquatic Sciences 61:279-292
Rodhe W. (1958) The primary production in lakes: some results and restrictions of the 14C-method. Congrès International de la Mer, Rapp. et Proc.-Verb. 144:122-128
References
146
Roiha T., Tiirola M., Cazzanelli M., and Rautio M. (2011) Carbon quantity defines productivity while its quality defines community composition of bacterioplankton in subarctic ponds. Aquatic Sciences:1-13
Ronaghi M., Uhlen M., and Nyren P. (1998) A sequencing method based on real-time pyrophosphate. Science 281:363-365
Rösel S., Allgaier M., and Grossart H.P. (2012) Long-term characterization of free-living and particle-associated bacterial communities in Lake Tiefwaren reveals distinct seasonal patterns. Microbial Ecology 64:571-583
Rösel S., and Grossart H.P. (2012) Contrasting dynamics in activity and community composition of free-living and particle-associated bacteria in spring. Aquatic Microbial Ecology 66:169-181
Rosenstock B., and Simon M. (2001) Sources and sinks of dissolved free amino acids and protein in a large and deep mesotrophic lake. Limnology and Oceanography 46:644-654
Royet J., and Dziarski R. (2007) Peptidoglycan recognition proteins: pleiotropic sensors and effectors of antimicrobial defences. Nature Reviews Microbiology 5:264-277
Saito A., Fujii T., Yoneyama T., Redenbach M., Ohno T., Watanabe T., and Miyashita K. (1999) High-multiplicity of chitinase genes in Streptomyces coelicolor A3(2). Bioscience, Biotechnology and Biochemistry 63:710-718
Salcher M.M., Pernthaler J., and Posch T. (2010) Spatiotemporal distribution and activity patterns of bacteria from three phylogenetic groups in an oligomesotrophic lake. Limnology and Oceanography 55:846-856
Salcher M.M., Pernthaler J., and Posch T. (2011) Seasonal bloom dynamics and ecophysiology of the freshwater sister clade of SAR11 bacteria that rule the waves (LD12). ISME Journal 5:1242-1252
Sanders R.W., Caron D.A., and Berninger U.G. (1992) Relationships between bacteria and heterotrophic nanoplankton in marine and fresh waters: an inter-ecosystem comparison. Marine Ecology Progress Series 86:1-14
Schleifer K.H., and Kandler O. (1972) Peptidoglycan types of bacterial cell walls and their taxonomic implications. Bacteriological reviews 36:407-477
Schloss P.D., Westcott S.L., Ryabin T., Hall J.R., Hartmann M., Hollister E.B., . . . Weber C.F. (2009) Introducing mothur: Open-source, platform-independent, community-supported software for describing and comparing microbial communities. Applied and Environmental Microbiology 75:7537-7541
Schröder R. (1969) Ein summierender Wasserschöpfer. Archiv für Hydrobiologie 66:241-243

References
147
Schubert C.J., Niggemann J., Klockgether G., and Ferdelman T.G. (2005) Chlorin Index: A new parameter for organic matter freshness in sediments. Geochemistry, Geophysics, Geosystems 6:Q03005
Shade A., Chiu C.Y., and McMahon K.D. (2010) Differential bacterial dynamics promote emergent community robustness to lake mixing: An epilimnion to hypolimnion transplant experiment. Environmental Microbiology 12:455-466
Shade A., Jones S.E., and McMahon K.D. (2008) The influence of habitat heterogeneity on freshwater bacterial community composition and dynamics. Environmental Microbiology 10:1057-1067
Sherr E.B., and Sherr B.F. (1991) Planktonic microbes: Tiny cells at the base of the ocean's food webs. Trends in Ecology and Evolution 6:50-54
Sigg L., Johnson C.A., and Kuhn A. (1991) Redox conditions and alkalinity generation in a seasonally anoxic lake (Lake Greifen). Marine Chemistry 36:9-26
Šimek K., Kasalický V., Zapomělová E., and Horňák K. (2011) Alga-derived substrates select for distinct betaproteobacterial lineages and contribute to niche separation in Limnohabitans strains. Applied and Environmental Microbiology 77:7307-7315
Šimek K., Pernthaler J., Weinbauer M.G., Hornák K., Dolan J.R., Nedoma J., . . . Amann R. (2001) Changes in bacterial community composition and dynamics and viral mortality rates associated with enhanced flagellate grazing in a mesoeutrophic reservoir. Applied and Environmental Microbiology 67:2723-2733
Simon M., Lenhard A., and Tilzer M.M. (1993) Bacterial production and the sinking flux of particulate organic carbon in a large and deep lake in comparison to oceanic environments. Marine Microbial Food Webs 7:161-176
Sipos R., Székely A.J., Palatinszky M., Révész S., Márialigeti K., and Nikolausz M. (2007) Effect of primer mismatch, annealing temperature and PCR cycle number on 16S rRNA gene-targetting bacterial community analysis. FEMS Microbiology Ecology 60:341-350
Siuda W., and Chróst R.J. (2002) Decomposition and utilization of particulate organic matter by bacteria in lakes of different trophic status. Polish Journal of Environmental Studies 11:53-65
Smith D.C., Simon M., Alldredge A.L., and Azam F. (1992) Intense hydrolytic enzyme activity on marine aggregates and implications for rapid particle dissolution. Nature 359:139-142
Smucker R.A. (1991) Chitin primary production. Biochemical Systematics and Ecology 19:357-369
Sobek S., Durisch-Kaiser E., Zurbrügg R., Wongfun N., Wessels M., Pasche N., and Wehrli B. (2009) Organic carbon burial efficiency in lake sediments

References
148
controlled by oxygen exposure time and sediment source. Limnology and Oceanography 54:2243-2254
Sogin M.L., Morrison H.G., Huber J.A., Welch D.M., Huse S.M., Neal P.R., . . . Herndl G.J. (2006) Microbial diversity in the deep sea and the underexplored "rare biosphere". Proceedings of the National Academy of Sciences of the United States of America 103:12115-12120
Stable H.-H. (1984) Mechanisms controlling the sedimentation sequence of various elements in prealpine lakes. In: W. Stumm (Ed.) Chemical processes in lakes. John Wiley, New York
Stackebrandt E., and Goebel B.M. (1994) Taxonomic note: A place for DNA-DNA reassociation and 16S rRNA sequence analysis in the present species definition in bacteriology. International Journal of Systematic Bacteriology 44:846-849
Staley J.T., and Konopka A. (1985) Measurement of in situ activities of nonphotosynthetic microorganisms in aquatic and terrestrial habitats. Annual Review of Microbiology 39:321-346
Steeman-Nielsen E. (1952) The use of radioactive carbon (14C) for measuring organic production in the sea. Journal du Conseil permanent International pour l'Exploration de la Mer 18:117-140
Sun M.Y., Aller R.C., Lee C., and Wakeham S.G. (2002) Effects of oxygen and redox oscillation on degradation of cell-associated lipids in surficial marine sediments. Geochimica et Cosmochimica Acta 66:2003-2012
Suzuki K., Sugawara N., Suzuki M., Uchiyama T., Katouno F., Nikaidou N., and Watanabe T. (2002) Chitinases A, B, and C1 of Serratia marcescens 2170 produced by recombinant Escherichia coli: Enzymatic properties and synergism on chitin degradation. Bioscience, Biotechnology and Biochemistry 66:1075-1083
Suzuki M.T., and Giovannoni S.J. (1996) Bias caused by template annealing in the amplification of mixtures of 16S rRNA genes by PCR. Applied and Environmental Microbiology 62:625-630
Svitil A.L., Chadhain S.M.N., Moore J.A., and Kirchman D.L. (1997) Chitin degradation proteins produced by the marine bacterium Vibrio harveyi growing on different forms of chitin. Applied and Environmental Microbiology 63:408-413
Svitil A.L., and Kirchman D.L. (1998) A chitin-binding domain in a marine bacterial chitinase and other microbial chitinases: Implications for the ecology and evolution of 1,4-β-glycanases. Microbiology 144:1299-1308
Tang K.W., Bickel S.L., Dziallas C., and Grossart H.P. (2009) Microbial activities accompanying decomposition of cladoceran and copepod carcasses under different environmental conditions. Aquatic Microbial Ecology 57:89-100
References
149
Tang K.W., Hutalle K.M.L., and Grossart H.P. (2006) Microbial abundance, composition and enzymatic activity during decomposition of copepod carcasses. Aquatic Microbial Ecology 45:219-227
Timmis K., Hobbs G., and Berkeley R.C.W. (1974) Chitinolytic clostridia isolated from marine mud. Canadian Journal of Microbiology 20:1284-1285
Torsvik V., Øvreås L., and Thingstad T.F. (2002) Prokaryotic diversity - Magnitude, dynamics, and controlling factors. Science 296:1064-1066
Tranvik L.J., Downing J.A., Cotner J.B., Loiselle S.A., Striegl R.G., Ballatore T.J., . . . Weyhenmeyer G.A. (2009) Lakes and reservoirs as regulators of carbon cycling and climate. Limnology and Oceanography 54:2298-2314
Tremblay L., and Benner R. (2009) Organic matter diagenesis and bacterial contributions to detrital carbon and nitrogen in the Amazon River system. Limnology and Oceanography 54:681-691
Tsujibo H., Yoshida Y., Miyamoto K., Imada C., Okami Y., and Inamori Y. (1992) Purification, properties, and partial amino acid sequence of chitinase from a marine Alteromonas sp. strain O-7. Canadian Journal of Microbiology 38:891-897
Tulonen T., Salonen K., and Arvola L. (1992) Effects of different molecular weight fractions of dissolved organic matter on the growth of bacteria, algae and protozoa from a highly humic lake. Hydrobiologia 229:239-252
Turner J.T. (2002) Zooplankton fecal pellets, marine snow and sinking phytoplankton blooms. Aquatic Microbial Ecology 27:57-102
Unger D., Gaye-Haake B., Neumann K., Gebhardt A.C., and Ittekkot V. (2005) Biogeochemistry of suspended and sedimentary material in the Ob and Yenisei rivers and Kara Sea: Amino acids and amino sugars. Continental Shelf Research 25:437-460
Utermöhl H. (1958) Zur Vervollkommnung der quantitativen Phytoplankton-Methodik. Mitteilungen der internationalen Vereinigung für theoretische und angewandte Limnologie 9:1-38
Van Der Gucht K., Sabbe K., De Meester L., Vloemans N., Zwart G., Gillis M., and Vyverman W. (2001) Contrasting bacterioplankton community composition and seasonal dynamics in two neighbouring hypertrophic freshwater lakes. Environmental Microbiology 3:680-690
Vaz-Moreira I., Egas C., Nunes O.C., and Manaia C.M. (2011) Culture-dependent and culture-independent diversity surveys target different bacteria: A case study in a freshwater sample. Antonie van Leeuwenhoek, International Journal of General and Molecular Microbiology 100:245-257
Vogler P. (1965) Beiträge zur Phosphatanalytik in der Limnologie. Fortschritte der Wasserchemie und ihrer Grenzgebiete 2:109-119

References
150
Vrba J., Kofronova-Bobkova J., Pernthaler J., Simek K., Macek M., and Psenner R. (1997) Extracellular, low-affinity β-N-acetylglucosaminidases linked to the dynamics of diatoms and crustaceans in freshwater systems of different trophic degree. Internationale Revue der Gesamten Hydrobiologie 82:277-286
Vrba J., Šimek K., Pernthaler J., and Psenner R. (1996) Evaluation of extracellular, high-affinity β-N- acetylglucosaminidase measurements from freshwater lakes: An enzyme assay to estimate protistan grazing on bacteria and picocyanobacteria. Microbial Ecology 32:81-99
Wakeham S.G., Lee C., Hedges J.I., Hernes P.J., and Peterson M.L. (1997) Molecular indicators of diagenetic status in marine organic matter. Geochimica et Cosmochimica Acta 61:5363-5369
Wang G.C.Y., and Wang Y. (1997) Frequency of formation of chimeric molecules as a consequence of PCR coamplification of 16S rRNA genes from mixed bacterial genomes. Applied and Environmental Microbiology 63:4645-4650
Watanabe T., Kanai R., Kawase T., Tanabe T., Mitsutomi M., Sakuda S., and Miyashita K. (1999) Family 19 chitinases of Streptomyces species: Characterization and distribution. Microbiology 145:3353-3363
Watanabe T., Kobori K., Kiyotaka, Miyashita, Fujii T., Sakai H., . . . Tanaka H. (1993) Identification of glutamic acid 204 and aspartic acid 200 in chitinase A1 of Bacillus circulans WL-12 as essential residues for chitinase activity. Journal of Biological Chemistry 268:18567-18572
Weinbauer M.G., Fuks D., and Peduzzi P. (1993) Distribution of viruses and dissolved DNA along a coastal trophic gradient in the northern Adriatic Sea. Applied and Environmental Microbiology 59:4074-4082
Weiss P., Schweitzer B., Amann R., and Simon M. (1996) Identification in situ and dynamics of bacteria on limnetic organic aggregates (lake snow). Applied and Environmental Microbiology 62:1998-2005
Wetzel R.G. (1995) Death, detritus, and energy flow in aquatic ecosystems. Freshwater Biology 33:83-89
Williamson N., Brian P., and Wellington E.M.H. (2000) Molecular detection of bacterial and streptomycete chitinases in the environment. Antonie van Leeuwenhoek, International Journal of General and Molecular Microbiology 78:315-321
Wunderlin T. (2009) Fingerprinting bacterial communities from three Swiss lakes in response to chitin enrichment. Master thesis ETH Zurich.
Xiao X., Yin X., Lin J., Sun L., You Z., Wang P., and Wang F. (2005) Chitinase genes in lake sediments of Ardley Island, Antarctica. Applied and Environmental Microbiology 71:7904-7909

References
151
Yannarell A.C., Kent A.D., Lauster G.H., Kratz T.K., and Triplett E.W. (2003) Temporal patterns in bacterial communities in three temperate lakes of different trophic status. Microbial Ecology 46:391-405
Yannarell A.C., and Triplett E.W. (2004) Within- and between-lake variability in the composition of bacterioplankton communities: investigations using multiple spatial scales. Applied and Environmental Microbiology 70:214-223
Yannarell A.C., and Triplett E.W. (2005) Geographic and environmental sources of variation in lake bacterial community composition. Applied and Environmental Microbiology 71:227-239
Yue J.C., and Clayton M.K. (2005) A similarity measure based on species proportions. Communications in Statistics - Theory and Methods 34:2123-2131
Zeng J., Bian Y., Xing P., and Wu Q.L. (2012) Macrophyte species drive the variation of bacterioplankton community composition in a shallow freshwater lake. Applied and Environmental Microbiology 78:177-184
Zhang X., and Amelung W. (1996) Gas chromatography determination of muramic acid, glucosamine, mannosamine, and galactosamine in soils. Soil Biology and Biochemistry 28:1201-1206
Zobell C.E., and Rittenberg S.C. (1937) The occurrence and characteristics of chitinoclastic bacteria in the sea. Journal of Bacteriology 35:275-287
Zwart G., Crump B.C., Kamst-van Agterveld M.P., Hagen F., and Han S.K. (2002) Typical freshwater bacteria: An analysis of available 16S rRNA gene sequences from plankton of lakes and rivers. Aquatic Microbial Ecology 28:141-155

153
ACKNOWLEDGMENTS
I would like to thank all the people who supported me during my time as a PhD student. Without you this thesis would not exist! First I would like to express thanks to my supervisors Dr. Helmut Bürgmann and Prof. Josef Zeyer. Helmut, thanks for giving me the opportunity to work at this extraordinarily beautiful place Kastanienbaum, your confidence, and “open doors”. Thank you Sepp for caring about the progress of my work, your good advice and correcting and improving my manuscripts. I am grateful to Prof. Hans-Peter Grossart for co-examination of this thesis. I would like to thank my project partners Carsten Schubert and Dörte Carstens for the good collaboration. Thanks to Carsten for correcting and improving my manuscripts and the special project meetings. In particular, I want to thank Helmut and Carsten for selecting Dörte and me for this challenging interdisciplinary project. It was a great pleasure to work with you Dörte! Thank you for all the discussions, your sense of humor and optimism! I am grateful to all the people who helped me in the field: Michael Schurter, Alois Zwyssig, Francisco Vazquez, Tina Wunderlin, Torsten Diem, Gijs Nobbe, Leticia Stojkovski, Mathias Kirf, and Beat Kienholz. In particular, I would like to thank Francisco Vazquez for his great support in the field and in the lab, his outstanding expertise and commitment and his friendship. I am grateful to Esther Keller for analyzing the zoo- and phytoplankton samples from Lake Zug. Frederik Hammes is acknowledged for support with flow cytometry analyses. Thanks to Stefan Zoller from the Genetic Diversity Center ETH Zurich for helping with bioinformatics. I am grateful to Markus Zeh and Katrin Guthruf from the Environmental Agency of Canton Bern for providing the plankton monitoring data of Lake Brienz. Peter Keller from the Environmental Agency of Canton Zug is acknowledged for providing monitoring data from Lake Zug. I would like to thank the Aua Lab and Ruth Stierli for the basic chemical analysis. My special thanks are extended to the great secretaries’ team Eliane Scharmin, Patricia Achleitner, Luzia Fuchs, and Nadja Pepe for their administrative support. I thank the Swiss National Science Foundation for funding this study. Thank you Lawrence, Jeff, Oliver, and Dörte for cooking together and the humorous lunch breaks. Thank you Chregu for sharing the coffee breaks with me and the interesting discussions. I am very grateful to my family and friends for their support, their sympathetic ear and motivation during my PhD work.