Embed Size (px)
Citation preview
Research Collection
Doctoral Thesis
Distribution and storage of data on local and remote disks inmulti-use clusters of commodity PCs
Author(s): Rauch, Felix
Publication Date: 2003
Permanent Link: https://doi.org/10.3929/ethz-a-004629233
Rights / License: In Copyright - Non-Commercial Use Permitted
This page was generated automatically upon download from the ETH Zurich Research Collection. For moreinformation please consult the Terms of use.
ETH Library

Distribution and Storage of Dataon Local and Remote Disksin Multi-Use Clusters of PCs
Distribution and Storage of Dataon Local and Remote Disksin Multi-Use Clusters of PCs
Series in Computer ScienceVolume 4
Felix Rauch
ΣHartung-Gorre


Distribution and Storage of Data on Local and Remote Disksin Multi-Use Clusters of Commodity PCs
Felix V. Rauch


Felix V. Rauch
Distribution and Storage of Dataon Local and Remote Disks
in Multi-Use Clusters of Commodity PCs
Hartung-Gorre Verlag Konstanz2003

Reprint of Diss. ETH No. 15281
Felix V. Rauch
Distribution and Storage of Data on Local and Remote Disks
in Multi-Use Clusters of Commodity PCs
A dissertation submitted to the
Swiss Federal Institute of Technology Zurich (ETH)
for the degree of
Doctor of Technical Sciences
accepted on the recommendation of
Prof. Dr. Thomas M. Stricker, examiner
Prof. Dr. Walter Schaufelberger, co-examiner
Dr. Bernard Tourancheau, co-examiner
Series in Computer Science Volume 4
Editor: Thomas. M. Stricker
Bibliographic Information published by Die Deutsche BibliothekDie Deutsche Bibliothek lists this publication in the DeutscheNationalbibliografie; detailed bibliographic data is available in theinternet at http://dnb.ddb.de.
Copyright c© 2003 by Felix V. Rauch
First edition 2003
HARTUNG-GORRE VERLAG KONSTANZ
ISSN 1611-0943ISBN 3-89649-893-2

To the memory of Valentin Shun Rauch


Acknowledgements
Many people have supported me in one way or another while I was working on my dis-sertation and I would like to take the opportunity to express my sincere gratitude to them.
I would like to thank first and foremost my advisor Professor Thomas M. Stricker.Under his supervision I had the opportunity to conduct exciting research and work withinteresting computer systems. I got many insights into computer science by his detailedand constructive criticism as well as his constant drive to improve all aspects of our re-search. This dissertation improved greatly thanks to his vision and suggestions.
My thanks also go to Professor Walter Schaufelberger and Bernard Tourancheau whoagreed to be my co-advisors. I am thankful for their suggestions and feedback.
I am also in great debt to Christian Kurmann and Michela Taufer. Many parts ofthis dissertation would not have been possible without Christian’s generous support andsuggestions. Michela’s help with ORACLE databases and the TPC-D benchmarks wasinvaluable. She also gave me many opportunities to test my knowledge of Linux internals.
Furthermore I thank my students Christian Widmer, Andreas Fleuti, Michael Psarrosand Christian Wittenhorst. Their implementation efforts during their term and mastersprojects were indispensable. The projects of Ivo Sele, Martin Gruter, Rolf Spuler, EricDondelinger, Roland Brand and Patrik Stahli also gave me great insights, even thoughtheir results did not find a way into this dissertation.
My thanks include all the members of the laboratory for computer systems at ETHZurich, who made the many hours of work (and especially the breaks) so friendly andpleasant, but are too numerous to be completely listed.
I am further very thankful to Matthias Neeracher for proofreading the manuscript ofmy dissertation. His suggestions and remarks were of great value and helped me tremen-dously to sail around the cliffs and reefs of the english language and its grammar.
Many thanks go to my parents Elisabeth and Paul Rauch-Fry, as well as to my brotherand sister, Daniel and Trix, for all their love and support. Last, but certainly not least, Iwould like to thank my fiancee Rebecca Valenti for her love, understanding and endlesssupply of energy.
v


Contents
Acknowledgments v
Contents vii
Abstract xi
Kurzfassung xiii
1 Introduction 11.1 Motivation. . . . . . . . . . . . . . . . . . . . . . . . . . . . . . . . . . 11.2 Challenges. . . . . . . . . . . . . . . . . . . . . . . . . . . . . . . . . . 41.3 Thesis Statement and Contributions. . . . . . . . . . . . . . . . . . . . 71.4 Roadmap . . . . . . . . . . . . . . . . . . . . . . . . . . . . . . . . . . 8
2 Background 112.1 Technology Trends that Lead to Commodity Computing. . . . . . . . . 112.2 Benefit of Large Volumes. . . . . . . . . . . . . . . . . . . . . . . . . . 132.3 Commodity Computing for Clusters and Desktops: Multi-Use Clusters. . 18
2.3.1 Notions . . . . . . . . . . . . . . . . . . . . . . . . . . . . . . . 182.3.2 Bringing Clusters and Desktop PCs Together. . . . . . . . . . . 202.3.3 Usage Mode of Multi-Use Clusters. . . . . . . . . . . . . . . . 232.3.4 Examples of Multi-Use Clusters in Practice. . . . . . . . . . . . 25
2.4 Summary of Envisaged Environment. . . . . . . . . . . . . . . . . . . . 262.5 Problems . . . . . . . . . . . . . . . . . . . . . . . . . . . . . . . . . .262.6 Border to Other Areas. . . . . . . . . . . . . . . . . . . . . . . . . . . . 282.7 Summary . . . . . . . . . . . . . . . . . . . . . . . . . . . . . . . . . .31
3 Definitions and Concepts 333.1 Problem Definitions. . . . . . . . . . . . . . . . . . . . . . . . . . . . . 33
3.1.1 Data Stream Modeling. . . . . . . . . . . . . . . . . . . . . . . 333.1.2 Data Replication. . . . . . . . . . . . . . . . . . . . . . . . . . 343.1.3 Data Archival. . . . . . . . . . . . . . . . . . . . . . . . . . . . 35
vii

viii C ONTENTS
3.1.4 Data Gathering. . . . . . . . . . . . . . . . . . . . . . . . . . . 363.2 Network Topologies for Data Communication. . . . . . . . . . . . . . . 363.3 Data Granularity for Communication and Storage. . . . . . . . . . . . . 413.4 Frequency of Updates. . . . . . . . . . . . . . . . . . . . . . . . . . . . 433.5 System Layers. . . . . . . . . . . . . . . . . . . . . . . . . . . . . . . . 443.6 Summary . . . . . . . . . . . . . . . . . . . . . . . . . . . . . . . . . .46
4 Experimental Platforms 494.1 Evolution of PC Clusters Used for Experiments. . . . . . . . . . . . . . 49
4.1.1 Prototype Cluster of PCs: Old CoPs. . . . . . . . . . . . . . . . 504.1.2 First Multi-Use Cluster: Patagonia. . . . . . . . . . . . . . . . . 514.1.3 Main Experimental Testbed: New CoPs. . . . . . . . . . . . . . 514.1.4 Departmental PC Cluster Infrastructure: Xibalba. . . . . . . . . 52
4.2 Compliance of Building Blocks with their Specification. . . . . . . . . . 544.3 System Development. . . . . . . . . . . . . . . . . . . . . . . . . . . . 554.4 Summary . . . . . . . . . . . . . . . . . . . . . . . . . . . . . . . . . .56
5 Modelling Data Streams in Clusters 575.1 Introduction and Related Work. . . . . . . . . . . . . . . . . . . . . . . 575.2 Node Types. . . . . . . . . . . . . . . . . . . . . . . . . . . . . . . . . 595.3 Network Types . . . . . . . . . . . . . . . . . . . . . . . . . . . . . . . 605.4 Capacity Model. . . . . . . . . . . . . . . . . . . . . . . . . . . . . . . 615.5 Simple Model Algorithm. . . . . . . . . . . . . . . . . . . . . . . . . . 635.6 A More Detailed Model for an Active Node. . . . . . . . . . . . . . . . 665.7 Modelling the Limiting Resources in an Active Node. . . . . . . . . . . 675.8 Dealing With Compressed Data. . . . . . . . . . . . . . . . . . . . . . 685.9 Modelling Capabilities of Passive Nodes. . . . . . . . . . . . . . . . . . 69
5.9.1 Multicast Implementations. . . . . . . . . . . . . . . . . . . . . 695.9.2 Behavior Under Load. . . . . . . . . . . . . . . . . . . . . . . . 70
5.10 Summary and Conclusions. . . . . . . . . . . . . . . . . . . . . . . . . 72
6 Data Casting 756.1 Introduction and Related Work. . . . . . . . . . . . . . . . . . . . . . . 756.2 Differences in the Implementations. . . . . . . . . . . . . . . . . . . . . 77
6.2.1 Network-Supported Multicast. . . . . . . . . . . . . . . . . . . 776.2.2 Network File System (NFS). . . . . . . . . . . . . . . . . . . . 786.2.3 Tree Topology With Dolly-Tree. . . . . . . . . . . . . . . . . . 806.2.4 Multi-Drop Chain With Dolly . . . . . . . . . . . . . . . . . . . 81
6.3 Experimental Evaluation of Partition Cast. . . . . . . . . . . . . . . . . 826.4 Comparison of Model with Experimental Data. . . . . . . . . . . . . . . 856.5 Summary and Conclusions. . . . . . . . . . . . . . . . . . . . . . . . . 88
CONTENTS ix
7 Efficient Data Storage for OS Installations in Clusters 917.1 Introduction and Related Work. . . . . . . . . . . . . . . . . . . . . . . 91
7.1.1 The Problem of Software Maintenance. . . . . . . . . . . . . . 927.1.2 Related Work and Limitation of Commercial Products. . . . . . 937.1.3 Partition Cloning for Efficient Distribution. . . . . . . . . . . . 95
7.2 Characteristics of Data Evolution. . . . . . . . . . . . . . . . . . . . . . 967.2.1 Temporal Differences. . . . . . . . . . . . . . . . . . . . . . . . 967.2.2 Spacial Differences. . . . . . . . . . . . . . . . . . . . . . . . . 97
7.3 Data Repositories for Incremental Data Evolution. . . . . . . . . . . . . 987.3.1 Optimised Storage of Full Data Images. . . . . . . . . . . . . . 997.3.2 Storing Data Increments as Blockwise Diffs. . . . . . . . . . . . 1007.3.3 Storing Data Increments in Block Repositories. . . . . . . . . . 100
7.4 Experimental Evaluation of Partition Repositories. . . . . . . . . . . . . 1027.5 Summary and Conclusions. . . . . . . . . . . . . . . . . . . . . . . . .108
8 Distributed File Systems vs. Distributed Devices 1118.1 Introduction and Related Work. . . . . . . . . . . . . . . . . . . . . . .1118.2 Architectures Using Distributed Devices. . . . . . . . . . . . . . . . . .114
8.2.1 Petal . . . . . . . . . . . . . . . . . . . . . . . . . . . . . . . .1158.2.2 Network Block Device (NBD). . . . . . . . . . . . . . . . . . .1168.2.3 Myrinet Distributed-Device System (MDDS). . . . . . . . . . . 1178.2.4 Fast Network Block Device (FNBD). . . . . . . . . . . . . . . .1188.2.5 Discussion . . . . . . . . . . . . . . . . . . . . . . . . . . . . .120
8.3 Architectures of Distributed File Systems. . . . . . . . . . . . . . . . .1218.3.1 Lustre. . . . . . . . . . . . . . . . . . . . . . . . . . . . . . . .1218.3.2 Frangipani . . . . . . . . . . . . . . . . . . . . . . . . . . . . .1228.3.3 Parallel Virtual File System (PVFS). . . . . . . . . . . . . . . .1238.3.4 GigaFS . . . . . . . . . . . . . . . . . . . . . . . . . . . . . . .1248.3.5 Discussion . . . . . . . . . . . . . . . . . . . . . . . . . . . . .125
8.4 Evaluation. . . . . . . . . . . . . . . . . . . . . . . . . . . . . . . . . .1268.4.1 Workload Description . . . . . . . . . . . . . . . . . . . . . . .1268.4.2 Analytic Model. . . . . . . . . . . . . . . . . . . . . . . . . . .1298.4.3 Experimental Design. . . . . . . . . . . . . . . . . . . . . . . .1368.4.4 Performance Measurements. . . . . . . . . . . . . . . . . . . .138
8.5 Summary and Conclusions. . . . . . . . . . . . . . . . . . . . . . . . .149
9 Conclusions 1539.1 Summary and Contributions. . . . . . . . . . . . . . . . . . . . . . . .153
9.1.1 Modelling Data Streams in Clusters. . . . . . . . . . . . . . . .1559.1.2 Data Casting. . . . . . . . . . . . . . . . . . . . . . . . . . . .155

x CONTENTS
9.1.3 Efficient Data Storage for Evolutionary Partition Images. . . . . 1569.1.4 Distributed File Systems vs. Distributed Devices. . . . . . . . . 157
9.2 Future Work. . . . . . . . . . . . . . . . . . . . . . . . . . . . . . . . .1599.3 Concluding Remarks. . . . . . . . . . . . . . . . . . . . . . . . . . . .161
Bibliography 165
List of Abbreviations 175
List of Figures 177
List of Tables 181
Index 183
Curriculum Vitae 187
Abstract
Over the last few decades, the power of personal computers (PCs) has grown steadily, followingthe exponential growth rate predicted by Moore’s law. The trend towards the commoditization ofPC components (such as CPUs, memories, high-speed interconnects and disks) results in a highlyattractive price/performance ratio of the systems built from those components. Following thesetrends, I propose to integrate the commodity IT resources of an entire company or organziationinto multi-use clusters of commodity PCs. These include compute farms, experimental clusters aswell as desktop PCs in offices and labs. This thesis follows a bottom-up architectural approachand deals with hardware and system-software architecture with a tight focus on performance andefficiency. In contrast, the Grid view of providing services instead of hardware for storage andcomputation deals mostly with problems of capability, service and security rather than perfor-mance and modelling thereof.
Multi-use clusters of commodity PCs have by far enough storage on their hard-disk drives forthe required local operating-system (OS) installation and therfore there is a lot of excess storagein a multi-use cluster. This additional disk space on the nodes should be put to a better use for avariety of interesting applications e.g. for on-line analytic data processing (OLAP). The specificcontributions of the thesis include solutions to four important problems of optimized resourceusage in multi-use-cluster environments.
Analytic models of computer systems are important to understand the performance of currentsystems and to predict the performance of future systems early in the design stage. The thesisinstroduces a simpleanalytic model of data streams in clusters. The model considers the topologyof data streams as well as the limitations of the edges and nodes. It also takes into account thelimitations of the resources within the nodes, which are passed through by the data streams.
Using the model, the thesis evaluates different data-casting techniques that can be used toreplicate OS installations to many nodes in clusters. The different implementations based on IPmulticast, star-, tree- and multi-drop–chain topologies are evaluated with the analytic model aswell as with experimental measurements. As a result of the evaluation, themulti-drop chainisproposed as most suitable replication technique.
When working with multi-use clusters, we noticed that maintenance of the highly replicatedsystem software is difficult, because there are many OS installations in different versions andcustomisations. Since it is desirable to backup all older versions and customisations of all OSinstallations, I implemented several techniques to archive the large amounts of highly redundantdata contained in the nodes’ OS partitions. The techniques take different approaches of comparingthe data, but are all OS independent and work with whole partition images. Theblock repositories
xi

xii A BSTRACT
that store onlyuniquedata blocks prove to be an efficient data storage for OS installations inmulti-use clusters.
Finally we look at the possibilities to take advantage of the excess storage on the many nodes’hard-disk drives. The thesis investigates several ways to gather data from multiple server nodes toa client node running the applications. The combined storage can be used for data-warehousingapplications. While powerful multi-CPU “killer workstations” with redundant arrays of inexpen-sive disks (RAIDs) are the current workhorses for data warehousing because of their compatibilitywith standard databases, they are still expensive compared to multi-use clusters of commodity PCs.On the other end several researchers in databases have tried to find domain specific solutions usingmiddleware. My thesis looks at the question whether, and to what extent, the cost-efficient multi-use clusters of commodity PCs can provide an alternative data-warehousing platform with an OSsolution that is transparent enough to run a commodity database system. To answer the questionabout the most suitable software layer for a possible implementation, the thesiscompares differ-ent distributed file systems and distributed-device systemsagainst the middleware solution thatuses database-internal communication for distributing partial queries. The different approachesare modelled with the analytic model and evaluated with a microbenchmark as well as the TPC-Ddecision-support benchmark.
Given the existing systems and software packages it looks like the domain specific middle-ware-approach delivers best performance, and in the area of the transparent OS-only solution,distributed devices are faster than the more complex distributed file systems and achieve similarperformance to a system with local disks only.

Kurzfassung
In den letzten Jahrzehnten stieg die Leistung von”Personal Computern“ (PCs) kontinuierlich an,
entsprechend der durch das Moore’sche Gesetz verhergesagten exponentiellen Leistungskurven.Dieser Trend fuhrte dazu, dass PC-Komponenten (wie CPUs, Speicher, Hochgeschwindigkeits-Datennetzwerke und Festplatten) zu Massenware wurden und Alltags-PCs, die aus diesen Kom-ponenten gebaut werden, ein sehr attraktives Preis-Leistungs-Verhaltnis aufweisen. Diesem Trendfolgend schlage ich vor, die verschiedenen IT-Ressourcen eines Unternehmens oder einer Organi-sation zu kombinieren inMehrzweck-Cluster bestehend aus Alltags-PCs. Zu diesen IT-Ressourcengehoren Rechen- und Experimental-Cluster sowie PCs in Buros und Labors. Diese Disserta-tion folgt einem grundlagenorientierten architektonischen Ansatz und behandelt Hardware undSystem-Software mit einem engen Fokus auf Leistung und Effizienz. Im Gegensatz dazu orien-tiert sich der Ansatz des
”Grid“, das vor allem Dienste fur Datenspeicherung und Rechenleistung
anbietet, eher an Problemen der Kapazitat, Dienstqualitat und Sicherheit als an der Leistung undihrer Modellierung.
Mehrzweck-Cluster aus Alltags-PCs haben mehr als genug Speicherkapazitaten auf ihrenFestplatten fur notige lokale Betriebssystem-Installationen. Deruberschussige Speicher auf denFestplatten der Knoten kann folglich fur andere Aufgaben benutzt werden wie aufkommende An-wendungen der Online-Daten-Analyse (OLAP). Die spezifischen Beitrage dieser Dissertation un-tersuchen vier wichtige Problemstellungen des optimierten Ressourcen-Gebrauchs in Umgebun-gen mit Mehrzweck-Clustern.
Analytische Modelle von Computersystemen sind wichtig fur das Verstandnis und die Vor-hersage der Leistung von aktuellen bzw. zukunftigen Systemen bereits fruh in der Planung. DieDissertation stellt deshalb einanalytisches Modell von Datenstromen in Clusternvor, welches dieTopologie der Datenstrome sowie die Limitierungen der Kanten und Knoten berucksichtigt. Eben-so werden die Limitierungen der Ressourcen innerhalb der Knoten, durch welche die Datenstromefliessen, einbezogen.
Anhand des Modells werden verschiedene Daten-Verbreitungsmethoden zur Reproduktionvon Betriebssystem-Installationen auf viele Knoten in Clustern untersucht. Die verschiedenen Im-plementationen basieren auf IP Multicast, Stern- und Baum-Topologien sowie der
”multi-drop
chain“ (Kette mit mehrfacher Datenreplikation). Die Ansatze werden mit dem Modell als auchmit experimentellen Messungen verglichen. Anhand der Resultate wird die
”multi-drop chain“ als
am besten geeignete Methode zur Datenreplikation vorgeschlagen.
Bei unserer Arbeit mit Mehrzweck-Clustern stellt sich die Wartung von vielen verteiltenBetriebssystem-Installationen als schwierig heraus, weil die Installationen in verschiedenen Ver-
xiii

xiv K URZFASSUNG
sionen und lokalen Anpassungen vorliegen. Da eine Sicherung aller alten Versionen und Anpas-sungen wunschenwert ist, wurdenverschiedene Methoden zur Archivierung der grossen und teil-weise identischen Datenmengenin den Betriebssystem-Partitionen implementiert. Die Implemen-tationen verfolgen verschiedene Ansatze zum Vergleich der Daten, sind aber alle Betriebssystem-unabhangig und verwenden vollstandige Abbilder der Partitionen.
”Block repositories“ (Block-
Behalter), welche nur einzigartige Daten speichern, erweisen sich dabei als effiziente Datenspei-cher zur Archivierung von Betriebssystem-Installationen in Mehrzweck-Clustern.
Schliesslich betrachten wir Moglichkeiten, um dieuberschussigen Speicherkapazitaten aufden Festplatten der Knoten nutzen zu konnen. Die Dissertation untersucht verschiedene Wege umDaten von mehreren Server-Knoten zu sammeln und zu einem Client-Knoten zu schicken, wo ei-ne Anwendung die Daten verwendet. Der kombinierte Speicher kann fur Anwendungen aus demBereich des
”data warehousing“ (Datenwarenhaus) benutzt werden. Wahrend momentan beson-
ders leistungsstarke Arbeitsplatzrechner mit mehreren Prozessoren und redundanten Festplatten-Arrays (RAID) fur Datenwarenhauser verwendet werden, sind diese teuer im Vergleich zu Mehr-zweck-Clustern aus Alltags-PCs. Andererseits haben Datenbank-Forscher versucht, bereichsspezi-fische Losungen mit Middleware zu finden. Meine Dissertation hingegen nimmt sich der Frage an,ob und wie gut Mehrzweck-Cluster aus Alltags-PCs geeignet sind als alternative Datenwarenhaus-Plattform, die mit einer Betriebssystem-spezifischen Losung transparent genug ist, um Alltags-Datenbanksysteme betreiben zu konnen. Um die Frage nach der fur eine Implementation am be-sten geeigneten Ebene zu beantworten,vergleicht die Dissertation verschiedene verteilte Dateisy-steme und Systeme aus verteilten Geratenmit einer Middleware-Losung, welche die Datenbank-interne Kommunikation zur Verteilung von Abfragen benutzt. Die verschiedenen Ansatze werdenanalytisch modelliert und mit je einem Mikro- als auch einem Anwendungs-orientierten Leistungs-vergleich evaluiert.
Das Resultat des Vergleichs basierend auf bestehenden Systemen und Software-Paketen er-gibt, dass der bereichsspezifische Middleware-Ansatz die beste Leistung erreicht, wahrend im Be-reich der transparenten Betriebssystem-Ansatze die verteilten Gerate hohere Leistungen erbringenals die komplexeren verteilten Dateisysteme. Die Leistung der verteilten Gerate liegt im selbenBereich wie die von lokalen Festplatten.
1Introduction
Bandwidth is like candy given to a small child —you give the child one piece of candy and he wants a pound.
Hershey’s Law
Two trends determine the future of computing. The first trend is the commoditisationof components which drives an incredible improvement in the price/performance ratio ofcomputers. The second trend is closely coupled to the first one and leads to an increasingdistribution and parallelisation of high-performance applications. Eventually these twotrends will lead to the grid, a global infrastructure where computing power and storagespace is available for purchase as a commodity. The road to a global grid is still a long oneand many problems remain to be solved. The evolution of computer systems towards thegrid is an incremental process and fortunately there are milestones on the way in the formof systems that can be successfully built and used today. My thesis should be understoodas a contribution to the evolution of computer systems towards the grid. I am labelingthe current state of the art as multi-use clusters. This important step adds flexible useand management of distributed resources to conventional clusters of commodity PCs. Inthis thesis, I describe multi-use clusters and discuss some of their associated challengesin great detail.
In the first chapter of my thesis, I start with describing the motivation behind my re-search and the challenges that I tackled. After the thesis statement, I list my contributionsin the areas of analytic modelling, data distribution and storage. Finally I give a road mapon how I establish the thesis.
1.1 Motivation
Recent advances in technology created many different computer architectures, from per-sonal digital assistants (PDAs) to notebooks, laptops, desktops, workstations, high-end
1

2 Chapter 1: Introduction
servers with multiple parallel CPUs to highly parallel architectures. All these archi-tectures are successful because they are built from the same set ofcommoditybuildingblocks. The trend to commodity computing was especially strong over the last twodecades, when the performance of workstations and PCs improved consistently. Theworkstations were connected into networks of workstations (NOWs) to combine theircomputational power. With the increasing popularity of PCs, workstations were then re-placed by PCs and the term “network” was replaced by “clusters”, leading to clusters ofPCs (CoPs). The resulting systems were named “Beowulfs” after a first project on clustersof commodity PCs at NASA [BSS+95]1.
The Beowulf-style clusters combined commodity PC with initially limited power butwith a very appealing price/performance ratio to form economically highly attractive com-putation farms. When desktop PCs are connected by local area networks, they become“interpersonal computers”, enabling new applications and many ways of interpersonalcommunication and data exchange. The performance of the clusters’ building blocks—the PCs—improved constantly because of their increasing sales volume. In the end, thepower of a desktop PC matched a classical node in a supercomputer like the Cray T3E.In this new era almost all computing resources are made of commodity parts: From in-dividual PCs in laboratories and offices through small-scale experimental clusters up tohigh-performance supercomputing clusters at the biggest national and international re-search laboratories. Even newer devices like laptops, notebooks or PDAs are built fromthe same commodity components.
The trend to commodity computing and storage capacities increased the performanceand the amount of available computing resources considerably. However, many comput-ing resources in companies and universities are not used up to their full potential yet.Commodity desktop PCs in offices and laboratories are unused during most of their life-time and even small clusters in research and development groups are sometimes heavilyunderutilised because they are used only partially by small groups for some testing orresearch and development, wasting computing resources and money. On the other hand,there are many highly useful applications that can not be run due to lack of computingpower, small memories and limited disk space.
The idea to use all these unused computing resources to enable new types of appli-cations—or extend existing applications—on a global scale led the research communityto design a future evolutionary step of widely distributed computer system: The grid.The grid is a new computing infrastructure that connects multiple computing resources—bottom up—to enable new applications with very high demands on computational power,memory or storage space. This thesis provides a few specific novel operating systemtechnologies to drive the system evolution closer to the vision of a global grid, wherecomputational power and storage capacities are provided and traded as commodities.
1Analogous to all dark, acidic lemonades being called “coke”, even if they are Pepsi.
1.1. MOTIVATION 3
Since the research community has not yet agreed on what exactly the grid will looklike, a highly personal vision is stated in this introduction to my thesis. My view of agrid is that of a large number of interconnected machines and devices from many differ-ent classes, with all of them contributing some of their spare resources to a global poolof computing resources. In the end, all electronic devices will be interconnected andjoin forces to solve computationally highly demanding problems. However, many of thefundamental operating-system technologies needed to implement this vision are not yetdeveloped. There is still a long way to go and much research needs to be done until we canexpect to produce, consume and trade computational power and storage as a commodity.
The commodity PCs simplify the aggregation of computational power and storage re-sources and in fact, the combination of distributed CPU power works very well for somehighly parallel applications like SETI@home or the applications run with the infrastruc-ture of distributed.net. The aggregation of other resources on a large scale remains diffi-cult. Hard-disk drives for example grew in size and dropped in price disproportionally toother computer parts, giving a normal PC user access to much more storage than a fewyears ago. It became also very easy to manage some aggregated disk drives as a redundantarray of inexpensive disks (RAID) within a server that delivers high performance for ac-cesses that can be striped and carried out in parallel. Managing large distributed storagewhile maintaining high performance remains a big challenge. It will be even harder tomanage many different remote resources as resources are distributed over increasing geo-graphical and administrative distances in a global grid. In short, harnessing computationalpower of many CPUs is easy, but harnessing storage of many disks remains difficult.
Fortunately there are intermediate goals and milestones on the road from PCs andclusters to the global grid. Two key technologies in the evolution of computer systemstowards a universal infrastructure are desktop grids and multi-use clusters, which bothallow to better utilise available computational resources. Desktop grids intensively usesandboxes providing a virtual machine within the OSs of desktop machines. The parallelapplications are then run within these sandboxes. In contrast to desktop grids, the PCnodes of multi-use clusters have multiple OSs and runtime environments installed andare rebooted on demand to the desired environment. Desktop grids might offer a higheravailability because parallel applications may run within the sandboxes while the regularusers are working with their PCs, but applications must be adapted and depend on thesandboxes—which are harder to manage as they require additional software layers andcosts, might not be available for all OSs and lose a non negligible amount of resources dueto overhead. Multi-use clusters require reboots, but allow full efficiency due to exclusiveuse of the machines in any desired environment. Having full control allows to use OSs andmiddlewares that are highly optimised for the available hardware and the problem at hand.Applications need no adaptation to run on multi-use clusters: They are moved by cloningtheir installation to an unused partition on the disks of currently unused machines—takingalong their whole OS environment.
4 Chapter 1: Introduction
It is important to note that desktop grids and multi-use clusters are not mutually ex-clusive: The OS management technique of multi-use clusters can be used to replicate andmaintain different OS installations on clusters and desktop machines. During the day thedesktop PCs are booted into a generic office environment that allows employees to workwith their office applications while running desktop-grid applications in the background.During the night machines are booted into another environment which allows to run spe-cialised applications with high performance. Both techniques are steps in the evolutionfrom centralised computing resources to a global grid.
The evolution of computing resources towards a global computing and storage infras-tructure complicates the management of the resources and requires additional OS support.For the future we therefore need to provide OS support for the distributed managementof resources, while keeping up high performance. Systems research should lead to anadaptation of OSs which extends the efficient management of the resources of just onemachine to a flexible use of the resources of many distributed machines. Flexible use ofdistributed CPU power has been done for quite some time, but the flexible use of storagewith high performance is still a hard research problem.
1.2 Challenges
Three observable trends support the described multi-use cluster environment: First, thesize of commodity PCs’ hard disk drives increases every year, creating excess storagefor free. Secondly, commodity PCs will be equipped with high-performance networks,and thirdly, the throughput of future data networks is higher than the throughput of thehard-disk drive in a single PC.
Following these trends, I propose that the cluster nodes use the excess storage spaceon their local disks for system installations and as replicated data storage for auxiliary dataprocessing and analyses. The machines should store all required OSs completely on theirlocal disk, as there is enough disk space available. Storing the system installation locallyreleases the file server from the burden of serving many application binaries, libraries andother shared system files. Freeing the file server from the task frees system resources forserving the users’ data files. Special experiments or classes may even require replacingthe whole installation with their own, for example to be able to change system parameters,because another exotic operating system is needed or because a large amount of local datais required.
The excess storage in the cluster nodes and the fast network also allow to store large,non-priority data sets in a distributed manner, so that large-scale analyses can access thedata during non-critical times. There are two approaches to use the excess storage: Eitherdata is replicated on many nodes and different parallel analyses are run locally on thenodes, or data is striped over the nodes, allowing larger data sets to be analysed by ac-

1.2. CHALLENGES 5
cessing the data over the network in some way. The use of the additional resources allowsto augment the amount of computation, analysis or processing.
The optimised resource management in multi-use clusters and desktop-grid–like envi-ronments leads to a few particular challenges in operating systems and to many interestingquestions that I will try to address in this thesis.
In the practice and tradition of operating systems work, one could argue that solvingthe problems is a question of hiring or educating more talented hackers that might produceacceptable solutions. As a scientist, I want to follow a more scientific approach and tryto understand and predict the systems’ performance by creating analytic models for thesoftware systems we are trying to optimise. The models should include all the buildingblocks of the environment and model the properties of performance and efficiency. Withsuch a model for large reliable data streams in distributed storage systems, it would beeasier to find the best system, because dead leads could be detected earlier in the designprocess.
As a first application of modelling and optimising OS support for multi-use clusterswe will look at the best way of replicating data across multi-use clusters. It is not obvioushow to replicate large identical data sets to many nodes as quickly as possible. WhileIP multicast theoretically seems to be the obvious choice for the data distribution, it israther difficult in practice to synchronise the many nodes for high-speed multicast trans-missions. Another interesting question is whether data compression should be used, sincecompression would certainly reduce the amount of transmitted data and thus the accesstime for the network, but on the other hand compression uses a lot of CPU power, therebypotentially slowing the throughput of the transmission.
A further problem when distributing and maintaining a large number of machines withdistributed operating system images is to keep a revision history of the changes to theinstallations. With a complete revision history it is possible to reinstall the last workingversion of a system, even if a rarely used software part broke in some older revision ofthe installation. Because some of the machines might have additional hardware or specialduties, they require a customisation of their software installation. The complete revisionhistories of all the installations as well as all the customisations are potentially a hugeamount of data that must be stored somewhere in a space-efficient way.
To archive all the different evolutionary installations on the nodes as well as the cus-tomisations, we need a technique to store all involved partitions in an efficient way. Hereagain, the question of whether to compress the data arises. While it seems obvious thatcompression will help to reduce the amount of data to store in the archive, it is worth moredetailed research to find good solutions for other parameters of the system, like e.g. thesize of the data blocks in the archive. Besides these standard compression techniques itwould also be interesting to investigate whether it is possible to completely eliminate du-plicate data parts in such an archive to reduce the required storage even more—especiallywhen many upgraded systems with similar data are archived. Furthermore, it is also de-

6 Chapter 1: Introduction
sirable for such an archive system to be independent of OSs and file systems since thereare potentially many different of them in a multi-use cluster.
Working with the distribution of OS images, there is a question on how to provideaccess to storage in a larger system with a global view. The need for a technique toefficiently access the distributed data storage on the nodes’ hard-disk drives poses thequestion of how to implement the data accesses—that are almost exclusively read only—in an efficient way. The obvious first choice might be to use an existing distributed filesystem. A distributed file system offers many features that are not really necessary in thissimplified environment. It might be possible to achieve a higher throughput by virtuallydistributing the devices and handling them as if they were local to the data processingnodes. This reduces many overheads, but treating distributed devices as if they werelocal completely ignores problems that are common to distributed systems but of differentimportance in local systems.
One could argue that putting a pile of PCs together should not be considered research.However, applied research should be directed towards real, existing systems. While somelarge, proprietary supercomputers still exist today, research and development for new ma-chines can hardly be financed nowadays. For most customers, supercomputers offer amuch worse price/performance ratio than commodity cluster systems. Hardware man-ufacturers must make sure that their systems supports the customers’ applications. Forproprietary systems this means that not only the hardware must be built, but often also alot of accompanying system software like OSs, compilers and libraries. It is economicallymuch more interesting to build simple commodity parts that work as part of commoditysystems (and possibly supply a driver for it) thereby integrating perfectly into existingsystems that already support customers’ applications. This economical trend towardscommodity clusters is also visible in the semiannually “TOP500” list of the world’s 500most powerful computer systems. In the 22nd edition of the list from November 2003,41% of all systems are clusters—more than half of the top ten are clusters built on com-modity PC technology. Even if these clusters are based on commodity parts, it is certainlynot enough to just plug all the parts together to get high performance. The individual partsare engineered to get best possible price/performance for themselves, but combining themdoes not necessarily result in a high overall performance of the resulting system. Whatwe need is that all the parts work well individually, together and combined with all theinvolved software. Research should thus also find ways to get more—or even the most—out of economically feasible systems. Omitting this applied research would result in lossof performance and thus wasted money. I think that innovative research does not onlycome from improving the building blocks of a system (be it hardware or software), butalso from improving the system as a whole. The goal of applied systems research shouldbe to combine all the parts, including the hardware, system and application software, insuch a way that the resulting system is “more than the sum of its parts”.
1.3. THESIS STATEMENT AND CONTRIBUTIONS 7
1.3 Thesis Statement and Contributions
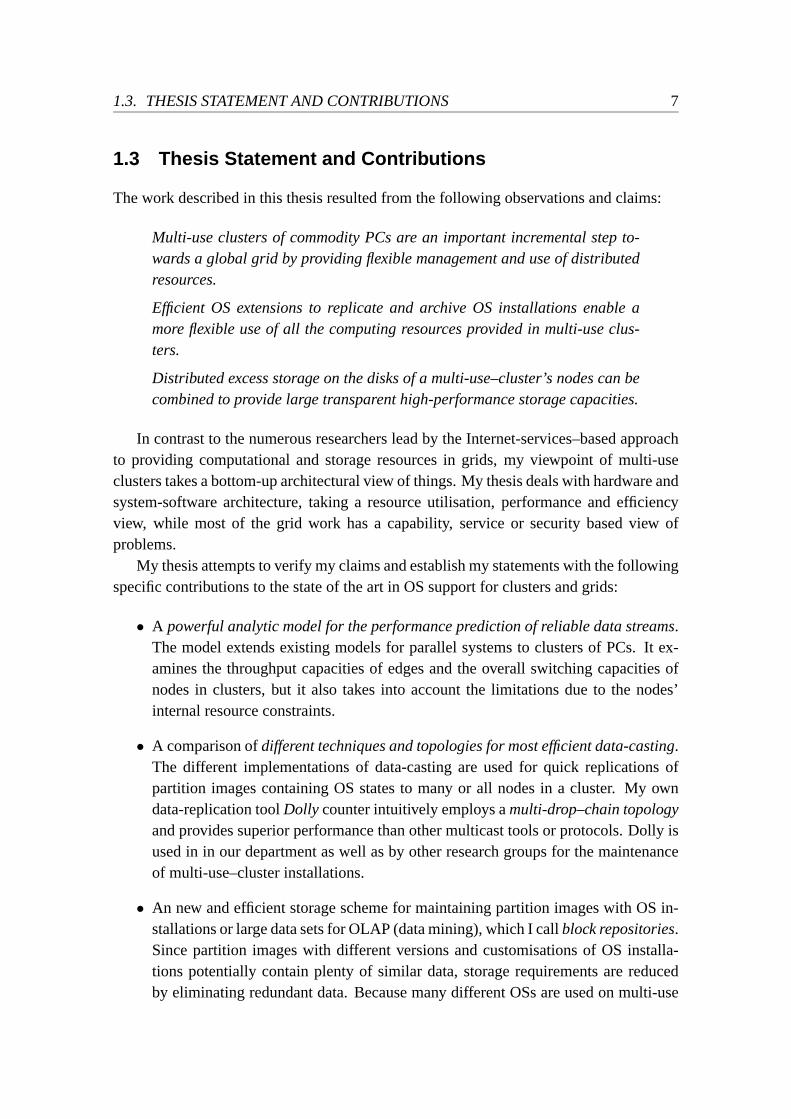
The work described in this thesis resulted from the following observations and claims:
Multi-use clusters of commodity PCs are an important incremental step to-wards a global grid by providing flexible management and use of distributedresources.
Efficient OS extensions to replicate and archive OS installations enable amore flexible use of all the computing resources provided in multi-use clus-ters.
Distributed excess storage on the disks of a multi-use–cluster’s nodes can becombined to provide large transparent high-performance storage capacities.
In contrast to the numerous researchers lead by the Internet-services–based approachto providing computational and storage resources in grids, my viewpoint of multi-useclusters takes a bottom-up architectural view of things. My thesis deals with hardware andsystem-software architecture, taking a resource utilisation, performance and efficiencyview, while most of the grid work has a capability, service or security based view ofproblems.
My thesis attempts to verify my claims and establish my statements with the followingspecific contributions to the state of the art in OS support for clusters and grids:
• A powerful analytic model for the performance prediction of reliable data streams.The model extends existing models for parallel systems to clusters of PCs. It ex-amines the throughput capacities of edges and the overall switching capacities ofnodes in clusters, but it also takes into account the limitations due to the nodes’internal resource constraints.
• A comparison ofdifferent techniques and topologies for most efficient data-casting.The different implementations of data-casting are used for quick replications ofpartition images containing OS states to many or all nodes in a cluster. My owndata-replication toolDolly counter intuitively employs amulti-drop–chain topologyand provides superior performance than other multicast tools or protocols. Dolly isused in in our department as well as by other research groups for the maintenanceof multi-use–cluster installations.
• An new and efficient storage scheme for maintaining partition images with OS in-stallations or large data sets for OLAP (data mining), which I callblock repositories.Since partition images with different versions and customisations of OS installa-tions potentially contain plenty of similar data, storage requirements are reducedby eliminating redundant data. Because many different OSs are used on multi-use

8 Chapter 1: Introduction
clusters, block repositories work independent of the OSs or file systems, which isan improvement over other existing archival techniques that are either efficient orindependent of underlying operating and file systems.
• Several implementations and a qualitative comparison of different hardware andsoftware architectures to coalesce excess storagefrom the disks of multiple nodesin the cluster, based on the analytic model. As an alternative to application-leveldata distribution, I examine transparent approaches to access remote storage forunchangeable applications. Specifically, I compare a middleware approach for dis-tributed data analyses on the ORACLE database system with approaches that trans-parently usedistributed file systemsanddistributed devicesas its underlying storagearchitecture. My approaches require no additional costs for hardware or softwareand are fully transparent to the applications.
1.4 Roadmap
The rest of this dissertation is structured as follows:
In Chapter2 the technological trends that lead to the success of commodity com-puting are described. These trends made it possible to combine traditional clusters ofcommodity PCs and—around the turn of the century when the research for this thesis wasconducted—desktop PCs into multi-use clusters of commodity PCs. I will also explainthe usage modes of multi-use clusters and present my vision for a target environment. Af-ter the description of multi-use clusters, I discuss the problems that arise in such a setupand briefly list related areas of research.
In Chapter3 a theory is established and architectural problems are discussed. Aftera formal problem definition, I discuss different topologies for data distribution as wellas data granularities for communication and storage. I then discuss frequencies for soft-ware updates in multi-use clusters and finally list the different system layers where datadistribution techniques can be implemented.
Chapter4 lists details about the evolution of our experimental platforms and some ofthe problems we encountered.
Chapter5 looks into an analytic model for data streams in clusters in more detail. FirstI discuss different node and network types. A basic model and a corresponding algorithmform the middle part of the chapter. The last part describes an extended model, whichalso takes the limiting resources in the active nodes into account.
In Chapter6 the problem of high-speed large-scale data distribution in clusters isaddressed and different approaches to a solution are presented. The chapter contains anexperimental evaluation and a comparison with the predictions of the analytic model fromChapter5.
1.4. ROADMAP 9
Chapter7 contains a description of block repositories as an efficient data storage tech-nique for OS installations in clusters. After discussing the problem of software mainte-nance in great detail, I present three different techniques for the storage of incrementallyevolving data, which finally leads to block repositories. In an experimental section, Ievaluate the different techniques with partition images from our productive cluster instal-lations.
Chapter8 describes our implementations and a comparison of multiple distributed filesystems and distributed devices as data distribution techniques. I model the performancefor one representative of each technique with the analytic model presented in Chapter5.Implementations for each representative as well as a more traditional middleware solutionare then evaluated with performance measurements. The measurements include a mi-crobenchmark as well as a standard OLAP benchmark running on an ORACLE databasesystem that transparently accesses remote storage either through the middleware, througha distributed file system or through distributed devices.
Chapter9 will summarise the contributions, discuss future work and end with someconcluding remarks.


2Background
I think there is a world market for maybe five computers.Thomas Watson, chairman of IBM, 1943
Large-volume commodity computing was enabled by some technological trends that Iwill discuss in more detail in this chapter. The chapter also includes an attempt to forecaston where the continuation of these trends will lead to. I will also describe and define theenvironments and the terminology used for commodity and desktop computing as wellas multi-use clusters of commodity PCs. Another important part is to draw a borderlinebetween the content of my thesis and other related areas of research and to explain therelevance for the application domain of multi-use clusters of commodity PCs. After giv-ing some examples of typical multi-use clusters I will summarise my target computingenvironment and describe some problems that arise in the described environments.
2.1 Technology Trends that Lead to Commodity Computing
At the beginning of the supercomputer era, computers based on integrated circuits (ICs)were still a relatively new technique. New techniques are always expensive and thus onlya few organisations could afford computers. The few computers available were custom-made and the costs for their development had to be recouped from a small number ofcustomers, keeping costs high. This economical condition is properly illustrated by thequotation at the very beginning of this chapter. The quotation’s prediction was soon ex-ceeded, thanks to many emerging applications for computers.
New applications increased the demand for computers. Since supercomputers werestill too expensive for wide-spread use microcomputers and later workstations emergedthat filled the gap. The workstations’ performance was of course lower than the super-computers’, but their price was low enough for wider use in engineering departments anduniversities. The increased propagation of workstations even enabled the creation of anew type of computing resource: Networks of workstations (NOWs), which are described
11

12 Chapter 2: Background
in [ACP95, Ste96]. NOWs enabled laboratories to get their own cheap yet cost-efficient“supercomputer”.
The availability of workstations and microcomputers enabled even more applicationsfor computers and increased the demand for computing resources again. This increasingdemand proved a fertile ground for the creation of the personal computer (PC). The PCshad an even more limited functionality and only few features, but were still useful enoughfor simple tasks like text editing, spreadsheet calculations and small database managementin many office environments. Frequent use of PCs in offices resulted in much higher vol-umes than supercomputers or workstations. The large volumes and the increasing numberof competitors in the PC market allowed only small margins on equipment that was notin the top range, high margins were only possible for new technology. New technologysold best when the price/performance ratio was good for the customers. Customers thusforced technology companies to invest in research and development (R&D) to improve theprice/performance more than the competitors. The tough competition in the market forPC parts—especially CPUs and RAM—coerced the companies to push the technologicalborders to their limits.
The limit of the technology was roughly given by Moore’s law [Moo65], which statesthat the number of transistors per square inch on ICs doubles roughly every 18 months1.Moore’s law held for many years and ICs became denser all the time. Denser ICs resultedparticularly in faster CPUs and larger RAMs, the amount of storage on hard-disk drivesimproved similarly. These trends resulted generally in more data that was processed at afaster pace. These increased data processing capabilities resulted in a spiral in which thedemand for even more computational and data processing capabilities arose.
Because of the high volume of the market, most development efforts were spent onthe most common (and most sold) computer parts. This allowed many companies to focuson only a few products that were used in a wide area. Today, most computers sold runwith an Intel-based processor: Desktops, laptops, servers and high-performance clusternodes. Memory evolved in a similar way and today most computers use standard memoryof the DRAM family like e.g. DDR SDRAM. Likewise, current desktop systems as wellas (file) servers and disk systems attached to a SAN all use IDE or SCSI hard-disk drivesto store data (with different interfaces). In the domain of interconnection networks thetrend to commodity networks selected the Ethernet family of networks (including FastEthernet, Gigabit Ethernet and 10 Gigabit Ethernet) as the predominant technology fordesktops, laptops, servers and clusters (only a few high performance clusters use differentnetworking technologies like e.g. Myrinet or QsNet from specialised vendors like Myri-com or Quadrics respectively). Recapitulating these trends, we notice that most computerparts for a broad range of current systems are of the same frequently-used type and thusbecame commodity products.
1In his original paper from 1965, Moore observed a period of 12 months for the doubling of componentsper area on an IC, which slowed down to 18 months in about 1970.
2.2. BENEFIT OF LARGE VOLUMES 13
The computing and processing capabilities improved so well—thanks to the “com-moditisation” of PC parts—that todays top desktop machines have similar performanceas the expensive supercomputers back in the 1980s. For example in 1988 the Cray Y-MP was the first supercomputer to sustain 1 GFlop/s on many applications (with multiple333 MFlop/s processors). At the time of writing this thesis a top desktop system alsodelivers roughly 1 GFlop/s. The same Cray Y-MP could hold 1 GByte of memory, whichwill soon be the standard for high-end desktop machines that are hardly sold with any-thing less than 256 MByte of RAM nowadays. A similar trend holds for the developmentof storage. As a result todays top desktop machines can be considered as “old Crays onthe desk”.
The rapid evolution of PCs made them more and more attractive to supercomputerapplications. Even though a single PC does not have sufficient resources for success in thehigh-performance world, many PCs together can urge forward into the domain of currentsupercomputers. These clusters of commodity PCs are generally called Beowulf clustersand are usually composed of commodity PC parts and commodity operating systems likeLinux, as described in [BSS+95].
In fact, when we look at the most powerful supercomputers in the world (as definedby the Linpack benchmark [DBMS79]) which are listed in the TOP500 list [TOP03], wesee an increasing share of clusters, many of them based on PC-type nodes. Most futuresupercomputers will be based on commodity PC clusters, but the commodity PCs willstill drive the technological development for the years to come.
The result is that todays cluster hardware is exclusively commodity hardware that iscomposed of mass-market parts and can easily be bought in any computer store. Withthe ever increasing minimisation and integration, the commodity PCs include more andmore built-in features such as: Network interconnect, graphic card or disk adapters. Withthese features built-in, the difference in the hardware between cluster nodes and inter-personal computers vanishes more and more. For the near future I expect Beowulf-stylecomputational clusters and desktop PCs to have practically identical hardware.
2.2 Benefit of Large Volumes
As described in the previous section, the volume of the computer-parts market increasedrapidly, such that computer parts are commodity products today. In this section I willexamine these technological trends in more detail and explain their benefits. The mostimportant trends for commodity PCs are as follows:
Fast computation capabilities Commodity CPUs used for workstations and PCs be-come faster every year. Figure2.12 illustrates this trend with the SPEC CPUfloating-point (FP) benchmark (notice that the results of the two generations of
2Source: [SPE03]

14 Chapter 2: Background
the benchmark can not be compared directly. The numbers for the two rightmostyears 2000 and 2003 in each of the two figures include only the first halves of therespective years). The results of the SPEC CPU benchmark include not only theCPUs performance, but to some degree also the memory and compiler of the exam-ined system. It is thus more realistic than a simple theoretical MFLOP number for aCPU. From the figure we can deduce that the median computation power of work-stations and PCs increased by a factor of more than 14 from 1995 until 2003 andeven the performance of the slowest system improved by a factor of more than 12.In the same time the code for applications became more complex and consumedsome of these improvements. Still, the increase in computational power is remark-able and will continue to increase as long as Moore’s law holds.
1995(38)
1996(134)
1997(70)
1998(86)
1999(73)
2000(37, part.)
10
100
SP
EC
CP
U95
FP
res
ult
SPEC CPU95 FP benchmark
2000(69)
2001(120)
2002(139)
2003(81, part.)
50
100
1000
5000
SP
EC
CP
U20
00 F
P r
esu
lt
SPEC CPU2000 FP benchmark
Lowest, median and highest SPEC CPU benchmark results by year of publication(number of published results)
Figure 2.1: Development of computation capabilities 1995-2003.
My conclusion from this trend is that commodity PCs will have strong computa-tional capabilities available.
Large RAMs DRAM ICs became commodity products and their technological evolutionwas driven by the large demand of the growing PC market. This lead to a continuinggrowth of the size of DRAM ICs as illustrated in Figure2.23. The figure showsthe size of DRAM ICs in the year of their introduction into the market. At thetime of the introduction the ICs are still quite expensive, that is why the commoditymarket typically uses ICs that are no longer at the top of the technological evolution.Still, the figure shows a trend that is similar for these second line products4. From
3Source: [IC 03]4Those interested in the details of DRAM costs will find a figure in Chapter 1.4 of [HP96]

2.2. BENEFIT OF LARGE VOLUMES 15
Figure2.2we see that the size of the DRAM ICs also increase exponentially—againas long as Moore’s law holds. The additional RAM available in PCs is used forlarger data sets and the larger applications, libraries and multimedia contents. Still,much of this additional RAM is unused for typical office applications (it might beused for buffering data, which is not of great importance for an office environment).
1970 1975 1980 1985 1990 1995 2000
10
100
1000
10000
100000
1000000
10000000
DR
AM
IC s
ize
[Kb
it]
Year of IC's introduction
Figure 2.2: Development of DRAM IC capacity 1970-2000.
My conclusion from this trend is that there is enough RAM available in commod-ity PCs for more complex tasks than typical office applications—now and in themedium-term future.
Large hard-disk drives Hard disks get much larger every year (even the smaller disks).Todays commodity PCs have larger disks by default than what can be used by ageneral purpose OS. Storage requirements of OSs increase also, but at a smallerrate. In Figure2.35 is a graphic overview over the recent development from 1995until 2003. The data is taken from a hard-disk overview of the German c’t maga-zine. It shows that most (E)IDE and SCSI disks on the market today have a sizeclearly above 10 GBytes, the smallest EIDE disk examined in 2003 was 13 GBytes.A comparison of the development of EIDE disk sizes and the storage required fora full SuSE Linux installation during the years 1998 until 2003 is shown in Fig-ure2.4. Similar numbers hold for other operating systems. Note that a typical OSenvironment does not require a full OS installation with all supplied packages, butonly a subset with the packages used by the actual user or user group.
My conclusion from this trend is that there is a lot of excess storage available in thenodes of commodity clusters.
5Source: c’t Magazin fur Computertechnik, issues 1995(11), 1998(14), 2000(16), 2003(05)

16 Chapter 2: Background
4Q/1995(12 disks)
3Q/1998(124 disks)
3Q/2000(163 disks)
1Q/2003(109 disks)
0.1
10
100
1000D
isk
size
[G
Byt
e]
4Q/1995(18 disks)
3Q/1998(101 disks)
3Q/2000(123 disks)
1Q/2003(98 disks)
0.1
10
100
1000
Dis
k si
ze [
GB
yte]
(E)IDE SCSI
Smallest, median and largest disk of c't magazine surveys
Figure 2.3: Development of hard-disk sizes from 1995–2003.
1998 1999 2000 2001 2002 20030
5
10
15
20
25
30
Siz
e [G
Byt
e]
Year of survey
Median disk size
Full OS size
Figure 2.4: Development of hard-disk sizes and a full SuSELinux installation from 1995–2003.
High-speed network Commodity PC nodes will have built-in high-speed networkinghardware with ever increasing throughput. In the past, networks were an add-into personal computers that used to be isolated machines. Networking features be-came anymore important, so built-in network interfaces became more and more astandard (i.e. Ethernet). With increasing communication demands, Ethernet was nolonger fast enough, so Fast Ethernet NICs and later built-in Fast Ethernet becamethe standard. With new multi-media applications, growing data complexity andtherefore larger data sets, Fast Ethernet again starts to show its limits. Commoditysystems—even some laptops—appear with built in Gigabit Ethernet. The high-speed networks are first used in specialised environments where a small amount ofhigh-speed equipment suffices to fulfill the demands. Thanks to wide spread uni-

2.2. BENEFIT OF LARGE VOLUMES 17
versal twisted pair cabling (UTP) and auto-sensing NICs and switches, other partsof departmental networks can be upgraded later when there is a need for highercommunication bandwidths or when the costs of the next-generation switches camedown.
My conclusion from this trend is that commodity clusters of the future will have ahigh-speed general-purpose network built in.
4Q/1995(12 disks)
3Q/1998(124 disks)
3Q/2000(163 disks)
1Q/2003(109 disks)
10
100
Dis
k th
rou
gh
pu
t [M
Byt
e/s]
4Q/1995(18 disks)
3Q/1998(101 disks)
3Q/2000(123 disks)
1Q/2003(98 disks)
10
100
Dis
k th
rou
gh
pu
t [M
Byt
e/s]
(E)IDE SCSI
Slowest, median and fastest disk of c't magazine surveys
Figure 2.5: Development of hard-disk throughput 1995–2003.
1995 1999 20031
10
100
1000
2000
Th
rou
gh
pu
t [M
Byt
e/s]
Year
Max. disk throughput
Ethernet throughput
Fas
t E
ther
net
Gig
abit
Eth
ern
et
10 G
igab
it E
ther
net
Figure 2.6: Development of maximal throughput for EIDE hard-disk drives andEthernet networks 1995–2003.
Network is faster than disk A state-of-the-art network is usually faster than a state-of-the-art hard-disk drive (See also Figures2.56 and2.6). In 1995 Fast Ethernet be-came a standard with a throughput of about 11 MByte/s and initial products wereon the market, but still expensive back then. At the same time, the fastest hard
6Source: c’t Magazin fur Computertechnik, issues 1995(11), 1998(14), 2000(16), 2003(05)
18 Chapter 2: Background
disk had a sustained throughput for large linear reads of roughly 5 MByte/s (IDE)to 7 MByte/s (SCSI). Gigabit Ethernet appeared in 1998, but was still very expen-sive due to the fiber interconnects. Its prices came down when copper intercon-nects became available around the year 2000. In 2000, the fastest disks’ speedincreased to about 27 MByte/s (IDE) or 35 MByte/s (SCSI). Now in 2003, thefirst 10 Gigabit Ethernet adapters are in the market, offering realistic throughputsof about 800 MByte/s, while the fastest available disks offer 37 MByte/s (EIDE)to 52 MByte/s (SCSI). The current median disk speed of roughly 15–25 MByte/sis still substantially below the rapidly deploying Gigabit Ethernet. Of course, formore realistic access patterns the disks throughput is much less and the differencebetween the disk and the network increases even more.
My conclusion from this trend is that there is excess bandwidth available in thenodes’ network connection to export local partitions to other nodes in the network.Or in other words: Even if we export the disk to other nodes and the disk is readover the network at full speed, there is still bandwidth left for the main applications.
The above five trends suggest that future IT resources are composed of multi-use clus-ters of commodity PCs. I will describe multi-use clusters of commodity PCs in followingsections.
2.3 Commodity Computing for Clusters and Desktops: Multi-Use Clusters
In this section I will explain my vision of multi-use clusters. Do do so I first have to definesome notions from the domains of commodity hardware, PCs and clusters.
2.3.1 Notions
For a better understanding of this part of my thesis I will describe some of the notions thatare frequently used in this chapter.
At the time of their introduction,personal computers(PCs) were used by only oneperson at a time for isolated office applications. Byoffice applicationsI mean mostlytext processing, spreadsheet calculations and data management with databases. In theearly days PCs had no network connections and floppy disks were used to exchange databetween machines, but nowadays most PCs are interconnected and also used to exchangedata with other persons, sointerpersonal computerwould be a more descriptive term7.Todays PCs are now quite similar to workstations, which are high-end PCs in most cases.
I use the wordcommodityfor goods that can be bought in every regular shop, ormore adapted to this technical context:Commodity hardwareor commodity computers
7For the sake of simplicity I will use the abbreviation “PC” in the rest of this thesis.
2.3. COMMODITY COMPUTING FOR CLUSTERS AND DESKTOPS: MULTI-USECLUSTERS 19
are technical goods that can be bought in any regular computer store. In contrast, highlyspecialised hardware that is not commodity has to be ordered in advance and is producedon demand, like e.g. supercomputers. On the border between the two categories are goodsthat can only be bought in specialised stores or by mail order (as is the case for e.g.many high-performance network interconnects that are commonly used in clusters). I stillconsider these products to be commodity, since they can easily be bought from web-storesand have a reasonably low price to be widely used in certain communities.
A traditional cluster is generally a group of computers that is working together in atight or loose cooperation. The machines of a cluster are often of a similar type or evenidentical. The same administrator manages the machines which are situated in the sameroom. Clusters can be subdivided in different types of clusters like computational, ex-perimental or collaborative clusters.Computational clusterswork on computationallyintensive parallel tasks (“number crunching”). These clusters often run all around theclock in computational centres and use a batch scheduling system to allocate the poten-tially large number of jobs to the nodes.Experimental clustersare used as experimentalsystems in laboratories, for example to test new interconnect technologies or other hard-ware, operating system features, middlewares or still unstable software releases. Theyare often in unstable conditions and not used for productive work. Finally,collaborativeclusters are used by persons that somehow work together on the same problem. Oftenthe machines in a student laboratory are used as collaborative clusters as many studentswork on the same problem (and some try to mutually solve the problem). Another exam-ple for a collaborative cluster can be found in movie companies where many employeescollaboratively work on new movies.
A student laboffers temporary workplaces for students. It offers a certain minimalsoftware environment on all machines that is adequate for students taking many differentclasses. Because of the wide range of classes typically given at a university, the machinesin such a lab typically require a lot of installed software from different areas, includingtypical office applications and communication software like browsers and email clients.Smaller specialised labs might do with less software as there are less students using themachines.
A multi-use clusteris a cluster that is used for multiple uses, often by multiple usersand user groups. The uses might be completely different and not just different applicationsor application domains like e.g. on a computational cluster. The requirements for thewidely different uses might even require different operating systems and different usagemodes. A multi-use cluster’s nodes might even be used as office PCs at one time and asnodes for a computational cluster at another time. A multi-use cluster is therefore notnecessarily as tightly coupled as a traditional cluster (see above) and its nodes may belocated in different offices or labs. However, the nodes of a multi-use cluster are still partof the same department and are usually still placed in the same building, while the nodesof emerging desktop grids may be spread over a whole country. Amulti-use cluster of

20 Chapter 2: Background
commodity PCsis a multi-use cluster consisting of commodity hardware. Given todaysdevelopment in hardware technology, this holds for almost all multi-use clusters. Forexamples of multi-use clusters of commodity PCs in practice see Subsection2.3.4.
An IT resourceis some information-technology (IT) equipment to achieve a certaininformation-related task, e.g. in the application domains of computation, data processing,data storage, visualisation or multi-media applications. Examples of such tasks include(but are not limited to) scientific computing, spreadsheet calculations, store permanent ortemporary data, text processing, small and large data base applications like managementof employees’ data or complex data mining, visualisation of complex data structures,multi-media teaching, or collaborative work.
2.3.2 Bringing Clusters and Desktop PCs Together
Because of the aforementioned large-volume market and the ensuing commoditisation ofPC parts, PCs and cluster nodes came closer together. The remaining differences betweencluster nodes and PCs are in the operating and usage modes as shown in Table2.1: Tradi-tional clusters are installed in racks placed in server rooms, run all around the clock andhave no monitors or keyboards attached. PCs on the other hand are installed as desktopunits in offices and labs, are used only during “business” hours and are equipped withmonitors, keyboards and mice.
Cluster Personal computer
Installation Rack mounted DeskEnvironment Server room Offices, labsOperation times All around the clock “Business” hours,
unused during nightPrimary user No monitor, keyboard or mouseMonitor, keyboard and mouseinteraction Network only
Table 2.1: Operating modes: Differences of clusters and personal computers.
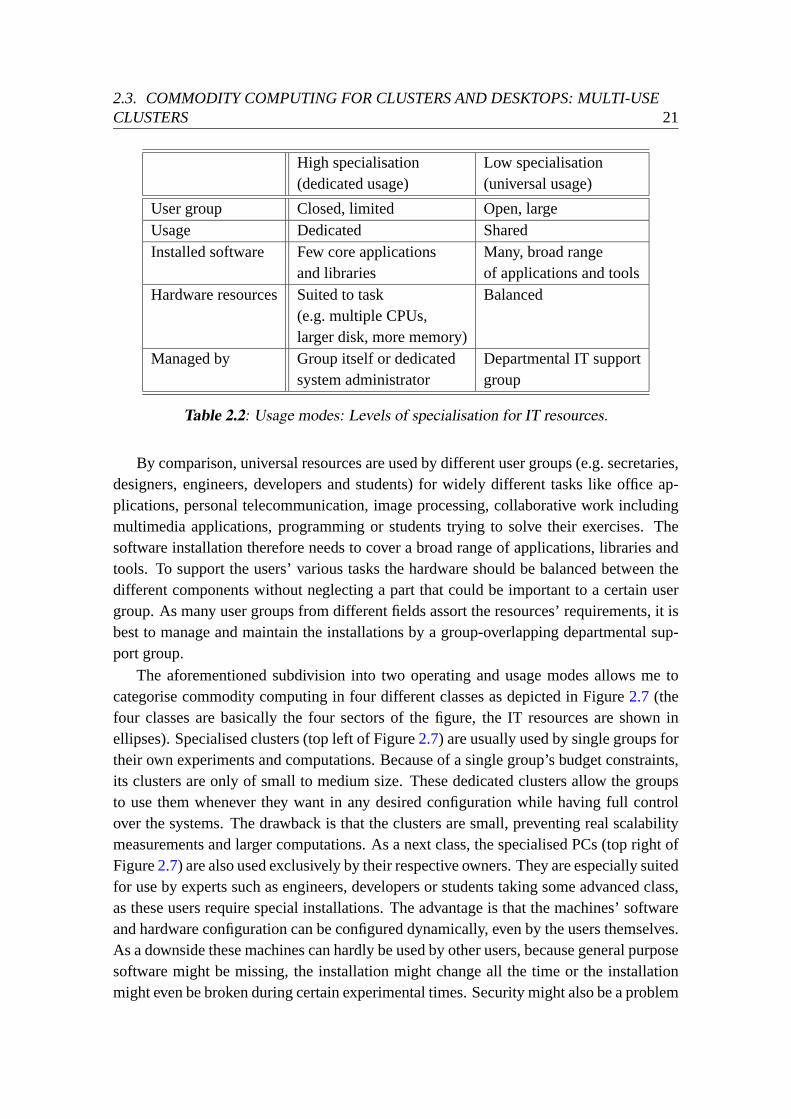
Both clusters and PCs have different levels of specialisation according to their usagemodes. The differences between highly specialised and universal usage are shown in Ta-ble 2.2. A higher level of specialisation results in a small, closed user group using theavailable resources exclusively for a few core tasks. While only a small software instal-lation suffices for these core tasks the hardware is sometimes especially accommodated:For computationally intensive tasks a second CPU might be installed, while memory hun-gry applications need more RAM or communication-sensitive codes are supported witha special high-performance network. Since the installation is highly specialised, the ad-ministration is often done by the user group itself or a dedicated system administrator.
2.3. COMMODITY COMPUTING FOR CLUSTERS AND DESKTOPS: MULTI-USECLUSTERS 21
High specialisation Low specialisation(dedicated usage) (universal usage)
User group Closed, limited Open, largeUsage Dedicated SharedInstalled software Few core applications Many, broad range
and libraries of applications and toolsHardware resources Suited to task Balanced
(e.g. multiple CPUs,larger disk, more memory)
Managed by Group itself or dedicated Departmental IT supportsystem administrator group
Table 2.2: Usage modes: Levels of specialisation for IT resources.
By comparison, universal resources are used by different user groups (e.g. secretaries,designers, engineers, developers and students) for widely different tasks like office ap-plications, personal telecommunication, image processing, collaborative work includingmultimedia applications, programming or students trying to solve their exercises. Thesoftware installation therefore needs to cover a broad range of applications, libraries andtools. To support the users’ various tasks the hardware should be balanced between thedifferent components without neglecting a part that could be important to a certain usergroup. As many user groups from different fields assort the resources’ requirements, it isbest to manage and maintain the installations by a group-overlapping departmental sup-port group.
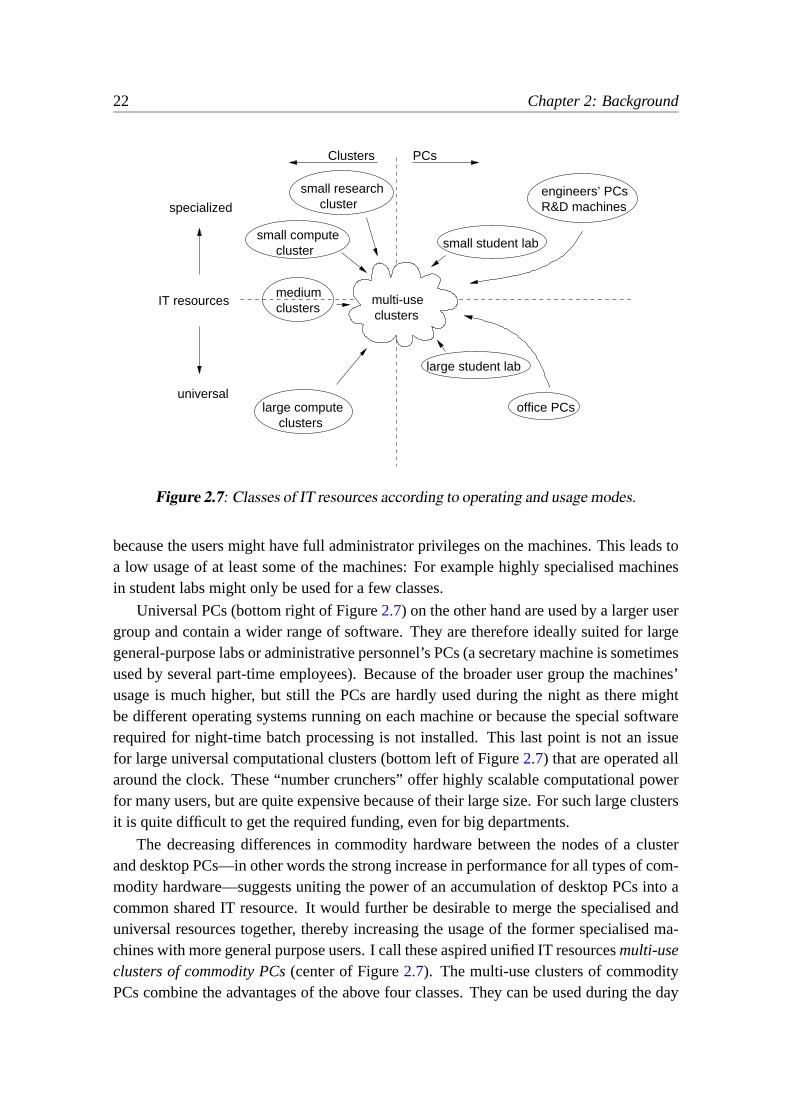
The aforementioned subdivision into two operating and usage modes allows me tocategorise commodity computing in four different classes as depicted in Figure2.7 (thefour classes are basically the four sectors of the figure, the IT resources are shown inellipses). Specialised clusters (top left of Figure2.7) are usually used by single groups fortheir own experiments and computations. Because of a single group’s budget constraints,its clusters are only of small to medium size. These dedicated clusters allow the groupsto use them whenever they want in any desired configuration while having full controlover the systems. The drawback is that the clusters are small, preventing real scalabilitymeasurements and larger computations. As a next class, the specialised PCs (top right ofFigure2.7) are also used exclusively by their respective owners. They are especially suitedfor use by experts such as engineers, developers or students taking some advanced class,as these users require special installations. The advantage is that the machines’ softwareand hardware configuration can be configured dynamically, even by the users themselves.As a downside these machines can hardly be used by other users, because general purposesoftware might be missing, the installation might change all the time or the installationmight even be broken during certain experimental times. Security might also be a problem
22 Chapter 2: Background
clusterengineers’ PCsR&D machines
small student lab
small research
large computeclusters
mediumclusters
office PCs
large student lab
specialized
small computecluster
universal
multi-useclusters
IT resources
PCsClusters
Figure 2.7: Classes of IT resources according to operating and usage modes.
because the users might have full administrator privileges on the machines. This leads toa low usage of at least some of the machines: For example highly specialised machinesin student labs might only be used for a few classes.
Universal PCs (bottom right of Figure2.7) on the other hand are used by a larger usergroup and contain a wider range of software. They are therefore ideally suited for largegeneral-purpose labs or administrative personnel’s PCs (a secretary machine is sometimesused by several part-time employees). Because of the broader user group the machines’usage is much higher, but still the PCs are hardly used during the night as there mightbe different operating systems running on each machine or because the special softwarerequired for night-time batch processing is not installed. This last point is not an issuefor large universal computational clusters (bottom left of Figure2.7) that are operated allaround the clock. These “number crunchers” offer highly scalable computational powerfor many users, but are quite expensive because of their large size. For such large clustersit is quite difficult to get the required funding, even for big departments.
The decreasing differences in commodity hardware between the nodes of a clusterand desktop PCs—in other words the strong increase in performance for all types of com-modity hardware—suggests uniting the power of an accumulation of desktop PCs into acommon shared IT resource. It would further be desirable to merge the specialised anduniversal resources together, thereby increasing the usage of the former specialised ma-chines with more general purpose users. I call these aspired unified IT resourcesmulti-useclusters of commodity PCs(center of Figure2.7). The multi-use clusters of commodityPCs combine the advantages of the above four classes. They can be used during the day

2.3. COMMODITY COMPUTING FOR CLUSTERS AND DESKTOPS: MULTI-USECLUSTERS 23
for any task as described above, simply by booting them into the desired environment. Thesame machines can and should also be used during the night, booted into their night-timeenvironment, levering the amount of computational resources available to a department.
2.3.3 Usage Mode of Multi-Use Clusters
The four aforementioned classes of commodity computing resources differ in the waytheir OS installations are managed. A comprehensive usage mode for multi-use clustersunites the management and maintenance into a common usage mode which I will describein this subsection.
Nodes should store their OS installations locally, including all libraries and applicationbinaries. There is enough space for that (see trends in Section2.2) and it helps to offloadthe server which can then focus on serving users’ critical data. Mission-critical user datais still stored on a central server in practical environments for various reasons: (a) Aserver has enough room to put in or attach as many disks as needed, (b) the storage spaceis centrally manageable, (c) access to the server is possible from anywhere at any time,(d) the noise of additional disks is generated in the separate server room and not in theusers’ offices, (e) the backup strategy is simplified and (f) a real server room has coolingequipment installed to reduce failure rates of mission critical data.
In a multi-use cluster with many different user groups it might even be required to re-place a complete system installation in a short time. Different classes for students mighthave varying demands for the installed systems. Even if multiple installed systems areavailable, there might be classes that need a very rare local installation, e.g. for experi-ments with databases, local file systems or to store multi-media content. During the night,another user group might have different requirements for the installations to conduct ex-periments or data analysis. Cluster nodes will therefore not only have local system instal-lations, they also need to be able to replace their installations (or at least parts thereof)quickly.
The installations on the nodes are likely to be mostly identical, as the operating systemused is usually the same. Some nodes might have customisation like e.g. different userdomain, different default printer depending on the location of the node, slightly differenthardware or users might make some small system changes like additionally installed fa-vored software or different versions of the system. Therefore we need a mechanism toback up the complete state of every nodes installation. Further, even small system up-grades might render some specific functionality of one or more nodes unusable. Thesekinds of problems might be go unnoticed until somewhen later when a seldomly used ap-plication is started and does no longer work. In these situations it would be helpful to beable to go back in the history of system installations to find the last installation that stillworked. Thus, we also need a mechanism to back up the different versions of installedsystem and application software.
24 Chapter 2: Background
Because of the ever increasing disk sizes and the excellent cost/performance ratio ofdistributed single disks, the nodes in a multi-use cluster of commodity PCs have enoughspace for non mission-critical data like e.g. databases that are used for marketing analysisor other data that is processed at a lower priority (this data are of course also important,but their primary storage location is on some server as argued above. The nodes additionalstorage capabilities are used for read-only data analysis and to unburden the server). Theadditional storage space and processing capacities of the cluster nodes provide additionalresources that would otherwise not be available. These resources can ideally be used foremerging applications like data warehousing (e.g. customer data) or data analysis (e.g.stock trade analysis). These applications have no transactional properties and a lowerdemand for consistency or availability and can thus profit ideally from the excess storageof distributed disks in a multi-use cluster.
Some of the above described reasons for using the excess storage capacities in thecluster nodes could certainly encourage the use of the storage locally to the nodes. Bycopying a small database to many nodes’ local disks, data processing can be parallelisedand will therefore either reduce processing time or increase the number of analyses thatcan be processed in a certain amount of time. On the other hand, with improved meth-ods for data collection (e.g. because of improved physical sensors in experiments, bettermodels for simulations resulting in more data output, higher resolutions in multi-mediaapplications, complexer scenes for movie rendering) the demand for storage capacity in-creases. To process the increasing amount of data, higher throughput is also essential. Tosatisfy the demand for higher storage capacity, the distributed excess storage of the clusternodes should be aggregated. This aggregate space can by combined similar to a RAID8,but in a distributed manner instead of with local disks. In a sense, a node in a multi-usecluster has some similarities with a NA(S)D9, but has much more computational powerand is used in a shared usage mode. According to the second trend listed previously clus-ters will have a high-speed network that allows to access disks over the network without anetwork-induced reduction in performance. Because of the third trend from above, com-bining multiple nodes’ disks helps to better utilise the bandwidth offered by the networkwhile still leaving enough bandwidth for regular applications. By combining multipleremote disks, the data throughput for a single client can be improved.
Theoretically the distributed excess storage on the nodes could be used for importantdata. There are ways to protect against node crashes (similar to the redundancy introducedin a RAID). But in the case of multi-use clusters it is still difficult to have enough nodesrunning at all times, to guarantee the availability of all data. Employees could for exampleturn their systems off when going on vacations and the storage space will not be availableduring every upgrade of the cluster. I therefore suggest to store critical data on a serverand using the distributed storage space for less critical read-only data copies only (see
8Redundant array of inexpensive disks9Network-attached (secure) disk
2.3. COMMODITY COMPUTING FOR CLUSTERS AND DESKTOPS: MULTI-USECLUSTERS 25
also the beginning of this section where I explained why users’ data should be stored ona central server).
A similar approach to add storage space could be to just add a few cheap disks tosome nodes of the cluster and let the nodes process data locally. Advantages to suchan approach are simplicity (just add disks and use them) and independence (of othernodes). The disadvantages in a multi-use cluster would be costs for the additional disks(as opposed to the free excess storage space that is in the nodes anyway), energy, heat andnoise (the latter being especially a problem in office environments). Therefore I proposeto use the underutilised disks that are already installed in the nodes of a multi-use cluster.
When looking at the above usage modes for multi-use clusters, we can identify threemajor scenarios for data communication patterns. A first pattern occurs mostly in the tra-ditional usage mode of a computational cluster, where the nodes communicate in an many-to-many pattern. Many-to-many communication patterns are used for example when thenodes of the cluster run an application program that uses MPI middleware to communi-cate data between all its processes, for example during FFTs or in array transposes whereonly one dimension of the array is distributed [SH96]. A second kind of communicationpattern is applied for a “network RAID” where a client node accesses the disks of someserver nodes over a network in a many-to-one communication pattern. This is the sce-nario of a distributed file system or a system with distributed devices that I will discussin more detail in Chapter8. And finally a third communication pattern is a the counter-part of the many-to-one pattern, the one-to-many communication pattern. This pattern isused for data replication when a server needs to replicate some data (for example an OSinstallation from a hard-disk drive) to many other nodes in the cluster.
2.3.4 Examples of Multi-Use Clusters in Practice
A typical multi-use cluster of commodity PCs is the Patagonia cluster of the departmentof computer science at ETH Zurich that is described in [RKMLS99, Pat00]. It consistscompletely of commodity hardware bought from a major manufacturer of desktop PCs.The machines were already fully connected by Gigabit Ethernet in the year 2000. Atthe time the hard-disk drives allowed to install multiple operating systems, namely twodifferent installations of Windows NT for education and research, also two different Linuxinstallations for the same reason, Oberon [Rei91, WJ92] and a small maintenance OS. Thecluster was installed in a classroom and mostly used by students of varying classes duringday, few students did tests for master theses and some scientific experiments were runduring nights and weekends.
Another multi-use cluster of commodity PCs is the Xibalba cluster [KRS03, Xib03]which was installed during summer 2001 at the department of computer science at ETHZurich. It is not a typical representative for multi-use clusters of commodity PCs since itis installed in racks in the basement of the computer centre. Nevertheless it is composed of
26 Chapter 2: Background
commodity hardware and software and used by different user groups with many differentsoftware requirements and operating systems. Every node includes a full installation ofWindows 2000, two Linux installations for two different user groups and a small mainte-nance operating system. The different user groups use their own parts of the cluster in thepreferred environment for their daily work, but for for larger computations or scalabilitytests all nodes of the cluster are temporarily rebooted into the desired environment.
For the full details of the hardware of these two clusters, see Section4.1.
2.4 Summary of Envisaged Environment
In the future, I see multi-use clusters of commodity PCs as a combined evolution ofBeowulf-style computational clusters and desktop PCs working together. The latter typeof clusters is referred to as “Desktop Grids” and is installed differently as the nodes areplaced on employees’ desks or in student labs. The usage scheme of multi-use clustersis also a combination of their predecessors: During the day, the nodes are used by their“owners” or even multiple user groups with widely different usage requirements for theirdaily work, while during the night and over the weekend the clusters are used for lowerpriority tasks. This switch between different user groups might require quick reinstalla-tions of local data or software for many nodes in the cluster.
The nodes of a multi-use cluster of commodity PCs have lots of local storage on theirhard disk drives. They use their storage space either locally as part of the comprehensivesystem installation, to duplicate non-critical data for local low-priority processing or tomake it available over the network to other nodes in the cluster. The data stored on theexcess storage space on the nodes is non-critical and should therefore be used for read-only processing like data analysis. As some nodes might have small customisations intheir system configuration and to have older installations available for possible later re-installation, all installations and versions should be backed up somehow.
2.5 Problems
In the environment described above, there are a few problems that arise, as well as someinteresting tradeoffs that are worth further investigation:
Data-stream modelling How do we know in advance what (future) system offers betterperformance? When designing or comparing systems as described above, it is im-portant to have accurate performance predictions for different options and tradeoffs.With accurate performance predictions it is possible to find performance-relevantdesign flaws earlier in the design or to find the better system for a given situationwithout installing and testing many systems. We therefore need a model to predictthe performance of data-streaming systems.

2.5. PROBLEMS 27
Data replication How should data be distributed efficiently to the nodes of a cluster?When installing a cluster or upgrading an installation, all (or some of) the nodesneed to receive and store the same, large amount of data. A similar scenario is whena small database should be copied for later local analysis to the nodes. There areseveral ways to distribute the data to the nodes, like copying the files from a networkfile system (which is quite easy to do), broadcasting it with IP multicast (which istheoretically the best use of the network) or so called multi-drop chains (which arestable and easy to implement). Further, it is not obvious whether compressing thedata would actually speed up the transmission, since compression would reduce theamount of data to transport over the network, but would increase the load on theCPU of the nodes. There is no easy answer to the question of how to distribute thedata most efficiently.
Data archival How to store many different installations efficiently? Backing up all ma-chines and all versions of the systems that were installed over time potentially re-quires a lot of storage space. Since there are many different operating systems ina multi-use cluster it would be very hard to do file-based backups, as the backupsystem would have to support all file systems used. We therefore need an operatingand file system independent way to store large amounts of partially similar data.Would it be helpful to simply compress blocks of data to reduce the storage needsor does the segmentation of data hinder compression (which is basically the searchfor similar patterns in the data) and should the stored data thus be compressed as awhole? Are there other viable techniques to manage this vast amount of operatingsystem installations?
Data gathering How can nodes access the excess remote storage of other nodes effi-ciently? When a node wants to read large amounts of data stored on other nodes (ase.g. in data warehousing or data analysis), what is the best way to do so? Should afull featured and readily-available distributed file system be used, that offers muchmore functionality than what the nodes require for this one-directional data trans-fer? Or would it be sufficient to simply import the remote devices over the networkand access them on the reading node as if they were local? A distributed file sys-tem is typically designed to scale to a larger number of nodes with different accesspatterns, but might have a bad throughput for a smaller number of mostly readingnodes. Throughput-optimised distributed devices on the other hand might not scaleto many nodes, but offer higher read performance for less nodes.
There are of course many more problems than can be addressed in this thesis. A fewof the remaining problems that I will not discuss in this thesis are the following.
How should we store a large distributed data set to many different nodes? For a hugedata set we need the excess storage space of many nodes. Storing the data set on the

28 Chapter 2: Background
nodes means that a unique piece of the database has to be send to every participatingnode’s hard-disk drive. There are less interesting tradeoffs in this scenario, since theserver storing the original database simply has to send a part of the database to everynode. More importantly, storing the data is not done very often, since we are mostlyinterested in the more resource intensive analysis of the data. Optimizing the read phaseis therefore more important than the write phase, thus I will focus on the reading of thedata in this thesis.
In other more traditional clusters a typical application is parallel computation. Someparallel computational jobs have the requirement for large IO, but in such a system theprimary interest from a performance point of view is the aggregate IO performance, com-pared to the individual IO performance of a single node. These computational clusterstherefore use a parallel file system designed to scale to many nodes and many parallelIO operations. As described above, we have different application scenarios in mind fora multi-use cluster. Further, the field of high-performance parallel IO has been widelycovered in research. Thus, I will not discuss these issues any further in this thesis.
2.6 Border to Other Areas
The research area of my thesis is a fairly broad field of systems research and thereforeit touches on many other areas of research and technology. In this section I will brieflymention other related areas and distinguish between them and the topics covered in mythesis. The different areas are shown in Figure2.8, with the specific contributions of thisthesis in the middle: A modelling framework for data streams in clusters is the topic ofChapter5, data casting for data replication is covered in Chapter6, efficient data storagefor partially similar data is discussed in Chapter7 and finally I will compare distributedfile systems with distributed devices in Chapter8.
An important related area are storage area networks (SANs). SANs are mostly fibrechannel interconnects that are used to connect servers and disks. They provide most flex-ibility to storage managers and make faster access to storage than through a file server.Furthermore they allow for easy backups [Pre02]. SANs provide access to many addi-tional disks over a dedicated additional network for one or more CPUs. In contrast, ourenvironment for multi-use clusters of commodity PCs uses the excess storage capacityof existing disks as well as the already installed commodity high-speed data network ofclusters of commodity PCs.
Also import are the related areas of network-attached (secure) disks (NA(S)D) andnetwork attached storage (NAS). NASDs, described in more detail in [GNA+96], aredrives that support independent client access to drive-provided object services. They con-tain a CPU and small OS to provide client authentication, access-control enforcement,data privacy and data integrity. NAS [Pre02] is a device dedicated to sharing files viacommon network-file–system protocols like NFS or SMB. These systems contain a min-

2.6. BORDER TO OTHER AREAS 29
Data replication
Multi-use clusterstorage
Modelling framework
devicessystems vs. distributed
Distributed file
Efficient storage
SANsolutions
Internet / gridstorage
OLAP
High-performance
I/O
Killerworkstations
RAID
NA(S)D
Grid / VMcomputing
Figure 2.8: Related areas of research.
imal CPU to reduce costs, while the nodes of a multi-use cluster are powerful enoughto provide the functions offered by NA(S)D and NAS. The multi-use cluster nodes evenhave enough spare resources for shared use with other applications. Both NA(S)D andNAS require the installation of additional hardware in the network. Our own architectureprovides similar services, but uses the economically interesting excess storage of the disksattached to the nodes in the cluster.
Another related area are redundant arrays of inexpensive disks (RAIDs) [PGK88,PCGK89]. Conventional RAIDs are constructed by attaching many similar disks to aserver and storing the data striped over the disks including some redundant information(except for RAID level 0 where data is striped without redundant information simply toget highest throughput). The data redundancy allows to reconstruct the data in case a diskfails. In my thesis I will not use multiple disks inside a node, but connect the disks of somenodes together in a “network RAID”. Since my focus is on performance and the under-standing thereof, I will only use RAID level 0 which allows to combine the throughputsof multiple (remote) disks at the expense of redundancy—thus the distributed file systemsand distributed-device systems discussed in this thesis are technically no RAIDs.
In the area of high-performance computing and parallel I/O the most interesting as-pect of a (parallel) system is the aggregate performance of all nodes running a parallelapplication together. The exact access pattern depends on the parallel application and canbe fine grained or coarse grained and predictable or random. Scientific-computing ap-plications often access data in well defined phases and compute between the I/O phases.You can find more details about this topic in [May01]. According to May, distributedfile systems manage accesses to files from multiple processes, but concurrent accesses are
30 Chapter 2: Background
treated as unusual events. On the other hand, parallel file systems used in parallel I/O forhigh-performance computing are superior and much more scalable. They address severalproblems far beyond the capabilities of general distributed file systems. In my thesis Iwill not elaborate on this kind of parallel I/O for high-performance computing .
A related type of system are the so called “killer workstations” that are equipped withmultiple CPUs and many disks. Unlike high-end PCs that allow for two CPUs, the “killerworkstations” usually contain more CPUs (but not as much as parallel supercomputers)that all access the same shared memory. The many disks make the machines ideallysuited for database applications like online analytical processing (OLAP). These kinds ofmachines are quite expensive and at the border of commodity. A typical representative ofthese machines would be the DEC 8400.
There are few different approaches to large-scale OLAP applications. One approachare the aforementioned expensive killer workstations with large RAID arrays attached, butit requires money for the additional server and disks. Another approach is to parallelisethe queries to access different database servers over the network, which needs middlewarewith powerful parallelisation techniques to distribute the queries in an efficient way. Myapproach is a different one: I parallelise data accesses transparently in the file system orthe device-driver layer to get high-throughput data transfers without additional hardwareor software.
An emerging technique to store huge amounts of data are internet storage and gridstorage solutions. In these systems data is stored on servers that are widely distributedover different administrative domains on the internet. Research in this area encountersother problems such as latency tolerance, ensuring the reliability of data or multi-path dataaccess. An example for a project in this research domain is “Ocean Store” [REG+03].
Finally, grid computing is gaining widespread popularity among scientists harness-ing the power of clusters and individual users’ PCs as well as among users competingfor higher ranks on the projects’ statistics. Because of the slow dialup connections ofmany users and the large distances between the servers and clients, applications suitablefor grid computing must not have high demands on communication—neither latency northroughput. Furthermore, since processes of a grid computing application likely requirea different environment than what the grid client machines offer—in terms of operatingsystem, hardware, installed middleware or security features—the client process is oftenrun inside a sandbox or virtual machine on the clients PC, which makes it more diffi-cult to predict, achieve and understand performance levels. On the other hand, multi-useclusters allow for quick reinstallations of complete systems over high-speed networks andrebooting into the desired environment. Representatives of grid computing projects arefor example distributed.net [Dis97] or SETI@home [ACK+02] and more informationsabout grids can be found in [FK99]. The integration of the desktop machines within adepartment into a computational grid is referred to as “Desktop Grid”. Commercial com-panies involved in grid computing include United Devices Inc. and Entropia Inc.

2.7. SUMMARY 31
2.7 Summary
I started this chapter by listing the trends that led to commodity computing: First therewere only the expensive supercomputers, but the emerging workstations and later PCswere cheaper and satisfied the smaller computing demands. The availability of low-costcomputing power created a demand for more resources and the large volumes of PCs al-lowed manufacturers to invest in research and development and thus to push technologyfurther. The limit of technology is given by Moore’s law which states (simplified) thatcomputational power and memory size double about every 18 months. Pushing technol-ogy along the limit of Moore’s law increased the processing capabilities in a spiral thatresulted in an even higher demand. The high volume led to a “commoditisation” of PCparts and today most computers use the same commodity technology for CPU, RAM,storage and network interconnect.
The high-volume market maintains a few beneficial trends that hold for now and themedium-term future: First, commodity PCs will have strong computational capabilitiesthanks to the fast development of CPUs. A second benefit for commodity PCs is theirsufficient equipment with RAM for more complex tasks than typical office applications.Further, they include large hard-disk drives and a high-speed general-purpose NIC built-in. As the network’s throughput will be faster than the disk’s, there is excess bandwidthavailable to allow the nodes the export parts of their disk capacity to other nodes and stillhave bandwidth left for their main applications.
After defining some notions used in this chapter I explained the remaining differencesbetween clusters and desktop PCs. These are their different usage and operating modesthat are distinguished by their different installations, environmental conditions, operationtimes and the primary user interactions.
Other research areas that are close to the subject of my thesis are then briefly men-tioned: SAN solutions with their dedicated network to access storage systems, NA(S)Dand NAS which also increase storage capacities in a network but require additional hard-ware, RAID arrays to enlarge storage capacities by adding additional disks and parity in-formation, high-performance I/O systems which focus mostly on aggregate performanceand matching access patterns of applications to the underlying storage architecture, “killerworkstations” with more CPUs than high-end PCs and a RAID array to attack problemswith high I/O requirements suitable for shared-memory architectures, OLAP which runseither on “killer workstations” or requires intelligent query parallelisation, the areas ofinternet and grid storage that fight the high latencies, reduced throughputs and low relia-bility of a WAN and finally grid and desktop grid computing that requires sandboxes orvirtual machines to enclose its processes inside the guest machines OS.

3Definitions and Concepts
question = to ? be : !be;
William Shakespeare (adapted)
A primary goal of the thesis is a more systematic and scientific approach to the archi-tectural problems of multi-use clusters of commodity PCs. Therefore I will try to establisha theoretical foundation to designing such systems in this chapter. Furthermore, I intro-duce some concepts and definitions as a basis for the discussion in the following chapters.The definitions cover different networking topologies used in data communication, thegranularity of data to be communicated or stored incrementally, the frequency at whichdata can be updated in multi-use clusters and finally the different system layers at whichdata distribution, storage, and gathering can be implemented.
3.1 Problem Definitions
In this section, I describe the problems to be addressed in more detail and with a theoret-ical view. Besides the basic problem descriptions, I also briefly discuss some alternativesthat should be studied, as well as possible tradeoffs during the design and implementationof a system.
3.1.1 Data Stream Modeling
For the simple replication of data (e.g. when installing OS images or copying large inputfiles to many nodes of a cluster) and for gathering distributed data from many nodes ofthe cluster, data is transported through the cluster’s network and nodes. The network’slinks are the edges of an undirected graph that interconnects the nodes according to theinstalled interconnect technology. The nodes of the cluster are the nodes of the graph.Since I want to move large amounts of data, I am not interested in the constant setupcosts of starting the stream or the costs for the transmission to reach a steady state (which
33

34 Chapter 3: Definitions and Concepts
are rather low anyway for a high-speed TCP transmission within a cluster network). Themodel shall therefore focus on the steady stream bandwidth and ignore latency.
In practice, only the time to transport a data setD is of interest. The time to transport aset of data is designated asts. The time of the operation depends on the throughput of thetransport streambs and the amount of data to transport|D|. Since it is difficult to comparethe execution times of different operations that vary in the amount of data they transport,I will use the steady stream throughputbs from now on. The steady stream throughput isa function of several parameters as described in this formula:
bs = f (E,N,T,m)
The steady stream bandwidth depends on the data communication capacityE of the edgesthat the data has to cross and on the capacityN of the nodes through which the data hasto be transported. Another important factor is the topologyT of the network which mightreduce the throughput of certain edges of the graph because of multiple data passes. Forsome data distributions—depending on the used topology—the number of nodes alsoinfluences the resulting throughput.
The model that I will present in Chapter5 should allow to predict the steady streamthroughputbs depending on the above parameters.
3.1.2 Data Replication
The termdata replicationin this thesis describes the action of duplicating a certain largeamount of data to many nodes in a multi-use cluster. In this context, small data setsor different data sets for all the receiving nodes are not of interest. Small data sets areharder to optimise in a commodity network, since the network’s latency is mostly givenby interconnect technology and the internal bus technology in modern PCs.
All the nodes that need to receive the data setD are elements of the replication setS.The data must be transported by a streams from noden1 to the nodes in the replicationsetS such that after the data transport all nodes of the replication set have a copy of thedata:
di ⊃ D ∀i | ni ∈ SAll nodes that are serviced by the data transport of a certain stream following topologyTare elements of the topology setT:
T= {ni | ni is part of topologyT}
The streams must service all nodesni ∈ S. To do so it can choose an arbitrary topology,even one that crosses edges (or passes nodes) multiple times, as long asT= S.
The nodes may compress data, hereby reducing the amount of data to transport andvirtually increasing the edge capacityE of the network. The tradeoff for this optimisationis that the nodes’ capacityN is burdened with handling the compression of data, which islikely to result in reduced stream bandwidthbs.

3.1. PROBLEM DEFINITIONS 35
3.1.3 Data Archival
Every node in a multi-use cluster of commodity PCs has different OS installations on itslocal disk. These installations evolve over time, e.g. because of updates, patches to thesystem or installation of new software. All these installations should be archived, so thatthey are still available in case some part of a newer installation breaks and the systemadministrator needs to find the last version of the installation that still worked correctly.
There arem nodesni (1≤ i ≤m) with different OS installations. The number of OSinstallations on nodeni is oi , which is not necessarily identical for all nodes, since notall nodes need to have the same number of OS installations. As these installations evolveover time, there are multiple versions of every OS installation per node. The number ofversions of an OS installationj on nodei is ti, j . The data setd of a specific installationon nodei for OS installationj in versionk is thus
di, j,k where 1< i ≤m1< j ≤ oi
1< k≤ ti, j
Since we have to store all the data setsdi, j,k of all installations and all versions thereof,the complete set of dataD is
D=⋃
di, j,k
This set of data is of course huge, but it contains a lot of redundant data: The installationsof the same OS on the different nodes are mostly identical, besides some customisationsand temporary data. The evolutionary versions of an OS installation are also likely tocontain only small changes compared to the whole installation. Thus, the manydi,x,k fora certain OS installationx contain a lot of identical and thus redundant data. To storethe data setD of all installations more efficiently, we want to find all the redundant (andthus plurally stored) data and store it only once. The setDr ⊂D of redundant data can bedescribed as
Dr =⋃
di1, j1,k1∩di2, j2,k2 where 1< i1, i2≤m1< j1≤ oi1 1< j2≤ oi2
1< k1≤ ti1, j1 1< k2≤ ti2, j2
In practice, data needs to be split in blocks for storage such that these blocks can bemanaged. The block size is a tradeoff that influences the efficiency of the storage. Forlarger blocks, the management overhead becomes smaller, because there are less blocksto manage and data structures can be kept smaller. But on the other hand, the amount ofredundant data also becomes smaller and more apparently unique data has to be stored.When using compression, the use of larger block size might increase the efficiency ofblock compress algorithms, which makes the selection of an ideal block size for efficientand manageable compression ofD even more difficult.

36 Chapter 3: Definitions and Concepts
Another problem is that storing only unique data and thereby eliminating redundantdata in the archive means that the data has to be analysed and the blocks need to becompared. A simple algorithm would just linearly compare all the blocks that are at thesome positions within the OS installations. The algorithm might likely miss some of theredundant data but completes withinO(|D|). A better algorithm that actually comparesall blocks with each other would be more complex and a trivial implementation has acomplexity ofO(|D|2), but in Subsection7.3.3, I will use an algorithm that has a reducedaverage complexity ofO(|D| · log|D|) in practice.
3.1.4 Data Gathering
Data gathering in this thesis means that a client noden1 remotely reads data from thedisks ofm server nodesni (1< i ≤m+ 1). The set of server nodesS1 contains all servernodes for the client noden1:
S1 = { ni | ni is server forn1}
During a data read,n1 needs to read the data setD1 from the nodesni ∈ S1). To aggregatethe performance of all servers, the data is striped into smaller partsdi across the servernodes:
D=⋃
∀i | ni∈S1
di
Since the data can be stored without redundancy (see Section2.3.3 for an explanationwhy mission critical data is still stored on central storage servers),⋂
∀i | ni∈S1
di = /0
For the problem of data gathering, we are interested in the throughputb1 of the datastreams1 that is flowing into client noden1. The data stream is composed of the individualstreamssi (1< i ≤m+1) flowing from the server nodes and thus the resulting throughputb1 is the sum of the servers’ throughputsbi
b1 = ∑1<i≤m+1
bi
The questions that are open and that I will try to answer in this thesis are the maximumthroughput that can be achieved in such a scenario, the exact bottleneck of that throughputand the best layer in the system to implement such a system.
3.2 Network Topologies for Data Communication
In this section, I discuss topologies of data interconnect networks that are used for datacommunication in multi-use clusters of commodity PCs. The topologies can be applied
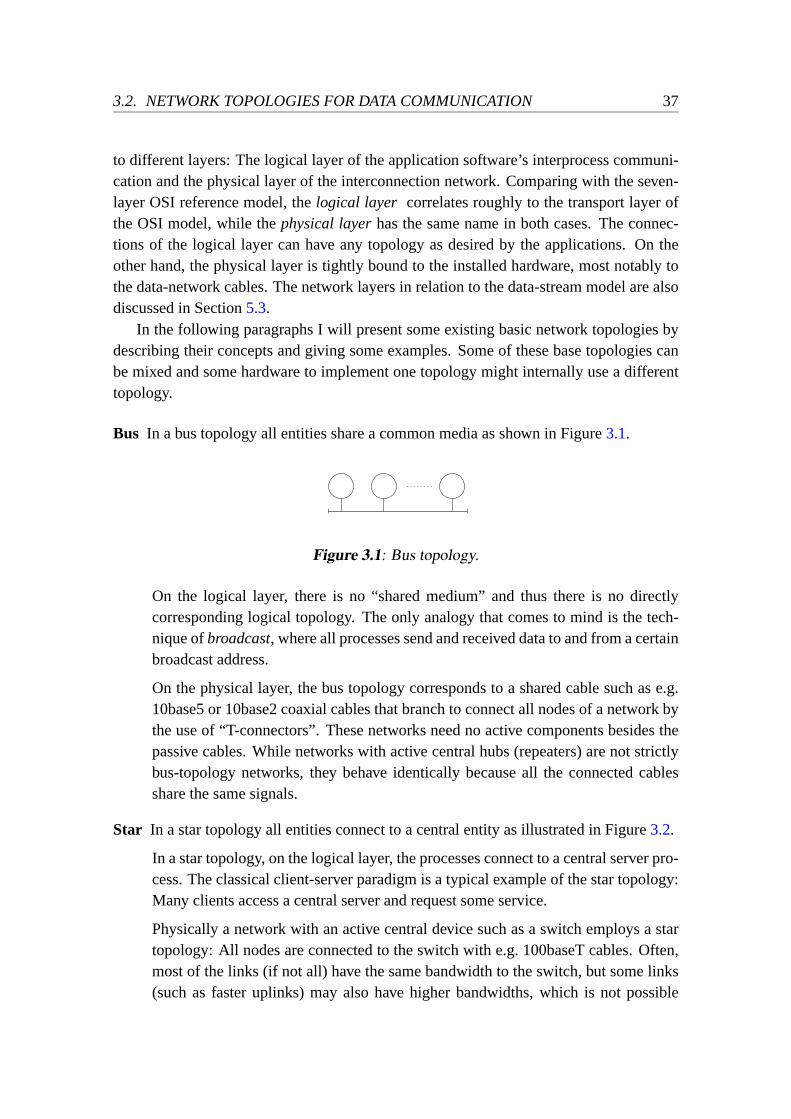
3.2. NETWORK TOPOLOGIES FOR DATA COMMUNICATION 37
to different layers: The logical layer of the application software’s interprocess communi-cation and the physical layer of the interconnection network. Comparing with the seven-layer OSI reference model, thelogical layer correlates roughly to the transport layer ofthe OSI model, while thephysical layerhas the same name in both cases. The connec-tions of the logical layer can have any topology as desired by the applications. On theother hand, the physical layer is tightly bound to the installed hardware, most notably tothe data-network cables. The network layers in relation to the data-stream model are alsodiscussed in Section5.3.
In the following paragraphs I will present some existing basic network topologies bydescribing their concepts and giving some examples. Some of these base topologies canbe mixed and some hardware to implement one topology might internally use a differenttopology.
Bus In a bus topology all entities share a common media as shown in Figure3.1.
Figure 3.1: Bus topology.
On the logical layer, there is no “shared medium” and thus there is no directlycorresponding logical topology. The only analogy that comes to mind is the tech-nique ofbroadcast, where all processes send and received data to and from a certainbroadcast address.
On the physical layer, the bus topology corresponds to a shared cable such as e.g.10base5 or 10base2 coaxial cables that branch to connect all nodes of a network bythe use of “T-connectors”. These networks need no active components besides thepassive cables. While networks with active central hubs (repeaters) are not strictlybus-topology networks, they behave identically because all the connected cablesshare the same signals.
Star In a star topology all entities connect to a central entity as illustrated in Figure3.2.
In a star topology, on the logical layer, the processes connect to a central server pro-cess. The classical client-server paradigm is a typical example of the star topology:Many clients access a central server and request some service.
Physically a network with an active central device such as a switch employs a startopology: All nodes are connected to the switch with e.g. 100baseT cables. Often,most of the links (if not all) have the same bandwidth to the switch, but some links(such as faster uplinks) may also have higher bandwidths, which is not possible
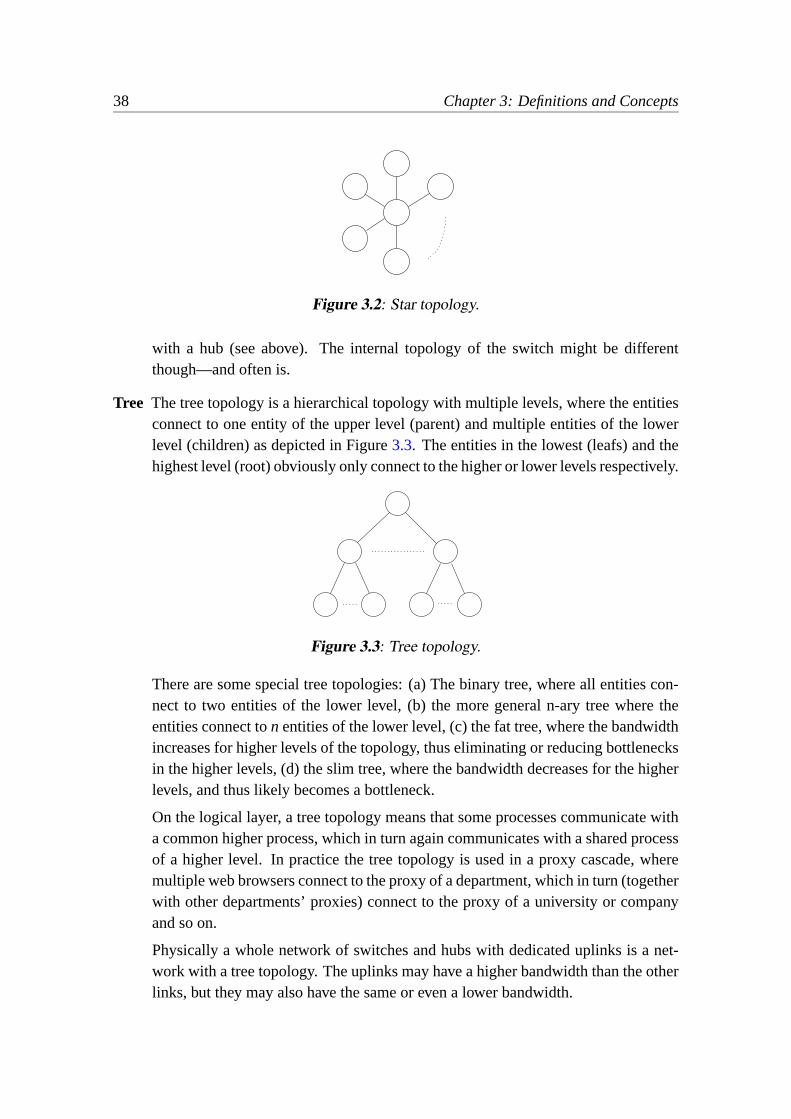
38 Chapter 3: Definitions and Concepts
Figure 3.2: Star topology.
with a hub (see above). The internal topology of the switch might be differentthough—and often is.
Tree The tree topology is a hierarchical topology with multiple levels, where the entitiesconnect to one entity of the upper level (parent) and multiple entities of the lowerlevel (children) as depicted in Figure3.3. The entities in the lowest (leafs) and thehighest level (root) obviously only connect to the higher or lower levels respectively.
Figure 3.3: Tree topology.
There are some special tree topologies: (a) The binary tree, where all entities con-nect to two entities of the lower level, (b) the more general n-ary tree where theentities connect ton entities of the lower level, (c) the fat tree, where the bandwidthincreases for higher levels of the topology, thus eliminating or reducing bottlenecksin the higher levels, (d) the slim tree, where the bandwidth decreases for the higherlevels, and thus likely becomes a bottleneck.
On the logical layer, a tree topology means that some processes communicate witha common higher process, which in turn again communicates with a shared processof a higher level. In practice the tree topology is used in a proxy cascade, wheremultiple web browsers connect to the proxy of a department, which in turn (togetherwith other departments’ proxies) connect to the proxy of a university or companyand so on.
Physically a whole network of switches and hubs with dedicated uplinks is a net-work with a tree topology. The uplinks may have a higher bandwidth than the otherlinks, but they may also have the same or even a lower bandwidth.

3.2. NETWORK TOPOLOGIES FOR DATA COMMUNICATION 39
Chain In a chain topology, as shown in Figure3.4, all entities are connected to a leftand a right neighbour (except the leftmost and rightmost entities obviously). Thechain topology thus lines up all entities on a single chain and might be viewed as adegenerated tree, a “unary tree”. There are no branches along a data path in a chaintopology and no entity has more than two partners.
Figure 3.4: Chain topology.
On the logical layer a chain topology translates into a long string of processes com-municating along the line of the string. It is rather uncommon in practice, exceptfor the Dolly tool that will be introduced in Section6.2.
The chain topology on the physical layer implies that there is no central networkdevice. A technology based on a chain topology is token ring, where data is trans-mitted together with a token along a circular chain through the nodes’ networkinterfaces until the target of the data transmission is reached.
Crossbar A (full) crossbar topology interconnects every entity directly with every otherentity as in Figure3.5.
Figure 3.5: Crossbar topology.
On the logical layer the crossbar topology means that every process has a connec-tion to every other process of a certain application. This would be a typical setupin a parallel application running on a cluster, where the processes have to exchangedata between computation steps. Typically the communication would be handledby some kind of middleware like e.g. an MPI library.
A crossbar topology is seldom used as cluster interconnect topology in practice,since it would require that every node has a direct connection to every other node.This means that forn nodes, every node requiresn− 1 interconnections and the

40 Chapter 3: Definitions and Concepts
cluster hadn(n− 1)/2 cables. It has been done in the past for early cluster pro-totypes of up to about five nodes. However, the internal topology of full bisectionswitches are often crossbars, or multi-stage crossbars as e.g. in a multi-stage closnetwork.
Mesh In a mesh topology, the entities of the network are spread within a few dimensionsand interconnected parallel to the axes of the dimensions, as shown in Figure3.6.Popular meshes are spread in two or three dimensions, while a one-dimensionalmesh is the same as a chain.
Figure 3.6: Two dimensional mesh topology (dashed lines indicate torus).
Related to mesh topologies are the torus topologies. The difference is that in torustopologies the connections along the axes are closed, as indicated by the dashedlines in Figure3.6.
On the logical layer, the mesh topology implies that all processes of an applicationcommunicate with their direct neighbors in all dimensions. This topology is notwidely used in practical applications.
As topology for the physical layer, meshes were used in supercomputers like theIntel Paragon that employed a two-dimensional mesh. Cray T3D and T3E used athree-dimensional torus topology for its data interconnect.
Hypercube In a hypercube topology, the entities are placed in several dimensions, butalong every dimension there are at most two entities. In an n-dimensional hyper-cube, every entity has n direct neighbors. The direct neighbors are the nodes thatdiffer in only one coordinate. A three-dimensional hypercube is shown in Fig-ure3.7.
A fundamental attribute ofn-dimensional hypercubes is that a connection betweenany two entities never has more thann hops.
On the logical layer, a hypercube topology is constructed by processes that connectjust to their neighbors along every virtual dimension.
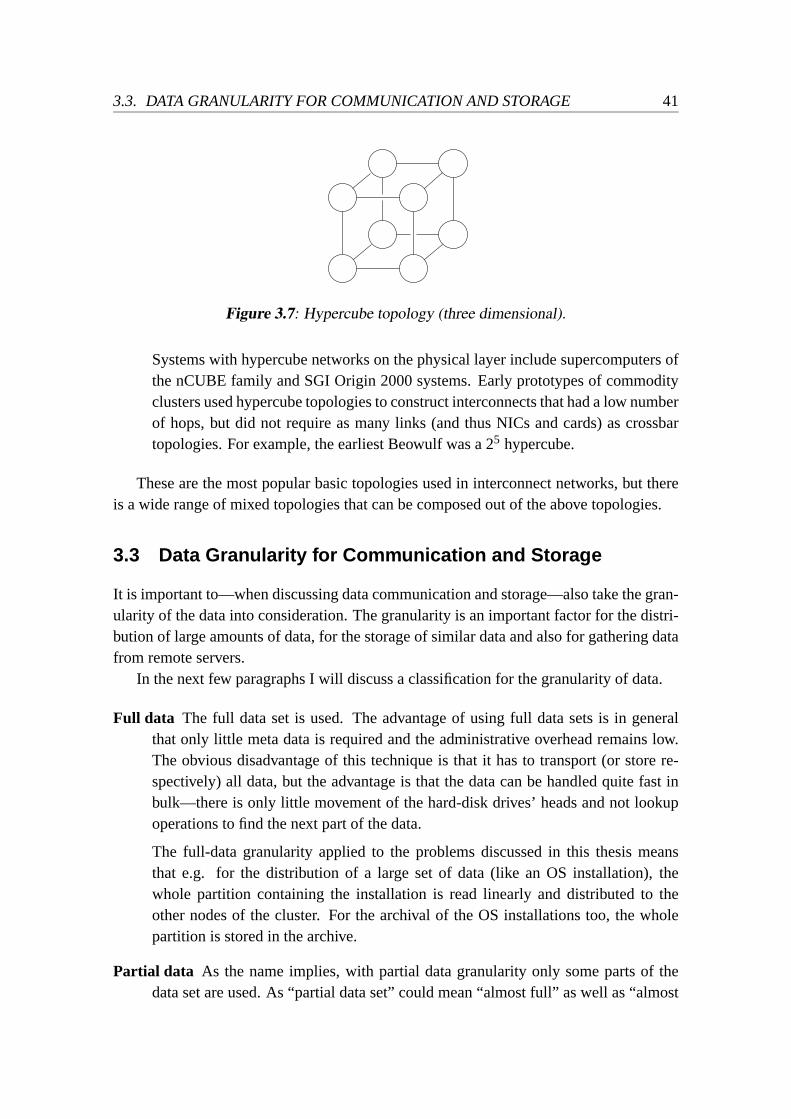
3.3. DATA GRANULARITY FOR COMMUNICATION AND STORAGE 41
Figure 3.7: Hypercube topology (three dimensional).
Systems with hypercube networks on the physical layer include supercomputers ofthe nCUBE family and SGI Origin 2000 systems. Early prototypes of commodityclusters used hypercube topologies to construct interconnects that had a low numberof hops, but did not require as many links (and thus NICs and cards) as crossbartopologies. For example, the earliest Beowulf was a 25 hypercube.
These are the most popular basic topologies used in interconnect networks, but thereis a wide range of mixed topologies that can be composed out of the above topologies.
3.3 Data Granularity for Communication and Storage
It is important to—when discussing data communication and storage—also take the gran-ularity of the data into consideration. The granularity is an important factor for the distri-bution of large amounts of data, for the storage of similar data and also for gathering datafrom remote servers.
In the next few paragraphs I will discuss a classification for the granularity of data.
Full data The full data set is used. The advantage of using full data sets is in generalthat only little meta data is required and the administrative overhead remains low.The obvious disadvantage of this technique is that it has to transport (or store re-spectively) all data, but the advantage is that the data can be handled quite fast inbulk—there is only little movement of the hard-disk drives’ heads and not lookupoperations to find the next part of the data.
The full-data granularity applied to the problems discussed in this thesis meansthat e.g. for the distribution of a large set of data (like an OS installation), thewhole partition containing the installation is read linearly and distributed to theother nodes of the cluster. For the archival of the OS installations too, the wholepartition is stored in the archive.
Partial data As the name implies, with partial data granularity only some parts of thedata set are used. As “partial data set” could mean “almost full” as well as “almost

42 Chapter 3: Definitions and Concepts
empty” data set, it is relevant to distinguish at least two levels of data granularityhere:
Coarse grain The parts of the data are selected to contain mostly1 the requireddata. The process of selecting these parts is done in a convenient and naturalway that follows the available administrative or meta data. The advantage ofthis method is that the amount of data can be reduced with little overhead. Thedisadvantage on the other hand is that meta data needs to be available.
In real systems, coarse-grain partial-data granularity often applies to systemsthat handle files, since files are convenient administrative units for which cor-responding meta data (like the date of the last change) is easily provided. Anexample is the remote file synchronisation toolrsync that synchronises fileson different machines and can thus be used to remotely update machines.When distributing e.g. databases to other machines, this approach could re-quire big files to be copied, which might result in little gain over the full-datagranularity. Besides, some databases store their data in unknown proprietarydata formats directly in the hard-disks’ partitions, and for some OSs the file-system structure is not published, rendering the coarse-grain partial-data ap-proach unusable.
Fine grain When using fine-grain partial-data granularity,only the required partsof the data set are selected, with reasonably realistic assumptions2. The ad-vantage is that the amount of data to be transported or stored can be reducedto just the essential parts, with the drawback that finding these parts can bequite expensive.
The selection of the required parts follows the smallest available administra-tive unit of the system (software or hardware), possibly with the exception ofbytes. Realistically, these are the blocks of the file system or the hard-diskdrive, which usually have a size of about 512 or 1024 bytes. Dealing directlywith disk blocks reveals another advantage of the fine-grain partial-data granu-larity: No knowledge of a file’s or a file system’s internal structure is required.A tool that compares text files at this level of granularity is e.g.diff , that out-puts only the lines that differ between to given files. Applying this approachto a database means that only the essential entries in a database are handled,which requires a running database system.
The above definitions are deliberately not precise definitions, but rather helpful guide-lines, since formal definitions would not be of much help in practice. The distinction
1“Mostly” in this context meansall required data plus possibly some more.2“Reasonably realistic” here means that not just the importantbits or bytesare selected, since the over-
head would be far too large.

3.4. FREQUENCY OF UPDATES 43
between the different levels of data granularity should help to understand some of theissues and tradeoffs that I will discuss in some of the later chapters of this thesis.
3.4 Frequency of Updates
When discussing the distribution of data in clusters, like for updating or replacing OSinstallations, it is important to also take the frequency of the distribution operations intoaccount. The frequency dictates how up to date the data is, as well as the required over-head for the update operations.
Again, the following definitions are deliberately not very precise. In the theory ofdistributed systems there are certainly many more levels of consistency, but in this thesisI will only distinguish immediate and delayed updates as described below.
Immediate updates To immediately (or constantly) update the data guarantees that thedata is always consistent and up to date. This kind of updates needs much admin-istrative overhead, since every change to the data must be detected, communicatedand the participating systems have to act accordingly.
In practice immediate updates are used in distributed file systems, where all theusers that access the files within the file system want a consistent and up to dateview of the data. The levels of consistency in distributed file systems are different.Often the systems loosen the consistency rules for practical reasons.
Delayed updatesAs the name suggests, delayed updates are only performed when theydo not disturb other services or probably periodically. Overhead is low, since thechecks to find the data that needs to be updated can be done a quiet times. Thedrawback is that not all the data is up to date.
Real systems use delayed updates e.g. for system upgrades, backups or the distri-bution of large input files. System upgrades are only done when they are requiredfor some reason (e.g. security or critical bug fix) and when the node to upgrade isunused. Data is often backed up daily during the night, and thus most data of back-ups are inconsistent during the day. The inconsistency of backups is not a problem,because backups try to minimise damage in case of a data loss. Distributing largeinput files to the nodes of a cluster happens when an application needs to work onfresh data. Thus, redistribution is done on demand, which can be every few hours,days or weeks.
For the rest of this thesis I will focus on delayed updates. Delayed updates are requiredwhen the cluster nodes are used in a multi-use usage mode as described in Chapter2.Immediate updates on the other hand are important for research in distributed systems ordevelopment of distributed file systems with concurrent users and are not the topic of thisthesis.

44 Chapter 3: Definitions and Concepts
3.5 System Layers
There are different layers in a system where data handling can be implemented. In thefollowing paragraphs I will describe and discuss the possible layers with special regard tosystems that distribute or gather data in a cluster. For better readability I will use the termdata handlingfor data distribution as well as data gathering. I will list the layers from thebottom up and also give some examples.
Hardware On the hardware layer, the data handling is fully done by the hardware itselfand no software intervention is necessary.
Examples include multicast implementations in network switches, adapted firm-ware of NICs, or NAS RAID controllers. Multicast-capable switches receive multi-cast packets and autonomously forward the packets to all the ports that subscribed tothe destination multicast group. Certain network adapters (like e.g. Myrinet NICswith their LANai interface controllers) allow developers to adapt the firmware tosuit the needs of special data handling applications and implement some parts ofthe required functionality directly “in the hardware”. A NAS RAID controller com-municates with machines that access its storage, automatically handles the RAIDfunctionality and distributes the data accordingly between its attached disks.
The advantage of the hardware layer is that hardware is usually built to do certainthings quite efficiently, with the drawback that changes are often difficult (if notimpossible) to implement.
Device driver The device-driver layer is the lowest software layer in an OS and is usuallyonly responsible for handling and controlling a certain piece of hardware. However,to make the data handling easier and more transparent to the upper layers in a system(like file systems, network stacks or other subsystems of an OS), a device drivercould be enhanced by data-handling functionality.
Examples of systems with distributed device drivers (“distributed devices”) will bepresented in Chapter8. In short, a virtual device driver offers access to other remotedevices. Several of these drivers can be combined into an array of remote devicesthat can be accessed like local ones, e.g. by a local RAID setup. The device driverdoes not have to coordinate all the remote devices since it is only a device with nodistributed functionality.
Advantages of the device-driver layer are that the upper layers as well as the the OSitself need not be changed, and the behavior of a piece of hardware can be adaptedby implementing the changes in the driver. The disadvantage is highly system spe-cific implementations—specific to the hardware as well as to the operating system.
File system When handling data at the file-system layer, the file system must take careof all aspects of the file system as well as the distributed data. All regular accesses

3.5. SYSTEM LAYERS 45
to the file system are transparently distributed according to the design and setup ofthe distributed file system.
The file-system layer is a popular layer for data handling and quite a few distributedfile systems exist. Some distributed file systems have only one server with manyclients accessing it (like e.g. the popular NFS), while other file systems have manyparallel servers and clients with some nodes even using the file system as clientsas well as providing services as servers. Lustre is an example of a distributed filesystem with multiple servers and many clients, while PVFS is an example where thenodes can be clients and servers at the same time. Both systems will be presentedin more detail in Section8.3.
Data handling implemented at the file-system layer does not need to interact di-rectly with hardware as it uses existing device drivers and system interfaces. De-vice drivers and applications need not be changed, but a distributed file system issignificantly more complex than a local one, since (in addition to all the file systemspecific functionality) it has to handle all the distributed aspects like coordinationof the involved nodes. It is more complex than a system with distributed devices,but it also offers more functionality and constant updates of data.
File The file layer implies an intermediary layer since files can not handle data—they arejust containers for the data. By data handling in the file layer I mean that appli-cations running on the nodes simply access local files, which are then handled bysome other entity like a daemon that periodically updates the distributed files on thenodes’ hard-disk drives.
An example tool for such a system is thersync utility that synchronises files ondifferent machines. In some installations it is used to keep multiple OS installationson different nodes of a cluster in synchronisation.
An advantage of handling data in the file layer is that no part of the OS has totake care about the data updates or has to be changed. A simple tool or customapplication can do the job, which is certainly easier to develop and debug thankernel code. A disadvantage is that files are not consistent between updates and thatthere is no automatic conflict resolution. The system is thus best used for distributedor parallel applications that need to read large input files without changing themoften.
Middleware Applications can be programmed to use middleware, a software layer be-tween the OS and the applications. The middleware then takes care about the han-dling of the distributed data.
A typical example of such a middleware is MPI. Applications using MPI are writtenaccording to the API and can then be run with any MPI implementation. The MPI
46 Chapter 3: Definitions and Concepts
middleware takes care of exchanging the data between the nodes according to theapplications’ needs. Another example is a distributed database application, wherethe RDBMS takes care of parallelizing and distributing the queries.
Advantages of using middleware include that neither the OS nor the applicationneeds to be changed, the middleware can be implemented in user space and systemsare more portable. The disadvantage is the added software layer which potentiallyintroduces more overhead.
Application Applications can almost always be written to handle distributed data, as longas the OS supports data communication with other nodes.
Data handling is often implemented on the application layer when special hard-ware has to be controlled for which an adapted driver would not be of much use,or when an unusual environment has to be taken into consideration for which nogeneral middleware or OS support exists. One example of such an applicationis SETI@home, which was written for a widely distributed environment whenthere was no middleware for Grid computing available. Thus, all handling of dis-tributed data had to be implemented in the application itself. Another example isthe partition-cast tool Dolly that I will present in more detail in Section6.2. Dollyachieves high performance by only using the reliable transport service offered bythe OS’s TCP stack.
The advantage of implementing the data handling directly in the application layeris the flexibility of using all functionality that the OS offers. There is no need torestrict functionality to what is offered by some middleware. The ability to use onlythe services that are strictly required offers the potential for higher performance.The drawback of the application layer is of course that all the distributed logic hasto be programmed into the application.
Distributed data handling can also be implemented in multiple of the above layers.While one layer may be used for the coordination of the processes, another layer mightbe more suitable to handle the bulk data transfers.
3.6 Summary
At the beginning of this chapter I first give a somewhat theoretical definition of the prob-lems that I attack in this thesis. The model for data streams shall be able to predict thesteady stream bandwidth of a data stream depending on the following factors: Data han-dling capacity of the edges and the nodes in the cluster, the topology of the data networkand possibly the number of nodes involved. Data replication is the problem of distributinga set of data to a number of nodes in the cluster, such that all the nodes eventually receiveall the data. For efficient data archival of similar data, the problem is how to efficiently

3.6. SUMMARY 47
store a large amount of data without archiving redundant data multiple times. As a lastproblem, data gathering describes the problem of reading a set of distributed data in par-allel from multiple remote hosts by aggregating the bandwidth of all the involved nodes’networks connections.
In the second section I describe the network topologies that can be used in a clusterto transport data. With the bus topology all the nodes share a common media for datatransport, while the star topology has a central entity to which all other nodes connect.The tree topology has a hierarchical structure where a node has a parent and multiplechildren. A simple topology is the chain with all nodes connected in a one-dimensionalstring. In a (full) crossbar topology all nodes are directly connected with each other. Themesh topology interconnects all the nodes along with their direct neighbours along allthe dimensions, usually in two or three dimensions. If the outmost nodes in a mesh aredirectly connected, the topology becomes a torus. In a hypercube the nodes also connectto all their neighbours in all dimensions, but every dimension has only two levels.
In a next step I discuss the levels of data granularity for communication of data aswell as for storage. With full-data granularity, the whole data set is communicated orarchived, even if parts of the data are redundant. I subdivided the partial-data granularityinto coarse-grain and fine-grain. Coarse-grain partial-data granularity handles only therequired data, but uses conveniently available meta-data to find redundant data. The fine-grain partial-data granularity on the other hand makes more efforts to find strictly the datathat is actually required for transportation or archival.
I then discuss the difference between constant updates that keep all data consistentand up to date at all times, depending on the selected level of consistency. The less strictperiodic updates synchronise data only when required.
In the final section of the chapter I cover the different layers in a system where thedistributed handling of data can be implemented. On the lowest layer specialised hard-ware can take care of data handling. The next higher layer is the device driver, which isnormally responsible for handling a local device, but it can be adapted to enable accessto a remote device. A quite natural layer for handling distributed data is the file systemlayer. Several distributed file systems exist that transparently map file accesses to remoteservers. The file layer is less common and implies a special entity that takes care of copy-ing files to the local disks of the nodes whenever required. Middleware is a layer betweenthe OS and the application that is quite often used to handle distributed data and whichallows to easily port applications to other OSs or hardware. Finally, the highest layeris the application layer, which means that applications can be written in a way that theyhandle their data distribution themselves.


4Experimental Platforms
My law of computing hardware: Pay now, or pay later,but believe me, youwill pay.
Darcy Brockbank
Accurately describing all factors of an experiment is fundamental to a systematic andscientific approach to computer architecture as it allows for repeatability and thus verifi-cation of results. Unfortunately describing experimental computer systems in great detailremains difficult because there are so many variable factors in real systems. Real systemsare built from many different hardware and software parts that are often available onlyin different product release versions and are configurable for different environments orbehaviours. I will try to describe the systems that I used during the last few years in theexperimental work of this thesis as accurately as possible. The wide range of involvedhardware and software, as well as the evolution thereof, led to some interesting problemsin experimental computer science that I describe in the next sections.
4.1 Evolution of PC Clusters Used for Experiments
In this section I will describe the different cluster systems that I used during my studiesat the department of computer science at ETH Zurich. While I will try to cover the mostimportant factors for all the systems, it is nearly impossible to give a complete list of allfactors that could influence the software systems and experiments described later. Some ofthe information was even lost over the years, other information would be too voluminousto list here. Omitted information includes: Compiler version used to compile the kernel,drivers and user-level software, the version of linked libraries like e.g. the C-library andthe exact configurations of all the involved kernel versions. The kernels used were nostandard-distribution kernels, because the kernels’ configurations had to be changed towork on our cluster nodes.
49

50 Chapter 4: Experimental Platforms
4.1.1 Prototype Cluster of PCs: Old CoPs
A first prototype of a Cluster of PCs (CoPs1) was installed in 1997 by the parallel anddistributed systems research group at ETH Zurich. It was only a small cluster that wasmainly used to test and benchmark new interconnect networks and by students to im-plement their term and masters projects. Initially the old CoPs cluster consisted of fourmachines which were equipped as listed in Table4.1.
Part Description
CPU 1 Intel Pentium Pro, 200 MHz, 256 KByte L2 CacheRAM EDO DRAM, 64 MByteChipset Intel 440FX PCIsetHard disk Maxtor 83201A6, EIDE, 3 GByteGraphic card ATI Xpert 98Primary NIC 3Com 905B 10/100 EthernetSecondary NIC DEC DE500 Fast EthernetHigh-speed NIC M2F-PCI32C LAN, LANai4 interface processor, 640 Mbit/sOS SuSE Linux 5.0, 5.2Kernel Linux kernel 2.0.33
Table 4.1: Node configuration of old four-node CoPs cluster.
Later, the cluster was enlarged with four additional machines with the specificationlisted in Table4.2. The Myrinet NICs were all interconnected by a M2LM-SW16 16-portswitch and copper cables.
Part Description
CPU Intel Pentium II MMX, 350 MHz, 512 KByte L2 CacheRAM EDO DRAM, 64 MByteChipset Intel 440BX AGPsetHard disk Maxtor 90432D3, EIDE, 4 GByteGraphic card ATI Rage ProPrimary NIC 3Com 905B 10/100 EthernetSecondary NIC DEC DE500 Fast EthernetHigh-speed NIC M2M-PCI32B SAN, LANai4 interface processor, 1.2 Gbit/sOS SuSE Linux 5.0, 5.2Kernel Linux kernel 2.0.33
Table 4.2: Node configuration of additional four nodes for old CoPs cluster.
1The acronymCoPsis used as a name for the cluster itself as well as for the overall project [SKTR].

4.1. EVOLUTION OF PC CLUSTERS USED FOR EXPERIMENTS 51
4.1.2 First Multi-Use Cluster: Patagonia
In 1999 a new cluster was installed at the department of computer science at ETH Zurichthat was used as a true multi-use cluster of commodity PCs. It was named Patagoniacluster [RKMLS99]. The Patagonia cluster was installed in a classroom and used on onehand by students for their exercises, term and master projects and on the other hand by re-searchers for experiments and calculations during the night and over weekends. Table4.3lists the equipment of the cluster’s nodes. The table is incomplete as the Patagonia clusterhas been put out of service and the knowledge about the graphic cards of its nodes waslost. This loss is less important since no experiment in this thesis is related with graphics.
Part Description
CPU 1–2× Intel Pentium II, 400 MHz, 256 KByte L2 CacheRAM SDRAM, 128 MByte, 100 MHzChipset Intel 440BX AGPsetHard disk Seagate ST39102LW, 9 GByte, 10 krpmSCSI adapter Adaptec AIC 7890, Ultra2 LVD/SE Wide SCSI controllerGraphic card N/APrimary NIC 3Com 905 “cyclone” Fast EthernetSecondary NIC Packet Engines G-NIC II Gigabit EthernetHigh-speed NIC M2M-PCI32 SAN, LANai4 interface processor, 1.2 Gbit/sOS SuSE Linux 6.0, 6.2, Red Hat Linux 6.2Kernel Linux kernels 2.2.7, 2.3.99-pre-3
Table 4.3: Node configuration of 24-nodes Patagonia cluster.
Some of the nodes had Myrinet NICs and were again all interconnected by a M2LM-SW16 16-port switch and copper cables. To connect the Gigabit Ethernet NICs a Ca-bletron Smart Switch Router 86002 with fiber cables was used.
The OSs listed in Table4.3 are the ones used for the experiments described in thelater chapters of this thesis. Other OSs used for education are different versions of Win-dows NT and Oberon as previously mentioned in Subsection2.3.4.
4.1.3 Main Experimental Testbed: New CoPs
In the beginning of 2001 we installed a new cluster as main experimental testbed for ourresearch group, the new CoPs cluster. The installation followed an extensive performanceevaluation and led to the hardware listed in Table4.4. The nodes of the cluster were in-stalled in two racks in our lab’s own small server room. The cluster is still a multi-usecluster as the nodes were used by different users for different tasks: Some nodes were
2Now Enterasys X-Pedition 8600.

52 Chapter 4: Experimental Platforms
running a standard Linux installation and were used by research staff to develop and testsoftware for research projects, other nodes were used by students for their master projectsand running a customised Linux installation adjusted to their needs including full rootprivileges, some nodes were used in yet another Linux configuration for research in dis-tributed databases and inverted middleware3 and free nodes were used as number crunch-ers for computationally intensive applications of other research groups in the department.
Part Description
CPU 2× Intel Pentium III, 1 GHz, 256 KByte L2 CacheRAM ECC SDRAM, 512 MByte, 133 MHzChipset ServerWorks ServerSet III LEHard disks 2× IBM DDYS-T09170M, 9.1 GByte, 10 krpmSCSI adapter Adaptec AIC7899, Ultra160 SCSI controllerGraphic card ATI 3D Rage IICPrimary NIC Intel 82557 10/100 Ethernet Pro 100, Fast EthernetSecondary NIC Packet Engines G-NIC II, Gigabit Ethernetalternative secondary NICASANTE FriendlyNET (DP83820), Gigabit EthernetHigh-speed NIC M3S-PCI64B-2, LANai9 interface processor, 2 Gbit/sOS SuSE Linux 6.0, 6.2, 7.0, 7.1, Red Hat 7.3Kernel Linux kernels 2.2.16, 2.4.3, 2.4.18-3smp
Table 4.4: Node configuration in new 16-node CoPs cluster.
The new CoPs cluster employed the same Gigabit Ethernet network as the Patag-onia cluster described above, including the Cabletron Smart Switch Router 8600. Forsome experiments that took advantage of special Gigabit Ethernet NICs and which willbe described in Chapter8, an alternative Gigabit Ethernet network was installed for fournodes. The alternative network with copper cables was interconnected by a Cisco Catalyst4000 switch. The cluster also had a new Myrinet infrastructure based on Myrinet 2000products. The type of Myrinet NICs used is listed in Table4.4, the switch used was aM3S-SW16 switch.
4.1.4 Departmental PC Cluster Infrastructure: Xibalba
During the year 2000, several research groups at the department of computer science ofETH Zurich needed a cluster for their research. Every group wanted its own cluster that itcould use arbitrarily for its research projects and of course the clusters should be as largeas financially possible. It became apparent that the best solution was to install a sharedmulti-use 128-node cluster of commodity PCs that could be used in a shared mode of
3For more information aboutinverted middlewaresee [Tau02].

4.1. EVOLUTION OF PC CLUSTERS USED FOR EXPERIMENTS 53
operation: In its default configuration every group uses its own part of the cluster for theirresearch projects, but for scalability measurements or exceptionally large computations,the whole cluster could be booted into the desired environment and used by a single groupor user. The hardware of the Xibalba cluster thus had to match the requirements of all theinvolved research groups which work in the fields of power databases, workflows, trafficsimulation and cluster architecture. The cluster’s nodes were installed in 8 cabinets andthe nodes’ details are shown in Table4.5.
Part Description
CPU 1–2× Intel Pentium III, 1 GHz, 256 KByte L2 CacheRAM ECC SDRAM, 256 MByte per processor, 133 MHzChipset ServerWorks ServerSet III LEHard disks (s) 2× IBM DTLA-307020 Ultra ATA/100, 20 GByte, 7.2 krpmHard disks (d) 2× IBM DDYS-T18350S Ultra 160 SCSI, 18.3 GByte, 10 krpmSCSI adapter Adaptec AIC7899, Ultra160 SCSI controllerGraphic card ATI 3D Rage IICPrimary NIC Intel 82557 10/100 Ethernet Pro 100, Fast EthernetSecondary NIC Intel 8255x-based PCI adapter, Fast EthernetHigh-speed NIC M3S-PCI64B-2, LANai9 interface processor, 2 Gbit/s (part.)OS SuSE Linux 7.1, Red Hat 7.1, 7.3, Windows 2000Kernel Linux kernels 2.4.3, 2.4.9
Table 4.5: Node configuration in 128-node Xibalba cluster.
Half of the cluster nodes are equipped with two processors to allow for faster compu-tations. As the database group could not make much use of an additional processor, theother half of the cluster remained with a single processor. For database research projectslarge storage is important and thus all the nodes were equipped with two additional fastSCSI hard-disk drives for the data (labeled “d” in Table4.5). The two 18.3 GByte disks(instead of a single larger one) even allow to add the two throughputs by using a RAID-level–0 configuration. For the system installations two cheaper IDE disks (labeled “s” inTable4.5) were installed—one to install Windows 2000 and one for all the Linux instal-lations. By this separation of OSs troubles with mutual interference could be minimised.The two Fast Ethernet controllers where installed to allow for two separated networks.One network is used as the primary data network to be used by the applications for theirdata communications. The primary network was first interconnected by a central En-terasys Matrix E7 switch. The E7 switch did not match the advertised performance andwas thus replaced by an Enterasys ER16 switch (see next section). The second networkis used for remote logins and maintenance. It is interconnected by eight small 24-portEnterasys Horizon VH-2402S switches of which each has a single Fast Ethernet uplinkto the departmental backbone. As we shall see in Chapter6, the second network dou-

54 Chapter 4: Experimental Platforms
bles the speed of some administrative tasks like installing new operating systems on thenodes. Since some experiments in traffic simulations require extremely low latencies, the32 nodes of the corresponding research group were also equipped with a Myrinet network.The Myrinet is connected by a M3-E64 switch.
4.2 Compliance of Building Blocks with their Specification
As you can see from the previous section, there was a lot of hardware involved in theresearch for this thesis. Unfortunately, some parts of the hardware did not fulfill our ex-pectations and some parts did not even comply with the specification of the manufacturer.
One of the problems we had was with the ASANTE FriendlyNET cards that we usedin our Fast Network Block Device experiment (see Subsection8.2.4). The cards use theDP83820 PCI Ethernet network interface controller from National Semiconductor andwere chosen because the DP83820 offers a few features that were quite useful for ourproject. When using the chip it turned out that the design has several deficiencies. Oneof the deficiencies is its performance. Neither the drivers available in the Linux kernelnor our own drivers were able to achieve 70 MByte/s on the new CoPs cluster for TCPdata transfers (with or without a switch), even though the older G-NIC II Gigabit Ethernetcards reached 100 MByte/s. Test that were simply sending dummy packets to the networkwithout any protocol handling could not improve the throughput much, which leads to theconclusion that the chip is unable to match the performance of a Gigabit Ethernet networkfor which it was originally designed.
Further, the DP83820 had multiple technical flaws. When it is instructed to automat-ically remove VLAN tags from incoming packet’s headers, it forgets that packet sizescan be lower than the smallest allowed Ethernet frame after removing the VLAN tag anddrops valid VLAN packets. Another flaw is that incoming packets that it should storein multiple descriptor frames were not always separated at the positions given by thedescriptor-frame lengths. The reversed operation of sending a single packet constructedfrom multiple descriptor frames works well on the sender side. A last flaw that I will men-tion here is related to the automatic distribution of incoming packets in different receiverings. The receive ring where an incoming packet should be stored in is determined by theuser priority given in the VLAN tag of each packet. When using up to three receive rings,this distribution follows an increasing function, but with four receive rings the distributionbecomes a weird pattern. Non of these flaws were mentioned in the documentation whichled to a considerable waste of time on the side of our master student.
The last but not least problem that we had with our clusters was with the networkswitch of the Xibalba cluster. In the advertised bidding process the primary data net-work was specified to have full bisection bandwidth. The system integrator winning thebidding decided to install an Enterasys Matrix E7 switch, which promised to fulfill thefull-bisection requirement according to the corresponding data sheet. After the cluster

4.3. SYSTEM DEVELOPMENT 55
was installed, we started benchmarking and testing the cluster and found out that oursoftware did not behave as expected. Some programs that generated huge data trafficran much slower than they should have. In a time-consuming analysis and benchmark-ing phase we found out that the Matrix E7 switch was unable to deliver the advertisedperformance because of its limited design. The switch was then replaced by an EnterasysER16 switch and a repetition of our analysis showed that the ER16 switch could fulfill therequirements within reasonable bounds. The details of the analysis as well as the resultsfor all the tested networks can be found in more detail in [KRS03].
Another problem that I had to cope with was that there was not enough local storagecapacity left on the new CoPs cluster for some data-intensive experiments. The exper-iments required storing data for a data base in excess of 10 GByte on a single node aswell as distributed over three remote nodes. The nodes were set up in such a way thatthere were no single spare partitions of the required sizes available on their local disks.Fortunately I could circumvent this problem by using Linux’ “linear RAID” functionality.The linear RAID allows to concatenate multiple partitions into a single virtual partition4.While the linear-RAID technique does not require any changes to the applications, it in-troduces another software layer into the system that must be analysed properly and thusresults in more complexity. The added complexity makes the system’s overall perfor-mance harder to understand and potentially even reduces the performance.
4.3 System Development
In the course of a multi-year hardware project, it is inevitable that the underlying hardwarewill change significantly. While working with our multi-use clusters of commodity PCs,the hardware as well as the software underwent many changes. The changes in hardwarerequire to change drivers for specific hardware parts in every generation. To apply thechanges to the software is not only time consuming because of the high complexity anddifficulties of debugging in the kernel layer of an OS, but it is sometimes also hard to getthe required documentation. For projects that also involve enhancements to the firmwareof certain adapters—e.g. with Myrinet as shown in Subsection8.2.3—the enhancementsof the firmware must be ported to the new version of the adapter and its correspondingbase firmware.
Even if the parts of the hardware that belong to the experiments do not change ina new generation of a cluster, other parts might still require a newer revision of the OSkernel to work properly. New kernel versions might include changes to their internals (likee.g. internal programming interfaces) that make it nevertheless necessary to adapt somedrivers. Despite Linux’ advantage of having the kernel source code openly available it ishard to find decent documentation for new implementations.
4Again, the term RAID is technically incorrect here, as there is no redundancy of data.

56 Chapter 4: Experimental Platforms
All the described problems with changes in hardware and the OS’s kernel need asubstantial amount of time to solve—time which is not always available. Consequentlysome of our experimental systems were lost during the change from one generation ofa cluster to the next generation. For example, we were able to port some distributed-device systems involving Myrinet from the old CoPs cluster to the Patagonia cluster, butthere were to many required changes to all the involved software layers to get the systemrunning again on the new CoPs cluster. Thus, some of the experiments could only be doneon the older CoPs cluster, but unfortunately not on the more recent hardware of the newCoPs cluster.
4.4 Summary
In this chapter I explained that it is important to list the factors of a scientific experimentto increase understanding of the results and to enable others to reproduce the experiment.On the other hand it is difficult to reportall factors of experiments in computer systemsand can be quite voluminously to list them all entirely.
I thus concentrated on listing the most important factors of the hardware and systemsoftware for our four main experimental platforms which are: The old CoPs cluster, whichwas a prototype of a cluster of PCs, consisted of 4–8 PCs and was based on Pentium ProCPUs as well as Fast Ethernet and Myrinet as data interconnects. The next cluster we in-stalled was the 24-node Patagonia cluster, that consisted of dual Pentium II nodes runningat 400 MHz. The nodes had the same interconnects as the old CoPs cluster, but were inaddition connected to a Gigabit Ethernet network. Our main experimental testbed is thenew CoPs cluster. It is composed of 16 nodes that have the same network interconnectsas the previous clusters, but are equipped with two 1 GHz Pentium III processors. Forsome experiments I also use the PC-cluster infrastructure of the department of computerscience at ETH Zurich, the 128-node Xibalba cluster. The Xibalba cluster uses the samehardware for its nodes, but is interconnected by two Fast Ethernet networks and includesmore hard-disk space to allow for data-base research done by another research group.
Some of these systems did not comply with their specifications. Finding flaws isa time-consuming and frustrating process. Some parts of the hardware were behavingerroneously while others did not achieve the advertised performance at all. With an un-derperforming base hardware it is hard to build well-performing systems.
When performing research over multiple generations of hardware and system soft-ware, it is difficult to keep up with the low level software parts of one’s systems. As hard-ware changes, drivers should be changed too and similar requirements hold for changes offirmware and internals of OSs. These problems need quite some time to fix for every newgeneration of clusters. Thus, support for some of our older systems had to be dropped asnew clusters were installed to keep time resources free for new projects.

5Modelling Data Streams in
Clusters
Prediction is very difficult,especially of the future.
Niels Bohr
A more scientific approach to computer architecture requires the rigor of an analyticmodel to understand and predict the performance of computer systems. To comply withthis requirement I am developing a modelling scheme that allows to find the most ef-ficient logical topology to distribute data streams over a given physical topology. Myanalytic model extends an existing model for parallel machines to clusters. Its focus is ondata streams in clusters, like applications that do data replication in multi-use clusters ofcommodity PCs, but it can be applied to other environments with high-performance datastreams.
5.1 Introduction and Related Work
When designing or configuring a distributed system, the most efficient configuration tohandle data is not always obvious. There are different possible configurations with manypossible tradeoffs that must be balanced. Many experiments are required to eliminatenon-obvious bad designs and to find a good or the best solution. With emerging clusterinstallations and the variety of software (like tools or middleware), the number of factorsand possible tradeoffs in the construction of a distributed system increases. Having amodel to predict the performance of a projected system would reduce the number ofexperiments before finding a design with satisfying performance. Further, to improvethe performance of future systems, we need tounderstandthe performance of currentsystems and know about their bottlenecks. Understanding of a system’s performance
57
58 Chapter 5: Modelling Data Streams in Clusters
and thus finding critical bottlenecks is facilitated by a model that is able to describe theperformance of the system.
A model can take different approaches and have different properties in describing asystem: Overly generic models with a very abstract view of the systems are certainlysimple and understandable, but have only reduced accuracy. The accuracy is reducedbecause the complex processes in computer systems can not be described accurately byignoring all the details. On the other hand, specific models which take into account all thesmall details of a certain machine match only that machine and are very complex. Thecomplexity is hardly manageable and thus reduces the usefulness of the model. One ofthe difficult parts of creating a model is to find the proper level of detail and accuracy.In this chapter I will present two different models: A basic model that reduces a node inthe cluster to its capacity of handling data, and a more detailed model that also considersthe data streams that flow through the subsystems of the nodes. As a base feature, bothmodels take the network into account.
A popular model is LogP [CKP+93]. It is a parallel machine model that assumes amachine as a collection of essentially complete computers and puts a focus on handlingmessages. It ignores accesses to the memory and the I/O bus. The model is mainlyused for parallel algorithms with small messages. LogP’s parameters are the numberof processors, the per-processor communication bandwidth, the communication latencyand the communication overhead incurred by the processor. With its restriction on smallmessages it is not suitable for large data streams as required in this thesis.
The LogGP [AISSm95] model extends LogP by an additional parameter, the per-pro-cessor communication bandwidth for long messages. It still does not deal with the localmemory subsystem of the nodes. It assumes a fully connected network with constantbandwidth, which is not necessarily the case for many Beowulf-style clusters or multi-use clusters of commodity PCs.
The model presented in this chapter is based on similar ideas of the copy-transfermodel for communication-system performance [SG95]. The copy-transfer model cap-tures the contribution of the memory system to inter-node communication and was devel-oped with MPPs in mind. It focuses on the throughput of copy and transferoperationsanddecomposes these compiler-generated communication operations into basic transfers. AsI will show in the next sections, my model for data streams concentrates on the limitingresourcespassed through by the data streams.
While the model shall be useful for many stream-based data-handling operations, Iwill use data-replication as an example throughout this chapter. As described in Sec-tion 2.5 and Subsection3.1.2, data replication is the problem of distributing a largeamount of identical data to many nodes in the cluster, e.g. when distributing an OS instal-lation to the nodes’ hard-disk drives.

5.2. NODE TYPES 59
5.2 Node Types
In my model, I divide the nodes of a system into two categories: Active nodes whichduplicate a data stream and passive nodes which can only route data streams. The twonode types are shown in Figure5.1.
Active node A node which is able to duplicate a data stream is called an active node.Active nodes that participate in a data-replication operation often store the receiveddata stream on the local disk (as e.g. when OS installations are replicated to thepartitions of the nodes’ local hard-disk drives).
An active node has at least an in-degree of 1 and is capable of passing the datastream further to one or more nodes (out-degree) by acting as a T-pipe.
A typic active node in a multi-use cluster is a single PC of the cluster.
Passive nodeA passive node is a node in the physical network that can neither duplicatenor store a copy of the data stream. Passive nodes can pass one or more streamsbetween active nodes in the network.
A typic passive node in a multi-use cluster is a switch of the data network.
Figure 5.1: An active node (left) and passive node (right).
Figure5.1depicts an active node with an in-degree of 1 and an out-degree of 2 on theleft, as well as a passive node with an in- and out-degree of 3 on the right.
Large-scale data replication requiresreliabledata streams with flow control. Ethernetswitches do only provideunreliablemulticast facilities and must therefore be modelledas passive switches that do only route TCP/IP point-to-point connections. Incorporatingintelligent network switches or genuine broadcast media (like coaxial Ethernet or hubs)could be achieved by making them active nodes and modelling them at the logical level.This is an option for expensive gigabit ATM switches that feature multicast capability onlogical channels with separate flow control or for simple multicast enhanced switches.In the later case a special end-to-end multicast protocol is used to make multicast datatransfers reliable.

60 Chapter 5: Modelling Data Streams in Clusters
5.3 Network Types
The different subsystems involved in handling large amounts of data like in a data-castingoperation must be specialised to transfer long data streams rather than short messages.Partitions with whole OS installations are fairly large entities and the model is thereforepurely throughput-oriented. We start our modelling process by investigating the topologyof the physical network, determing and recording the installed link and switch capacities.
Physical network The physical network topology is a graph given by the cables, nodesand switches installed. The vertices are labeled by the maximal switching capacityof a node, the edges by the maximal link speeds.
The model itself captures a wide variety of networks including hierarchical topolo-gies with multiple switches. Figure5.2 shows the physical topology of the meta clusterinstalled at ETH and the topology of our simple CoPs sub-cluster testbed. The sub-clustertestbed is built with a single central Gigabit Ethernet switch withfull duplexpoint-to-pointlinks to all the nodes. The switch has also enough Fast Ethernet ports to accommodateall cluster nodes at the low speed. Clusters of PCs are normally built with simple andfast layer-2 switches like our Cabletron Smart Switch Routers. In our case the backplanecapacity for a 24 port switch is at 4 GByte/s and never results in a bottleneck.
16 NodesLinneus
192 No
Beow
Math./P
Asgard
16 NodesCoPs
8 Nodes
SSR 8000Cabletron Cabletron
SSR 8600
CabletronSSR 8600 SSR 9000
Cabletron
Fast Ethernet Gigabit Eth
Patagonia
...
... ...
...
...
16 NodesCoPs Cluster
Figure 5.2: Physical network topologies of the ETH meta cluster (left) and the simpleCoPs subcluster with one central switch (right).
Our goal is to combine several subsystems of the participating machines in the mostefficient way for an optimal data-replication operation, so that the cloning of operating

5.4. CAPACITY MODEL 61
system images can be completed as quickly as possible. We therefore define differentsetups of logical networks.
Logical network The logical network represents a connection scheme that is embeddedinto a physical network. A spanning tree of TCP/IP connections routes the streamof a data replication to all participating nodes. Unlike the physical network, thelogical network must provide reliable transport and flow control over its channels.
The physical as well as the logical networks are built according to a certain topology.While the physical network’s topology is given by the cables and switches, the logicalnetwork could have any topology. The logical network’s topology must be mapped ontothe physical network for the model to be able to analyze the streaming performance andthe bottlenecks. The next paragraphs discuss a few popular possible topologies. Networktopologies are discussed in more detail in Section3.2.
Star A logical network with one central server, that establishes a separate logical channelto all n other nodes. This logical network suffers heavy congestion on the outgoinglink of the server.
n-ary spanning tree Eliminates the server bottleneck by using ann-ary spanning-treetopology spanning all nodes to be cloned. This approach requires active T-nodeswhich receive the data, store it to disk and pass it further to up ton next nodes inthe tree.
Multi-drop chain A degenerated, specialised tree (unary case) where each active nodestores a copy of the stream to disk and passes the data to just one further node. Thechain is spanning all nodes to be cloned.
Figure5.3 shows the above described topologies as well as their embedding in thephysical networks. We assume that the central switch is a passive node and that it can notduplicate a data-replication stream.
5.4 Capacity Model
Our model for maximal throughput is based on capacity constraints expressed througha number of inequalities. These inequalities exist for active nodes, passive nodes andlinks, i.e. the edges in the physical net. As the throughput will be the limiting factor, allsubsystems can be characterised by the maximal throughput they achieve in an isolatedtransfer. The extended model further introduces some more constraints, e.g. for the CPUand the memory-system throughput in a node (see Section5.6). This section describesthe important constraints for the basic model.
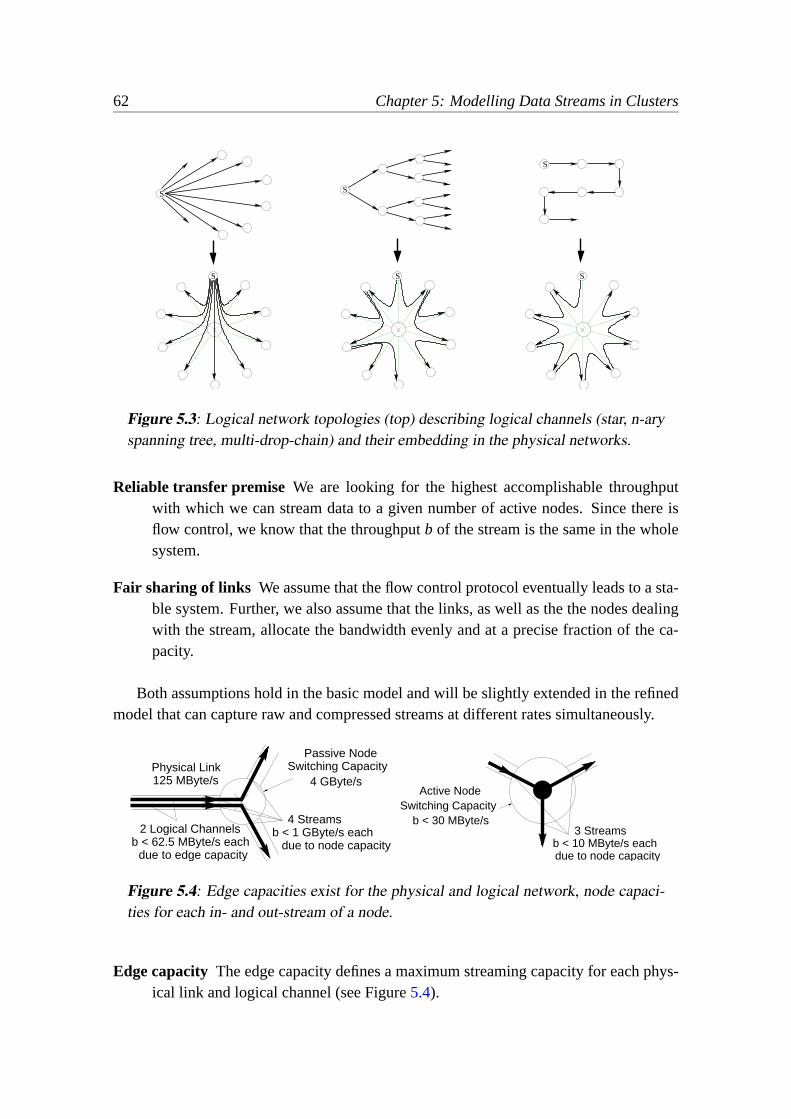
62 Chapter 5: Modelling Data Streams in Clusters
S
SS
S S S
Figure 5.3: Logical network topologies (top) describing logical channels (star, n-aryspanning tree, multi-drop-chain) and their embedding in the physical networks.
Reliable transfer premise We are looking for the highest accomplishable throughputwith which we can stream data to a given number of active nodes. Since there isflow control, we know that the throughputb of the stream is the same in the wholesystem.
Fair sharing of links We assume that the flow control protocol eventually leads to a sta-ble system. Further, we also assume that the links, as well as the the nodes dealingwith the stream, allocate the bandwidth evenly and at a precise fraction of the ca-pacity.
Both assumptions hold in the basic model and will be slightly extended in the refinedmodel that can capture raw and compressed streams at different rates simultaneously.
Passive NodeSwitching Capacity
4 GByte/sPhysical Link125 MByte/s
2 Logical Channelsb < 62.5 MByte/s each
due to edge capacity
4 Streamsb < 1 GByte/s each
due to node capacity
b < 30 MByte/s
Active NodeSwitching Capacity
3 Streamsb < 10 MByte/s eachdue to node capacity
Figure 5.4: Edge capacities exist for the physical and logical network, node capaci-ties for each in- and out-stream of a node.
Edge capacity The edge capacity defines a maximum streaming capacity for each phys-ical link and logical channel (see Figure5.4).

5.5. SIMPLE MODEL ALGORITHM 63
As the physical links normally operate infull duplex mode, the inbound- and out-bound-channels can be treated separately. If the logical-to-physical mapping sug-gests more than one logical channel over a single physical link, the physical link’scapacity is evenly shared between the logical channels. Therefore the capacity issplit in equal parts by dividing the link capacity through the number of channelsthat are mapped to the same physical link.
An edge with in-degreei and out-degreeo is denoted withiEo.
Example:For a binary tree with in-degree 1 and out-degree 2 mapped to one physicalGigabit Ethernet link the throughput of a stream has to comply with the following edgeinequality:
1E2 : b< 125, 2b< 125 → b<1252
The first inequality is due to the Gigabit Ethernet’s maximum throughput of 125 MByte/sand the second inequality is a result of the fair sharing of links and the edge capacity.
Node Capacity is given by the switching capacity a node can provide, divided throughthe number of streams it handles.
A passive node is denoted similar to an edge, while an active node that hasd datastreams going to its hard-disk drive is denoted asNi,d,o.
The switching capacity of a node can be measured experimentally (by parameter fit-ting) or be derived directly from data of the node computer through a detailed model ofcritical resources. The experimental approach provides a specific limit value for each typeof active node in the network, i.e. the maximalswitching capacity. Fitting all our measure-ments resulted in a total switching capacity of 30 MByte/s for our active nodes runningon a 400 MHz Pentium II based node of the Patagonia cluster (see Subsection4.1.2for adetailed hardware description). The switching capacity of our passive node, the 24 portGigabit Ethernet switch is about 4 GByte/s—much higher than needed for a data replica-tion on the Patagonia cluster.
5.5 Simple Model Algorithm
With the model described above we are now able to evaluate the different logical networkalternatives described earlier in this chapter. The algorithm for evaluation of the modelcomprises the steps illustrated in Figure5.5.
Example:We compare then-ary spanning tree structure, ranging from the special caseof the multi-drop chain to the other special case of the star topology. We will do so forGigabit Ethernet as well as for Fast Ethernet. The chain topology with all active nodeswith in-degreei and out-degreeo of exactly one (except for the source and the sink) can be
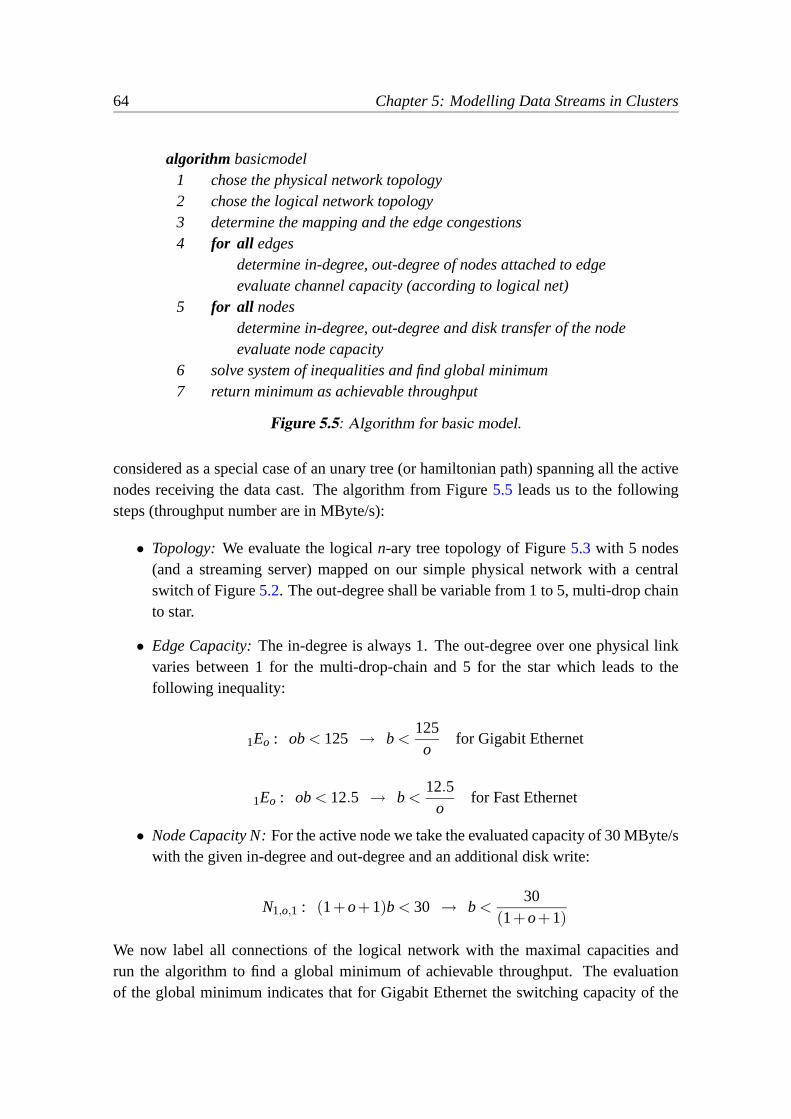
64 Chapter 5: Modelling Data Streams in Clusters
algorithm basicmodel1 chose the physical network topology2 chose the logical network topology3 determine the mapping and the edge congestions4 for all edges
determine in-degree, out-degree of nodes attached to edgeevaluate channel capacity (according to logical net)
5 for all nodesdetermine in-degree, out-degree and disk transfer of the nodeevaluate node capacity
6 solve system of inequalities and find global minimum7 return minimum as achievable throughput
Figure 5.5: Algorithm for basic model.
considered as a special case of an unary tree (or hamiltonian path) spanning all the activenodes receiving the data cast. The algorithm from Figure5.5 leads us to the followingsteps (throughput number are in MByte/s):
• Topology: We evaluate the logicaln-ary tree topology of Figure5.3 with 5 nodes(and a streaming server) mapped on our simple physical network with a centralswitch of Figure5.2. The out-degree shall be variable from 1 to 5, multi-drop chainto star.
• Edge Capacity:The in-degree is always 1. The out-degree over one physical linkvaries between 1 for the multi-drop-chain and 5 for the star which leads to thefollowing inequality:
1Eo : ob< 125 → b<125o
for Gigabit Ethernet
1Eo : ob< 12.5 → b<12.5
ofor Fast Ethernet
• Node Capacity N:For the active node we take the evaluated capacity of 30 MByte/swith the given in-degree and out-degree and an additional disk write:
N1,o,1 : (1+o+1)b< 30 → b<30
(1+o+1)
We now label all connections of the logical network with the maximal capacities andrun the algorithm to find a global minimum of achievable throughput. The evaluationof the global minimum indicates that for Gigabit Ethernet the switching capacity of the

5.5. SIMPLE MODEL ALGORITHM 65
active node is the bottleneck for the multi-drop chain and for then-ary trees. But for theslower links of a Fast Ethernet and then-ary tree topology the network rapidly becomes abottleneck as we move to higher branching factors.
SS
S
< 125/3
< 30/2
[MByte/s]
< 24< 12.5
< 30/3
< 24 < 125< 125/2
< 30/4
< 24
< 125/2
< 4000/6
< 24< 30/4
< 4000/5
Figure 5.6: Example network with physical network (top left), logical network (topright) and the embedding of the logical in the physical network (bottom).
Example:In a second example we apply our model to a somewhat complex networkas shown in Figure5.6. The data stream is sent from one server to eight clients. Thephysical network (as shown on the top left in the figure) consists of a server and twoclients that have direct Gigabit Ethernet links to a first switch, which in turn has a fourthGigabit Ethernet link to a second switch. This second switch connects to the remaining sixclients with Fast Ethernet. We use the tree-based topology on the top right of Figure5.6aslogical network topology. One possible mapping of the logical into the physical networkis shown on the bottom of the figure. In a next step, all the edge and node congestionsare determined, according to the number of streams handled. This results in a numberof inequalities which are shown at the bottom of the figure, including the trivial limits ofthe hard drives. Again, all numbers are in MByte/s. Solving the inequalities of the entire

66 Chapter 5: Modelling Data Streams in Clusters
model results in a maximal streaming bandwidth of 7.5 MByte/s, limited by the switchingcapacity of the two nodes with an out-degree of two.
The algorithm does not directly give an optimal mapping for a data-replication oper-ation, but it leads to a prediction of the anticipated throughput of a certain setup. Withsome common sense the model guides to a good solution for the data-handling operationin question.
5.6 A More Detailed Model for an Active Node
The basic model considered two different resources: Link capacity and switching ca-pacity. The link speeds and the switch capacity of the passive node were taken from thephysical data sheets of the networking equipment, while the total switching capacity of anactive node was obtained from measurements by a parameter fit. Link and switching ca-pacity can only lead the optimisation towards a graph-theoretical discussion and will onlybe relevant to cases that have extremely low link bandwidth and high processing poweror to systems that are trivially limited by disk speed. For clusters of PCs with high speedinterconnects this is normally not the case and the situation is much more complex. Mov-ing data through I/O buses and memory systems at full Gigabit/s speed remains a majorchallenge in cluster computing. Most systems of today are nearly balanced between CPUperformance, memory system and communication speed and some interesting tradeoffscan be observed. As indicated before, several options exist to trade off the processingpower in the active node against a reduction of the load on the network. Among them aredata compression or advanced protocol processing that turns some unreliable broadcastcapabilities of Ethernet switches into a reliable multicast.
bufferSystem User
buffer
bufferSystem
bufferSystem
SCSI
DMA Copy
T-connector
Copy
Copy
DMA
NetworkDMA
Figure 5.7: Schematic data flow of an active node running the Dolly client.
For a better model of an active node we consider the data streamswithin an activenode and evaluate several resource constraints. For a typical client of a data-replicationoperation the node activity comprises receiving data from the network and writing parti-tion images to the hard-disk driver. We assume a “one copy” TCP/IP protocol stack asprovided by a standard Linux kernel. In addition to the source and sink nodes, the tree andmulti-drop chain topologies require active nodes that store a data stream and forward oneor more copies of the data streams back into the network. Figure5.7 gives a schematicdata flow in an active node capable of duplicating a data stream. The node in the figure is

5.7. MODELLING THE LIMITING RESOURCES IN AN ACTIVE NODE 67
receiving a data stream from the network which it forwards to the next node in the logicaltopology, at the same time duplicating it to the disk. In the next section, I will integrate thenodes’ internal resources like the memory subsystem (for data copies or DMA transfers)and the CPU (for controlling the streams) into the model.
5.7 Modelling the Limiting Resources in an Active Node
The switching capacity of an active node is modelled by the two limits of the network andfour additional resource limits within the active node. The limits of the network are asfollows:
Link capacity The link capacity is taken from the physical specifications of the networktechnology (e.g. 125 MByte/s for Gigabit Ethernet or 12.5 MByte/s for Fast Ether-net).
Switch capacity of passive nodesThe capacity of the passive nodes is taken from thephysical specifications of the network hardware (e.g. 2 or 4 GByte/s depending onthe Cabletron Smart Switch Router model, 8000 or 8600 respectively).
The resource limits of an active node are listed below. The examples of correspondinghardware are based on the Patagonia cluster (see Subsection4.1.2).
Disk system The maximum throughput of the node’s hard-disk drive, similar to a linkcapacity in the basic model (e.g. 24 MByte/s for a Seagate Cheetah 10’000 RPMdisk).
I/O-bus capacity The sum of data streams traversing the I/O bus must be less than itscapacity (e.g. 132 MByte/s on 32-bit PCI-bus–based PC cluster nodes).
Memory-system capacity The sum of the data streams to and from the memory systemmust be less than the memory system’s capacity (e.g. 180 MByte/s on systems withthe Intel 440 BX chipset).
CPU utilisation The processing power required for the data streams at the differentstages. For each operation the fraction coefficient 1/a1,1/a2,1/a3, . . . indicatesthe maximal speed of the stream with exclusive use of 100% CPU. The denomina-torsa1,a2,a3, . . . correspond to the real throughputs of the respective subsystems asobserved in practice. The sum of the fractions of CPU use must be< 1(= 100%)(Throughputs considered: 80 MByte/s SCSI transfer, 90 MByte/s internal copymemory to memory, 60 MByte/s send or receive over Gigabit Ethernet, 10 MByte/sto decompress a data stream for a 400 MHz single-CPU cluster node).

68 Chapter 5: Modelling Data Streams in Clusters
Limitations on the four latter resources result in constraint inequalities for the maximalthroughput achievable through an active node. The modelling algorithm determines andposts all constraining limits in the same manner as described in the example with a singleswitching capacity. The constraint over the edges of a logical network can be evaluatedthen into the maximum achievable throughput considering all limiting resources.
5.8 Dealing With Compressed Data
Partition images or other data for replication like multimedia presentations can be storedand distributed in compressed form. This reduces network load but puts an additionalburden on the CPUs in the active nodes. Compressing and uncompressing is introducedinto the model by an additional data copy to agunzipprocess, which uncompresses datawith an output data rate of about 10 MByte/s on a typical node of our Patagonia cluster(see Subsection4.1.2 for more details on the hardware of the Patagonia cluster). Thisconfiguration is depicted in Figure5.8.
bufferSystem
Userbuffer
bufferSystem
gunzip Network
Copy
Copy
DMA
DMA
CopyCopy
UncompbufferSystemDMA
SCSIT-connector
Figure 5.8: Schematic data flow of a Dolly client with data decompression.
The workload is defined in raw data bytes to be distributed and the throughput ratesare calculated in terms of the uncompressed data stream. For constraints inequalities in-volving the compressed data stream the throughput must be adjusted by the compressionfactorc. Hardware supported multicast could be modeled in a similar manner. For multi-cast, the network would be enhanced by newly introduced active switches, but a reliablemulticast flow control protocol module must be added at the endpoints and would con-sume a certain amount of CPU performance and memory system capacity (just like acompression module).
Example:We model the switching capacity of an active node for a multi-drop chainwith Fast Ethernet and compression. From the flow chart in Figure5.8 we derive onenetwork send and one receive stream, one disk write, three crossings of the I/O bus, elevenstreams from and to buffer memory, one compression module and four internal copiesof the data stream. This leads to the following constraints for the maximal achievablethroughputb:

5.9. MODELLING CAPABILITIES OF PASSIVE NODES 69
bc < 12.5 MByte/s network link for receivebc < 12.5 MByte/s network link for sendb< 24 MByte/s SCSI Disk
2bc +b< 132 MByte/s I/O bus, PCI
8bc +3b< 180 MByte/s memory system
( 260c + 1
80 + 390c + 1
90 + c10)b< 1 (100%) CPU utilisation
For a realistic compression factor ofc = 2, an active node in this configuration can handle3.9 MByte/s. The limiting resource is the CPU utilisation.
The use of compression seems tempting at first glance because of the reduced amountof data to transport over the potentially throughput-limiting network. But as the exampleshows, the CPUs are not fast enough (relatively to the throughput of the network) toactually improve the throughput of the data stream. Instead, the increased use of the CPUeven slows down the stream’s performance. If we assume a constant compression factorc = 2 and examine the above equation on the CPU utilisation regarding decompressionthroughput, we find that the decompression throughput should be about 70 MByte/s toachieve a stream throughput comparable to the uncompressed case. Even with a doubleddecompression rate of 140 MByte/s—which is even higher than a single memory-copyoperation and thus rather unrealistic—the maximum throughput of the compressed datastream (measured as uncompressed data) could barely exceed 14 MByte/s. The CPUs’load due to additional decompression and memory copies is simply too high to make theuse of a compressed data stream worthwhile in this environment. Compression couldbecome interesting again in an unbalanced environment with a slow network—whichclearly limits the transmission’s throughput—and spare resources of the CPU and thememory subsystem.
5.9 Modelling Capabilities of Passive Nodes
The model thus far did not include the details of passive nodes, as it is often difficult toget inside knowledge about their internal designs. Without knowledge about their inter-nals, the performance of some switches is hard to predict—and sometimes even hard tounderstand. In this section I will discuss two problems with modelling the passive nodes’capabilities: Integrating the multicasting features of the switches and the accuracy of theirtechnical specifications.
5.9.1 Multicast Implementations
The PC-based active nodes use TCP/IP connections to distribute the data. If IP multicastwere used, it would be unreliable without error correction. It would be up to the end-points to deal with flow control and retransmission of lost data. A multicast flow-controlmodule is modelled similar to a compression module putting load on the memory system

70 Chapter 5: Modelling Data Streams in Clusters
(extra copies for retransmission which are likely to occur more often if many receiversneed to be coordinated) and on the CPU (additional protocol processing). In a previousstudy [Rau97] I implemented a well known approach for a reliable multicast protocol de-scribed in [FJM+95]. Unfortunately the performance reached in those implementationswas not able to sustain data rates that come even close to the 10 MByte/s observed on ourcluster machines. It turned out that the protocol was not able to handle even very smallpacket-loss rates when transmitting high-speed data streams.
Problems also emerged with other implementations like the public data-casting toolUDPcast [Kna02]. Some of the cheaper 10/100-Mbps switches—which otherwise offeredquite good performance—could send multicast packets only at the speed of the slowestlink connected to them, even if the node on that link was not part of the multicast group.As a result, a single independent machine with a 10-Mbps link connected to an arbitraryport of the switch could reduce the throughput of the stream flowing through the other100-Mbps ports of the switch to a crawling 10 Mbps.
With a well-behaving switch there could still be problems if the sender of the datareplication is faster than the receivers. The slow receivers result in many dropped packetsthat have to be retransmitted. The retransmissions slow the stream down, sometimesleading to a complete interruption of the stream.
As a conclusion, while IP multicast seems like a suitable technique for data replicationin theory, it turns out that the coordination of a single sender and many receivers for high-performance data transmissions is very difficult in practice. The correct modelling of amulticast-module in the active and passive nodes under these conditions remains quitedifficult.
5.9.2 Behavior Under Load
Ideal passive nodes would have a switching capacity high enough to handle all load with-out becoming a bottleneck for the data streams, because such passive nodes could safelybe ignored by the model. However, real switches have an upper limit for their switchingcapacities. Upper limits are nicely treated by the model as long as the switches share themaximum switching capacity between all passing streams according to the “fair sharingof links” premise. Unfortunately, not all switches cope equally well under high loads, asthe following examples will show.
Figure5.9shows the results of data-replication operations using the multi-drop–chaintopology and an increasing number of client nodes or streams passing through the threeswitches. The Switchbench tool [Kur01] is used to conduct the experiments. The switchesused are an ATI CentreCom FS724i and a Cisco Catalyst 2900 Series XL for Fast Ethernetand a Cabletron Smart Switch Router SSR8600 as mentioned in Chapter4 for GigabitEthernet. The experiment basically offers full load on all used ports of the switch, exceptfor the Gigabit Ethernet switch, where the nodes are not fast enough to transmit data with

5.9. MODELLING CAPABILITIES OF PASSIVE NODES 71
1 2 3 4 5 6 7 8 9 10 11 12 13 14 150
20
40
60
80
100
120
140
160
180
200
0
200
400
600
800
1000
1200
Ag
gre
gat
e sw
itch
ing
cap
acit
y [M
Byt
e/s]
Ag
gre
gat
e sw
itch
ing
cap
acit
y [M
Byt
e/s]
Number of client nodes
ATI FS724iFast Ethernet24 ports
Cisco 2900 XLFast Ethernet24 ports
SSR8600Gigabit Ethernet16 ports
Figure 5.9: Behavior of three switches with increasing load.
full gigabit speed. The figure reveals three different types of behavior for switches underheavy load: The well-behaving ATI switch offers full Fast-Ethernet performance for anynumber of nodes. For the Gigabit-Ethernet switch, the offered load does not suffice to fillthe network links (the figure’s right y-axis has been scaled to allow for direct scalabilitycomparison with the Fast Ethernet switches). Still, the aggregate performance shown inthe graph increases linearly up to 12 nodes and then roughly holds the apparent maximumswitching capacity. This switch can still be integrated into the model if the real maximumswitching capacity is know. An example of a switch with catastrophic behavior is theCisco 2900: It increases the switching capacity with the offered load up to 12 nodes, butreduces its capacity dramatically as more nodes offer traffic to the switch. This switchcan not be accurately modelled.
While most switch manufacturers publish data sheets with technical specifications,these specifications are not always correct. After installing the Xibalba cluster (see Sub-section4.1.4) we found out that the data network did not behave as advertised: Thethroughput for a data-replication operation was much lower than predicted. After a care-ful evaluation we found that the Enterasys Matrix E7 switch could not meet the advertisedperformance. The outcome of our switch evaluation seems disappointing. It is well knownthat data sheets sometimes do not reflect the performance of the real hardware implemen-tation. Confronted with our test results the representative of the vendor readily checkedwith engineering and admitted that there is an inter-module communication limitation inthe line modules of the Matrix E7. He also stated that marketing inflates the total band-width numbers to take into account that in a normal network setting not all the users ona switch will communicate with all other users on the switch and that we are the firstcustomers that have a problem with this limitation. Many details about these evaluationsof network interconnects for clusters of commodity PCs are described in [KRS03]. Thepaper shows that the performance of a switch may depend on the communication patternof the nodes, making the modelling of such passive nodes even harder.

72 Chapter 5: Modelling Data Streams in Clusters
5.10 Summary and Conclusions
In this chapter I first emphasise the need for accurate models to better understand currentsystems’ performance. Understanding the performance of current systems together witha powerful model helps to design better future systems and to predict the performance ofthese systems. Other work in the area is for small-message systems, ignores the effectsof the memory subsystem or focuses on copy-transfer operations. My model on the otherhand emphasises on the limiting resources of a system which are passed through by datastreams. As an example for the model I used the data-replication operation used e.g. forcloning OS installations to many nodes in multi-use clusters of PCs.
The next section then differentiates between active and passive nodes. Active nodesactively participate in the data-replication operation and are capable of forking a streamto multiple other nodes. A passive node is part of the physical network and simply passesdata along without permanently storing it.
Physical and logical networks are the topic of the next section. The physical network’stopology is given by the cables of the data-network installation, while the topology ofthe logical network is chosen arbitrarily. The mapping of the logical onto the physicalnetwork is crucial for the performance of the data stream.
In a next step, I explain important constraints for the basic model: The reliable transferpremise, which ensures that the logical stream is reliable and its performance the same inthe whole system, and the fair sharing of links, which means that resources’ capabilitiesare shared evenly between all passing data streams. The edge capacity specifies the edges’streaming capacity for each physical link and logical channel. Similarly, the node capacityis given by the switching capacity that a node can provide.
In a first model, a basic algorithm finds the maximal achievable throughput of a datastream in a system. It does so posting a series of inequalities according to the chosentopologies and depending on the edges’ and nodes’ capabilities. Two examples illustratethe use of the basic model. The basic model ignores important subsystems in the activenode such as the memory or CPU. A more detailed model thus also takes the data flowinside the active nodes into account. The enhanced model shares the capacities of the disksystem, the I/O bus, the memory system and the CPU between the involved data streams.Thereby it helps to compare and understand the performance of different approaches to adata-streaming operation. A next section then explains how to deal with compressed datastreams. Compressed data streams can be integrated into the model by integrating theadditional data copies and the compression module into the set of inequalities. The calcu-lation of the model for our sample PC cluster pointed towards an optimal solution usinguncompressed streams of raw data. Compression resulted in a lower network utilisationbut was slower due to the higher CPU utilisation.
The passive nodes’ capabilities are harder to model, because the switches may exhibitstrange behavior, e.g. when slower links are connected to the switch or when they reach

5.10. SUMMARY AND CONCLUSIONS 73
their performance limits. It is thus difficult to use the switches’ IP-multicast features fordata distribution and some switches can not even be modelled accurately.


6Data Casting
Practice is like theory,only different.
Saying
The flexibility of multi-use clusters of commodity PCs requires a technique to rapidlyreplicate OS installations to many nodes in a cluster. A basis for such a replicationtechnique—also known as cloning—is a data casting algorithm and implementation thatallows to multicast large amounts of identical data with high performance to many nodesin a cluster. In this chapter I discuss different approaches to the data-casting problem withvarying topologies and introduce our partition-cloning tool Dolly that uses a multi-dropchain as network topology. The use of a multi-drop chain topology seems to be againstintuition at first, but follows naturally from the analytic model presented in the previouschapter. Finally I compare the different approaches in an experimental evaluation.
6.1 Introduction and Related Work
I was motivated to realize the work on data casting by the work with the Patagonia multi-use cluster of commodity PCs. This cluster can be used for different tasks by bootingdifferent system installations (see Section4.1.2for more information about the hardwareof the Patagonia cluster). The usage modes comprise traditional scientific computingworkloads (Linux), research experiments in distributed data processing (data mining) ordistributed collaborative work (Linux and Windows NT) and computer science education(Windows NT, Oberon). For best flexibility and maintenance, such a multi-use clustermust support the installation of new operating system images within minutes.
The problem of copying entire partitions over a fast network leads to some interestingtradeoffs in the overall design of a PC cluster architecture. Our cluster nodes are builtfrom advanced components such as fast microprocessors, disk drives and high-speed net-work interfaces connected via a scalable switching fabric. Yet it is not obvious which
75
76 Chapter 6: Data Casting
arrangement of the network or which configuration of the software results in the fastestsystem to distribute large blocks of data to all the machines of the cluster. At first, the useof IP multicast seems the best solution as it takes advantage of the switches’ multicastingfeatures. However, the coordination of a single sender and many receivers with poten-tially different hardware capabilities is complex. Other protocols and topologies mightoffer similar or better performance than the multicast based. Another tradeoff worth in-vestigation is the use of compression. As discussed in Section5.8the use of compressionreduces the amount of data to transmit, but increases the load on the CPU and the mem-ory subsystem. This tradeoff might reduce the throughput of streams in some systems,but might improve others—depending on the topology and the relative speed of the CPUand the network.
After in depth analytical modelling of network and cluster nodes in Chapter5, I createa simple, OS-independent tool that distributes raw disk partitions. The tool can be used toreplicate (i.e. clone) any OS installation. Most OSs can perform automatic installation andcustomisation at startup and a cloned partition image can therefore be used immediatelyafter a partition cast completes.
Partition cloning is similar to general backup and restore operations. The differencesbetween logical and physical backup are examined in [HMF+99]. We wanted our toolto remain operating system and file system independent and therefore we work with rawdisk partitions ignoring file systems and their content.
Another previous study of software distribution [KC96] presents a protocol and a toolto distribute data to a large number of machines while putting a minimal load on thenetwork (i.e. executing in the background at a lower priority). The described tool usesunicast, multicast and broadcast protocols depending on the capabilities and the locationof the receivers. The different protocols drastically reduce the network usage of the tool,but also keep the data distribution well below maximal speeds.
A quite recent and interesting project in the field is Frisbee [HSL+03]. Frisbee isa cloning tool with multicast data distribution and compression techniques for the data.It uses IP multicast with a receiver-driven application-level reliable multicast protocol.However, there is no flow control and the multicast packets are sent at a constant datarate that must suit the receivers. With data networks becoming faster and faster, it willbecome more essential that the data is never sent too fast for the receivers. Otherwisemany dropped and retransmitted packets are the result. Even if a single node is over-loaded temporarily, the server has to retransmit data which slows down the whole stream.Compression of partitions is done in chunks and includes only allocated blocks.
Pushing the protocols for reliable multicast over unreliable physical network towardshigher speeds leads to a great variation in the perceived bandwidth, even with moder-ate packet loss rates, as shown in [Rau97]. Known solutions for reliable multicast (suchas [FJM+95]) require flow-control and retransmission protocols to be implemented in theapplication. Most of the multicast-protocol work is geared to either reliably distribute

6.2. DIFFERENCES IN THE IMPLEMENTATIONS 77
small control messages or audio and video streams with low delay and jitter, rather thanto optimise bulk data transfers at a high burst rate. Work on small-message reliable mul-ticast includes [PRO03, WMK95], while [PSK94, AR94] focuses on high-speed reliablymulticast on wide area networks.
A few commercial products are available for operating system installation by cloning,such asNorton Ghost1, ImageCast2 or DriveImagePro3. All these tools are capable ofreplicating a whole disk or individual partitions and generating compressed image files,but—at the time of our study in the year 2000—none of them can adapt to differentnetworks or the different performance characteristics of the computers in PC clusters.Commercial tools also depend on the OS and the file system, since they use knowledge ofthe installed OS and file systems to provide additional services such as resizing partitions,installing individual software packages and performing customisations.
An OS-independent open-source approach is desirable to support partition cast formaintenance in Beowulf installations [BSS+95]. Other applications of my data-distribu-tion technique could include data casting for presentations, databases or screen imagesfor new applications in distributed data mining, collaborative work or remote tutoringon multi-use clusters of PCs. An early survey about research in that area including videocast for clusters of PCs was done in the Tiger project [BID+96]. Some simulations requirelarge input data sets on the nodes’ local hard-disk drives for faster reading. Distributingthese input files with an efficient data-casting technique could help to speed up researchwith and development of these simulations.
6.2 Differences in the Implementations
In this section I describe different implementations of a data-casting operation. I imple-mented most of the described techniques to evaluate their fitness for practical use.
6.2.1 Network-Supported Multicast
An obvious topological alternative would be a true physical spanning tree using the mul-ticasting feature of the networking hardware. With this bus-topology–based option theserver would only source one stream and the clients would all only sink a single stream.Actual replication of the data to multiple network links is done by the switches. Sincedata is theoretically just transmitted once over every link to a node that needs to receivethe data, multicast is the most economic use of the network’s resources. The protocolsand schemes required forreliableand robust multicast are neither trivial to implement norincluded in common commodity OSs and often depend on very specific multicast capa-
1Norton Ghost by Symantec,http://www.symantec.com/2ImageCast by Innovative Software Ltd.,http://www.innovativesoftware.com/3DriveImagePro by PowerQuest,http://www.powerquest.com/

78 Chapter 6: Data Casting
bilities of the network hardware. Some of the cheaper switches behave strangely undercertain conditions as described in Subsection5.9.1.
S
S
Figure 6.1: Logical topology of multicast-based data cast (left) and its mapping ontoa physical cluster network with a single switch (right).
For the experimental evaluation in Section6.3 of that implementation alternative Iused the protocol described in [Rau97] and the publicly available tool UDPCast [Kna02]in a reconsideration five years later, as it is more advanced than my own prototype im-plementation. A graph of the logical and physical topology of a multicast-based data castis shown in Figure6.1. UDPcast reliably multicasts data by using IP multicast from onenode to all other nodes that take part in the distribution. Lost packets are retransmittedand an option for asymmetric links allows forward error correction by including redun-dant information in the data packets, thereby increasing the volume of the transmitteddata.
If we would try to model the multicast setup, it would be difficult because of the un-known behavior of the network switches (see also Section5.9.1) and the complex flowcontrol for the asymmetric situation of one single sender and many receivers. Theoreti-cally we see from Figure6.1 that every node and every edge has only one correspondingdata stream, which would be an optimal topology.
6.2.2 Network File System (NFS)
Another experimental setup for partition-cast uses a standard file-sharing service likeNFS4 with transfers over a UDP/IP network resulting in astar topology. The NFS serverexports partition images to all the clients in the cluster. A command line script readsthe images from a network-mounted drive, possibly decompresses the data and writes itto the raw partitions of the local disk. Although this approach might look a bit naive toan experienced system architect, it is simple, highly robust and supported by every OS.Furthermore, a single client failure or a congested network can be easily dealt with.
4Network File System

6.2. DIFFERENCES IN THE IMPLEMENTATIONS 79
S
S
Figure 6.2: Logical topology of an NFS-based (star topology) data cast (left) and itsmapping onto a physical cluster network with a single switch (right).
Figure 6.2 illustrates the logical topology and its mapping onto a physical clusternetwork. Because of the asymmetric role of one server which individually serves manyclients, this approach does not scale well, since the single network link of the server canbe saturated while serving a relatively small number of clients even with a high-speedGigabit Ethernet connection.
bufferSystem
Userbuffer
Userbuffer
Userbuffer buffer
System
bufferSystem
bufferSystem
...SCSI
...
DMA
Copy
NFS server
Copy
Copy
Copy DMA
DMA
DMA
Copy
Copy
Network
Figure 6.3: Schematic data flow in a source node for a star-topology partition cloningoperation, as used in the simple “copy from NFS” approach
When looking at the internal data operations of the server node as depicted in Fig-ure 6.3, we see three types of operations: One is the transfer of the data from the diskinto the system’s buffer cache. It transfers every part of the data exactly once. Anothertype of operation are the data copies from the system buffer to the NFS daemons’ buffers.Depending on the implementation and the level of parallelism of the NFS daemons, datamay be copied once for every single client or once to every NFS daemon (kernel-basedimplementations of NFS might avoid this copy). The final type of operation is the datastream from the NFS daemons to the system’s network buffers and over the network in-terface to all the clients. This operation requires exactly one data copy for every singleclient. Only a true zero-copy architecture could reduce the data copies, but the data wouldstill cross the PCI bus and the NIC for all the clients. In the model from the previouschapter, these data copies would introduce a variable parametern (representing the num-ber of clients) into the inequalities for the capacity constraints. The throughput of the

80 Chapter 6: Data Casting
overall stream worsens with an increasing number of clients. The model clearly predictsthe nonscalability of the NFS-based approach.
6.2.3 Tree Topology With Dolly-Tree
As a next setup, we considered putting together active clients in an-ary spanning treetopology. This method works with standard TCP point-to-point connections and usesswitching capability of the switch backplane. My partition cloning programDolly5 runson each active node. A simple server program reads the data from disk on the imageserver and sends the stream over a TCP connection to the first few intermediary clients.The clients receive the stream, write the data to the local disk and send it concurrently onto the next clients in the tree. The leaf nodes in the tree receive the stream and simplystore on their local disks. The nodes are connected in ann-ary spanning tree, eliminatingthe bottleneck of the server link accessing the network.
S
S
Figure 6.4: Logical topology of an tree-based data cast (left) and its mapping onto aphysical cluster network with a single switch (right).
The logical topology of the tree setup and its mapping on the physical network of acluster is depicted in Figure6.4. It shows—considering a binary tree as example—thatthe server’s link has only two outgoing data streams, and every following node has exactlyone incoming and two outgoing data streams.
bufferSystem
bufferSystem
Userbufferbuffer
System
bufferSystem
SCSI
DMA
CopyCopy
DMA
DMA
DMA
Copy
Copy
Network
Intermediary node
Figure 6.5: Schematic data flow through a node running the Dolly-tree client in abinary-tree topology.
The detailed internal operations inside an intermediary node of a binary-tree setup isillustrated in Figure6.5. It reveals that the number of copy operations no longer depends
5http://www.cs.inf.ethz.ch/CoPs/patagonia/

6.2. DIFFERENCES IN THE IMPLEMENTATIONS 81
on the number of clients, but on the branching factor of the tree. The branching factor alsodetermines the number of outgoing data streams over the potentially limiting network.While the tree setup is an improvement over the NFS-based star topology, the limitingfactor has shifted from the number of nodes to the branching factor of the tree. The modelpredicts an increase in the stream’s performance, but suggests that a branching factor ofone should result in even better throughput due to fewer copy operations per node andbetter use of the network links.
6.2.4 Multi-Drop Chain With Dolly
For the final and optimal solution the same Dolly client program can be used with a localcopy to disk and just one further downstream client to serve to. The topology turns into ahighly degraded unary spanning tree—a tree with a branching factor of one. We call thislogical network amulti-drop chain. My cloning tool Dolly can be configured to organiseits data-casting operation in a multi-drop chain: The server reads the data stream fromdisk and sends it to the first client. The clients continuously store the incoming datastream on their local disks while concurrently forwarding it to their corresponding nextclient. At the end of the chain, the final client simply sinks the stream to its disk.
S
S
Figure 6.6: Dolly-based data cast with a multi-drop–chain topology. The logicaltopology is on the left and its mapping onto a physical cluster network with a singleswitch on the right.
The logical multi-drop chain and its mapping onto the physical network of a clusteris shown in Figure6.6. The figure reveals that every node has at most one incoming datastream and at most one outgoing data stream. Every edge is traversed by at most onestream in each direction, leaving the switch as the only scalability-limiting resource ofthe physical network.
The schematic data flow of a data cast with Dolly is depicted in Figure6.7, includ-ing the internal operations of the nodes. The number of the nodes’ internal copy opera-tions is lower than with a tree topology and is completely independent of the number ofnodes. This independence makes the system highly scalable and according to the modelit achieves optimal performance.

82 Chapter 6: Data Casting
bufferUserbuffer buffer
System
bufferSystem
System
bufferSystem
Userbuffer
System
SCSI
DMA
Copy
Copy
Copy
DMA
buffer
bufferSystem
bufferSystem
Userbuffer
DMA
System
SCSI
DMA
Copy
Copy
Copy
DMA
DMA
bufferSystem User
buffer bufferSystem
buffer
SCSI
... ...
Dolly (server)
Copy Copy DMA
Network
Dolly (intermediate node)
Dolly (intermediate node)
Dolly (last node)
Copy Copy DMA
SCSI
DMA
DMA
Figure 6.7: Schematic data flow for a number of nodes running the Dolly client.
6.3 Experimental Evaluation of Partition Cast
In this section I provide measurements of partition casts in different logical topologies asdescribed in the previous section, with compressed and uncompressed partition images.The partition to be distributed to the target machines is a 2 GByte Windows NT partitionfrom a production OS installation. For measurements with compressed data streams,the image file is compressed with GNUgzip down to 1 GByte in size, resulting in acompression factor of 2. All the experiments were executed on the Patagonia cluster (seeSubsection4.1.2for details on the systems) except where otherwise noted.
The initial version of our partition-cast tool uses only existing OS services and there-fore applies a simplistic star-topology approach as described in Subsection6.2.2. It com-prises a NFS server which exports the partition images to all the clients. The clientsaccess the images over the network using NFS, possibly uncompressing the images andfinally writing the data to the target partition. The results of this experiment are shown inthe left chart in Figure6.8 (the execution time for each client machine is logged to showthe variability due to congestion). The figure shows two essential results: (1) The moreclients need to receive the data, the more time the distribution takes (resulting in a lowertotal bandwidth of the system). The bandwidth is limited by the edge capacity of theserver. (2) Compression helps to increase the bandwidth for a star topology. As the edgecapacity is the limiting factor, the nodes have enough CPU, memory and IO capacity leftto uncompress the incoming stream at full speed, thereby increasing the total bandwidthof the channel.
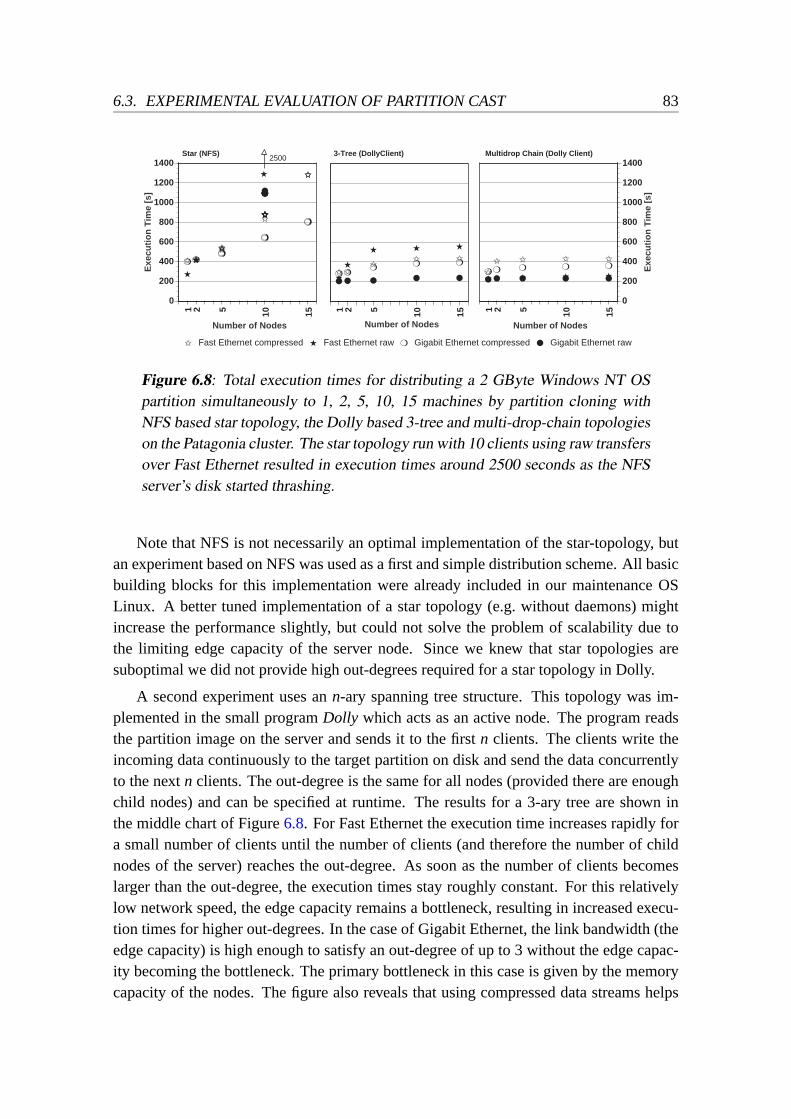
6.3. EXPERIMENTAL EVALUATION OF PARTITION CAST 83
✩
✩ ✩ ✩ ✩
� � � � �❍❍ ❍ ❍ ❍
� � � � �
0
200
400
600
800
1000
1200
1400
1 2 5 10 15
Exe
cuti
on
Tim
e [s
]
Number of Nodes
�
�
� � �
� � � � �✩ ✩
✩✩ ✩
❍❍❍ ❍ ❍
0 1 2 3 4 5 6 7 8 9 10 11 12 13 14 15 16
Number of Nodes
✩ ✩✩✩✩✩✩✩
✩✩✩✩✩✩✩✩✩✩
✩✩✩
�
��❍❍❍❍
❍❍
❍❍
����������
0
200
400
600
800
1000
1200
1400
1 2 5 10 15
Exe
cuti
on
Tim
e [s
]
Number of Nodes
✩ Fast Ethernet compressed � Fast Ethernet raw ❍ Gigabit Ethernet compressed � Gigabit Ethernet raw
�
2500Star (NFS) 3-Tree (DollyClient) Multidrop Chain (Dolly Client)
Figure 6.8: Total execution times for distributing a 2 GByte Windows NT OSpartition simultaneously to 1, 2, 5, 10, 15 machines by partition cloning withNFS based star topology, the Dolly based 3-tree and multi-drop-chain topologieson the Patagonia cluster. The star topology run with 10 clients using raw transfersover Fast Ethernet resulted in execution times around 2500 seconds as the NFSserver’s disk started thrashing.
Note that NFS is not necessarily an optimal implementation of the star-topology, butan experiment based on NFS was used as a first and simple distribution scheme. All basicbuilding blocks for this implementation were already included in our maintenance OSLinux. A better tuned implementation of a star topology (e.g. without daemons) mightincrease the performance slightly, but could not solve the problem of scalability due tothe limiting edge capacity of the server node. Since we knew that star topologies aresuboptimal we did not provide high out-degrees required for a star topology in Dolly.
A second experiment uses ann-ary spanning tree structure. This topology was im-plemented in the small programDolly which acts as an active node. The program readsthe partition image on the server and sends it to the firstn clients. The clients write theincoming data continuously to the target partition on disk and send the data concurrentlyto the nextn clients. The out-degree is the same for all nodes (provided there are enoughchild nodes) and can be specified at runtime. The results for a 3-ary tree are shown inthe middle chart of Figure6.8. For Fast Ethernet the execution time increases rapidly fora small number of clients until the number of clients (and therefore the number of childnodes of the server) reaches the out-degree. As soon as the number of clients becomeslarger than the out-degree, the execution times stay roughly constant. For this relativelylow network speed, the edge capacity remains a bottleneck, resulting in increased execu-tion times for higher out-degrees. In the case of Gigabit Ethernet, the link bandwidth (theedge capacity) is high enough to satisfy an out-degree of up to 3 without the edge capac-ity becoming the bottleneck. The primary bottleneck in this case is given by the memorycapacity of the nodes. The figure also reveals that using compressed data streams helps

84 Chapter 6: Data Casting
for the slower Fast Ethernet, because more data can be transfered over the limiting link.For Gigabit Ethernet, compression increases the execution time due to its strong impacton the CPU and the memory subsystem.
For the third experiment I use Dolly to cast the partition using a multi-drop chain.The results are shown in the right chart of Figure6.8. The times measured indicate indi-cate that the execution time for this partition cast is nearly independent of the number ofclients. This independence results from the fact that in a multi-drop–chain configuration,the edge capacity is no longer a bottleneck as every edge carries at most one stream. Thenew bottleneck is the nodes’ memory system. The memory bottleneck also explains whycompression results in a lower bandwidth for the channel (decompressing data requiresmore memory copy operations in UNIX pipes from/to the gunzip process). The only limitto the scalability of the multi-drop–chain setup is the backplane capacity of the switch.
��
�
�
�
�
��
�
�
�
�
��
�
�
�
���
�
�
�
❍❍❍
❍ ❍ ❍
✩✩✩ ✩ ✩ ✩
0
20
40
60
80
100
120
140
160
180
1 5 10 15 20
Ag
gre
gat
e B
and
wid
th [
MB
yte/
s]
Number of Nodes
�Gigabit Ethernetmulti-drop/raw
�Fast Ethernetmulti-drop/raw
�Gigabit Ethernetspanning tree/raw
�Fast Ethernetspanning tree/raw
❍Gigabit Ethernetstar/compressed
✩Fast Ethernetstar/compressed
Theo
retic
al li
mit
(dis
k sp
eed)
Figure 6.9: Total (aggregate) throughputs achieved in distributing a 2 GByteWindows NT Operating System partition simultaneously to a number of hostsby partition cloning in the Patagonia cluster.
Figure6.9shows the total, aggregate bandwidth of data transfers to all disk drives inthe system with the three experiments. The figure indicates that the aggregate bandwidthof the NFS-approach increases only modestly with the number of clients while the multi-drop chain scales perfectly. The 3-ary-tree approach also scales linearly, but increases ata lower rate on Fast Ethernet because the link bandwidth is shared between three streams.The numbers for the NFS approach clearly max out with the transfer bandwidth of theserver’s network interface reaching the edge capacity: Our NFS-server can deliver a max-imum of about 20 MByte/s over Gigabit Ethernet and about 10 MByte/s over Fast Ethernet(note that we are using compressed data for the NFS approach in the above figure therebydoubling the bandwidth).
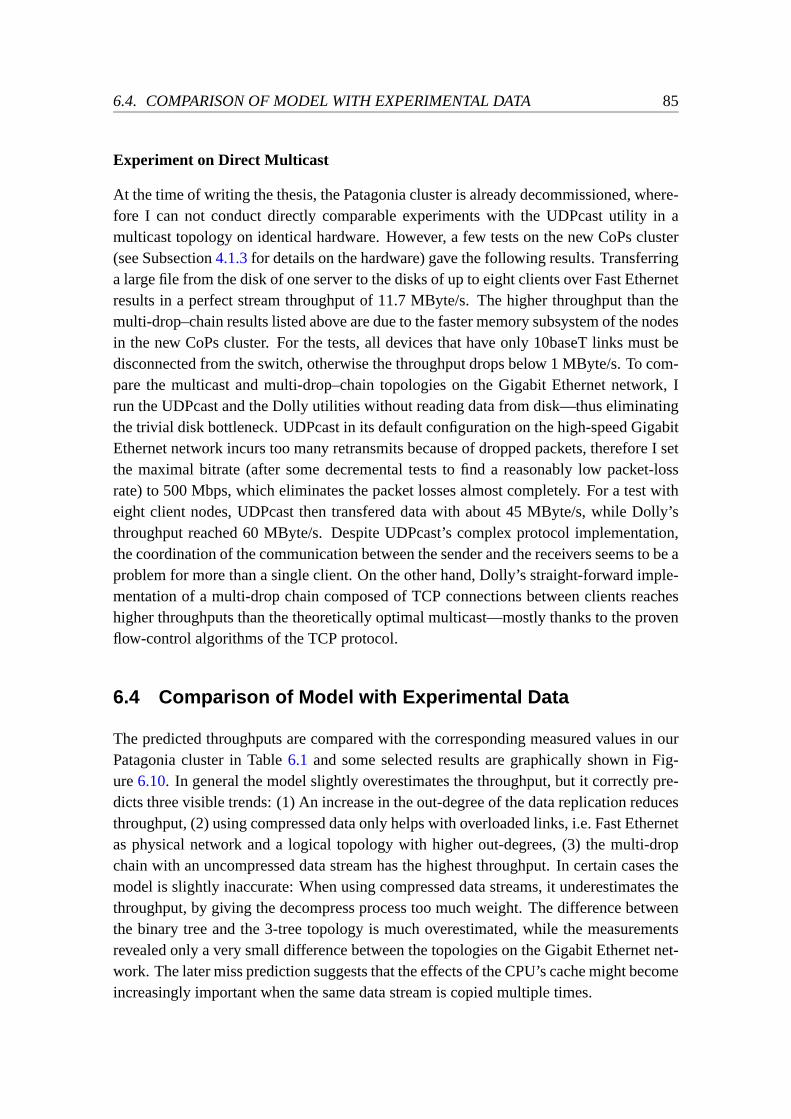
6.4. COMPARISON OF MODEL WITH EXPERIMENTAL DATA 85
Experiment on Direct Multicast
At the time of writing the thesis, the Patagonia cluster is already decommissioned, where-fore I can not conduct directly comparable experiments with the UDPcast utility in amulticast topology on identical hardware. However, a few tests on the new CoPs cluster(see Subsection4.1.3for details on the hardware) gave the following results. Transferringa large file from the disk of one server to the disks of up to eight clients over Fast Ethernetresults in a perfect stream throughput of 11.7 MByte/s. The higher throughput than themulti-drop–chain results listed above are due to the faster memory subsystem of the nodesin the new CoPs cluster. For the tests, all devices that have only 10baseT links must bedisconnected from the switch, otherwise the throughput drops below 1 MByte/s. To com-pare the multicast and multi-drop–chain topologies on the Gigabit Ethernet network, Irun the UDPcast and the Dolly utilities without reading data from disk—thus eliminatingthe trivial disk bottleneck. UDPcast in its default configuration on the high-speed GigabitEthernet network incurs too many retransmits because of dropped packets, therefore I setthe maximal bitrate (after some decremental tests to find a reasonably low packet-lossrate) to 500 Mbps, which eliminates the packet losses almost completely. For a test witheight client nodes, UDPcast then transfered data with about 45 MByte/s, while Dolly’sthroughput reached 60 MByte/s. Despite UDPcast’s complex protocol implementation,the coordination of the communication between the sender and the receivers seems to be aproblem for more than a single client. On the other hand, Dolly’s straight-forward imple-mentation of a multi-drop chain composed of TCP connections between clients reacheshigher throughputs than the theoretically optimal multicast—mostly thanks to the provenflow-control algorithms of the TCP protocol.
6.4 Comparison of Model with Experimental Data
The predicted throughputs are compared with the corresponding measured values in ourPatagonia cluster in Table6.1 and some selected results are graphically shown in Fig-ure6.10. In general the model slightly overestimates the throughput, but it correctly pre-dicts three visible trends: (1) An increase in the out-degree of the data replication reducesthroughput, (2) using compressed data only helps with overloaded links, i.e. Fast Ethernetas physical network and a logical topology with higher out-degrees, (3) the multi-dropchain with an uncompressed data stream has the highest throughput. In certain cases themodel is slightly inaccurate: When using compressed data streams, it underestimates thethroughput, by giving the decompress process too much weight. The difference betweenthe binary tree and the 3-tree topology is much overestimated, while the measurementsrevealed only a very small difference between the topologies on the Gigabit Ethernet net-work. The later miss prediction suggests that the effects of the CPU’s cache might becomeincreasingly important when the same data stream is copied multiple times.

86 Chapter 6: Data Casting
In the future, the processing speed of CPUs will continue to improve drastically, whilethe difference in the speed of caches and RAMs will increase. Since our model doesnot include caches, any data transfers that make use of the cache will inevitably leadto inaccurate predictions of the model. Cache effects are hard to predict, because theydepend on the parameters of the cache as well as on the order of the data transfers—which in turn may depend on the OS.
Network Fast Ethernet Thr. Gigabit Ethernet Thr.Out- Com- Extended Mea- Extended Mea-
Topology Degree pression Model sured Model sured
Chain 1 no 12.5 8.8 12.6 9.0Chain 1 yes 3.9 4.9 3.9 6.12-Tree 2 no 6.3 5.4 9.3 8.23-Tree 3 no 4.2 3.8 7.4 8.0Star 5 no 2.5 2.3 5.3 6.3Star 5 yes 3.0 3.6 3.0 4.1
Table 6.1: Predicted and measured throughputs (Thr.) for a partition cast with a multi-drop–chain (Chain) topology, different tree topologies and the star topology for uncom-pressed and compressed data streams. All values are given in MByte/s.
After we put our new CoPs cluster into service, I did a re-measurement on this newhardware to assess the predictive power of the model. A microbenchmark [KS98, KS]measured the memory-copy bandwidth at 200 MByte/s, while the TCP-transfer band-width with the Linux-kernel version 2.4.1 is about 110 MByte/s. Using these numbersour model predicts a multi-drop–chain throughput of 25.4 MByte/s, while the measure-ment showed that the measured throughput is 26 MByte/s and falls within the range of afew MByte/s.
One might argue that the model is rather imprecise since some of its predictions areoff by about one fifth of the throughput. However, the accuracy of an analytic modeldepends largely upon its complexity. A higher accuracy comes at the price of a highercomplexity, which makes the model harder to use and increases the feedback loop duringthe design of new systems. Our comparatively simple model helps to get a sense for theperformance of a system without having to know every detail of the implementation andthe underlying subsystems. Its simplicity and small feedback loop help to quickly locatebottlenecks and guide the design of new systems towards their optimum. It is easy to usein practice while still correctly predicting important performance trends.
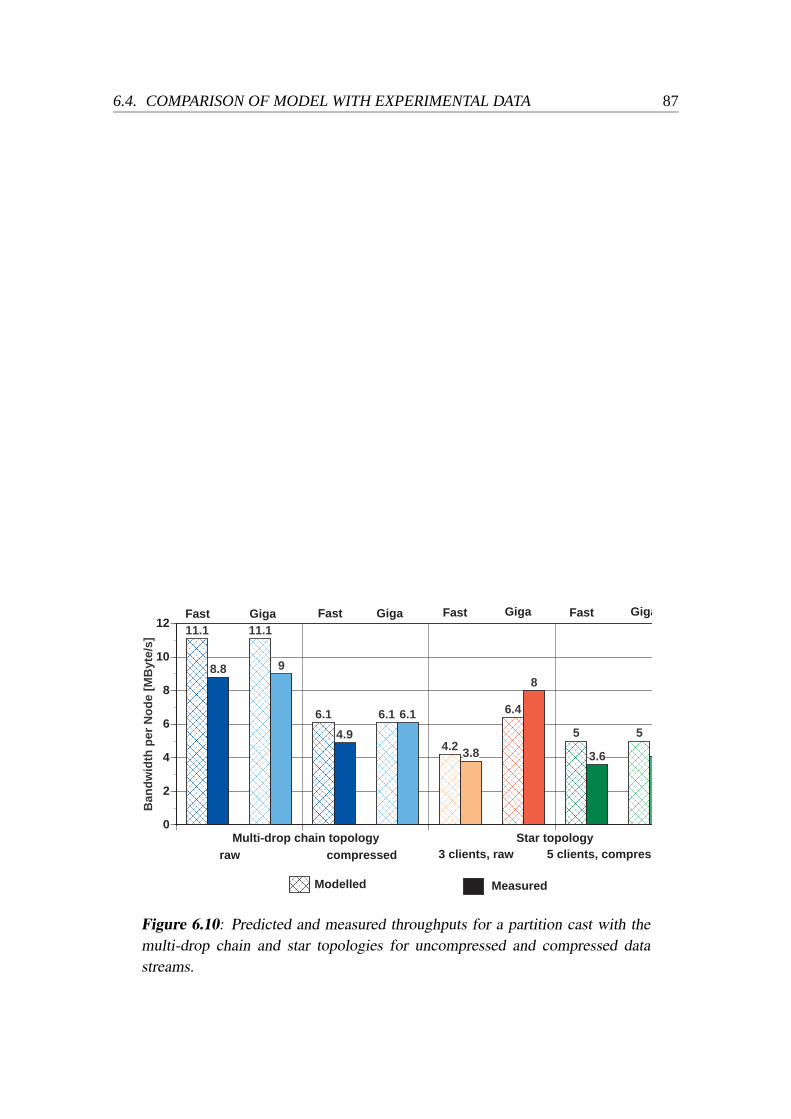
6.4. COMPARISON OF MODEL WITH EXPERIMENTAL DATA 87
0
2
4
6
8
10
12
Ban
dw
idth
per
No
de
[MB
yte/
s]
11.1
8.8
11.1
9
6.1
4.9
6.1 6.1
4.2 3.8
6.4
8
5
3.6
54
Fast Fast Fast FastGiga GigaGigaGiga
Multi-drop chain topologyraw compressed
Star topology3 clients, raw 5 clients, compress
Modelled Measured
Figure 6.10: Predicted and measured throughputs for a partition cast with themulti-drop chain and star topologies for uncompressed and compressed datastreams.
88 Chapter 6: Data Casting
6.5 Summary and Conclusions
Data casting is an important operation to replicate OS installations onto the many nodesof a multi-use cluster. While it is obvious that the operation should be done as quicklyas possible to minimise downtime, it is much less evident what kind of setup gives thehighest throughput. Possible tradeoffs include the topology of the data stream or the useof compression to reduce the amount of transfered data.
In a second section I discuss several different implementations of data cast. A seem-ingly promising idea is the use of a reliable multicast protocol on top of IP multicast, as itwould theoretically allow to make best use of the available network resources by lettingthe switches distribute the data stream. The second implementation bases on the star-topology and uses readily available tools and a NFS server to distribute partition imagesto the client nodes. Because the server needs to send the data over its network interfacefor every single client, my model from Chapter5 predicts non-scalability. To limit thenumber of streams that pass through the server’s network interface, a third approach usesthe tree-topology. My cloning toolDolly distributes data in such a setup. The model pre-dicts an even better scalability for the multi-drop–chain topology, where every edge of thenetwork is crossed by at most one stream per direction and every node has no more thanone incoming and one outgoing data stream. This topology is implemented by the Dollytool too, and the model predicts high scalability.
The experimental evaluation of the different implementations of partition cast revealsthat in fact, the execution time for a cloning operation using the star-topology and NFSis highly dependant on the number of clients. Execution times for the tree-topology onlyincrease until the number of client nodes exceeds the specified out-degree. After thatpoint is reached, the approach scales well. Best scalability is achieved with the multi-drop chain since it is completely independent of the number of nodes. Measurementswith the UDPcast tool—which implements a reliable multicast protocol—indicate thatthe flow control between a single sender and many receivers is a rather difficult task thatis best done with constant bit rates, thus losing flexibility and adaptability.
A comparison of the model’s prediction and the results of the measurements indicatethat, while the model is certainly not perfect, it correctly predicts three trends: (1) Higherout-degrees yield lower throughputs, (2) data compression is only worthwhile for linkswith highly reduced bandwidths, (3) the uncompressed multi-drop chain offers the highestthroughput rates. On the other hand, the throughput of compressed data is underestimatedby the model, while the difference in throughput between similar out-degrees is much lessthan predicted by the model.
The resulting partition-casting tool is capable of transferring a 2 GByte Windows NToperating system installation to 24 workstations in less than 5 minutes while transferringdata at a sustained rate of about 9 MByte/s per node through a multi-drop chain. Fast par-tition cast permits the distribution of entire installations in a short time, adding flexibility

6.5. SUMMARY AND CONCLUSIONS 89
to a multi-use cluster of PCs to do different tasks at different times. A setup for efficientdata cast also results in easier maintenance and enhances the robustness against slowlydegrading software installations in a PC cluster.


7Efficient Data Storage for OS
Installations in Clusters
For goals and tasks, which we recognised as worthwhile and valuable,we can exert ourselves substantially more efficiently
than for those, whose value we suspectonly vaguely or even doubt.
Ulrike Brommer
As Multi-use clusters of commodity PCs are used with different OS installations andenvironments, they usually store a copy of more than one commodity OS installation oneach node. The management and maintenance of all the installations on the nodes is achallenging task, not only because of the different requirements, installation and updateprocedures of the different OSs, but also because of the vast amount of partially replicateddata that must be archived. An interesting question is how to store these huge data setsefficiently, considering that the data sets of different versions and customisations of OSinstallations in clusters of PCs potentially contain much redundant data. In this chapter Iwill present some different solutions for efficient storage of these large data sets, introduceblock repositories as my solution to the problem, discuss the different approaches andevaluate them.
7.1 Introduction and Related Work
In this section I will first describe in more detail the problems with the maintenance ofcurrent commodity OSs in multi-use clusters, after which I discuss related work and thelimitations that come with many commercial products. While dependable OS mainte-nance is quite important in a cluster that is used by many different users or user groups,the fundamental problem also appears in other applications that use large data sets thatevolve over time, or have otherwise relatively small differences.
91

92 Chapter 7: Efficient Data Storage for OS Installations in Clusters
7.1.1 The Problem of Software Maintenance
The different usage modes (production, training, experimentation) and the different OSs(Linux, Windows NT, Oberon) in multi-use clusters greatly complicate software mainte-nance. Typically software maintenance for these large clusters of PCs or corporate fleetsof PCs is done with OS specific tools, e.g. a variety of utilities specifically written for Win-dows NT. The three different OS families in our Patagonia cluster run on three differentrelease schedules. The compatibility of OS dependent tools with future releases would beextremely hard to guarantee resulting in a unstable system. Furthermore we have to dealwith increasingly error-prone software and complicated installation processes that can infact have unexpected influence on so-called preference settings or on other parts of soft-ware configuration state. De-installation of software is even worse and some systems cannever be brought back to their initial state without a re-installation from the beginning.
To overcome the drawbacks and deficiencies of highly specialised and complex main-tenance tools on the market, I raise some fundamental questions and require that ourmaintenance tools remain completely OS independent. Such a viewpoint will mandateand enforce that there are clean abstractions of a partition with an installed software sys-tem in terms of bootable partition, visible partitions and configuration state of a partition.All maintenance operations such as archive, restore, upgrade or replication of releases andpersonalisation or customisation (i.e. single licence installations or custom drivers) mustbe achievable without knowledge of the file-system formats or the configuration files ofthe system-software installation. Last but not least the method of storing and archivingsoftware installations should be as efficient as possible, i.e. there can be no waste of stor-age space in a partition archive.
For the improved cluster maintenance mechanisms investigated in this chapter we usea minimal Linux [Onl99] installation on all the cluster nodes to control all setup opera-tions. This maintenance OS can be booted remotely for maintenance tasks. While theconcepts of our approach by themselves are remarkably simple, the viability is deter-mined entirely by performance aspects of software replication and the storage efficiencyof keeping a fair number of incremental OS images in our partition repository and fastreplication across the network. The optimal setup and the performance of software repli-cation (cloning) in large clusters of PCs is described in Chapters5 and6.
Partitions are distributed out of our repository by a simple tool calledDolly, com-prising a small server and a very thin client of roughly 2000 lines of code. Dolly linksthe nodes together in a TCP-based multi-drop chain, and is able to distribute data to alldisks in the cluster in a short time over classic, Fast or Gigabit Ethernet independent ofthe number of nodes. This gives us full control over how the partitions are distributed andinstalled on a multi-use cluster.
While the archiving of all recently installed OS images offers the advantage of goingback in time and being able to correct errors made during an installation processes, it
7.1. INTRODUCTION AND RELATED WORK 93
could require a tremendous amount of storage space to store the images, if done naively.Therefore we createdpartition repositories, a technique to archive and restore softwareinstallations as partitions with a full base image and incremental changes. Most com-mercial tools can replicate partition images by ignoring the specifics of the different OSsor store configured OS installations incrementally using the different file systems of thetarget OS, but so far we have not encountered one that can do both with reasonable effi-ciency. The partition repository proposed and implemented works in an incremental andcompletely OS independent manner and can store the different steps of a system installa-tion efficiently. In the evaluation section I present empirical evidence that this approach isfully usable and I quantify the size of the different partition images and their incrementalchanges based on the example installations encountered in our Patagonia cluster at ETHZurich. The partition-repository maintenance system runs with Linux and does not de-pend on any proprietary knowledge of the target OS or file system. It is simple and builtcompletely from open source software, which makes it perfectly suited for a distributionunder an open source licence itself.
7.1.2 Related Work and Limitation of Commercial Products
One of the major challenges for educational system administrators and managers of cor-porate PC fleets is the constant need to maintain consistency in their distributed systeminstallation, as users or students are continuously changing configurations or adding pro-grams. As educational clusters often comprise a large number of identical machines, diskcloning of a master machine has been used for years but was always used in conjuctionwith OS specific tools. The brute force method of disk cloning is gaining more and moreacceptance in the business world as a technique for software distribution and maintenance.The principal remaining problem with cloning maintenance is the large amount of datarequired to store the different OS installations and incremental versions, especially oncemultiple OSs are used on the same set of machines in a cluster. This problem is addressedin this chapter.
A previous study in this area by Hutchinson et. al. [HMF+99] compares the speedof physical vs. logical backups of secondary storage devices to tertiary storage, i.e. fromhard disks to tape drives. The authors use a different terminology and misleadingly de-note logical backups (i.e. filewise backups) as OS independent, because the files couldbe restored on any operating system. Our naming scheme is different: We call physicalbackups (i.e. blockwise backups) OS independent, as no knowledge of the underlyingfile-system structure is needed to process backup and restore operations. In contrast tological backups, physical backups therefore work for any file system and any OS imageinstalled in that partition.

94 Chapter 7: Efficient Data Storage for OS Installations in Clusters
The basic idea of disk or partition cloning is not new and in fact there are already a fewsuccessful products available such asNorton Ghost1 [Cor98], ImageCast2 or DriveIm-agePro3. All these tools are capable of replicating a whole disk or individual partitionsand of generating compressed image files to store the partition data. Unfortunately thosecommercial tools are largely OS and file-system dependent. They use knowledge of theinstalled OSs and file systems to provide additional services such as resizing partitions,installing individual software packages and performing post-clone customisations such ase.g., the change of TCP/IP settings. Their operation is therefore limited to the OS versionssupported by the tool. Some of the tools do include some functionality of blind disk-copyoperation, but those are unable to work with efficient storage techniques.
Other tools developed and used by system administrators use similar techniques: Thetools described in [Rid94] and [SMH95] use full partition images ordumpfiles for backupand restore. The approach withdump uses less storage space as it just stores files, whilethe partition image superfluously includes unused parts of the partitions. Customisationsare performed with shell scripts or by copying modified files from a second local hard-diskdrive. A more advanced approach presented in [Rud97] uses a revision control system forfile systems (fsrcs). It stores changed files for each revision of the system installation in afile tree. This approach also saves disk space but requires knowledge about the underlyingfile system to access the files.
Frisbee is another tool for disk imaging and is described in [HSL+03]. It compressesdisk images by looking at the file-system type and skipping all unallocated blocks forknown file-system types. For unknown file systems, all blocks are marked as allocated,thus keeping file-system independence. Frisbee then simply compresses the disk imagesinto individual 1-MByte chunks that can be read at random for later replication in thecluster. There is no optimisation between identical blocks or chunks of different disk im-ages. Work described in [SCP+02] tries to optimise the migration of virtual computers,so calledcapsules. The authors try to minimise the time to transfer a capsule (i.e. the cap-sule’s blocks) between different locations as the capsule migrates (e.g. between a user’sworkplace and home). The reduction in capsules’ transfer times is done by calculatinghashes on all data blocks (in memory and on disk) and migrating only the blocks that arerequired but not present at the current location of the capsule.
To the best of my knowledge our approach with cloning installations out of an in-cremental partition repository remains the only solution that istruly OS independent byworking with raw disk-partition installations. Images are stored in a block repository,where compressed raw disk blocks are administered. Modern OSs can be set up for au-tomatic installation and customisation, e.g. network settings can be initialised by DHCPbased on the unique address in the Ethernet adapter. Further post-cloning configurations
1Norton Ghost, Symantec,http://www.symantec.com/2ImageCast, Innovative Software Ltd.,http://www.innovativesoftware.com/3DriveImagePro, PowerQuest,http://www.powerquest.com/

7.1. INTRODUCTION AND RELATED WORK 95
(as e.g. setting a new SID for Windows NT or individual licence keys for applicationsoftware) can be performed by scripts at startup.
7.1.3 Partition Cloning for Efficient Distribution
This section contains the most important details about the cloning system that is closelyrelated to our experimental investigation of partition repositories. An analytic model pre-dicting cloning performance is presented in Chapter5 and performance measurements onthe implemented system is described in Chapter6.
First I need to define the terminology more precisely: The process of storing thecontents of a disk or partition to an image file is called abackup. The action in reverse,writing an image to a partition is called arestore. In my definition, a restore includesthe installation on a previously empty, unused or broken partition, as well as the upgradeof an image on an existing installation. The process of backing up an image from onemachine and then (later or at the same time) restoring to one or many other machines iscalledcloning.
A somewhat simplistic approach (which is described in detail in Subsection6.2.2)relies on a standard networked file system (e.g. NFS) to backup a whole disk or partition4.The machine with the partition to be backed up simply copies its content to an NFSfile system exported from a server holding the collection of images. The image can becompressed on the client side to save some storage space. For a restore, all the clientsinvolved will read the (compressed) partition image simultaneously over the network fromthe NFS server, possibly uncompress it and write the data to the local disk. This approachis simple, highly robust and most OSs include all software functions needed. The methodhas the disadvantages that it does not scale beyond very few clients (see Section6.3) andthat it does not have much room for improvements as each image is stored in one file andserved from 1 server ton clients.
In a more sophisticated approach as described in detail in Subsection6.2.4, the backupprocess can be done exactly as in the first approach or alternatively the master machine tobe cloned can also be used directly as server to the clients. The second step for the restoreoperation is different: The distribution of the partition image for the restore operation isaccomplished using a virtual TCP multi-drop chain with the dedicated client. The advan-tages of this approach are scalability and flexibility: The overall system performance islimited solely by the performance of a client, not the server, and therefore scales perfectlyeven for a large number of clients.
In the basicDolly partition-cloning framework the partitions are best transfered as asequence of uncompressed consecutive blocks. In the next section, I argue that it is worth-
4The termsdisk andpartition can be used interchangeably in this context. While this is not strictlytechnically correct, they are handled in exactly the same way in our system. Therefore we will use the termpartition from now on.

96 Chapter 7: Efficient Data Storage for OS Installations in Clusters
while to change this to a sequence of (not necessarily consecutive) blocks and a pairedarray of disk-block numbers and image blocks. With some more advanced schemes, wemanage to transfer only unique blocks, saving much storage space and work in incremen-tal installations. During the search for the best data representation we discovered thatthere is a systematic structure to the various partition images that are used to maintain acluster installation. The next section analyzes this structure.
7.2 Characteristics of Data Evolution
Software installations arenot done in one single, atomic step without ever changing themagain. The installation and maintenance of an OS remains an evolutionary and ratherincremental process. Because of the changing nature and complexity of todays OS instal-lations, it would be desirable to have some sort of version control for the incremental stepsas this is the case with software development. For software development it is a commonpractice that developers check out a stable part of the software being developed from arepository, improve or change it and check it back into the repository. If at a later timea bug is found, all old versions are still available, as every single version can be fullyretrieved from the repository as a snapshot. Since there can be a potentially large numberof incremental steps in the lifetime of a software development project, it is not efficientto save all full revisions of the software in the repository. The repository therefore storesonly the differencesbetween each version. As I will show, the same can be done withsoftware installations in hard-disk partitions. In Figure7.1 I depict the typical structuralrelationships of an OS partition image. I explain that a cluster software installation experi-ences changes (due to version upgrades) along a temporal axis during its lifetime, as wellas changes along a spacial axis when replicated into a large number of PCs in a multi-usecluster and adapted to different clients and their hardware.
7.2.1 Temporal Differences
A common first step in OS installation and maintenance is to install the basic OS includingthe kernel and only the most common programs needed to run the system. In further stepsmore patches, service packs and additional software packages are installed. Later in thelife cycle new patches need to be applied or users demand the installation of new or theupgrading of existing software packages. This process is error-prone: Software-partsmight be installed in an incorrect order or might not work together, or a configurationoption might be badly chosen. For such cases it is extremely helpful if single installationsteps can be completely reversed by reverting back to the last working version of theinstallation without having to start from the beginning again.
Sometimes software is only temporarily installed on a cluster, e.g. for special classes,courses, experiments or tests, and removed soon after its use. Most packages provide

7.2. CHARACTERISTICS OF DATA EVOLUTION 97
Addition of newsoftware packages
Initial OSinstallation
patchService pack /
Temporaryinstallation
Localizedreplication
Time
Space
Localizedreplicationreplication
Personalized
Figure 7.1: Diagram showing the evolutionary steps of a typical software in-stallation. As software is added, changed or patched, the installation evolvesover time (downwards). Customised and personalised replications of the instal-lation on different machines are separated horizontally. An OS installation andmaintenance tool should capture changes in both directions.
de-installing options, but often these are not capable of reverting every change done tothe system during the installation of the package. These small remaining changes resultin a so-calledsoftware rotwhich makes the system as a whole unstable and increasinglydifficult to maintain.
The OS installation is therefore changing (and hopefully improving in quality andsecurity) all the time, but only at the price of high complexity.
7.2.2 Spacial Differences
Some software packages also require local changes or adaptions on the machines, suchas licence keys for commercial software or changes to the local configuration files or theMicrosoft Registry database. These are only small changes between the installations, butit might nevertheless be worthwhile to store those spacial differences: When a hard diskfails, the exact images for the partitions of that machine can be restored and no furtherconfiguration is required.
Since the original OS image and its copies on the nodes’ disks are bit-wise identical,some customising configuration steps must be taken to make them operational. In mostcases a freshly cloned OS cannot be brought to life with a simple booting process butrequires some customisation. We use a DHCP server on the same Ethernet segment toassign IP addresses and machine names based on the unique Ethernet MAC address builtinto the primary network interface of each node. Additional scripts are performed at boot

98 Chapter 7: Efficient Data Storage for OS Installations in Clusters
time to initialise further settings such as setting a unique SID, logging onto a domaincontroller for Windows NT or selecting the correct driver for the graphics card installed.
Another possibility for machine specific changes would be to usescripted installs.With this approach, a script does the local configurations and software installations au-tomatically after the initial OS is installed. Scripted installs have some disadvantageshowever: (1) They are OS dependent as the OS must support scripting languages and beconfigurable by scripts. (2) They are slow since the file system must be used. ([HMF+99]describes how the direct physical access of the disk is much faster than using the logicalfile system, and in Chapter6 I show that fast network-based installations on clusters arein fact possible with raw disk accesses). (3) The removal of software packages with ascript is not as clean as restoring exactly the same installation. Most OS manufacturersrecommend scripted installs from an original CD ROM distribution and force the userto become OS dependent. Our techniques are truly OS independent and will thereforework for future releases of Linux and Windows. Once some form of auto configuration atstartup time can be worked out, a replication to hundreds of PCs is easily possible. How-ever, auto configuration and fully floating licences are not always possible. With futureOSs it is well conceivable that a fully automatic configuration can still not be worked outand manual intervention becomes necessary. Therefore the partition repository techniqueallows the storage of fully customised images for each machine, and due to their efficientmanagement of differences, can do so without exceeding the storage budget. Since parti-tion repositories are oblivious to the file system it does not matter if the application storesits customised licence key in a file, in the executable or in an entry of the central MicrosoftRegistry database. The disk-block based incremental imaging techniques will correctlyapply any changes upon a restore.
Abstraction of the installation state and a strict OS independence seems to be theonly viable approach to this maintenance problem since it is very hard to obtain properdocumentation about the configuration state of OSs and application programs.
7.3 Data Repositories for Incremental Data Evolution
The advantages of working with partitions in an OS independent way have been outlinedin the previous sections. Archiving customised and fully configured images and entiremaintenance histories of a large multi-use cluster of PCs as raw-image files requires a lotof storage space. Therefore most commercial tools revert to incremental storage in a filesystem or other dependent schemes for image maintenances.
I implemented a very different scheme for the storage of all information requiredto do software maintenance in a cluster. The implementation required many tradeoffsand design decisions, and therefore we need to quantify the storage requirement and thesavings of optimised storage techniques such as the deletion of zeroed blocks, image

7.3. DATA REPOSITORIES FOR INCREMENTAL DATA EVOLUTION 99
compression and an incremental storage method calledpartition repositorywith a fewtypical example installations.
Partition repositories work with partition images exclusively (no knowledge of thedifferent file systems is desired or required) and therefore the method is completely OSindependent. The software maintenance system will work with any future OS versionand any file system that is or will be used on our cluster of PCs. The system works atpartition level and at disk-device level. At disk-device level there are no restrictions onthe data layout of a disk and even non-standard formats, such as Oracle data disks, can bereplicated. At the partition level the system works with the standard partitioning systemof the cluster platform. Our system relies on the partition access facilities provided by theLinux maintenance OS.
7.3.1 Optimised Storage of Full Data Images
The most simple and obvious approach to manage different versions of installations is tostore the partition image of each new or upgraded OS installation in a file on a server. Tosave valuable disk space, the images can be compressed with a generic data compressionalgorithm such as Huffman or Lempel Ziv encoding—our tool uses thegzip utility fromGNU. According to our experience, partition images of moderately filled partitions can becompressed to roughly 50% of their original size, depending on the kind of data installedand the amount of free space in the partition. We occasionally use various file-systemdependent tools to “wipe” free space or to fill empty blocks with zeros after a complexinstallation. Such tools help to achieve better compression. As there is exactly one image-file per installation, archives and restores are simple to manage. On the other hand, a lotof disk space is wasted as most of the information in two incremental installations isidentical.
A B C D B E
A F C E B G
+ = 12 blocks of storage req
6 blocks in updated image
6 blocks in original image
X Block archived in repository
Figure 7.2: Example with two partition images archived as full data images.
Figure7.2 displays an example with two images that are archived according to thefull-image approach. In the figure, the two simplified partition images contain six blockseach. The characters in the disk blocks designate the content of the block—identicalcharacters stand for identical content. Even though there are some identical (and thusredundant) blocks, all twelve blocks are fully archived.

100 Chapter 7: Efficient Data Storage for OS Installations in Clusters
7.3.2 Storing Data Increments as Blockwise Diffs
A better and more advanced approach to capture at least some of the similarities betweentwo software-installation images is to store the full base image in a file for the first instal-lation. Subsequent installations are then generated by comparing the updated partition ona block-by-block basis. Only blocks which actually differ from previous reference imagesare stored in a so calleddiff-file. With this approach, the unchanged blocks are not storedtwice. Small changes in an installation can thus be archived quite efficiently.
X Block archived in repository
Block not in repository (redundant block)
Pointer to redundant block in repository
X
A F C E B G
EBDCBA+ = 9 blocks of storage req
6 blocks in original image
3 blocks in updated image
Figure 7.3: Example with two partition images archived as blockwise diffs.
The generation of the diff-files is simple: The old image file and the upgraded partitionare both read sequentially and each block is compared with the block at the same positionof the other input file. When two blocks differ, the block is written to the diff-file. Whenthe two blocks are identical, only the number of the block in the original image file iswritten to the diff-file, thus saving the space of an entire block. Figure7.3 illustrates theresult with the same example as before. Blocks that are identical and at the same positionsare not stored twice, resulting in an archive with nine blocks instead of twelve.
There are some cases that are not handled very well by this simple method: For someOSs, the removal and re-installation (probably with a partial update) of software pack-ages is a common operation. In this case, the program itself, some configuration files aswell as shared libraries, are frequently moved to other locations in the partition, but notnecessarily changed. For some file systems it is a common operation to defragment thestored files, which results primarily in moving data blocks around. Only some block anddirectory structures on the disk need actually to be changed. Another case are modernlog-structured file systems (see e.g. [RO91, SBMS93]) in which even unchanged blocksare frequently moved around by the cleaner to regain space in new empty segments. Thesechanges in location rather than content are not detected properly by the block-by-blockcompare.
7.3.3 Storing Data Increments in Block Repositories
My most sophisticated solution, the partition block repositories, overcomes the limitationof the two previous solutions and is fully enabled to detect the relocation of unchanged

7.3. DATA REPOSITORIES FOR INCREMENTAL DATA EVOLUTION 101
data during the difference calculation. It works by comparing all blocks of the base imageand incremental changes with each other and by storing only the unique blocks in ablockrepository. The result is that blocks are not stored again in the block repository if theywere just moved around during an upgrade or defragmenting process by a system admin-istrator or the cleaning process of a log-structured file system. A new differential imageonly contains pointers to the blocks to be found in the repository. Changed blocks not yetin the repository are stored and a pointer to them is inserted in the corresponding archivefile. This approach has the additional advantage that identical blocks in the same image(such as zeroed blocks or common identical font files, libraries, graphics or dictionariesfound in may software packages) will also be stored only once, resulting in improvedstorage efficiency.
5 blocks in original image
X Block archived in repository
Block not in repository (redundant block)X
A F C E B G
EBDCBA
2 blocks in updated image
+ = 7 blocks of storage req
Pointer to redundant block in repository
Figure 7.4: Example with two partition images archived in a block repository.
The same example as before, but with the archive organised as a block repository, isillustrated in Figure7.4. The block repository contains just unique blocks, there are nomore redundant blocks. Even inserting the original image alone into the block repositoryreduces the storage requirements.
The downside of this most advanced approach of storing software installations is thatcomparison of all blocks is an expensive operation, as each block of an image has to becompared with each block of the other image. However, there are some possibilities tospeed up the process. Instead of cross-comparing all the blocks, we speed up the pro-cess by generating hash tables over the contents of the blocks at runtime when comparingcompressed images. We then compare the hash-values in memory only. For collidinghash values, the blocks have to be compared in a second comparison pass, but the com-parison of images is nevertheless much faster than it would be with a naive approach. Thecomparison of two uncompressed Windows NT partitions of 2 GByte each takes about7 minutes on a high-end PC and requires a few hundred MByte of memory. The samecomparison with compressed images took less than 9 minutes.
This operation is done only once for each archived installation step and is not requiredfor the more frequent restores. Furthermore, it is still much smaller compared to the time

102 Chapter 7: Efficient Data Storage for OS Installations in Clusters
it usually takes to apply and test a system installation or upgrade, and it can easily be doneas a background process during the night, which makes it a reasonable effort.
7.4 Experimental Evaluation of Partition Repositories
For evaluating the different storage schemes we study a few partition-image series of realOS installations on our Patagonia multi-use cluster. The images studied are taken fromour server which ran the software maintenance system as described in Subsection7.3.1atthe time of the tests. Figure7.5 shows the evolutionary steps of the installations and thereplications to multiple PCs in our cluster.
Upgrade
Boot part. Maint. OS
Upgrade
Linux Localizationfor diff. hardware
Oberon
Upgrade Localizationfor diff. room
WinNT 1
Small upgrade
Localizationfor diff. clusters
Service pack inst.WinNT 2
SpaceTime
Figure 7.5: Evolutionary steps of the installations in Table 7.1 showing the tem-poral and spacial changes.
Table 7.1 lists the relevant storage requirements for a comparison of the differentmethods of storage and for an estimate of storage requirements to maintain all systemsoftware in a large and diverse multi-use cluster.
Installation Full images Blockwise diff Blockwise repositoryBase Incr. Total Base Incr. Total Base Incr. Total
Boot part. 16 16 32 16 (18kB) 16 14 (18kB) 14Maint. OS 205 205 410 205 0.3 205 195 0.3 195Linux 945 945 1890 945 12 957 844 6 850Oberon 106 2×10⁶ 318 106 25+22 153 28 10+2 40WinNT 1 2048 2×2048 6144 2048 35+430 2516 1893 22+280 2195WinNT 2 2048 2048 4096 2048 29 2077 1804 17 1821
Table 7.1: Comparison of the three presented approaches of storing incremental installa-tions for different production images in use on the Patagonia cluster. All numbers are inMByte except where otherwise noted.
In Table7.1 the different storage methods as described in Section7.3 are compared.For some installations we have a base installation and one incremental version available;other tests are done with two increments. With the blockwise-diff approach, the base-image size is equal to the partition size of the installation, while the blockwise-repositorybase is slightly smaller due to the detection of identical disk blocks. The listed diffs are

7.4. EXPERIMENTAL EVALUATION OF PARTITION REPOSITORIES 103
calculated between the first version and the second version of the installation or from thesecond version to the third one respectively. The listed installations have the followingcharacteristics: The first two installations are a very small boot partition, where only a mi-nor change was applied, and a maintenance OS (Linux in our case) which was slightly up-graded. The series of two subsequent Linux installations differ in a few configuration andkernel changes for slightly different hardware (amount of memory, processors, graphicand network cards), resulting in a few changed and a few relocated blocks. Oberon usesonly a small portion of its partition which results in a quite small partition repository. Thesecond upgrade is the installation of nearly the same system for slightly different hard-ware, resulting in mostly the same information at different locations on the disk. The fifthexample is a series of Windows NT installations starting with a baseline Windows NTinstallation followed by service pack installs. The second Windows NT installation is fortwo nearly identical PC clusters where only a few default settings (such as printers andboot scripts) have been changed.
Full Images BlockwiseDiffs
BlockRepositories
CompressedImages
CompressedDiffs
CompressedRepository
0
400
800
1200
1600
2000
2400
Siz
e [M
Byt
es]
Method of storage
Base Install Increment 1 Increment 2
Windows NT
Figure 7.6: Storage required for a successive Windows NT update path of threedifferent generations of installation steps from a base install to a fully updatedimage. The three presented methods of archival are shown, without compressionapplied in the left three cases and combined with compression in the right three.The blocksize used for the diffs and the repository is 1 KByte.
The different storage techniques for Windows NT and the Linux maintenance soft-ware installation series is examined in more detail in Figures7.6 and7.7 respectively.The above methods are combined with compression of the base archive as well as the

104 Chapter 7: Efficient Data Storage for OS Installations in Clusters
Full Images BlockwiseDiffs
BlockRepositories
CompressedImages
CompressedDiffs
CompressedRepository
0
50
100
150
200
250S
ize
[MB
ytes
]
Method of storage
Base Install Increment
Linux maintenance OS
Figure 7.7: Storage required for a successive Linux update path of two differ-ent generations from a base install to an updated image are examined for theLinux maintenance OS respectively. The three presented methods of archival areshown, without compression applied in the left three cases and combined withcompression in the right three. The blocksize used for the diffs and the repositoryis 1 KByte.
increments. The incremental archive approaches show a great potential in saving diskspace without knowledge of the underlying file system. The block repository successfullyreduces the required storage for the initial image as well as the updates in the uncom-pressed case. In the compressed case however, the initial block repository is larger thenthe compressed initial image files of the other techniques because the block repository iscompressed blockwise while the image files are compressed as a whole.
We then compare the storage requirements of our disk-block repository when in-stalling the same software package on different OSs with different file systems. Thesoftware package used for this experiment is Sun Microsystems’ StarOffice 5.1 which isavailable for both Microsoft Windows NT and Linux. The results shown in Table7.2andFigure7.8show that the block-repository technique works comparably well on both OSsand file systems. According to the installation documentation of the software, the pack-age requires 110–140 MByte of permanent disk space and around an additional 20 MByteduring the installation. The numbers in the table are higher because our tool also captureschanged entries in the directory and block-handling structures of the file system.
Another common operation in software-installation maintenance is the upgrading orpatching of the base OS or kernel respectively. We thus measure typical patch operations

7.4. EXPERIMENTAL EVALUATION OF PARTITION REPOSITORIES 105
Original Repository Increase afterStarOfficeInstallation
Increase afterService Patch/Kernel Upgrade
0
400
800
1200
1600
2000
Siz
e [M
Byt
es]
Windows NT Linux
Figure 7.8: Storage requirements in the repository for an incremental softwareupdate, i.e. installing the same new office package StarOffice 5.1and for up-grading or patching the base OS or kernel respectively on both Windows NT andLinux. The original images are 2 GByte large.
OS Part. Repository sizeInstallation Size Orig. img. Incr. after inst.
Windows NT 2048 1791 203Linux 2048 1535 209
Table 7.2: Storage requirements in the repository for installing the same office packageStarOffice 5.1on both Windows NT and Linux. The numbers are in MByte.
for Windows NT and Linux. On Windows NT we upgrade from Service Pack 4 to ServicePack 5, while on Linux we patch the kernel source tree on the machine from 2.2.14 to2.2.15, recompile and install the kernel. These two operations are not directly comparablebut show typical software maintenance tasks for the two OSs used in our Patagonia cluster.The results are depicted in Table7.3and Figure7.8.
In our next experiment we compare the installations on two identical machines whichhave been customised, again both for Windows NT and Linux. The Windows NT systemwas cloned, self-configured during the first bootup, and rebooted eventually as the newcustomised machine. For Linux there is no need for such a configuration step in ourinstallation, as completely identical images can be used (we use DHCP for setting the IPaddresses and hostnames, we do not have software with local licences and we use scripts

106 Chapter 7: Efficient Data Storage for OS Installations in Clusters
Repository sizeOS Part. Incr. after patchInstallation Size Orig. img. Abs. Perc.
Windows NT 2048 1791 106 5.9 %Linux 2048 1535 50 3.2 %
Table 7.3: Storage requirements in the repository for upgrading or patching the base OSor kernel respectively. The numbers are again in MByte.
Repository sizeOS Partition Increase after customisation # of inst.Installation Size Original Img. Absolute Relative to double
Windows NT 2048 1791 27 1.5 % 75Linux 2048 1535 9 0.5 % 227
Table 7.4: Storage requirements in the disk-block repository for customised replications.The numbers are in MByte except in the last column, which lists the number of customisedreplications that can be inserted in the repository before its size is twice as big as theuncompressed partition.
to detect and select the right graphic-card driver during bootup). The Linux numbers arederived by comparing two identical machines after they were only in light use for a fewweeks. The results are shown in Table7.4. The table’s last column shows the number ofcustomised partition images that can be inserted into the repository before the repositoryis twice as big as the uncompressed partition. This means that we can store 75 customisedWindows NT installations in a repository that has only twice the size of the partition.
A shortcoming of the blockwise-repository storage technique is that the fragmenta-tion into blocks adversely affects the compression rate since compression is now block-wise (instead of the whole image at once) so that individual blocks can later be accesseddirectly without first uncompressing the whole repository file. We examined the ratein more detail by comparing the raw size as well as the increase (diff size) of the un-compressed and compressed repository, after inserting a base installation as well as anupdated partition. We store the 205 MByte large maintenance-Linux base partition aswell as its 25 MByte incremental updated image in the repository and use varying blocksizes for the gzip compression algorithm to compare (diff) and compress the blocks. Theresults in Figure7.9 show that for increasing block sizes the uncompressed repositorysize increases due to the coarser granularity of difference detection. This increase in therepository’s size is because, for small changes, a larger block needs to be inserted into therepository. The compression algorithm, on the other hand, works better for larger block

7.4. EXPERIMENTAL EVALUATION OF PARTITION REPOSITORIES 107
� � � � � � �
��
� � � � �
512 1 K 2 K 4 K 8 K 16 K 24 K50
100
150
200
250
300
0
10
20
30
40
50
60
70
80
90
Siz
e of
rep
osito
ry/im
age
[MB
yte]
Com
pres
sion
rat
io [%
of o
rigin
al s
ize]
Block Size [Byte]
�Raw Image Size(200MB-192MB) �
Compressed Size(113MB to 66 MB)
Compressed ratio(59% to 30%)
� ��
� �� �
�
�� � � � �
512 1 K 2 K 4 K 8 K 16 K 24 K10
15
20
25
30
0
10
20
30
40
50
60
70
80
90
Siz
e of
rep
osito
ry/im
age
[MB
yte]
Com
pres
sion
rat
io [%
of o
rigin
al s
ize]
Block Size [Byte]
�Diff Image Size(21MB-25MB) �
Compressed Size(18MB to 12MB)
Compressed ratio(86% to 49%)
Figure 7.9: Comparison of disk space requirements depending on different blocksizes for the comparison (diff) and compression algorithm. The 205 MByteLinux maintenance partition is inserted alone in the upper figure, while in thelower figure, the first update is also inserted. In the upper case the absolute sizesof the uncompressed and compressed repositories are compared and the com-pression ratio is shown. The lower figure shows the same characteristics for anincremental partition image of 25 MByte as an uncompressed and compressedrepository after inserting the updated partition.

108 Chapter 7: Efficient Data Storage for OS Installations in Clusters
sizes. Larger blocks thus improve the compression factor. The results indicate that onemight reduce the disk space requirements considerably by using 16 KByte blocks andby optimally combining blockwise repositories to whole-image compression techniques.16 KByte seems to be optimal for the incremental image, since the compression algorithmshows little additional gains beyond 16 KByte and is offset by the loss in the accuracy ofdifference processing.
7.5 Summary and Conclusions
In this chapter I analyse the problem of software maintenance in large clusters of PCs. Ithink that our work applies to traditional clusters for scientific computing, novel clustersfor multimedia collaboration or even computers in a corporate fleet of PCs. Versatilityin the use of clusters and the rapid release schedule of different OSs in the commoditysoftware market require a cluster maintenance tool to use simple and clean abstractionsof the state comprised of system installation.
Therefore, I propose to build a software maintenance system for clusters based onthe storage and the distribution of entire partition images. The system thus does not de-pend on any operating system or file system. In the previous chapter I proposed to usemy cloning toolDolly for high-speed partition cloning and data distribution across thehigh-speed network of large multi-use clusters. In this chapter I investigated blockwisepartition repositories to address the storage problems associated with the partition main-tenance approach in large clusters of PCs. I clearly identify two reasons for a replicatedstorage of partitions: The temporal evolution of an OS installation following the releaseschedule for updates and the installations of additional middleware or application pack-ages, the individual configuration of images for heterogeneous hardware environment orfor network or licence key configurations.
The implementation of a block-based difference scheme demonstrates that we canreduce the storage needs for keeping a full software history based on partition imagesdrastically by storing increments of 1% up to 20% of the space that would be required tostore a full partition. A comparison between a release history of Windows NT and Linuxpartition on our multi-use cluster Patagonia does not reveal any fundamental differencebetween the two most popular cluster OSs and shows that our partition repositories workfor both OSs in the same way.
I also demonstrate that storing fully customised images for the different nodes in alarge cluster is relatively cheap. Since our Linux system offers complete network auto-configuration and none of the Linux Software packages rely on individual licence keysthe capability for customised replication is not as important for Linux as it is for Win-dows NT. For Windows NT my method can store up to 75 incremental customisations inthe space required by a typical 2 GByte OS installation. I hope that all future OSs willeventually migrate to full networked autoconfiguration, but we still appreciate a mainte-

7.5. SUMMARY AND CONCLUSIONS 109
nance system that offers a fallback solution. In my evaluation I carefully consider theinteraction between difference processing that works best at a fine granularity and datacompression that works best at large granularity. It appears that the best block size forblock partition repositories would be around 16 KByte.
Our software maintenance system based on high-speed partition cloning across thenetwork and highly efficient storage in partition repositories is at the stage of a highlymodular university prototype, and some parts of the system are already in daily use byour system administrators. It is based on simple ideas, and most software involved isavailable under an open-source license.


8Distributed File Systems vs.
Distributed Devices
To err is human.To forgive is beyond the scope of the operating system.
Unknown
The hard-disk drives of the nodes in multi-use clusters of commodity PCs contain avast amount of excess storage that should be used as part of a flexible distributed stor-age architecture. There are many distributed file systems and systems using distributeddevices, but accessing remote storage at high performance is still a challenging task. Ina first part of this chapter I describe and discuss architectures using distributed devicesand distributed file systems as a step towards a more flexible use of distributed storageresources. The description includes existing systems as well as our various own imple-mentations for both kinds of architectures.
One particular question about the flexible use of storage resources that I address in thischapter is whether we can provide an OS-based solution for clusters of commodity PCsthat is transparent enough to run a commodity database system—in direct competition tothe killer workstations that are well suited to run OLAP applications on top of commoditydatabase systems. I describe a workload for OLAP and use my model from Chapter5 topredict the performance for different experimental OLAP systems that handle the datadistribution on different layers. The different implementations evaluated and measuredcomprise a middleware solution to distribute queries, local disks, distributed devices anda distributed file system. Finally, I evaluate the systems in a series of experiments.
8.1 Introduction and Related Work
A multi-use cluster of commodity PCs typically has vast amounts of excess storage space,because hard-disk sizes continue to increase far beyond the capacity that is used by a typi-
111
112 Chapter 8: Distributed File Systems vs. Distributed Devices
cal OS installation. In Chapter2 I explain that the data interconnection network of a nodehas enough bandwidth to access these unused resources in the cluster. Large storage spaceon the disks of a multi-use cluster could well be used for non-mission–critical applicationslike e.g. emerging data warehouses. Data processing can be developed and tested on sparenodes of the cluster and larger runs can be conducted during the night on the whole multi-use cluster to get initial results. As the demand for data analysis increases—due to theincreasing benefits—additional resources can be added to the cluster.
Gathering the distributed storage on the cluster in a database leaves the question onwhich layer the distribution should be implemented, in other words: On which layerthe intelligence of the distribution should be located. I will thus discuss the layers thatwere previously mentioned in Section3.5for an implementation in a multi-use cluster ofcommodity PCs.
An implementation on the hardware layer means additional hardware (e.g. a SAN or aRAID controller), which is contrary to the basic idea of multi-use clusters of commodityPCs. Implementing the distribution on the device layer only needs changes to the devicedriver and is transparent to the upper layers. The implementation can make optimal useof the hardware, but is bound to a particular device and knows nothing about the layout ofthe transferred data, making data-oriented optimisations impossible. Since a device driverknows nothing about the upper layers in the system like e.g. the buffer cache, it can notensure data consistency across multiple nodes and should thus be used for read-only dataaccesses. An implementation on the file-system layer is independent of the underlyingdevice and can use knowledge about the layout of the data for optimisations. But a file-system implementation typically supports all essential features of a file system, therebyintroducing possibly unnecessary overhead. The file layer (not to be confused with thefile-system layer) implies that data files are copied in advance to the nodes processingthe data. All data processing is then done local to the nodes, which allows only smallerdata sets and poses no interesting questions regarding data gathering. Using middlewareto access the distributed data bypasses the file system and may thus allow further opti-misations, but introduces another layer into the system. There are multiple middlewarelayers possible in a real distributed database system: The DBMS itself is a middlewarebetween the application generating the queries and the OS that stores the data. The organ-isation of the data and the translation of the queries into read requests to the OS is doneby the DBMS middleware. Other middleware layers, which are important alternativesfor commercial DBMS that offer no possibilities for easy changes, are either below orabove the DBMS. Below the DBMS are certain distributed file systems that are actuallyimplemented as linkable libraries. Above the DBMS are middlewares that distribute thequeries generated by the application to other DBMSs. In any case, an implementationon the middleware layer is transparent and needs no changes to the application. Finally,an implementation on the application layer would allow to make use of the application’sinternal knowledge of the data structures and data accesses, which could be used for op-

8.1. INTRODUCTION AND RELATED WORK 113
timisations. On the other hand, such an implementation requires to change applicationsthat are not prepared to handle distributed data sets. Changing applications is not possiblefor commercial applications that do not come with source code.
The goal of this chapter is to compare different techniques—implemented on differentlayers of the system—for data gathering and to find out about their usefulness for emerg-ing applications with large data sizes on multi-use clusters of commodity PCs. Becausethe use of middleware for this application domain is already discussed in the literature,I will focus on the comparison of distributed file systems and distributed devices. Dis-tributed file systems are improving their usability and gaining acceptance in the clustercommunity worldwide. I will explore the possible performance benefits of dropping theunnecessary overhead of a full-featured distributed file system by using distributed de-vices for data gathering. Of course, distributed file systems are not always an “unneces-sary overhead”, but the specialised and limited application domain of data warehousingdoes not require all features of a fully-enabled distributed file system.
There has been a lot of work on distributed file systems. Most of the literature confinesitself to describe the design, implementation and performance of a single specific filesystem: The aged but very popular Network File System (NFS) from Sun Microsystemsis described in [SGK+85]. [HKM+88] describes AFS with client side caching. [HO93]describes a distributed file system that stripes the stream of a log-structured file systemto multiple remote servers. Swift/RAID is described in [LMC94] and offers additionalavailability features that reduce the performance of the distributed file system. [CAG+99]presents Trapeze, which uses custom Myrinet firmware and a block-I/O service to getgigabit-per-second performance on Myrinet networks. Many distributed file systems arecompared from a protocol perspective in [Bra99].
A scalable storage system that could be used to build a distributed file system on topof it is described in [HMS99]. [LTWH98] compares shared disks that are connected toa SAN and partitioned disks that are connected to the nodes off a LAN. The concept ofactive disks that support data analyses by executing certain application-specific codes onthe disk-resident processor is described in [AUS98].
A user-level library including a rich application interface, allowing the applicationto advertise access patterns, control caching and prefetching is described in [HER+95].In [CID02] an architecture for a cluster file system that is built on top of MPI-IO is pre-sented.
The Google File System (GFS) as described in [GGL03] uses commodity PCs to storevery large files that are mostly read sequentially. Since GFS is a primary data storage(as opposed to replicated data storage) for large numbers of servers, it has to deal withcomponent failures and must ensure availability of data at all times. Therefore, it storesmultiple replica of data chunks. To achieve higher performance, GFS provides its ownfile-system interface that does not provide a full standard POSIX API. GFS clients andservers are implemented in user space.

114 Chapter 8: Distributed File Systems vs. Distributed Devices
[DG92] explains why partitioned databases are better scalable than pipelined paralleldatabases. An installation of 100 PC nodes and an ATM network for data mining in alarge database is described in [TOK97].
I will discuss some other distributed file systems and distributed device systems inmore detail in the following Sections8.2and8.3.
8.2 Architectures Using Distributed Devices
A device driver is a piece of software that controls a hardware device and provides aninterface between the operating system and the controlled device. The device driver alsooffers device access to applications that need to directly control or access the device, ifthe applications process has the required permissions. There are many different kinds ofdevices, the most common ones are various disk-based devices (like for e.g. hard disks,floppy disks or CD-ROM drives), network interfaces, tape drives, printers, graphical dis-play units, and many more. As I discuss data distribution in this thesis, I will only describethe two most important devices to store and transfer data in clusters: The hard-disk drivesand network interfaces.
Hard-disk device drivers are so calledblock device drivers, because their smallestaccess unit is a disk block. A disk block is a directly addressable part of the hard diskdrive with a fixed size. Common sizes are 512 bytes, 1024 bytes or 4096 bytes (Linux forexample uses 512-byte blocks). The disk drivers need to handle data in blocks to keep theorganisational overhead low. These blocks are also the units that are transfered betweenthe device and the node’s adapter (for more details on the data transfer between deviceand node see Section5.6).
Device drivers for network interfaces control an adapter which is plugged into (orbuilt in) a node and connects to a certain type of network. These drivers arecharac-ter device driversand control the transfer of data packets between the network and thenode. Network transfers are usually streams of bytes (for connection-oriented transfers)or individual packets (for datagram-oriented transfers). Neither bytes not packets can beaddressed directly within a stream, which is the major difference between block devicedrivers and character device drivers.
A distributed device driveris similar to a regular block device driver, except that theactual hardware device may be connected to another node of the cluster. More specifically,a distributed device driver consists of two parts: One of them is on the client node wherean application wants to read or write data. This client part of the distributed device driveraccepts the request for data and forwards it to a remote node. On the remote node (aserver node) the server part of the distributed device driver receives the request for data,transforms and eventually forwards it to the driver that controls the actual device. Theserver part is therefore an interface between the NIC driver and the actual hardware driver(see Figure8.1).

8.2. ARCHITECTURES USING DISTRIBUTED DEVICES 115
bc
NICdriver
Distributed device driver(client part)
d a
NICdriver
Distributed device driver(server part)
Server node Client node
Application(s)
File system
Disk driver
File system
Disk driver
Application(s)
Operating system Operating system
Figure 8.1: Architecture of generic distributed devices.
Figure8.1 shows four different methods to access data for an application: It can di-rectly access the device driver (a). This method is used e.g. by the UNIX utilitydd to copydata to or from hard-disk drives at the lowest level or to copy data between disks and files(see Section6.2.2). Other uses of direct device access are database systems that preferto organise the placement of their data on the disk and the data accesses by themselves.The most common method is to use the file system to organise and access the data (b).This method is used implicitely when an applications reads data from a file which is ina locally mounted file system. The methods (d) and (c) correspond to (a) and (b) exceptthat they use remote devices of other nodes: (d) is a direct access to the remote device,which can be used for the same purposes as described above for (a). Remote devices canalso be mounted as local file systems (c) and used as if they were local.
The described setups (c) and (d) work fine as long as there is only one client or aslong as there are only read accesses. The data on the disks might become inconsistentwhen there are more clients doing read and write operations. Data consistency requirescoordination between the clients and servers. This coordination is not done by the dis-tributed device driver, because a driver should be kept simple and only control the flowof data from and to the device. Data consistency is handled in a higher layer like a realdistributed file system. This topic will be discussed in Section8.3.
8.2.1 Petal
Petal is a system that implements distributed virtual disks and is described in more detailin [LT96]. Distributed virtual disks are more advanced than distributed devices. Thesystem offers as sophisticated extensions single-component failure tolerance, transparentreconfiguration, load balancing and snapshots. The architecture of the system with onlyone server and one client node is shown in Figure8.2.
Petal uses different architectures for client and server nodes: On the client side thereis a kernel device driver which offers access to the virtual disks. The virtual disks are thenaccessed directly by applications or by a file system. The device driver uses UDP/IP to
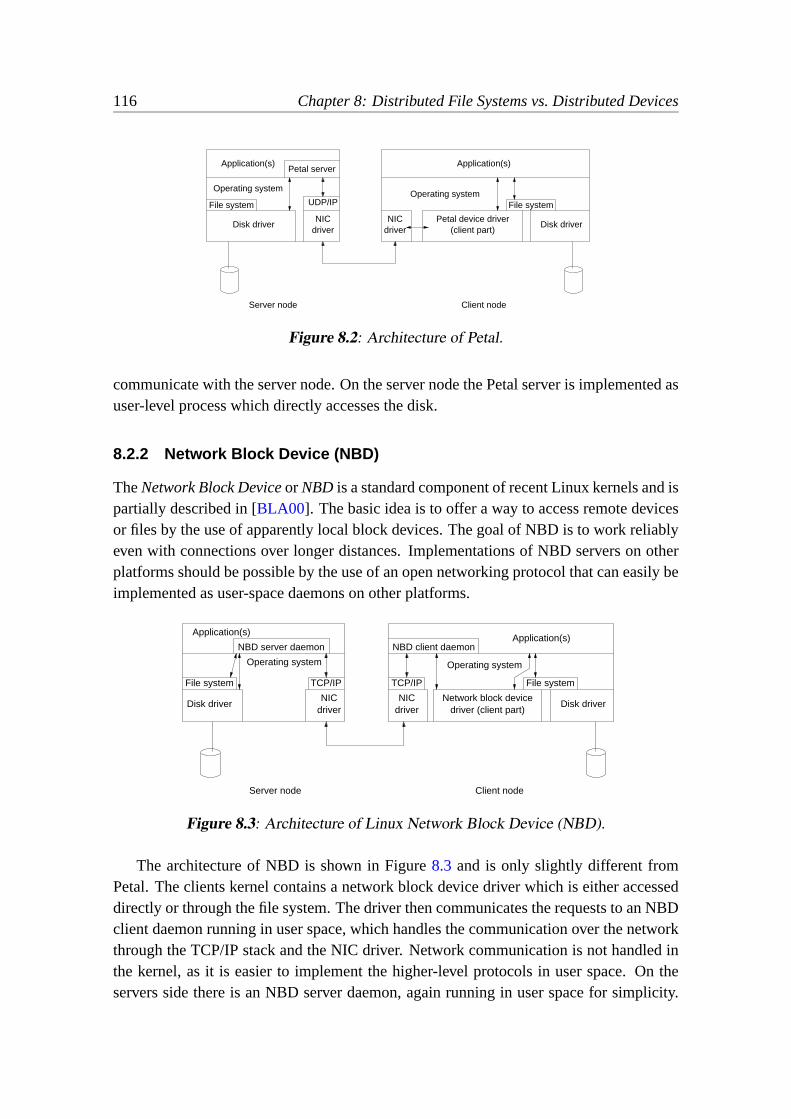
116 Chapter 8: Distributed File Systems vs. Distributed Devices
(client part)Petal device driver
UDP/IP
NICdriver
Application(s)
Disk driverNIC
driver
Server node Client node
File system
Disk driver
Operating systemFile system
Petal serverApplication(s)
Operating system
Figure 8.2: Architecture of Petal.
communicate with the server node. On the server node the Petal server is implemented asuser-level process which directly accesses the disk.
8.2.2 Network Block Device (NBD)
TheNetwork Block Deviceor NBD is a standard component of recent Linux kernels and ispartially described in [BLA00]. The basic idea is to offer a way to access remote devicesor files by the use of apparently local block devices. The goal of NBD is to work reliablyeven with connections over longer distances. Implementations of NBD servers on otherplatforms should be possible by the use of an open networking protocol that can easily beimplemented as user-space daemons on other platforms.
Server node Client node
Application(s)
NICdriver
NICdriver
Disk driver
File system
Disk driver
File system
NBD server daemon
Operating system
Network block devicedriver (client part)
Application(s)NBD client daemon
TCP/IPTCP/IP
Operating system
Figure 8.3: Architecture of Linux Network Block Device (NBD).
The architecture of NBD is shown in Figure8.3 and is only slightly different fromPetal. The clients kernel contains a network block device driver which is either accesseddirectly or through the file system. The driver then communicates the requests to an NBDclient daemon running in user space, which handles the communication over the networkthrough the TCP/IP stack and the NIC driver. Network communication is not handled inthe kernel, as it is easier to implement the higher-level protocols in user space. On theservers side there is an NBD server daemon, again running in user space for simplicity.

8.2. ARCHITECTURES USING DISTRIBUTED DEVICES 117
This daemon then accesses raw disk partitions or large files emulating partitions. The twodaemons use the TCP protocol for their communication, so they do not have to handlepacket loss, retransmission and congestion control.
8.2.3 Myrinet Distributed-Device System (MDDS)
TheMyrinet Distributed-Device Systemor MDDS is the prototype of a distributed-devicesystem. The evolution and many details of the experimental system developed at ourlaboratory are described in [Psa99, Fle99, Fle00]1. The main goal of MDDS was theoptimisation of the throughput using the special features offered by the hardware of theMyrinet NIC. Because of the close integration with the hardware, MDDS is highly systemspecific and not easily portable. I will first give an overview of the architecture, thendescribe some of the optimisations made possible by the Myrinet hardware and finallydescribe some of the problems we encountered.
(server part)MDFS driver
Server node Client node
Program (MCP)Myrinet Control
Disk driver
Application(s)
Disk driverProgram (MCP)Myrinet Control
Operating system Operating systemFile system
Application(s)
MDFS driver(client part)
Figure 8.4: Architecture of Myrinet Distributed-Device System (MDDS).
The architecture of MDDS is depicted in Figure8.4, again with only one server nodeand one client node. On the client node there is a device driver which can be accessed likeany other block device, either directly or through the file system. This block device drivercommunicates directly with the Myrinet NIC, which in turn handles the communicationwith the server node(s). On the server node(s) is the server-side MDDS device driver,which communicates directly with the Myrinet NIC and the OS’s disk I/O subsystem.In this design there is no need for a user-space daemon, and therefore no need for extracontext switches and boundary crossings between user space and kernel space.
More information about the Myrinet hardware can be found in [BFK+95, Myr]. TheNICs have their own processor (calledLANai) and memory on board, which allows toinstall and execute site-specific firmware on the processor—the so calledMyrinet ControlPrograms(MCPs). The Myrinet NICs have several DMA engines available to transferdata between the hosts’ PCI bus, the cards’ memory and the network links concurrently.
1These student projects were misleadingly named distributed file systems, but are really distributeddevice systems.
118 Chapter 8: Distributed File Systems vs. Distributed Devices
These features allowed to implement some optimisations for high-throughput data trans-fers that I will describe in the next paragraph.
On the client side we tried to reduce memory accesses as much as possible to reducethe load on the memory subsystem. This load reduction was achieved by putting someintelligence in the MCP. The MCP does all the network protocol processing. While theprotocol was deliberately kept simple, it still took off some of the load from the hostsCPU. The intelligent MCP also knows the addresses of the blocks in the host’s mainmemory buffer to directly deposit incoming data packets at their final addresses. The di-rect deposit reduces the required copy operations to be done by the host’s CPU to one:To cross the boundary between the OS and the user space. This last copy could be elim-inated by directly transferring the data to the user-space process’ read buffer. However,this last optimisation would require quite some tricky changes in the virtual memory sub-system and could lead to races e.g. if the process’ page containing the read buffer wereswapped out. The MCPs on both the client and the server(s) pipeline the DMA transfersbetween the Myrinet network and the host’s memory to exploit the bandwidth offered bythe network as much as possible [Vin98]. As an optimisation on the server node we donot use any user-space daemons, thereby reducing the number of context switches andmemory-copy operations caused by the crossing of the protection boundary. We use theOS’s buffer cache though to take advantage of the built-in read-ahead functionality andbuffering of frequently accessed disk blocks. The use of the buffer cache introduces acopy operation, because data is first read into the buffer cache from disk and then trans-fered to the Myrinet NIC. [Geo02] describes a technique to take the memory system outof the data path completely by directly transfering the data from the SCSI controller to theMyrinet NIC by the use of DMA. We have not implemented this technique, but it mightcertainly be worth further investigation.
8.2.4 Fast Network Block Device (FNBD)
As a last system for distributed devices I will now discuss theFast Network Block Deviceor FNBD. The main goal of FNBD was to implement a high-performance system similarto MDDS, but using Gigabit Ethernet hardware as underlying communication network.The Gigabit Ethernet hardware we used offers some features that allows to implementefficient zero-copy protocols. More details about the system are described in [Wid01b], Iwill present an overview of its architecture and features in the next few paragraphs.
Figure 8.5 shows the architecture of FNBD. On the client side there is an FNBDdriver, which can be accessed directly or through the file system. The driver accepts re-quests from the upper layers and initialises RDMA operations by the use of a specialprotocol calledBurst Transfer Protocol(BTP, see below). The driver of the NIC also usesthe BTP, supports zero-copy operation and automatic header and payload separation ofthe incoming data packets. On the server side, the same NIC driver handles the incom-

8.2. ARCHITECTURES USING DISTRIBUTED DEVICES 119
Server node Client node
File system
Disk driver
Operating system
(server part)FNBD driver
Operating system
Application(s)
NIC driver
Application(s)
Special
File system
(client part)FNBD driver
Disk driverNIC driver
Special
Figure 8.5: Architecture of Fast Network Block Device (FNBD).
ing requests by forwarding them to the server-side FNBD driver. This driver then talksdirectly to the hard-disk driver and supports remote DMA operations with its counterparton the client side.
The implementation of FNBD bases on theASANTE FriendlyNETGigabit EthernetNIC, which contains the DP83820 chip. One interesting feature of the DP83820 is itsfour different receive (RX) and transmit (TX) rings. The rings can be combined with afilter that assigns incoming packets to specific receive rings based on a given pattern. Thepattern used as filter in the DP83820 is the VLAN tag, which thus allows to automaticsorting of incoming packets.
A similar idea that works optimistically is the technique of protocol speculation de-scribed in [KMRS00, KRS01, Kur03]. FNBD makes protocol speculation more reliableby using the hardware to do the filtering of the incoming packets. This technique thusallows to separate the headers and the data parts of incoming packets quite efficiently andto store the data directly in the buffers where they belong. FNBD uses the four RX/TXrings as follows: On ring is reserved for regular IP traffic of the Linux network stack.Another ring is reserved for control traffic, which leaves two rings for remote DMA chan-nels as used by the BTP. However, the version of the chip used in our experiments stillhad some problems: The performance was less than what could be expected (even withregular drivers) and there were still some bugs in the hardware [Wid01b]. Fortunately atleast the hardware bugs could be bypassed to make the driver work.
The connection-oriented Burst Transfer Protocol (BTP) offers mainly two services:The delivery of small messages at low latencies and the high-speed transfer of data withzero-copy techniques as described above. The small message delivery is used for controlmessages. These control messages are required e.g. to initiate a remote DMA betweentwo end points. The end points must agree on an upcoming remote DMA transfer, so thatthe recipients’ pre-allocated buffers are ready for the incoming zero-copy data stream. Toeliminate data-copy operations from incoming packets, the NIC driver has to set up hisRX ring corresponding to the used virtual channel. The descriptors of the RX ring are setup so that the data parts of the incoming packets are stored directly in their final buffers.
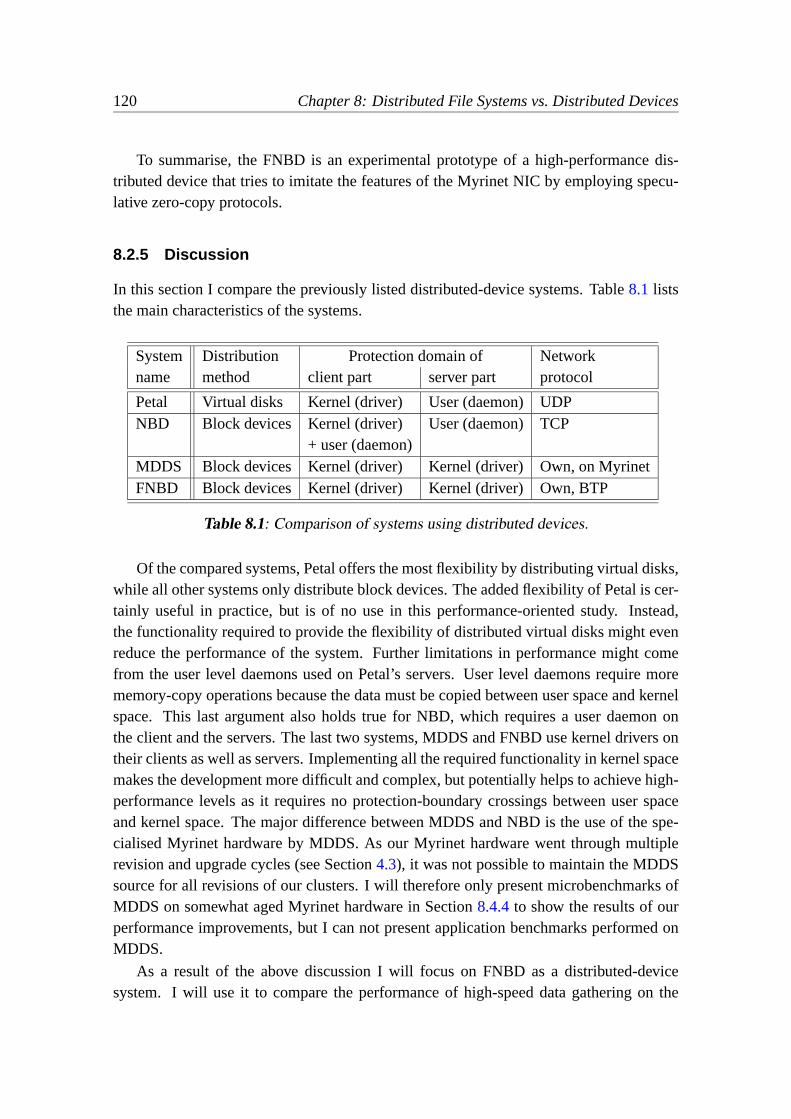
120 Chapter 8: Distributed File Systems vs. Distributed Devices
To summarise, the FNBD is an experimental prototype of a high-performance dis-tributed device that tries to imitate the features of the Myrinet NIC by employing specu-lative zero-copy protocols.
8.2.5 Discussion
In this section I compare the previously listed distributed-device systems. Table8.1 liststhe main characteristics of the systems.
System Distribution Protection domain of Networkname method client part server part protocol
Petal Virtual disks Kernel (driver) User (daemon) UDPNBD Block devices Kernel (driver) User (daemon) TCP
+ user (daemon)MDDS Block devices Kernel (driver) Kernel (driver) Own, on MyrinetFNBD Block devices Kernel (driver) Kernel (driver) Own, BTP
Table 8.1: Comparison of systems using distributed devices.
Of the compared systems, Petal offers the most flexibility by distributing virtual disks,while all other systems only distribute block devices. The added flexibility of Petal is cer-tainly useful in practice, but is of no use in this performance-oriented study. Instead,the functionality required to provide the flexibility of distributed virtual disks might evenreduce the performance of the system. Further limitations in performance might comefrom the user level daemons used on Petal’s servers. User level daemons require morememory-copy operations because the data must be copied between user space and kernelspace. This last argument also holds true for NBD, which requires a user daemon onthe client and the servers. The last two systems, MDDS and FNBD use kernel drivers ontheir clients as well as servers. Implementing all the required functionality in kernel spacemakes the development more difficult and complex, but potentially helps to achieve high-performance levels as it requires no protection-boundary crossings between user spaceand kernel space. The major difference between MDDS and NBD is the use of the spe-cialised Myrinet hardware by MDDS. As our Myrinet hardware went through multiplerevision and upgrade cycles (see Section4.3), it was not possible to maintain the MDDSsource for all revisions of our clusters. I will therefore only present microbenchmarks ofMDDS on somewhat aged Myrinet hardware in Section8.4.4to show the results of ourperformance improvements, but I can not present application benchmarks performed onMDDS.
As a result of the above discussion I will focus on FNBD as a distributed-devicesystem. I will use it to compare the performance of high-speed data gathering on the
8.3. ARCHITECTURES OF DISTRIBUTED FILE SYSTEMS 121
simpler distributed devices with the more complex distributed file systems in the rest ofthis chapter. The next section discusses some examples of distributed file systems.
8.3 Architectures of Distributed File Systems
In this section I will describe some distributed file systems. Data is typically organisedin files, so users or processes do not have to care about the data’s layout or the han-dling of individual data blocks on the disk.File systemsbasically allow to access filesand their corresponding meta data like the file’s owner, access permissions, creation andmodification date, size and so on.Distributed file systemsallow to share a collectionof files with other computers over the network. Parallel file systems are not the sameas distributed file systems, but they nevertheless share some features with distributed filesystems. Parallel file systems are designed to give multiple processes efficient, concurrentaccess to the same file and are important for high-performance computing on supercom-puters. [May01] also distinguishes cluster file systems, which are parallel file systemsdesigned to run on clusters of commodity PCs. As the focus of this chapter is on the com-parison of data gathering implemented on different levels of the OS, a simplified notionof distributed file systems suffices. In this chapter I define adistributed file systemas afile system where the data is stored on one or more remote servers and accessed over thenetwork.
There are basically two layers in a system where a distributed file system can beimplemented on the client side: Either as virtual file system in the OS, or as a library thatis linked to the applications. When implemented in the OS, the distributed file systemdeclares itself as a regular file system, but accesses remote data stored on the serversinstead of local disks. An implementation in a library is linked to the applications andintercepts I/O-specific system calls to redirect them to the remote servers. The serverpart of a distributed file system can be implemented on almost any layer as long as thenecessary coordination between the clients and the servers ensures data consistency.
In the next few sections I will introduce and discuss some implementations of dis-tributed file systems as described in the literature or implemented in our laboratory.
8.3.1 Lustre
A distributed file system which puts much of its focus on high performance and scalabilityis Lustre. The Lustre project is described in more detail in [Clu02a, Clu02b]. One goalof the project is to scale the number of clients to many thousands of machines, so somemight classify Lustre as a parallel file system. The information available online doesnot describe the inner architecture of the client and server nodes in great detail. Thenodes architecture as it can be extracted from [Clu02a, Clu02b] is depicted in Figure8.6.The applications on the clients access the Lustre distributed file system which in turn

122 Chapter 8: Distributed File Systems vs. Distributed Devices
uses the underlying Object-Based Disks (OBD) client. The OBD client uses the PortalsAPI [BMB03] to access the network. The Portals API allows to use different networks asunderlying communication technologies and hides the different programming interfacesof the network interconnects. The Portals API is of course also used on the server side. InLustre a storage server is called Object Storage Target (OST). OSTs store data as objectson so called Object-Based Disks (OBDs) and allow to handle data in object granularityinstead of the most common block granularity. The actual server component on the OSTis the OBD server, which accesses the underlying OBD for storage. The OBD driver issimilar in its functionality to a disk driver, but it allows to store data in objects insteadof blocks. Only the underlying OBD file system—which is usually based on a slightlymodified Linux ext2 file system—stores data in blocks through a standard disk devicedriver.
(server part)Object-Based Disk
Portals
NICdriver
OBD serverOBD file system
NICdriver
Disk driverDisk driver
Operating system
Application(s)
File systemLustre client file system
Operating system
Application(s)
Object-Based Disk (OBD)(client part)
Portals
Client nodeServer nodes (Object Storage Target, OST)
Figure 8.6: Architecture of the Lustre distributed file system.
Lustre certainly incorporates quite some overheads for meta-data management to al-low for very large scalability and POSIX compliance. On the other hand, all of Lustre’sfunctionality is handled in the kernel, removing unnecessary bidirectional data copies be-tween user-space daemons and the kernel as well as possibly expensive context switches.The use of the Portals API makes the system ready for a wider choice of underlying net-works, but introduces another software layer which will likely reduce the performanceof the system on high-speed cluster networking environments. The handling of objectsinstead of blocks allows for greater flexibility in applications, but requires a greater flex-ibility of the system, since requests in different object sizes must be transformed intoblock-size requests for the interaction with the final storage device—after all commoditystorage devices still store data blockwise. This might change in the future when storagedevices support a standard for OBDs.
8.3.2 Frangipani
A second, higher level that builds on top of Petal (see Section8.2.1for a description ofPetal) is Frangipani [TML97]. Frangipani’s architecture together with Petal is shown in

8.3. ARCHITECTURES OF DISTRIBUTED FILE SYSTEMS 123
Figure 8.7. The Frangipani file-server modules are part of the OS space on the clientmachines and register themselves there with the virtual file-system switches as one of theavailable file-system implementations. They do not communicate among each other, butonly with the underlying Petal device driver and some lock servers.
LocalFrangipani fileserver module
NICdriver
file system
(client part)NIC
driver
Operatingsystem
Disk driverPetal device driver
UDP/IP
Petal serverApplication(s)
Operating system
File system
Client nodeServer nodes
Disk driver
Application(s)
Figure 8.7: Architecture of Frangipani distributed file system.
The use of Petal as underlying distributed storage service certainly reduces the com-plexity of the implementation of a distributed file system. Thus, the Frangipani file servermodule could be written in kernel space without introducing too much hardly-manageablecomplexity into the kernel. The thin file-system layer also introduces no additional datacopies that would result in a performance loss.
8.3.3 Parallel Virtual File System (PVFS)
A project in distributed–file-systems research that evolved into a widely used system forPC clusters is PVFS [IR99]. PVFS provides a global name space, striping of data acrossmultiple I/O nodes and multiple user interfaces. Its architecture is shown in Figure8.8andis based on user-space daemons and application libraries. The application library is eithercalled directly from an application using the native PVFS interface or by intercepted sys-tem calls from an application using the standard UNIX system interface. The library thencommunicates with user-space daemons on the I/O nodes by using the TCP protocol. Theusage of TCP as communication protocol allows to use most of the available bandwidthwithout implementing new protocols in user space. Some small problems remain withTCP’s slow start and delayed acknowledgment mechanisms. The PVFS daemons on theI/O nodes then access the stored data by standard I/O system calls to a regular local filesystem, thereby transparently using the buffer cache for buffering data.
As PVFS implements all its functionality in user space, it requires no changes tothe kernel. The drawback is that data must cross protection-domain boundaries morefrequently, thereby increasing the number of data copies. The choice of TCP as underlyingdata communication protocol enables the use of all networks for which an implementation

124 Chapter 8: Distributed File Systems vs. Distributed Devices
NICdriver
NICdriver
Application(s)PVFS application library
File system
PVFS daemon
Client node
TCP/IP
Disk driver
Operating systemTCP/IP
Operating system
File system
Disk driver
Application(s)
Server node
Figure 8.8: Architecture of the parallel virtual file system (PVFS).
of TCP exists. TCP is not really a light-weight protocol on the other hand and increasesthe load on the CPU. The use of a regular local file system as underlying data storage areaallows to take over the advantages of a well developed and tested file system. The filesystem’s buffer cache is transparently used too, relieving PVFS from implementing anybuffering mechanism. For large data access (that are larger than the buffers), the use of thebuffer cache introduces an unnecessary data copy, potentially slowing the transmission orincreasing the load on the CPU and the memory subsystem.
8.3.4 GigaFS
As a last distributed file system I will describe GigaFS [Wit01], which is an experimentalsystem developed in a master project at our laboratory. The details are shown in Fig-ure8.9. On the client side GigaFS registers itself as another file system with the virtualfile system of the Linux kernel. Applications then access files on a GigaFS-mounted filesystem in the same way as files on other (e.g. local) file systems. The GigaFS client for-wards any requests to the GigaFS servers. For all communications between clients andservers TCP is used. The servers are implemented as user-space daemons and access datathrough a local file system.
The GigaFS client is implemented in kernel space to reduce the number of data copiesand context switches when data from multiple servers is transmitted into or out of theclient. In the relatively simple scenario the servers have to deal with only one client eachand are therefore unlikely to be a bottleneck. Thus, the GigaFS servers are implementedin user space to make the development and testing easier. Using TCP as an underlyingcommunication protocol relieved GigaFS from implementing its own transport protocolwhile losing only little raw throughput compared to UDP. The use of a regular local filesystem on the servers enables the use of the system’s buffer cache automatically, therebygetting server-side caching without additional efforts.

8.3. ARCHITECTURES OF DISTRIBUTED FILE SYSTEMS 125
GigaFS server
Operating systemLocal file system
NICdriver
Disk driver
File system
NICdriver
GigaFSclient
TCP/IP
Application(s)Application(s)
Operating system
Client nodeServer nodes
Disk driver
Figure 8.9: Architecture of GigaFS.
8.3.5 Discussion
In this section I compare the previously described distributed file systems. Table8.2 liststhe main characteristics of the systems.
System Client Protection domain of Networkname access client part server part protocol
Lustre File system Kernel Kernel (OBD (Portals, currently(file system) server) TCP, Quadrics)
Frangipani File system Kernel (file Kernel (driver) UDPserver module) (Petal)
PVFS Library User (library) User (daemon) TCPGigaFS File system Kernel User (daemon) TCP
(file system)
Table 8.2: Comparison of distributed file systems.
Of these systems, Lustre is the most advanced system that offers the highest scalabil-ity. The price for these advantages is that Lustre needs different kinds of servers like e.g.Object Storage Targets (OST) and Metadata Servers (MDS). Since the inner workingsof Lustre are not so well documented it is difficult to understand and model the perfor-mance of the system. Additionally, Lustre is targeted at very-large clusters, not at thetypical size of a system in a multi-use cluster as discussed in this thesis. Frangipani iscertainly an interesting concept with its two layers that build a distributed file system ontop of a distributed-device system. Since I want to compare distributed file systems withdistributed devices in this study and Frangipani contains both in one system, it is thusof little use here. PVFS on the other hand is considered a typical distributed file systemfor clusters and offers a reasonable amount of features. It works well with commodityparts as it builds on top of standard OS features like standard network protocols and file

126 Chapter 8: Distributed File Systems vs. Distributed Devices
systems. This helps to model the performance because the performance of these standardsubsystems are well known or can be individually measured. The scalability of PVFSsuits small and medium-size clusters and is best in aggregate throughput. As a last sys-tem, GigaFS as a research prototype is similar in its architecture to PVFS, except that itimplements the client’s functionality in kernel space by offering access to the applicationsthrough a file-system interface.
A comparative study between PVFS and GigaFS found that GigaFS offers higherthroughput with small block sizes, which is of less interest in this data-stream–orientedstudy. PVFS scales slightly better with very-large files and many servers, and also scalesbetter with the number of concurrent clients. For all these reasons I will focus on PVFSas distributed file system for the rest of the chapter.
8.4 Evaluation
A goal of this section is to investigate the usefulness in excess storage capacities of multi-use clusters of commodity PCs and fast data interconnects for data warehousing applica-tions. Further, I want to explore the suitability of different layers in the system for imple-mentation of the data-distribution handling. Should the implementation be done on theapplication or library layer in user space? How would such an implementation compare toa transparent approach on the lower layers of the file system or distributed devices? Theperformance metrics that I use in this chapter are twofold: First, for a better understandingof the systems’ performance and the application’s behavior, I measure the throughput ofthe base data-handling system. For more practical results I measure queries’ executiontimes of a data-warehousing application. The main factor for the evaluation is the layerof the implementation that handles the distributed data. Another important factor is theuser-level block size. Some applications prefer smaller block sizes for finer grained dataaccesses, but the throughput of large-block transfers are likely to have higher throughputs.To test the scalability of the systems I vary the number of servers in the system. A finalfactor for some tests is the hard disks’ throughput. Artificially slower disks allow to sim-plistically simulate future systems where the network’s throughput will be much higherthan the disks’. As evaluation techniques I first apply the analytic model from Chapter5and then perform measurements with real systems.
8.4.1 Workload Description
In this subsection I will describe my choice of data warehousing as a typical workloadfor multi-use clusters. The workload will later be used to compare the performance of thedistributed devices and the distributed file systems.
As we want to use the vast amount of excess storage space on many hard disks ofmulti-use clusters of commodity PCs, the target application should have a large data set.

8.4. EVALUATION 127
The data set should mostly be accessed by the application read-only, as the many disksof the multi-use cluster store only non-critical data (see Section2.3.3). If the applicationwas to write or update important data, that data would somehow have to go back to areal storage or file server before the multi-use clusters are booted back to their dailyenvironment. A third requirement is a stream-based data-access pattern. A stream-basedaccess pattern is achieved by mostly sequential data accesses without random accesses.First, it is more interesting to analyse continuous read operations, since they require higherthroughputs than random read operations. I stated in Section2.1that commodity networkswill increase their throughputs faster than disks, so only continuous read operations cantake advantage of these ever increasing network bandwidths. Random read operationson the other hand are bound by the latency of the disks’ seek operations. Secondly, thestream-based data-access pattern allows to apply the stream-based model described inChapter5 to predict the applications’ performance. Finally the application should belimited by the I/O bandwidth as we are interested to see the different performances ofmy distributed data-access approaches as well as their influence on the overall applicationperformance. To summarise, the requirements for an ideal application are (a) large dataset, (b) read-only data, (c) stream-based access pattern and (d) I/O limited performance.
These requirements suggest for example the following applications. A first applica-tion might be a simple pattern search in a huge file by the use of the grep utility. Thisapplication trivially satisfies all of the above requirements, but is rather a microbench-mark than an interesting real application. A second application area would be scientificcomputing applications. Many scientific applications satisfy some of the above proper-ties, but some of them have only small input sets or large output sets, some have irregulardata-access patterns or are CPU limited. So, the compliance of the above requirementsdepends largely on the specific scientific computing application. Scientific computing asan application domain is therefore in general less interesting for our environment. As alast application domain I list OLAP (On-line analytical processing). OLAP is used forexample to analyse large data warehouses and certainly satisfies requirements (a) and (b).The fulfillment of the requirements (c) and (d) depends on the nature of the queries. Forqueries that have to scan large parts of fact tables, they are perfectly met. While otherqueries are bound to the performance of the CPU, the network or the database middle-ware [TSW02], the queries that do full table scans are typical enough to be a standardcase for data warehousing. Besides, database operations like large data reads are par-allelisable, thus turning multi-use clusters of commodity PCs in a perfect environmentfor data warehousing. Since the demand for data-warehouse analyses increases, OLAPis an interesting and significant application for evaluating the performance of distributeddevices and distributed file systems in practice.
The next question to address is how to parallelise OLAP on one or more nodes of amulti-use cluster. The simplest solution would be to buy some more commodity disks andput them into a few database servers. Even though new disks are relatively cheap, it still

128 Chapter 8: Distributed File Systems vs. Distributed Devices
requires some money to buy them and leaves the disks in the nodes of the multi-use clusterunderutilised, thus wasting the money even more. In addition, installing more disks in thenodes of a multi-use cluster might lead to problems with increased generation of heat andnoise—which is especially disturbing in a lab or office environment. Therefore we usethe distributed storage space on the disks in the nodes of the multi-use cluster which isthere basically for free.
A natural followup question here is how to parallelise the OLAP operations otherwise.There are basically two ways: (1) Either there is one database instance with a copy of thedata per node and every node performs different analyses on the same data set, or (2) thestorage of all (or some) of the nodes is aggregated to provide space for a much larger dataset that is then analyzed by a single node accessing the distributed storage. Approach (1)is based on areplication of the data set and works only for relatively small data sets—limited by the excess storage space of single nodes. Replicating data for parallel analysesof the same data set assumes that there are many different analyses to be done. Providedthere are enough parallel analyses to be done, approach (1) will scale very well as there isno interdependency between the nodes. It is thus not of much interest to study its perfor-mance in a cluster environment. On the other hand, approach (2) is based onpartitioningthe data between the nodes, thus enabling analyses of much larger data sets that are pri-marily limited by the number of available nodes. While one could expect good scalabilityfor approach (2) because of the throughput-increasing parallel use of many disks, coordi-nation overheads and the network bottleneck of the data-reading machine could also limitthe performance of such a parallelised database.
NICdriver
Distributed device driver(client part)
Operating systemOperating system
NICdriver
Distributed device driver(server part)
Server node Client node
LibraryApplication
File system
Disk driver
Application(s)
LibraryServer process Application(s)
File system
a
c
d
b
Figure 8.10: Layers for data-gathering architecture.
There are different layers where a database system can implement the access to dis-tributed data and I will discuss some of them as shown in Figure8.10. At the high-est level the distribution can be done in user space by the application (Figure8.10, a).Several approaches fall into this category as described in [BGRS00]: There can be anapplication of distributed components like a transaction monitor that handles the commu-nication between different instances of the RDBMS on the cluster’s nodes (TP-Heavy), a
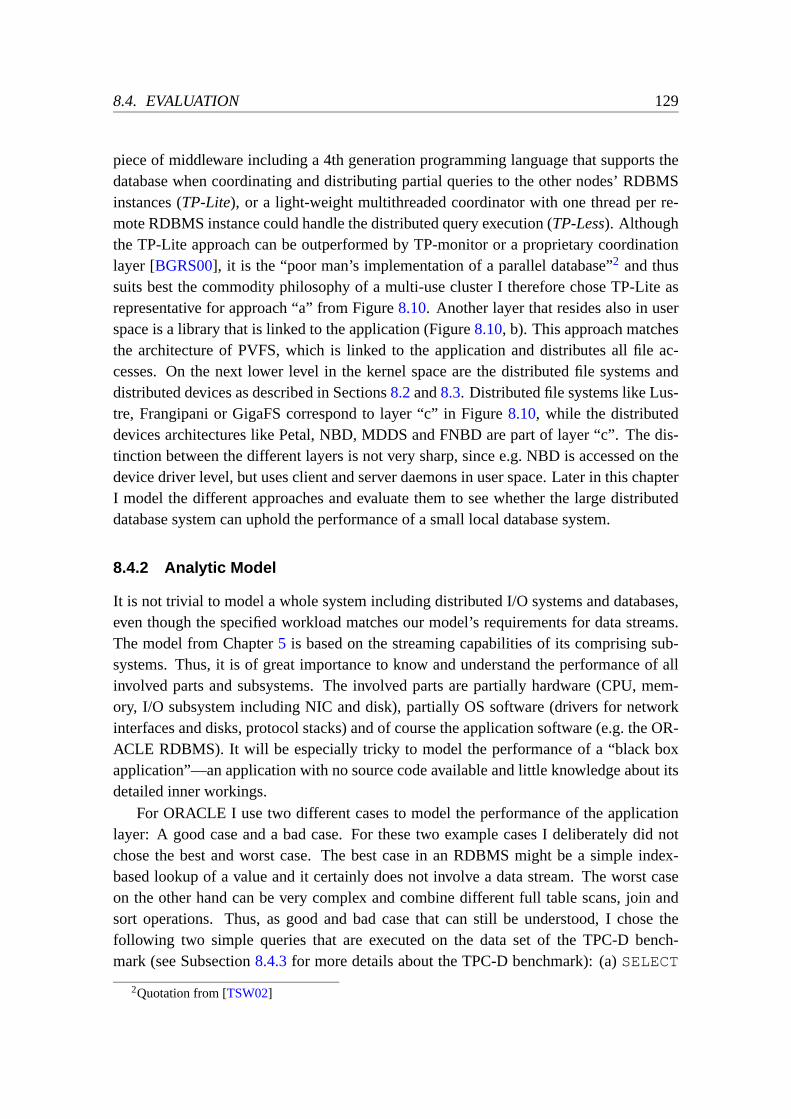
8.4. EVALUATION 129
piece of middleware including a 4th generation programming language that supports thedatabase when coordinating and distributing partial queries to the other nodes’ RDBMSinstances (TP-Lite), or a light-weight multithreaded coordinator with one thread per re-mote RDBMS instance could handle the distributed query execution (TP-Less). Althoughthe TP-Lite approach can be outperformed by TP-monitor or a proprietary coordinationlayer [BGRS00], it is the “poor man’s implementation of a parallel database”2 and thussuits best the commodity philosophy of a multi-use cluster I therefore chose TP-Lite asrepresentative for approach “a” from Figure8.10. Another layer that resides also in userspace is a library that is linked to the application (Figure8.10, b). This approach matchesthe architecture of PVFS, which is linked to the application and distributes all file ac-cesses. On the next lower level in the kernel space are the distributed file systems anddistributed devices as described in Sections8.2and8.3. Distributed file systems like Lus-tre, Frangipani or GigaFS correspond to layer “c” in Figure8.10, while the distributeddevices architectures like Petal, NBD, MDDS and FNBD are part of layer “c”. The dis-tinction between the different layers is not very sharp, since e.g. NBD is accessed on thedevice driver level, but uses client and server daemons in user space. Later in this chapterI model the different approaches and evaluate them to see whether the large distributeddatabase system can uphold the performance of a small local database system.
8.4.2 Analytic Model
It is not trivial to model a whole system including distributed I/O systems and databases,even though the specified workload matches our model’s requirements for data streams.The model from Chapter5 is based on the streaming capabilities of its comprising sub-systems. Thus, it is of great importance to know and understand the performance of allinvolved parts and subsystems. The involved parts are partially hardware (CPU, mem-ory, I/O subsystem including NIC and disk), partially OS software (drivers for networkinterfaces and disks, protocol stacks) and of course the application software (e.g. the OR-ACLE RDBMS). It will be especially tricky to model the performance of a “black boxapplication”—an application with no source code available and little knowledge about itsdetailed inner workings.
For ORACLE I use two different cases to model the performance of the applicationlayer: A good case and a bad case. For these two example cases I deliberately did notchose the best and worst case. The best case in an RDBMS might be a simple index-based lookup of a value and it certainly does not involve a data stream. The worst caseon the other hand can be very complex and combine different full table scans, join andsort operations. Thus, as good and bad case that can still be understood, I chose thefollowing two simple queries that are executed on the data set of the TPC-D bench-mark (see Subsection8.4.3for more details about the TPC-D benchmark): (a)SELECT
2Quotation from [TSW02]
130 Chapter 8: Distributed File Systems vs. Distributed Devices
MAX(c acctbal) FROM customer and (b)SELECT c acctbal FROM cus-
tomer ORDER BY c acctbal . Query (a) requires a full table scan of a large facttable to find a maximum value. It therefore has to read a large data stream, but the CPUhas otherwise not much to do with the data besides finding the maximum value. Query(b) also has to read a large amount of data, but it additionally has to sort the data, therebynot only reading but also touching and/or copying the data around more often. To findout the throughput of ORACLE alone for these two queries—i.e. without involving manyother subsystems—I chose the tablecustomer that fits into the buffer cache of the ma-chine running ORACLE. Tests revealed that the system has to read 278.8 MBytes and280.0 MBytes respectively from disk3 during the execution of the above two queries witha cold buffer cache. With a hot buffer cache the execution of the two queries took 2.01and 36.14 seconds respectively, thus resulting in a throughput of 140 MByte/s and 7.75MByte/s respectively for ORACLE. I will use these numbers in the following paragraphsto model the overall performance of OLAP.
When modeling OLAP with a distributed RDBMS, one has to take into account thatthe RDBMS instances on the database servers might filter the data and send only the partto the client which are relevant to compute and present the final results to the user. Thesize of the relevant data parts depends on the query and can be significantly smaller thanthe data that is originally read from the disks. This data reduction can be modelled asa data compression in our model. To find out the “compression factor”c of differentTPC-D queries I analyzed some queries as shown in Table8.3. The queries are limited
TPC-D Input read [MByte] Result “Compres-query index data total output [MByte] sion factor”c
1 0 8758 8758 0.001 7.3×10⁶
2 85 477 562 2.4 2343 0 10998 10998 5.6 19644 1318 10265 11583 <0.001 17.6×10⁶
8 3412 10782 14194 0.017 835000
Table 8.3: TPC-D query analysis with ratios of input/output.
by different subsystems like CPU, network, disk or middleware as described by Taufer et.al. [TSW02]. The results indicate that the distribution of the intelligent RDBMS middle-ware layer results in compression factors that vary by four orders of magnitude. Even thesmallest compression factor encountered is larger than 200, which indicates that we haveto handle data streams differently in our model for the case with TP-Lite, depending ontheir position in the data flow—before or after the filtering by the RDBMS on the servers.The amount of data transfered is definitely different before and after the filtering. While
3These values are taken from the/proc/stat file.

8.4. EVALUATION 131
these measurements are only an approximation in the sense that they do not revealwherethe filtering is done: In the distributed RDBMS instances, in the coordinating RDBMSon the client, or in both layers. I assume that the filtering for the queries in Table8.3 ismostly done by the distributed RDBMSs on the servers.
The modelling of the rest of the system is possible because the other layers compriseknown parts that either have known throughput characteristics for data streams or whichcan be measured individually (e.g. the SCSI disk, the PCI I/O bus, the memory as well asthe CPU).
Local Disk
As a first case I will model the performance of an RDBMS executing OLAP queries ona local disk-based file system. The architecture is shown in Figure8.11. The applicationthat takes queries from the user (or the shell) is thesqlplus CLI. The CLI then contactsthe RDBMS through pipes. The pipes involve at least one copy operation: When thereading end of the pipe is ready to receive data and the writing end of the pipe starts tosend data. In this case the data is directly copied from one end of the pipe to the other.Only when the reading end of the pipe is not ready, then the data from the writing endis copied in a buffer in the kernel space. As I am examining queries with rather smallresults, I expect the reading end of the pipe to be ready at all times. The RDBMS has toread the data of the database from the file system’s buffer cache, which involves anothercopy from the kernel space to the user space. The file system—or precisely the underlyingdisk driver—receives the data by DMA from the SCSI interface of the disk.
File system
CopyOperating system
Pipe(reduced copy)
Application(s)
Disk driver
Client node
RDBMS4GL
DMA
Figure 8.11: Architecture of OLAP performance with local disk.
When inserting a SCSI disk throughput of 33 MByte/s, an I/O bus bandwidth of264 MByte/s, a memory bandwidth of 420 MByte/s into the adapted equations fromChapter5 we get a throughput of 33 MByte/s for a trivial application that simply reads

132 Chapter 8: Distributed File Systems vs. Distributed Devices
large amounts of raw data from the disk. Applying the same numbers to the slightly morecomplex cases with the RDBMS we get 33 MByte/s for the good case (trivially limitedby the disk) and a throughput of 7.1 MByte/s for the bad case (limited by the CPU). Forthe TPC-D query number four I thus predict an execution time of 351 and 1631 secondsrespectively for the two cases. While this difference with a factor of nearly 5 seems ratherlarge for a model, it is important to stress that this difference comes from the very differentqueries assumed for the good and bad example cases. As you will see in the next para-graphs, the lower and higher numbers still allow to compare the modelled performancesof the different architectures.
TP-Lite
The system architecture with TP-Lite looks quite different and is depicted in Figure8.12.On the server nodes data is read from the disk and transfered by the disk driver to the file-system’s buffer cache by DMA. A copy operation to user space is performed when thedata is read by the RDBMS. The RDBMS then handles the data with different throughputsdepending on the executed query. While handling the data its amount is reduced as aresult of data preselection. The next copy back to the TCP/IP stack is thus only a reducedcopy, since less data needs to be copied. The NIC driver finally transfers the data with aDMA operation onto the network. On the client side the data coming from the network istransfered to the network buffers by DMA, handled again by the TCP/IP stack and copiedto the RDBMS when it reads the data. The final results are then copied to the 4GL frontend.
NICdriver
NICdriver
DMA
RDBMS
4GL
Operatingsystem
RDBMS
Server node Client node
DMA
TCP/IPTCP/IPFile system
Disk driver
DMA
Application(s)
Copycopy
Reduced
Operating system
Application(s)
Reduced copy
Reduced copy
Figure 8.12: Architectural model of OLAP with TP-Lite.
When inserting the same numbers as above, the model predicts 119 MByte/s for atrivial application that does simply raw TCP/IP transfers, while real measurements withthe GNIC-II Gigabit Ethernet card showed 110 MByte/s raw TCP performance. Appliedto the OLAP architecture with TP-Lite the model predicts throughputs of 99 MByte/s
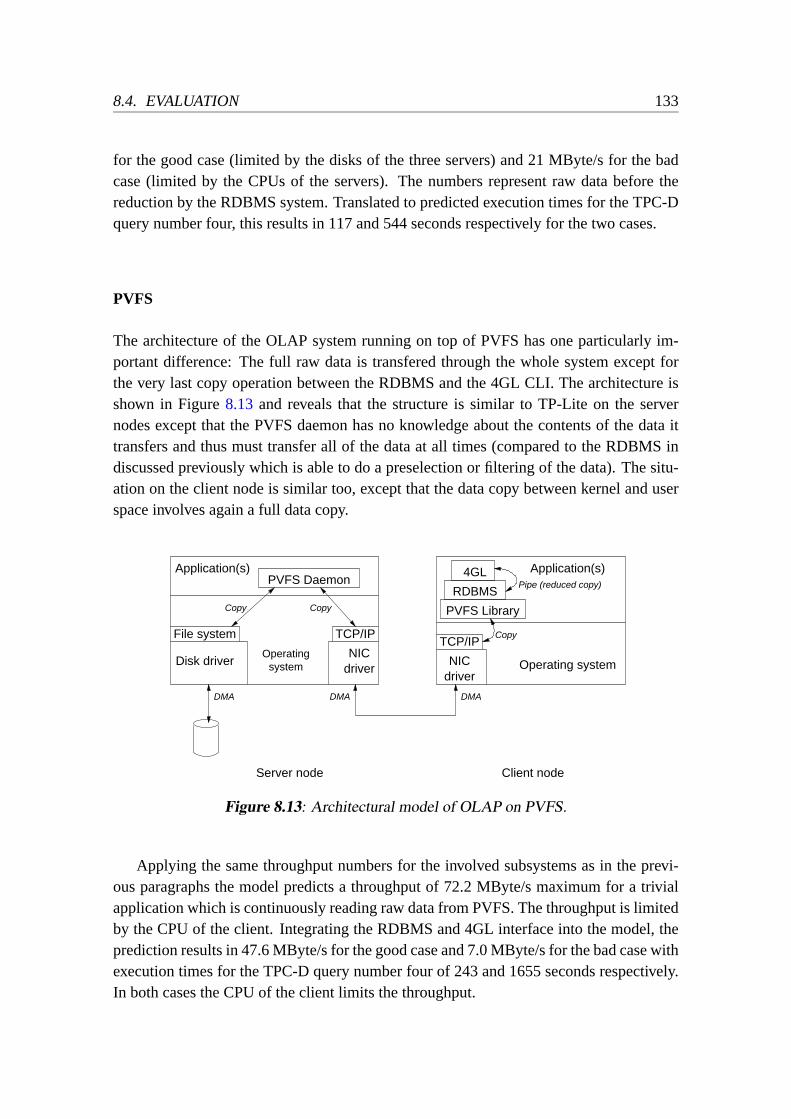
8.4. EVALUATION 133
for the good case (limited by the disks of the three servers) and 21 MByte/s for the badcase (limited by the CPUs of the servers). The numbers represent raw data before thereduction by the RDBMS system. Translated to predicted execution times for the TPC-Dquery number four, this results in 117 and 544 seconds respectively for the two cases.
PVFS
The architecture of the OLAP system running on top of PVFS has one particularly im-portant difference: The full raw data is transfered through the whole system except forthe very last copy operation between the RDBMS and the 4GL CLI. The architecture isshown in Figure8.13 and reveals that the structure is similar to TP-Lite on the servernodes except that the PVFS daemon has no knowledge about the contents of the data ittransfers and thus must transfer all of the data at all times (compared to the RDBMS indiscussed previously which is able to do a preselection or filtering of the data). The situ-ation on the client node is similar too, except that the data copy between kernel and userspace involves again a full data copy.
NICdriver
Pipe (reduced copy)
DMA
RDBMS
4GL
Operatingsystem
PVFS Daemon
NICdriver
PVFS Library
Disk driver
Server node
TCP/IPFile system
Application(s)
Client node
Application(s)
Copy
TCP/IP
Operating system
Copy
Copy
DMA DMA
Figure 8.13: Architectural model of OLAP on PVFS.
Applying the same throughput numbers for the involved subsystems as in the previ-ous paragraphs the model predicts a throughput of 72.2 MByte/s maximum for a trivialapplication which is continuously reading raw data from PVFS. The throughput is limitedby the CPU of the client. Integrating the RDBMS and 4GL interface into the model, theprediction results in 47.6 MByte/s for the good case and 7.0 MByte/s for the bad case withexecution times for the TPC-D query number four of 243 and 1655 seconds respectively.In both cases the CPU of the client limits the throughput.

134 Chapter 8: Distributed File Systems vs. Distributed Devices
FNBD
As a last architecture I model an OLAP system on top of FNBD as depicted in Figure8.14.FNBD is strongly optimised for high-performance data streams and therefore does notinvolve any unnecessary data copies on the servers—the only data transfers are done byDMA from the SCSI adapter and again by DMA to the NIC. While the client is alsooptimised by using special protocols and running completely in kernel space, there is stillone last data copy to cross the protection boundary between kernel and user space. Thus,from the viewpoint of the stream-based model, the client side of FNBD is identical to thePVFS-based architecture.
Server node Client node
Copy
DMA
Operatingsystem
4GLRDBMS
Pipe(reduced copy)
Special(client part)
Application(s)
NIC driverFNBD driver
NIC driverSpecialFNBD driver
(server part)
Operating system
Disk driver
File system
Application(s)
DMA DMA
Figure 8.14: Architectural model of OLAP on FNBD.
When inserting the throughput numbers of our hardware into the model’s equations,the maximum throughput a trivial application can expect when reading raw sequential datafrom a FNBD-based file system is predicted at 46.7 MByte/s. Integrating the RDBMSsystem we get a maximum throughput of 35.0 MByte/s and 6.7 MByte/s for the goodand the bad case respectively. The corresponding execution times for the TPC-D querynumber four are 331 and 1729 seconds. Both example queries are again limited by theCPU of the client.
Discussion
In the following paragraphs I discuss and compare the numbers predicted by the analyticmodel. All numbers from the previous paragraphs are summarised in Table8.4.
There certainly is a large gap between the good and bad cases, but this gap comes fromthe different assumptions of the queries’ complexities, not the model itself. Still, there isclearly a trend visible in the good cases, where data is streamed without much CPU inter-vention: TP-Lite seems to be clearly the best architecture, with PVFS and FNBD takingroughly the double amount of time. The local disk clearly limits the local architecture andis thus the slowest approach according to the model. I explain these results as follows:In the case of TP-Lite, the distributed RDBMS prefilters the data and therefore has to

8.4. EVALUATION 135
System Underlying sub- OLAP throughput TPC-D Query 4name system raw read good bad good bad
[MByte/s] [MByte/s] [MByte/s] [s] [s]
Local disk 33 33 7.1 351 1631TP-Lite 119 99 21 117 544PVFS 72 48 7.0 243 1655FNBD 47 35 6.6 331 1729
Table 8.4: Predictions of the analytic model for different systems.
transmit only small amounts of data to the client. The client is thus no longer the limitingbottleneck of the system. For a query where the RDBMS’ on the servers can not prefilterthe data, for example a full table dump, the throughput of TP-Lite would be limited bythe client’s CPU to about 38 MByte/s.
The distributed file system PVFS and the approach with FNBD’s distributed deviceshave both no knowledge about the transmitted data on the servers and thus must transportall data. The client becomes a bottleneck because it has to handle lots of data from dif-ferent servers. It is interesting to note that the predicted performance of PVFS is higherthan the one for FNBD—even though FNBD was especially optimised for data streamsby reducing the number of copy operations and by removing all overhead that a full-featured distributed file system might have. This difference comes only from the factthat Linux reaches a TCP throughput of about 110 MByte/s with the GNIC-II GigabitEthernet adapters that are used for PVFS, while the ASANTE Gigabit Ethernet adaptersreach only about 60 MByte/s with Linux TCP4. Otherwise, the architectures are rathersimilar: The most notable difference between the to architectures is that FNBD doesnot require any data-copy operations on the servers at all, while PVFS needs to copydata twice between user and kernel space. The model for the server nodes alone (seealso Figures8.13and8.14) predicts CPU-related throughput limitations of 39 MByte/sfor PVFS and 62 MByte/s for FNBD, but the disks’ limit is lower in both cases with33 MByte/s. While FNBD leaves more CPU resources available to other applications,it does not help to speed up the data transmission. The throughput limitations of thetwo systems could theoretically be raised by the use of true zero-copy protocol stacks asdescribed in [KRS01]. The use of such a true zero-copy approach could allow an applica-tion to read data much faster from the underlying file system. Integrating true zero copyinto the model predicts data-read throughputs for applications of up to 100 MByte/s and
4Even when not using any protocol at all and simply sending dummy packets to the network, the AS-ANTE NICs do not reach a higher throughput [Wid01a]. We suspect that this performance drawback iscaused by a bad hardware design or bad documentation that makes it difficult to tune all hardware parame-ters optimally. We found out about this deficiency only after purchasing the cards that we selected becauseof their features for simplified zero-copy techniques (see Section8.2.4).

136 Chapter 8: Distributed File Systems vs. Distributed Devices
OLAP throughputs of 58 MByte/s for the good case and 7.2 MByte/s for the bad caserespectively.
The system architecture with the data on the local hard-disk drive offers the lowestperformance according to the model. The system is trivially limited by the throughput ofthe local disk. This limitation could easily be bypassed by installing multiple disks in themachine and using their aggregate throughput in a RAID. However, more disks increasecosts and contradict the multi-user clusters’ usage mode presented in Section2.3.3.
Another trend that is visible in Table8.4 is that the performance for the bad cases isnearly identical for all systems except TP-Lite. This is a result of the CPU limitation ofthe strongly CPU-bound bad cases (sort operation). For all systems except TP-Lite, theCPU on the client has to do all of the CPU-intensive operations. With TP-Lite, the threeCPUs on the servers can share that workload and thus triple the overall performance.
According to the model’s predictions, TP-Lite would clearly be the best choice forparallel OLAP applications on multi-use clusters of commodity PCs. The drawback isthat a standard RDBMS software has to be adapted for this kind of parallel execution.All other approaches work perfectly with unchanged software that is running “as-is” notonly on the local disk, but equally well on PVFS or FNBD with much larger data sets.Especially for a multi-use cluster that allows new technologies like e.g. data mining incompanies or departments it is important that there is no need to rewrite software forparallelisation, buy expensive parallelised versions of the software or buy additional disks.Thus, it will still be interesting to see and compare the performance of OLAP on PVFS,FNBD and traditional local disks in the next subsections.
While the model predicts identical performance for PVFS and FNBD, we have toremember that the model is based on data streams and does not take any additional over-head into account. Since FNBD does not have to handle anything else but disk blocks, andPFVS potentially has more overhead for synchronisation between servers and handling ofmeta data, I expect PVFS to have lower performance in experiments on real systems. Theamount of performance reduction (if there is one at all), remains to be seen in the nextsubsections.
8.4.3 Experimental Design
For the later evaluation of the systems and setups described in this chapter, I describe thedesign of some microbenchmarks as well as an application benchmark.
Microbenchmarks
An ideal microbenchmark for this study should fulfill similar requirements as a well suitedapplication. I listed these requirements for an application benchmark in Subsection8.4.1.For a microbenchmark this means that it must be scalable to large data sets, it must offer

8.4. EVALUATION 137
read-only experiments, it must follow a stream-based access pattern and it must be I/Obound to thoroughly stress the underlying distributed file or distributed device system.
There are some microbenchmarks for file systems commonly known that I will listand describe in this paragraph. Some of the benchmarks I examined have a differenttarget than this thesis: The SPEC System File Server benchmarkSFS97R1 [Sta01] isthe successor of theLADDISor SFS93benchmark and is used to evaluate specifically thethroughput and request-handling capabilities of NFS servers. Thus, it can not be used tobenchmark generic distributed file systems as required in this section.
Lmbench [MS96] is a collection of OS benchmarks, including one to measure theoverhead of the virtual file system and one to measure the bandwidth of sequential andrandom read and write operations. However, as Lmbench is an OS benchmark, it readsfiles from the cache only to measure the effectiveness of the virtual file system whencopying data from the buffer cache to user space. Since I want to measure real file-systemthroughput, I will not use this benchmark.
The Andrew benchmark [HKM+88] consists of a command script that operates on acollection of files. It models the typical mix of an Andrew user back in 1987 and has aworking set size of only 220 KByte—which is extremely limited by todays standards andis even smaller than the cache of most modern CPUs. The Bonnie benchmark [Bra96]was designed with simplicity in mind and offers no scalability to current, larger workloadstoo. Both benchmarks are therefore not suited to evaluate large-file reads on moderndistributed file systems.
The self-scaling benchmarks [CP93] on the other hand offer a very-high scalabilityand scale automatically to the interesting focal points of different benchmark factors.Since I know the design of the systems under consideration in this thesis and thus havean idea about the interesting focal points, the self-scaling capabilities exceed the featuresthat are important for my microbenchmark measurements.
The Postmark benchmark [Kat97] was especially designed for mail and netnews serv-ers and evaluates file-system operations on many mostly small files. This too, is a differentworkload then required for this chapter.
The last two benchmarks come much closer to the goal of a relatively simple, mostlythroughput oriented, yet scalable microbenchmark.Iozone[NC03] is a file-system bench-mark tool that generates and measures a variety of file operations like e.g. read, write,re-read, re-write, read strided, random read and write. It does so with different recordand file sizes and measures the throughput or latency. All parameters can be changed tomatch the tested system and to approximate the targeted application. Finally,Speedis avery simple benchmark used in [Psa99, Fle00, Wid01b] that measures throughputs andblock latencies for continuous read or write operations. Latency numbers for continuousread or writes are not so useful in general, because modern systems do read ahead and thelatency therefore measures mostly the system-call time. However in some circumstancesthe latency numbers help to find problems with the buffer cache. Since Speed fulfills all
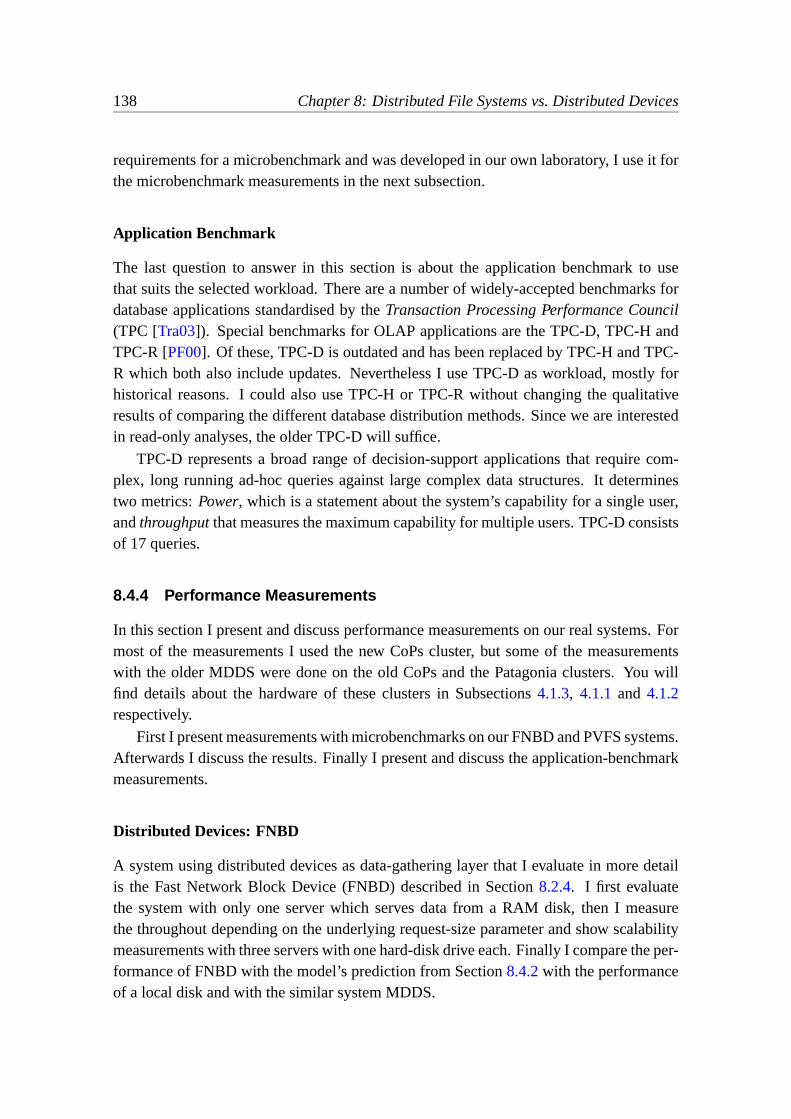
138 Chapter 8: Distributed File Systems vs. Distributed Devices
requirements for a microbenchmark and was developed in our own laboratory, I use it forthe microbenchmark measurements in the next subsection.
Application Benchmark
The last question to answer in this section is about the application benchmark to usethat suits the selected workload. There are a number of widely-accepted benchmarks fordatabase applications standardised by theTransaction Processing Performance Council(TPC [Tra03]). Special benchmarks for OLAP applications are the TPC-D, TPC-H andTPC-R [PF00]. Of these, TPC-D is outdated and has been replaced by TPC-H and TPC-R which both also include updates. Nevertheless I use TPC-D as workload, mostly forhistorical reasons. I could also use TPC-H or TPC-R without changing the qualitativeresults of comparing the different database distribution methods. Since we are interestedin read-only analyses, the older TPC-D will suffice.
TPC-D represents a broad range of decision-support applications that require com-plex, long running ad-hoc queries against large complex data structures. It determinestwo metrics:Power, which is a statement about the system’s capability for a single user,andthroughputthat measures the maximum capability for multiple users. TPC-D consistsof 17 queries.
8.4.4 Performance Measurements
In this section I present and discuss performance measurements on our real systems. Formost of the measurements I used the new CoPs cluster, but some of the measurementswith the older MDDS were done on the old CoPs and the Patagonia clusters. You willfind details about the hardware of these clusters in Subsections4.1.3, 4.1.1 and 4.1.2respectively.
First I present measurements with microbenchmarks on our FNBD and PVFS systems.Afterwards I discuss the results. Finally I present and discuss the application-benchmarkmeasurements.
Distributed Devices: FNBD
A system using distributed devices as data-gathering layer that I evaluate in more detailis the Fast Network Block Device (FNBD) described in Section8.2.4. I first evaluatethe system with only one server which serves data from a RAM disk, then I measurethe throughout depending on the underlying request-size parameter and show scalabilitymeasurements with three servers with one hard-disk drive each. Finally I compare the per-formance of FNBD with the model’s prediction from Section8.4.2with the performanceof a local disk and with the similar system MDDS.

8.4. EVALUATION 139
As we had only fourASANTE FriendlyNETethernet NICs available the system wastested with one client and up to three servers. The first experiment measures the through-put of FNBD on the new CoPs cluster without influence from the file system and the harddisk. The disk is taken out of the data path by using a RAM disk on the server side, thefile system is eliminated by usingraw devices. Using raw devices means that the systemdoes not use the buffer cache. Without buffer cache, FNBD is a zero-copy system on theclient side, but it loses the automatic read ahead that is handled by the buffer cache. Theexperiment thus measures only the operating system, FNBD’s drivers and protocols, aswell as the network. The throughput is measured with theSpeedprogram and differentuser-level block sizes. The results are shown in Figure8.15. The maximal read through-put is 57.3 MByte/s for block size of 64 KByte or more. Smaller blocks introduce higherlatency overheads because of the missing read ahead. Data-access sizes of databases areoften 4 KByte or 8 KByte large blocks (which match many systems’ page sizes), whichare rather small and could thus result in lower performance. The numbers for writing arenot shown here since they are of less importance in this study. However, the maximalwrite speed is 57.5 MByte/s.
4 8 16 32 64 128 256 512 10240
10
20
30
40
50
60
Th
rou
gh
pu
t [M
Byt
e/s]
User-level block size [KByte]
Figure 8.15: Read throughput with single RAM-disk–based server and differentuse-level block sizes.
To answer the question whether the system can scale—or more precisely whether thesystem can issue and handle multiple requests to different servers in parallel—I performeda scalability test. We can not expect a higher throughput rate than in the previous exper-iment, because a single RAM-disk–based server will most likely reach the performancelimit of the client. Thus, the RAM-disks for this experiment have been artificially limitedto a read-throughput of roughly 20 MByte/s. The user-level block size was 64 KByte ineach case. The results for one to three servers are shown in Figure8.16and indicate thatthe FNBD client scales nicely up to at least three servers with a speedup of 2.65. Thesame experiment for writing result in a slightly lower throughput (1–9% lower).
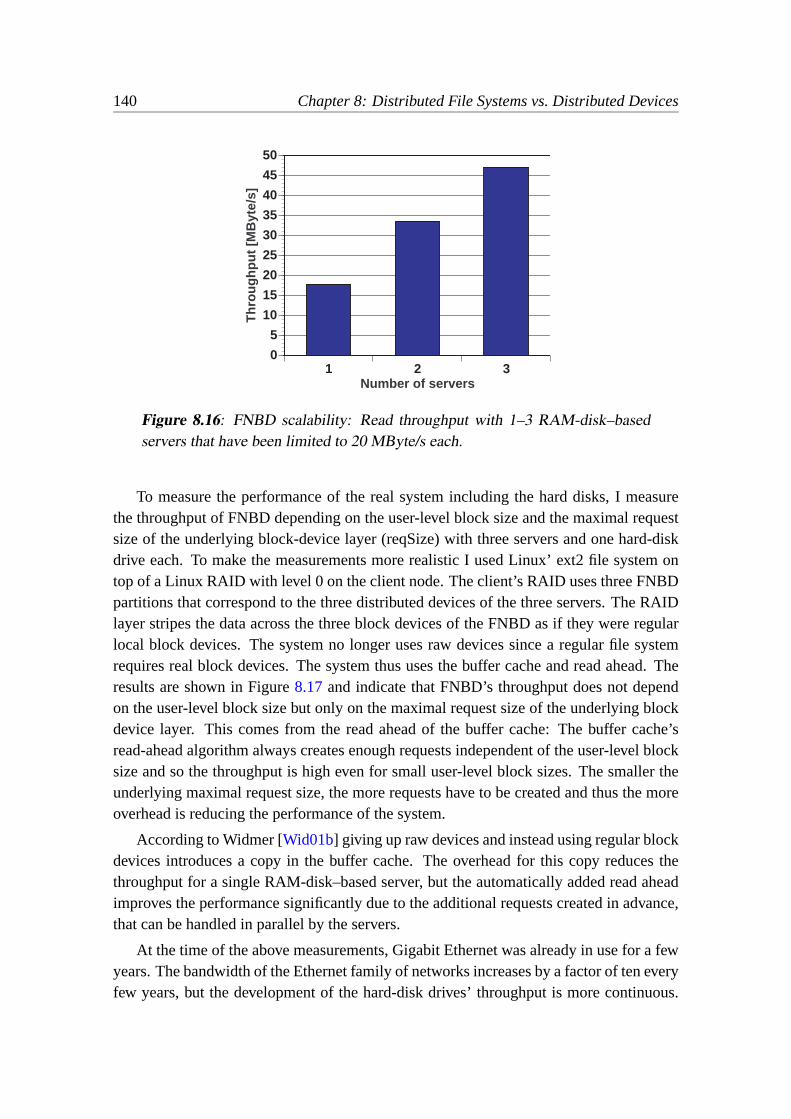
140 Chapter 8: Distributed File Systems vs. Distributed Devices
1 2 30
5
10
15
20
25
30
35
40
45
50
Th
rou
gh
pu
t [M
Byt
e/s]
Number of servers
Figure 8.16: FNBD scalability: Read throughput with 1–3 RAM-disk–basedservers that have been limited to 20 MByte/s each.
To measure the performance of the real system including the hard disks, I measurethe throughput of FNBD depending on the user-level block size and the maximal requestsize of the underlying block-device layer (reqSize) with three servers and one hard-diskdrive each. To make the measurements more realistic I used Linux’ ext2 file system ontop of a Linux RAID with level 0 on the client node. The client’s RAID uses three FNBDpartitions that correspond to the three distributed devices of the three servers. The RAIDlayer stripes the data across the three block devices of the FNBD as if they were regularlocal block devices. The system no longer uses raw devices since a regular file systemrequires real block devices. The system thus uses the buffer cache and read ahead. Theresults are shown in Figure8.17and indicate that FNBD’s throughput does not dependon the user-level block size but only on the maximal request size of the underlying blockdevice layer. This comes from the read ahead of the buffer cache: The buffer cache’sread-ahead algorithm always creates enough requests independent of the user-level blocksize and so the throughput is high even for small user-level block sizes. The smaller theunderlying maximal request size, the more requests have to be created and thus the moreoverhead is reducing the performance of the system.
According to Widmer [Wid01b] giving up raw devices and instead using regular blockdevices introduces a copy in the buffer cache. The overhead for this copy reduces thethroughput for a single RAM-disk–based server, but the automatically added read aheadimproves the performance significantly due to the additional requests created in advance,that can be handled in parallel by the servers.
At the time of the above measurements, Gigabit Ethernet was already in use for a fewyears. The bandwidth of the Ethernet family of networks increases by a factor of ten everyfew years, but the development of the hard-disk drives’ throughput is more continuous.

8.4. EVALUATION 141
1 2 4 8 16 32 64 128 2560
5
10
15
20
25
30
35
40
45T
hro
ug
hp
ut
[MB
yte/
s]
User-level block size [KByte]
reqSize = 64
reqSize = 32
reqSize = 16
reqSize = 8
reqSize = 4
Figure 8.17: FNBD read throughput with different I/O sizes, reading data fromthe disks of three remote servers.
Therefore the ratio of disk throughput to network throughput was significantly higherthan will be at the time when 10 Gigabit Ethernet is widely available. To simplistically“simulate” the scalability of FNBD in an environment where the network is much fasterthan the hard disks, I performed an experiment where the disks have been artificiallyslowed down to 10 MByte/s5. The results are depicted in Figure8.18 and show thatFNBD with the three available server scales up to 17 MByte/s, which is a speedup of1.89. This is in fact lower than expected and might be caused by timing issues as FNBDwas tuned for Gigabit Ethernet and fast SCSI hard-disk drives. For comparison the figurealso includes a bar for FNBD continuously reading data from the buffer caches of thethree servers. This number indicates that FNBD itself would be able to read data muchfaster from more servers if the system was slightly tuned to the lower speed disks.
The attained maximal throughput of 40.6 MByte/s for read operations from three re-mote disks is roughly 14% lower than the 47 MByte/s predicted by the model. Thisdiscrepancy might come from FNBDs preallocated transmission channels that introducesome additional latency. Possible other reasons include the file system’s need to read metadata to handle (large) files, like indirect-block lists, or the small MTU of only 1 KByte ofFNBD’s underlying BTU protocol.
When comparing with the other distributed-device system developed in our lab—theMyrinet Distributed Device System (MDDS)—I see the following differences: MDDSuses the Myrinet NICs processor for some protocol processing and to directly deliverthe incoming data to their final place in the buffer cache of the client, but there is stilla data-copy operation left to cross the protection boundary to the application process inuser space. Thus, the architecture of MDDS is not significantly different from FNBD’s
5The disks were decelerated by setting the SCSI interface to 10 MByte/s in the SCSI BIOS.
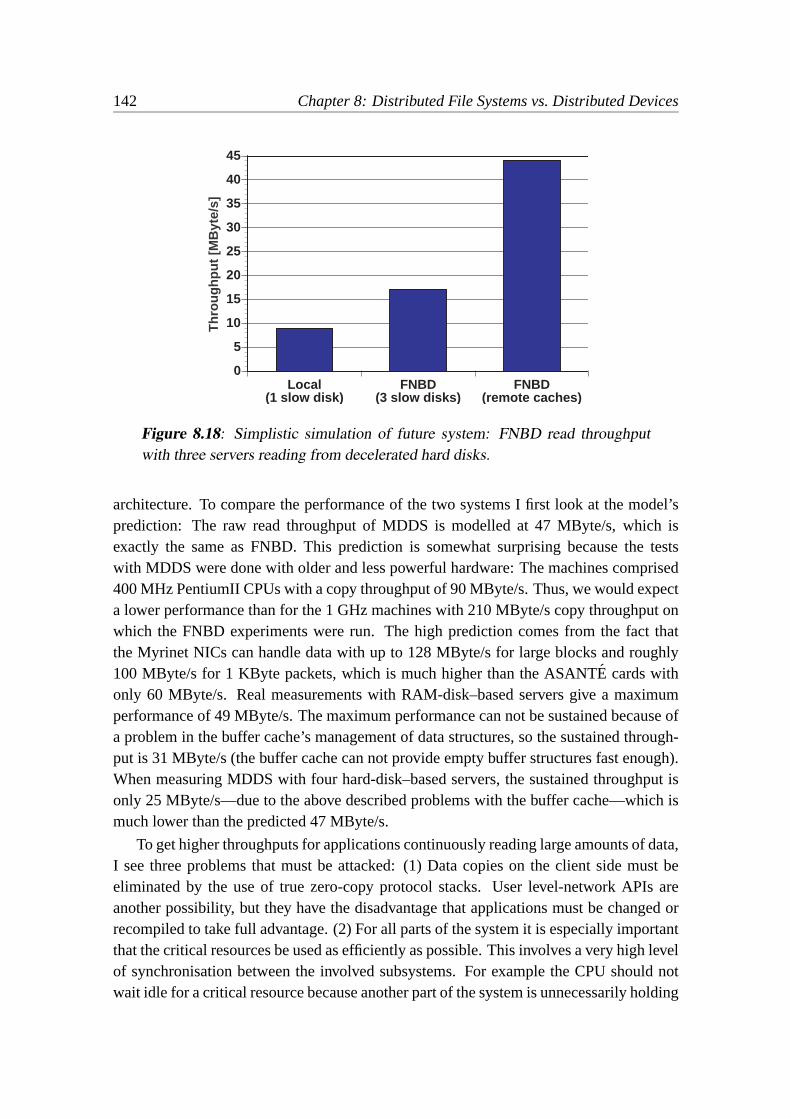
142 Chapter 8: Distributed File Systems vs. Distributed Devices
Local(1 slow disk)
FNBD(3 slow disks)
FNBD(remote caches)
0
5
10
15
20
25
30
35
40
45
Th
rou
gh
pu
t [M
Byt
e/s]
Figure 8.18: Simplistic simulation of future system: FNBD read throughputwith three servers reading from decelerated hard disks.
architecture. To compare the performance of the two systems I first look at the model’sprediction: The raw read throughput of MDDS is modelled at 47 MByte/s, which isexactly the same as FNBD. This prediction is somewhat surprising because the testswith MDDS were done with older and less powerful hardware: The machines comprised400 MHz PentiumII CPUs with a copy throughput of 90 MByte/s. Thus, we would expecta lower performance than for the 1 GHz machines with 210 MByte/s copy throughput onwhich the FNBD experiments were run. The high prediction comes from the fact thatthe Myrinet NICs can handle data with up to 128 MByte/s for large blocks and roughly100 MByte/s for 1 KByte packets, which is much higher than the ASANTE cards withonly 60 MByte/s. Real measurements with RAM-disk–based servers give a maximumperformance of 49 MByte/s. The maximum performance can not be sustained because ofa problem in the buffer cache’s management of data structures, so the sustained through-put is 31 MByte/s (the buffer cache can not provide empty buffer structures fast enough).When measuring MDDS with four hard-disk–based servers, the sustained throughput isonly 25 MByte/s—due to the above described problems with the buffer cache—which ismuch lower than the predicted 47 MByte/s.
To get higher throughputs for applications continuously reading large amounts of data,I see three problems that must be attacked: (1) Data copies on the client side must beeliminated by the use of true zero-copy protocol stacks. User level-network APIs areanother possibility, but they have the disadvantage that applications must be changed orrecompiled to take full advantage. (2) For all parts of the system it is especially importantthat the critical resources be used as efficiently as possible. This involves a very high levelof synchronisation between the involved subsystems. For example the CPU should notwait idle for a critical resource because another part of the system is unnecessarily holding

8.4. EVALUATION 143
a lock. (3) On systems where (1) cannot be implemented, the buffer cache managementis a highly critical resource because all data must go through the buffer cache. Effortsshould thus be directed towards the optimised handling of buffers in the buffer cache.
Distributed File Systems: PVFS
The measurements with PVFS were all done with 6 servers because of two reasons: (1)PVFS reaches better throughput with more I/O nodes (see e.g. [IR99]), so the idea is tosomewhat compensate the higher overhead of a real distributed file system with moreavailable disk bandwidth. (2) At the time of the measurements there was not enough freedisk space in the servers of our test environment to store the 10 GByte that are requiredfor the TPC-D benchmark on only three servers. No measurements were done with RAM-disk–based servers.
The test PVFS’ throughput I use theSpeedmicrobenchmark that reads large amountsof continuous data. The tests are done with different user-level block sizes. The results areshown in Figure8.19, including the corresponding numbers of a local disk for compari-son. The throughput of the local disk is independent of the user-level block size becausethe OS’s read ahead is prefetching data from the disk.
1 2 4 8 16 32 64 128 2560
5
10
15
20
25
30
35
40
45
50
Th
rou
gh
pu
t [M
Byt
e/s]
User-level block size [KByte]
Local disk PVFS(remote disk)
PVFS(remote cache)
Figure 8.19: Comparing the throughput of a local disk and PVFS with sixservers for various user-level block sizes.
The experiments evince that PVFS works well for very large reads: Only user-levelblock sizes of 128 KByte and above offer higher throughputs than a local disk, up to amaximum of 37.1 MByte/s. When the file to be read is in the I/O servers’ buffer caches—

144 Chapter 8: Distributed File Systems vs. Distributed Devices
which is a similar scenario as a test with RAM disks on the servers—then the performanceis higher and reaches 46.1 MByte/s with 64 KByte user-level blocks. These results indi-cate that PVFS was designed for very large reads of scientific applications and is lesssuited for the smaller reads of database systems.
PVFS reaches only about 52% of the model’s predicted 72 MByte/s for raw readsfrom the servers’ disks (62% when reading from the servers’ buffer caches). There aresome reasons that could account for this large discrepancy: A real distributed file systemhas a much higher overhead than distributed devices as it has to make sure that meta datais updated—even when reading a file—and it must check whether a file or parts of a fileare currently in use by other processes somewhere in the distributed file system’s networkto maintain data consistency. These updates and checks often require other servers to becontacted, which results in additional latencies that are not captured by the stream-basedmodel. Another reason might be the user-space–based daemon on PVFS’ server nodeswhich results in many context switches per requested data block. These context switchescharge on CPU and memory resources and are not well accounted for in the model.
The other distributed file system developed in our laboratory is GigaFS, as describedin Subsection8.3.4. The major architectural difference between GigaFS and PVFS is thatGigaFS is implemented as a file system on the client node, while PVFS is essentially alibrary that implements the file-system functionality. GigaFS was deliberately kept sim-ple to allow for higher throughputs of data-stream–based applications, while PVFS wasdeveloped for large applications with many processes accessing the file system concur-rently. These different backgrounds are visible in the performance of the two systems6:With one client reading small user-level blocks (up to 64 KBytes) from 1–16 servers Gi-gaFS’ throughput is 30–40% higher than PVFS’, for very large user-level blocks (largerthan 16 MBytes) PVFS is a few percents faster. The difference becomes even more ap-parent when comparing more than one client reading at the same time: PVFS scales muchbetter with the number of clients concurrently reading from the servers’ disks. However,this scenario has been researched extensively and is not of interest in this study.
Discussion of Microbenchmark Results
To conclude the microbenchmark measurements I compare the three systems with a lo-cal disk, with the distributed device system FNBD and with the distributed file systemPVFS. Because the database system used in the coming paragraphs uses 4 KByte user-level blocks, I show the large-scale read throughput of the three systems for 4 KByteblocks in Figure8.20. The results show that for this setup the stream-oriented FNBDachieves a 23% higher throughput than a single local disk. PVFS reaches only 30% of thelocal disk’s throughput.
6GigaFS’ performance numbers are taken from [Wit01].
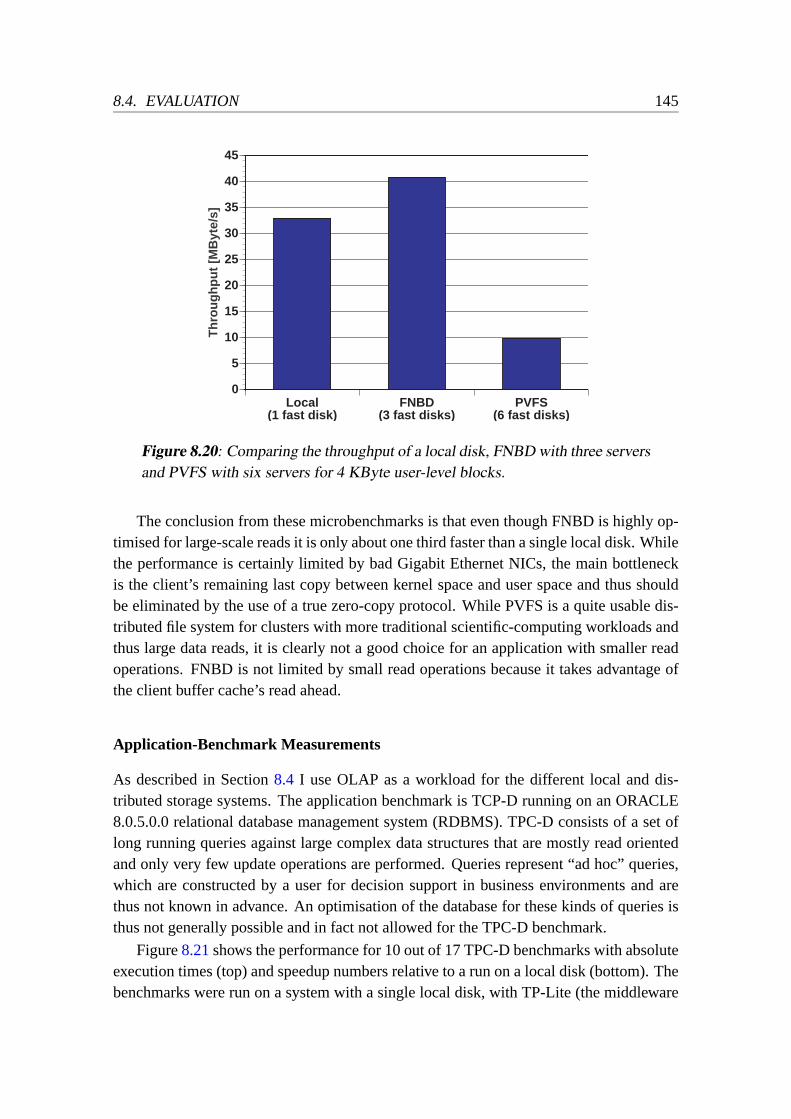
8.4. EVALUATION 145
Local(1 fast disk)
FNBD(3 fast disks)
PVFS(6 fast disks)
0
5
10
15
20
25
30
35
40
45
Th
rou
gh
pu
t [M
Byt
e/s]
Figure 8.20: Comparing the throughput of a local disk, FNBD with three serversand PVFS with six servers for 4 KByte user-level blocks.
The conclusion from these microbenchmarks is that even though FNBD is highly op-timised for large-scale reads it is only about one third faster than a single local disk. Whilethe performance is certainly limited by bad Gigabit Ethernet NICs, the main bottleneckis the client’s remaining last copy between kernel space and user space and thus shouldbe eliminated by the use of a true zero-copy protocol. While PVFS is a quite usable dis-tributed file system for clusters with more traditional scientific-computing workloads andthus large data reads, it is clearly not a good choice for an application with smaller readoperations. FNBD is not limited by small read operations because it takes advantage ofthe client buffer cache’s read ahead.
Application-Benchmark Measurements
As described in Section8.4 I use OLAP as a workload for the different local and dis-tributed storage systems. The application benchmark is TCP-D running on an ORACLE8.0.5.0.0 relational database management system (RDBMS). TPC-D consists of a set oflong running queries against large complex data structures that are mostly read orientedand only very few update operations are performed. Queries represent “ad hoc” queries,which are constructed by a user for decision support in business environments and arethus not known in advance. An optimisation of the database for these kinds of queries isthus not generally possible and in fact not allowed for the TPC-D benchmark.
Figure8.21shows the performance for 10 out of 17 TPC-D benchmarks with absoluteexecution times (top) and speedup numbers relative to a run on a local disk (bottom). Thebenchmarks were run on a system with a single local disk, with TP-Lite (the middleware

146 Chapter 8: Distributed File Systems vs. Distributed Devices
1 2 3 4 6 9 10 12 13 170
0.5
1
1.5
2
2.5
3
Sp
eed
up
TPC-D benchmark number
Local disk(1 disk)
TP-Lite(3 servers)
FNBD(3 servers)
PVFS(6 servers)
1 2 3 4 6 9 10 12 13 170
200
400
600
800
1000
1200
1400
1600
1800
Exe
cuti
on
tim
e [s
]
TPC-D benchmark number
Figure 8.21: Performance of TPC-D benchmark queries with execution times(top) and speedups (bottom).

8.4. EVALUATION 147
for distributed databases) connected to three RDBMSs, on FNBD with three servers andon PVFS with six servers. The figure does not include numbers for queries 5, 7, 8, 11,14, 15 and 16 because they do not complete on all systems. Speedup numbers are relativeto the system with a local disk. The results indicate that TP-Lite’s performance is higherthan for the other systems in 7 queries, while PVFS has the lowest performance in 9queries because of its low performance for small user-level block sizes. FNBD surpassesthe local-disk system only in query 2 and is otherwise slightly worse (actually for the notshown query 11 FNBD is much faster than the local disk because of the larger distributedbuffer cache on FNBD’s servers. Query 11 has been omitted from the figure because thequery did not complete in our TP-Lite setup). Even though the model predicted higherperformance for FNBD than the local disk and even though the microbenchmarks seemto support this prediction, FNBD is slightly slower in almost all queries. While TP-Litesurpasses the other systems by a factor of two for most queries, it is slightly worse thanFNBD in queries 2, 9 and 10.
Local disk(1 disk)
TP-Lite(3 servers)
FNBD(3 servers)
FNBD raw(3 servers)
PVFS(6 servers)
0
100
200
300
400
500
600
700
800
900
1000
Exe
cuti
on
tim
e [s
]
Figure 8.22: Execution times for disk-limited TPC-D benchmark number fouron all examined systems.
Taufer et al describe in [TSW02] that the performance of TPC-D query number fouris disk bound. Since this study is examining systems for large contiguous read opera-tions I show the results of the different systems for this specific query in Figure8.22.In addition to the above systems the figure includes numbers for FNBD on raw devices.This means that the file system containing the RDBMS’s data files is installed on top ofa software RAID that accesses FNBD’s distributed devices as raw devices. Raw devicesare block devices not using the buffer cache and thus saving a copy operation from thebuffer cache to the user space. Because of the removed copy operation we would expecthigher performance on raw devices, but the buffer cache is also responsible for read-aheadoptimisations. As we see in the figure, the performance is reduced more by the loss ofread-ahead optimisations than it is improved by the economised data copy. The figure

148 Chapter 8: Distributed File Systems vs. Distributed Devices
indicates that FNBD is able to uphold the performance of OLAP on a single local disk,but PVFS more than doubles the execution time.
Fast disk(s) Slow disk(s)0
200
400
600
800
1000
1200
1400
Exe
cuti
on
tim
e [s
]
Localdisk
FNBD
Figure 8.23: Simplistic simulation of future systems: Execution times for TPC-D benchmark number four with fast and slow disks.
It is somewhat disappointing that FNBD—despite its three parallel servers and itsslightly higher raw-read throughput—does not result in a higher performance for OLAP.In our current experimental environment the disks’ raw throughput is roughly one thirdof the network’s raw throughput. The disks were high-performance disks at the timeof their purchase as can be seen in Figure2.5. As observed in Subsection2.1 this gapwill widen drastically with wide availability of 10 Gigabit Ethernet. To get a rough ideaabout the performance of systems with average disks as well as future systems with high-performance networks I also measure the execution time of TPC-D query number fourwith slower hard disks in Figure8.23(ignoring the development of other subsystems likee.g. the memory bandwidth). Basically this experiment simulates an environment wherethe network is much faster than the disk. For the experiment with the slow disks theSCSI interface of FNBD’s servers was limited to 10 MByte/s resulting in a real raw diskthroughput of roughly 9 MByte/s. The figure shows that the execution time of TPC-Dquery four increases much more for a single local disk than it increases for FNBD withthree servers and a slow disk each. The results look promising for a future with even fasternetworks and suggest that TPC-D performance could become better relative to a singlelocal disk for FNBD on a future system.
Table8.5 lists the results of the OLAP experiments similar to the predictions of themodel in Table8.4: The first column lists the measured raw-read performance of the un-derlying communication system (TCP for TP-Lite) or file system (for the other systems).The accuracy for the local disk, TCP (for TP-Lite) and FNBD ranges from 1–14%, but theprediction for PVFS is off by nearly an order of magnitude. I attribute this to the higheroverhead of a full-featured distributed file system which can not be modelled accuratelyby a data-stream–oriented model. The second column of Table8.5 lists the executiontime for the disk-bound TPC-D query four. These numbers are all in the predicted range

8.5. SUMMARY AND CONCLUSIONS 149
System Underlying sub- TPC-D Query OLAP through-name system raw read number 4 put (est.)
[MByte/s] runtime [s] [MByte/s]
Local disk 32.7 446 26.0TP-Lite 109 162 71.5PVFS 9.8 938 12.3FNBD 40.6 469 24.7
Table 8.5: Measured performance of different systems.
of the model, which is not surprising since the model predicts a wide range between agood case and a bad case. Nevertheless, a trend predicted by the model is verified bythe experiments: TP-Lite is much better than the other systems, with the local disk andFNBD at similar performances. Again, the prediction of PVFS is completely off bounds.The last column of the table contains estimations of the data throughput for the OLAPexperiments, based on the amount of data read and the time spent. The values are thenumber of MBytes read per second in uncompressed form by the servers. TP-Lite clearlyleads because of its preselection of data on the RDBMS’ servers. FNBD and the localdisk have about the same throughput because both systems have one important data copyleft on their clients to cross the protection domain border between kernel and user space.The other copy between the RDBMs and the 4GL interpreter is less important becausethe RDBMS’ filters the data quite heavily and forwards only a few hundred bytes. It isespecially interesting to note that the performance of the TPC-D queries is not higher onFNBD than on a local disk—despite the higher raw read performance of FNBD. The rea-sons for this paradox are not certain, I suspect a slightly higher latency for FNBD becauseof the network and the more involved layers on client and servers. Another paradox is thatthe estimated OLAP throughput on PVFS is higher than the raw read throughput of theunderlying file system, which looks impossible at first sight. The reason for this apparentcontradiction is that PVFS is the only system that used six servers instead of three andthus had much more aggregate buffer cache available on the servers.
8.5 Summary and Conclusions
At the beginning of this chapter I presented the architecture of distributed devices. Dis-tributed devices simply map a remote (block) device to the local machine. By aggregatingmultiple remote devices a system easily gets a simple form of parallelism by striping dataover the remote devices. Examples of systems with distributed devices are: (a) Petal,which uses a user-space server, (b) Network Block Device (NBD) with user-space dae-mons for clients as well as servers, (c) Myrinet Distributed Device System (MDDS) whichis highly optimised for Myrinet with no user-space parts on client and servers and (d) Fast

150 Chapter 8: Distributed File Systems vs. Distributed Devices
Network Block Device (FNBD) optimised for our Gigabit-Ethernet hardware, also withno user-space parts.
Then I presented distributed file systems that offer full file-system functionality withdistributed servers. A distributed file system offers features such as buffer cache consis-tency and concurrent file access from multiple clients. As it does not necessarily build ontop of distributed devices, a distribute file system can be implemented on different layerswithin a system. Examples are: (a) Lustre, which uses object storage targets (OST) asstorage servers that access object-based disks (OBD) and is aimed at very large clusters,(b) Frangipani that builds on top of Petal, (c) PVFS, that implements file system function-ality in a library that is linked to the main application and intercepts file system calls, and(d) our own prototype GigaFS.
Subsequently I describe the workload to compare distributed storage on our multi-usecluster of commodity PCs. The workload should do I/O limiting, large, read-only andstream-based data accesses. These types of workloads are more interesting to examinein a high-performance environment as they are not bound by the latency of the hard-diskdrives and they can therefore be modelled with our stream-based model. With these re-quirements I found On-Line Analytical Processing (OLAP) as a suitable candidate. Whilesimply installing more disks in the nodes of multi-use clusters of commodity PCs couldcertainly increase the performance of OLAP applications, I do not consider this a viablealternative because it has several drawbacks. I discuss the possibilities of replicating andpartitioning the data for distribution and find the partitioning approach more interesting. Idiscuss the different layers of a computer system where the data gathering could be imple-mented. On the application layer I consider TP-Lite, a piece of middleware that supportsa database in the distribution of queries to RDBMS instances running on remote nodes.
As a next step I analytically modelled the performance of OLAP on a local installation,with TP-Lite, PVFS and FNBD. Because OLAP queries are difficult to model I assumed agood and a bad case as representatives for stream-oriented data-gathering applications andintegrated them into the model. An analysis of some TPC-D queries shows that while thequeries read a lot of data, their resulting data output is very small. The model predictedthe highest performance for TP-Lite because its distributed RDBMS servers efficientlypreselect (or filter) data before sending it to the potentially limiting client. The othersystems all have a similar, albeit lower performance for the bad case because the CPUof the client is the main bottleneck when handling the large amounts of data, but for thegood case PVFS is predicted to have clearly superiour performance to FNBD, which isonly slightly better than the local disk. However, the model can not capture the complexinteractions between the different subsystems on the client and the servers, so I expect itto be less accurate than for the simpler experiments from earlier sections.
Before presenting the experimental performance measurements I briefly described theTransaction Processing Performance Council’s TPC benchmarks and explained why I usethe TPC-D benchmark as workload for the OLAP experiments.

8.5. SUMMARY AND CONCLUSIONS 151
At the beginning of the measurement section I present the results of microbenchmarkson the selected systems. The results indicate that FNBD reads data at about 40 MByte/sindependent of the user-level block size due to the buffer cache’s read ahead, which isslightly better than a single local disk. PVFS is optimised for large data reads and offersonly a disappointing 10 MByte/s for small reads.
As application benchmarks I present the results of OLAP queries with an ORACLERDBMS. Test runs with 10 out of 17 queries from the TPC-D decision-support bench-mark suite show that TP-Lite is best in most cases, while the local disk is on the secondplace for most of the benchmarks. In general FNBD is only slightly slower than a localdisk, while PVFS has clearly worse performance. When analysing the disk-bound querynumber four I found that raw devices for FNBD (and thus no data copies in the buffercache) do not speed up the benchmarks because of the missing read-ahead optimisation.As a last experiment I run query number four with artificially decelerated SCSI disks tosimplistically simulate an environment where the network is much faster than the disk.The results indicate that the approach with the distributed devices looks promising onsuch a future system. Regarding the predictions of the analytic model, the measured per-formance for the local disk, for TP-Lite and FNBD match the predictions approximatelywithin an error of up to 15% (which is acceptable for a data-stream oriented model ap-plied to such rather complex systems). Only the prediction for PVFS is completely off interms of accuracy.
While TP-Lite is the best solution, we showed that distributed devices are a viablelarge-data–set alternative to local disks for data-intensive applications which cannot easilybe changed or parallelised. Distributed devices are not able to speed up OLAP querieson our system, but could roughly match the performance of an installation with a localdisk. In the future with relatively fast networks and slow disks distributed devices mightactually even speed up the tasks.
As a conclusion from this chapter I list some recommendations for the design of sys-tems that handle the gathering of distributed data from remote disks:
• Handling the distribution of data in the application itself or in a piece of middleware(like TP-Lite) is best if it helps to preselect (or filter) data on the servers beforesending it to the client, thereby reducing the load on the client.
• Individually using the local disks of many client nodes is best for applications thatcan easily work with multiple instances of replicated data.
• Full-featured distributed file systems are best for applications where many clientsneed to access a large shared data set or for very large clusters.
• Distributed devices suit smaller systems where the application cannot be changed,but still uses the additional excess storage capacities of multi-use clusters for largerdata sets.
152 Chapter 8: Distributed File Systems vs. Distributed Devices
While our own system FNBD was able to overcome the raw data throughput of alocal disk, it could not speed up the performance of an OLAP benchmark on a localdisk. Experiments with a higher gap between the throughput of the network and thedisk—as expected for future systems—indicate that the distributed devices might becomemore attractive in the future. Distributed devices thus proved to be a viable, transparentapproach to parallelise applications with high data-gathering demands without changingthem.

9Conclusions
Work for something because it is good,not just because it stands a chance to succeed.
Vaclav Havel
In this chapter I summarise my contributions to the state of the art in distributed stor-age systems, indicate the areas in which my work could be extended in the future andconclude this thesis with some remarks about what we learned from our modelling ef-forts, from our implementations and the experimental evaluation of our systems.
9.1 Summary and Contributions
The success of commodity PCs led to highly powerful systems outperforming traditionalsystems with a very attractive price/performance ratio. In many places there is a hugeamount of computational power and storage capacity installed, but still many of theseresources are much underutilised. The utilisation of the resources can be improved byadopting a view of multi-use clusters and desktop grids. The increasingly flexible useof the resources in these systems requires new techniques in OSs. A more flexible andscalable distributed OS must support and simplify the management of these distributed re-sources and enable their use for high-performance computing applications at a reasonableefficiency.
My view of Multi-use clusters of commodity PCs comprises not only traditional PCclusters, but also administrative employees’ desktop machines, engineers’ workstationsand PCs from student laboratories. The combination of all these machines allows toincrease a company’s or organisation’s installed power for computation, data processingand storage. Traditional computational clusters are quite static in their use, as they runwith a separate OS image on each machine that is integrated only by a batch job queuingsystem. Similarly, accumulations of PCs in laboratories or classrooms are used onlyinteractively and are idle or switched off during non busy hours. The new view of multi-
153
154 Chapter 9: Conclusions
use clusters in commodity computing and the resulting OS extensions provide for a quickand flexible change in the machine environment to accommodate the needs of differentusers. The multi-use cluster installation may be used for various purposes, e.g. as officemachines during the day and as computational and storage nodes during the night andweekends. The machines in a university’s lab can avoid specialisation and be used forall the different classes, even if they require a variety of different OSs, configurations orsecurity settings.
Although the disks in the multi-use clusters’ nodes must store multiple copies of OSinstallations, there is a vast amount of extra storage available for use by the users’ appli-cations if it can be managed properly—this is because the storage capacity of commoditydisk drives currently grows at a much faster pace than the storage requirements of thesystem software that is replicated to each system. This technological trend leads to theneed of a more flexible, fully distributed management of these resources. In the cur-rent client/server world storage is provided with a very-high–performance I/O system inservers. Besides some additional flexibility of management in distributed storage, thepeak high-performance and the transparency of central systems must still be attained tobring system architects away from the traditional route of simply buying more RAIDdisks for their servers—and wasting available resources and unnecessary money in theclient machines. Our approach with distributed file systems and distributed devices main-tains transparency and focuses on high performance.
The very flexible use of computers as multi-use clusters leads to some interestingproblems and questions in modern operating systems research: In a scientific approachto solve those problems we need a powerful analytic model to predict data streams thatflow in the different parts of a system and between the nodes of a multi-use cluster ofcommodity PCs. A model can give the answers to the question on how we can implementan efficient replication that allows to quickly reinstall systems on many nodes of a cluster.Managing multiple OS installations in a multi-use cluster leads to the need for an efficientmethod to centrally store all the different versions of system installations, which consistof largely replicated and identical data. The storage need of the user applications finallyleads to the question of how to access the excess amounts of local storage that are installedon the different nodes of the cluster. All these interesting systems research problems areadjacent to, but not directly addressed by research and product development in the closelyrelated fields of SAN (storage area networks) and NASD (network attached storage de-vices), RAID (redundant arrays of inexpensive disks) for high-performance I/O, killerworkstations used in OLAP (on-line analytic processing) or Internet and storage grids.
To motivate my detailed technical contributions, I described the four PC clusters thatwere architected by our group at the department of computer science at ETH Zurich andlead to my studies of this topic in this experimental thesis. I used most of these clustersfor some of my experiments and my work was instrumental to build and evaluate theseprototype production machines. The use of several generations of computing hardware
9.1. SUMMARY AND CONTRIBUTIONS 155
allowed to follow the progress of technology, but implicated working in the real world,where subsystems had hardware glitches, dissatisfying performance or parts that did sim-ply not comply with their specifications. For some of the system software developed inthese projects, it was hard or even impossible to keep up with the different revisions ofhardware and OS kernels that we used during all those years.
Starting from the four conceptional aspects of multi-use clusters given above and thevast experience in building real systems during my six years of research, I developedmy four scientific contributions in the thesis that I briefly summarise in the followingparagraphs.
9.1.1 Modelling Data Streams in Clusters
In Chapter5 I present a powerful analytical model that is based on reliable and flow-controlled data streams. My work extends existing simple models for clusters. A firstbasic model includes network topology, the overall switching capabilities of the partic-ipating nodes as well as the network parameters like link bandwidths. It distinguishesbetween physical networks installed and the logical networks used for distributing data.An extended model attempts to explain and describe the internals of the active nodes thatparticipate in handling the data streams in a system. The extended model’s focus is onthe utilisation and the limitations of the CPUs, the buses, memory systems and storagedevices used by the data stream in an active node. The limiting resources in a typical nodeof a multi-use cluster of commodity PCs depends strongly on the configuration and thelayout. In some cases it is the I/O bus, the memory subsystem, the CPUs or even somehard-disk drive. The model allows to integrate features like data compression or multi-casting capabilities by modelling an additional module as a throughput-limited subsystemthrough which the data stream has to flow.
My extended model goes more into the details of the hardware than many other higher-level models. After working intensively with the model it can be said that it is certainly nottoo complex. The input parameters that the model requires are the data-stream through-puts of the nodes’ subsystems. These values can be determined experimentally by mi-crobenchmarks (the most convincing method for existing nodes), found in technical datasheets (which are not always as trustworthy as they should be) or estimated based ontechnological roadmaps (for future systems that do not yet exist).
The model helps to understand the performance of current systems and guides imple-mentations towards optimal configurations. It is also useful to predict the performance offuture systems.
9.1.2 Data Casting
As an immediate application of my modelling effort I analyse and optimise efficient datacasting in multi-use clusters as described in Chapter6. This is a key technique to manage

156 Chapter 9: Conclusions
and replicate widely distributed OS installations to many nodes of a multi-use cluster ofcommodity PCs. Such a replication must be quick to reduce the downtime of clusternodes due to maintenance and re-dedication of the resources.
In the search of the most robust and most efficient solution I examined four differentimplementations in more detail: (a) A reliable multicast implementation on top of IPmulticast, that would use the network optimally in theory. Since reliable multicast is anontrivial operation, there are still practical problems and the replication works only withfixed bit rates determined in advance. (b) A very simple alternative implementation is withan NFS server from which clients read large image files as this can be done with existingUNIX OS capabilities that are installed everywhere. This solution leads to no scalabilitybecause all connections went through a bottleneck in the server’s network link, whichmakes the system highly dependant on the number of clients and destroys scalability.(c) The theory of optimal broadcasting solutions suggests a tree with limited fan-out,that did really scale better, but did not make full use of the network links. (d) The bestsolution suggested by our model and proven in practice with our cloning toolDolly usesa linear multi-drop chain in most physical network configurations to replicate the data.The solution performs best since it puts a minimal load on the nodes and uses every linkonce and only once in every direction. Looking at the topology alone, a multi-drop chainas data-distribution topology seems counter intuitive, but delivers superior performancethan other multicast protocols and tools, and most physical network graphs offer a simpleway to find an Euler tour. The multi-drop chain even achieves perfect scalability for largeamounts of data.
Verifying the predictions of the analytic model with the results from the data castingexperiments, I found that the model is certainly not perfect, but correctly predicts the per-formance of the three important alternatives as described above: Lower fan-out degreesperform better because of lower link and node usage, compressing data is mostly counter-productive (except for highly reduced networks) and the uncompressed multi-drop chaintopology offers highest throughput for the data-cast operation.
My data-casting tool Dolly—resulting from this analysis and technical contribution—allows to quickly replicate OS installations to many nodes in a cluster and is in practi-cal use for years. With Dolly, we used to clone a 2 GByte Windows NT installation to24 workstations in less than 5 minutes. On Xibalba, our current departmental cluster, weclone 20 GByte of data per node in about 16 minutes to 127 target nodes. The tool wasreleased to the community under the rules of an open-source distribution, became quicklypopular and a basis for a variety of follow-on projects elsewhere.
9.1.3 Efficient Data Storage for Evolutionary Partition Images
Because of the many different user requirements in a multi-use cluster of commodityPCs, that might even apply to the same nodes, software maintenance is becoming more

9.1. SUMMARY AND CONTRIBUTIONS 157
complex in this class of machines. OS-independent cluster maintenance requires a cleanabstraction of OS installations and a tool able to store all the abstract states of the node’sOS images on the corresponding disk partitions. To maintain independence from thedifferent file systems used in current OSs and from the all different meta information onfiles, my proposed scheme and implemented archival system builds on the storage anddistribution of whole partition images.
There are two reasons for a dedicated solution to replicated storage of partitions in asystem-software archive. One reason is the temporal evolution of system software dueto upgrades or installations of new software packages. The other reason is the need forindividual customisations for heterogeneous hardware, network or licence configurationsof different nodes in a multi-use cluster. These evolving and customised partition imagesare similar to each other and contain much redundant data: The images have vertical wayalong the axis of time or version history and in a horizontal way along the spacial axis ofa software distribution to all the different machines in a multi-use cluster.
I proposed, implemented and evaluated three different archival techniques for evolu-tionary partition images. The most simple approach stores full partition images includingall redundant data. A second approach creates “diffs” by comparing blocks linearly withinpartition images. My new and most advanced approach with “block repositories” com-pares all blocks against each other by using hash values, thus eliminating all redundantblocks.
I compare the three approaches by conducting experiments with different productiveOS installations in multiple versions. The block repositories clearly require the leastamount of storage space, but are worse than full images for block-compress algorithms.The increase in a block repository’s size is similar for the installation of the same softwarepackage on two different OSs with completely different file systems, which demonstratesblock repositories’ independence of the OSs and the file systems. Other partition archivaltools are either independent of the OS and file system, or they store the partition dataefficiently, but not both.
Tests with fully customised productive Windows NT images showed that 75 installa-tions in different versions and for different machines with a size of 2 GByte each will fiteasily into a block repository of only 4 GByte.
9.1.4 Distributed File Systems vs. Distributed Devices
The aspect of using surplus storage in user applications lead to research for the best formof distributed storage in multi-use clusters. In particular the two alternatives distributeddevices (with one file system) and distributed files (with one file system per device) wereconsidered. Bydistributed devicesI mean a device mapped from a remote machine overthe network to a local machine, which appears there as if it was a regular local device.Parallelism is then obtained by striping data across multiple distributed devices, mapped

158 Chapter 9: Conclusions
to different remote nodes. With such a setup, a node can gather data from the excessstorage capacities of other nodes.
In Chapter8 I then present and compare four distributed-device systems: (a) Petal,which offers distributed virtual disks that collect multiple distributed devices into a singlevirtual disk, (b) the Network Block Device (NBD) which is mostly user-space based,(c) our prototype of a Myrinet Distributed-Device System (MDDS) which is especiallywritten for the Myrinet network and (d) our own implementation FNBD that uses specialfeatures to implement channel separation on our Gigabit Ethernet hardware.
For a comparison of technologies I looked at some distributed file systems, which ingeneral offer more features than distributed devices, like e.g. cache consistency or thelocking of files. Often these more features come at a cost of lower performance andefficiency, i.e. only a fraction of the installed disk bandwidth is passed to the application.The discussed systems are: (a) Lustre, which is targeted at very large cluster installations,(b) Frangipani that builds on top of Petal’s distributed virtual disks, (c) PVFS which isimplemented as a library linked to applications and intercepting their system calls and(d) our own prototype GigaFS with its kernel-level implementation of a file system thatconnects to user-space daemons on the servers.
As a workload for our data-gathering setup on multi-use clusters of commodity PCswe use database workloads with on-line analytical processing queries as an application.Queries of OLAP are ideally suited for testing distributed storage, because many of themare I/O limited and perform large read-only stream-based data accesses. Some interest-ing tradeoffs remain regarding the layer where the handling of distributed data should beimplemented. The layers that I investigate in more detail are (from the bottom up) dis-tributed devices and distributed file systems as described above, as well as an approachwith middleware (TP-Lite) that parallelises queries by distributing them to multiple re-mote RDBMS servers. The use of distributed file systems and distributed devices is anew and fully transparent approach to bring DBMSs to commodity clusters.
The microbenchmark measurements reveal that FNBD reads data from three remotedisks about 24% faster than from a local disk. As PVFS is optimised for for very-largereads, it reads data only with a throughput at about one third of the throughput of a lo-cal disk for 4 KByte user-level block sizes. The analytic model predicts a much higherthroughput for PVFS than for FNBD, mostly because of the slow Gigabit Ethernet cardsthat we use for FNBD. The model can not capture the increased complexity of a full-featured distributed file system accurately.
I measured application performance with the TPC-D benchmark on an ORACLERDBMS. Their results show that the approach with the TP-Lite middleware is the bestfor most of the performed queries. The local disk is the second fastest approach, closelyfollowed by FNBD. The OLAP on PVFS was clearly worse than the other approaches.While the model correctly predicts the highest performance for TP-Lite, and similar per-formances for the local disk and FNBD, the prediction for PVFS was much too optimistic.

9.2. FUTURE WORK 159
While the handling of distributed data in a middleware layer—which knows about thecontents of the data requests and the transported data—seems to be the best approachconceptually, distributed devices are a viable alternative for accessing local disks as dis-tributed storage transparently and without modification/parallelisation of the application.Distributed devices allow to extend storage space by the use of the excess storage onthe disks of a small number of remote nodes in a multi-use cluster of commodity PCs.Full-featured distributed file systems are less suited for OLAP workloads.
9.2 Future Work
As a first line of future work, the detailed analytic model of data streams in clusters couldbe extended to better handle data streams with increased complexities. Such streamingconfigurations might become more common in future enhanced systems, because suchcomplex data streams have dependences between each other. In particular the model couldbe tested with video streams in a video-on–demand distribution system. Such systemshave interesting bandwidth/processing tradeoffs due to a variety of video compressionschemes.
A refined model should deal with the more realistic view of the memory hierarchyin the processing elements. Not all the copies or transfers have the same cost. Somedependences between related copies of the same stream come from the CPU’s cache whena stream is handled or copied twice in short sequence. An example of such a situation iswhen the stream is read by the CPU, possibly processed, then stored to a buffer andimmediately afterwards copied to another buffer, e.g. a system buffer. This last copy mightread data from the CPU’s cache (depending on the scheduling) and is thus faster than aregular memory copy. These kinds of interdependencies are not yet handled by the model.Since the memory speed is not improving as fast as CPUs, memory hierarchies are likelyto become more important in future systems and the effects of such interdependenciesmight become more relevant for my analytic model of data streams in clusters.
TheDolly tool used for partition replication proved to be a helpful tool for system ad-ministration, but it is only a prototype at this time. My data-casting technique should beextended in two ways: First, the data casting could be extended to automatically discoverphysical topologies and map a suitable logical topology on top of the physical network.For most current cluster installations the topology is rather trivial, but for future largemulti-use clusters with a high number of nodes and many subclusters, ideal topologiesmight become more complicated. Secondly, as a more practical point, Dolly should in-clude improved methods for crash recovery. When a node fails, e.g. because of a brokenor defective hard-disk drive, Dolly should continue to clone the other nodes in the ringand alert the system administrator about the failed replication. Such an extension mustalso handle defective blocks in the middle of a disk partition, when a partition can onlybe partially written.

160 Chapter 9: Conclusions
As our multi-drop chain was a highly successful topology for high-performance datacasting, it would be a worthwhile challenge to integrate it into other data-casting applica-tions from other application domains. It would be interesting to see if it is able to speedup high-performance–computing applications when integrated into MPI middleware. Ofcourse, the multi-drop chain has an increased latency compared to other topologies, whichstarts to become important for shorter data casts. Still it might improve the performanceof large broadcast operations or the distribution of large input data sets to all nodes in aparallel computation.
To make the block repositories a more efficient storage technique, it would be inter-esting to investigate the possibility of using a larger block size for the block repository toachieve a good tradeoff between access time to individual blocks and compression ratio.Compacting some blocks into a larger “compression unit” might reduce the size of theblock repository even more, but requires to keep hash values of the contained blocks foreasier comparison of blocks in the repository with blocks of new partition images. Accessto individual blocks would require to uncompress (partially or as a whole) compressionunits, thus trading space against time. To find the ideal tradeoff is a topic for furtherresearch.
My extensive studies on distributed storage architectures like distributed file systemsand distributed devices lead me to propose the following essential requirements for fu-ture systems, which imply the future work on this part of my thesis. The evolution ofsystem-software support will be driven by technology trends in infrastructure built fromcommodity components. Faster network interconnects as well as faster CPUs will beavailable due to future technologies visible on todays roadmaps already. Yet for all goodsolutions the nodes require a fast memory subsystem and fast CPUs to handle all the in-coming and outgoing data streams that make up a distributed storage solution, especiallywhere multiple data streams get together (e.g. in traditional file servers, or even for ourdata-gathering scenario for peak performance in distributed storage the clients are still thebottlenecks because they read from multiple servers concurrently). Parallelising clientsand applications is the obvious solution in theory, but changing complex application codeswill always remain a hard thing in practice. For the practical use there will always be ademand for a high-performance devices based on distributed disks, that does distributiontransparently in system software.
Since networks are likely to improve quicker than memory subsystems, alternativetechniques must be found to speed up the client side in distributed storage architectures.Ideal candidates for better implementation techniques are true zero-copy architectureswhere data copies are completely eliminated. Eliminating data copies could also be ac-complished by RDMA protocols that help to store incoming data streams directly to theirfinal memory locations, thereby enabling true zero-copy architectures. Such protocols arenot yet widely implemented in commodity OSs and not yet ideally supported by com-modity hardware.

9.3. CONCLUDING REMARKS 161
Designers of storage systems and storage architectures should keep in mind to con-sider support for data streams, even if the user-level block sizes for large data accesses areknown to be small. The systems must be prepared to handle data streams efficiently, de-spite the short term user demands for e.g. low latency, ease of management or security. Ona longer timescale and in the more distant future, this leads directly to the re-emergenceof stream-based computer architectures, that have additional hardware capabilities forstreams of I/O to, from and through the memory system in addition to a conventionalmemory hierarchy.
The current research prototypes for data replication from Chapter6 and block repos-itories from Chapter7 should be combined to form a comprehensive environment forbackup, storage and replication of hard-disk partitions in a multi-use cluster. Alterna-tively an existing fully functional OS management tool like e.g. Norton Ghost could bebrought up to speed and resource efficiency using the the techniques described in thisthesis.
A combination of all technologies in a single tool would read archived blocks from ablock repository and directly send them to all the clients. While such a scenario soundslike a simple combination of the two techniques, there are certainly interesting openquestions that should be investigated in more detail: Since hard disks are slow for non-consecutive reads and writes, and the order of the blocks in the block repository and onthe clients’ partitions is different, it would be interesting to see if there are ways to stillachieve a high throughput for data distribution directly out of a block repository.
Further, the environment should also include tools for automatic booting, replicationand configuration of nodes. A prototype for such an environment exists. From a scientificpoint of view, such an enhanced environment might seem less interesting, but it posessome hard engineering problems to achieve high reliability even in presence of brokendevices or nodes that are used outside their agreed usage mode. Those hairy little detailsof systems engineering have been neglected by researchers and architects that are capableof finding simple and conceptionally clean solution. There are still many technical de-tails with the nodes’ BIOS, network booting systems and OSs that make highly reliablemulti-use cluster environments a challenge to implement in practice. The current ad-hocmethods crippled by tradition and backwards compatibility rules in the marketplace andthe deficiencies and ramification of those allegedly trivial details still manage to bringdown and prevent the success of many systems building projects that are otherwise basedon innovation and excellent ideas.
9.3 Concluding Remarks
It could appear to the reader of this thesis that the performance of systems to distributeand gather data could be improved by employing more and better talented hackers, thatsimply optimise different parts of the system. However, good implementation skills alone

162 Chapter 9: Conclusions
are not sufficient for a high-performance system. Our scientific approach with the analyticmodel for data streams in clusters allowed us to follow counter-intuitive routes for the de-velopment of highly optimised architectures. For example, our idea of using a multi-dropchain topology for data replication in clusters was often criticised as being inferior to thetheoretically more obvious tree or multicast topologies. With the model and the imple-mentations in our hands we can easily prove in a scientific way that the multi-drop chainis the best possible technique for data replication in systems of our consideration. On theway to the best solution the model allowed us to better understand the performance bot-tlenecks of our data-casting tools, distributed-device systems and distributed file systems,guiding future implementations towards optimal performance.
The newly introduced view of clusters of commodity PCs and desktop grids as oneuniform multi-purpose, multi-use processing infrastructure leads to a highly flexible useof existing rack-mounted clusters and desktop machines in organisations like our univer-sity workplace of research and education or companies in the service and manufacturingindustries. The added flexibility is mainly enabled by the concept of multi boot and inconjunction with the high-performance data-replication tool Dolly, which is freely avail-able as open-source software. Dolly’s success comes from its high-speed data replicationtechnique and its independence of the underlying OSs and file systems—advantages thatwere not available in other tools at the time of its introduction. Dolly is used for manydifferent OS installations in clusters of widely different sizes. In fact, Dolly was used tomaintain multiple Linux, Windows NT and Oberon installations in our 24-node Patago-nia classroom cluster, as well as to maintain Linux and Windows 2000 installations in ourrack-mounted 128-node departmental Xibalba cluster.
Distributed storage systems is an increasingly important and fairly broad area of re-search. It is therefore important to clearly distinguish between the different topics of inter-est. One subarea is parallel I/O for high-performance systems with applications runningon many nodes accessing the same file in parallel. For such applications a high aggregateperformance for specific access patterns is of great importance. For other applications,a high-performance file access on a single node is required. Such a scenario is ideallysuited for the traditional applications developed for SMP workstations with highly paral-lel RAIDs. Other applications include the distributed storage of data for high-performancewebservers, where load balancing and quick response times must be obtained. In our sys-tem maintenance environment for multi-use clusters, high aggregate write performance ofidentical data to many nodes is the key to high performance—similarly when we distributedatabase images for OLAP in a cluster. It is important to clearly separate these differentusage modes since they have widely different requirements and a well engineered systemmust focus on the optimal solution for one of the problems. As of the beginning of mythesis research it was not clear that there are so many approaches to distributed storage andthat there is hardly one simple measure of performance (like we see e.g. in scientific com-puting with the all encompassing TOP500 list based on Linpack performance). Therefore

9.3. CONCLUDING REMARKS 163
it is probably a significant contribution to describe and list the different scenarios of usagefor distributed devices and distributed file systems.
My view of multi-use clusters can be classified as a step by step evolution of tra-ditional clusters of commodity PCs towards desktop grids and finally towards a globalcomputational and storage grid, where compute power and storage space is provided,used and traded like a commodity. The enabling technologies for such a flexible use ofIT resources within a company or department must be seen in OS extensions that lead toa better management of processors, memory and disks on a larger scale. For their broadacceptance it is vital that their usage modes and performance metrics are well established,communicated and accepted within a department or community before their introduction.While they demand some accommodation from its users, they also offer great flexibilityand an advancement in the use of available IT resources. Their adoption in practice alsogreatly depends on capable system administrators that have a clear vision of the systemand keep the clusters up and running—despite the added complexity through the use ofpotentially many different OSs each with its own set of system software, tools and pack-ages.
Many key technologies for multi-use clusters of commodity PCs are already in placeand used by early adopters. With little more experience and acknowledgment of theirbenefits, my vision of multi-use, multi-purpose IT infrastructures could become broadlyaccepted and implemented in research and educational organisations as well as in theindustries for daily production and services.


Bibliography
[ACK+02] David P. Anderson, Jeff Cobb, Eric Korpela, Matt Lebofsky, and DanWerthimer. SETI@home: An Experiment in Public-Resource Computing.Communications of the ACM, 45(11):56–65, November 2002.
[ACP95] T. Anderson, D. Culler, and D. Patterson. A Case for NOW (Networks ofWorkstations).IEEE Micro, 15(1), February 1995.
[AISSm95] Albert Alexandrov, Mihai F. Ionescu, Klaus E. Schauser, and Chris Schei-man. LogGP: Incorporating Long Messages into the LogP Model—Onestep closer towards a realistic model for parallel computation. InProceed-ings of Seventh Annual ACM Symposium on Parallel Algorithms and Archi-tectures, July 1995.
[AR94] Sudhir Aggarwal and Amritansh Raghav. DUALCAST: A Scheme for Reli-able Multicasting. InProceedings of International Conference on NetworkProtocols, pages 15–22. IEEE Computer Society Press, 1994.
[AUS98] Anurag Acharya, Mustafa Uysal, and Joel Saltz. Active Disks: Program-ming Model, Algorithms and Evaluation. InASPLOS-VIII Proceedings,pages 81–91. ACM and IEEE Computer Society, 1998.
[BFK+95] Nanette J. Boden, Robert E. Felderman, Alan E. Kulawik, Charles L. Seitz,Jakov N. Seizovic, and Wen-King Su. Myrinet—A Gigabit per SecondLocal Area Network.IEEE-Micro, 15(1):29–36, February 1995.
[BGRS00] K. Bohm, T. Grabs, U. Rohm, and H.-J. Schek. Evaluating the CoordinationOverhead of Synchronous Replica Maintenance in a Cluster of Databases.In Arndt Bode, Thomas Ludwig, Wolfgang Karl, and Roland Wismuller,editors,Lecture Notes in Computer Science 1900, Euro-Par 2000 Paral-lel Processing, 6th International Euro-Par Conference Munich, pages 435–444, Munich, Germany, August 2000. Springer.
[BID+96] William J. Bolosky, Joseph S. Barrera III, Richard P. Draves, Robert P.Fitzgerald, Garth A. Gibson, Michael B. Jones, Steven P. Levi, Nathan P.Myhrvold, and Richard F. Rashid. The Tiger Video Fileserver. InSixth In-
165
166 BIBLIOGRAPHY
ternational Workshop on Network and Operating System Support for Digi-tal Audio and Video, Zushi, Japan, April 1996. IEEE Computer Society.
[BLA00] P. T. Breuer, A. Marın Lopez, and Arturo Garcıa Ares. The Network BlockDevice.Linux Journal, 73, May 2000.
[BMB03] Ron Brightwell, Arthur Maccabe, and Peter J. Braam. Sandia PortalsProject. Home page, 2003.http://www.sandiaportals.org/ .
[Bra96] Tim Bray. Bonnie.http://www.textuality.com/bonnie/ , 1996.
[Bra99] Peter J. Braam. File Systems for Clusters from a Protocol Perspective.USENIX Annual Technical Conference, Extreme Linux Workshop, 1999.http://www.usenix.org/events/usenix99/ .
[BSS+95] D. J. Becker, T. Sterling, D. Savarese, J. E. Dorband, U. A. Ranawake, andC. V. Packer. Beowulf: A Parallel Workstation for Scientific Computation.In P. Banerjee, editor,Proceedings of International Conference on ParallelProcessing. CRC Press, Boca Raton, FL, USA, August 1995.
[CAG+99] Jeffrey S. Chase, Darrell C. Anderson, Andrew J. Gallatin, Alvin R. Lebeck,and Kenneth G. Yocum. Network I/O with Trapeze. InProceedings of HotInterconnects, a Symposium on High Performance Interconnects, August1999.http://www.hoti.org/ .
[CID02] Rosario Cristaldi, Giulio Iannello, and Francesco Delfino. The Cluster FileSystem: Integration of High Performance Communication and I/O in Clus-ters. InProceedings of the Second IEEE/ACM International Symposium onCluster Computing and the Grid, pages 173–182. IEEE Computer Society,2002.
[CKP+93] David Culler, Richard Karp, David Patterson, Abhijit Sahay, Klaus ErikSchauser, Eunice Santos, Ramesh Subramonian, and Thorsten von Eicken.LogP: Towards a Realistic Model of Parallel Computation.SIGPLAN No-tices, 28(7):1–12, July 1993. Forth ACM SIGPLAN Symposium on Prin-ciples and Practice of Parallel Programming, 19–22 May 1993, San Diego,CA, USA.
[Clu02a] Cluster File Systems, Inc. Lustre: A High-Performance, Scalable, OpenDistributed File System for Clusters and Shared-Data Environments. Lustrefact sheet,http://www.lustre.org/ , November 2002.
[Clu02b] Cluster File Systems, Inc. Lustre: A Scalable, High-Performance FileSystem. Lustre Whitepaper Version 1.0,http://www.lustre.org/ ,November 2002.

BIBLIOGRAPHY 167
[Cor98] Symantec Corporation. Norton Ghost: Disk Cloning Technology for theOverburdened IS Professional, 1998.http://www.symantec.com/sabu/ghost .
[CP93] Peter M. Chen and David A. Patterson. A New Approach to I/O Perfor-mance Evaluation: Self Scaling I/O Benchmarks, Predicted I/O Perfor-mance. InProceedings of the 1993 ACM SIGMETRICS Conference onMeasurement and Modeling of Computer Systems, 1993.
[DBMS79] J. Dongarra, J. Bunch, C. Moler, and G. W. Stewart. Linpack users guide.SIAM, Philadelphia, PA, 1979.
[DG92] David DeWitt and Jim Gray. Parallel Database Ssystems: The Futureof High Performance Database Systems.Communications of the ACM,35(6):85–98, June 1992.
[Dis97] Distributed Computing Technologies Inc. distributed.net project. WorldWide Web,http://www.distributed.net/ , 1997.
[FJM+95] S. Floyd, V. Jacobson, S. McCanne, L. Zhang, and C-G. Liu. A Reli-able Multicast Framework For Lightweight Sessions and Application LevelFraming. InProceedings of ACM SIGCOMM ’95, pages 342–356, August1995.
[FK99] Ian Foster and Carl Kesselman, editors.The Grid: Blueprint for a new Com-puting Infrastructure. Morgan Kaufmann Publishers, Inc., San Francisco,USA, 1999.
[Fle99] Andreas Fleuti. Verteiltes Filesystem fur Hochgeschwindigkeits-Netzwer-ke. Semesterarbeit, Swiss federal institute of technology Zurich, laboratoryfor computer systems, 1999.
[Fle00] Andreas Fleuti. Verteiltes Filesystem fur einen Cluster of PCs mit Myrinet.Diplomarbeit, Swiss federal institute of technology Zurich, laboratory forcomputer systems, 2000.
[Geo02] Patrick Geoffray. OPIOM: Off-Processor I/O with Myrinet.Future Gener-ation Computer Systems, 18(4):491–499, 2002.
[GGL03] Sanjay Ghemawat, Howard Gobioff, and Shun-Tak Leung. The Google FileSystem. InProceedings of the nineteenth ACM Symposium on OperatingSystems Principles (SOSP), pages 29–43. ACM Press, New York, NY, USA,October 2003.
[GNA+96] Garth A. Gibson, David F. Nagle, Khalil Amiri, Fay W. Chang, EugeneFeinberg, Howard Gobioff, Chen Lee, Berend Ozceri, Erik Riedel, andDavid Rochberg. A Case for Network-Attached Secure Disks. Technical
168 BIBLIOGRAPHY
Report CMU-CS-96-142, School of Computer Science, Carnegie MellonUniversity, Pittsburgh, PA, USA, September 1996.
[HER+95] James V. Huber, Jr., Christopher L. Elford, Daniel A. Reed, Andrew A.Chien, and David S. Blumenthal. PPFS: A High Performance PortableParallel File System. InICS ’95, 1995.
[HKM +88] John H. Howard, Michael L. Kazar, Sherri G. Menees, David A. Nichols,M. Satyanarayanan, Robert N. Sidebotham, and Michael J. West. Scale andPerformance in a Distributed File System.ACM Transactions on ComputerSystems, 6(1):51–81, February 1988.
[HMF+99] Norman C. Hutchinson, Stephen Manley, Mike Federwisch, Guy Harris,Dave Hitz, Steven Kleiman, and Sean O’Malley. Logical vs. Physical FileSystem Backup. InProceedings of the 3rd Symposium on Operating Sys-tems Design and Implementation, New Orleans, Louisiana, pages 239–249.The USENIX Association, February 1999.
[HMS99] John H. Hartman, Ian Murdock, and Tammo Spalink. The Swarm ScalableStorage System. InProceedings of the 19th IEEE International Conferenceon Distributed Computing Systems (ICDCS’99), pages 74–81, June 1999.Also available as Technical Report TR99-06, Department of Computer Sci-ence, University of Arizona, March 1999.
[HO93] John H. Hartmann and John K. Ousterhout. The Zebra Striped Network FileSystem.ACM SIGOPS Operating Systems Review, 27(5):29–43, December1993.
[HP96] John L. Hennessy and David A. Patterson.Computer Architecture: AQuantitative Approach. Morgan Kaufmann Publishers, Inc., second edi-tion, 1996.
[HSL+03] Mike Hibler, Leigh Stoller, Jay Lepreau, Robert Ricci, and Chad Barb. Fast,Scalable Disk Imaging with Frisbee. InProceedings of the USENIX An-nual Technical Conference 2003, San Antonio, TX, USA, June 2003. TheUSENIX Association.
[IC 03] IC Knowledge, Georgetown, MA, USA. History of the integrated circuit.World Wide Web,http://www.icknowledge.com/ , August 2003.
[IR99] Walter B. Ligon III and Robert B. Ross. An Overview of the Parallel Vir-tual File System. USENIX Annual Technical Conference, Extreme LinuxWorkshop, 1999.
[Kat97] Jeffrey Katcher. PostMark: A New File System Benchmark. TechnicalReport 3022, Network Appliance, 1997.

BIBLIOGRAPHY 169
[KC96] Steve Kotsopoulos and Jeremy Cooperstock. Why Use a Fishing Line Whenyou Have a Net? An Adaptive Multicast Data Distribution Protocol. InProccedings of the USENIX 1996 Annual Technical Conference, San Diego,California, January 1996. The USENIX Association.
[KMRS00] Christian Kurmann, Michel Muller, Felix Rauch, and Thomas M. Stricker.Improving the Network Interfaces for Gigabit Ethernet in Clusters of PCsby Protocol Speculation. InProceedings of the Ninth IEEE InternationalSymposium on High Performance Distributed Computing, pages 131–138.IEEE Computer Society, August 2000. ISBN 0-7695-0783-2.
[Kna02] Alain Knaff. UDPcast.http://www.udpcast.linux.lu/ , 2002.
[KRS01] Christian Kurmann, Felix Rauch, and Thomas M. Stricker. SpeculativeDefragmentation—Leading Gigabit Ethernet to True Zero-Copy Commu-nication.Cluster Computing: The Journal of Networks, Software Tools andApplications, 4(1):7–18, March 2001.
[KRS03] Christian Kurmann, Felix Rauch, and Thomas M. Stricker. Cost/Perfor-mance Tradeoffs in Network Interconnects for Clusters of Commodity PCs.In Workshop on Communication Architecture for Clusters, in conjunctionwith International Parallel and Distributed Processing Symposium (IPDPS’03), Nice, France, April 2003.
[KS] Ch. Kurmann and T. Stricker. ECT—Extended Copy Transfer Characteri-zation.http://www.cs.inf.ethz.ch/CoPs/ECT/ .
[KS98] Ch. Kurmann and T. Stricker. Characterizing Memory System Performancefor Local and Remote Accesses in High-End SMPs, Low-End SMPs andClusters of SMPs. In7th Workshop on Scalable Memory Multiprocessors,held in conjunction with ISCA98, Barcelona, Spain, June 1998.
[Kur01] Christian Kurmann. Switchbench benchmark.http://www.cs.inf.ethz.ch/CoPs/sbench/ , June 2001.
[Kur03] Christian Kurmann.Zero Copy Strategies for Distributed CORBA Objectsin Clusters of PCs. PhD thesis, Swiss federal institute of technology Zurich,department of computer science, 2003. ISBN 3-89649-830-4.
[LMC94] Darell D. E. Long, Bruce R. Montague, and Luis-Felipe Cabrera.Swift/RAID: A Distributed RAID System.Computing Systems, 7(3):333–359, 1994.
[LT96] Edward K. Lee and Chandramohan A. Thekkath. Petal: Distributed VirtualDisks. ACM SIGPLAN Notices, 31(9):84–92, September 1996.
[LTWH98] Edward K. Lee, Chandramohan A. Thekkath, Chris Whitaker, and JimHogg. A Comparison of Two Distributed Disk Systems. Research report,

170 BIBLIOGRAPHY
Digital Systems Research Center, 130 Lytton Avenue, Palo Alto, California94301, April 1998.
[May01] John M. May. Parallel I/O for High Performance Computing. MorganKaufmann Publishers, 2001.
[Moo65] Gordon E. Moore. Cramming more components onto integrated circuits.Electronics, 38(8), April 1965.
[MS96] Larry McVoy and Carl Staelin. lmbench: Portable Tools for PerformanceAnalysis. InProceedings of the USENIX 1996 Annual Technical Confer-ence, San Diego, California, January 1996.
[Myr] Myricom, Inc. Myricom homepage.http://www.myri.com/ .
[NC03] William D. Norcott and Don Capps. Iozone Filesystem Benchmark.http://www.iozone.org/ , 2003.
[Onl99] Linux Online. Linux Online! World wide web site, 1999.http://www.linux.org/ .
[Pat00] Patagonia—A Dual Use Cluster of PCs for Computation and Education.World Wide Web,http://www.cs.inf.ethz.ch/CoPs/patagonia/ ,2000.
[PCGK89] David A. Patterson, Peter Chen, Garth Gibson, and Randy H. Katz. Intro-duction to Redundant Arrays of Inexpensive Disks (RAID). InDigest ofPapers. COMPCON Spring ’89, pages 112–117. IEEE, 1989.
[PF00] Meikel Poess and Chris Floyd. New TPC Benchmarks for Decision Supportand Web Commerce.SIGMOD-Record, 29(4):64–71, December 2000.
[PGK88] David A. Patterson, Garth Gibson, and Randy H. Katz. A Case for Re-dundant Arrays of Inexpensive Disks (RAID).ACM SIGMOD Record,17(3):109–116, 1988.
[Pre02] W. Curtis Preston.Using SANs and NAS. O’Reilly & Associates , Inc.,February 2002.
[PRO03] Jose Pereira, Luıs Rodrigues, and Rui Oliveira. Semantically Reliable Mul-ticast: Definition, Implementation, and Performance Evaluation.IEEETransactions on Computers, 52(2), February 2003.
[Psa99] Michael Psarros. Verteiltes Filesystem fur Hochgeschwindigkeits-Netzwer-ke. Diplomarbeit, Swiss federal institute of technology Zurich, laboratoryfor computer systems, 1999.
[PSK94] Sanjoy Paul, Krishan K. Sabnani, and David M. Kristol. Multicast Trans-port Protocols for High Speed Networks. InProceedings of International

BIBLIOGRAPHY 171
Conference on Network Protocols, pages 4–14. IEEE Computer SocietyPress, 1994.
[Rau97] F. Rauch. Zuverlassiges Multicastprotokoll. Master’s thesis, ETH Zurich,1997. Title translated to english: Reliable Multicast Protocol. See alsohttp://www.cs.inf.ethz.ch/ .
[REG+03] Sean Rhea, Patrick Eaton, Dennis Geels, Hakim Weatherspoon, Ben Zhao,and John Kubiatowicz. Pond: The OceanStore Prototype. InProceedingsof the 2nd USENIX Conference on File and Storage Technologies (FAST’03), March 2003.
[Rei91] Martin Reiser.The Oberon System. ACM Press, 1991.
[Rid94] Paul Riddle. Automated Upgrades in a Lab Environment. InProceedingsof the Eighth Systems Administration Conference (LISA VIII), pages 33–36.USENIX Association, September 1994.
[RKMLS99] Felix Rauch, Christian Kurmann, Blanca Maria Muller-Lagunez, andThomas M. Stricker. Patagonia—A Dual Use Cluster of PCs for Compu-tation and Education. In2nd Workshop Cluster Computing, pages 65–75,Karlsruhe, Germany, March 1999.
[RO91] Mendel Rosenblum and John K. Ousterhout. The Design and Implemen-tation of a Log-Structured File System.ACM SIGOPS Operating SystemsReview, 25(5):1–15, 1991.
[Rud97] Gottfried Rudorfer. Managing PC Operating Systems with a Revision Con-trol System. InProceedings of the Eleventh Systems Administration Con-ference (LISA ’97), pages 79–84. USENIX Association, October 1997.
[SBMS93] Margo Seltzer, Keith Bostic, Marshall Kirk McKusick, and Carl Staelin. AnImplementation of a Log-Structured File System for UNIX. InProceedingsof the Winter 1993 USENIX Conference, pages 307–326. The USENIX As-sociation, 1993.
[SCP+02] Constantine P. Sapuntzakis, Ramesh Chandra, Ben Pfaff, Jim Chow, Mon-ica S. Lam, and Mendel Rosenblum. Optimizing the Migration of Vir-tual Computers. InProceedings of the Fifth Symposium on Operating Sys-tems Design and Implementation (OSDI ’02), pages 377–390, Boston, MA,USA, December 2002.
[SG95] T. Stricker and T. Gross. Optimizing Memory System Performance forCommunication in Parallel Computers. InProc. 22nd Intl. Symposium onComputer Architecture, pages 308–319, Santa Marguerita di Ligure, June1995. ACM.

172 BIBLIOGRAPHY
[SGK+85] Russel Sandberg, David Goldberg, Steve Kleinman, Dan Walsh, and BobLyon. Design and Implementation of the Sun Network Filesystem. InUsenix Association Summer Conference Proceedings, 1985.
[SH96] T. Stricker and J. Hardwick. From AAPC Algorithms to High Perfor-mance Permutation Routing and Sorting. InProc. SPAA’96, pages 200–203,Padua, Italy, June 1996. ACM.
[SKTR] Thomas M. Stricker, Christian Kurmann, Michela Taufer, and FelixRauch. CoPs—Clusters of PCs Project Overview. World Wide Web,http://www.cs.inf.ethz.ch/CoPs/ .
[SMH95] Michael E. Shaddock, Michael C. Mitchell, and Helen E. Harrison. How toUpgrade 1500 Workstations on Saturday, and Still Have Time to Mow theYard on Sunday. InProceedings of the Ninth Systems Administration Con-ference: (LISA IX), pages 59–65. USENIX Association, September 1995.
[SPE03] Standard Performance Evaluation Corporation (SPEC). World Wide Web,official website,http://www.spec.org/ , August 2003.
[Sta01] Standard Performance Evaluation Corporation (SPEC), 6585 MerchantPlace, Suite 100, Warrenton, VA 20187, USA.SFS 3.0 DocumentationVersion 1.0, 2001.http://www.spec.org/ .
[Ste96] Peter Steenkiste. Network-Based Multicomputers: A Practical Supercom-puter Architecture.IEEE Transactions on Parallel and Distributed Systems,7(8):861–875, August 1996.
[Tau02] Michela Taufer. Inverting Middleware: Performance Analysis of LayeredApplication Codes in High Performance Distributed Computing. PhD the-sis, Swiss federal institute of technology Zurich, department of computerscience, 2002. ISBN 3-89649-821-5.
[TML97] Chandramohan A. Thekkath, Timothy Mann, and Edward K. Lee. Frangi-pani: A Scalable Distributed File System.ACM SIGOPS Operating SystemsReview, 31(5):224–37, December 1997.
[TOK97] Takayuki Tamura, Masato Oguchi, and Masaru Kitsuregawa. ParallelDatabase Processing on a 100 Node PC Cluster: Cases for Decision SupportQuery Processing and Data Mining. InProceedings of the 1997 ACM/IEEESC97 Conference, 1997.
[TOP03] Top500 supercomputer sites.http://www.top500.org/ , June 2003.
[Tra03] Transaction Processing Performance Council, TPC. World Wide Web,http://www.tpc.org/ , 2003.
[TSW02] Michela Taufer, Thomas Stricker, and Roger Weber. Scalability and Re-source Usage of an OLAP Benchmark on Clusters of PCs. InProceedings
BIBLIOGRAPHY 173
of the fourteenth annual ACM symposium on parallel algorithms and ar-chitectures (SPAA’02), pages 83–94, New York, NY, USA, August 2002.ACM Press.
[Vin98] Christopher A. L. Vinckier. Distributed Shared Memory with Myrinet.Masters thesis, University of Ghent, faculty of applied sciences, June 1998.
[Wid01a] Christian Widmer, October 2001. Personal communication.
[Wid01b] Christian Widmer. Transparente Zugriffsmethode auf verteilte Festplatten.Diplomarbeit, Swiss federal institute of technology Zurich, laboratory forcomputer systems, December 2001.
[Wit01] Christian Wittenhorst. GigaFS—Verteiltes Filesystem fur einen Cluster ofPCs mit Gigabit Ethernet. Diplomarbeit, Swiss federal institute of technol-ogy Zurich, laboratory for computer systems, May 2001.
[WJ92] Nicklaus Wirth and Jurg Gutknecht.Project Oberon. ACM Press, 1992.
[WMK95] Brian Whetten, Todd Montgomery, and Simon Kaplan. A High Perfor-mance Totally Ordered Multicast Protocol. In K. P. Birman, F. Mattern,and A. Schiper, editors,Theory and Practice in Distributed Systems, pages33–57. Springer-Verlag, 1995.
[Xib03] Xibalba—Computer Science Cluster of ETH Zurich. World Wide Web,http://www.xibalba.inf.ethz.ch/ , 2003.

List of Abbreviations
API Application Programming Interface
BTP Burst Transfer Protocol
CLI Command line interface
CoPs Cluster of PCs
CPU Central Processing Unit
DBMS Database Management System
DHCP Dynamic Host Configuration Protocol
DMA Direct Memory Access
FNBD Fast Network Block Device
IC Intergrated Circuit
I/O Input/output
MCP Myrinet Control Program
MDDS Myrinet Distributed Device System
MPI Message Passing Interface
MTU Maximum Transfer Unit
NA(S)D Network-Attached (Secure) Disk
NAS Network-Attached Storage
NBD Network Block Device
NFS Network File System
NIC Network Interface Card or Network Interface Controller
NOW Network of Workstations
175

176 LIST OF ABBREVIATIONS
OLAP On-Line Analytical Processing
OLTP On-Line Transaction Processing
OS Operating System
PVFS Parallel Virtual File System
PXE Pre-Boot Execution Environment
RAID Redundant Array of Inexpensive Disks
RDBMS Relational Data Base Management System
RDMA Remote Direct Memory Access
SAN Storage Area Network
SID Security ID
SMB Server Message Block (protocol)

List of Figures
2.1 Development of computation capabilities 1995-2003.. . . . . . . . . . . 142.2 Development of DRAM IC capacity 1970-2000.. . . . . . . . . . . . . . 152.3 Development of hard-disk sizes from 1995–2003.. . . . . . . . . . . . . 162.4 Development of hard-disk sizes and a Linux installation from 1995–2003.162.5 Development of hard-disk throughput 1995–2003.. . . . . . . . . . . . . 172.6 Development of hard-disk throughput and Ethernet networks 1995–2003.172.7 Classes of IT resources according to operating and usage modes.. . . . . 222.8 Related areas of research.. . . . . . . . . . . . . . . . . . . . . . . . . . 29
3.1 Bus topology.. . . . . . . . . . . . . . . . . . . . . . . . . . . . . . . . 373.2 Star topology.. . . . . . . . . . . . . . . . . . . . . . . . . . . . . . . . 383.3 Tree topology.. . . . . . . . . . . . . . . . . . . . . . . . . . . . . . . . 383.4 Chain topology.. . . . . . . . . . . . . . . . . . . . . . . . . . . . . . . 393.5 Crossbar topology.. . . . . . . . . . . . . . . . . . . . . . . . . . . . . 393.6 Two dimensional mesh topology.. . . . . . . . . . . . . . . . . . . . . . 403.7 Hypercube topology.. . . . . . . . . . . . . . . . . . . . . . . . . . . . 41
5.1 Active node and passive node.. . . . . . . . . . . . . . . . . . . . . . . 595.2 Physical network topologies of ETH meta-cluster and CoPs subcluster.. . 605.3 Logical network topologies and their embedding in physical networks.. . 625.4 Edge and node capacities.. . . . . . . . . . . . . . . . . . . . . . . . . . 625.5 Algorithm for basic model.. . . . . . . . . . . . . . . . . . . . . . . . . 645.6 Example network with embedding of logical into physical network.. . . 655.7 Schematic data flow of an active node running the Dolly client.. . . . . . 665.8 Schematic data flow of a Dolly client with data decompression.. . . . . . 685.9 Behavior of three switches with increasing load.. . . . . . . . . . . . . . 71
6.1 Topologies of multicast-based data cast in a cluster network.. . . . . . . 786.2 Topologies of an NFS-based data cast in a cluster network.. . . . . . . . 796.3 Schematic data flow of NFS server implementing the simple NFS approach.796.4 Topologies of a tree-based data cast in a cluster network.. . . . . . . . . 806.5 Schematic data flow through a node running the Dolly-tree client.. . . . 80
177

178 LIST OF FIGURES
6.6 Topologies of a data cast based on Dolly in a cluster network.. . . . . . . 816.7 Schematic data flow for a number of nodes running the Dolly client.. . . 826.8 Total execution times for cloning a 2 GByte partition to an increasing
number of nodes with different topologies.. . . . . . . . . . . . . . . . . 836.9 Aggregate throughputs of cloning to an increasing number of clients for
different topologies.. . . . . . . . . . . . . . . . . . . . . . . . . . . . . 846.10 Predicted and measured throughputs for a partition cast with multi-drop
chain and star topologies.. . . . . . . . . . . . . . . . . . . . . . . . . . 87
7.1 Evolutionary steps of a typical software installation. . . . . . . . . . . . 977.2 Example with two partition images archived as full data images.. . . . . 997.3 Example with two partition images archived as blockwise diffs.. . . . . . 1007.4 Example with two partition images archived in a block repository.. . . . 1017.5 Evolutionary steps of installations with temporal and spacial changes.. . 1027.6 Storage required for successive Windows NT update path of three differ-
ent generations from a base install to a fully updated image.. . . . . . . . 1037.7 Storage required for successive Linux update path of two different gener-
ations from a base install to an updated image.. . . . . . . . . . . . . . . 1047.8 Storage requirements in the repository for the same incremental software
update on Windows NT and Linux.. . . . . . . . . . . . . . . . . . . . .1057.9 Comparison of disk space requirements depending on different block sizes
for the comparison (diff) and compression algorithm.. . . . . . . . . . . 107
8.1 Architecture of generic distributed devices.. . . . . . . . . . . . . . . .1158.2 Architecture of Petal.. . . . . . . . . . . . . . . . . . . . . . . . . . . .1168.3 Architecture of Linux Network Block Device (NBD).. . . . . . . . . . . 1168.4 Architecture of Myrinet Distributed-Device System (MDDS).. . . . . . . 1178.5 Architecture of Fast Network Block Device (FNBD).. . . . . . . . . . . 1198.6 Architecture of the Lustre distributed file system.. . . . . . . . . . . . . 1228.7 Architecture of Frangipani distributed file system.. . . . . . . . . . . . . 1238.8 Architecture of the parallel virtual file system (PVFS).. . . . . . . . . . 1248.9 Architecture of GigaFS.. . . . . . . . . . . . . . . . . . . . . . . . . . .1258.10 Layers for data-gathering architecture.. . . . . . . . . . . . . . . . . . .1288.11 Architecture of OLAP performance with local disk.. . . . . . . . . . . . 1318.12 Architectural model of OLAP with TP-Lite.. . . . . . . . . . . . . . . .1328.13 Architectural model of OLAP on PVFS.. . . . . . . . . . . . . . . . . .1338.14 Architectural model of OLAP on FNBD.. . . . . . . . . . . . . . . . . .1348.15 Read throughput with single RAM-disk–based server and different use-
level block sizes. . . . . . . . . . . . . . . . . . . . . . . . . . . . . . .1398.16 FNBD scalability: Read throughput with 1–3 RAM-disk–based servers
that have been limited to 20 MByte/s each.. . . . . . . . . . . . . . . . .140

L IST OF FIGURES 179
8.17 FNBD read throughput with different I/O sizes, reading data from thedisks of three remote servers.. . . . . . . . . . . . . . . . . . . . . . . .141
8.18 Simplistic simulation of future system: FNBD read throughput with threeservers reading from decelerated hard disks.. . . . . . . . . . . . . . . .142
8.19 Comparing the throughput of a local disk and PVFS with six servers forvarious user-level block sizes.. . . . . . . . . . . . . . . . . . . . . . .143
8.20 Comparing the throughput of a local disk, FNBD with three servers andPVFS with six servers for 4 KByte user-level blocks.. . . . . . . . . . . 145
8.21 Performance of TPC-D benchmark queries with execution times and speed-ups. . . . . . . . . . . . . . . . . . . . . . . . . . . . . . . . . . . . . .146
8.22 Execution times for disk-limited TPC-D benchmark number four on allexamined systems.. . . . . . . . . . . . . . . . . . . . . . . . . . . . .147
8.23 Simplistic simulation of future systems: Execution times for TPC-D bench-mark number four with fast and slow disks.. . . . . . . . . . . . . . . .148


List of Tables
2.1 Operating modes: Differences of clusters and personal computers.. . . . 202.2 Usage modes: Levels of specialisation for IT resources.. . . . . . . . . . 21
4.1 Node configuration of old four-node CoPs cluster.. . . . . . . . . . . . . 504.2 Node configuration of additional four nodes for old CoPs cluster.. . . . . 504.3 Node configuration of 24-nodes Patagonia cluster.. . . . . . . . . . . . . 514.4 Node configuration in new 16-node CoPs cluster.. . . . . . . . . . . . . 524.5 Node configuration in 128-node Xibalba cluster.. . . . . . . . . . . . . . 53
6.1 Predicted and measured throughputs for a partition cast with differenttopologies . . . . . . . . . . . . . . . . . . . . . . . . . . . . . . . . . .86
7.1 Comparison of the three presented approaches of storing incremental in-stallations for different production images.. . . . . . . . . . . . . . . . .102
7.2 Storage requirements in the repository for the same incremental softwareupdate on Windows NT and Linux.. . . . . . . . . . . . . . . . . . . . .105
7.3 Storage requirements in the repository for upgrading or patching the baseOS or kernel respectively.. . . . . . . . . . . . . . . . . . . . . . . . . .106
7.4 Storage requirements in the block repository for customised replications.. 106
8.1 Comparison of systems using distributed devices.. . . . . . . . . . . . . 1208.2 Comparison of distributed file systems.. . . . . . . . . . . . . . . . . . .1258.3 TPC-D query analysis with ratios of input/output.. . . . . . . . . . . . . 1308.4 Predictions of the analytic model for different systems.. . . . . . . . . . 1358.5 Measured performance of different systems.. . . . . . . . . . . . . . . .149
181

Index
n-ary spanning tree topology, 61
active node, 59Andrew benchmark, 135application layer, 46
benchmarkAndrew, 135Bonnie, 135Iozone, 135Linpack, 13lmbench, 135PostMark, 135Self-scaling I/O benchmarks, 135SPEC SFS, 135Speed, 135
block device driver, 112Bonnie benchmark, 135broadcast, 37BTP, 117Burst Transfer Protocol, 117bus topology, 37
capacityCPU, 67disk-system, 67edge, 62I/O-bus, 67link, 67memory-system, 67node, 63
capacity of passive nodes, 67chain topology, 38character device driver, 112
cloning, 3, 60, 76, 91, 92definition of, 93
cloning products, 92cluster, 19
collaborative, 19computational, 19experimental, 19multi-use, 19multi-use, of commodity PCs, 20
cluster of PCs, 2, 50coarse-grain partial-data granularity, 42collaborative cluster, 19commodity, 18commodity computers, 19commodity hardware, 18computational cluster, 19CoPs, 2, 50copy-transfer model, 58CPU utilisation, 67crossbar topology, 39
data granularity, 41data partitioning, 126data replication, 126delayed updates, 43desktop grids, 19device driver, 112
block, 112character, 112distributed, 112
device-driver layer, 44disk cloning, 91disk-system capacity, 67
183

184 INDEX
distributed device driver, 112distributed file system, 119distributed virtual disks, 113Dolly, 80, 81, 83, 157
edge capacity, 62experimental cluster, 19
fair sharing of links, 62Fast Network Block Device, 116–118file, 119file layer, 45file system, 119
distributed, 119file-system layer, 44fine-grain partial-data granularity, 42FNBD, 116–118Frangipani, 120–121Frisbee, 76, 92full-data granularity, 41
GigaFS, 122granularity
full-data, 41partial-data, 41
coarse-grain, 42fine-grain, 42
grid computing, 30grid storage, 30
hardware layer, 44hypercube topology, 40
I/O-bus capacity, 67immediate updates, 43internet storage, 30interpersonal computer, 18Iozone file system benchmark, 135IT resource, 20
killer workstations, 30
LANai processor, 115
layerapplication, 46device-driver, 44file, 45file-system, 44hardware, 44logical, 37middleware, 45physical, 37
link capacity, 67lmbench benchmark, 135LogGP model, 58logical layer, 37logical network, 61LogP model, 58Lustre, 119–120
MDDS, 115–116memory-system capacity, 67mesh topology, 40middleware layer, 45model
copy-transfer, 58LogGP, 58LogP, 58
multi-drop chain, 81multi-drop–chain topology, 61multi-use cluster, 19multi-use cluster of commodity PCs, 20Myrinet, 115Myrinet Distributed-Device System, 115–
116
NA(S)D, 28NAS, 28NBD, 114–115network
logical, 61physical, 60
network attached storage, 28Network Block Device, 114–115
INDEX 185
Network File System, 78network of workstations, 11network-attached disks, 28new CoPs cluster, 51–52NFS, 78node
active, 59passive, 59
node capacity, 63NOW, 11
office applications, 18OLAP, 30, 125
approaches to large-scale, 30Old CoPs cluster, 50online analytical processing, 30
parallel I/O for high-performance comput-ing, 30
Parallel virtual file system, 121partial-data granularity, 41partition cloning, 76, 80passive node, 59Patagonia cluster, 51PC, 18personal computer, 18Petal, 113–114physical layer, 37physical network, 60Portals, 120PostMark benchmark, 135PVFS, 121
RAID, 29level 0, 29
redundant array of inexpensive disks, 29reliable transfer premise, 62
SAN, 28scientific computing applications, 29Self-scaling I/O benchmarks, 135SPEC SFS benchmark, 135
Speed benchmark, 135star topology, 37, 61storage area network, 28student lab, 19switch capacity, 67Switchbench, 70
topologyn-ary spanning tree, 61bus, 37chain, 38crossbar, 39hypercube, 40mesh, 40multi-drop–chain, 61star, 37, 61tree, 38
TP-Lite, 127TPC, 136TPC-D, 136tree topology, 38
UDPcast, 70updates
delayed, 43immediate, 43
Xibalba cluster, 52–54

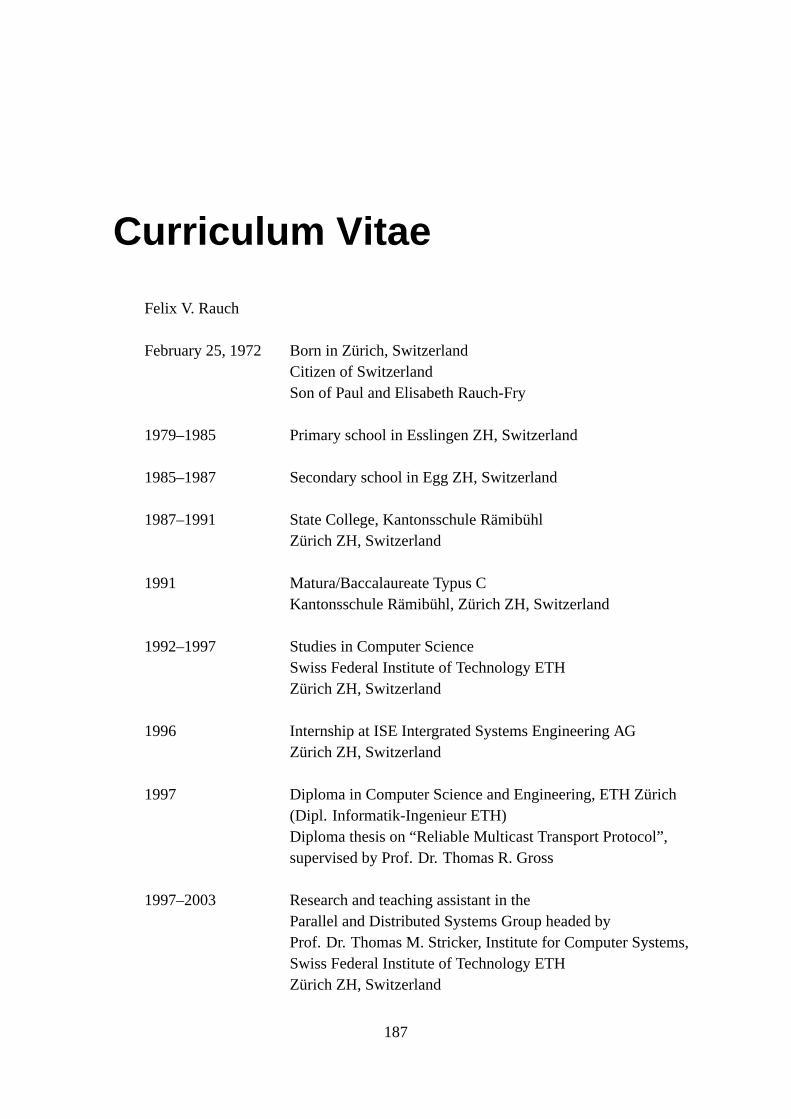
Curriculum Vitae
Felix V. Rauch
February 25, 1972 Born in Zurich, SwitzerlandCitizen of SwitzerlandSon of Paul and Elisabeth Rauch-Fry
1979–1985 Primary school in Esslingen ZH, Switzerland
1985–1987 Secondary school in Egg ZH, Switzerland
1987–1991 State College, Kantonsschule RamibuhlZurich ZH, Switzerland
1991 Matura/Baccalaureate Typus CKantonsschule Ramibuhl, Zurich ZH, Switzerland
1992–1997 Studies in Computer ScienceSwiss Federal Institute of Technology ETHZurich ZH, Switzerland
1996 Internship at ISE Intergrated Systems Engineering AGZurich ZH, Switzerland
1997 Diploma in Computer Science and Engineering, ETH Zurich(Dipl. Informatik-Ingenieur ETH)Diploma thesis on “Reliable Multicast Transport Protocol”,supervised by Prof. Dr. Thomas R. Gross
1997–2003 Research and teaching assistant in theParallel and Distributed Systems Group headed byProf. Dr. Thomas M. Stricker, Institute for Computer Systems,Swiss Federal Institute of Technology ETHZurich ZH, Switzerland
187

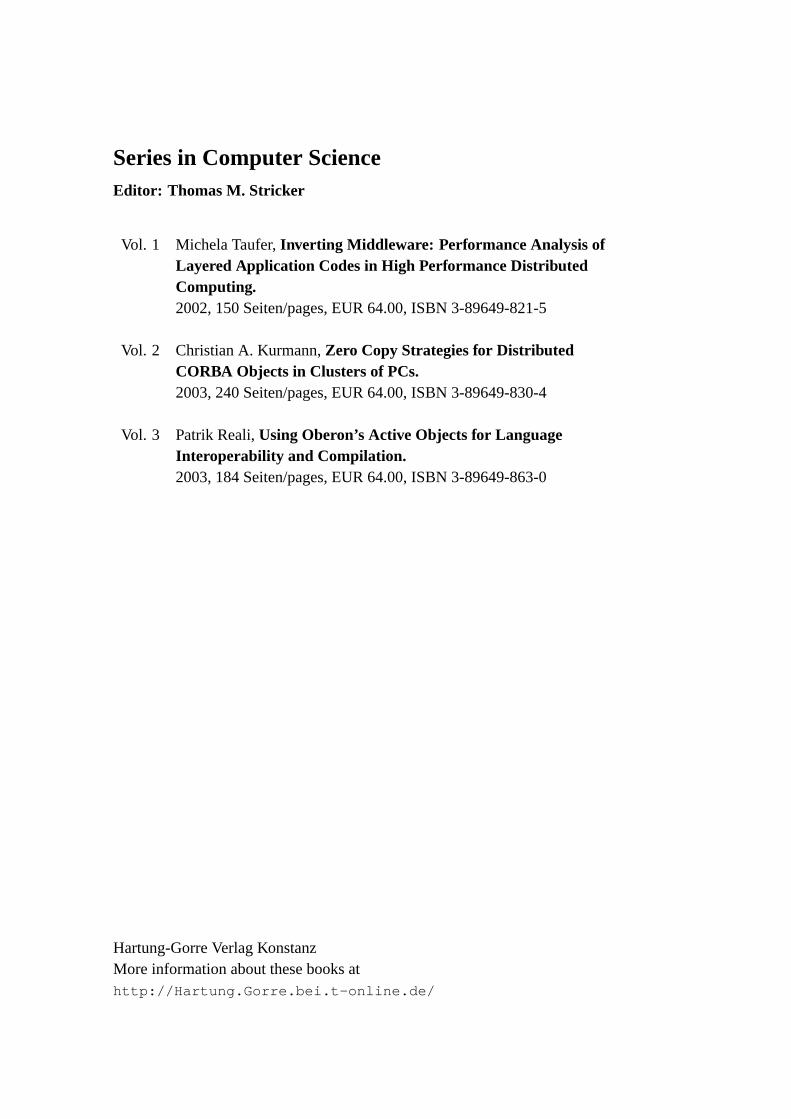
Series in Computer ScienceEditor: Thomas M. Stricker
Vol. 1 Michela Taufer,Inverting Middleware: Performance Analysis ofLayered Application Codes in High Performance DistributedComputing.2002, 150 Seiten/pages, EUR 64.00, ISBN 3-89649-821-5
Vol. 2 Christian A. Kurmann,Zero Copy Strategies for DistributedCORBA Objects in Clusters of PCs.2003, 240 Seiten/pages, EUR 64.00, ISBN 3-89649-830-4
Vol. 3 Patrik Reali,Using Oberon’s Active Objects for LanguageInteroperability and Compilation.2003, 184 Seiten/pages, EUR 64.00, ISBN 3-89649-863-0
Hartung-Gorre Verlag KonstanzMore information about these books athttp://Hartung.Gorre.bei.t-online.de/


ΣHartung-Gorre Verlag Konstanz
ISSN 1611-0943 ISBN 3-89649-893-2 € 64.00
Series in Computer ScienceEdited by Thomas M. Stricker
The trend to use the same or similar commodity components in all new architectures from a laptop to the largest supercomputers caused a highly welcome acceleration of growth in performance and decrease in price due to the high volume of these components. The annual increase in the amount of compute performance and disk storage capacities at the same or lower cost is just incredible. It is therefore highly important that we learn how to design a system under the constraint of commodity components and that we aim to use the widely available compute and storage resources in a more flexible and intelligent way. In this thesis the author postulates a generalised view of all installed IT resources (processors, storage and network) in the form of "multi-use clusters of commodity PCs".To achieve this vision, the operating-system installation of the previously isolated computers must support a flexible and distributed resource management. In order to achieve this by scientific means, the thesis introduces a few fundamental technologies including (a) an analytic model to optimise the streams while distributing large data sets in clusters of PCs, (b) a simple software tool to distribute disk images, which derived from the model and its principle, (c) an efficient storage scheme for archiving software-installation images in an operating-system–independent way and (d) several implementations and a rigorous classification of a variety of distributed storage solutions based on file systems and distributed devices. While the first technologies enable a more flexible management of multi-use clusters, the latter technologies allow for a more efficient use of all unused disk space in multi-use clusters.