Embed Size (px)
Citation preview

Research Collection
Doctoral Thesis
Preparation and characterization of membrane proteins andchallenging oligomeric proteins for solution NMR spectroscopy
Author(s): Hu, Kaifeng
Publication Date: 2004
Permanent Link: https://doi.org/10.3929/ethz-a-004844309
Rights / License: In Copyright - Non-Commercial Use Permitted
This page was generated automatically upon download from the ETH Zurich Research Collection. For moreinformation please consult the Terms of use.
ETH Library

Diss.ETH Nr. 15726
Preparation and characterization of membrane
proteins and challenging oligomeric proteins for
solution NMR spectroscopy
A dissertation submitted to the
Swiss Federal Institute of Technology Zürich
for the degree of
Doctor of Sciences
Presented by
Kaifeng Hu
Master of Science
Shanghai Institute of Materia Medica, Chinese Academy of Sciences
Born on Feb. 19, 1974
Citizen of China
accepted on the recommendation of
Prof. Dr. Konstantin Pervushin, examiner
PD. Dr. Oliver Zerbe, co-examiner
2004

Acknowledgement
During these years of my study and work at the ETH, I have learnt from, cooperated and
discussed with a lot of people. Many of them helped me not only on the scientific side, but
supported me mentally with their friendship and with their generous help in everyday life. I am
very grateful to all of them.
Especially, I would like to thank Prof. Konstantin Pervushin for giving me the chance to study
NMR and to carry out my research project in his group. I appreciate his guidance and support in
my project, his explanation and his penetrating understanding of NMR theory. I thank Prof.
Andreas Plükthun for offering me the opportunity to purify FkpA in his group and his group
members for their help when I worked there.
I want to thank all Prof. Pervushin's group members for providing a nice and friendly working
environment. I should give my special thanks to Beat Vogeli, for his help and patient explanation,
which was important for me to catch up and understand physics of NMR, and for his stimulating
discussions through all these years. I should give my special thanks also to Dr. Maria lohansson
for our very pleasant cooperation on the membrane protein project and her friendly support and
help in everyday life. Simon Alioth also deserves my thanks for his explanation and practical
discussion on molecular biology. I should also thank Dr. Osvaldo Moreira, Dr. Donghan Lee,
Alexander Eletski, Veniamin Galius, Okhrimenko Oksana and Reto Walser for their help all
these years. I thank Dr. Fred Damberger for carefully reading the manuscript of my thesis.
1 owe my previous supervisor, Prof. Dr. Ronald Guiles a debt of gratitude for giving me the
opportunity to begin my Ph.D study in NMR at the Univ of Maryland, Baltimore. I also thank his
group members, Dr. Hanqiao Feng, Dr. Bindi Dangi and Dr. Nazim Shahzad for their help when
1 studied there.
Finally, I would like to thank my family for their continuous support, encouragement and
understanding all these years. I owe them a great debt for their care and love!

Table of contents
Summary 5
Zusammenfassung 7
Abbreviations 9
Chapter T Preparation and characterization of a membrane protein ß-barrel platform for
solution NMR studies 11
1.1 Introduction 13
1.1.1 Structural studies of membrane proteins 13
1.1.1.1 Membrane proteins vs. water soluble proteins 13
1.1.1.2 Micelles, bicelles and lipid bilayers 14
1.1.1.3 NMR vs. X-ray crystallography in MP structure studies 15
1.1.1.4 a- helical and ß - barrel MP studied by solution NMR 16
1.1.2 Experimental aspects: solution NMR studies of MP 20
1.1.2.1 MP sample preparation for solution NMR studies 20
1.1.2.1.1 Expression and purification 20
1.1.2.1.2 Refolding 21
1.1.2.1.3 Isotope-labeling 21
1.1.2.2 NMR spectroscopy and structure determination of MP 22
1.2 Preparation and characterization of a membrane protein ß-barrel platform of OmpA ..24
1.2.1 Introduction to the outer membrane protein A (OmpA) 24
1.2.2 Design of the ß-barrel platform (BBP) of OmpA 25
1.2.3 NMR sample preparation of BBP 26
1.2.3.1 Sequencing the reconstructed gene26
1.2.3.2 Over-expression, labeling and purification of BBP 26
1.2.3.3 Refolding of BBP into micelles 27
1.2.4 NMR spectroscopy of BBP 29
1.2.5 Conclusions and perspectives 32
References 33
Chapter II NMR studies of structure and function of FkpA 39
II. 1 Introduction 41

2
II.2 Sample preparation 43
IL3 Backbone chemical shift assignment and secondary structure determination 44
IL3.1 NMR spectroscopy and backbone chemical shift assignments 44
II.3.2 Analysis of secondary structure 49
11.4 15N Relaxation 49
11.4.1 NMR experiments 50
11.4.2 Data processing and analysis 53
11.5 Residual dipolar coupling and the dynamic molecular model 56
11.5.1 Residual dipolar coupling measurement 56
11.5.1.1 Measurements of RDCs by addition of Pfl filamentous bacteriophages 57
11.5.1.2 Measurements of RDCs in La phase 61
11.5.2 Fitting of the alignment tensor to the residual dipolar couplings 64
11.5.3 Analysis of fitting results and dynamic molecular model 67
II. 6 Chapcrone function of FkpA 71
11.6.1 Substrate protein binding 71
11.6.2 Specific polypeptide binding site of FKpA and comparison of its chaperone
function and PPIase activity 73
11.6.3 FkpA chaperone function 78
II.7 Mechanism of chaperone function of dimeric FkpA: model of "mother's arms" 81
References 82
Chapter III Backbone resonance assignment in large protonated proteins using a
combination of new 3D TROSY-HN(CA)HA, 4D TROSY-HACANH and 13C detected
HACACO experiments 85
Introduction: 13C-detection based NMR spectroscopy of proteins 87
Development of 3D TROSY-HN(CA)HA and 4D TROSY-HACANH experiments 88
Combined use of the 3D TROSY-HNCA, 3D TROSY-HNCO with 3D MQ-HACACO 97
References 99
Chapter IV Side-chain H and C resonance assignment in partially deuterated proteins
using a new 3D ,3C-detected HCC-TOCSY 101
Introduction: strategies of side chain assignment 103
Development of 3D in-phase and sensitivity enhanced HCC-TOCSY 103

3
Side-chain assignment 108
References 112
Appendix 114
A.l Table 1 BBP of OmpA: DNA sequence and amino acid sequence 114
A.2 Table 2 Backbone HN, N, Ca, C and Cp chemical shift assignments of FkpA 115
A.3 Linear least-squares fitting of RDCs 122
Back calculation of RDCs 123
Linear least-squares fitting of RDCs for homodimeric molecules 124
References 125
Curriculum vitae 127

4
Seite Leer /
Blank leaf

5
Summary
The aim of my thesis is to develop methodological aspects of NMR structure/dynamics
investigations of proteins considered to be difficult from the vista of conventional NMR. This
includes membrane proteins reconstituted into micelles of detergents or highly dynamical and
extended (non-compact) soluble proteins with low density or absence of long range structural
constraints based on NOEs. The methodological aspects discussed in the thesis include choice of
the isotope-labeling pattern, sample preparation and conditions for NMR studies, adopting both
previously developed strategies as well as developing new ones for assignment of backbone
resonances, and analysis of dynamical properties and function of the selected target proteins. The
presented results should serve as a basis for more detailed structural studies of these biologically
important systems.
Membrane proteins take part in a large number of important physiological functions. As an
example of a membrane protein suitable for NMR studies, we selected outer membrane protein A
(OmpA), which is an abundant structural protein of the outer membrane of Gram-negative
bacteria. The N-tcrminal domain of the OmpA protein from Escherichia coli, consisting of
residues 1-172, forms an antiparallel ß-barrel whose eight transmembrane ß-strands are
connected by three short periplasmic turns and four relatively large surface-exposed hydrophilic
loops. In NMR studies of OmpA, we were concerned with a structural role of the surface-
exposed loops of OmpA. An OmpA deletion variant with all four loops shortened, which we
called ß-barrel platform (BBP) of OmpA, consists of only 142 amino acid residues and
constitutes the smallest ß-struetured integral membrane protein known to date. Fractional
factorial refolding screens were used to identify refolding conditions for BBP. The shortened
protein was successfully refolded and properly labeled for NMR structure determination. An
analysis of NMR spectra shows that this artificially designed outer membrane protein refolds into
a ß-barrel structure, which is similar to the transmembrane domain of the wild type of OmpA.
This implies that the absence of the extracellular loops does not affect the structure of the
transmembrane domain. BBP therefore can serve as a good starting point for the development of
integral membrane proteins with novel engineered functions.
FkpA is a heat shock periplasmic peptidyl-prolyl cis/trans isomerase (PPIase) with chaperone
activity. The chaperone activity of FkpA is independent of its PPIase activity. The mature
dimeric FkpA protein has 245 amino acid residues per monomer. Both chain termini are not well

6
structured and were therefore removed in the reconstructed gene and the expressed protein
prepared for structure studies is denoted "shortened FkpA" (sFkpA). Both FkpA and sFkpA with
C-terminal His6-tag were overexpressed with suitable 2H/15N/l3C- labels and purified for solution
NMR studies. Backbone resonances of 94% of the residues of FKpA were assigned and
secondary structure elements were established using the CSI analysis. Primary dynamical
properties of FkpA were investigated by NMR relaxation experiments, suggesting that the
dimeric FkpA protein could be divided into three relatively rigid subunits moving relative to each
other. Residual dipolar couplings (RDC) were used to compare the global NMR structure of
FkpA in solution with the corresponding crystal structure. Experimental RDC showed significant
mobility of two FKBP domains relative to the dimerization domain. These dynamic properties of
the protein might play an important role in the chaperone activity of FkpA, where binding to
different substrates potentially requires some structural adaptations of the chaperone. Protein
substrates were then used to identify where the chaperone function resides in the dimeric
molecule. Results indicated that five residues, which are distributed between the long a helices
and the FKBP domains, could play an important role in polypeptide binding. A model, the so-
called "mother's arms" model, is then proposed to illustrate the mechanism of the chaperone
function of FkpA. In this model, FkpA "catches" the polypeptide or small protein ("baby protein")
substrates with its polypeptide binding sites (like "hands"), and then holds the substrates through
its structural adaptations, i.e. bending of its two long helical "arms", which is like a mother's
arms hugging her baby.
In NMR methodological aspects, the 3D TROSY-HN(CA)HA and 4D TROSY-HACANH
experiments were proposed for backbone resonance assignment and a new C-detected 3D HCC-
TOCSY is described which serves as an attractive experiment for simultaneous and unambiguous
assignment of the side-chain H and C resonances in partially deuterated proteins of large size. In
3D TROSY-HN(CA)HA and 4D TROSY-HACANH, the combined application of 1H-13C
multiple-quantum and the 1H-15N TROSY effect is proposed to enhance sensitivity. The C-
detected 3D HCC-TOCSY expected to be suitable for assignment of the side-chain methyl 13C
and 'H chemical shifts, containing important information for structure determination, of methyl
protonated, highly deuterated and 13C-labeled proteins with high molecular weight.
7
Zusammenfassung
Das Ziel meiner Doktorarbeit ist es, neue Methoden für die Untersuchung mittels NMR-
Spektroskopie von Struktur und Dynamik von Proteinen zu entwickeln, welche vom Standpunkt
der konventionellen NMR-Spektroskopie als schwierig angesehen werden. Dies schliesst in
Mizellen rekonstituierte Membranproteine oder auch höchst dynamische und lösliche Proteine
mit grosser Ausdehnung und geringer Dichte oder fehlenden weitreichenden strukturellen
Informationen durch NOEs mit ein. Die in dieser Arbeit behandelten Aspekte sind die Wahl einer
geeigneten Isotopenmarkierung, Herstellung einer Probe, Anpassung von schon bestehenden und
Entwicklung neuer Strategien für die Resonanzzuordnung und die Analyse von dynamischen und
funktionellen Eigenschaften des zu untersuchenden Proteins. Die präsentierten Resultate sollten
als Grundlage für detailiertere Untersuchungen über die Struktur und Dynamik von diesen
biologisch wichtigen Systemen dienen.
Membranproteine erfüllen eine grosse Anzahl physiologisch wichtiger Aufgaben. Ein Beispiel
eines Membranproteins, welches geeignet ist für die Untersuchung mittels NMR-Spektroskopie,
ist OmpA, welches in der äusseren Membran von gram-negativen Bakterien in grosser Anzahl zu
finden ist. Die N-terminale Domäne von OmpA von Escherichia coli, welche die Aminosäuren
1-172 umfasst, bildet ein antiparalleles ß-Barrel, dessen acht transmembranäre ß-Stränge durch
drei kurze periplasmatische und vier relativ lange oberflächen-exponierte hydrophile Loops
verbunden sind. Wir wollten den Einfluss der oberflächen-exponierten Loops auf die gesamte
Struktur des Proteins mittels NMR-Spektroskopie untersuchen. Eine OmpA Deletions-Variante,
in welcher alle vier Loops auf eine minimal nötige Länge gekürzt sind und von uns ß-Barrel
Plattform (BBP) benannt wurde, besteht aus nur 142 Aminosäuren und ist das kleinste bekannte
ß-strukturierte integrale Membranprotein. Um die idealen Rückfaltungsbedingungen für die BBP
zu erreichen, wurde eine grosse Anzahl verschiedener Bedingungen in einem „fractional factorial
screen" getestet. Zu diesem Zeitpunkt kann BBP erfolgreich rückgefaltet und isotopenmarkiert
werden und ist damit für NMR-spektroskopische Untersuchungen zugänglich. Ein Vergleich der
NMR-Spektren von BBP und dem Wildtyp OmpA, zeigt dass beide Proteine ähnlich gefaltet sind.
Dies führt zu der Annahme, dass die Abwesenheit der cxtrazellulären Loops keinen Einfluss auf
die Struktur der Transmembrandomäne hat.
FkpA ist eine periplasmatische Hitzeschock petidyl-prolyl cis/trans Isomerase (PPIase) mit
Chaperone-Aktivität, welche unabhängig von der PPIase Aktivität ist. FkpA liegt als ein

8
Homodimer bestehend aus zweimal 245 Aminosäuren vor. Da die beiden Termini keine feste
Struktur aufweisen, wurden sie entfernt und das daraus entstandene Protein wurde sFkpA (für
„shortened FkpA") genannt. Beide Varianten wurden mit einer C-terminalen Hisft-Extenstion und
geeigneter Isotopenmarkierung überexprimiert und für NMR-spektroskopische Untersuchungen
aufbereitet. Rückgratresonanzen von 94% der Aminosäuren von FkpA konnten zugeordnet
werden und die Sekundärstruktur wurde mittels CSI Analyse vorausgesagt. NMR-
spektroskopische Relaxationsexperimente weisen darauf hin, dass das FkpA Dimer aufgrund
dynamischer Eigenschaften in drei Domänen unterteilt werden kann. Um die Struktur von FkpA
in Lösung mit der Kristallstruktur zu vergleichen wurden dipolare Kopplungen verwendet,
welche signifikante Mobilität von zwei FKBP Domänen relativ zur Dimerisierungsdomäne
aufzeigen. Diese dynamischen Eigenschaften des Proteins könnten bei der Chaperone-Aktivität
von FkpA, wo die Bindung an verschiedene Substrate strukturelle Adaptation nötig macht, eine
wichtige Rolle spielen. Die Chaperone-Aktivität innerhalb des Dimers wurde mittels Titration
mit verschiedenen Substraten in den langen a-Helices und FKBP Domänen lokalisiert. Das
sogenannte „mother's arms" Modell, in welchem FkpA ein Polypeptid oder ein kleines Protein
(„Baby-Protein") mit den Bindungsstellen (den „Händen") hält und dieses durch strukturelle
Veränderungen in den zwei langen helikalen „Armen" umschliesst, wurde aufgrund dieser
Resultate vorgeschlagen.
In Bezug auf NMR-spektroskopische Methoden, wurden 3D TROSY-HN(CA)HA und 4D
1 ^
TROSY-HACANH Experimente zur Zuordnung von Rückgratresonanzen und ein neues C-
detektiertes 3D HCC-TOCSY Experiment als attraktive Alternative zur simultanen und
eindeutigen Resonanzzuordnung für JH und 13C in Seitenketten von partiell deuterierten,
grösseren Proteinen entwickelt. Es wird vorgeschlagen, durch kombinierte Anwendung des H-
13C „multiple-quantum" und des 'H-15N TROSY Effekts in den 3D TROSY-HN(CA)HA und 4D
TROSY-HACANH Experimenten die Sensitivität zu erhöhen. Es kann vorausgesagt werden,
dass das 13C-detektierte 3D HCC-TOCSY Experiment sehr hilfreich sein wird bei der
Resonanzzuordnung von 13C und 'H chemischen Verschiebungen in Methylgruppen von
Aminosäureseitenketten. Diese chemischen Verschiebungen enthalten für die
Strukturbestimmung wichtige Informationen in methyl-protonierten, komplett deuterierten und in
13C-markierten Proteinen mit hohem Molekulargewicht.

9
Abbreviations
ID, 2D, 3D 1-dimensional, 2-dimensional, 3-dimensionaI,
BBP ß-barrel platform
cine critical micelle concentration
CRINEPT Cross relaxation-enhanced polarization transfer
CRIPT Cross relaxation-induced polarization transfer
CSA Chemical shift anisotropy
CSI Chemical shift index
DHPC Dihexanoylphosphatidylcholine
DPC Dodecylphosphocholine
DSS 2,2-dimethyl-2-silapentane-5-sulfonate, sodium salt
FKBP FK506-binding protein
INEPT Insensitive nuclei enhanced by polarization transfer
IPTG Isopropylthiogalactoside
LpMIP Legionella pneumophila macrophage infectivity potentiator
MALDI Matrix-assisted laser desorption ionization
MAS Magic angle spin
MP Membrane protein
NMR Nuclear magnetic resonance
NOE Nuclear Ovcrhauser effect
NOESY NOE spectroscopy
OD6oo Optical density at 600 nm
Omp Outer membrane protein
PAS Principal axis system
PDB Protein data bank
PFG Pulse field gradient
PPIase peptidyl-prolyl cis/trans isomerase
ppm Parts per million
RCM-la Reduced and carboxymcthylated bovine a-lactalbumin

10
RDC Residual dipolar coupling
SDS-PAGE Sodium dodecyl sulphate-polyacrylamide gel electrophoresis
TM Transmembrane
TOCSY Total correlation spectroscopy
TROSY Transverse relaxation optimized spectroscopy
11
Chapter I
Preparation and characterization of a membrane protein ß-barrel platform
for solution NMR studies

Membrane protein ß-harrel platform for solution NMR studies 12

Membrane protein ß-barrel platform for solution NMR studies 13
1.1 Introduction
Membrane proteins take part in a large number of important physiological functions, such as
solute and macromolecular transport, chemical and electrical signaling, metabolism and
regulation, therefore, they constitute key targets for drug development. However, a deeper insight
into structure-function relationships of membrane proteins requires high-resolution structural
information, thus knowledge of their three-dimensional (3D) structures could contribute
decisively to better understanding of biological processes at the molecular level.
1.1.1 Structural studies of membrane proteins
High yield expression, purification and refolding of membrane proteins for studies either by X-
ray crystallography or by nuclear magnetic resonance (NMR) spectroscopy are still much more
demanding than the corresponding work with soluble proteins. It is generally difficulty to
crystallize membrane proteins from detergent solutions. For solution NMR experiments,
membrane proteins usually have to be indirectly solubilized in water by incorporation in model
membrane systems, such as micelles. Even for small membrane proteins, these mixed membrane
protein detergents micelles have rather large molecular masses, typically beyond 50000 Da.
Before the advent of the TROSY technique and complete deuteration of the side-chains, the size
of the resulting protein/detergent/lipid supramolecular assemblies was typically too large for
structure determination in solution by NMR.
1.1.1.1 Membrane proteins vs. water soluble proteins
Due to the above mentioned difficulties, determination of the 3D structures of membrane proteins
is still at a frontier of structural biology. Presently, less than 30 independent integral membrane
protein structures have been solved. This contrasts sharply with about 15 000 soluble proteins
solved by X-ray crystallography and NMR spectroscopy. About 30% of all proteins in eukaryotic
cells are membrane proteins [1J, however, less than 0.2% of all membrane protein structures are
known, whereas approximately 10% of soluble proteins are structurally characterized [2|.

Membrane protein ß-barrel platform for solution NMR studies 14
1.1.1.2 Micelles, bicelles and lipid bilayers
For biophysical, structural and functional studies of membrane proteins, detergent micelles,
bicelles, lipid bilayers or lipid vesicles are commonly used as a replacement of the natural
membrane environment.
Micelles: Membrane proteins embedded in detergent micelles are most appropriate for studying
by solution NMR techniques as the combined demands of modest overall size of the
protein/detergent/lipid supramolecular assemblies and preservation of the functional structure of
the protein have so far most promisingly been met by reconstitution of membrane protein into
micellar structures.
Two important parameters characterize micellar solutions: the critical micelle concentration (cmc)
and the aggregation number. Detergents are monomeric below the cmc, but cooperatively
assemble into micelles above the cmc. The aggregation number describes the number of
monomers in a micelle. In the mixed membrane protein-detergent micelles, the effective
molecular weights of the membrane protein-detergent aggregates were determined more by the
structural properties of the protein than by the properties of the detergents [3], Usually there is no
general correlation between effective molecular weights for the mixed micelles and the sizes of
the corresponding protein-free micelles. Medium-chain detergents are generally preferred for use
in NMR studies of complex membrane proteins because they are no worse than short-chained
detergents in terms of increasing the effective molecular weight of the protein of interest while
they are considerably better at maintaining native-like protein conformation [4J. Cmcs and
aggregation numbers depend, sometimes quite dramatically, on environmental parameters, such
as temperature, ionic strength, pH and so on.
Bicelles are thought to be disk-shaped aggregates of phospholipid and detergent that can orient
spontaneously perpendicular to an applied magnetic field owing to their anisotropy of magnetic
susceptibility [5, 6], They were originally devised to orient membrane proteins in the magnetic
field for solid-state NMR studies. Apart from studying the structures of small membrane-bound
peptides, mostly in solid state NMR [7J, bicelles have so far not found wide application in the
solution NMR for structure determination of membrane proteins due to their overall effective

Membrane protein ß-barrel platform for solution NMR studies 15
molecular weight, which is usually larger than that of corresponding mixed micelles, and their
anisotropical property, which causes additional line broadening in solution NMR. Sample
preparation of membrane protein in bicellar assemblies and their activity are also factors to be
considered. For example, diacylglycerol kinase (DAGK) exhibited a preference for
dimyristoylphosphatidylcholine or dipalmitoylphosphatidylcholine bicelles relative to those of
dilauroylphosphatidylcholine. The catalytic activity of DAGK reconstituted into several different
bicelle systems was measured and compared to the activities measured in traditional mixed
micelles and vesicles. For the most optimal bicelle systems tested, DAGK activities approached
those observed in mixed micelles or vesicles. For some other bicellar mixtures tested, activities
were much lower. [8J
Lipid bilayers are the natural environment of membrane proteins. Individual peaks can be
resolved by solid-state NMR of proteins in membranes that either are mechanically oriented in
the magnetic field or are unoriented, but spun at the magic angle (MAS) in the NMR
spectrometer [9-111- Recently, the transmembrane domain of Phospholamban (24-52) was
reported to be incorporated into phospholipid bilayers prepared from 1-palmitoyl -2-oleoyl-sn-
glycero-phosphocholine(POPC). PLB is a 52-amino acid integral membrane protein that
regulates the flow of Ca2+ ions in cardiac muscle cells [12]. Recently, the structure of GpA has
been determined in lipid bilayers by solid-state NMR [13].
1.1.1.3 NMR vs. X-ray crystallography in MP structure studies
Most structures of membrane proteins have been solved by X-ray crystallography. Despite its
relative success, X-ray crystallography of membrane proteins must still be considered a high art.
It is very difficult to crystallize membrane proteins from detergent solutions and the search for
appropriate crystallization conditions must sample a much larger space than a typical soluble
protein crystallization screen.
The use of NMR as a tool to determine structures of membrane proteins is for the most part in a
developmental stage. Compared to soluble proteins, for membrane proteins, the search for
appropriate solution conditions for the NMR samples typical must include a larger number of
variable parameters. In addition to temperature, pH and ionic strength, choice of detergents, the

Membrane protein ß-barrel platform for solution NMR studies
detergent concentration and the protein-to-detergent ratio are important parameters. Due to the
large size and long correlation time of MP in micelles or other membrane mimetic, relaxation is
efficient, resulting in reduced signal to noise and broad lines for signals detected with
conventional NMR techniques. TROSY techniques, which compensate the detrimental effects of
relaxation, open novel avenues for studies of structure, function and dynamics of large soluble
proteins, integral membrane proteins and various complexes of biomolecules [14]. Membrane
proteins can be analyzed in some detergent micelle systems using TROSY. For perdeuteratcd
proteins with high molecular weight, TROSY-based NMR experiments, such as 3D TROSY-
HNCA, TROSY-HN(CO)CA, TROSY-HN(CA)CO, TROSY-HNCACB, TROSY-
HN(CO)CACB and 4D TROSY-HNCACO and 4D TROSY-HNCOCA triple-resonance
experiments [15-17], can be recorded in order to assign backbone 1HN, 15N, 13C\ 13Ca and 13CP
resonances. Using samples uniformly 2H,15N,13C labeled with selectively protonated Val-y(l,2),
Leu-Ô(l,2) and He- 6(1) methyl groups, the NMR experiments 3D (H)C(CQ-TOCSY-(CO)-
["N.'HJ- TROSY and 3D HtCXCQ-TOCSY-fCOM^N^HJ-TROSY can be used for
assignment of the side chain methyl resonances of Val, Leu and He [18]. For uniformly
deuterated or highly deuterated and 13C- and 15N-labeled protein sample, the 13C-observe 2D and
3D spectroscopy can be employed in order to correlate the side-chain 13C chemical shifts and
assign them to particular residues along the polypeptide backbone using the'
C,lCa and C^
residue specific backbone assignment [19].
1.1.1.4 oc - helical and ß - barrel MP studied by solution NMR
With the advent of TROSY and isotope labeling techniques such as perdeuteration [20, 21J and
selective protonation of side chain[22-24J, a remarkable progress was achieved in the area of
NMR structural studies of membrane proteins.
For cc-helical membrane proteins, examples of systems studied include:
The first membrane-associated a-helical 29-residue polypeptide hormone glucagon in DPC
micelles [25], the bacteriorhodopsin fragment comprising residues 1-71 [26], native
bacteriorhodopsin [27, 28], the dimeric transmembrane domain of human glycophorin A (2 x 40

Membrane protein ß-barrel platform for solution NMR studies 17
residues) in DPC micelles [29], the 81-residue human immuno-defciency virus (HIV) membrane-
associated protein Vpu [30, 31], the light-harvesting Iß subunit of Rhodobacter sphaeroides (48
residues) [32], biologically active phospholamban in lipid-mimicking dodecylphosphocholine
mice11es[33J, the 39-kDa homotrimeric protein diacylglycerol kinase (DAGK) in micellar
complexes with overall sizes larger than 100 kDa [34, 35] and most recently the atomic structure
was reported for an unusually small membrane protein Ost4p, containing only 36 residues [36].
Phospholamban is an integral membrane protein that regulates the contractility of cardiac muscle
by maintaining cardiomyocyte calcium homeostasis. The first structure of recombinant,
monomeric, biologically active phospholamban in lipid-mimicking dodecylphosphocholine
micelles was determined by multidimensional NMR experiments. The overall structure of
phospholamban is "L-shaped" with the hydrophobic domain approximately perpendicular to the
cytoplasmic portion [33],
E. coli diacylglycerol kinase (DAGK), an a-helical polytopic membrane protein is a
homotrimeric integral membrane protein comprised of 121 residue subunits, each having three
transmembrane segments. [34, 37, 38]. The aggregate detergent-protein molecular mass of
DAGK in both octyl glucoside and decyl maltoside (DM) micelles was determined to be in the
range of 100-110 kDa. Backbone NMR assignments were most recently reported for DAGK in
detergent micelles using TROSY-based pulse sequences [35].
Ost4p is a subunit of oligosaccharyltransferase (OT), which catalyzes N-glycosylation of proteins
in all eukaryotes and some prokaryotes. In Saccharomyces cerevisiae, OT is -composed of nine
nonidentical membrane proteins. Ost4p is an unusually small membrane protein containing only
36 residues, which folds into a well formed, kinked helix in the model-membrane solvent system.
The NMR structure of Ost4p helps understanding the structural basis for the function of this
protein [36].
a-helical membrane proteins can also be studied in organic solvent-water mixtures or organic
solvent, such as the subunits c and b of the Escherichia coli FoFi ATP synthase [391, subunit a of
the Escherichia coli ATP synthase [40] and the 52 residue phospholamban [41] However, there
are discrepancies between the reported structure for synthetic phospholamban in organic solvents
and its structure in lipid-mimicking dodecylphosphocholine micelles [33].
Subunit a of the Escherichia coli ATP synthase is a 30 kDa integral membrane protein, Pure
subunit a can be reconstituted with subunits b and c and phospholipids to form a functional

Membrane protein ß-barrel platform for solution NMR studies 18
proton-translocating unit. NMR spectra of the pure subunit a in a mixed solvent show good
chemical shift dispersion and demonstrate the potential of the solvent mixtures for NMR studies
of the large membrane proteins that are currently intractable in aqueous detergent solutions [40].
The results must however be taken with caution considering the discrepancies observed for
phospholamban.
Bacteriorhodopsin (BR) is a 26 kDa seven-helical transmembrane protein found in the cellular
membrane of Halohacterium salinarium. Bacteriorhodopsin converts light energy into that of a
proton gradient that is subsequently used by the transmembrane protein ATP-synthase to produce
chemical energy in the form of ATP. Structures of a chymotryptic fragment C2 (residues 1- 71)
of bacterioopsin from Halohacterium halobium, solubihzed in an organic mixture of
methanol/chloroform and deuterated HCO2NH4, or in perdeuterated sodium dodecyl sulfate (SDS)
micelles in the presence of perdeuterated trifluoroethanol were determined by two-dimensional
and three-dimensional heteronuclear 15N-'H NMR techniques [26, 42]. Recently, the structures of
two forms of bacteriorhodopsin solubihzed in dodecyl maltoside with a deuterated dodecyl
moiety (dDM) present in the dark-adapted state were determined by using solution state NMR,
[28].
For ß-barrel membrane proteins, systems most widely studied include:
OmpX (148 residues) in DHPC micelles (with molecular mass of the mixed micelles of
OmpX/DHPC on the order of 60 kDa) [43, 44] and in a urea-denatured form [45], the
transmembrane domain of OmpA(177 residues) in DPC [46] and DHPC (with molecular mass of
the mixed micelles of OmpA/DHPC on the order of 80 kDa)[3], and the outer membrane enzyme
PagP (164 residues) in DPC and ra-octyl-ß-D-glucoside (OG) micelles[47].
TROSY-based NMR experiments have been applied in NMR studies of the E. coli integral
membrane proteins OmpX and OmpA in mixed micelles with the detergent DHPC [3, 18, 48].
For OmpX, complete sequence-specific NMR assignments have been obtained for the
polypeptide backbone and side chain methyl resonances of Val, Leu and Ile [18J. The Creand
13CP chemical shifts and nuclear Overhauser effect data then resulted in the identification of the
regular secondary structure elements of OmpX/DHPC in solution. The structure of the integral
membrane protein OmpX from E, coli reconstituted in 60 kDa DHPC micelles calculated from

Membrane protein ß-barrel platform for solution NMR studies 19
526 NOE upper limit distance constraints was recently reported [43]. The structure determination
was based on complete sequence-specific assignments for the amide protons and the Val, Leu,
and Ile(ôi) methyl groups in OmpX, which were selectively protonated on a perdeuterated
background. The solution structure of OmpX in DHPC micelles consists of a well-defined, eight-
stranded antiparallel beta-barrel, with successive pairs of beta-strands connected by mobile loops.
The topology and the protein-detergent interactions in the mixed micelles, consisting of about 90
molecules of the detergent DHPC and one molecule of the E. coli OmpX, were characterized by
intermolecular NOEs between the protein and detergent DHPC and by use of paramagnetic
probes with different physicochemical properties [44, 49]. The experimental data suggest that the
hydrophobic surface areas of OmpX are covered with a monolayer of DHPC molecules, which
appears to mimic quite faithfully the embedding of the beta-barrel in a double- layer lipid
membrane.
For the transmembrane domain of OmpA, published data indicate that very similar results were
obtained for OmpA (0-176)/DPC as for OmpA (1-176)/DHPC and OmpA (0-171)/DHPC [3, 46],
i.e. backbone assignments were obtained for 138 residues (76%), resulting in the identification of
eight ß-strands based on l3C chemical shifts and NOEs. The three-dimensional fold of the
transmembrane domain of OmpA of E. coli in DPC micelles in solution has been determined [46].
The structure consists of an eight-stranded ß-barrel connected by tight turns on the periplasmic
side and larger mobile loops on the extracellular side. The solution structure of the barrel in DPC
micelles is similar to that in rc-octyltetraoxyethylene (C8E4) micelles determined by X-ray
diffraction. NMR dynamic experiments reveal a gradient of conformational flexibility in the
structure that may contribute to the membrane channel function of this protein.
The global fold of E. coli PagP, a bacterial outer membrane enzyme which transfers a palmitate
chain from a phospholipid to lipid A, was determined in both DPC and OG detergent micelles
using TROSY. PagP consists of an eight-stranded anti-parallel ß-barrel preceded by an
amphipathic a-helix. The ß-barrel is well defined with barrel axis uniquely tilted by 30 degrees
with respect to the membrane normal, whereas NMR relaxation measurements reveal
considerable mobility in the loops connecting individual ß-strands. Three amino acid residues
critical for enzymatic activity were found to be located in extracellular loops near the membrane
interface, positioning them optimally to interact with the polar head groups of lipid A [47].

Membrane protein ß-barrel platform for solution NMR studies 20
1.1.2 Experimental aspects: solution NMR studies of MP
For solution NMR studies of membrane protein, preservation of the functional structure of the
protein and restriction of the overall size of the mixed protein/detergent/lipid particles have so far
most promisingly been met by reconstitution of membrane proteins into micelles.
1.1.2.1 MP sample preparation for solution NMR studies
As the overall size of the mixed membrane protein detergent micelles is usually quite large,
typically 60-110 kDa, membrane proteins typically have to be labeled with the stable isotopes H,
13C and 15N for multidimensional heteronuclear NMR experiments. Therefore, right at the
beginning of the project, it was very important to obtain a high-yield expression system for the
desired membrane proteins due to the costs associated with isotope labeling, and deuteration
often causes a reduction in yield of the protein due to the negative influence of the deuterated
medium on the cell metabolism [50].
1.1.2.1.1 Expression and purification
Because there is so far no generally recommended refolding protocol available for a-helical
membrane proteins, the protein is usually expressed in its native form in the cell membrane.
Membrane protein then may in favorable cases be extracted from the membrane and purified in
the folded form and transferred into detergent micelles [51]. However, low yields have often
greatly increased the expense of preparing of isotope-labeled NMR samples of a-helical
membrane proteins.
So far, ß-barrel membrane proteins, such as OmpX [43, 44], OmpA [3, 46] and PagP [47], were
overexpressed with high yield in an aggregated form (inclusion bodies) in the cytoplasm of E.
coli. In some cases, the signal sequences have to be deleted to redirect the membrane protein for
cytoplasmic expression and/ or Histidine tags were engineered into the expression vectors for
easier purification. The inclusion bodies are usually first isolated, and protein is extracted by
dissolving the inclusion bodies in concentrated urea or guanidinium hydrochloride solutions for
further purification, and subsequent refolding and reconstitution in detergent micelles[43, 45].

Membrane protein ß-barrel platform for solution NMR studies 21
1.1.2.1.2 Refolding
For the a-helical membrane proteins, there is so far no generally recommended refolding
protocol available, and expression and purification are usually carried out using the natively
folded form [51].
For the ß-barrel membrane proteins, purification can be performed in the presence of dénaturants
such as urea or guanidinium chloride [45]. However, the refolding step is often cumbersome.
Refolding conditions have to be carefully explored for each membrane protein. In addition to
temperature, pH, buffer and ionic strength, one has to consider the initial membrane protein
concentration in dénaturants, the choice of detergents, the detergent concentration and some other
agents which assist refolding, such as: divalent cations (MgCl2, CaCl2, orEDTA to reduce their
concentration), nonpolar additives (glycerol), polar additives (L-Arginine), chaotrope (guanidine
hydrochloride), non-detergent sulfobetaine (NDSB), ammonium sulfate, etc [52-55]. In many
cases, the lack of an appropriate refolding method is a major obstacle in the structure
determination of a membrane protein by NMR. It is hoped that in the future an efficient
expression of membrane proteins in their native form will avoid the often cumbersome refolding
step.
1.1.2.1.3 Isotope-labeling
Due to the large overall size of the membrane protein-detergent assemblies, membrane proteins
typically have to be labeled with the stable isotopes 2H, 13C and 15N for multidimensional
heteronuclear NMR experiments[35, 43],
For the nC and 15N labeling, MP can be expressed in a minimal medium or a Martek-9 medium
supplied with l3C- glucose and 15NH4C1 as the isotope sources. Deuterium labeling has been used
to improve the resolution and sensitivity of solution NMR spectra[23]. Furthermore, the use of
uniform the 2H labeling results in a relatively large improvement in the sensitivity of TROSY-
based NMR spectra of large molecules or macromolecular complexes, such as membrane
proteins in detergent micelles [56]. However, because much of the sidechain information is lost
by the complete deuteration of these moieties, methods were developed to keep methyl groups in

Membrane protein ß-barrel platform for solution NMR studies 22
the predeuterated protein, such as methyl groups in Val, Leu and He, [57]. Retention of proton
labels in the amino acids of a given type in the otherwise deuterated background is an important
method to obtain sidechain NOEs and necessary for a high resolution structure determination
[22-24].
1.1.2.2 NMR spectroscopy and structure determination of MP
Solution NMR spectroscopy was recently used for structure determination of membrane proteins
in micelles [35, 40, 43, 46, 47]. Optimal spectra with good sensitivity and high resolution can be
obtained by the suppression of transverse relaxation in multidimensional hcteronuclear NMR
experiments. Suppression of transverse relaxation can be achieved by biochemical methods, such
as perdeuteration of the membrane protein samples [20, 58, 59], and NMR methods, through the
use of carefully designed TROSY-based NMR pulse sequence[14, 16, 60],
A major advance in solution NMR spectroscopy that has had a significant impact on the
determination of membrane protein structures in detergent micelles was the development of
TROSY (Transverse relaxation- optimized spectroscopy) [14], which, compared to the
conventional HSQC, enables structural studies of much larger size system such as, large protein
oligmers and membrane protein/detergent/lipid supramolecular assemblies. TROSY is an
approach for the suppression of transverse relaxation in multidimensional NMR experiments,
which is based on the constructive use of the cross-correlated interference effect between dipole-
dipole coupling (DD) and chemical shift anisotropy (CSA). The principle of TROSY combined
with cross-correlated relaxation enhanced polarization transfer (CRINEPT) [61, 62] was applied
to particles with the molecular masses up to 900 kDa [63J.
Selective and uniform deuteration of amino acid sidechains is another indispensable tool for
suppression of transverse relaxation in multidimensional heteronuclear NMR spectra of large
complexes, including membrane proteins in detergent micelles [58]. The gain in sensitivity
comes from the lower gyromagnetic ratio of 2H relative to 'H and the corresponding reduction in
the rate of transverse relaxation of the neighboring heteronuclei due to the dipole-dipole coupling
mechanism. This results in sharper resonance lines. However, a complete deuteration of the side-
chains eliminates much of the side-chain information and usually only a limited set of NOE

Membrane protein ß-barrel platform for solution NMR studies 23
distance constraints are accessible among the backbone amide protons. Consequently, structural
models for ß-barrel membrane proteins which have been constructed so far are only of low
resolution, whereas for the a-helical membrane proteins usually only the secondary structure is
determined. Methyl groups are useful sources of information for structure determination.
Protonation of methyl groups in a predeuterated protein, such as methyl groups in Val, Leu and
He, results in greatly improved precision of the structure determination because more NOE
distance constraints are generated for the sidechain methyl protons. However, dipolar interactions
between the backbone amide protons and the methyl protons have a severe effect on the TROSY
efficiency in very large systems. For these systems, the sensitivity of TROSY spectra is
significantly degraded by the introduction of methyl protons into the uniformly deuterated
background. Recently, it was reported that methyl analyses with molecular weights greater than
600 kDa will complement TROSY and CRINEPT analyses of amides in NMR studies of
structure and molecular interactions of extremely large macromolecules and assemblies [64].
These results indicate that for very large systems optimal observation of amide and methyl
moieties might require separately labeled samples.
In addition to distance constraints based on the NOE (NOESY), useful additional experimental
constraints for membrane protein structure determination can presently be expected to result from
measurement of residual dipolar couplings [65] and from the use of paramagnetic spin labels
[66]. An interesting method to weakly align spherical membrane protein-detergent complexes in
the magnetic field is by the use of lanthanide metal ions to adventitious [67] or engineered [30]
sites in this class of proteins. An 'EF hand' calcium-binding site could be engineered into
membrane proteins which do not have an adventitious lanthanide-binding site.
Furthermore, for uniformly or highly deuterated membrane proteins, 13C-detected 2D and 3D
spectroscopy recently developed in our group can be employed as a method for the side-chain ' C
chemical shift assignment [19]. Another attractive feature of the 13C-observe experiments is that
multiple and redundant 'Jcc scalar couplings are resolved as the i3C multiplets in the directly
acquired 13C dimension. Measurement of multiple l3C - nC residual dipolar couplings (RDCs)
could further offer potential orientational constraints for the structure determination of membrane
proteins f681.

Membrane protein ß-barrel platform for solution NMR studies 24
1.2 Preparation and characterization of a membrane protein ß-barrel
platform of OmpA
1.2.1 Introduction to the outer membrane protein A (OmpA)
Outer membrane protein A (OmpA) is an abundant structural protein of the outer membrane of
Gram-negative bacteria. It is believed to connect the outer membrane structurally to the
periplasmic peptidoglycan layer via its periplasmic domain, which consists of residues 177-325.
The N-terminal domain of the OmpA protein from Escherichia coli, consisting of residues 1-172,
is embedded in the outer membrane and forms the transmembrane domain, whose structure was
solved by X-ray crystallography [69] and NMR [46].
LI L2 L3 L4
AimAsn As»
#9
Ptie
Ihr
VMSet
(Sei
ûlySur
Glu
fîsr A$n j^ «gPm Ûty Am Ly* m «te û)yi7wa* ijW Gfyra "Ont —•&{ **P A&>î$o 7**
Ms fyr Ala to__A Thr Aap Ars»ßii a«A"^*TB^ 75«- ffiE ' —
W»^*" (Ami ] [Mal I bj».
Extracellular
Periplasmic
Figure 1.1 Two-dimensional model of the arrangement of the N-terminal ß-barrel domain of OmpA in the
outer membrane, adapted from [70]. The surface-exposed loops and periplasmic turns are labeled LI to L4
and Tl to T3, respectively. Amino acid residues are numbered according to their position in the wild-type
sequence. In the study of the ß-barrel platform of OmpA, two modifications in the periplasmic turns were
maded. At turn T2, Tle-87 was replaced by Lys-Leu-Gly. At turn T3, the peptide Arg-Arg-Arg-Ile was
introduced between 1131 and T132, and Ala-130 was converted to Val. Residues that were removed upon
loop deletion mutagenesis are shown in italics; amino acids that were introduced in their places are shown
in boldface.

Membrane protein ß-barrel platform for solution NMR studies 25
In detergent micelles and lipid bilayers, the transmembrane domain of OmpA forms an
antiparallel ß-barrel whose eight transmembrane ß-strands are connected by three short
periplasmic turns and four relatively large surface-exposed hydrophilic loops (Figure 1.1) [70]. A
gradient of increasing dynamics starts from the center of the barrel towards both ends of the
barrel of OmpA, which opposes the dynamic gradient of the lipid bilayer itself [46].
Over-expression and spontaneously refolding of OmpA into detergent micelles [11] has greatly
facilitated its structure determination by NMR [46J. Refolded OmpA exhibits similar single
channel properties as native OmpA [72]. Other functions that have been attributed to OmpA are
its involvement in bacterial conjugation and its action as a receptor for various bacteriophages
and some colicins.
1.2.2 Design of the ß-barrel platform (BBP) of OmpA
The structural and functional roles of the surface-exposed loops of OmpA were extensively
studied through reconstruction of its loop-shortened mutants [701. The loops are shortened
separately and in all possible combinations. In vivo, the loop deletion mutants assembled into the
outer membrane with high efficiency and adopted the wild-type membrane topology. This
approach indicates the absence of topogenic signals (e.g., in the form of loop sizes or charge
distributions) in these loops. In our work, we prove this by direct refolding experiments followed
by NMR analysis. The shortening of surface-exposed loops did not reduce the thermal stability of
the protein. However, all loops were necessary for the OmpA protein to function in the
stabilization of mating aggregates during F conjugation[70].
An OmpA deletion variant with all four loops shortened (Figure 1.1), i.e. the ß-barrel platform
(BBP) of OmpA, consisting of only 142 residues (with the C-terminal QGEAA remaining
attached), constitutes the smallest ß-struetured integral membrane protein known to date. In our
NMR studies of this BBP, we were asked questions if the removed loops contain amino-acid
sequences critical for the membrane protein's folding and if the absence of the extracellular loops
affects the structure of the transmembrane domain. This ß-barrel platform (BBP) could serve as a
model for NMR study of membrane assembly of integral ß-struetured membrane proteins in vitro.

Membrane protein ß-barrel platform for solution NMR studies 26
1.2.3 NMR sample preparation of BBP
Ï.2.3.1 Sequencing the reconstructed gene
The plasmid was extracted from the BBP mutant and transformed into E. coli XLl-Blue
competent cells. The plasmid extracted from XLl-Blue cells was sequenced with using standard
sequencing techniques offered online (www.microsynth.ch). Translation of the DNA sequence to
amino acids (Table 1 in Appendix A.l) shows that BBP is presumably four-loop shortened
mutant of OmpA, with two modifications at its periplasmic turns (T2 to T2H1 and T3 to T3S1),
Ala-130 converted to Val and QGEAA remaining attached at the C-terminaus [70].
1.2.3.2 Over-expression, labeling and purification of BBP
The sequenced plasmid was transformed into E. coli BL21-Gold (DE3)pLysS competent cells.
The freshly transformed cells were grown in the LB medium overnight. Then 4 x 2.5 ml of this
culture was inoculated into 4 x 250 ml Martek-9 medium, with 13C-glucose and 15NH4C1 supplied
as the 13C and 15N sources for the labeled samples. To prepare the deuterated samples, D20 was
used as solvent instead of H2O with a two-step adaptation of the growing cultures in 50% D2O /
H20 and 100% D20 LB medium. The culture was induced with 1 mM 1PTG at OD6(x> 0.3-0.4 in
Martek-9 medium and harvested by centrifugation when the cell growth reached the stationary
phase.
The cell pellet was frozen and then thawed on ice, resuspended in the Tris-EDTA buffer (20 mM
Tris, 5 mM EDTA), pH - 8, with a volume (ml) of the buffer corresponding to 3 times the wet
pellet weight (g). To lyse the cells, the resuspended pellet was sonicated for 20-30 minutes on
crushed ice (to avoid heating of the solution and degradation of the protein), then centrifuged for
1 hour at 6000 rpm and the white inclusion body pellet was kept. The inclusion body pellet was
resuspended in a volume (ml) of 2% Triton-XlOO Tris-EDTA buffer, pH = 8, corresponding to
about 3 times the wet pellet weight (g) shaken in the incubator for 20 minutes at 37°C to remove
cell membranes, centrifuged for 30 minutes at 4°C to collect the pellet. The supernatant was
discarded and the pellet was resuspended in 30 ml Tris-EDTA buffer, pH = 8 without Triton and
shaken again for 1 hour at 37°C to remove detergent, then centrifuged for 30 minutes at 4ÜC and
the pellet was kept. This pellet was resuspended a in minimal amount (~lml) of 6M GuHCl, Tris-
Membrane protein ß-barrel platform for solution NMR studies 27
EDTA buffer, pH 6.0, shaken for a minimum of 2 hours in the incubator at 37 °C, and centrifuged
for 20 minutes at 20000 rpm, and the supernatant was kept.
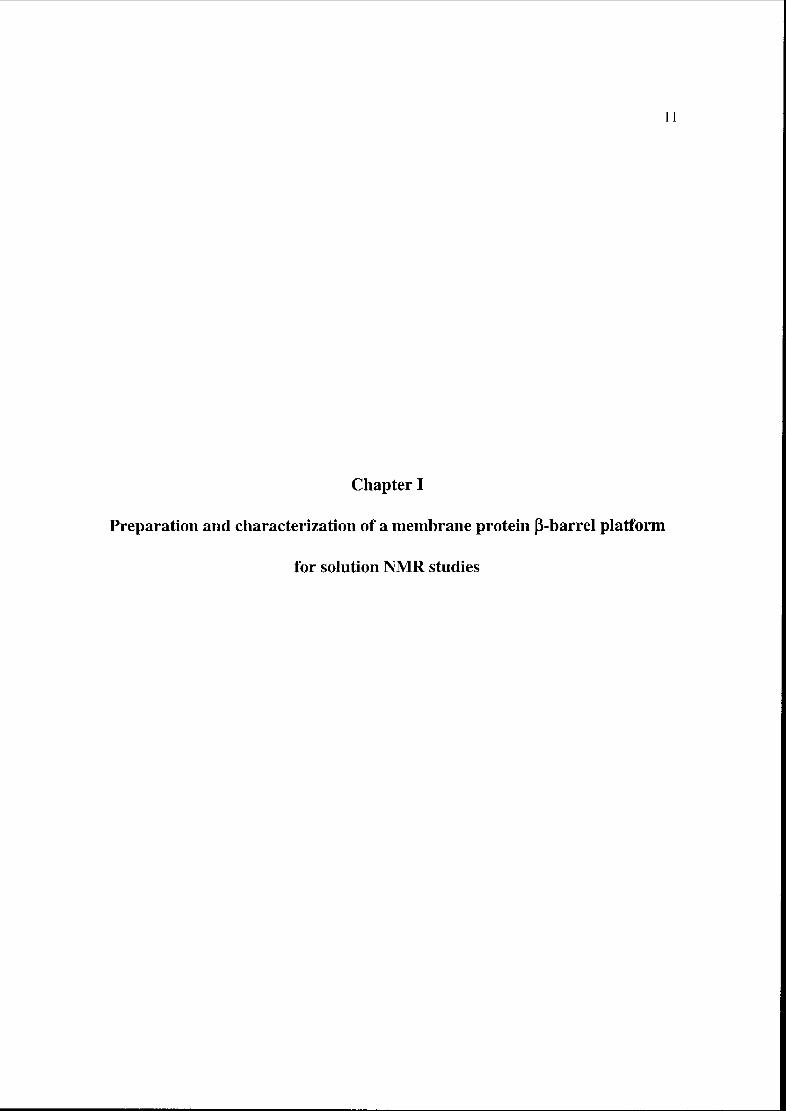
SDS-PAGE is done to check the purity of the protein sample (Figure 1.2). The MALDI mass
spectrum showed a MW of 15681, which is comparable with theoretical average mass of 15673.6
(with N-terminal Met removed).
1
Figure 1.2 SDS-PAGE shows the induction and purification of BBP. Lane 1 is protein marker (14 kDa -
66 kDa). Lane 2 is the purified proteinin 6 M GuHCl solution. Lanes 3, 5, 7, 9 and 4, 6, 8, 10 are cell
extract samples of 1 ml of culture taken from four different flasks before and after induction, respectively.
1.2.3.3 Refolding of BBP into micelles
Refolding of BBP required screening of a large space of refolding conditions so that fractional
factorial [73] refolding screens were used to identify refolding conditions for BBP [53, 55]. The
protein sample obtained in 6M GuHCl, Tris-EDTA buffer, PH 6.0 was diluted to 0.4 mM and
then refolded in the presence of detergent micelles and other additives at room temperature by
slowly diluting the unfolded protein into the refolding buffer while stirring extensively followed
by dialysis and concentration by ultrafiltration.

Membrane protein ß-barrel platform for solution NMR studies 28
Table 1 Fractional factorial refolding screen
Factor 1 2 3 4 5 6 7 8
Exp. 1 - - - - - - - -
Exp.2 + . - - - + + +
Exp.3 - + - - + - + +
Exp.4 + + - - + + - -
Exp.5 - - + - + + + -
Exp.6 + - + . + - - +
Exp.7 - + + - - + - +
Exp.8 + + + - - - + -
Exp.9 - - - + + + - +
Exp. 10 + - - + + - + -
Exp.ll - + - + - + + -
Exp. 12 + + - + - - - +
Exp. 13 - - + + - - + +
Exp. 14 + - + + - + - -
Exp. 15 - + + + + - - -
Exp. 16 + + + + + + + +
Factor 1 pH (MES pH 6 +/ HEPES pH 7 -)
Factor 2 detergent (Octyl-POE +/ DHPC -)
Factor 3 divalent cations (presence +/ absence, 5 mM EDTA -)
Factor 4 guanidinium hydrochloride (presence / absence)
Factor 5 Glycerol (presence / absence)
Factor 6 L-arginine (presence / absence)
Factor 7 non-detergent sulfobetaine (presence / absence)
Factor 8 ammonium sulfate (presence / absence)
With the consideration of 8 factors with 2 levels (- or + in the schematic representation shown
above) for each factor, a 16 condition fractional factorial refolding screen (Table 1) was carried
out to identify optimal refolding conditions. By examining 1/16th fraction of the full factorial (the

Membrane protein ß-barrel platform for solution NMR studies 29
full factorial would require 28- 256 experiments), refolding conditions were established for BBP
in Dihexanoylphosphatidylcholine (DHPC) micelles.
Finally, the optimal refolding of BBP for solution NMR studies is carried out by diluting 0.4 mM
denatured protein in 6M GuHCl into 6 volumes of the refolding buffer: 3% DHPC in 0.1 M MES
buffer, pH 6 in the presence of 5 mM EDTA, 0.5 M guanidinium hydrochloride, 0.4 M glycerol,
0.35 M L-arginine, 0.5 M ammonium sulfate and 100 mM NaCI, at room temperature. After
concentrating and dialysis against the MES buffer, pH 6.0 containing 5% 2H20, the final protein
sample is concentrated to a volume of 300 pi by ultrafiltration and then transferred to a Shigemi
NMR tube for solution NMR studies.
1.2.4 NMR spectroscopy of BBP
NMR spectra including 2D ^H^NJ TROSY of the 2H,15N-labeled BBP and 3D TROSY-
versions of HNCA, HNCACB and 3D 15N resolved TROSY-NOESY of 2H, 15N and 13C -labeled
BBP were acquired at 30°C on a Bruker Avance 600 MHz spectrometer equipped with a TXI
cryogenic probehead and a Bruker Avance 900 MHz spectrometers. NMR data were processed
using the PROSA software [74] and analysed using XEASY [75] and CARA (unpublished,
Keller ct al., 2004). The 'H chemical shifts were referenced to the DSS signal at 0 ppm and the
l3C and 15N chemical shifts were referenced indirectly using the 13C/1H and 15N/'H gyromagnetic
ratios [76].
Figure 1.3 shows the 2D f'H,15N] TROSY of 2H, 15N and I3C -labeled BBP, which displays the
large signal dispersion typical for a folded protein. After a comparison of the peak pattern with
2D ['H,15N] TROSY of the transmembrane domain of OmpA (1-176), the primary conclusion
can be drawn that BBP with all four extracelluar loops truncated refolds in vitro in a similar way
to the transmembrane domain of wild-type OmpA. This suggests that the extracellular loops
indeed do not contain amino-acid sequences critical for the membrane protein's refolding in vitro.
The squenece specific backbone assignment is in a part achieved by the use of 3D TROSY-
versions of HNCA, HNCACB and 3D 15N resolved TROSY-NOESY of 2H, 15N and 13C-labeled
BBP together with the information from the previously reported NMR studies of the N-terminal

Membrane protein ß-barrel platform for solution NMR studies 30
110
115
[ppm]
125
-130
10.0 9.0 JïFtPpm] 8.0
Figure 1.3 900 MHz 2D [*H, l5N ]-TROSY spectrum recorded with a 2 mM 2H, I5N and nC -labeled BBP
sample at 303 K. Signals corresponding to the assigned residues are annotated with number according to
their position in the wild-type OmpA sequence.
transmembrane domain of OmpA (1-176) [3, 46J. Figure 1.4 shows strips corresponding to the
residues 48- 52 of BBP in the TROSY-HNCA experiment recorded at 900MHz, 303K. The
assigned residues are indicated in figure 1.3, of which residues 10-13, 42- 45, 48- 57, 77- 85, 95-
97, 125- 128 and 164-176 are located in transmembrane ß-strand segments (except
ransmembrane ß-strand 7), ranging from the center toward the periplasmic side of the ß-barrel.
The residues residing either at the interface between the transmembrane segments and the
extracellular loops (although already shortened) or in the short periplasmic turns, have not yet
been assigned, probably due to line broadening due to the conformational exchange on ms

Membrane protein ß-barrel platform for solution NMR studies 31
E52
121.79
-45
55
[ppm]
-65
7.92 7.28 8.66 9.098.67
*HJ^|»D1]
Figure 1.4 Strips corresponding to the assignment of the residues 48-52 (numbered according to their
position in the wild-type OmpA sequence) of BBP in the TROSY-HNCA spectrum recorded with a 2 mM
2H, l5N and 1JC-labeled BBP sample at 900 MHz, 303 K. Arrows indicate the sequential connectivities.
timescale [77-79]. However, the chemical shift index (CSI) analysis based on the CA chemical
shifts of the assigned residues [80] indicates the existence of the ß-strand secondary structure
elements. These results further suggest that BBP indeed refolds as a ß-barrel in DHPC in vitro, in
a similar way to the transmembrane domain of the wild type OmpA, and that the absence of the
extracellular loops does not affect the structure of the transmembrane domain. Based on the
information available so far, we constructed a 3D model of BBP using the program SWISS-
MODEL 181], as shown in figure 1.5.

Membrane protein ß-barrel platform for solution NMR studies 32
Figure 1.5 A. One conformer of the solution NMR structure (PDB code: 1G90) of the N-terminal
transmembrane domain of OmpA (0-176) [46]. B. Structure of BBP modelled based on the
conformer in figure 1.5 A using SWISS-MODEL [81].
1.2.5 Conclusions and perspectives
Based on our NMR studies of BBP, this artificially designed outer membrane protein, which
constitutes the smallest ß-struetured integral membrane protein known to date, refolds into a ß-
barrel structure in vitro. The absence of the extracellular loops does not appear to affect the
structure of the transmembrane domain. Therefore, this minimal ß-barrel unit, or ß-barrel
platform, could be used as a basic model for design of an artificial membrane protein, which may
have interesting biological applications, such as, artificially controllable ion channels or signal
transduction across the cell membrane.
Successful refolding of BBP in vitro and preparation of isotope labeled samples suitable for
NMR structure determination encouraged us to engineer an 'EF hand' calcium-binding site into
this BBP, to design a new artificial membrane protein with high affinity to paramagnetic ions,
such as lanthanide. As mentioned above, binding of lanthanides to this engineered site has the
potential to weakly align the membrane protein-detergent complex in strong magnetic fields,
which in turn can provide important structural constraints based on paramagnetic relaxation rate

Membrane protein ß-barrel platform for solution NMR studies 33
enhancements (distances), residual dipolar couplings (orientation), pseudocontact shifts
(distances) and Curie-dipole dipole cross-correlation (distances and orientation) [82].
Engineering of the lanthanide binding sites and aforementioned NMR data can be used as a
general method to obtain high resolution NMR structure of membrane proteins.
References
1. Walhn E, von Heijne G, Genome-wide analysis of integral membrane proteins Jrom eubacierial, archaean, and
eukaryotic organisms. Protein Sei., 1998. 7(4): p. 1029-1038.
2. Vitkup D, Melamud E, Moult J, Sander C, Completeness in structural genomics. Nat. Struct. Biol., 2001. 8(6): p.
559-566.
3. Fernandez C, Hilly C, Bonjour S, Adeishvili K, Pervushin K, Wuthrich K, Solution NMR studies ojthe integral
membrane proteins OmpX and OmpA from Escherichia coli. FEBS Lett., 2001. 504(3): p. 173-178.
4. Vinogradova, O., F. Sonnichsen, and C. R. Sanders, On choosing a detergent for solution NMR studies of
membrane proteins. J. Biomol. NMR, 1998. 11(4): p. 381-386.
5. Tjandra, N. and A. Bax, Direct measurement oj distances and angles in biomolecules by NMR in a dilute liquid
crystalline medium (vol 278, pg 1111, 1997). Science, 1997. 278(5344): p. 1697-1697.
6. Cavagnero, S., H. J. Dyson, and P. E. Wright, Improved low pH bicelle system for orienting macromolecules
over a wide temperature range. J. Biomol. NMR, 1999. 13(4): p. 387-391.
7. Fujiwara T, Todokoro Y, Yanagishita H, Tawarayama M, Kohno T, Wakamatsu K, Akutsu H, Signal
assignments and chemical-shifl structural analysis of uniformly C-13, N-15-labeled peptide, mastoparan-X, by
multidimensional solid-state NMR under magic-angle spinning. J. Biomol. NMR, 2004. 28(4): p. 311-325.
8. Czerski L, Sanders CR, Functionality of a membrane protein in bicelles. Anal. Biochem., 2000. 284(2): p. 327-
333.
9. Opella, S. J., NMR and membrane proteins. Nat. Struct. Biol., 1997. 4: p. 845-848.
10. Hu, W., N. D. Lazo, and T. A. Cross, Tryptophan Dynamics and Structural Refinement in a Lipid Bitayer
Environment - Solid-State Nmr of the Gramicidin Channel. Biochemistry, 1995. 34(43): p. 14138-14146.
11. Marassi, F. M, and S. J. Opella, NMR structural studies of membrane proteins. Curr. Opin. Struct. Biol., 1998.
8(5): p. 640-648.
12. Dave PC, Tiburu EK, Damodaran K, Lorigan GA, Investigating structural changes in the lipid bilayer upon
insertion of the transmembrane domain of the membrane-bound protein phospholamban utilizing P-31 and H-2
solid-state NMR spectroscopy. Biophys. J., 2004. 86(3): p. 1564-1573.
13. Smith, S. O., et al., Structure of the transmembrane dimer interface of glycophorin A in membrane bilayers.
Biochemistry, 2001. 40(22): p. 6553-6558.
14. Pervushin, K., et al., Attenuated T-2 relaxation by mutual cancellation ofdipole- dipole coupling and chemical
shift anisotropy indicates an avenue to NMR structures of very large biological macromolecules in solution.
Proc. Natl. Acad. Sei. U. S. A., 1997. 94(23): p. 12366-12371.

Membrane protein ß-barrel platform for solution NMR studies 34
15. Salzmann, M., et al., Improved sensitivity and coherence selection for [N-15,H-1J- TROSY elements in triple
resonance experiments. J. Biomol. NMR, 1999. 15(2): p. 181-184.
16. Salzmann, M., et al., TROSY-type triple-resonance experiments for sequential NMR assignments of large
proteins. J. Am. Chcm. Soc, 1999. 121(4): p. 844-848.
17. Yang, D. W. and L. E. Kay, TROSY triple-resonance four-dimensional NMR spectroscopy of a 46 ns tumbling
protein. J. Am. Chem. Soc., 1999. 121(11): p. 2571-2575.
18. Hilty C, Fernandez C, Wider G, Wuthrich K, Side chain NMR assignments in the. membrane protein OmpX
reconstituted in DHPC micelles. J. Biomol. NMR, 2002. 23(4): p. 289-301.
19. Eletsky A, Moreira O, Kovacs H, Pervushin K, A novel strategy for the assignment of side-chain resonances in
completely deuterated large, proteins using C-13 spectroscopy. J. Biomol. NMR, 2003. 26(2): p. 167-169.
20. LeMaster, D. M., Deuteration in Protein Proton Magnetic-Resonance. Method Enzymol., 1989.177: p. 23-43.
21. LeMaster, D. M., Uniform and Selective Deuteration in 2-Dimensional Nmr of Proteins. Annual Review of
Biophysics and Biophysical Chemistry, 1990. 19: p. 243-266.
22. Rosen, M. K., et al., Selective methyl group protonation ofperdeuterated proteins. J. Mol. Biol., 1996. 263(5): p.
627-636.
23. Gardner, K. H„ et al., Solution NMR studies of a 42 KDa Escherichia coli maltose binding protein beta-
cyclodextrin complex: Chemical shift assignments and analysis. J. Am. Chem. Soc, 1998. 120(45): p. 11738-
11748.
24. Goto, N. K., et al., A robust and cost-effective method for the production of Vat, Leu, He (delta 1) methyl-
protonatedN-15-, C-13-, H-2-labeledproteins. J. Biomol. NMR, 1999. 13(4): p. 369-374.
25. Braun W, Wider G, Lee KH, Wuthrich K, Conformation Of Glucagon In A Lipid Water Interphase By II-l
Nuclear Magnetic-Resonance. J. Mol. Biol., 1983. 169(4): p. 921-948.
26. Pervushin, K. V., et al., 3-Dimensional Structure of (l-71)Bacterioopsin Solubilized in Methanol/Chloroform
and SDS Micelles Determined By N-15-H-1 Heteronuclear Nmr-Spectroscopy. Eur. J. Biochem., 1994. 219(1-2):
p. 571-583.
27. Schubert M, Kolbe M, Kessler B, Oesterhelt D, Schmieder P, Heteronuclear multidimensional NMR
spectroscopy of solubilized membrane proteins; Resonance assignment of native bacteriorhodopsin.
Chembiochem, 2002. 3(10): p. 1019-1023.
28. Patzelt, H., et al., The structures of the active center in dark-adapted bacteriorhodopsin by solution-state NMR
spectroscopy. Proc. Natl. Acad. Sei. U. S. A„ 2002. 99(15): p. 9765-9770.
29. MacKcnzie, K. R., J. H. Prestegard, and D. M. Engelman, A transmembrane helix dimer: Structure and
implications. Science, 1997. 276(5309): p. 131-133.
30. Ma C, Opella SJ, Lanthanide ions bind specifically to an added "EF-hand" and orient a membrane protein in
micellesfor solution NMR spectroscopy. J. Magn. Reson., 2000. 146(2): p. 381-384.
31. Kochendoerfer GG, Jones DH, Lee S, Oblatt-Montal M, Opella SJ, Montai M, Functional characterization and
NMR Spectroscopy on full-length Vpu from HIV-1 prepared by total chemical synthesis. J. Am. Chem. Soc,
2004. 126(8): p. 2439-2446.
Membrane protein ß-barrel platform for solution NMR studies 35
32. Sorgen PL, Cahill SM, Krueger-Koplin RD, Krueger-Koplin ST, Schenck CC, Girvin ME, Structure of the
Rhodobacter sphaeroides light-harvesting 1 beta subunit in detergent Micelles. BIOCHEMISTRY, 2002. 41(1):
p, 31-41.
33. Zamoon J, Mascioni A, Thomas DD, Veglia G, NMR solution structure and topological orientation of
monomeric phospholamban in dodecylphosphocholine micelles. Biophys. J., 2003. 85(4): p. 2589-2598.
34. Oxenoid K, Sonnichsen FD, Sanders CR, Topology and secondary structure of the N-terminal domain of
diacylglycerol kinase. Biochemistry, 2002. 41(42): p. 12876-12882.
35. Oxenoid K, Kirn HJ, Jacob J, Sonnichsen FD, Sanders CR, NMR assignments for a helical 40 kDa membrane
protein. J. Am. Chem. Soc, 2004. 126(16): p. 5048-5049.
36. Zubkov S, Lennarz WJ, Mohanty S, Structural basis for the function ofa minimembrane protein subunit ofyeast
oligo.iaccharyltransfera.se. Proc. Natl. Acad. Sei. U. S. A., 2004. 101(11): p. 3821-3826.
37. Sanders, C. R., et al., NMR structural studies of diacylglycerol kinase, a 13 kDa integral membrane protein.
Biophys. J., 1998. 74(2): p. A130-A130.
38. Vinogradova, O., et al., Escherichia coli diacylglycerol kinase: A case study in the application of solution NMR
methods to an integral membrane protein. Biophys. J., 1997. 72(6): p. 2688-2701.
39. Rastogi, V. K. and M. E. Girvin, Structural changes linked to proton translocation by subunit c of the ATP
synthase. Nature, 1999. 402(6759): p. 263-268.
40. Dmitriev OY, Altendorf K, Fillingame RH, Subunit a of the E-coli ATP synthase: reconstitution and high
resolution NMR with protein purified in a mixed polarity solvent. FEBS Lett, 2004. 556((l-3)): p. 35-38.
41. Lamberlh S, Schmid H, Muenchbach M, Vorherr T, Krebs J, Carafoli E, Griesinger C, NMR solution structure
ofphospholamban. Helv. Chim. Acta, 2000. 83(9): p. 2141-2152.
42. Orekhov, V. Y., K. V. Pervushin, and A. S. Arseniev, Backbone Dynamics of (1 -71)Bacterioopsin Studied By 2-
Dimensional H-I-N-1S Nmr-Spectroscopy. Eur. J. Biochem., 1994. 219(3): p. 887-896.
43. Fernandez C, Hilty C, Wider G, Guntert P, Wuthrich K, NMR structure ofthe integral membrane protein OmpX.
J. Mol. Biol., 2004. 336(5): p. 1211-1221.
44. Hilty C, Wider G, Fernandez C, Wuthrich K, Membrane protein-lipid interactions in mixed micelles studied by
NMR spectroscopy with the use ofparamagnetic reagents. Chembiochem, 2004. 5(4): p. 467-473.
45. Tafer H, Hiller S, Hilty C, Fernandez C, Wuthrich K, Nonrandom structure in the urea-unfolded Escherichia
coli outer membrane protein X (OmpX). Biochemistry, 2004. 43(4): p. 860-869.
46. Arora A, Abildgaard F, Bushweller JH, Tamm LK, Structure of outer membrane protein A transmembrane
domain by NMR spectroscopy. Nat. Struct. Biol., 2001. 8(4): p. 334-338.
47. Hwang PM, Choy WY, Lo EI, Chen L, Forman-Kay JD, Raetz CRH, Prive GG, Bishop RE, Kay LE, Solution
structure and dynamics of the outer membrane enzyme PagP by NMR. Proc. Natl. Acad. Sei. U. S. A., 2002.
99(21): p. 13560-13565.
48. Fernandez C, Adeishvili K, Wuthrich K, Transverse relaxation-optimized NMR spectroscopy with the outer
membrane protein OmpX in dihexanoyl phosphatidylcholine micelles. Proc. Natl. Acad. Sei. U. S. A., 2001.
98(5): p. 2358-2363.

Membrane protein ß-barrel platform for solution NMR studies 36
49. Fernandez C, Hilty C, Wider G, Wuthrich K, Lipid-protein interactions in DHPC micelles containing the
integral membrane protein OmpX investigated by NMR spectroscopy. Proc Natl. Acad. Sei. U. S. A., 2002.
99(21): p. 13533-13537.
50. Marley, J., M. Lu, and C. Bracken, A methodfor efficient isotopic labeling of recombinant proteins. J. Biomol.
NMR, 2001. 20(1): p. 71-75.
51. Ren, Q. and L. Thony-Meyer, Physical interaction of CcmC with heme and the heme chaperone CcmE during
cytochrome c maturation. J. Biol. Chem., 2001. 276(35): p. 32591-32596.
52. Goldberg ME, Expert-Bezancon N, Vuillard L, Rabilloud T., Non-detergent sulphobetaines: a new class of
molecules that facilitate in vitro protein renaturation. Folding and Design, 1995. 1(1): p. 21-27.
53. Chen GQ, Gouaux E, Overexpression of a glutamate receptor (GluR.2) ligand binding domain in Escherichia
coli; Application of a novel protein folding screen. Proc. Natl. Acad. Sei. U. S. A., 1997. 94(25): p. 13431-
13436.
54. Vuillard L, Rabilloud T, Goldberg ME, Interactions of non detergent sulfobetaines with early folding
intermediates facilitate in vitro protein renaturation. Eur. J. Biochem., 1998. 256(1): p. 128-135.
55. Armstrong N, De Lencastre A, Gouaux E, A new protein folding screen: Application to the ligand binding
domains of a glutamate and kainate receptor and to lysozyme and carbonic anhydrase. Protein Sei., 1999. 8(7):
p. 1475-1483.
56. Pervushin, K. V., Impact of TROSY as a technique in structural biology. Q. Rev. Biophys., 2000. 33(2): p. 161-
197.
57. Gardner, K. H., M. K. Rosen, and L. E. Kay, Global folds ofhighly deuterated, methyl-protonated proteins by
multidimensional NMR. Biochemistry, 1997. 36(6): p. 1389-1401.
58. Gardner, K. H. and L. E. Kay, The use of H-2, C-13, N-15 multidimensional NMR to study the structure and
dynamics ofproteins. Annu. Rev. Biophys. Biomolec Struct., 1998. 27: p. 357-406.
59. Leiting, B., F. Marsilio, and J. F. O'Connell, Predictable deuteration of recombinant proteins expressed in
Escherichia coli. Anal. Biochem., 1998. 265(2): p. 351-355.
60. Salzmann, M., et al., TROSY in triple-resonance experiments: New perspectivesfor sequential NMR assignment
oflarge proteins. Proc Nail. Acad. Sei. U. S. A., 1998. 95(23): p. 13585-13590.
61. Riek, R., K. Pervushin, and K. Wuthrich, TROSY and CRINEPT: NMR with large molecular and
supramolecular structures in solution. Trends Biochem.Sci., 2000. 25(10): p. 462-468.
62. Riek, R„ et al., Polarization transfer by cross-correlated relaxation in solution NMR with very large molecules.
Proc Natl. Acad. Sei. U. S. A„ 1999. 96(9): p. 4918-4923.
63. Salzmann, M., et al., NMR assignment and secondary structure determination of an octameric 110 kDa protein
using TROSY in triple resonance experiments. J. Am. Chem. Soc, 2000.
64. Kreishman-Deitrick M, Egile C, Hoyt DW, Ford JJ, Li R, Rosen MK, NMR analysis of methyl groups at 100-
500 kDa: Model systems andArp2/3 complex. Biochemistry, 2003. 42(28): p. 8579-8586.
65. Prestegard, J. H., H. M. Al-Hashimi, and J. R. Tolman, NMR structures of biomolecules using field oriented
media and residual dipolar couplings. Q. Rev. Biophys., 2000. 33(4): p. 371-424.

Membrane protein ß-barrel platform for solution NMR studies 37
66. Gaponenko V, Howarth JW, Columbus L, Gasmi-Seabrook G, Yuan J, Hubbell WL, Rosevear PR, Protein
globalfold determination using site-directed spin and isotope labeling. Protein Sei., 2000. 9(2): p. 302-309.
67. Veglia G, Opella SJ, Lanthanide ion binding to adventitious sites aligns membrane proteins in micelles for
solution NMR spectroscopy. J. Am. Chem. Soc, 2000. 122(47): p. 11733-11734.
68. Vögeli B, Kovacs H, Pervushin K, Measurements of side-chain C-13-C-13 residual dipolar couplings in
uniformly deuterated proteins. J. Am. Chem. Soc, 2004. 126(8): p. 2414-2420.
69. Pautsch, A. and G. E. Schulz, Structure of the outer membrane protein A transmembrane domain. Nat. Struct.
Biol., 1998. 5(11): p. 1013-1017.
70. Koebnik, R., Structural andfunctional roles of the surface-exposed loops of the beta-barrel membrane protein
OmpAfrom Escherichia coli. J. Bacteriol., 1999. 181(12): p. 3688-3694.
71. Kleinschmidt, J. B., M. C. Wiener, and L. K. Tamm, Refolding of outer membrane, protein a in neutral or
zwilterionic detergents requires micelles and does not depend on the detailed chemical structure of the detergent.
Biophys. J., 1999. 76(1): p. A106-A106.
72. Arora, A., et al., Refolded outer membrane protein A of Escherichia coli forms ion channels with two
conductance states in planar lipid bilayers. J. Biol. Chem., 2000. 275(3): p. 1594-1600.
73. Box GEP, Hunter WG and Hunter JS, Statisticsfor experimenters. 1978.
74. Guntert, P., et al., Processing of Multidimensional Nmr Data with the New Software Prosa. J. Biomol. NMR,
1992. 2(6): p. 619-629.
75. Bartels, C, et al., The Program Xeasy for Computer-Supported Nmr Spectral-Analysis of Biological
Macromolecules. J. Biomol. NMR, 1995. 6(1): p. 1-10.
76. Wishart, D. S., et al., U-l, C-13 and N-15 Chemical-Shift Referencing in Biomolecular Nmr. J. Biomol. NMR,
1995. 6(2): p. 135-140.
77. Pervushin, K., The use of TROSY for detection and suppression of conformational exchange NMR line
broadening in biological macromolecules. J. Biomol. NMR, 2001.
78. Orekhov, V. Y., et al., Backbone Dynamics of (1-71 jBacterioopsin and (1- 36)Bacterioopsin Studied By 2-
Dimensional H-l-N-15 Nmr- Spectroscopy. J. Biomol. NMR, 1995. 6(2): p. 113-122.
79. Li, Y. C. and G. T. Montelione, Human type-alpha transforming growth factor undergoes slow conformational
exchange between multiple backbone conformations as characterized by nitrogen-15 relaxation measurements.
Biochemistry, 1995. 34(8): p. 2408-23.
80. Wishart, D. S., Sykes, B.D., The C-13 Chemical-Shift Index - A Simple Method For The Identification Of
Protein Secondary Structure Using C-13 Chemical-Shift Data. J. Biomol. NMR, 1994. 4(2): p. 171-180.
81. Schwede T, Kopp J, Gucx N, Peitsch MC, SWISS-MODEL: an automated protein homology-modeling sei-ver.
Nucleic Acids Res., 2003. 31(13): p. 3381-3385.
82. Banci, L., el al., Partial orientation of oxidized and reduced cytochrome b(5) at high magnetic fields: Magnetic
susceptibility anisotropy contributions and consequences for protein solution structure determination. J. Am.
Chem. Soc, 1998.120(49): p. 12903-12909.

Seite Leer /
Blank leaf

Chapter II
NMR studies of structure and function of FkpA
A part of the content was published in: Kaifeng Hu, Andreas Pliickthun and Konstantin
Pervushin,./. Biomol NMR (2004), 28 (4), 405-406.

40
Seite Leer /
Blank leaf

NMR studies ofstructure and function ofFkpA 41
II.l Introduction
FkpA is a 245-residue periplasmic peptidyl-prolyl cis/trans isomerase (PPIase) from E. coli with
a chaperone activity, which is induced by heat shock [1]. Previous studies have indicated that the
chaperone activity of FkpA is independent of its PPIase activity [2] as it is also observed for
proteins devoid of cis-prolines. Overexpression of FkpA suppresses the formation of inclusion
bodies from a defective folding variant of the maltose-binding protein and promotes the
reactivation of the denaturated citrate synthase [3], Coexpression of FkpA can dramatically
improve functional periplasmic production of single-chain fragments (scFv) of antibodies, even
those not containing ds-prolines [4J. The yield of soluble and functional scFv fragment was also
increased in vitro in the presence of stoichiometric amounts of FkpA The chaperone function of
FkpA is hypothesized to be due to its interaction with early folding intermediates preventing their
aggregation, and its ability to reactivate inactive proteins, possibly by binding to partially
unfolded species |2J.
FkpA was originally discovered as a periplasmic Escherichia coli homolog of the MIP-like
FK506-binding proteins [1]. The Macrophage Infectivity Potentiator protein from Legionella
pneumophila (LpMIP) exhibits PPIase activity. The 3D structures of both LpMlP [51 and FkpA
[6J were determined by X-ray crystallography. The crystal structure of FkpA indicates that FkpA
is a dimer comprising of two domains, the N-terminal dimcrization domain and the C-terminal
FK506-binding protein (FKBP) domain (Figure 2.1). FK506 is a natural peptidomacrolide from
Streptomyces tsukubaensis [7] [8] and has been known to inhibit this family of PPIases. The N-
terminal domain of FkpA includes three helices that are interlaced with those of the other subunit
to provide all the inter-subunit contacts maintaining the dimeric species.
In solution FkpA retains apparently as a dimeric organization as it evidenced in analytical gel
filtration |21 [9] and by ultracentrifugation experiments [31,. The overall form of the dimer is V-
shaped, and a comparison of the crystal structures of FkpA and of a mutant and the mutant
complex with FK506 reveals flexibility in the relative orientation of the two C-terminal domains
located at the extremities of the V [6J. Although different reports agreed that the chaperone
activity of FkpA is independent of its PPIase activity, there is still uncertainty regarding to where

NMR studies of structure and function of FkpA 42
(a)
Figure 2.1. (a) and (b) Stereo view of the complex formed between FkpA-ACT (residue 1-224) dimer and
the immunosuppressant FK506 in two orthogonal views. The structure is shown schematically in ribbon
and loop representation. The ß strands, present in the C-lerminal domains arc shown in yellow. Helical
regions are colored green and blue for the respective monomers. The bound FK506 molecules are shown
in red (Adapted from [61).
the chaperone function resides in the dimeric molecule [3, 6, 91. In Ramm's report, experiments
with the isolated domains of FkpA imply that both the isomerase and the haperone site are
mechanistically related and confined to the the highly conserved FKBP domain (C-terminus).
The additional amino-terminal domain appears to be only utilized to mediate the dimerization,
which places the two active sites of the FKBP domains in a juxtaposition, such that they can
simultaneously interact with one protein substrate [9J. However, in Saul's report [6], the deletion
mutant FkpNL (residues 15-114), consisting principally only of the three N-terminal helices and
existing in solution as a mixture of monomelic and dimeric species, as it is established by gel
filtration and ultracentrifugation experiments [31, still exhibited chaperone activity. By contrast, a
deletion mutant comprising the C-terminal domain only is monomcric, as it is indicated by
ultracentrifugation experiments [31, and although it shows PPIase activity, it is devoid of
chaperone function. Therefore, they suggested that the chaperone and catalytic activities reside in
the N and C terminal domains, respectively. Accordingly, they proposed that the observed elative
mobility of the two C-terminal domains of the dimeric molecule could effectively adapt these two
independent folding functions of FkpA to different polypeptide substrates [6].

NMR studies of structure and function ofFkpA 43
As the nature of molecular chaperone activity of FkpA and the characteristic of the polypeptide-
binding site of this dimeric chaperone have remained poorly defined, our NMR investigations are
therefore mainly aimed at a dynamic characterization of FkpA, its interactions with polypeptide
(protein) substrates and at obtaining an explanantion of the molecular mechanism of its
chaperone activity. Due to the availability of the high resolution X-ray structrue of FkpA and the
high conservation of the sequence for the domain containing PPIase activity, our efforts are not
directed towards establishing 3D strucutre of FkpA in solution but rather concentrate on
structural dynamical aspects of its chaperone function.
II.2 Sample preparation
The nearly complete backbone chemical shift assignment was achieved by thee combined use of
triple-resonance spectra of the mature 2H/15N/13C- labeled FkpA protein (245 amino acid residues)
and an engineered variant, the so-called "shortened FkpA" (sFkpA) obtained by the removal of
the first 9 N-terminal and 18-C terminal residues of the mature FkpA, which are dispensable for
its functionality [9], 1SN relaxation, residual dipolar couplings and substrate protein titrations
were measured with the 2H/15N- labeled sFkpA.
The unlabeled protein was prepared as described [2], and MALDI mass spectra were used to
identify the proteins. For the preparation of the uniformly 2H,15N and 13C-labeled FkpA, the E.
coli strain SB536 was freshly transformed with the plasmid pHB610-His6 and the cells were
gradually adapted to D20 solution by growing cells in Luria Broth prepared in 2/1 and then 1/1
H20/D20 mixtures. Cells adapted to D20 were used to innoculate the 2H,15N and 13C-labeled
Celtone medium (Spectra Stable Isotopes) at 37°C. Due to the constitutive expression of the
FkpA encoding gene under control of its own promoter, no induction of expression was
necessary. Cells were harvested after 60 hours of growth, normally at an OD6oo of about 1-1.2.
After lysis with a French press and centrifugation, the soluble supernatant was passed over an
immobilized metal ion affinity chromatography column (IMAC, with Ni-charged Porös MC
(PerSeptive Biosystems) material on a BioCAD workstation) at pH 7.0, followed by S/Ft cation-
exchange chromatography (Poros HS/M column on a BioCAD workstation) at pH 6.0 in 20 mM
Mes buffer. FkpA elutes in one broad and one sharp peak, probably corresponding to the
monomelic and the dimeric species, respectively. After buffer exchange using 20mM Mes buffer

NMR studies ofstructure and function ofFkpA 44
pH6.0 with 50mM NaCI (NMR buffer) and back exchange of amide deuterons with protons from
water, the two samples of the presumed monomer and dimer fraction showed identical NMR
spectra and thus were combined. The final NMR sample concentration was 0.6 mM of FkpA per
monomer in 20 mM Mes buffer at pH 6.0 with 50 mM NaCI.
The "shortened" sFkpA (residues 10-227) gene, also containing the C-terminal His6-tag was
subcloned into the vector pTFT74 under the control of the phage T7 promoter, and the signal
sequence was removed for cytoplasmic expression. Overproduction of sFkpA was carried out in
the E. coli strain BL21(DE3)pLysS at 25°C. After two-step adaptation of cells to D20 as
described above, expression in M9 D20 minimal media supplemented with 1SNH4C1 (99% l5N, 1
g/L) (For 2H/15N- labeled sFkpA ) or I5NH4C1 (99% 15N, 1 g/L) and l3C6-glucose (99% 13C, 4 g/L)
(Cambridge Isotope Laboratories) (For 2H/15N/13C - labeled sFkpA ) was induced by 1 mM
IPTG at OD6oo ~ 0.3 and the cells were harvested after 60 hours at an OD600 of about 1-1.2. The
purification is similar to that of FkpA as described above, except running S/H cation-exchange
chromatography at pH 4.7 in 20 mM Mes buffer.The 2H/13N/l3C-labeled NMR sample of
sFkpA protein was 0.6 mM per monomer in 20 mM Mes buffer at pH 6.0 with 50 mM NaCI, and
the 2H/15N-labeled NMR sample of sFkpA protein was 0.8 mM per monomer in 20 mM Mes
buffer at pH 6.0 with 50 mM NaCI.
II.3 Backbone chemical shift assignment and secondary structure
determination
The assignment of chemical shifts to specific sites in a macromolecule forms the basis for NMR
studies of its structure and function [10|. Among all possible resonances the backbone *H, 15N,
13Ca, 13C and 13CP chemical shift assignments of the 2H, ,5N and 13C labeled FkpA (sFkpA) in a
functional dimeric form in solution are the most informative and constitute a basis for detailed
NMR studies of its dynamic properties, its interactions with polypeptide (protein) substrates and
the molecular mechanism of its chaperone activity.
II.3.1 NMR spectroscopy and backbone chemical shift assignments
All NMR spectra of both constructs, FkpA (residues 1-245) and sFkpA (residues 10-227), were
acquired using transverse relaxation optimized spectroscopy (TROSY) [11] at 25"C and 37"C on

NMR studies of structure and function ofFkpA 45
y -y
'HHi<t>i
15N *i
<h <l>4
-xl-xtac
*Hfr4 I éiUll
13c-a î î* MÎ I
13/
G1 Gj
V^VJ SEDUCE-1
H WALTZ16
PFG| | III 1
G2 G2 G,
Figure 2.2 Pulse sequences of 3D TROSY-HNCA with high resolution along the 15N dimension. The
radio-frequency pulses on 'H, 13Ca, 15N, l3CO, and 2H are applied at 4.7, 54.6, 119, 173.6 and 3.5 ppm,
respectively. Narrow and wide black bars indicate nonselective 90° and 180° pulses. Water suppression is
achieved by watergate. 13CO decoupling is achieved with SEDUCE-1 at a field strength ofyB2 = 1.65 kHz.
Sine bell shapes on the line marked 'H indicate water selective 90° pulses. The line marked PFG indicates
the duration and strength of pulsed magnetic field gradients applied along the z-axis: d: 0.7ms, 25 G/cm;
G2: 0.8ms, 75 G/cm; G3: 0.7ms, 45 G/cm. The delays are 7/= 12 ms, x, = 2.7ms. The phase cycle is: fa=
{y, -y, x, -x}, 4>2= {4x, 4(-x)}, <t>3 = {-y}; fa = {y}; fa = {-y}; *« = {y, -y, -x, x, -y, y, x, -x}. All other
radio-frequency pulses are applied with phase x except indicated. A phase-sensitive spectrum in the N (t{)
dimension is obtained by recording a second FID for each t\ value, with <j)i = {y, -y, -x, x}, fa = {y}, fa =
{-y} and fa = {y}. Quadrature detection in the 13C" (t2) dimension is achieved by the States-TPPI method
applied to the phase <t>2.
a Bruker Avance 600 MHz spectrometer equipped with a TXI cryogenic probehead and Bruker
Avance 800 and 900 MHz spectrometers. The experiments include 2D ['H,15N] TROSY, 3D
TROSY-versions of HNCA (Figure 2.2) ,HNCACB, HNCO and HN(CA)CO run in the high
resolution mode, utilizing both N->C and C->N polarization transfer periods to simutaneously

NMR studies ofstructure and function ofFkpA 46
Figure 2.3 Scheme showing unambiguous residue specific backbone assignment achieved through
alignment of chemical shifts of 1) Cain TROSY-HNCA, 2) Ca/ Cß in TROSY-HNCACB, 3) CO in
TROSY-HNCO / TROSY-HN(CA)CO, and 4) HN in TROSY-NOESY spectra of the uniformly
^''C^N-labeled dimeric sFkpA sample.
frequency label the 15N spins to maximize spectral resolution along the 15N dimension [12, 13],
and 3D 15N resolved TROSY-NOESY (imix = 150 ms) [14]. The NMR data were processed using
the PROSA software [15J and analysed using XEASY [16] and CARA (http://www.nmr.ch/).
The 'H chemical shifts were referenced to the DSS signal and the 13C and 15N chemical shifts
were referenced indirectly using the 13C/lH and 15N/'h gyromagnetic ratios [17].
To assign the resonances unambiguously, we exploited all possible chemical shifts of the
backbone, Ca, Ö, CO and HN as fragment alignment criteria to build up sequential connetivities.
The H, N, C, i3Ca and i3C^ resonances were sequence-specifically assigned by
identification of sequentially connected [W^N] fragments of the TROSY- HNCA, TROSY-
HNCACB, TROSY-HNCO and TROSY-HN(CA)CO spectra supported by the TROSY-NOESY
connectivities (Figure 2.3), followed by global fragment mapping with the program MAPPER
[18]. With this approach ca. 60% of all resonances of the full length FkpA were sequence-
specifically assigned at 25°C. The assigned resonances were mostly located in the FKBP domain
(residue 139-224) and both N- (residues 3-14) and C- (residues 225-245) termini. The resonances
contributed by the N- and C-terminal regions 3-14 and 225-245 exhibited predominantly random
coil chemical shifts and were typically stronger by an order of magnitude than the resonances
stemming from the structured N-terminal and FKBP domains. This prevented further progress in
the assignment of resonances in the mostly a-helical N-terminal dimerization domain due to the

NMR studies of structure and function of FkpA 47
(a) 3D TROSY-HNCA
155 A56 G57 V58 Q59 D60
117 45 124 32
-**4D
106 29 1'2T'52
22Ä
117 19
""*|*fc
120 41 -45.0
50.0
-®
(b) 3D 15N TROSY-NOESY
155 A56 G57 V58 Q59 D60
nC
[ppm]
60.0
65 0
7.66 7.70 7.93 7.37 8.30 9.00
]HN [ppm]
7.64 7.70 7.94 7.37 8.30 9 00
'HN [ppm]
Figure 2. 4 (A) Stnps corresponding to the assignment of the residues 55-60 of sFkpA, in the TROSY-
HNCA experiment recorded at 900MHz, 37oC. Dashed lines indicate the sequential connectivities (B)
Stnps corresponding to the residues 55-60 of sFkpA, in the 15N resolved TROSY-NOESY cxpenment
recorded at 900MHz, 37oC The NOFSY pattern signifies clearly, the a-hehx secondary structure in this
region Diagonal peaks are marked with astensks
proximity of the 'H and i5N chemical shifts in a-helical and disordered structures. The other
problem hampering the assignment was a significant inhomogeneity of the line shapes of
resonances from the a-helical parts of FkpA, probably reflecting conformational exchange
processes in the milliseconds to seconds time scale for this domain.
The removal of the first 9 N-terminal and 18 C-terminal residues in the so-called "shortened
FkpA" (sFkpA), together with an increase of the temperature to 37°C and the use of the ultra high
field NMR spectrometer operating at 900 MHz permitted largerly completed (94%) the backbone
resonance assignment of sFkpA. The a-helical regions were effectively assigned by a
combination of the most sensitive experiments namely the 3D TROSY-HNCA and 3D TROSY-

NMR studies ofstructure and function ofFkpA 48
.« V^fc,«»-
,„ o.o mir *
119.5
M^y »i9i mi ^y^,
<*« #" •*
J. 124.0
8.60 8.20 7.80
'HN [ppm]
10.0 9.0 HN [ppm] 70
Figure 2.5 2D [15N,'HN]-TR0SY spectrum of sFkpA (residues 10-227) measured using the Avance 900
spectrometer at 37"C. The cross-peaks are annotated according to residue numbering of the full length
FkpA. The cross-peaks stemming from the guanidinum group of Arg side-chains are labeled with asterisks.
The cross-peaks marked with open triangles are degradation products which appear with the aging of the
protein samples. An expansion of the spectrum showing resonances of the residues mostly in the a-hclical
regions is displayed in the insert.
NOESY as shown in Figure 2. 4 A and B. The spectra of sFkpA were then aligned and compared
to the corresponding spectra of FkpA showing in most cases no significant perturbations of
chemical shifts. This implies that the removal of the first 9 N-terminal and 18-C terminal residues
and the increase of the temperature does not affect the structure of FkpA. This facilitated the
assignment of the backbone resonances of FkpA (Appendix Table 2). Figure 2.5 shows the 2D
['Hn,15N] TROSY spectrum of sFkpA. The sequence-specifically assigned cross-peaks are
annotated according to the residue numbers in FkpA. The residues for which the assignment was
not unequivocally established, are predominantly located in the a-helical region of the N-
terminal domain (Figure 2.5), mostly due to weak spectral intensities and large line width,
presumably due to the conformational exchange processes on the chemical shift timescale.

NMR studies ofstructure and function ofFkpA 49
11.3.2 Analysis of secondary structure
In Figure 2.6, the polypeptide sequence of FkpA from E. coli is aligned with the sequence of the
MIP from Legionella pneumophila, a PPIase for which the crystal structure was determined
(PDB code 1FD9) [5], Despite the modest sequence identity of 34.6%, the secondary structure
elements closely correspond to each other in the aligned sequences of both proteins. The
secondary structure elements in FkpA are identified by using the chemical shift index (CSI)
based on the experimental 13Ca chemical shifts [19J. A comparison of the secondary structure
perdicted from the 13Ca chemical shifts to those of LpMIP (Macrophage Infectivity Potentiator
PDB code 1FD9) [5] and the recently published X-ray structure of FkpA[6] shows a good
agreement.
These proteins are surface components of intracellularly replicating bacteria and are required for
an efficient injection into the host cell. An analysis of the NMR data indicates that the long a-
helix (Helix 3, residues 70-111) connecting the FKBP and N-terminal dimerization domains
might be dynamically disturbed in the area located between residues 84 and 91, resulting in
significant broadening of the corresponding backbone resonances. These dynamic properties of
the protein might play an important role in the chaperone activity of FkpA, where binding to
different substrates would require some structural adaptations of the chaperone. The backbone
assignment should serve as a platform to investigate details of dynamic properties and chaperone
activities of FkpA.
II.4 15N Relaxation
The structures of FkpA, a C-terminal truncation mutant FkpA-ACT (resiude 1-224) and FkpA-
ACT in complex with FK506 as determined by X-ray crystallography published recently [6]
reveal flexibility in the relative orientation of the two C-terminal domains of FkpA. While the
structure was solved for FkpA, the mechanism of sequence-specific binding in its chaperone
acitivity remains unclear. As dynamic properties of FkpA might play an important role in its
chaperone activity, which allow FkpA to bind to different substrates through structural
adaptations, our first interest is investigating details of the dynamic properties of FkpA in
solution by NMR.

NMR studies ofstructure and function of FkpA 50
Ec. FkpA X-Ray
HI
Ec. sFkpANMRFkpA 10 adskaafknddqksayalgaHgry^nslk||eklgikldkdqliagvqdafadks-klMIP 1 ATDATSLATDKDKLSYSIGADLGKNFKNQ GIDVNPEAMAKGMQDAMSGAQLAL
Lp. MIP X-Ray ^^^^^^H^H
Ec. FkpA X-Ray
Ec. sFkpANMR
H3 ßl ß2
FkpA 69 SDQEIEQTLQAFEAP§KSS0S§MEKDAADNEAKGKEYREKFAKEKGVKTSSTGLVYQVVEMIP 54 TEQQMKDVLNKFQKDLMAKRTAEFNKKADENKVKGEAFLTENKNKPGVVVLPSGLQYKVIN
Lp. MIP X-Ray ^MM^^HM^HMH^BHl^^nMHH ^~ ^^-
ß3 ß4a H4 ß4b H5
Ec. FkpA X-Ray
Ec. sFkpA NMR ,. r
FkpA 130 AGKGEAPKDSDTWVNYKGTLIDGKE&NSYTRGEPLSFRLDGVIPGWTEGLKNIKKMIP 115 SGNGVKPGKSDTVTVEYTGRLIDGTVFDSTEKTGKPATFQVSQVIPGWTEALQLMPA
Lp. MIP X-Ray"
ß6Ec. FkpA X-Ray
Ec. sFkpANMR w w ^»-
FkpA 187 GGKIKLVIPPELAYGKAGVPG-IPP§STLVFDVELLDVKPAPMIP 172 GSTWEIYVPSGLAYGPRSVGGPIGPNETLIFKIHLÏSVKKSS
Lp. MIP X-Ray
Figure 2.6 Comparison of secondary structures of FkpA with LpMIP. Sequence alignment of
FkpA(scquence in upper line) and MIP (sequence in lower line) (Macrophage Infectivity Potentiator, PDB
code 1FD9) using the SIM program (ExPASy, http://www.expasv.ch). The secondary structure elements
of FkpA shown in the top and second row are from the X-ray structure and predicted the from NMR
chemical shift index (CSI) analysis, respectively. Corresponding secondary structure elements of MIP are
shown in the bottom row. Filled boxes represent a-helices and arrows indicate ß sheets. Unassigned
amides of FkpA are enclosed in rectangular boxes.
II.4.1 NMR experiments
The pulse sequences used to record 15N Ti and T2 values are shown in Figure 2.7 a and b,
respectively, and the scheme for measurement of the steady-state 'H-15N NOE is indicated in
Figure 2.7 c. We employed the TROSY version in all three pulses sequences with the use of

NMR studies of structure and function of FkpA 51
pulsed field gradients in order to suppress the intense solvent resonance, and select for the
coherence transfer pathway. 15N Ti and T2 and 'H-15N NOE spectra were recorded at 37°C on a
Bruker Avance 600 MHz spectrometer equipped with a TXI cryogenic probehead, with 32 scans
for Ti and T2 experiments and 64 scans for 'H-15N NOE experiments.
(a)
EH
<h y -y y
1111
15N tiItiItiItJi*"*+HtttJBBU*iist*ft»WTWi*h<ih*JBfc*«»»»»*4w»
PFG ili I
Seduce 1
¥s
Gl &\ G4 Gb^T!-^
§4 fa
XX >"Äl**«*****wt*»
G^ Ga Gg G3
W<h y -y y
«nu
15N Til Ti I Ti|1PFG ±il
Seduce-1
WMWWWdMwniiililiiiHi i iTïrniiiili
fc
«H g, p. I^^^JCs
LUI
B MiWmwsgftWftm i uni iJ|i|im't«dWWW»«M»ih*ii»JWk
i i-i "hJ»^
Gj G2 G3 Gi
(c)
1Sain
Hal
Lock,,
PFG iLG| Gj
Mi
JUislu^nx
I'1 TiFihi|fJ1111111111 iiïiiwhhkim h
i\t(tmhJÊ^utmMt*t*tJftLttttJÊir
nilGj G2 Gj G3

NMR studies ofstructure and function of FkpA 52
Figure 2.7: TROSY version pulse sequences for the measurement of (a) ISN T,, (b) 15N T2, and (c) 'H-15N
NOE. In all experiments, the radio-frequency pulses on 'H, l5N are applied at 4.7 and 119 ppm,
respectively. Narrow and wide black bars indicate nonselective 90° and 180° pulses. Delay ti = 2.7 ms.
Water suppression is achieved by a Watergate method using 1 ms water selective pulses. In (a) 13N Tls (b)
15N T2, the phase cycle is: fa = {8x, 8(-x)}, fa= {4x, 4(-x)}, fa= {y, -y, -x, x}, fa = {-y}; fa = {y};fa =
{-y}; fate = {y, -y, -x, x, -y, y, x, -x, -y, y, x, -x, y, -y, -x, x }. In (c) 'H-^N NOE, the phase cycle is: fa=
{y, -y, -x, x}, fa = {-y}; fa = {y}; fa - {-y}; fa.c = {y, -y, -x, x}. All other radio-frequency pulses are
applied with the phase x except indicated otherwise. A phase-sensitive spectrum in the 15N (t{) dimension
is obtained by recording a second FID for each t\ value, with fa = {y, -y, x, -x}, fa - (y), fa - {-y) and fa
= {y}. The line marked PFG indicates the duration and strength of pulsed magnetic field gradients applied
along the z-axis: d: 0.5ms, 19 G/cm; G2: 0.5ms, 30 G/em; G3: 0.5ms, 65 G/cm, G4: 1ms, 90 G/cm, G5:
lms, 90 G/cm. During Ti and T2, to eliminate the effects of cross-correlation between 'H-15N dipolar
coupling and chemical shift anisotropy relaxation, decoupling on 'H is applied with the SEDUCE-1
profile at the field strength of yB2 = 3.61 kHz with the offset 2583Hz (i.e. 9ppm on resonance). In (c) 'H-
N NOE, N 90" pulse and spin lock in a combination with the strong gradients are used to clean up 15N
magnetization. An overall delay between scans of 5 s was employed in both NOE and NONOE
experiments. 'H saturation is achieved by the application of 120° pulses spaced at 5-ms intervals for 3 s
prior to the 15N pulse with phase fa.
N Ti values were measured from the spectra recorded with ten different durations of the delay T:
Ti = 20, 90, 160, 200, 300, 400, 600, 800, 1000, and 1200 ms. T2 values were determined from
spectra recorded with delays T2 = 2, 8, 12, 24, 30, 35, 40, 50, 70, and 90 ms. In order to eliminate
the effects of cross-correlation between 'H-15N dipolar and 15N CSA relaxation mechanisms, 'H
were decoupled during the T relaxation times.
Relaxation delays of 1 s were employed in the measurement of 15N Ti and T2 values. The 'H-15N
steady-state NOE values are obtained by recording spectra with (NOE experiment) and without
(NONOE experiment) the use of the lU saturation applied before the start of the experiment. In
order to ensure a clean steady-state 'H-15N NOE effect and that magnetization originates on 15N
in both the NOE and NONOE experiments, the sequence begins with a 90° 13N pulse followed by
the application of a field gradient pulse to dephase any magnetization in the transverse plane, and
then magnetization is locked in the transverse plane and dephased again. The level of water

NMR studies of structure and function ofFkpA 53
suppression in the spectra recorded without *H saturation is often significantly worse than that in
the H saturation case and can lead to difficulties in obtaining accurate values for peak intensities.
Moreover, any saturation of protons prior to the start of the NONOE experiment gives rise to a
small truncated NOE effect [20]. Therefore, the suppression of the strong H20 resonance is
achieved via the use of the Watergate. The NOE values were determined from the spectra
recorded in the presence and absence of a proton presaturation period of 3 s. 'H saturation was
achieved with the use of 120° pulses applied every 5 ms. In the case of the NONOE spectra, a net
relaxation delay of 5 s was employed, while a relaxation delay of 2 s prior to a 3-s proton
presaturation period was employed for the NOE spectra.
II.4.2 Data processing and analysis
All spectra were recorded with 60 x 512 complex matrices with spectral widths of 1500 and 9600
Hz employed in F\ and F2, respectively. The NMR data were processed using the PROSA
software [15] and analysed using XEASY [16]. All spectra were processed identically with sine
75° apodization functions applied in both dimensions. NOE and NONOE spectra are scaled by
the same factor. The intensities of the peaks in the 2D spectra were described by peak heights as
determined by the peak-picking package in XEASY[16].
The values of R| and R2 were determined by fitting the measured peak heights to a single-
exponential two-parameter decay function of the form:
7(0 = /0exp(-Äli20 (2.1)
where I(t) is the intensity after a delay of time t and I0 is the intensity at time t = 0. Figure 2.8
illustrates examples of the exponential fit to the measured longitudinal and transverse relaxation
data for sFkpA. The steady-state NOE values were determined from the ratios of the intensities of
the peaks with and without proton saturation.
The values of the relaxation parameters, Ri, R2 and NOE, are shown in Figure 2.9 for sFkpA.
Figure 2.9 displays the variations in the R| and R2 values as a function of the residue number. It
is obvious that the average value of Ri for N-terminus (calculated for residues 10-112, 0.85 S"1) is

NMR studies of structure and function ofFkpA 54
(a) (b)
6.00E+03
0.2 04 0.6 0£
Tims (S)
T2
.26
»27
62
102
1173
£0 40
Time (mS)
Figure 2.8 Examples of (a) ^ and (b) T2 decay curves for Ala 26, Leu 27, Phe 62, Lys 102, and Val 173.
The curves indicate best fits to single-exponential decays.
100 150
Residue
ce
(C)
• *
100 150
Residue
250
Residue
Figure 2.9 Plots of (a) Rb (b) R2, (e) R^R,, and (d) NOE of sFkpA as a function of residue number.
significantly different from that for C- terminus (calculated for residues 113-226, 1.04 S"1). The
R2 values show similar sequential variations to those described for Ri above, with the average
value of R2 for the N-terminal domains, 25.8 S"1 and that for the C- terminal domains, 18.6 S"1.
Another feature that is seen from the overall pattern in R2 values is that they are more dispersive
in the N-terminal domains whereas they are more homogenous in the C-terminal domains. This
may indicate that there is different intramolecular mobility in N-terminal and C-terminal domains,

NMR studies ofstructure and function ofFkpA 55
in fast (ns) and slow (ms) motional regimes reflected in Rj and R2 values. These are even more
clear when R2/Ri ratios are plotted as a function of residue number as in Figure 2.9 c. The steady-
state NOEs determined from the ratio of the peak height in NOE and NONOE spectra are plotted
in Figure 2.9 d. As low NOE values usually indicate a local high mobility, some residues within
the long a-helix (Helix 3, residues 70-111), such as Ala 90, Met 92, Glu 93 and Asp 95, with
very low NOE values (smaller that 0.5) may implicate that there is significantly high flexibility in
this long helix. This could also serve as an explanation for the interuption of our backbone
assignment in the area located between residues 84 and 91. The flexibility of the long a-helix
(Helix 3) might result in significant broadening of the corresponding backbone resonances
hampering the resonance assignment process.
As described in [20], an estimate of the overall correlation time xm may be determined from the
R2/Ri ratio for each residue. All residues with R2/Ri ratios greater than one standard deviation
from the mean were usually discarded in the evaluations of %m. Since the overall correlation time
of a molecule should be approximately proportional to its molecular weight, the molecular weight
of sFkpA can then be calculated on the basis of the estimated overall correlation time Tm using
Ubiquitin as reference upon adjustment of the difference in the temperature of measurement [21].
Table 2.1 shows approximate molecular weights of sFkpA calculated from experimental data of
N-terminal residues, C-terminal residues, and all residues, respectively.
Table 2.1 Estimates of the overall correlation time xm and approximate MW of sFkpA
(Theoretical molecular weight for sFkpA dimer is: 24.4 x 2 Kda)
Average
R2/R1
Stdev Estimated
tm (ns)
Estimated
MW (Kda)
N-term(Res. 10-112) 36.21 26.85 28.3 61.1
C-term(Res. 113-226) 18.39 7.96 17.4 37.5
Overall 26.86 21.29 18.8 40.5
The overestimation of MW of sFkpA calculated from experimental data of N-terminal residues
could be caused by the significant contribution of the conformational exchange to R2. A slight
underestimation of MW of sFkpA calculated from experimental data of all residues can be
explained by the significant intramolecular mobility of the FKBP domain relative to the

NMR studies ofstructure and function ofFkpA 56
dimerization domain. The most likely explanation for a further lower estimation of MW of
sFkpA calculated from the experimental data of the C-terminal residues is that there is a relative
intramolecular mobility between the two C-terminal domains, and that they behave somewhat
like independent single globular monomeric proteins within the dimeric molecular frame. The
dispersive R2 values in the N-terminal domains may indicate that the N-terminal domain is rather
flexible in the very broad time scale.
II.5 Residual dipolar coupling and the dynamic molecular model
The introduction of residual dipolar coupling methodology has broadened the scope of structural
biological problems which can be addressed by NMR spectroscopy[22]. Residual dipolar
couplings (RDCs) represent an extremely valuable source of long-range angle information for
solution structure determinations of macromolecules by NMR spectroscopy which cannot be
obtained otherwise [23], In addition, RDCs can also be employed to determine the relative
orientation of domains and study protein dynamics [24, 25], conformational changes, and
structure of protein-protein complexes [26] [27]. The development of the residual dipolar
coupling methodology for rapid recognition of homologous protein folds and for studies of
submillisecond timescale dynamics has also seen considerable progress [28],
II.5.1 Residual dipolar coupling measurement
As dipolar couplings generally average out in an isotropic solution, an anisotropic environment is
necessary for observation of these dipolar couplings. Although high degrees of ordering can
generate strong observable dipolar interactions, their complexity makes these spectra difficult to
interpret. Thus, to make use of the residual dipolar couplings, the tumbling of the molecule must
be perturbed such that it becomes very slightly anisotropic, with the dipolar couplings (so-called
residual dipolar coupling) almost, but not completely, averaged to zero.
Methods have been proposed for generating partial and tunable degrees of alignment of
macromolecules, including dissolving macromolecules in an anisotropic solution of magnetically
aligned liquid crystalline bicelles [231 or lyotropic planar liquid crystalline bilayers [29], by

NMR studies ofstructure and function ofFkpA 57
addition of magnetically aligned Pf 1 filamentous bacteriophages as a cosolute [30] or in presence
of the purple membrane of the membrane protein bacteriorhodopsin [31].
Here, we measured residual dipolar couplings (RDCs) for the 'H-15N amide groups on 0.8 mM
7 1 *î
H, N-labeled sFkpA sample either by an addition of magnetically aligned Pfl filamentous
bacteriophages or in a dilute liquid crystalline phase composed of Ci2E5 / hexanol/H20[29] and
characterized the dynamic properties of FkpA by fitting the alignment tensors [31].
II.5.1.1 Measurements of RDCs by addition of Pfl filamentous bacteriophages
The bacteriophage Pfl consists of a 7,349-nucleotide single-stranded circular DNA genome that
is packaged at a -1:1 nucleotide:coat protein ratio into a -60 Â diameter by -20,000 Â long
particle that has a negatively charged surface (pi -4.0). The coat protein forms an a-helical
structure that runs roughly parallel to the long axis of the phage. The coat proteins form a
repeating network of carbonyl groups that are believed to be the source of the phage's large
anisotropic magnetic susceptibility, with the long axis of the phage aligning parallel to the
magnetic field. It was demonstrated that the phage are already fully aligned at B0 = 7.5 Tesla [30],
The solution of oriented phage particles forms a liquid crystalline medium that can impart
alignment of biomolecular cosolutes. For some RNA, DNA and protein systems, the Pfl phage
appears to align the macromolecule by a steric mechanism with no evidence of any binding of the
macromolecules to the phage. In this case, the macromolecule does not bind to the phage but
instead alignment is induced by collisions. Alignment has also been reported through binding
interaction with phages, however, there are no significant structural changes in the
macromolecule in the presence of phages. The proteins are in fast exchange between the free and
phage-bound forms. The phages do not affect the microscopic rotational correlation times of
individual macromolecules dissolved in the phage solution in spite of the fact that they lead to a
high macroscopic viscosity [30].
The magnetic alignment of the Pfl phages was monitored by observation of the 2H quadrupolar
splitting in a ID H NMR spectrum of the water as a function of the phage concentration (Figure
2.10 B). The splitting of the HOD signal arises from the large deuterium quadrupolar moment

NMR studies of structure and function ofFkpA 58
Figure 2.10 (A) TROSY (red) and H-anti-TROSY (black) spectra (recorded at 37"C at 900 MHz) of 0.8
mM 2H, 15N-labeled sFkpA aligned with the Pfl filamentous bacteriohages by monitoring (B) 2H
quadrupolar splitting in ID 2H NMR spectrum of the solvent. (C) An expanded portion shows the effect of
phage on the splitting between the TROSY (red) and H-anti-TROSY(black) components. (D) ID slice cut
from (C) at the dotted line shows fitting of Lorentzian lineshapes on the top of the peaks to obtain more
precise measurements of the splitting between the TROSY (red) and H-anti-TROSY (black) components.
that is not isotropically averaged for water bound to the aligned phage particles. The observed
quadrupolar splitting varies approximately linearly with the phage concentration (up to 60 mg/ml
of phage). The TROSY and H-anti-TROSY spectra (Figure 2.10 A) were recorded using the 0.8
mM 2H, ^N-labeled sFkpA in 20 mM Mes buffer at pH 6.0 with 50 mM NaCI at 37°C using a
Bruker Avance 900 MHz spectrometer, equipped with a cryogenic Z-gradient TXI probe. The
sample with the lightly aligned protein was obtained by titration of the Pfl phage from a 50
mg/mL stock solution until the observed quadrupolar deuterium splitting of the solvent signal
was about 4.4 Hz. RDCs were obtained by calculating the changes (which could be either

NMR studies ofstructure and function ofFkpA 59
positive or negative) of the frequency difference (splitting) between the TROSY and H-anti-
TROSY components upon the addition of the Pfl phages.
As sFkpA is in homodimeric form, in an isotropic solution (before addition of the Pfl phages),
each single peak, both TROSY and H-anti-TROSY, can be assumed as an equally weighted
superposition of chemical shifts from both subunits. When the protein is weakly aligned in an
anisotropic solution (after the addition of Pfl phage), it could concomitantly induce a slightly
non-equivalent chemical environment between these two subunits. However, this small
difference in chemical shift is usually averaged by the fast tumbling of the macromolecule. In
most cases, an almost complete overlap of the chemical shifts from the two subunits appears as a
single broadened peak [32, 33]. In our experiments, we measured the chemical shifts with high
precision at the center of the broadened peaks by fitting of Lorentzian lineshapes to the sum of
the overlapped peaks, even for weak peaks with very low signal-to-noise ratio as shown in
(Figure 2.10 D). For a homodimeric protein, such as sFkpA, it is reasonable to assume that two
subunits are equally weighted in the overlapped peak and thus the center of the apparent single
broaden peak occurs exactly at the average of the chemical shifts of the two subunits, which is
given by equation 2.2:
J + D,-(J + D')+2(y + D')(2-2)
Dl +Drand Deiip=__ (2.3)
Measured RDCs on sFkpA aligned with the Pfl filamentous bacteriophages are shown in Table
2.2. Figure 2.11 shows the statistic distribution of the measured RDCs.
Figure 2.11 Histogram of RDCs measured with sFkpA aligned with the Pfl filamentous bacteriophage

NMR studies of structure and function ofFkpA 60
Table 2.2 Measured RDCs on sFkpA aligned with Pfl filamentous bacteriophages at 37°C
Residue Pfl_RDC Residue Pfl RDC Residue Pfl RDC
18 -9.9 107 -6.3 169 -2.7
20 -1.8 109 0.9 170 26.1
21 0.0 110 0.0 172 -15.3
22 -12.6 111 1.8 173 22.5
24 0.9 112 26.1 174 2.7
25 -9.0 116 0.9 176 20.7
26 -14.4 117 -11.7 180 17.1
27 -9.9 118 0.0 182 7.2
28 -0.9 119 15.3 183 27.0
29 -11.7 121 -0.9 184 -25.2
34 0.9 123 27.0 185 -10.8
43 2.7 124 8.1 186 19.8
44 -10.8 125 0.9 187 -5.4
45 -7.2 126 -5.4 188 2.7
46 -11.7 127 -8.1 189 -0.9
47 6.3 137 -10.8 190 -12.6
50 -16.2 138 -3.6 191 -2.7
53 2.7 139 24.3 192 0.9
54 -23.4 141 34.2 193 10.8
56 -20.7 142 1.8 197 -17.1
58 -18.0 144 -6.3 198 9.9
67 -12.6 145 -4.5 199 0.0
68 -15.3 146 4.5 201 -4.5
69 -15.3 147 2.7 202 15.3
70 -16.2 148 -1.8 204 20.7
71 -8.1 149 20.7 205 -5.4
74 1.8 150 10.8 207 19.8
75 -4.5 151 -22.5 208 -19.8
81 -19.8 152 -15.3 212 -14.4
82 -12.6 153 13.5 213 27.0
95 -18.0 154 -10.8 214 26.1
96 -1.8 155 12.6 215 24.3
98 -9.0 157 -18.9 216 1.8
100 -2.7 158 -17.1 218 -10.8
101 5.4 159 -8.1 219 -7.2
102 -7.2 160 -7.2 220 -17.1
103 -15.3 161 -12.6 221 3.6
104 2.7 166 -20.7 222 8.1
105 4.5 168 0.9 224 17.1
Data are divided into N-terminus (in bold, residues 18 - 112) and C-terminus (FKBP domains, residues
116 - 224). RDCs from flexible parts are already excluded.

NMR studies ofstructure and function ofFkpA 61
II.5.1.2 Measurements of RDCs in La phase
ra-Alkyl-poly(ethylene glycol)/n-alkyl alcohol and glucopone/rc-hexanol mixtures are shown to
form dilute liquid crystalline phases in an aqueous solution and were introduced as a suitable
medium for partial alignment of biological macromolecules in a magnetic field [29]. The
poly(ethylene glycol)-based systems are uncharged and thus insensitive with respect to pH
variation, only slightly sensitive to salt, and tolerant to high protein concentrations. Different
alkyl-poly(ethylene glycol) molecules are denoted CmEn, where m is the number of carbons in
the rc-alkyl group and n is the number of glycol units in the poly(ethylene glycol) moiety. Under
certain conditions, the mixture of w-Alkyl-poly(ethylene glycol)/«-alkyl alcohol systems form a
lyotropic liquid crystalline phase referred to as La, where the hydrophobic n-alkyl chains
aggregate into planar bilayers with the hydrophilic poly(ethyleneglycol) headgroups directed into
the water phase. The La phase is optically clear with slight opalescence, forming a lamellar-like
superstructure where the spacing of the stacked bilayers and thus the degree of alignment of guest
molecules in the water-rich layers can be tuned by the surfactant/water ratio. In a magnet, the
bilayer surfaces are oriented parallel to the direction of the magnetic field, presumably with a
superstructure in which the bilayers bend into a set of concentric tubes of different radii with the
axis aligned along the magnetic field. The La phase is relatively viscous, immobilizing any small
air bubbles present in solution. However, they can be readily removed by centrifugation.
In our experiment, a C12E5/n-hexanol/ H20 system was chosen to form the La phase for partial
alignment of sFkpA in a magnetic field. To obtain a sample with the aligned protein, 15%(w/v)
concentrated liquid crystal composing of C|2E5/n-hexanol in 90% H2O/10%D2O was first
prepared under vigorous shaking and then the protein sample was carefully added in during
further vigorous shaking to form a suitable final concentration (around 4%) of the liquid crystal.
In the case that addition of the protein leads to a phase separation, more n-hexanol should be
added to the mixture to re-establish the liquid crystal. Just as with the measurement of RDCs on
sFkpA aligned with Pfl phage, TROSY and H-anti-TROSY spectra (Figrue 2.12 A) were
recorded on 0.8 mM 2H, 15N-labeled sFkpA in 20 mM Mes buffer at pH 6.0 with 50 mM NaCI at
25°C at 900 MHz in the presence and absence of the liquid crystal of Ci2E5/n-hexano1/ H20.
Deuterium quadrupolar splitting of the solvent signal in ID 2H NMR spectrum, finally adjusted

NMR studies ofstructure and function ofFkpA 62
to 18.6 Hz (Figrue 2.12 B), was observed to tune the degree of alignment of sFkpA. RDCs were
calculated in the same way as above.
A) B)
1 18.5
15.0 0 '5-0 2II[Hz]
1 19.5
[ppmj
120.5
7.3 7.2 7.1
'HNfppml
7.07.3 7.2 7.1
'HN[ppmJ
7.0
Figure 2.12 (A) An expanded portion of the TROSY (red) and H-anti-TROSY(black) spectra (recorded
at 25°C at 900 MHz) of 0.8 mM 2H, 15N-labeled sFkpA and (B) corresponding 2H quadrupolar splitting
observed in the ID 2H NMR spectrum of the solvent in liquid crystalline phase composed of C12E5 /
hexanol/H20. (C) 1D slices cut from (A) at the dotted line show that fitting of Lorentzian lineshapes on
the top of the peaks gives reliable measurements of the splitting between the TROSY (red) and H-anti-
TROSY (black) components even for the peaks with very low signal-to-noise ratios.
25
20
i153
I 10
40 -35 -25 5 15 25 35
Figure 2.13 Histogram of RDCs measured in C!2ES / hexanol/H20 liquid crystalline phase
Measured RDCs on sFkpA aligned in C|2ES / hexanol/H20 liquid crystalline phase are shown in
Table 2.3. Figure 2.13 shows the statistic distribution of the measured RDCs.

NMR studies ofstructure and function ofFkpA 63
Table 2.3 Measured RDCs on sFkpA aligned in C!2ES / hexanol/H20 liquid crystalline at 25 °C
Residue OP RDC Residue OP RDC Residue OP_RDC
15 2.7 118 -15.3 167 -11.7
16 16.2 119 -6.3 169 -36.0
17 30.6 120 0.9 170 -17.1
18 5.4 122 -21.6 171 -6.3
20 -5.4 123 9.0 172 6.3
25 34.2 124 -18.0 173 -13.5
28 -20.7 125 1.8 174 27.9
29 1.8 126 -16.2 176 -25.2
38 -6.3 127 1.8 179 -23.4
45 -16.2 130 -27.9 184 -24.3
48 38.7 131 -0.9 185 -7.2
59 0.0 133 -18.0 187 -36.0
66 -13.5 134 11.7 188 3.6
67 -2.7 137 21.6 189 -23.4
69 18.9 138 18.9 190 -18.9
70 -37.8 139 -8.1 191 -13.5
75 -26.1 142 -18.9 192 8.1
80 0.0 143 -24.3 197 -13.5
86 27.9 144 -37.8 198 -0.9
87 6.3 146 -9.9 199 20.7
94 3.6 147 -8.1 202 11.7
103 -21.6 148 -1.8 204 -1.8
104 -25.2 149 -9.0 205 -7.2
105 -30.6 151 17.1 207 -9.9
106 -2.7 152 -27.0 208 -22.5
107 -23.4 153 15.3 213 -2.7
108 -18.9 154 27.0 214 8.1
109 -28.8 155 26.1 215 -8.1
110 0.0 157 -25.2 216 6.3
111 -13.5 158 -25.2 218 -8.1
112 -21.6 159 3.6 219 -28.8
114 7.2 160 3.6 220 -36.0
115 11.7 162 19.8 221 -24.3
116 -18.0 163 -0.9 222 -7.2
117 5.4 164 5.4 224 -13.5
Data in normal (non-bold), which arc from the flexible part of the protein, are excluded in calculating the
final tensor alignment. The data are divided into N-terminus (dimerization part) and C-terminus (FKBP
domains) subsets. Here, the N-terminal domain is defined as residues 18 - 112, which are shown in italics.
The C-terminal domain includes residues 116 - 224.

NMR studies ofstructure and function ofFkpA 64
II.5.2 Fitting of the alignment tensor to the residual dipolar couplings
The method used to fit RDCs to alignment tensors is given in Appendix 3. Although it has been
reported that the effect of nonuniform S2 values, even those of few residues that exhibit large
amplitude motions (S2 ranging from 0.3 to 0.8) on the calculated alignment tensor is minimal [34]
[35], care is taken in the analysis of the RDC data and only residues with low internal mobility
(as judged from the secondary structure of FkpA and using the data from the residues with
steady-state !H- 15N NOE larger than 0.6) were considered.
As shown in equation 2.3, for a homodimeric molecule, such as sFkpA, measured RDCs are in
fact an averaged value of RDCs from two different subunits / and r. With this in mind, three
types of molecular models with different dynamic properties are considered for fitting of
alignment tensors to the measured RDCs:
1) With the assumption that the whole dimeric molecule is rigid, so that the whole molecule
should be aligned with a single unique tensor. The alignment tensor can be calculated
using equation 5 in Appendix 3 with an average matrix X containing the structural
information from both subunits / and r, as shown in equation 15 in Appendix 3. The
calculated results for fitting the alignment tensor are shown in the tables 2.4 and 2.5 with
the notation of "Dimer" in the column of "Molecule Model".
2) In the second extreme situation, two monomers are assumed to be able to move
completely independently relative to each other. When the dimeric molecule is aligned,
RDCs from two subunits, Dl!theo and DTIJheo are then similar to RDCs from the same two
unassociated monomers, i.e. D\theo is equal to D\fhf„ We can then easily derive:
Di,theo - DUheo - T>ifhro (2.4)
In this case, alignment tensors can be calculated by fitting to the experimental data using
as equation 5 or 13 in Appendix 3 where the coordinate matrices Y and X contain the
structural information from only a single subunit, monomer / or monomer r. The
calculated results of alignment tensor fitting are shown in the tables 2.4 and 2.5 with the
notation of "Mon /" or "Mon r" in the column of "Molecule Model".

NMR studies ofstructure and function ofFkpA 65
Talbe 2.4 Results of alignment tensor fitting to RDCs measured on sFkpA aligned with the Pfl
filamentous bacteriophage at 37°C
#
Data Data
Size
Molecule
Model
Alignment Tensors Correlation
CoefficientAxx Ayy Azz
1 Exjoop 117 Dimer -10.53 -14.97 25.50 0.747
2 Ex_loop 117 Mon / -12.73 -19.74 32.47 0.872
3 Exjoop 117 Dimer
2 Tensors
11.89 55.02 -66.91 0.909
-0.57 -43.07 43.64
5 Ex_loop_Nterm 44 Dimer -11.69 -39.20 50.88 0.684
6 Ex_loop_Nterm 44 Mon / -10.03 -15.36 25.39 0.714
7 Ex_loop_Nterm 44 Mon r -5.12 -16.27 21.39 0.606
8 Ex_loop_Nterm 44 Dimer
2 Tensors
23.97 75.70 -99.67 0.816
-29.24 -44.46 73.69
9 Ex_loop_Cterm 73 Dimer -8.04 -89.12 97.16 0.766
10 Ex_loop_Cterm 73 Mon/ -15.32 -21.93 37.24 0.949
11 Ex_loop_Cterm 73 Mon r -15.20 -21.20 36.41 0.950
12 Ex_loop_Cterm 73 Dimer
2 Tensors
-5.45 -45.73 51.18 0.954
-7.65 -43.12 50.77
Ex_loop indicates that fits were performed with RDCs from the flexible part of the protein excluded.
Nterm indicates that data are from the N-terminal domain (residues 18 - 112) were used whereas Ctcrm
indicates that data from the C-terminal residues 116 - 224 were used. AM, Ayy, and A^ are the main axis
components of the Cartesian alignment tensor in the principle axis system (PAS), where |AXX| < \A.yy\ <
\A7l | and Axx+ Ayy + A„ =0.
3) In the intermediate situation between 1) and 2), there is some intramolecular motion
between subunits / and r, with none-the-less some correlation due to the connection
between the monomers. In this situation, subunits / and r are assumed to be independent
in the alignment medium, and Dliäheo and Drutheo should be calculated from two different
alignment tensors, that is: Dilhm = (D[lheo + D\thfg)l2, and

NMR studies of structure and function ofFkpA 66
A) Dimer / one unique tensor B) Monomer /
-30 -20 -10
y=1.1474x-4.2329
R2 = 0 5872
0 10 20 30 40
RDCexp
C) Monomer r
40
30
20
8r 10
r>Q 0DC
-10
-20
-30
y = 0.9024x-1.8318
R2 = 0.902
30 -20 -10 0 10 20 30 40
RDCexp
40
30
20
10
0
-10
-20
-30
y = 08985x-19869
^ ^ R2 = 0 8998
-30 -20 -10 0 10 20 30 40
RDCexp
D) Dimer / two tensors
y = 1 2511X + 0 74S8
y = 0 9118k- 1.6867
Rf = 0.91
40 -30»
Figure 2.14 Correlation between measured dipolar couplings (RDCexp) for the C-terminal domain
(residues 116 - 224) of sFkpA in the presence of the Pfl filamentous bacteriophages and calculated
dipolar couplings (RDCtheo ) based on different alignment tensor fitting models, (A) fitting experimental
data to a single tensor using rigid dimeric molecular model (No. 9 in table 2.4), (B) and (C) fitting
experimental data using monomer / or monomer rasa molecular model (No. 10 and 11 in table 2.4) (D)
fitting experimental data to two independent tensors using a dimeric molecular model (No. 12 in table 2.4).
RDC1 and RDC2 are back-calculated dipolar couplings using tensors T' and Y for subunit / and subunit r,
respectively.
D',*o - Kh<o <7" ) ,and /),;„„„ ~ D[Mu (T ) (2.5)
Equation 2.5 states that Dlitheo and D\Mo depend on two different alignment tensors T'
and T'. Alignment tensors were fit to the experimental data using equation 16 in
Appendix 3. The results are shown in the tables 2.4 and 2.5 with the notation of "Dimer 2
Tensors" in the column of "Molecule Model".

NMR studies of structure and function ofFkpA 67
To further investigate the detailed dynamic properties of the N- and C- terminal domains of the
dimeric sFkpA. The experimental data of RDCs are divided into a subset from the N-terminal
residues 18-112 and a subset from the C-terminal residues 116 - 224. Fitting of these data using
different molecular models and corresponding alignment tensors are shown in Table 2.4 and 2.5.
II.5.3 Analysis of fitting results and dynamic molecular model
Fitting of RDCs measured at 37°C on sFkpA aligned with Pfl filamentous bacteriophage (Table
2.4) and RDCs measured at 25°C on sFkpA in the presence of C|2E5 / hexanol/H20 liquid
crystalline phase (Table 2.5) gave very good agreement. The results are shown in Table 2.4 and
2.5 and are plotted in Figure 2.14 in 2.15, respectively.
In Table 2.5, a comparison of fitting No. 3 and 4 using the data, in which RDCs from the flexible
part of the protein are excluded, to fitting No.l and 2 using all measured RDCs (Table 2.3) shows
an improvement in the correlation coefficients, which it is probably due to the removal of the
effect of nonuniform S2 values on the fitting. Thus, in the later stages of fitting of the alignment
tensors, only residues with low internal mobility were considered [31].
However, the low correlation coefficients for fittings No. 3 and No. 4 in Table 2.5, which are
0.756 and 0.843, respectively, suggested that there is intramolecular mobility within the dimeric
molecular frame and that there may even be flexibility in each monomeric subunit, as well. No. 1,
2 and No. 3 in Table 2.4 show the same results. Experimental RDCs are then divided into subsets
from the N-terminal and from the C-tcrminal residues for alignment tensor fitting to illustrate the
detailed dynamic properties of N- and C- terminal domains of the dimeric sFkpA.
In No. 9, 10, 11 and No. 12 in Table 2.4 and 2.5, fitting of the measured RDCs from the C-
terminal residues are carried out using different molecular models as described above. A
significant improvement in the correlation coefficients from No. 9 to No. 10 and/or No. 11 is
observed, where the correlation coefficient improves from 0.766 (0.857 in Table 2.5), obtained

NMR studies ofstructure and function ofFkpA 68
Table 2.5 Alignment tensor fitting results from RDCs of sFkpA measured in Q2E5 / hexanol/H20
liquid crystalline phase
#
Data Data
Size
Molecule
Model
Alignment Tensors Correlation
CoefficientAxx Ayy A„
1 All 105 Dimer 0.59 13.32 -13.91 0.727
2 All 105 Mono / -5.42 -25.51 30.94 0.778
3 Exjoop 88 Dimer 2.73 11.59 -14.33 0.756
4 Exjoop 88 Mono / -5.14 -26.82 31.96 0.843
5 Ex_loop_Nterm 23 Dimer 6.04 43.93 -49.97 0.708
6 Ex_loop__Nterm 23 Mono / 7.77 16.71 -24.48 0.707
7 Ex_loop_Nterm 23 Mono r 7.96 14.90 -22.85 0.643
8 Ex_loop_Nterm 23 Dimer
2 Tensors
-6.55 -48.50 55.05 0.757
13.51 45.54 -59.04
9 Ex„loop_Cterm 65 Dimer -10.24 -26.87 37.11 0.857
10 Ex_loop_Cterm 65 Mono / -5.63 -31.58 37.21 0.952
11 Ex_loop_Cterm 65 Mono r -5.10 -30.66 35.75 0.947
12 Ex_loop_Cterm 65 Dimer
2 Tensors
3.21 45.91 -49.13 0.954
-14.20 -19.61 33.81
Exjoop is data (Table 2.3) in which RDCs from the flexible part of the protein are excluded. Nterm
indicates data from the N-terminal domain (residues 18 - 112) and Cterm stands for data from the C-
terminal residues 116 - 224. Axx, Ayy, and Azz are the main axis components of Cartesian alignment tensor
in the principle axis system (PAS), where |AXX| < [Ayy| < |AZZ | and Axx+ Ayy + Azz =0.
using a unique tensor for the dimeric molecule, to 0.949 (for monomer I) / 0.950 (for monomer r)
(0.952 /0.947 in Table 2.5), calculated using a single tensor with monomeric molecular model,
monomer / or monomer r, indicated that there is relative motion between the two C-terminal
domains within the molecular frame of the dimer. However, the high correlation coefficients
resulting from fitting using a single tensor with a monomeric molecular model indicates that
these two C-tcrminal domains are quite rigid within each subunit, thus fitting No. 10 and No. 11
in both table 2,4 and 2.5 gave a satisfactorily high correlation coefficient as rigid bodies. Fitting

NMR studies ofstructure and function of FkpA 69
A) Dimer / one unique tensor B) Monomer /
y = 0 7514x -1 205
Ff = 0 7349
-20 0
RDCsxp
C) Monomer r
20
: o
i
-20
-40
y = 09142x + 00696
# = 0.8964
40 -20 0
RDCexp
20 40
ys09177x-0 1621
tf = 0 9058
O
RDCaxp
D) Dimer / two tensors
-50 -40 -30
y=1 3113X + 228
y-0 9244x 0 0443
(^ = 09109
y=0 5376x 2 3686
* Avgrago of RDC1 and RDC2
• RDC1
BUC2
Figure 2.15 Correlation between measured dipolar couplings, RDCexp for the C-terminus (residues 116-
224) of sFkpA in liquid crystalline phase composed of Ci2E5 / hexanol/H20 and calculated dipolar
couplings (RDQheo ) based on different alignment tensor fitting models, (A) fitting experimental data to a
single tensor using rigid dimeric molecular model (No. 9 in table 2.5), (B) and (C) fitting experimental
data using monomer / or monomer r as a molecular model (No. 10 and 11 in table 2.5) (D) fitting
experimental data to two independent tensors using a dimeric molecular model (No. 12 in table 2.5).
RDC1 and RDC2 are back-calculated dipolar couplings using tensors T' and Tr for subunit / and subunit r,
respectively.
No. 12 using simultaneously two independent alignment tensors with a dimeric molecular model
gave a correlation coefficient of 0.954. This suggested that the two C-terminal domains moved
independently within the dimeric molecular frame rather than being rigidly fixed at the end of the
long helix (helix 3). One thing to be noted is that the different results calculated using monomer /
and monomer r as molecular model are probably due to differences in the structures of the / and r

NMR studies of structure and function ofFkpA 70
monomers in the homodimeric molecular model. In our RDC fitting, we use, as a structural
model, the published X-ray crystal structural coordinates (PDB code: 1Q6H), which can be
considered as a "snapshot" of a dynamically tumbling molecule. At a certain time point when the
"snapshot" is taken, the homodimcr most probably exhibits a somewhat asymmetric relative
orientation. This may explain why the two tensors of No. 12 in Table 2.4 and 2.5 are not exactly
same. Correspondingly, the theoretical RDCs predicted on the basis of these two distorted tensors
T' and T' are also a little bit different from each other. The fitting results are plotted in Figure
2.14 and Figure 2.15.
The relative motion between the two C-terminal domains could be caused by somewhat higher
flexibility of the long helix (helix 3), presumably between residues 84 and 91. This result agrees
with the previous data obtained during backbone assignment and relaxation studies of sFkpA.
Similarly, in No. 5, 6, 7 and No. 8 in Table 2.4 (and 2.5), fitting of measured RDCs from N-
terminal residues are carried out using different molecular models. Low correlation coefficients
of fittings No. 5 and No. 6 / No. 7 in Table 2.4 (and 2.5), which are 0.684 (0.708) and 0.714
/0.606( 0.707/0.643), respectively, suggested that there is intramolecular mobility within the two
N-terminal domains of the dimeric molecule, which could be intra-subunit or inter-subunit
motion. However they are 1) neither relatively fixed in orientation and rigid within each subunit,
as fittings No. 5 gave low correlation coefficient, which means that the molecular model 1 ) is not
satisfied, i.e. there is relative motion between the two N-terminal domains of the dimeric
molecule or the individual monomers are not rigid. 2) nor highly free and independent to each
other and rigid within each subunit, as fittings No. 6 and 7 gave also low correlation coefficients,
which means that the molecular model 2) above and equation 2.4 are not satisfied. 3) Thus,
fitting is carried out using molecular model 3) and equation 2.5 described above. However fitting
No. 7 in Table 2.4 and 2.5 still gave rather low correlation coefficients of 0.816 and 0.757. These
results can only be explained by the existence of backbone flexibility within each monomeric
subunit for the N-terminal domains, rather than due to relative motion between these two
subunits. That is, the backbone of N-terminal residues is highly flexible. This could also imply
that the dimerization is generally due to the interaction between sidechains of the interlaced N-
terminal domains of the two subunits rather than two monomers are hold together through
backbone interactions, such as H-bonds between the backbone groups.

NMR studies ofstructure and function of FkpA 71
Conclusion: The dynamic model for this dimeric molecule can be described as follows:
1. The backbone of the N-terminal domain is highly flexible and the dimerization is
suspected mainly due to an interaction between sidechains of the interlaced N-terminal
domains (mainly helices 1 and 2) of the two subunits rather than through backbone
interactions between two subunits.
2. There is high relative mobility between the two C-terminal domains (i.e. the FKBP
domains) due to the existence of flexibility in the long a-helix (helix 3), presumably
between residues 84 and 91. However the skeleton of each FKBP domain (excluding the
disordered loops) is quite rigid.
II.6 Chaperone function of FkpA
Our NMR studies on the dimeric sFkpA in solution showed that the long a-helix (helix 3) is
flexible, presumably between residues 84 and 91. It has been reported that the X-ray structures of
LpMIP the bending of the long a-helix around residue 81 changes before and after the protein
binds FK506[5J. The published X-ray structure of the dimeric FkpA-ACT, which can be looked
upon as a snapshot of the dynamically tumbling dimeric FkpA in solution, also showed a visible
bending in the long a-helix around residue 91 (Figure 2.20 B, "elbow") [6]. Considerable
plasticity of the long a-helix might be a key to the chaperone activity of FkpA, which allows it to
bind a wide range of targets.
However, the location of the chaperone-funtion-related polypeptide-binding site resides within
the dimeric molecule is subject to some dispute [6, 9]. Here, using solution NMR techniques, we
investigate the interactions between FkpA and substrate polypeptides (proteins) and the
molecular mechanism of its chaperone activity.
11.6.1 Substrate protein binding
To locate the chaperone-funtion-related polypeptide-binding site in its 3D structure and
investigate the interactions between FkpA and substrate polypeptides (proteins), the candidate
substrate proteins should ideally be: 1) partially folded or misfolded proteins or relatively stable

NMR studies of structure and function ofFkpA 72
B)
115.0 ,..-''
10.0 9-0 W[ppm] 7-°
7.50 7.30
'HN[ppm]
7.10
* '
r a » Iff à 7.50
10.0 90 <HN£ppm] 7.0
7.30
'HNfrpm]
7.10

NMR studies ofstructure and function ofFkpA 73
Figure 2.16 Overlay of the 2D 'H-'^N TROSY spectra (900MHz at 37°C) of sFkpA alone (black) and
titrated with RNase AS-Protein (A, and B) and RCM-la (C and D) at the molar ratios of 1:0.25 (magenta),
1:0.5 (blue), 1:0.8(green), and 1:1 (red). The crosspeaks showing shifts are marked with the corresponding
residue numbering for FkpA. B and D show an expansion of the 'H/15N chemical shift correlation spectra.
intermediates on a refolding pathway, but 2) still water soluble and 3) preferably with low
molecular weight, making possible study of the complex with solution NMR.
According to these criteria, we choose RNase AS-Protein and reduced and carboxymethylated
bovine a-lactalbumin (RCM-la) as protein substrates to investigate the chaperone function of
FkpA. RNase AS-Protein is a 104 amino acid protein, derived from RNase A, which retains some
residual structure stabilized by four disulfide-bonds [36] [371. By limited proteolysis, the peptide
bond between A20-S21 of RNase A can be selectively cleaved, resulting in only a slightly
altered structure [38], but with a fully cnzymatically active complex. By removing the N-terminal
20 amino acid ploypeptide, the enzymatically inactive, but folding competent so-called RNase
AS-Protein is generated. RNase AS-Protein has a native-like residual structure with good water
solubility under slightly acidic conditions [39]. Reduced and carboxymethylated bovine a-
lactalbumin (RCM-la) is a denatured protein with the molecular weight of 14 kDa and is
unfolded under physiological conditions. However, it remains water soluble under the condition
chosen for our solution NMR study [9]. In our experiments, RNase AS-Protein and
carboxymethylated bovine a-lactalbumin were obtained from Sigma. The latter was then reduced
with dithiothreitol (DTT, also from Sigma) to generate RCM-la. 2D 1H-I5N TROSY spectra are
recorded on 2H/15N-1abeled sFkpA (0.8 mM per monomer in 20 mM Mes buffer at pH 6.0 with
50 mM NaCI) at 37°C at 900MHz at the following molar ratios of sFkpA to substrate: 1:0, 1:0.25,
1:0.5, 1:0.8, and 1:1, with either RNase AS-Protein or RCM-la as substrate (Figure 2.16).
Through a careful comparison, the residues showing 'H/15N chemical shift perturbation during
the titration are mapped to the amino acid sequence of FkpA, as shown in Figure 2.17 A.
II.6.2 Specific polypeptide binding site of FKpA and comparison of its chaperone function
and PPIase activity
As shown in Figure 2.17 A, there is an extensive scope of residues showing 'h/'^N chemical shift
perturbation when titrated with either RNase AS-Protein or RCM-la. This suggested that there

NMR studies of structure and function ofFkpA 74
A)
sFkpA+Sprotein 10
sFkpA+RCM-la 10
sFkpA+Fk506 10
sFkpA+Sprotein 69
sFkpA+RCM-la 69
sFkpA+Fk506 69
HI H2
adskaafknddqksayalgaeiIgryESnslkEBeklgikldkdqliagvqdafadkskl
adskaafknddqksayalga|3ljgry£[i nslk îçeklgikldkdqliagvqdafadkskladskaafknddqksayalgaslgrymenslkeqeklgikldkdqliagvqdafadkskl
H3 ßl ß2
sdqeieqtlqafeafvJkssESsISmekdaadneakgkeyrekfakekgvktsstglvtqvve
sdqeieqtlqafeab\jkss^qfifmekdaadneakgkeyrekfakekgvktsstglvyqvvesdqeieqtlqafearvkssaqakmekdaadneakgkeyrekfakekgvkt sstglvyqwe
ß3 ß4a H4 ß4b H5
sFkpA+Sprotein 130 AGKGEAPKDSDTWVNYKGTLIDGKEFDNSYTRGEPLSFRLDGVIPGWTEGLKNIKK
sFkpA+RCM-la 130 AGKGEAPKDSDTWVNYKGTLIDGKEFDNSYTRGEPLSFRLDGVIPGWTEGLKNIKK
sFkpA+Fk506 130 AGKGEAPKDSDTVVVNYKGTLIDGKEFDNSYTRGEPLSFRLDGVIPGWTEGLKNIKK
ß5 ß6
sFkpA+Sprotein 187 GGKIKLVIPPELAÏGKAGVPGIPPM3TLVFDVELLDVKPAP
SFkpA+RCM-la 187 GGKIKLVIPPELAYGKAGVPGIPPN3TLVFDVELLDVKFAP
sFkpA+Fk506 187 GGKIKLVIPPELAYGKAGVPGIPPNSTLVFDVELLDVKPAP
B)
ANW

NMR studies ofstructure and function ofFkpA 75
Figure 2.17 A) Residues showing 'H/15N chemical shift perturbation upon titration with RNase AS-
Protein and RCM-la are highlighted in yellow. Residues N99, K102, F168, Y200 and V205 showing
chemical shift changes, AS > 0.1 (see Equation 2.6) with RNase AS-Protein are in red. For comparison,
residues located in FK506 binding pocket are in green. B) Comparison of structure function relation of
FkpA as chaperone with its PPIase function. Residues related to chaperone function are in red (left) and
residues related to its PPIase function are in green (right). The molecule is shown perpendicular to and
along the crystallographic 2-fold axis. The molecular model is based on the X-ray structure (PDB code:
1Q6H).
might be a background of chemical shift perturbations due to non-specific binding of RNase AS-
Protein and RCM-la to sFkpA. In order to locate potential specific polypeptide binding sites and
to illustrate the thermodynamics of its chaperone activity, detailed quantitative analysis of the
chemical shift changes upon addition of RNase AS-Protein and RCM-la is necessary. The
following expression defining changes between the spectrum with the sFkpA only and a
spectrum with a substrate protein and sFkpA was proposed [40]:
A£ = ^/(A#/)2+0.04(A<W)2 (2.6)
Here, A5H and AON represent the difference in chemical shifts of the amide hydrogen, and the
nitrogen, respectively, of the free sFkpA vs. a mixture of substrate proteins and sFkpA, where all
chemical shifts are in ppm. In Tables 2.6 A and B, residues are listed in the descending order
according to the calculated chemical shift changes using equation 2.6 upon addition of equimolar
RNase AS-Protein and RCM-la, respectively.
Six residues showing the most significant peak shifts upon addition of equilmolar RNase AS-
Protein (bold in the Table 2.6 A) are chosen for quantitative investigation on sFkpA and substrate
binding. Residue 200 is excluded due to the overlapping with the residue 33, which makes it not
suitable for the quantitative characterization. Similarly, five residues showing the most
significant peak shifts upon addition of equimolar RCM-la (bold in the Table 2.6 B) are chosen.
Residue 82 and 24 are excluded due to overlap and weak peak intensity.
For all chosen residues, chemical shift changes of sFkpA are measured during the process of
titration at molar ratios of 1:0.25, 1:0.5, 1:0.8, and 1:1, with RNase AS-Protein and RCM-la. The

NMR studies ofstructure and function ofFkpA 76
measured chemical shift changes (AÔ) are plotted against the concentrationof the substrates,
RNase AS-Protein and RCM-la, respectively, as shown in Figure 2.18 A and B.
tO
012 ~*~-Residue49—,
01Residue 143
-*- Residue 157- y" 3
008~*~ Residue 1S9
-«— Residue 207
~ - ~yyxy
~
ys—
^
006
004- - éé
yy^d&-
002~
<
01 02 03 04
IS] («M)
OS 06
£tesidus_t57
0.3 04
[Sj (mM)
oe
Figure 2.18 (A) Plots of peak shifts, AÖ, in 2D 'H-15N TROSY spectra (900MHz at 37°C) of sFkpA, as a
function of the concentration of RCM-la, |5*| .(B) Peak shifts, A5, in 2D 'H-15N TROSY spectra
(900MHz at 37"C) of sFkpA, as a function of the concentration of the substrate RNase AS-Protein, [5].
The concentration of 0.55 mM of substrates corresponds to the molar ratio of 1:1 of sFkpA (concentration
based on monomer) to substrates. The lines through the experimental points represent fits to the data with
Equation 2.13.
As we can see from Figure 2.18 A, RCM-la shows weak binding to sFkpA at the concentrations
on the order of mM. Probably there is a positive cooperative effect when the concentration of
RCM-la increases because the chemical shift changes vs. the concentration of RCM-la shows an
"S" (sigmoidal) curve. However, overall the chemical shift changes AÔ are small with maximum
of 0.101 of residue 207. Using AÔ of 0.1 ppm as cutoff, as previously reported criteria [41], we
only consider perturbations greater than 0.1 ppm significant, Thus, we assume that RCM-la
weakly binds to sFkpA and note that this type of weak binding could induce the chemical shift
perturbation AÔ of up to 0.1 ppm. However, RNase AS-Protein shows strong binding to sFkpA
at the concentration on the order of mM as there is an obvious trend of saturation of the binding
as the concentration of RNase AS-Protein increases (Figure 2.18 B).

NMR studies ofstructure and function ofFkpA 77
Table 2.6 A Chemical shift changes of sFkpA upon addition of RNase AS-Protcin at molar
ratio of 1:1
Residue ÔH _ref ON _ref SH ON AôH A5N AÔ
205 7.639 115.149 7.598 114.583 -0.041 -0.566 0.120396
99 8.567 119.593 8.679 119.446 0.112 -0.147 0.115794
102 8.35 118.909 8.251 118.628 -0.099 -0.281 0.11384
168 8.376 120.785 8.273 120.59 -0.103 -0.195 0.110136
200 8.565 122.35 8.464 122.158 -0.101 -0.192 0.108054
207 8.393 113.699 8.34 113.295 -0.053 -0.404 0.096631
157 7.055 120.789 7.04 120.339 -0.015 -0.45 0.091241
Table 2.6 B Chemical shift changes of sFkpA upon addition of RCM-la at molar ratio of 1:1
Residue ÔH _ref ON _ref 5H ON A5H AON AÖ
207 8.393 113.699 8.335 113.232 -0.058 -0.467 0.109943
157 7.055 120.789 7.044 120.288 -0.011 -0.501 0.100802
82 7.465 120.961 7.469 120.539 0.004 -0.422 0.084495
49 8.353 124.702 8.32 124.406 -0.033 -0.296 0.067776
24 7.086 122.545 7.019 122.497 -0.067 -0.048 0.067684
169 8.524 123.007 8.46 122.902 -0.064 -0.105 0.067357
143 7.64 122.027 7.595 121.785 -0.045 -0.242 0.066088
28 8.09 108.165 8.137 107.999 0.047 -0.166 0.057543
ÔH and 8N are the chemical shifts of the amide hydrogen and nitrogen of sFkpA measured for a mixture
of sFkpA and substrate proteins, RNase AS-Protein or RCM-la. 8H_ref and ÖN_rcf are the corresponding
chemical shifts measured for the free sFkpA. All chemical shifts are in ppm.
Considering only perturbations greater than 0.1 ppm significant, therefore, only residues N99,
K102, F168, Y200 and V205 show significant chemical shift changes and they are believe to be
important for specific binding with the substrate of RNase AS-Protein and reflect the chaperone

NMR studies ofstructure and function ofFkpA 78
function of FkpA. These residues are marked in red in Figure 2.17 A and mapped to the 3D X-ray
structure (Figure 2.17 B). These residues involved in the polypeptide binding and potentially
involved in the chaperone activity are compared with the FK506 binding pocket, which is related
to the PPIase activity of FkpA, as shown in Figure 2.17 B. Inspection of Figure 2,17 A and B,
reveals that residues Y200 and V205 are important for both chaperone function and PPIase
activity; and that residue F168, which is located adjacent to the FK506 binding pocket, is
important for specific polypeptide (protein) binding, although it is not involved in the PPIase
activity; N99 and K102, which are located in the long a-helix, are also important for the
chaperone function but have no relation to the PPIase activity.
II.6.3 FkpA chaperone function
We have shown that the chaperone FkpA can specifically bind to non-natively structured RNase
AS-Protein. The residues N99, K102, Fl 68, Y200 and V205 are believe to be important for this
specific binding and the chaperone function of FkpA. Our next interest is trying to characterize
the equilibrium constant of the substrate binding and the number of substrate molecules per dimer
of FkpA in the binding. The binding reaction can be written as:
[sFkpA] + n[S] — [sFkpA^SJ (2.7)
A B
Where free and bound forms of FkpA are noted as spieces A and B and the integral constant n
gives the number of substrate molecules that bind to a single chaperone molecule sFkpA. For a
homodimeric molecule, sFkpA, the constant n is likely to be equal to either 1 or 2, which means
that two or only one substrate molecule binds to a single dimeric molecule of FkpA. As only a
single set of NMR signals is observed for the mixture of RNase AS-Protein and sFkpA, one can
assume that the exchange between the free and bound forms of sFkpA is fast on the NMR
timescale. Thus, without further detailed consideration of chemical shift perturbation due to non¬
specific binding, our measured chemical shift is a weighted average value between the free and
bound forms of FkpA expressed by:
ST=-^-SA+-^—SB (2.8)[A\ + [B] [A] + [B]

NMR studies ofstructure and function ofFkpA 79
where or is the measured chemical shift and SA and SB are chemical shifts for the free and bound
forms of sFkpA. Thus, the chemical shift changes can be expressed as:
AS= ÖT -SA =
[A]3A +
{B]5B-ÖA
T A
[A] + \B] [AJ + [B1
=_^1_(^ -SA) = -W—ASm[A] + [B\
B A
[A] + [B]
where Aô = S„- SÀ is the chemical shift difference between the bound and free form sFkpA.TTL1X 15 r\.
It can easily be derived that,
(2.10)[B] AS _ôT- SA
[A] ASm-AS 50-ôT
The observable equilibrium constant Kapp can be written as:
Kaa,=^a = Kx*[S] + K2»lS]2 (2.11)
K; and K2 are the binding constant when integral constant n is equal to 1 and 2.
For non-competitive binding the average number of substrates bound per sFkpA protein molecule,
N,can be calculated as:
( AS \
N = d\nKapp/dln(lS\) = d\n /d\n(\S]) (2.12)V^^max A<? J
If ln(AÔ/AÔmax - A5) is plotted as a linear function of ln(rS'l), then the slope is equal to the
constant N,i.e., the average number of substrates bound per sFkpA protein molecule. Chemical
shift changes for residues N99, K102, F168. V205 at different concentration of RNase AS-
Protein were used to calculate lnCAS/AS* - AS). Figure 2.19 shows the plot of ln(AÔ7A<w -
A8) for residues N99, K102, F168, V205 and their average vs. ln([5j). Linear regression gives
an average value for constant N of about 0.7, which indicates that n is equal to 1 (n must be an
integer).
The intrinsic binding constant for the titratable residues, Klt was evaluated by fitting the data in
Figure 2.18 to a simple two-state binding equation:

NMR studies ofstructure and function ofFkpA 80
AS = (2.13)
The approximate value for K1 is 1.57 mM'1 and the corresponding inverse value of the binding
constant is around 640 u.M. This matches previously reported results of 730±100 u,M in steady-
state kinetic analysis using Suc-Ala-Phe-Pro-Phe-pNA as substrate [3].
y = 0.692ÔX + 0.438 R8Sidua-_S9
y = 0.6702X + 0.4554 * Resïdue_102
y = 0.7535X + Q.47Ô6 ResidueJSS
y = 0.6842* + 0.438S x ReSldU6„205
S*
Mi
J -2<3
» Average
y = 07ÛÛ2x+Û.4S3
0.5
Figure 2.19 Linear regression analysis of ln(AÔ/A8111£lx - AS) for residues N99, 1C102, F168, V205 and
their average as a function of ln([^]). [S] is the concentration of substrate RNase AS-Protein.
Conclusion: Our NMR studies on the complex of dimeric sFkpA with substrate proteins
characterize the chaperone function of FkpA as follows:
1. Five residues, N99, K102, Fl 68, Y200 and V205 are probably important for specific
polypeptide (or substrate protein) binding and may play an important role in the FkpA
function, of which N99 and K102 locate in the long a-helix are not involved in the PPIase
activity, whereas F168, Y200 and V205 are located in the FKBP domain, which are in or
nearby the PPIase activity related FK506 binding pocket.
2. Thermodynamic property of the complex of dimeric sFkpA with substrate protein RNase
AS-Protein shows that sFkpA dimer binds RNase AS-Protein at a 1:1 molar ratio and is in

NMR studies of structure and function ofFkpA 81
the fast exchange regime on the NMR time scale with an equilibrium constant on the order
of 100 p.M .
II.l Mechanism of chaperone function of dimeric FkpA: model of "mother's
arms"
Based on our NMR studies of the structure and dynamics of FkpA and its complex with substrate
proteins, we propose a molecular model, the so-called "mother's arms" model, to explain the
mechanism of chaperone function of FkpA, as shown in Figure 20.
Figure 2.20 Model of "mother's arms" to illustrate the mechanism of chaperone function of FkpA. The
curved double arrows indicate the flexibility in the long a helices.
In this model, FkpA has two long flexible "arms" (the two long a helices) which can bend at the
"elbows" (presumably between residues 84 and 91 in the long a helices). The two "hands" are
the specific polypeptide binding sites on the two subunits and each of them has five
"fingers"(residues N99, K102, F168, Y200 and V205). These two hands using their five fingers
can "catch" (bind) "one" (constant « is 1) polypeptide or small protein (called "baby protein")
substrate. The "mother", i.e., dimeric FkpA, through bending of her two long a-helical "arms",
can then hold the "baby" (polypeptide or small protein substrate), which is like a mother's arms
hugging her baby. The considerable plasticity in the long a helices renders FkpA able to adapt its
structure and bind a wide range of targets, which might be very important for the chaperone
activity of FkpA.

NMR studies ofstructure and function ofFkpA 82
Perspectives:
To further confirm the refolding assistant function of FkpA on partially folded or misfolded
proteins or relatively stable intermediates on a refolding pathway, the binding experiments can be
carried out, however using fully folded protein, such as RNase A, as substrate. This type of
negative control experiment will exclude the possibility of false-positive results in our substrate
binding experiment in II 6.1. RDCs and 15N relaxation can be measured with the sFkpA complex
with RNase AS protein. The results will help further understand the structural and dynamical
properties of the chaperone-substrate complex, which in turn can provide information to illustrate
the mechanism of the chaperone function of the dimeric FkpA.
References
1. Home Sm, Young KD, Escherichia-Coli And Other Species Of The Enterobacteriaceae Encode A Protein
Similar To The Family OfMip-Like Fk506-Rinding Proteins. Archives Of Microbiology, 1995. 163(5): p. 357-
365.
2. Kathrin Ramm, Andreas Pliickthun, The Periplasmic Escherichia coli Peptidylprolyl cis,lrans-Isomerase FkpA.
II. 1SOMERASE-INDEPENDENT CHAPERONE ACTIVITY IN VITRO. J. Biol. Chem., 2000. 275: p. 17106-
17113.
3. Jean-Philippe Arié, Nathalie Sassoon, Jean-Michel Betton, Chaperone function of FkpA, a heat shock prolyl
isomerase, in the periplasm ofEscherichia coli. Mol. Microbiol, 2001. 39(1): p. 199 -210.
4. Hendrick Bothmann, Andreas Pliickthun, The Periplasmic Escherichia coli Peptidylprolyl eis, trans-Isomerase
FkpA. I. INCREASED FUNCTIONAL EXPRESSION OF ANTIBODY FRAGMENTS WITH AND WITHOUT cis-
PROLINES. J. Biol. Chem., 2000. 275: p. 17100-17105.
5. Riboldi-Tunnicliffe A, Konig B, Jessen S, Weiss MS, Rahfeld J, Hacker J, Fischer G, Hilgenfeld R, Crystal
structure ofMip, a prolylisomerase from Legionella pneumophila. Nat. Struct. Biol., 2001. 8(9): p. 779-783.
6. Saul FA, Arie JP, Normand BVL, Kahn R, Betton JM, Bentley GA, Structural and functional studies of FkpA
from Escherichia coli, a cis/trans peptidyl-prolyl isomerase with chaperone activity. J. Mol. Biol., 2004. 335(2):
p. 595-608.
7. Schreiber SL, Crabtree GR, The Mechanism OfAction OfCyclosporine-A AndFk506. Immunology Today, 1992.
13(4): p. 136-142.
8. Tanaka H, Nakahara K, Halanaka H, Inamura N, Kuroda A, Discovery and development of a novel
immunosuppressant, tacrolimus hydrate. Yakugaku Zasshi-Journal Of The Pharmaceutical Society Of Japan,
1997.117(8): p. 542-554.

NMR studies of structure and function of FkpA 83
9. Kathrin Ramm, Andreas Pliickthun, High Enzymatic Activity and Chaperone Function are Mechanistically
Related Features of the Dimeric E. coli Peptidyl-prolyl-isomerase FkpA. J. Mol, Biol., 2001. 310(2): p. 485-498.
10. Wuthrich, K, NMR ofProteins and Nucleic Acids. 1986, New York: Wiley.
11. Pervushin, K., et al., Attenuated T-2 relaxation by mutual cancellation of dipole- dipole coupling and chemical
shift anisotropy indicates an avenue to NMR structures of very large biological macromolecules in solution.
Proc. Natl. Acad. Sei. U. S. A., 1997. 94(23): p. 12366-12371.
12. Salzmann, M., et al., TROSY in triple-resonance experiments: New perspectivesfor sequential NMR assignment
of large proteins. Proc. Natl. Acad. Sei. U. S. A., 1998. 95(23): p. 13585-13590.
13. Salzmann, M., et al., TROSY-type triple-resonance experiments for sequential NMR assignments of large
proteins. J. Am. Chem. Soc., 1999. 121(4): p. 844-848.
14. Zhu, G., et al., 2D and 3D TROSY-enhanced NOESYofN-15 labeled proteins. J. Biomol. NMR, 1999. 14(4): p.
377-381.
15. Guntert, P., et al., Processing of Multidimensional Nmr Data with the. New Software Prosa. J. Biomol. NMR,
1992. 2(6): p. 619-629.
16. Bartels, C, et al., The Program Xeasy for Computer-Supported Nmr Spectral-Analysis of Biological
Macromolecules. J. Biomol. NMR, 1995. 6(1): p. 1-10.
17. Wishart, D. S., et al., H-l, C-13 and N-15 Chemical-Shift Referencing in Biomolecular Nmr. J. Biomol. NMR,
1995. 6(2): p. 135-140.
18. Guntert P, Salzmann M, Braun D, Wuthrich K, Sequence-specific NMR assignment of proteins by global
fragment mapping with the program MAPPER. J. Biomol. NMR, 2000. 18(2): p. 129-137.
19. Wishart, D. S., Sykes, B.D., The C-13 Chemical-Shift Index - A Simple Method For The Identification Of
Protein Secondary Structure Using C-13 Chemical-Shift Data. J. Biomol. NMR, 1994. 4(2): p. 171-180.
20. Farrow, N. A., et al., Backbone Dynamics of a Free and a Phosphopeptide-Complexed Src Homology-2 Domain
Studied By N-15 Nmr Relaxation. Biochemistry, 1994. 33(19): p. 5984-6003.
21. Cavanagh, J., et al., Protein NMR Spectroscopy: Principles and Practice. 1996, New York: Academic Press.
22. Bax, A., G. Kontaxis, and N. Tjandra, Dipolar couplings in macromolecular structure determination, in Nuclear
Magnetic Resonance ofBiological Macromolecules, Pt B. 2001. p. 127-174.
23. Tjandra, N. and A. Bax, Direct measurement ofdistances and angles in biomolecules by NMR in a dilute liquid
crystalline medium [see comments] [published erratum appears in Science 1997 Dec 5;278(5344):1697],
Science, 1997. 278(5340): p. 1111-4.
24. Tolman JR, Al-Hashimi HM, Kay LE, Prestegard JH, Structural and dynamic analysis of residual dipolar
coupling data for proteins. J. Am. Chem. Soc, 2001. 123(7): p. 1416-1424.
25. Bernado P, Blackledge M, Anisotropic small amplitude peptide plane dynamics in proteins from residual
dipolar couplings. J. Am. Chem. Soc, 2004. 126(15): p. 4907-4920.
26. Matsuda T, Ikegami T, Nakajima N, Yamazaki T, Nakamura H, Model building of a protein-protein complexed
structure using saturation transfer and residual dipolar coupling without paired intermodular NOE. J. Biomol.
NMR, 2004. 29(3): p. 325-338.

NMR studies ofstructure and function ofFkpA 84
27. Clore GM, Schwieters CD, Docking of protein-protein complexes on the basis of highly ambiguous
inlermolecular distance restraints derived from H-1(N)/N-15 chemical shift mapping and backbone N-15-H-1
residual dipolar couplings using conjoined rigid body/torsion angle dynamics. J. Am. Chem. Soc, 2003.
125(10): p. 2902-2912.
28. Tolman, JR, Dipolar couplings as a probe ofmolecular dynamics and structure in solution. Curr. Opin. Struct.
Biol., 2001. 11(5): p. 532-539.
29. Ruckert M, Otting G, Alignment of biological macromolecules in novel nonionic liquid crystalline media for
NMR experiments. J. Am. Chem. Soc, 2000.122(32): p. 7793-7797.
30. Hansen, M. R., L. Mueller, and A. Pardi, Tunable alignment of macromolecules by filamentous phage yields
dipolar coupling interactions. Nat. Struct. Biol., 1998. 5(12): p. 1065-1074.
31. Sass, J., et al., Purple membrane induced alignment of biological macromolecules in the magnetic field. J. Am.
Chem. Soc, 1999.121(10): p. 2047-2055.
32. Byeon, I. J. L., J. M. Louis, and A. M. Gronenbom, A captured folding intermediate involved in dimerization
and domain-swapping ofGBl. J. Mol. Biol., 2004. 340(3): p. 615-625.
33. Yuzawa, S., et al., Solution structure of the tandem src homology 3 domains ofp47(phox) in an autoinhibited
form. J. Biol. Chem., 2004. 279(28): p. 29752-29760.
34. Vogeli B, Kovacs H, Pervushin K, Measurements of side-chain C-13-C-13 residual dipolar couplings in
uniformly deuterated proteins. J. Am. Chem. Soc, 2004. 126(8): p. 2414-2420.
35. Clore GM, Schwieters CD, How much backbone motion in ubiquitin is required to accountfor dipolar coupling
data measured in multiple, alignment media as assessed by independent cross-validation? J. Am. Chem. Soc,
2004. 126(9): p. 2923-2938.
36. Richards, F.M. and H.W. Wyckow, Bovine pancreatic ribonucleases, in The Enzymes, Boyer, Editor. 1971,
Academic Press, New York. p. 647-806.
37. Ritter, C. and A. Helenius, Recognition of local glycoprotein misfolding by the. ERfolding sensor UDP-glucose ;
glycoprotein glucosyltransferase. Nat. Struct. Biol., 2000. 7(4): p. 278-280.
38. Kim, E. E., et al., Refinement of the Crystal-Structure of Ribonuclease-S - Comparison with and between the
Various Rihonuclease-a Structures. Biochemistry, 1992. 31(49): p. 12304-12314.
39. Pervushin K, Gallius V, Ritter C, Improved TROSY-HNCA experiment with suppression of conformational
exchange induced relaxation. J. Biomol. NMR, 2001. 21(2): p. 161-166.
40. Damberg CS, Orekhov VY, Billeter M, Automated analysis of large sets ofheteronuclear correlation spectra in
NMR-based drug discovery. J. Med. Chem., 2002. 45(26): p. 5649-5654.
41. Hajduk PJ, Boyd S, Nettesheim D, Nienaber V, Severin J, Smith R, Davidson D, Rockway T, Fesik SW,
Identification of novel inhibitors of urokinase via NMR-based screening. J. Med. Chem., 2000. 43(21); p. 3862-
3866.

85
Chapter III
Backbone resonance assignment in large protonated proteins using a
combination of new 3D TROSY-HN(CA)HA, 4D TROSY-HACANH and 13C
detected HACACO experiments
Kaifeng Hu, Alexander Eletsky and Konstantin Pervushin, J. Biomol NMR, (2003) 26 (1),
66-77.

86
Seite Leer /
Blank leaf

87
Introduction: X-detection based NMR spectroscopy of proteins
In the recent years a method for the residue-specific assignment of the backbone resonances in
large proteins has been developed, which is based on the implementation of transverse relaxation-
optimized spectroscopy (TROSY) (Pervushin et al. 1997) in 3D and 4D sets of the triple-
resonance experiments (Salzmann et al. 1999a; Salzmann et al. 1999b; Yang and Kay 1999;
Mulder et al. 2000). The sensitivity of the basic TROSY-type HNCA, HNCOCA, HNCACB,
HNCO and HNCACO experiments constituting this method is critically important for the
successful backbone assignment. The uniform or partial replacement of non-labile protons with
deuterons reducing transverse relaxation of the *HN and 13Ca'^ spins has been an indispensable
tool for resolving and assigning NMR spectra of large complexes, including membrane proteins
in detergent micelles (LeMaster 1994; Yamazaki et al. 1994; Grzesiek et al. 1995b; Shan et al.
1996; Gardner and Kay 1998; Salzmann et al. 1998). In this case much of the valuable side chain
information is lost by the complete deuteration of these moieties. With the use of only partial
deuteration the assignment process can be hampered by 13C line broadening due to ^^H isotope
effects (Venters et al. 1996). Other problems associated with the *HN "out- and-back" method
underlying this line of experiments are the use of smaller scalar couplings Vnc« (relative to
I
i n
Jnco) to establish sequential correlations (Cavanagh et al. 1996), strong "C transverse
relaxation due to the large 13C CSA tensor, limiting the use of the HNCOCA-type experiments
to spectrometers operating at lower polarizing magnetic field strength, and the need to back-
exchange 2HN to protons.
Recently we proposed a new 3D multiple-quantum HACACO experiment (Eletsky and Pervushin
2002) designed to complement this method. The use of the 3D MQ-HACACO experiment with
proteins of larger molecular weight relies on the favorable relaxation properties of the 1Ha-
13Ca multiple quantum coherences (Grzesiek et al. 1995a; Swapna et al. 1997; Xia et al. 2000) to
record 1Ha and 13Ca chemical shifts and transfer the 'Ha magnetization to the 13C spins using
one double- constant-time evolution period (Swapna et al. 1997) and the direct acquisition of the
13C resonances (Serber et al. 2000; Serber et al. 2001). High sensitivity and a simple anti-phase
doublet structure of the 13C resonances enable effective signal acquisition even for large
88
protonated proteins on the order of 50-60 kDa at room temperature. Sequential connectivities
derived from weak sequential cross peaks in the 3D TROSY-HNCA experiments are
complemented or completely replaced by strong one bond 13Ca-13C correlation cross- peaks
obtained from the MQ-HACACO experiment, thereby "bridging" intra-residual cross- peaks of
the HNCA experiment with the strong inter-residual cross peaks derived from the HNCO
experiment. Although 3D MQ-HACACO effectively resolves the problem of overlapping inter-
and intra-residual 13CU resonances (Salzmann et al. 1999b), bridging of the HNCA and HNCO
experiments still relies on the consecutive matching of single pairs of the C
(HNCO/HACACO) and 13Ca (HACACO/HNCA) chemical shifts. While good spectral resolution
and large dispersion of the 13C chemical shifts facilitate the correlation between HNCO and
HACACO experiments, broader lines along the 13Ca dimension in the 3D HACACO and 3D
HNCA experiments might result in significant ambiguities in the assignment.
Development of 3D TROSY-HN(CA)HA and 4D TROSY-HACANH
experiments
A new method for backbone resonance assignment suitable for large proteins with the natural 'H
isotope content is proposed based on a combination of the most sensitive TROSY-type triple-
resonance experiments. These techniques include TROSY- HNCO, 13C detected 3D multiple-
quantum HACACO and the newly developed 3D TROSY multiple-quantum-HN(CA)HA and 4D
TROSY multiple-quantum-HACANH experiments. The favourable relaxation properties of the
multiple-quantum coherences, signal detection using the l3C anti phase coherences, and the use
of TROSY optimize the performance of the proposed set of experiments for application to large
protonated proteins. The method is demonstrated with the 44 kDa uniformly 15N,13C-labe1ed and
fractionally (35%) deuterated trimeric B. Subtilis Chorismate Mutase and is suitable for proteins
with large correlation times but a relatively small number of residues, such as membrane proteins
embedded in micelles or oligomeric proteins.
The remarkably good sensitivity obtained in the MQ-HACACO experiment (Eletsky and
Pervushin 2002) applied to large proteins with natural lW isotope content encouraged us to

89
(a)y -y
lu * >l
h
H
ÏH t2 t2il i
*k
15,
y b
'N x\%\ T2 | t2 I
13C<* III â
Î3CO
PFG j_iiG1 Gl t^3
SEDIiCË
AJ.U.Ci Ci Gj Gj
(b) t> ,i ,
'H | j j |2 lT5,
4>5<t>6
LUIL<f>r
ISN HI 44W
13>-ia *3
13.
Hr^li 1
CO
PFG
SEKUCE:
ic3
j_t4-4

90
Figure 1. Experimental scheme for (a) 3D TROSY MQ-HN(CA)HA and (b) 4D TROSY MQ-HACANH
experiment. The radio-frequency pulses on 'H, 13Cu, isN and l3C are applied at 4.7, 54.6, 119 and 173.6
ppm, respectively. Narrow and wide black bars indicate high power 90° and 180° pulses. Filled sine bell
shapes on the line marked *H indicate water-selective 1 ms Gaussian 90° pulses applied to align the water
magnetization in +z direction before data acquisition (Grzesiek and Bax 1993). The residual transverse
water magnetization is dephased using 3-9-19 composite pulses (Liu et al. 1998). Selective 13C
decoupling is achieved by SEDUCE-1 (Shaka ct al. 1983) at a field strength of yfi2 = 1.65 kHz. The line
marked PFG indicates the duration and strength of pulsed magnetic field gradients applied along the z-
axis: d: 0.9 ms, 40 G/cm; G2: 1 ms, 80 G/cm; G3: 0.5 ms,50 G/cm and G4: 0.9 ms, 40 G/cm. In (a) open
shapes on the line marked 'H indicate the 'HN band-selective 1.5 ms excitation E-Burp2 pulse (Geen and
Freeman 1991) with y#y = 2.73 kHz with the phase (J)2(time point b) and the time-reversed excitation E-
Burp2 pulse with the phase x (time point c). The centre of excitation for the *HN band-selective pulses is
placed at 9 ppm, so that all amide protons resonating between 11.5 and 6.5 ppm are returned to the +z
axis. A filled sine bell shape on the line marked 13Ca indicate 1.6 ms refocussing 180° Re-Burp pulse
(Geen and Freeman 1991) with yBt = 3.91 kHz. The delays are T = 14 ms, ô] = 2.7 ms, ô2 = 14 ms, ô3 =
3.5 ms. The phase cycle is: (J), = {x}, fa= {-x}, fa= {4(-x), 4x}, fa= {y,-y,-x, x}; fa = {-y};fa= {y}; fa
= l-yl; <|W = (y. -y. -x, x, -y, y, x, -x}. A phase-sensitive spectrum in the 15N(f0 dimension is obtained by
recording a second FID for each ty value, with fa = {y, -y, x, -x}, fa = {y}, fa - {-y} and fa = {y}.
Quadrature detection in the 'H (f2) dimension is achieved by the States-TPPI method (Marion et al. 1989)
applied simultaneously to the phases fa and fa. In (b) the delays arc 7-14 ms, ô\ = 2.7 ms, 62 = 12 ms
and Ô3 = 3.5 ms. The phase cycle is: fa = {x}, fa= {x}, fa= {4x, 4(-x)}, fa- {y, -y, -x, x}; fa= {-y}; fa -
ly}; $7 = {-y}; <t>rec - (y> -y> _x* x> -y» y> x» -*} A phase- sensitive spectrum in the 15N(fi) dimension is
obtained by recording a second FID for each ^ value, with <J>4 = {y, -y, x, -x}, fa = {y}, fa = {-y} and fa =
{y}. Quadrature detection in the 'H (f2) and nC(t}) dimensions is achieved by the States-TPPI method
(Marion et al. 1989) applied to the phases fa and <j>2, respectively.
explore the possibility of using 'Ha as well as l3Cn chemical shifts to reduce ambiguities in
correlating the backbone resonances. Here, we describe two experiments, 3D multiple-quantum
TROSY HN(CA)HA, correlating the chemical shifts of the 'H^, 15N, and intra-residual 'H
spins, and 4D multiple-quantum TROSY HACANH, correlating 'H,N, 15N;, 13C" and intra-
residual LH,a spins. Previously, enhancement factors of 1.5 to 1.7 were observed for 24 kDa

91
(a) 3D TROSY HN(CA)HA (b) 3D TROSY HA(CA)NH a-helix
EI7125.23
T16in.65
t~?
0
&
fci
HIS116.74
fr g-Ô,y-r-
(7
o
E19119.66
C&-
116113 65
£17125.23
<m
EIS116,74
va
E19119,66
0»3,6
-4.0
0
-4.4
O-4,8
7.57 9.16 8 85 '52 7.57 9.16 8,85
tt^H^lppm]7.52
(c) 3D TROSY HN(CA)HA (d) 3D TROSY OA(CA)MH ß-sheet
12474
K
' Y?!11*73
O
^
M92127 25
*O
M93109,90
/1X
<D
00
,R90124 74
O
&
O
&
&
V9111973
©
* i
M92127,25
„0
*J! (
O
C
M93109,90
Co>
-4,4
-4,8
[Pp]
-5,2
5.6
8,71 8,88 8,92
%{'H**)fppm]1019 8 71 8.92
»4{lH«)[ppm]10,19

92
Figure 2. Comparison of corresponding 2D fœ2(1Hct), (o3,4('HN)] strips from 3D TROSY MQ-
HN(CA)HA (a and c) and 3D TROSY MQ-HA(CA)NH experiments (b and d) recorded with a 1 mM
solution of the uniformly lsN,13C-labeled and fractionally 35% deuterated trimeric 44 kDa B. Subtilis
Chorismate Mutase (BsCM). The strips were taken at the 15N chemical shifts that assigned to residues 16-
19 and 90-93, located in the a-helical and (3-sheet regions of BsCM, respectively. They are centered about
the corresponding amide proton chemical shifts and have a width of 131 Hz along 'H dimension. The 4D
TROSY MQ-HACANH experimental scheme of Fig. lb was acquired with fj = 0 resulting in the 3D
TROSY MQ-HA(CA)NH experiment. For both experiments 40(fi) x 55(r2) x 512(f3/f4) complex points
were accumulated, with fi^^N) = 26.64 ms, t2aisa(]Ha) = 22.89 ms and r3/4nu*(1HN) = 53.25 ms and 8
scans per increment resulting in a total measuring time of - 22 hours per spectrum. The sequential
connectivities are indicated by dashed lines.
13C,15N-labeled protein (FimC) when the standard triple-resonance schemes were upgraded to
TROSY (Salzmann et al. 1998). We expect similar factors in our case.
Figures 1 a and lb show the experimental schemes of 3D TROSY MQ-HN(CA)HA and 4D
TROSY MQ-HACANH, utilizing the "out-and-back" and "out-and-stay" methods, respectively
(Cavanagh et al. 1996). The product operator description of the TROSY coherence transfer
pathway in 3D TROSY MQ-HN(CA)HA is given by Eq. (1 ).
^-4C?H^NA--H?)^-4C^HfNz(-~H?)[t2]^-2C^Nz(-~H?) (1)
^_2N±C?(|-tff)[rJ^//^ + A^)[r1]
where H, N and C represent product operators of !H, 15N and 13Ca spins, respectively. Single
E E
transition operators H"(~ + N7) and N±(— + Hz) represent slowly relaxing TROSY
components of the 15N-'HN multiplet (Pervushin et al. 1997). The experimental scheme of Fig. la
deviates from the corresponding TROSY HNCA experiment (Salzmann et al. 1998) at time point
a, where the polarization transfer period x^ is inserted, resulting in the development of the C
coherence antiphase relative to the directly attached [Ha spin. This coherence is subsequently
converted by the pulse fa to the 13ca-'Ha multiple quantum operator with favourable relaxation

93
properties, used to record the !H chemical shift. The high power 90° ]H excitation pulses applied
at time points b and c are bracketed by lHN band-selective 90° E- Burp2 pulses (Geen and
Freeman 1991), in order to preserve the spin state of the *HN spins and to prevent exchange
between TROSY and anti-TROSY l5N multiplet components. In the middle of t2 13Ca chemical
shift is refocused by a 180" 13Ca band selective Re-Burp pulse, (Geen and Freeman 1991)
reducing signal attenuation due to the evolution of 13C homonuclear passive /-couplings between
13Ca and 13CP. The standard ST2-PT element (time points d and e) (Pervushin et al. 1998) is used
to correlate the frequency of the TROSY component of the 15N multiplet with the corresponding
component of the 'H^ multiplet.
Figure lb shows the 4D TROSY MQ-HACANH experiment, based on the "cVH" HMQC
double-constant-time magnetization transfer scheme and TROSY detection of the 15N and 1UN
chemical shifts. The product operator description of the relevant coherence transfer pathways is
given by Eq. (2).
H" -> 2HaxC* -» -2H*Cay[t2,t^ -> 2CayNz -> 2CfN7
F F(2)
->-2CfN±(--Hf)[r1]^H_A'(- + iV()[f4J
The experimental scheme of Fig. lb is best suited for the methine Ca carbons, since full use of
the double-constant-time period can be made for the 'Ha and 13Ca chemical shift evolution. A
modification of the experimental scheme of Fig. lb is required in order to detect with optimal
sensitivity the methylene Ca carbons which occur in glycine residues. This version of the
HACANH corresponds to the first part of the (HA)CA(CO)NH experiment introduced by
(Swapna et al. 1997) and will not be described in detail in this paper. After the double-constant-
time period 2x2, the resulting signal is determined by magnetization transfer from the lHa to l3Ca
and subsequently to 15N spins, as well as attenuation due to passive homonuclear J- couplings of
1Ha to !Hß, 'HN spins and 13Ca to 13Cpspins. Neglecting effects of relaxation and small
heteronuclear J-couplings between 'H and 13Cß and13Ca and 'Hp spins, the HMQC part of the
transfer function is given by Eq. (3):
/(T2, r, ) = sin(8/nx:, t3
)2 sin(2^/cf^
r2 ) cos(2tc/h?h, t2 )
x cos(2tiJh,,h!I t2 )cos(27tJc«n ^
r2 ) cos(2nJc;,cj1t2 )

94
4D TROSY HACANH
(a) T16
«>2dH«H,5£2«>3( Ca)=57,'513
T16
(c) E17
W3(13ca^5gg26J
(e) El8
<92f%aH.*9ö)3(13faHÖ201 |
' EIS i
l I
12,00 9,00
118.00
0,(«N)
112.00
112 00
118,00
124.00
6,00
pr
E17
(b)
El?
f»l(,3N>=125.210'»4<lHN)=9J63
« T16
EIS
»I(15M)r» 16,710
ca4(1HIV 8,835 ,
*
*E17
(f)*
B.E18
El9
- E19
8>1(15N>ÎI9.96Q
«4J,1 ^7.537
.?
4.00
5.00
5.50
-1
4,00
(jppml
5.00
5,50
4,00
©at'H11)
iPpm]
5.0Û
^f 5,50
ontWXppml
60.00 56.00 52,00
©rf^ppm]

95
Figure 3. 2D [œ,(15N), co4 ('HN)] (a, c and e) and Lcù/H"), g>3 (13Ca)l (b, d and f) planes taken at the
positions of the 'Ha, l3Ca chemical shifts and the 15N, 'HN chemical shifts, respectively, of residues 16-19
showing the procedure of sequential assignment of the backbone resonances using the 4D TROSY MQ-
HACANH experiment of Fig. lb. 16 (fi) x 30 (r2) x 40 (f3) x 512 (f4) complex points were accumulated,
with rim,lx(,5N) = 10.65 ms, WLHU) - 22.89 ms, r3mjx(13CH) = 22.21 ms, fw('HN) = 53.25 ms and 4
scans per increment resulting in the total measuring time of 5 days and 20 hours. Sequential connectivities
are indicated by arrows. In each 2D plane two chemical shifts of each residue associated with an
individual cross-peak are indicated.
Transfer efficiencies of 0.28 and 0.21 are obtained for the a-helical and ß-sheet secondary
structure elements of a protein at the optimal transfer delays (x3-3.4 ms and 2t2 = 27 ms),
determined using V(Ha-HN) = 4 Hz and 9 Hz for a-helix and ß-sheet, respectively, (Wuthrich
1986) and V(Ha-Hß2) - 12 Hz, '/(Ca-Cp) - 37 Hz, J(Ca-N,) ~ 9 Hz and /(Ca-N,_y) - 7 Hz for both
secondary structure elements (Cavanagh ct al. 1996). In the experiment, a somewhat shorter
delay (2i2 = 24 ms) was used to compensate the shift of the maximum in Eq. (3) due to transverse
relaxation. Since the full delay can be used to record chemical shifts of 'H" and l3Ca resonances,
excellent resolution along the corresponding 'Ha and 13Ca dimensions can be obtained.
Sufficiently sensitive 3D TROSY MQ-HN(CA)HA, 3D TROSY MQ-HA(CA)NH and 4D
TROSY MQ-HACANH spectra are obtained for the 44 kDa uniformly 15N,13C-labeled and
fractionally 35% deuterated chorismate mutase from Bacillus subtilis (BsCM) (Eletsky et al.
2001) using the experimental schemes of Figure 1. Figure 2 compares the intensities of cross-
peaks stemming from residues in the a-helical and ß-sheet secondary structure elements of
BsCM, obtained with the 3D TROSY MQ-HN(CA)HA and 3D TROSY MQ-HA(CA)NH
experiments. Although sufficiently strong intra-residual 1HN-1Ha cross-peaks are identified in
both experiments for most residues (see Fig. 2), significantly different performance of these two
experiments is observed for residues located in a-helices and ß-sheets. Overall, higher sensitivity
is detected for the a-helical regions of BsCM compared to the ß-sheet or turn regions in the
spectra measured with the 3D TROSY MQ-HA(CA)NH experiment (Fig. 2 b and d). Rather
similar relative cross-peak amplitudes for a-helical and ß-sheet are observed in spectra measured
with the 3D TROSY MQ-HN(CA)HA experiment (Fig. 2 a and c). Although the average S/N

96
over all residues of BsCM is slightly higher for MQ-HA(CA)NH than MQ- HN(CA)HA, the long
double-constant-time period x2 renders the former experiment more sensitive to the deleterious
effects of homonuclear passive J-couplings and transverse relaxation induced by dipole-dipole
interactions of the 'Ha spins with remote proton spins. These factors result in a significant
decrease of S/N in the ß-sheet regions. Thus, for practical purposes the choice between the
experimental schemes of Fig. 1 a and b can be determined by the predominance of a certain type
of the secondary structure in the studied protein or both experiments can be tried for the best
results.
The use of TROSY in the proposed experiments is justified by a direct comparison of signal-to-
noise ratio in TROSY and conventional 'HN-dccoupled MQ-HA(CA)NH experiments. For all
residues of 13N-, 13C-, 2H(35%)-labeled 44 kDa BsCM the TROSY version exhibited S/N
enhancement factors over the conventional implementation in the range of 1.1 to 1.5. These
enhancement factors agree with to those previously observed for a 24 kDa 13C,15N- labeled
protein (FimC) when the standard triple-resonance schemes were replaced with TROSY
(Salzmann et al. 1998). It should be noted that for fully protonated large proteins smaller and
none-uniform S/N enhancement factors in TROSY versions can be expected. This is attributed to
the dominant contribution of the proton-proton spin-flip interactions to the TROSY 1SN
relaxation rate (Kontaxis et al. 2000).
The presence of the ^c^H* HMQC double-constant-time period in the experimental scheme of
Fig. lb opens an attractive possibility of running TROSY MQ-HACANH in a 4D mode without
compromising sensitivity of the experiment due to additional time incrementations, besides the
v2 loss in S/N due to the quadrature detection in the 13Ca dimension. Figure 3 illustrates the
quality of the 4D spectrum measured using the 4D TROSY MQ-HACANH experiment with the
44 kDa uniformly 15N,13C-labeled and fractionally (35%) deuterated BsCM. Provided that
sensitive sequential correlations are observed, the 4D TROSY MQ-HACANH experiment alone
is sufficient to assign backbone resonances. In this experiment both 'Ha and 13Ca chemical shifts
are used as reference for sequential connectivity assignment, which is less ambiguous and more
reliable than only 13Cn chemical shift, as used in the conventional HNCA experiment. Figure 3

97
illustrates the process of sequential assignment obtained for a difficult case of Thrl6, Glul7,
Glu18 and Glu19 repeat.
Overall, the sole use of the 4D TROSY MQ-HACANH spectrum allowed establishing the
sequential connectivities between 51 residues. The longest found continuous stretches of the
connected residues are Thrl6 to Glu34, Ala59 to Ser66, Trp68 to Val71 and ArglOS to Argll6.
For the other residues either only intraresidual cross-peaks were found due to the lower intensity
of the sequential cross-peaks (39 residues) or the corresponding strips were void of any cross-
peaks (15 residues). For 20 residues the found connectivities were ambiguous. The use of the 3D
HN(CA)HA in addition to the 4D TROSY MQ-HACANH spectrum helped to establish the
sequential connectivities for Arg4, Ile6, Lys38 and His54.
Combined use of the 3D TROSY-HNCA, 3D TROSY-HNCO with 3D MQ-
HACACO
The combined use of the 3D TROSY-HNCA, 3D TROSY-HNCO, 3D MQ-HACACO (Eletsky
and Pervushin 2002) experiments for residue specific assignment of the 'Hu, 'Hn, 15N,
13Caand13C backbone resonances is now effectively complemented by the 3D TROSY MQ-
HN(CA)HA and 3D TROSY MQ-HA(CA)NH experiments. The 3D HA(CA)NH experiment is a
reduced version of 4D HACANH of Fig. 1. In this method sequential connectivities derived from
weak sequential cross peaks in the 3D TROSY-HNCA experiments are replaced by strong one
bond 13ça.1:,c' correlation cross-peaks obtained from the MQ-HACACO experiment. As shown
in Fig. 4, sequential correlations between protein backbone resonances can be obtained by
1 ^
matching the C chemical shifts in the HNCO/MQ-HACACO pair of experiments, obtained
with sufficiently high resolution along the 13C dimension, with subsequent matching of the 13Ca
and 'Ha chemical shifts in the MQ-HACACO/MQ-HACANH or MQ-HACACO/ MQ-
HN(CA)HA experiments.

98
L21 L2I Q22 Q22 K.23 K23
i^Tl
4.'il
TV,1$
"HEdl)r*v
«-*-5=iLi?
Z<;
oïU'H«) < CIppml 3:
>- <!rt u
<pi ~
5i—
o
-r s
55-o
4
-
ü
£0^ *
•* A.--!
ü>2( 1\'il) ..»^
'B2P'
[ppml £-
<
*
65
.—\ 178.9 /•£ 179 3 181 2
ÎJ** .ffl!
S**ï^,.
1745
1 "'-y
c^t'-^cO)ûi
©C-
|ppm| s s
178
180
«ôs?..**
8 69 8.06
W3(>HN>[ppm]8 62
Figure 4. Method of assignment of the backbone 'H'\ l3C\ uCa and 15N resonance in uniformly l3C, l5N-
labeled and fractionally deuterated large proteins using a combination of 3D TROSY-HNCA (Salzmann et
al. 1998; Eletsky et al. 2001), 3D TROSY-HNCO (Salzmann et al. 1999b; Salzmann et al. 1999c), 3D
MQ-HACACO (Eletsky and Pervushin 2002) and 4D HACANH experiments (shown in red) of Fig. lb.
Arrows indicate a sequential walk through 2D l3Ca-'HN, 13C'-'HN, 13ca-13C and 'Ha-'HN strips taken at
the positions of the corresponding ,5N, 13Ca and 'Haresonances in 3D TROSY-HNCA, 3D TROSY-
HNCO, 3D MQ-HACACO and 4D HACANH spectra, respectively. The assignment relies mostly on the
connectivities shown by solid blue, green and magenta arrows. Occasionally the sequential connectivities
of TROSY-HNCA, shown by dashed green arrows, are used.

99
The assignment process begins with the identification of the intraresidual and sequential 13Ca and
l3C chemical shifts in HN strips taken from the TROSY-HNCA and TROSY-HNCO
experiments, respectively. The intraresidiual 'Ha chemical shifts are identified using the 3D
HA(CA)HN spectrum. If the 4D HACANH spectrum is available, the intraresidual 'H^and
l3Ca chemical shifts are found simultaneously and then 13Ca chemical shifts are verified using the
TROSY-HNCA spectrum. At the next stage, connectivities between HN strips are established
using 3D MQ-HACACO spectrum and verified for the cases where the sequential cross-peaks are
resolved in TROSY-HNCA (see Fig. 4). Thus connected HN strips are then mapped to the
primary sequence of protein using the program MAPPER (Guntert et al. 2000). At this point it is
very helpful to obtain the TROSY-HNCACB spectrum (Salzmann et al. 1999b) to reduce
ambiguities in mapping. Thus, the minimal set of the triple-resonance experiments includes 3D
TROSY-HNCA, 3D TROSY-HNCO performed with standard transfer delays (Cavanagh et al.
1996), 3D MQ-HACACO experiment and 3D HA(CA)NH experiment of Fig. 1. If spectrometer
time and sample stability permit, the 3D TROSY-HNCA and 3D HA(CA)NH experiments can be
replaced by the single 4D HACANH experiment.
An attractive feature of this method is the requirement of only one fully protonated or partially
deuterated protein sample to assign backbone resonances, which can be subsequently used for 3D
structure determination. For proteins with large correlation times but a relatively small number of
residues, such as membrane proteins embedded in micelles or oligomeric proteins this method
alleviates the need to acquire the low sensitivity 13Cot-constant-time TROSY-HNCA experiment
(Salzmann et al. 1999a) and two or more of time-consuming 4D TROSY-type triple-resonance
experiments (Konrat et al. 1999).
References
Cavanagh, J., Fairbrolher, W. J., Palmer, A. G. and Skelton, N. J. (1996) Protein NMR Spectroscopy: Principles and
Practice. New York, Academic Press.
Chook, Y. M., Gray, J. V., Ke, H. M. and Lipscomb, W. N. (1994) J. Mol. Biol., 240, 476-500.
Eletsky, A., Heinz, T„ Moreira, O., Kienhöfer, A., Hilvert, D. and Pervushin, K. (2002) J, Biomol NMR.
Eletsky, A„ Kienhöfer, A. and Pervushin, K. (2001) J. Biomol. NMR, 20, 177-180.
Eletsky, A. and Pervushin, K. (2002) J. Biomol. NMR.

100
Gardner, K. H. and Kay, L. E. (1998) Annu. Rev. Biophys. Biomolec. Struct., 27, 357-406.
Geen, H. and Freeman, R. (1991)./. Magn. Reson., 93, 93-141.
Grzesiek, S. and Bax, A. (1993) /. Am. Chem. Soc, 115, 12593-12594.
Grzesiek, S., Kuboniwa, H., Hinck, A. P. and Bax, A. (1995a) J. Am. Chem. Soc, 117, 5312- 5315.
Grzesiek, S., Wingfield, P., Stahl, S., Kaufman, J. D. and Bax, A. (1995b) J. Am. Chem. Soc, 117, 9594-9595.
Guntert, P., Dötsch, V„ Wider, G. and Wuthrich, K. (1992),/. Biomol. NMR, 2, 619-629.
Guntert, P., Salzmann, M., Braun, D. and Wuthrich, K. (2000) J. Biomol. NMR, 18, 129-137.
Konrat, R„ Yang, D. W. and Kay, L. E. (1999) J. Biomol. NMR. 15, 309-313.
Kontaxis, G., Clore, G. M. and Bax, A. (2000) J. Magn. Reson., 143, 184-196.
LeMaster, D. M. (1994) Prou. Nucl. Magn. Reson. Spectrosc, 26, 371-419.
Liu, M. L., Mao, X. A., Ye, C. H., Huang, H., Nicholson, J. K. and Lindon, J. C. (1998) /. Magn. Reson., 132, 125-
129.
Marion, D., Tkura, M., Tschudin, R. and Bax, A. (1989) J. Magn. Reson., 85, 393-399.
Mulder, F. A. A., Ayed, A., Yang, D. W., Arrowsmith, C. H. and Kay, L. E. (2000) /. Biomol. NMR, 18, 173-176.
Pervushin, K., Riek, R„ Wider, G. and Wuthrich, K. (1997) Proc Natl. Acad. Sei. U. S. A., 94, 12366-12371.
Pervushin, K., Wider, G. and Wuthrich, K. (1998) J. Biomol. NMR, 12, 345-348.
Salzmann, M., Pervushin, K., Wider, G., Senn, H. and Wuthrich, K. (1998) Proc. Natl. Acad. Sei. U. S. A., 95,
13585-13590.
Salzmann, M., Pervushin, K., Wider, G., Senn, H. and Wuthrich, K. (1999a) J. Biomol. NMR, 14, 85-88.
Salzmann, M., Wider, G., Pervushin, K., Senn, H. and Wuthrich, K. (1999b) J. Am. Chem. Soc, 121, 844-848.
Salzmann, M., Wider, G., Pervushin, K. and Wuthrich, K. (1999c) J. Biomol. NMR, 15, 181- 184.
Serber, Z., Richter, C. and Dotsch, V. (2001) Chembiochem, 2, 247-251.
Serber, Z., Richter, C, Moskau, D., Bohlen, J. M., Gerfin, T., Marek, D„ Haberli, M., Baselgia, L., Laukien, F.,
Stern, A. S., Hoch, J. C. and Dotsch, V. (2000) J. Am. Chem. Soc, 122, 3554-3555.
Shaka, A. J., Keeler, J., Frenkiel, T. and Freeman, R. (1983) .1. Magn. Reson., 52, 335-338.
Sban, X., Gardner, K. H., Muhandiram, D. R., Rao, N. S., Arrowsmith, C. H. and Kay, L. E. (1996) J. Am. Chem.
Soc, 118, 6570-6579.
Swapna, G. V. T., Rios, C. B., Shang, Z. G. and Montclione, G. T. (1997) J. Biomol. NMR, 9, 105-111.
Venters, R. A., Farmer, B. T., Fierke, C. A. and Spicer, L. D. (1996) J. Mol. Biol, 264, 1101- 1116.
Wuthrich, K. (1986) NMR ofProteins and Nucleic Acids. New York, Wiley.
Xia, Y. L., Kong, X. M., Smith, D. K., Liu, Y., Man, D. and Zhu, G. (2000) J. Magn. Reson., 143, 407-410.
Yamazaki, T., Lee, W., Arrowsmith, C. H., Muhandiram, D. R. and Kay, L. E. (1994) J. Am. Chem. Soc, 116,
11655-11666.
Yang, D. W. and Kay, L. E. (1999) J. Am. Chem. Soc, 121, 2571-2575.

101
Chapter IV
Side-chain H and C resonance assignment in partially deuterated proteins
using a new 3D 13C-detected HCC-TOCSY
Kaifeng Hu, Beat Vogeli and Konstantin Pervushin
Laboratorium für Physikalische Chemie, Swiss Federal Institute ofTechnology, ETH- Honggerberg, CH-8093
Zürich, Switzerland.

102
Seite Leer /
Blank leaf

103
Introduction: strategies of side chain assignment
Recently," C-detected NMR spectroscopy [2-5] has been proposed as an attractive alternative for
studying large macromolecules [1, 6], Thus, two-dimensional (2D) 13C-start and 13C-observe
TOCSY NMR experiments were successfully used for the assignment of side-chain aliphatic 13C-
resonances in a completely deuterated protein with a molecular weight of 44 kDa [1] and
11 1 ^
measurement of a number of C- C residual dipolar couplings [7], As the protein size increases,
the peak overlap becomes a significant problem, especially for monomeric proteins, which have a
large number of residues. Simultaneous multiple-band-selective homonuclear 13C- and 15N-
decoupling during both chemical shift evolution periods and signal acquisition can alleviate this
problem to some extent by simplifying the multiplet patterns (Vögeli et al., submitted). The
introduction of a third chemical shift dimension in a combination with extensive spin decoupling
is expected to offer further reduction in peak overlap.
Development of 3D in-phase and sensitivity enhanced HCC-TOCSY
Here, we propose a new 'H-start and 13C-observe 3D HCC-TOCSY for the unambiguous
resonance assignment of the side-chain *H and 13C resonances. This experiment extends 2D C-
13-start and C-13-observe TOCSY type experiments [1]. Introduction of the third lH dimension
to 2D TOCSY i) reduces the peak overlap and ii) increases the sensitivity per unit time, even for
highly deuterated ( > 85%) protein samples, which makes this new method also an attractive tool
for the side-chain H and C assignment of large partially deuterated proteins. This method is
demonstrated with a 16 kDa 15N,13C-labeled non-deuterated apo-CcmE and a 48 kDa uniformly
15N,13C-labeled and fractionally (-90%) deuterated dimeric sFkpA. It is predicted that this
method is suitable for the assignment of methyl 13C and *H chemical shifts of methyl protonated,
highly deuterated and ~C-labeled proteins with even higher molecular weight. 3D HCCH-
TOCSY experiments were designed for protonated proteins in order to correlate the chemical
shifts of H1, C1 and H', which is bonded to the adjacent nonfrequency-labeled C1 [8, 9].
Comparing to the HMCM[CG]CBCA and amino-acid specific HMCM(CGCBCA)CO "out-and-
back" experiments proposed by Kay and coworkers for assignment of methyl groups in a 723
residue protein [10], we expect that the 13C-detected "out-and-stay" HCC is better-suited and can

104
be regarded as a general route for the assignment of methyl 13C and lU chemical shifts for methyl
protonated, highly deuterated and 13C-labeled proteins with high molecular weight [11] [12]. A
comparison to a primary single-quantum 13C-detected 3D HCC-TOCSY reported on a protonated
14 kDa protein alluded to potential application of 13C-detected spectra [13] [1]. Here, we
correlate H1, C and Cj in large partially deuterated or protonated proteins. The use of the *H-13C
multiple-quantum coherence during the chemical shift labeling period for the indirect *H and 13C
dimensions offers more favorable relaxation properties compared to the 13C single-quantum
coherence, as demonstrated for the 13C'-detected 3D multiple-quantum-HACACO, 3D TROSY
multiple-quantum-HN(CA)HA and 4D TROSY multiple-quantum-HACANH experiments [14].
The main advantage of the proposed approach is a possibility to use the resolved 13C multiplet
pattern along the directly acquired dimension in order to match resonances from different strips.
Besides reducing the overlap by introducing the *H dimension, an additional advantage of this
H-start 3D experiment is a significant reduction of the interscan delay from 2.5 ms to less than 1
ms in comparison to its 13C-start 2D counterpart [1] due to faster equilibrium magnetization
recovery of *H compared to 13C in the 2H-13C moieties [15]. Neglecting transverse relaxation,
theoretically, this new 'H-start and 13C-observe 3D HCC-TOCSY can be expected to have
comparable sensitivity per unit time to its 13C-start and 13C-observe 2D version as follows:
T = (S/N)hcc/(S/N)cc=\^.Zl.P (1)
where (S/N)HCC and (S/N)cc are signal-to-noise ratio in 3D HCC-TOCSY and 2D CC-
TOCSY spectra, respectively. Tf and T" are longitudinal relaxation times for 13C and 'H, with
typical values for Tf of about 3- 4s and for T" of 0.5-Is. Yc and Yh are gyromagnetic ratios for
13C and ]H, P indicates the proton level in the partially deuterated protein sample. For 90%
deuterated protein samples, P is equal to 0.1, resulting T range from 0.7 to 1.1. Optimal
sensitivity for the given protein size could be obtained by varying the deuteration level [16]. In
the construction of HCC-TOCSY, we pursued two alternative goals resulting in two
complementary experiments. In the first experiment, referred further on as IP-HCC-TOCSY, a
clean, in-phase multiplet pattern in the directly acquired dimension is produced, facilitating
sequential matching of 2D strips in the process of resonance assignment. In the second
experiment, referred as SE-HCC-TOCSY (SE stands for "sensitivity-enhanced"), the spectral

105
sensitivity is maximized, which is achieved by relaxing the requirement of "in-phase" appearance
of the resulting 3D spectra in the directly acquired dimension.
4>l <j>3
| vl| l|!H iwr 2
+, +<
,3c^ihJJLdi
SE A,
WALTZ-16
FLOPSY-16
H WAIT/.-161/2H WALTZ-16
PFG (IP only)
Gi G!
Figurel. Pulse sequence of 13C-detected 3D-HCC TOCSY, the radio-frequency pulses on ]H, 13C and 2H
are applied at 2.5, 35 and 3.0 ppm, respectively. Narrow and wide bars indicate non-selective 90° and 180°
pulses (black pulses are applied in both experiments; white pulses are only applied in the indicated
experiment). 'H- and 2H- decoupling is achieved with WALTZ-16 [25] at a field strength around yBi = 2.5
kHz. Unless indicated otherwise, all radio-frequency pulses are applied with phase x. The phase cycle is:
fa = {X}; fa. = {x, -x, x, -x, x, -x, x, -x}; fa = {y, y, y, y, -y, -y, -y, -y }; <j>4 = {x, x, -x, -x }; fatc = {x, -x, x,
-x, -x, x, -x, x}. In the IP experiment: The delays are Ti = l/(2/Cc) = 14 ms, r2 = 1/(27Ch) = 4 ms. The
FLOPSY-16 mixing time is 16.96 ms at yB2 = 0.83 kHz. Pulsed field gradients indicated on the line
marked PFG are applied along the z-axis with duration of 0.9 ms and strength of 40 G/cm. Quadrature
detection in the indirect 13C (fj) dimension and 'H (t2) dimension is achieved by the States-TPPI method
[26] applied to the phases fa and fa, respectively. In the SE experiment: The delays are: t\ is set to
smaller than l/(27Cc) = 14 ms (depending on the relaxation properties of the multiple-quantum coherence),
T2 = 1/(1/Ch) = 4 ms. The FLOPSY-16 mixing time is shortened to 16.96/2 ms - 8.48 ms at yB2 = 0.83
kHz. Pulsed field gradients are not applied. A phase-sensitive spectrum in the indirect ]'C(ti) dimension is
obtained using the ECHO/ANTIECHO method by recording two FIDs for each h value with fa = {x} and
fa = {-x}, respectively. Quadrature detection in the !H (t2) dimension is achieved by the States-TPPI
method applied to the phase fa.

106
Figure 1 shows the experimental scheme of the 3D 13C-detected HCC-TOCSY. The initial *H
polarization is transferred to 13C by the INEPT step generating the 'H-13C multiple-quantum
coherence during the chemical shift labeling period for the indirect 13C(r;) and lH(t2)
dimensions. In the IP experiment, t\ is set to 14 ms = l/(2/Cc) in order to maximize the pure 13C
in-phase operator at the beginning of the FLOPSY-16 13C-13C mixing period [20]. The pulse field
gradients (PFG) are applied to select the in-phase operators before and after the TOCSY mixing.
It should be noted that even with PFG based operator selection homonuclear 13C zero-quantum
terms insensitive to PFG can survive[21, 22], resulting distortion of the pure in-phase appearance
of the crosspeaks [7, 23]. Currently no efforts are made to prevent this. After a 13C-read pulse,
the NMR signal is detected while decoupling of lH or 2H (for deuterated samples) spins. In the
SE-HCC-TOCSY experiment, we aim to minimize relaxation and to preserve all magnetization
transfer pathways. Therefore, zx is set to much less than 14 ms = l/(2/cc) (e.g. 5 ms was used in
the spectrum of Figure 4). No gradients are applied before and after the mixing period to retain a
superposition of in-phase and antiphase coherence significantly improving the signal-to-noise
ratio. The product operator description of the coherence transfer pathway is given by diagrams 2
and 3 for the IP and the SE experiment, respectively:
FLOPSY-16 >CJ^CJ[t]
H[ ->-H'v -*2H\C\ ->-2//;c;n(amE/2 + bmC'")[t[,t2]m
~^-Ci±ll(am\2Tl]E/2 + bm[2Tl]C'zn)tWPSY~* >CiU(c'E/2+ d'Clz)[t3]
(2)
(3)
IF and C stand for the spins of the hydrogen and carbon atom of the bond i, from which the
magnetization pathway starts. C stands for the directly detected carbon atom. Cm and C1 are spins
involved in the ./-coupled network of the spins C and Ö. Due to the coherence order selective
mixing achieved by isotropic FLOPSY sequence [24], the "minus" operators evolving during ti
are transferred exclusively to "minus" operators, which is used for signal acquisition. Quadruture
detection is achieved by flipping "plus" and "minus" operators with a 13C 180° pulse before
TOCSY mixing. The mixture of in-phase or antiphase operators of C and C with respect to Cm

107
(a) Val 80 3D IP-HCC-TOCSY (c)
3D TROSYHNCACB
Wn:126.1
»H»1 iH» W2CH) JBJ 2.28
30.0
40.0
w,(13Q[ppm]
50.0
60.0
9.52 59.5 34.4 22.1 21.2
Wlppm] 13C* "C? »C1 "O3
wi(nC)[ppni]
**
r-
iHai iH9ï1.16 1.22
59.5 34.4 22.1 21.2
13(2« ^C* "C51 "C9*
Wl(13C)[ppm]
(b) lie 84
3DTROSYHNCACB
Wfc:124.2
^j
3D IP-HCC-TOCSY
»H» W" »H«2 ^ wzOH)5.72 1.47 0.88 0.63 -«—fo^
*—
-20.0
30.0
w3(13Q[ppm]
40.0
-50.0
9.40 58.8 40.5 17.7 14.5
Wfopm] 13Ctt "C* W »CV
wi(13Ç)[ppm]
(d)
iH«5.72
58.8
Iff» Ijjgî1.47 0.88
40.5
"C"17.7
"C2
wi(13C)[ppm]
»H*0.63 -
—
'
*dL :'
-
__
:
H —.
'
.
—
"*
;
w2(»H)[ppm]
20.0
30.0
w3(13C)[ppm]
-40.0
50.0
14.5

108
Figure 2. H-C strips taken from the 3D 13C-detected IP-HCC-TOCSY spectrum and HN strips taken from
the 3D HNCACB spectrum for (a) Val80 and (b) Ile84 of apo-CcmE-His6. The corresponding indirect nC
chemical shifts and their bonded 'H chemical shifts are assigned and labeled for each strip. Diagonal
peaks are marked with asterisks. 13C" and 13Cß chemical shifts are aligned to corresponding assignmed
signals in the 3D HNCACB. Slices taken along the direct 13C dimension are shown in c and d. The region
of 20.5 - 22.5 ppm is magnified to present the resolved multiplets due to 7CC couplings. Alignment of the
splitting pattern resolved at the high resolution obtained in the directly detected 13C dimension, helps to
confirm the assignment of the spin systems. The side chain 'H and i3C chemical shifts of Val80 are
completely assignable. The spin system of Ile84 can be identified without difficulty although the strip
corresponding to H7l-CYl is not visible. The experiment was performed at 600 MHz. 75(fi) x 24(t2) x
2048(r3) complex points were accumulated, with flmax(indirect 13C) = 9.93 ms, t2taJ1}i) = 9.99 ms and
?3max(direct 3C) = 168.7 ms, the interscan delay of 1 s and 56 scans per increment resulted in a total
measurent time of 117 hours. The time domain data was multiplied with a cosine function in all
dimensions and zero-filled to 256 x 128 x 2048 complex points.
and C1 is reflected by the time-dependent coefficients am, bm and c\ d] with
^(am)2 +(b'")2 =land yj(c')2 + (d')2 =1, respectively. In general, the splitting pattern becomes
very complex due to the superposition of the in-phase and antiphase terms, as well as the
different spin networks.
Side-chain assignment
As an example for the application to a protonated protein, Figure 2 shows data from a spectrum
of the 3D 13C-detected IP-HCC-TOCSY measured on 16 kDa uniformly 15N,13C-labeled apo-
CcmE-His6. CcmE (Cytochrome c maturation heme chaperone protein E) is a heme chaperone
active in the cytochrome c maturation pathway of Escherichia coli, protecting the cell from
premature activities of the highly reactive metalloorganic cofactor, which could cause oxidative
damage.Uniformly 15N-, 13C-labeled apo-CcmE- His6 (residues 30-159) was expressed and
purified as described in [17J. The NMR sample contained 350 pi of 1 mM protein solution in 20
mM sodium phosphate buffer at pH = 6.0 containing in addition 300 mM NaCI. Figures 2a and b
show H-C strips from the 3D 13C-detected IP-HCC-TOCSY spectrum and HN strips from the 3D
HNCACB spectrum for Val80 and Ile84, respectively. After the sequence-specific backbone

109
(a) Leu 123
3HNCACBY 3D IP-HCC-TOCSY
WH 'ff1 iff ^ W-
122.14
SC»
«ente
3.83
»C« 13(J> 13(^g | 13çdl | 13Q02
^[ppm] WlC3C)[ppm]
iHaa
7.40 56.1 41.1 25.4 23.2 22.0
.W2('H)[ppm]
25.0
35.0
w3C3C)[Ppm]
45.0
55.0
(C)
'Ha iff» ^ »H31 »ff
«C* | °&
m
l3çg|j 13çdl [j 13ÇJ2
1.02
56.1 41.1 25.4 23.2
Wl(»C)[ppm]
W2CH)[ppm]
22.0
25.0
35.0
|w3(13Ç)[ppm]
-45.0
55.0
(b) Lys 154
3D TROSYHNCACB
,
wn iff»
122.66
V/.v
3D IP-HCC-TOCSY
iffj_jH^ iHd_ 1H"
7.82 57.0
Wfcpm]
w3(13C)[ppm]
31.4 22.5 27.7
Wi(13C)[ppm]
40.9
(d)
Jffi
r*pc*
iff» iHg 'Hd1J96
»W»
1.52
13C«] »CI
57.0 31.4 22-5 27-7
Wi(13C)tppm]
lg.
PC
.w2CH)[ppm]
25.0
35.0
w3(13C)IPPm]
145.0
[55.0
40.9

110
Figure 3. H-C strips taken from the 3D 13C-detected IP-HCC-TOCSY spectrum and HN strips taken from
the 3D HNCACB spectrum for (a) Leul23 and (b) Lys 154 of sFkpA- His6. The corresponding indirect 13C
chemical shifts and their bonded 'H chemical shifts are assigned and labeled for each strip. Diagonal
peaks are marked with asterisks. ,3Cn and 13Cß chemical shift are aligned to their assignments in the 3D
HNCACB. Slices taken along the direct 13C dimension are shown in c and d. The systems of both Leul23
and Lysl54 are completely assigned. Broken lines indicate negative peaks. The peaks from the strips of
I3Cß of Leul23 and the 13Cß, 13CY and 13C5 of Lys 154 are opposite in sign to the other strips, which further
confirms the assignment of the spin systems. The experiment was performed at 500 MHz. 75(f,) x 24(t2) x
2048(?3) complex points were accumulated, with flmiiX(indirect 13C) = 11.93 ms, t2waxCU) = 11.99 ms and
^max(direct KC) = 203 ms, the interscan delay of 1 s and 56 scans per increment resulted in a total
measurement time of 117 hours. The time domain data was multiplied with a cosine function in all
dimensions and zero-filled to 256 x 128 x 2048 complex points.
assignment, 13Ca and 13Cß chemical shifts can be aligned for identification of the side-chain spin
systems. The complete spin system of Val80 can be clearly recognized. In the case of Ile84, all
matching 2D H-C strips are found with the sole exception of the strip corresponding to y1 13C
resonance. As an application to a large highly deuterated protein, a 3D IP-HCC-TOCSY was
recorded on 0.8 mM uniformly 15N-,13C-,2H(~90%)-labeled dimeric 48 kDa sFkpA- His6. Figures
3a and b show the 2DH-C strips from the 3D IP-HCC-TOCSY spectrum and HN strips from the
3D HNCACB spectrum of the complete spin systems of Leu 123 and Lys 154. As shown in Figure
2, the'C" and 13CP chemical shifts can be aligned for identification of bonded H and C groups
belonging to the same residue. The sign of the peaks in the H-C strips reports on the number of
carbon neighbors helping the assignment. For example, the H-C strips for the ß of Leul23 and
the ß, y and 5 of Lysl54 are opposite in sign to those in the other strips[l].
The high sensitivity of the SE version of the 3D 13C-detected HCC-TOCSY was demonstrated on
the 16 kDa uniformly 15N,13C-labeled apo-CcmE-His6 sample. Figure 4a shows H-C strips from
the 3D 13C-detected SE-HCC-TOCSY spectrum for Ile84. Although the maximum of the
components may shift by up to several Hertz due to the mixture of the in-phase and antiphase
coherences and concomitant lineshape distortion, identification of spin systems is obtained with
little difficulty and the 13C and 13CP chemical shifts can still be aligned with the corresponding
signals from the HNCACB. Slices taken along the direct dimension are shown in Figure 4b. An

Ill
(a) ne 84 3D SE-HCC-TOCSY
iHdi
lHa5.72 1.47
(b)
lH»m*2 'H" „vim0.88 a63^"tPPl5
5'72
iff» iff* ^ m
1.47 0.88 0.63 -«-W "'
[ppm]
20.0 L
30.0
W3(13C)[ppm]
r 40.0
50.0
r -:* i *
*-
>* lr ir
-20.0
(c)
58.5 40.5 17.5 144 58.5 40.5 17.5 14.4
«c 130» 13çg2wi(13C)[ppm]
l3Cdi 13c* 130> 13ça2
w^Qfppm]13031
Figure 4. (a) H-C strips taken from the 3D ,3C-detected SE-HCC-TOCSY spectrum for Ile84 of apo-
CcmE-Hiss. The corresponding indirect 13C chemical shifts and their bonded 'H chemical shifts are
assigned and labeled for each strip. Diagonal peaks are marked with asterisks. Compared with Figure 2
(b), the much cleaner spectrum demonstrates the significant gain in signal-to-noise ratio compared to the
IP experiment, which facilitate the recognition of the spin systems, (b) Corresponding slices taken along
the direct 13C dimension (c) Expanded regions showing the distorted lineshape of the peaks due to the
mixture of in-phase and antiphase coherence. The experiment was performed at 600 MHz. 75(r0 x 26(t2) x
2048(f3) complex points were accumulated, with flmM(indirect I3C) - 9.93 ms, ^max^H) = 10.82 ms and
?3max(direct I3C) = 168.8 ms, the interscan delay of 1 s and 56 scans per increment resulted in a total
measurement time of 126 hours. The time domain data was multiplied with a cosine function in all
dimensions and zero-filled to 256 x 128 x 2048 complex points and Fourier transformation was applied in
power mode.
expansion shows the distorted multiplet patterns. Using approximately same measurement time
for the SE version as for IP-HCC-TOCSY, as a comparison of Figures 2d and 4b reveals, affords
approximate 8 times gain of signal-to-noise ratio.

112
In conclusion, the new method presented here can serve as an attractive alternative to the
standard H-detected side-chain H and C assignment strategies. High resolution and good
sensitivity can overcome problems associated with 13C-spectroscopy such as peak overlap.
Especially for proteins with high molecular weight that requires partial deuteration, this method
proved to be very useful as exemplified with the 48 kDa sFkpA. Because the recovery delay can
be considerably shortened, and due to the start on 'H instead of 13C, the experiment can yield
comparable or higher sensitivity per unit experimental time. In addition to chemical shifts, the
clear splitting pattern of the peaks along the directly detected 13C dimension in IP type 3D 13C-
detected HCC-TOCSY can also be used to identify and confirm peak alignment. If the splitting
pattern of the peaks is not of interest, the SE experiment can greatly increase the signal-to-noise
ratio. More sophisticated homonuclear decoupling can further increase the signal-to-noise ratio
(Vögeli et al., submitted). The very high sensitivity indicates that the measurement time can be
further shortened.
References
1. Eletsky A, Moreira O, Kovacs H, Pervushin K, A novel strategyfor the assignment of side-chain resonances in
completely deuterated large proteins using C-13 spectroscopy. J. Biomol. NMR, 2003. 26(2): p. 167-169.
2. Maudsley, A. A., L. Müller, and R. R. Ernst, Cross-Correlation of Spin-Decoupled Nmr-Spectra by
Heteronuclear 2-Dimensional Spectroscopy. J. Magn. Reson., 1977. 28(3): p. 463-469.
3. Chan, T. M., et al., C-13 Nmr Sub-Spectra of a Protein Based on the Number ofAttached Protons - Ferredoxin
from Anabaena-Variabilis. J. Am. Chem. Soc, 1982. 104(14): p. 4008-4010.
4. Westler, W. M., et al., Two-Dimensional Nmr Strategies for Carbon Carbon Correlations and Sequence-
Specific Assignments in C-13 Labeled Proteins. J. Am. Chem. Soc, 1988. 110(12): p. 4093-4095.
5. Oh, B. H., et al., Protein C-13 Spin Systems by a Single Two-Dimensional Nuclear Magnetic-Resonance
Experiment. Science, 1988. 240(4854): p. 908-911.
6. Bermel W, Bertini I, Felli IC, Kummerle R, Pierattelli R, C-13 direct detection experiments on the paramagnetic
oxidized monomeric copper, zinc superoxide dismutase. J. Am. Chem. Soc, 2003. 125(52): p. 16423-16429.
7. Vögeli B, Kovacs H, Pervushin K, Measurements of side-chain C-I3-C-13 residual dipolar couplings in
uniformly deuteratedproteins. J. Am. Chem. Soc, 2004. 126(8): p. 2414-2420.
8. Bax, A., G. M. Clore, and A. M. Gronenborn, H-l-H-1 Correlation Via Isotropic Mixing ofC-13 Magnetization,
a New 3-Dimensional Approach for Assigning H-l and C-13 Spectra of C-13-Enriched Proteins. J. Magn.
Reson., 1990. 88(2): p. 425-431.
9. Olejniczak, E. T., R. X. Xu, and S. W. Fesik, A 4d-Hcch-Tocsy Experiment for Assigning the Side-Chain H-l-
Resonance and C-13-Resonance ofProteins. J. Biomol. NMR, 1992. 2(6): p. 655-659.

113
10. Tugarinov, V. and L. E. Kay, lie, Leu, and Val methyl assignments ofthe 723-residue malate synthase G using a
new labeling strategy andnovelNMR methods. J. Am. Chem. Soc, 2003. 125(45): p. 13868-13878.
11. Gardner, K. H. and L. E. Kay, Production and incorporation ofN-15, C-13, H-2 (H-l-delta I methyl) isoleucine
into proteinsfor multidimensional NMR studies. J. Am. Chem. Soc, 1997. 119(32): p. 7599-7600.
12. Goto, N. K., et al., A robust and cost-effective method for the production of Val, Leu, lie (delta 1) methyl-
protonatedN-15-, C-13-, H-2-labeledproteins. J. Biomol. NMR, 1999. 13(4): p. 369-374.
13. Serber, Z., C. Richter, and V. Dotsch, Carbon-detected NMR experiments to investigate structure and dynamics
of biological macromolecules. Chembiochem, 2001. 2(4): p. 247-251.
14. Hu KF, Eletsky A, Pervushin K, Backbone resonance assignment in large protonated proteins using a
combination ofnew 3D TROSY-HN(CA)HA, 4D TROSY-HACANH and C-13-detected HACACO experiments. J.
Biomol. NMR, 2003. 26(1): p. 69-77.
15. Pervushin, K., B. Vogeli, and A. Eletsky, Longitudinal H-l relaxation optimization in TROSY NMR
spectroscopy. J. Am. Chem. Soc, 2002. 124(43): p. 12898-12902.
16. Richter, G., et al., NMR studies on the 46-kDa dimeric protein, 3,4-dihydroxy-2- butanone 4-phosphate synthase,
using H-2, C-13, and N-15- labelling. Eur. J. Biochem., 1999. 261(1): p. 57-65.
17. Enggist E, Thony-Meyer L, Guntert P, Pervushin K, NMR structure of the heme chaperone CcmE reveals a
novelfunctional motif. STRUCTURE, 2002. 10(11): p. 1551-1557.
18. Hu KF, Pluckthun A, Pervushin K, Letter to the Editor: Backbone H-N, N, C-alpha, C'
and C-beta chemical
shift assignments and secondary structure of FkpA, a 245-residue peptidyl-prolyl cis/trans isomerase with
chaperone activity. J. Biomol. NMR, 2004. 28(4): p. 405-406.
19. Delaglio, F., et al., Nmrpipe - a Multidimensional Spectral Processing System Based On Unix Pipes. J, Biomol.
NMR, 1995. 6(3): p. 277-293.
20. Kadkhodaie, M., et al., Broad-Band Homonuclear Cross Polarization Using Flip-Flop Spectroscopy. J. Magn.
Reson., 1991. 91(2): p. 437-443.
21. Sorensen, O. W., M. Rance, and R. R. Ernst, Z-Filters for Purging Phase-Distorted or Multiplet-Distorted
Spectra. J. Magn. Reson., 1984. 56(3): p. 527-534.
22. Braunschweiler, L. and R. R. Ernst, Coherence Transfer by Isotropic Mixing - Application to Proton
Correlation Spectroscopy. J. Magn. Reson., 1983. 53(3): p. 521-528.
23. Kramer, F., B. Luy, and S. J. Glaser, Offset dependence of homonuclear Hartmann-Hahn transfer based on
residual dipolar couplings in solution state NMR. Appl. Magn. Reson., 1999. 17(2-3): p. 173-187.
24. Parella, T., A complete set of novel 2D correlation NMR experiments based on heteronuclear J-cross
polarization. J. Biomol. NMR, 2004. 29(1): p. 37-55.
25. Shaka, A. J„ J. Keeler, and R. Freeman, Evaluation ofa New Broad-Band Decoupling Sequence - Waltz-16. J.
Magn. Reson., 1983. 53(2): p. 313-340.
26. Marion, D. and A. Bax, Baseline Correction of 2d Ft Nmr-Spectra Using a Simple Linear Prediction
Extrapolation of the Time-Domain Data. J. Magn. Reson., 1989. 83(1): p. 205-211.

Appendix
A.l Table 1 BBP of OmpA: DNA sequence and amino acid sequence
DNA sequence (Complimentary strand) Result of translation
ATGCCGAAAGATAACACC Mot P K D N T
TGGTACACTGGTGCTAAACTGGGCTGGTCCCAGTAC WYTGAK.LGWSQY TM1
TCTAGAGAA SRE Ll
AACCAACTGGGCGCTGGTGCrrTTGGTGGTTACCAGGTT NQLGAGAFGGYQV TM2
AACCCGTAT NPY Tl
GTTGGCTTTGAAATGGGTTACGACTGGTTAGGTCGTATG V G FE MM G Y DW LG R Met TM3
CCTAGGAAA PRK L2
GCTCAGGGCGTTCAACTGACCGCTAAACTGGGTTAC AQGVQLTAKLGY TM4
CCCAAGCTTGGGACTGACGAC PKLGTDD T2H1
CTGGACATCTACACTCGTCTGGGTGGCATGGTATGGCGTGCA LDIYTRLGGMctVWRA TM5
GACACTAGT DTS L3
GTTTCTCCGGTCTTCGCTGGCGGTGTTGAGTACGTGATC VSPVFAGGVEYV1 TM6
CGTCGACGGATCACTCCTGAA RRRITPE T3S1
ATCGCTACCCGTCTGGAATACCAGTGGACCAACAAC IATRLEYQWTNN TM7
GCTAGCGAC ASD LA
AACGGTATGCTGAGCCTGGGTGTTTCCTACCGTTTC N G Met L S L G V S Y R F TM8
GGTCAGGGCGAGGCAGCTTGA G Q G E A A stop
TMl-8: transmembrane ß-strands, Ll-4: extracellular loops, Tl, T2H1 and T3S1 : periplasmic turns

115
A.2 Table 2 Backbone HN, N, Ca, C and Cß chemical shift assignments of
FkpA
Number Residue H N CA CB CO
1 ALA
2 GLU- 55.50 29.20 176.132
3 ALA 8.415 126.499 51.62 18.52 177.357
4 ALA 8.239 124.187 51.62 18.52 177.478
5 LYS+ 8.255 122.645 53.50 31.47 174.725
6 PRO 62.32 30.92 176.835
7 ALA 8.412 124.958 52.06 18.41 178.101
8 THR 8.042 113.589 60.59 69.56 174.565
9 ALA 8.280 126.692 52.29 18.41 177.799
10 ALA 8.132 122.969 52.29 18.41 177.853
11 ASP- 8.075 119.376 53.76 40.47 176.427
12 SER 8.129 117.190 58.40 62.72 174.920
13 LYS+ 8.257 123.279 55.96 31.56 176.487
14 ALA 7.957 124.520 51.73 18.32 177.150
15 ALA 7.845 123.539 52.00 18.95 176.929
16 PHE 7.721 116.683 56.46 40.42 176.246
17 LYS+ 8.705 121.974 57.24 33.01 176.266
18 ASN 7.439 110.636 51.87 39.49 175.663
19 ASP- 8.764 120.076 56.71 40.15 178.456
20 ASP- 8.327 123.946 57.47 39.10 179.862
21 GLN 8.205 121.498 59.19 29.42 177.110
22 LYS+ 7.445 119.533 59.19 32.25 178.134
23 SER 8.252 114.546 62.40 174.599
24 ALA 7.086 122.514 54.68 19.41 178.174
25 TYR 7.854 118.596 61.28 38.50 177.973
26 ALA 8.502 120.034 55.03 17.35 178.978
27 LEU 8.073 120.009 57.99 40.87 175.081
28 GLY 8.104 108.026 47.46 175.041
29 ALA 9.907 125.526 53.98 16.85 180.364
30 SER
31 LEU 57.60 179.480
32 GLY 8.982 107.901 47.34 175.302
33 ARG+ 8.531 122.429 58.02 28.57 178.717

116
Number Residue H N CA CB CO
34 TYR 7.933 121.439 61.15 37.95 177.110
35 MET
36 GLU- 55.78 32.38 176.667*
37 ASN 8.265 121.695 54.04 40.87 176.507
38 SER 8.806 115.562 58.06 63.69 174.478
39 LEU 8.263 122.609 54.44 40.88 176.366
40 LYS+ 8.134 121.908 56.55 29.42 180.284*
41 GLU-
42 GLN 58.08 28.56 177.15*
43 GLU- 8.339 121.905 59.51 32.58 181.288
44 LYS+ 7.446 120.324 58.60 31.59 177.893
45 LEU 7.390 117.073 53.82 41.66 177.190
46 GLY 7.839 107.025 44.91 173.835
47 ILL 7.507 123.157 60.37 38.24 174.177
48 LYS+ 8.572 130.391 54.17 32.18 175.422
49 LEU 8.359 124.658 53.47 42.52 176.333
50 ASP- 7.721 121.278 53.62 41.66 176.875
51 LYS+ 8.606 128.494 59.44 31.85 177.893
52 ASP- 8.157 118.621 56.94 39.62 180.163
53 GLN 7.780 120.259 56.94 28.29 177.672
54 LEU 7.356 121.773 58.45 41.73 179.153
55 ILE 7.624 117.478 62.74 36.46 177.391
56 ALA 7.694 124.378 54.88 18.70 179.460
57 GLY 7.924 106.179 46.48 175.683
58 VAL 7.368 121.445 66.15 31.07 177.833
59 GLN 8.299 117.300 58.92 28.23 179.922
60 ASP- 8.997 120.502 56.45 38.61 179.239
61 ALA 8.079 122.915 55.10 18.98 181.449
62 PHE 8.144 118.938 59.24 38.24 176.145
63 ALA 7.368 119.906 50.94 19.01 176.145
64 ASP- 7.866 117.809 54.92 38.93 175.422
65 LYS+ 8.409 117.759 53.99 32.52 176.306
66 SER 8.806 114.176 58.93 63.87 177.933
67 LYS+ 9.236 127.530 57.55 32.76 175.603
68 LEU 7.670 116.018 51.95 45.31 176.909

117
Number Residue H N CA CB CO
69 SER 9.526 121.647 56.60 64.24 174.297
70 ASP- 9.036 122.332 57.93 38.67 179.159
71 GLN 8.422 119.872 59.18 27.83 178.456
72 GLU- 7.763 121.054 59.02 30.17 181.228
73 ILE 8.864 124.615 66.95 37.45 177.029
74 GLU- 7.793 119.579 59.44 28.94 179.641
75 GLN 8.275 118.235 58.71 28.30 179.641
76 THR 8.249 118.525 66.95 67.82 177.270
77 LEU 8.665 123.367 57.99 39.82 179.601
78 GLN 8.230 120.946 59.18 27.58 179.440
79 ALA 7.632 123.004 54.36 16.71 180.525
80 PHE 8.441 122.389 60.94 38.50 176.893
81 GLU- 8.620 119.880 59.24 28.56 178.964
82 ALA 7.470 120.846 54.44 17.10 180.344
83 ARG+ 7.866 120.469 58.60 31.92 175.081*
84 VAL 62.73 31.32 177.082*
85 LYS+ 8.324 122.125 55.82 32.45 176.808
86 SER 7.720 122.088 59.18 64.58 175.904*
87 SER 7.836 123.600 59.44 64.68
88 ALA
89 GLN 55.43 30.08 176.045
90 ALA 8.229 127.066 50.29 17.89 175.543
91 LYS+ 57.27 32.05 177.872*
92 MET 8.042 122.297 53.99 29.68 178.636*
93 GLU- 8.312 125.429 56.02 32.25 176.748
94 LYS+ 8.317 121.370 56.68 29.55 177.411
95 ASP- 8.323 121.026 55.23 40.48 177.307
96 ALA 7.927 123.648 52.92 18.29 178.556
97 ALA 7.992 122.757 52.92 18.29 181.148
98 ASP- 8.564 122.188 56.90 40.35 178.889
99 ASN 8.567 119.478 55.76 41.53 179.139
100 GLU- 7.953 122.777 57.74 28.33 178.436
101 ALA 7.995 124.733 55.06 18.80 181.409
102 LYS+ 8.365 118.805 58.62 32.12 180.806
103 GLY 8.654 110.723 47.57 175.583

118
Number Residue H N CA CB CO
104 LYS+ 8.495 124.346 60.08 32.15 178.476
105 GLU- 7.443 118.201 59.18 29.06 178.837
106 TYR 8.006 120.298 61.67 38.69 178.837
107 ARG+ 8.837 118.979 60.41 29.43 178.054
108 GLU- 8.249 118.131 59.05 28.82 179.139
109 LYS+ 7.689 119.611 58.98 32.39 180.083
110 PHE 8.201 122.907 59.98 38.81 176.527
111 ALA 7.850 115.790 53.25 17.97 177.913
112 LYS+ 6.931 114.894 55.62 32.15 177.719
113 GLU- 7.513 121.289 56.05 28.26 176.855
114 LYS+ 8.305 122.934 57.38 31.03 178.315
115 GLY 8.664 112.887 44.54 173.795
116 VAL 7.199 122.641 62.36 30.03 175.784
117 LYS+ 8.525 128.197 53.62 34.13 174.117
118 THR 7.972 114.295 60.45 69.79 175.523
119 SER 9.447 123.376 55.72 64.02 177.190
120 SER 8.874 120.618 60.94 62.88 175.801
121 THR 8.245 112.968 62.03 68.67 175.764
122 GLY 7.697 108.236 43.43 J73.815
123 LEU 7.397 122.138 56.16 41.10 174.297
124 VAL 8.161 129.166 60.37 33.58 175.282
125 TYR 9.271 121.853 55.12 41.93 172.088
126 GLN 9.245 121.940 53.17 33.10 175.081
127 VAL 9.228 130.022 64.76 30.79 175.322
128 VAL 8.350 133.431 64.30 31.92 176.427
129 GLU- 7.997 119.621 55.10 32.58 175.623
130 ALA 8.778 127.876 55.10 19.12 179.038
131 GLY 8.156 102.901 43.65 172.891
132 LYS+ 8.455 118.403 55.27 34.72 175.061
133 GLY 8.298 110.750 44.16 172.831
134 GLU- 8.439 123.723 54.94 30.14 176.145
135 ALA 8.370 125.737 49.22 17.42 176.085
136 PRO 62.11 31.90 174.799
137 LYS+ 9.005 121.001 53.43 33.73 177.270
138 ASP- 8.097 118.305 58.22 41.52 174.558
139 SER 7.212 105.375 57.30 63.47 174.799

119
Number Residue H N CA CB CO
140 ASP- 7.857 123.327 54.72 40.55 176.246
141 THR 8.367 117.126 62.25 69.00 173.654
142 VAL 8.815 120.985 57.82 32.47 172.992
143 VAL 7.597 121.669 60.42 32.58 176.929
144 VAL 9.233 118.600 58.01 34.90 175.362
145 ASN 8.308 117.545 51.16 41.75 174.446
146 TYR 8.824 115.912 56.20 41.88 171.826
147 LYS+ 8.595 118.287 55.05 35.46 175.121
148 GLY 8.783 113.896 44.54 172.067
149 THR 9.404 ] 17.969 58.71 71.66 174.217
150 LEU 8.494 120.194 53.06 39.89 181.529
151 ILE 9.383 116.639 64.35 36.45 176.668
152 ASP- 7.528 119.117 52.73 39.44 177.391
153 GLY 7.961 108.475 44.09 174.337
154 LYS+ 7.818 122.658 56.60 31.35 176.266
155 GLU- 8.621 128.245 56.31 31.07 176.607
156 PHE 56.03 174.860
157 ASP- 7.056 120.588 54.39 42.88 174.799
158 ASN 8.159 122.313 52.95 38.56 175.462
159 SER 8.824 122.019 60.48 61.81 176.427
160 TYR 8.298 126.039 60.55 35.01 180.163
161 THR 7.615 112.801 64.02 67.63 176.306
162 ARG+ 7.098 119.417 57.27 30.14 177.652
163 GLY 7.609 106.252 45.20 173.333
164 GLU- 7.091 118.622 52.51 31.25 172.690
165 PRO 62.22 31.94 175.864
166 LEU 8.635 123.531 53.72 44.77 175.241
167 SER 8.196 118.810 55.71 64.12 174.317
168 PHE 8.323 120.701 55.71 40.28 173.675
169 ARG+ 8.502 122.823 55.59 30.40 179.380
170 LEU 8.582 128.739 58.49 40.00 176.587
171 ASP- 8.089 115.723 53.17 38.67 177.210
172 GLY 8.355 107.452 44.98 174.498
173 VAL 6.563 112.230 59.24 33.76 174.840
174 ILE 6.899 111.716 59.55 35.85 175.683

120
Number Residue H N CA CB CO
175 PRO 65.08 34.49 179.862
176 GLY 9.005 102.748 47.43 175.724
177 TRP 7.837 120.861 60.00 30.40 176.909
178 THR 7.740 117.664 66.70 68.68 174.458
179 GLU- 7.954 115.739 57.86 29.43 179.741
180 GLY 7.616 105.544 48.10 175.503
181 LEU 8.407 118.451 56.31 39.67 175.663
182 LYS+ 6.592 112.379 58.15 31.47 177.049
183 ASN 7.201 113.727 53.94 39.00 174.016
184 ILE 7.304 112.996 59.48 42.65 171.585
185 LYS+ 7.550 114.742 53.06 34.13 175.985
186 LYS+ 7.935 120.881 60.04 32.12 176.306
187 GLY 8.703 116.318 44.54 175.583
188 GLY 8.876 109.924 44.20 171.907
189 LYS+ 9.260 118.737 54.83 36.56 174.980
190 1LE 9.310 125.344 58.60 42.77 170.641
191 LYS+ 8.853 129.418 54.27 33.46 175.703
192 LEU 9.613 125.557 52.88 44.86 174.599
193 VAL 9.517 125.988 61.89 31.40 174.599
194 ILE 9.529 126.179 59.05 39.92 173.675
195 PRO
196 PRO 64.24 29.70 180.103
197 GLU- 9.848 119.823 58.72 27.27 177.773
198 LEU 7.631 118.891 52.73 41.55 174.498
199 ALA 7.708 125.771 50.96 18.07 175.422
200 TYR 8.557 122.314 58.49 37.34 176.849
201 GLY 8.388 107.879 45.86 175.041
202 LYS+ 8.641 125.050 58.04 31.42 176.808
203 ALA 8.222 118.599 52.84 18.52 179.862
204 GLY 7.290 103.205 44.29 172.148
205 VAL 7.650 115.072 58.73 31.80 173.353
206 PRO 65.44 29.82 177.491
207 GLY 8.387 113.556 44.77 173.474
208 ILE 8.400 121.497 57.42 40.48 173.293
209 PRO
210 PRO

121
Number Residue H N CA CB CO
211 ASN 52.83 174.518
212 SER 7.857 114.349 60.22 63.12 174.197
213 THR 8.663 124.841 62.62 68.99 173.233
214 LEU 8.416 125.203 52.34 44.50 175.041
215 VAL 8.619 122.926 60.52 30.58 176.045
216 PHE 9.806 123.407 55.32 43.10 174.880
217 ASP- 8.740 123.511 54.08 42.87 176.286
218 VAL 9.041 123.842 60.93 33.69 174.036
219 GLU- 9.165 127.974 54.33 32.11 174.558
220 LEU 8.420 127.616 53.62 42.14 174.634
221 LEU 8.993 129.296 56.34 41.90 177.933
222 ASP- 7.797 114.032 52.84 43.10 173.634
223 VAL 8.301 121.229 61.14 34.46 174.337
224 LYS+ 9.345 128.400 52.06 32.47 173.233
225 PRO 61.68 31.72 177.029
226 ALA 8.522 126.294 50.16 17.30 176.326
227 PRO 62.25 31.77 176.931*
228 LYS+ 8.264 122.067 55.50 31.77 176.594
229 ALA 8.320 126.307 51.95 18.52 177.478
230 ASP- 8.201 119.948 53.50 40.33 175.871
231 ALA 7.989 124.572 51.73 18.06 177.297
232 LYS+ 8.238 122.645 53.44 31.49 175.489*
233 PRO 62.47 30.87 177.277
234 GLU- 8.458 121.489 56.24 29.25 176.634
235 ALA 8.240 125.150 52.33 18.41 177.739
236 ASP- 8.175 119.755 53.88 40.38 176.574
237 ALA 8.143 125.343 52.77 18.11 178.442
238 LYS+ 8.142 119.562 56.31 31.46 177.237
239 ALA 8.002 124.765 52.48 18.33 178.422
240 ALA 8.130 123.031 52.67 18.06 178.322
241 ASP- 8.124 119.562 54.60 40.47 177.056*
242 SER 8.079 116.479 58.60 62.58 175.086
243 ALA 8.066 124.958 52.62 18.18 178.442
244 LYS+ 7.813 118.984 56.38 31.58 177.056
245 LYS+ 7.878 120.911 56.05 31.69
Data are from FkpA (in bold) and sFkpA (in plain) samples, respectively. Assignments marked with asterisk were not unambigously determined.

122
A.3 Linear least-squares fitting of RDCs
The theoretical dipolar coupling D^heo for a certain dipolar vector NHi in the absence of internal
motions of the molecule, i.e with order parameter S = 1 (or with a certain generalized order
parameter S2 for internal motion of the vector N-H) can be expressed using irreducible tensor
notation by a set of linear equations 11 ] :
A3L«W) = (4W5)1/2£ £< D\(Ci) >Y2m{dl,<t>i)m=-2,2
= (Axi5r2kJjsj2m(elA) (D
m=-2,2
m=-2,2
where D2n0{Q.) are elements of the Wigner rotation matrix for Euler angles Q, - (a, ß, y) of the
molecule with respect to the laboratory frame, which have properties Dfn0 (Q.) = (~l)m D2m0 (Q).
< > represents an ensemble average over the orientations of the molecule, which incorporates the
information about strength and shape of the alignment tensor, k = S f, ,
with the
8x-rNH
assumption that the order parameter S2 and rNH are constant, k is a constant which subsumes the
dipolar interaction energy and an overall order parameter, the spherical harmonics Y2m, and ($, 8,)
are the polar angles of the dipolar vector NHj in the molecular frame, and Sm is an irreducible
representation of the Saupe order matrix with S*m - (-l)mS_m. The five independent parameters
Sm relate to the five independent elements of the traceless, symmetric Saupe order matrix by a
linear transformation:
Sxx=éU2(S2+S_2)-S0/28
5,>--^),/2(52+S-2)-V2sa = So
1 (2)
Sxy=Syx=-i(-)U2(S2-S_2)o
'
^=^=-/(|)1,2(5,+S_I)Equation (1) can be written explicitly in matrix form:

123
D2
vAy
X-2(^i) r2,-i(0iM) Y2fi(0ith) Y^io^) Y^e^S
Y2,„2(.e2,4>2) Y2^(e2,<p2) Y2iO(02,02) Y2M(S2,<f>2) Y2t+2(02,</>2)
*-2
*+l
(3)
\A+2jy2.-2(0, A) Y^(0,^) YM(e„h) Y2M(0t,^) Y^A)
In brief form,
D = Y*A (4)
Linear least-squares fitting can be applied by solving:
(X'»D) = (Y'»Y)*Ä (5)
where Y - (Y*)T .Once the constants Am = (4n/5)mkSm are calculated from the measured
couplings and the molecular coordinates by a linear least-squares fit, Aap = kSap can be calculated
with equation (2). The principal axis system (PAS) and eigenvalues of Aap can then be derived by
standard methods of linear algebra.
Back calculation of RDCs
The individual dipolar coupling Dlitneo (in Hz) for a given NHi dipolar vector (tp, 9) can be
calculated from Azz and rhombicity r\ by:
DM) = Azz(-3cos26>-l A
+—sin 0cos20)2
(6)
where Axx, Ayy, and Azz are the main axis components of Cartesian alignment tensor in the
principle axis system (PAS), Axx| < |Ayy| < |AZZ |, Axx4- Ayy + Azz =0 and 0 < Ar = (Axx - Ayy)/Az
<1, or by [2] [3]:
LmLlBAa (3cos2#-1 {
3
%7t*rL °
2 4
flX^W^f^Aar"V 1+47sin2gcos2^) (7)'NH
where S is the generalized order parameter for internal motion of the vector N-H, |Xo is the
magnetic permeability of vacuum, Yn and Yh are the magnetogyric ratios of nuclei N and H, h is
Planck's constant, rNH is the distance between nuclei N and H, and 6 and § are spherical
coordinates describing the orientation of the N-H vector in the principal axis system(PAS) of A.
Values for Aa and r\ describe the amplitude and the shape of the alignment tensor. The degree of
alignment is adjusted to yield an value of Aa of about 103.
Comparison equation of (6) and (7) gives:

124
rNrHßoh
Sx'r,
2A_
3_3Aa, r, = ^~
= 2{Axx-Ayy)l3Az (8)
NH
In weakly aligned medium, Az/ is on the order of about 10 Hz as the amplitude of the alignment
tensor Aa is adjusted to about 10"3.
Linear least-squares fitting of RDCs for homodimeric molecules
Linear least-squares fitting of RDCs as in equation (5) is carried outin complex space. Equation
(3) can be rewritten in five dimensional real space as:
D:
2A, 2Ä 2C, - 20, \
2An -2B7 2C2 -2D, £,
2A,. 2B, 2C; -2D,
Ct\
T5
(9)
.VV'-V
by linear transformation of the molecular coordinates:
Y2,+2 =A + iB, Y2,+1 = C+iD, Y2,o = E, Y2rl = -C + i D, Y2,.2 =A-iB
and of the tensor components:
A+2 = T, + i T2,A+I = T3 + i T4,A0 = T5,A ., =- T3 + i T4, A.2 = T} - i T2,
Similarly, in brief form,
D = X»T
(10)
(11)
(12)
where X is a matrix containing the structural information and f is the alignment tensor in real
space.
Similarly, linear least-squares fitting is obtained by solving:
(X •D) = (i'»X)*f (13)
For homodimeric molecules, such as FkpA, measured RDCs are assumed to correspond to the
average value of RDCs from two different subunits / and r.
DUheo=(Dltheo+D[lhJ/2 (14)
If the molecule is rigid, the whole molecule can be aligned with a single tensor, with an average
matrix X containing the structural information from both subunits / and r.
X =(X' +Xr)/2 (15)

125
If there is intramolecular relative mobility between subunits / and r, subunits / and r are assumed
to be independent in the alignment medium. In this case, D'j[heo and Drithei> should be calculated
from two independent alignment tensors T' and Tr, respectively. Equation (9) can be expanded as:
Dn
yDtj
f2A\
2Â2
2B\ 2C'i -2D'i E\ 2Ar} -2B\ 2C\ -2D'i £r>
2D'2 E'22Ar2 -2Br2 2C2 -2Dr2 E\
1 i
2B' 2 2Cl2
2A'i -2B't 2C't -2D'i É, 2A\ -2Bri 2d -2Drt Ert
r,
r-pl10
(16)
where superscripts / and r stands for two different subunits / and r. Linear least-squares fitting is
then similar to equations (12) and (13) but in a 10 dimensional real space. Tensor components for
subunits / and r in irreducible tensor notation can be recovered using equation (11). The principal
axis system (PAS) and eigenvalues of T' and Tr can then be derived by standard methods of
linear algebra for each domain, respectively. It should be noted that in the case of a homodimer,
linear least-squares fitting can not be done in complex space by expansion of equation (4) to 10
dimensions because the solution to equation (5) in the 10 dimensional complex space may no
longer have the properties required by the traceless, symmetric Saupe order matrix in the
irreducible representation, i.e. S*m = (-l)mS.m, which is mathematically correct but is not a
physically meaningful tensor.
References
1. Sass, J., et al., Purple membrane induced alignment of biological macromolecules in the magnetic field. J. Am.
Chem. Soc, 1999.121(10): p. 2047-2055.
2. James H. Prestegard, J.R.T., Hashim M, Al-Hashimi, and Michael Andrée, Structure Computation and
Dynamics In Protein NMR. Biological Magnetic Resonance, edited by Krishna and Berliner. Kluwer Academic /
Plenum Publishers, New York, 1999., 17: p. 314-320.
3. Vögeli B, K.H., Pervushin K, Measurements of side-chain C-13-C-13 residual dipolar couplings in uniformly
deuterated proteins. J. Am. Chem. Soc, 2004. 126(8): p. 2414-2420.

126
Seite Leer /
Blank leaf

127
Curriculum vitae
Personal Data:
Name: Kaifeng Hu
Date of birth: Feb. 19, 1974
Place of birth: Hubei, People's Republic of China
Citizenship: China
Education:
1991 - 1995 School of Pharmaceutical Science, Beijing Medical University.
Beijing, People's Republic of China.
Degree: Bachelor of Science
1995- 1998 Shanghai Institute of Materia Medica, Chinese Academy of Sciences.
Shanghai, People's Republic of China.
Degree: Master of Science
1998 - 2000 School of Pharmacy, University of Maryland at Baltimore.
Baltimore, Maryland, U. S. A.
Ph.D study, PhD Candidate.
2000 - 2004 Institute of Physical Chemistry, Swiss Federal Institute of Technology.
Zurich, Switzerland.
Degree (to be awarded): Doctor of Science.
Publications:
Kaifeng Hu, Alexander Eletsky and Konstantin Pervushin, (2003) J. Biomol NMR, 26 (1), 66-77.
Kaifeng Hu, Andreas Plückthun and Konstantin Pervushin, (2004) J. Biomol NMR, 28 (4), 405-
406.
Thereza Soares, Markus Christen, Kaifeng Hu and Wilfred F. van Gunsteren, Alpha- and beta-
polypeptides show a different stability of helical secondary structure, (2004) Tetrahedron, 60,
7775-7780


![TROSY, transverse relaxation-optimized spectroscopycomplexity of the NMR spectra, both of which increase with increasing molecular size [16-19]. The use of TROSY [20] together with](https://img.pdfslide.net/doc/110x75/5f085b387e708231d4219adf/trosy-transverse-relaxation-optimized-complexity-of-the-nmr-spectra-both-of-which.jpg)