Embed Size (px)
Citation preview

Research Collection
Doctoral Thesis
The Drosophila PGC-1 homologue Spargel coordinatesmitochondrial biogenesis to insulin-signalling
Author(s): Tiefenböck, Stefanie Katharina
Publication Date: 2009
Permanent Link: https://doi.org/10.3929/ethz-a-005831335
Rights / License: In Copyright - Non-Commercial Use Permitted
This page was generated automatically upon download from the ETH Zurich Research Collection. For moreinformation please consult the Terms of use.
ETH Library

DISS. ETH NO. 18351
THE DROSOPHILA PGC-1 HOMOLOGUE SPARGEL COORDINATES MITOCHONDRIAL BIOGENESIS TO
INSULIN-SIGNALLING
A dissertation submitted to
ETH ZURICH
for the degree of
Doctor of Sciences
presented by
STEFANIE KATHARINA TIEFENBÖCK Mag. rer. nat., University of Vienna
29. Oktober 1980
Austria
Accepted on the recommendation of
Prof. Dr. Christian Frei
Prof. Dr. Wilhelm Krek
Prof. Dr. Pierre Léopold
Prof. Dr. Walter Wahli
2009

Ph.D. Thesis
INDEX
ABSTRACT 3
ZUSAMMENFASSUNG 4
1. INTRODUCTION 5
1.1. Mitochondria and the regulation of mitochondrial biogenesis 6
1.2. The PGC-1 family of transcriptional coactivators 7
1.3. Mitochondrial biogenesis in the fly 10
1.4. Aim of the study 11
1.5. Significance 11
2. RESULTS
2.1. Drosophila Spargel is the only fly homologue of the mammalian PGC-1 family of transcriptional
coactivators 12
2.2. Phenotypic characterization of the spargel mutant and rescue of these phenotypes 14
2.2.1. Spargel is required for normal larval development and growth 14
2.2.2. Rescue of the spargel mutant phenotypes by a genomic rescue construct and a UAS-Srl
transgene 16
2.2.3. Spargel mRNA is expressed in may larval tissues 17
2.2.4. Cellular phenotypes of the spargel mutant 20
2.3. Cell-autonomous versus non-autonomous effects in the spargel mutant 25
2.3.1. Spargel is required for cell-autonomous growth and survival 25
2.3.2. Spargel overexpression leads to reduced cellular size 27
2.4. Microarray analysis of the spargel mutant fat body 30
2.5. The effect of Spargel on mitochondrial biogenesis and its in vivo interaction with Delg, the
homologue of mammalian NRF-2α 35
2.5.1. Spargel and Delg share many target genes 35
2.5.2. Spargel and Delg function in parallel pathways in respect to mitochondrial mass 37
Stefanie Katharina Tiefenböck 1

Ph.D. Thesis
2.5.3. Oxidative phosphorylation defects in the spargel delg double mutant 40
2.5.4. Discussion 45
2.6. Spargel is required for insulin-signalling mediated growth and controls part of the transcriptional
changes induced by insulin-signalling 47
2.6.1. Background 47
2.6.2. Spargel is required for insulin-signalling mediated cellular growth 48
2.6.3. Spargel mediates transcription in response to insulin-signalling (microarray analysis) 52
2.6.4. The activation of insulin receptor leads to increased mitochondrial biogenesis 56
2.6.5. Insulin signaling leads to increased Spargel protein levels 58
2.6.6. Spargel mediates a negative-feedback on insulin-signalling 59
3. DISCUSSION AND OUTLOOK 62
4. APPENDIX 68
4.1. Summary of microarray data on all nuclear encoded mitochondrial proteins 68
4.2. GO Term enrichment analysis of INR-overexpression data and the dependence on Spargel 74
5. MATERIALS AND METHODS 76
6. ACKNOWLEDGEMENTS 83
7. CURRICULUM VITAE 84
8. REFERENCES 85
Stefanie Katharina Tiefenböck 2

Ph.D. Thesis
ABSTRACT
Mitochondrial biogenesis must be adapted to tissue function, cell proliferation and growth,
and nutrient availability. In mammals, the related transcriptional coactivators PGC-1α, PGC-
1β and PRC regulate multiple metabolic functions, including mitochondrial biogenesis.
However, we know relatively little about their respective roles in vivo. Here we show that the
Drosophila PGC-1 family homologue Spargel promotes the expression of multiple genes
encoding mitochondrial proteins. Spargel was not limiting for mitochondrial mass and
OXPHOS activity and functions in parallel to Delg, the fly NRF-2α/GABPα homologue.
Accordingly, the spargel delg double mutant showed strongly exacerbated mitochondrial
defects compared to single mutants. More importantly, in the larval fat body, Spargel
mediated mitochondrial biogenesis, cell growth and the transcriptional control of target genes
in response to insulin-signalling. In this process, Spargel functioned in parallel to the insulin-
responsive transcription factor dFoxo and provided a negative feedback loop to fine-tune
insulin-signalling. Together, our data place Spargel at a nodal point for the integration of
mitochondrial biogenesis to tissue and organismal metabolism and growth.
Stefanie Katharina Tiefenböck 3

Ph.D. Thesis
ZUSAMMENFASSUNG
Mitochondrielle Biogenese ist essentiell für die Anpassung des Energiehaushalts einer Zelle
an entwicklungs- und gewebsspezifische Veränderungen, sowie an vorherrschende
Umweltbedingungen (zum Beispiel Sauerstoff- und Nährstoffverfügbarkeit oder
Temperaturschwankungen). In Wirbeltieren wird dieser kritische Prozess durch eine Familie
von transkriptionellen Kofaktoren, PGC-1α, PGC-1β und PRC reguliert, die neben ihrem
Effekt auf mitochondrielle Biogenese eine Vielzahl anderer Stoffwechselprozesse (unter
anderem Glucose- und Fettmetabolismus) kontrollieren. Trotz dieser wichtigen Funktionen
weiss man zum jetzigen Zeitpunkt relativ wenig über die in vivo Funktion dieser Proteine.
Diese Studie beschreibt das funktionelle Homolog von PGC-1 Proteinen in der Fruchtfliege
Drosophila melanogaster, genannt Spargel, und dokumentiert den Effekt dieses Proteins auf
mitochondrielle Biogenese in der Fliege. Wir zeigen, dass Spargel die Expression einer
Vielzahl nukleär kodierter mitochondrieller Proteine reguliert und zwar in einem parallelen
Signalweg zu Drosophila Delg, ein Homolog des menschlichen NRF-2α. Ausserdem zeigen
wir, dass Spargel den molekularen Zusammenhang zwischen mitochondrieller Biogenese und
dem Insulin-Signalweg herstellt und somit mitochondrielle Funktionen mit Zellwachstum
koordiniert.
Stefanie Katharina Tiefenböck 4

Ph.D. Thesis
1. INTRODUCTION
During development of an organism, growth (accumulation of mass) and proliferation (cell
cycle progression) are highly regulated. These two processes are often linked but they are
separate and controlled by different mechanisms. These mechanisms ensure that tissues or
organisms grow to a certain size, both in response to environmental stimuli and genetic
factors. Whereas cell cycle progression is clearly defined, accumulation of mass can be
achieved by several mechanisms: synthesis of proteins, lipids or carbohydrates or changes in
the assimilation of nutrients.
As growth and the adaptation to environmental changes are highly dependent on an accurately
regulated energy household, the regulation of metabolism plays a major role. Mitochondria
are cellular organelles that serve critical functions in the regulation of energy homeostasis,
metabolic pathways, cell signalling and survival. An essential function of mitochondria is the
generation of energy out of nutrients such as carbohydrates, lipids and amino acids. Thus one
would expect the coordination of mitochondrial mass and activity with cellular growth rates.
Since there is only little known about the regulation of mitochondria in response to growth-
promoting pathways and nutrient availability, the main interest of my PhD thesis was to
elucidate the in vivo regulation of this process. Many growth-signalling pathways have been
studied in detail in the fruit fly Drosophila melanogaster making this organism ideal to study
the in vivo connection between growth control and mitochondrial biogenesis.
Stefanie Katharina Tiefenböck 5

Ph.D. Thesis
1.1. Mitochondria and the regulation of mitochondrial biogenesis
Mitochondria are cytoplasmic organelles that constitute a hall-mark of eukaryotic cells. They
are comprised of a soluble matrix surrounded by a double-membrane, an ion-impermeable
inner membrane and a permeable outer membrane. This specific architecture of the
mitochondrion allows a number of vital cellular processes to take place, the main function
being the generation of energy from nutrients through the production of ATP by oxidative
phosphorylation. In addition, mitochondria generate metabolites used for anabolic processes
(lipid- and protein metabolism) and serve other critical functions in the adaptation to
physiological changes and cell survival. Thus, it is not surprising that defects in mitochondrial
number and function are associated with a broad spectrum of pathologies, such as
neurodegenerative diseases, diabetes, aging and cancer (reviewed in Wallace, 2005).
A key in the normal control of mitochondrial function is the regulation of mitochondrial
biogenesis. Mitochondria can not be formed de novo, but emerge from preexisting
mitochondria. Mitochondria have their own DNA (mtDNA) encoding some proteins of the
oxidative phosphorylation (OXPHOS), as well as tRNAs and rRNAs. The maintenance,
replication and transcription of the mitochondrial genome is controlled by a well-
characterized mitochondrial-specific transcription complex: consisting of the mitochondrial
RNA polymerase POLRMT, the transcription factor Tfam and two mitochondrial
transcription specificity factors, TFB1M and TFB2M. All these factors are encoded in the
nucleus like the majority of mitochondrial proteins. They are imported into the mitochondrion
post-translationally, thereby increasing mitochondrial mass. Thus the tight coordination of the
expression programs between these two compartments is essential for mitochondrial
biogenesis (Kelly and Scarpulla, 2004; Ryan and Hoogenraad, 2007; Scarpulla, 2008). In
Stefanie Katharina Tiefenböck 6

Ph.D. Thesis
addition, the plasticity of mitochondria must be adapted to environmental conditions, such as
tissue function, cell proliferation and growth, and nutrient availability.
1.2. The PGC-1 family of transcriptional coactivators
A major regulator in the nuclear control of mitochondrial biogenesis in response to
environmental stimuli (like low ATP, growth hormones, NO, high Ca2+ (reviewed by
Clementi and Nisoli, 2005; Kelly and Scarpulla, 2004) is the family of PGC-1 proteins. It
consists of three family members: PGC-1a (PPARγ coactivator 1), the founding member of
this family (Puigserver et al., 1998), PGC-1β (Kressler et al., 2002; Lin et al., 2002a) and
PRC (PGC-1 related coactivator) (Andersson and Scarpulla, 2001). The PGC-1 proteins are
highly versatile transcriptional coactivators that regulate a number of different metabolic
processes by binding and coactivating different nuclear receptors and transcription factors in a
tissue- and stimulus-specific way: PGC1α, for example, was first identified as a potent
inducer of adaptive thermogenesis upon cold-stimulation in brown adipose tissue by
coactivation of PPARγ (Puigserver et al., 1998). In the liver, it interacts with FOXO1
(Puigserver et al., 2003) or HNF4α (Yoon et al., 2001) to induce gluconeogenesis upon
starvation and it can control differentiation programs such as the fiber-type switching in
muscle cells upon exercise by the activation of Mef2 (Lin et al., 2002b). This is by far not a
complete list of all described functions and binding partners of the PGC-1 family, a more
detailed description of all metabolic functions can be found in recent reviews, such as Finck
and Kelly, 2006 and Lin et al., 2005.
Important for our study, all three members were shown to be potent inducers of mitochondrial
mass and function: PGC-1α drives mitochondrial biogenesis by the coactivation of nuclear
transcription factors, including NRF-1, NRF-2 (Evans and Scarpulla, 1989; Virbasius and
Stefanie Katharina Tiefenböck 7

Ph.D. Thesis
Scarpulla, 1991) and estrogen-related receptor α (ERRα) (Mootha et al., 2004; Schreiber et
al., 2004), to enhance the expression of genes encoding mitochondrial proteins (Scarpulla,
2008). These include proteins that are involved in mitochondrial function (respiratory chain
complexes, TCA cycle), but also proteins that direct the replication and transcription of the
mitochondrial DNA, like TFB1M and TFB2M, as well as the mitochondrial transcription
factor Tfam (Gleyzer et al., 2005; Wu et al., 1999). Accordingly, NRF-1 and ERRα are
known to be functionally important for PGC-1s to stimulate mitochondria (Mootha et al.,
2004; Schreiber et al., 2004; Wu et al., 1999). In addition to enhancing the activity of these
transcription factors, PGC-1α overexpression was shown to increase expression levels of
NRF-1 and NRF-2α mRNA (Wu et al., 1999). However, this tremendous upregulation of
NRF-1 and NRF-2α mRNA upon PGC-1α induction could not be confirmed by another group
(Gleyzer et al., 2005). The reason for this discrepancy is unknown. PGC-1β, a close relative
of PGC-1α, also functions as a NRF-1 coactivator (Lin et al., 2002a). The third family
member, PGC-1 related coactivator (PRC), exhibits the properties of a cell growth regulator.
Like PGC-1α, PRC binds NRF-1 and directs the expression of NRF-1 target genes related to
the respiratory chain expression (Andersson and Scarpulla, 2001; Gleyzer et al., 2005).
Similarly, NRF-2 promoter binding sites are required for coactivation by PGC-1α and PRC
on certain genes (Gleyzer et al., 2005), and PRC can coactivate NRF-2β (Vercauteren et al.,
2008). However, a direct interaction of these two cofactors with NRF-2 has never been
shown, suggesting that a third factor is required for the coactivation of NRF-2 through PGC-
1α or PRC. Recent studies showed that PRC complexes with the host cell factor-1 (HCF-1)
and NRF-2β, building a functional transcriptional activation complex (Vercauteren et al.,
2008). Taken together, these data indicate that PGC-1s and NRF-2 function together on
transcription of nuclear encoded mitochondrial proteins. However, it is not known whether
NRF-2 is functionally required for PGC-1’s effect on mitochondria, or whether NRF-2 is
controlled via other factors. As there is no in vivo data on the interaction of NRF-1/2 and
Stefanie Katharina Tiefenböck 8

Ph.D. Thesis
PGC-1 proteins, genetic studies in invertebrates could help elucidate their function in
mitochondrial biogenesis.
In addition, the redundant functions of PGC-1 proteins on mitochondrial biogenesis have
complicated the analysis of their role in basal mitochondrial biogenesis: recently, PGC1α
(Leone et al., 2005; Lin et al., 2004) and PGC1β (Lelliott et al., 2006; Sonoda et al., 2007)
knock-out mice have been described. Importantly, although these knock-out animals showed
reduced expression of multiple genes encoding mitochondrial proteins, mitochondrial mass
was either not or only modestly reduced, depending on the tissue (Lelliott et al., 2006; Leone
et al., 2005; Lin et al., 2004; Sonoda et al., 2007). In contrast, RNAi-mediated downregulation
of PGC-1β in a PGC-1α-/- background led to strong mitochondrial biogenesis defects during
the differentiation of brown adipose tissue (Uldry et al., 2006). Furthermore, PGC-1αβ-/-
double knockout mice die shortly after birth having strong defects in heart maturation and
severe abnormalities in brown adipose tissue function and mitochondrial density (Lai et al.,
2008). Therefore, the mild phenotypes observed in single knockouts could be due to
redundancy. Alternatively, PGC-1 proteins could be required in tissues that have a large
stimulus-induced increase in mitochondrial mass, e.g. during brown adipose tissue
differentiation (Uldry et al., 2006) or muscle-type switching upon exercise (Lin et al., 2002b),
but otherwise be dispensable for basal mitochondrial mass in most tissues. As there is less or
even no redundancy in Drosophila, the fly is an ideal model system to study the function of
PGC-1 proteins in the control of basal mitochondrial levels.
As mentioned above, mitochondrial biogenesis must be adapted to tissue function, cell
proliferation and growth, and nutrient availability. However, relatively little is known about
the coordination of mitochondrial biogenesis in the context of growth. Although there is a
number of well-described growth driving pathways, including the insulin/TOR pathway, the
Stefanie Katharina Tiefenböck 9

Ph.D. Thesis
Hippo tumour-suppressor pathway or Myc, our understanding is very limited if and how these
growth pathways functionally interact with PGC-1 proteins, and if this in turn controls
mitochondrial functions. As most of these growth pathways are well-conserved in the fly, this
could be easily addressed in Drosophila. In addition, in the fly a clear requirement of
mitochondrial function for CyclinD/Cdk4-driven growth has been described (Frei et al.,
2005).
1.3. Mitochondrial biogenesis in the fly
The structure and gene content of the Drosophila melanogaster mitochondrial genome is
similar to that of mammals (Garesse and Kaguni, 2005). Analogously, most mitochondrial
proteins are encoded in the nucleus and functional homologs of the major factors that control
mitochondrial function are described: the mitochondrial DNA Polymerase Polγ (Wernette et
al., 1988), the mtSSB (Stroumbakis et al., 1994), Tfam (Goto et al., 2001) as well as mtTFB1
(Matsushima et al., 2005) and mtTFB2 (Matsushima et al., 2004). However, there are no clear
Drosophila homologues of PPAR nuclear receptors (King-Jones and Thummel, 2005) and a
role for the fly homolog of ERRα in mitochondrial biogenesis not been described. The fly
homolog of mammalian NRF-1, Erect wing (ewg), has been studied in the context of early
muscle cell and neuronal development but with no described effect on mitochondrial gene
expression (DeSimone et al., 1996; DeSimone and White, 1993). The same is true for a
described homolog of mammalian NRF-2α, Delg, which was first described for its role in
oogenesis (Schulz et al., 1993a; Schulz et al., 1993b). Although based on sequence homology
there is a putative homologue of the PGC-1 proteins, CG9809, it has not been functionally
characterized. Thus it is not known how the transcriptional control of mitochondrial
biogenesis is regulated in the fly.
Stefanie Katharina Tiefenböck 10

Ph.D. Thesis
1.4. Aim of the study
As the aim of this study was to elucidate how mitochondrial function is controlled in response
to nutrients, so we first asked whether a similar transcriptional network depending on
PGC1 does exist in invertebrates. While my study concentrates on the characterization of the
Drosophila homolog of mammalian PGC-1, a second project in the lab has characterized the
role of Delg, the fly homolog of mammalian NRF-2α, in mitochondrial biogenesis (Baltzer et
al., submitted). Thus, we were able to also analyze the in vivo interaction of these two proteins
in the fly. Second, since many of the growth driving pathways mentioned above are well
described in the fly (Eilers and Eisenman, 2008; Grewal, 2008; Saucedo and Edgar, 2007), we
investigated whether this putative PGC-1 homolog could mediate the molecular link between
growth signals and mitochondrial biogenesis and furthermore if this link is critical for cellular
and organismal growth.
1.5. Significance
We showed that the Drosophila melanogaster genome encodes a single PGC-1 homologue,
Spargel/CG9809, thus providing a system where PGC-1 function can be analyzed without
interfering redundancy. Although this homology has been published in the meantime by
another group (Gershman et al., 2007), this is the first functional analysis of the Spargel/PGC-
1 mutant phenotype in the fly. In addition, we investigated the role of Spargel in the control of
mitochondrial biogenesis in Drosophila and how it is functionally linked with the fly NRF-2α
homologue Delg (Baltzer et al., submitted). Moreover, we addressed the question how insulin-
signalling affects mitochondria, and found that Spargel was required to a large extent for the
transcriptional control in response to insulin-signalling, including for genes encoding
mitochondrial proteins. Thus, our data demonstrate a critical role for Spargel/dPGC in the
coordination of mitochondria with nutrients and growth.
Stefanie Katharina Tiefenböck 11

Ph.D. Thesis
2. RESULTS
2.1. Drosophila Spargel (CG9809) is the only fly homologue of the mammalian
PGC-1 family of transcriptional coactivators
2.1.1. The fly genome encodes only one putative homolog of mammalian PGC-1 proteins
Using blast search, we and others (Gershman et al., 2007) have identified only one PGC-1
homologue in the Drosophila melanogaster genome. This gene, CG9809, is encoded on the
right arm of the third chromosome (3R; 82B1) and has two predicted isoforms: CG9809-B
and CG9809-D (Fig. 1). These two isoforms are splice-variants of the same transcript and
encode a protein of 1067aa (CG9809-PB) or 1058aa (CG9809-PD), respectively. The shorter
protein, CG9809-PD, misses 27 nucleotides at the start of exon 3 and has a shorter predicted
3` untranslated region (UTR).
Figure 1. Representation of the Spargel (CG9809) locus. Shown is the genomic map of CG9809 (modified
from: Flybase, http://flybase.org/). Cytolocation: 3R:248,205..255,051 [-]. Orange boxes represent coding
regions of the respective genes (CG9809, CG31525 or eIF3-S10) including 5` untranslated regions (UTR). Grey
boxes indicate 3` UTR. The P-element insertion sites of srl1 and srl2 loss-of-function alleles are indicated as blue
triangles. The genomic rescue construct (SrlGR; 8700bp) is represented as hatched bar.
Both isoforms exhibit 68% and 52% homology with the mammalian PGC-1α and PGC-1β,
respectively, in the C-terminus. In addition, many of the functionally important domains are
Stefanie Katharina Tiefenböck 12

Ph.D. Thesis
conserved: the N-terminal acidic domain that serves as an interaction platform for the binding
of transcription factors (Puigserver et al., 1999), as well as the C-terminal arginine/serine rich
domain and the RNA-recognition motif (Fig. 2). The two latter are characteristic for RNA
splicing factors and were shown to directly couple the transcriptional activation function of
PGC-1 proteins to mRNA processing (Monsalve et al., 2000). Interestingly, CG9809 lacks the
canonical LXXLL motifs, which for mammalian PGC-1s is required for binding to multiple
nuclear hormone receptors and transcription factors. CG9809, however, contains a conserved
C-terminal FXXLL motif (Gershman et al., 2007), which could mediate transcription factor
binding (Huang et al., 1998).
Figure 2. Domains of Drosophila Spargel (CG9809) that are in common with human PGC-1α and PGC-1β.
Numbers indicate the respective percentage of homology between the proteins. Acidic: N-terminal acidic
domain, RS: arginine/serine-rich domain, RRM: RNA recognition motif. Taken from Gershman et al., 2007.
Given the high similarity of the protein structure between mammals and the fly, we further
investigated whether CG9809 is also a functional homolog of the mammalian PGC-1 proteins.
Stefanie Katharina Tiefenböck 13
Ph.D. Thesis
2.2. Phenotypic characterization of the spargel mutant and the rescue of these
phenotypes
2.2.1. The Drosophila PGC-1 homologue Spargel (CG9809) is required for normal larval
development and growth
To test whether CG9809 is a functional PGC-1 homologue in flies, we analyzed mutants that
have a P-element insertion (KG08646; 11.4kb) into the 5’ UTR (Fig. 1). Due to the size of the
P-element, such insertions are known to interfere with the normal transcriptional regulation
and thus lead to a downregulation of the affected gene. Compared to genetically matched
controls (precise excision of the P-element) homozygous mutant larvae have a strong
reduction in CG9809 mRNA levels (Fig. 3A). In addition, homozygous mutant animals have
a defect in larval development: when we followed the increase in larval volume over time
(Fig. 3C), we observed that homozygous mutant larvae are delayed in growth starting from
the 3rd instar and reach pupation with a delay by one day. This resulted in significantly smaller
pupa (~25% smaller than controls; Fig. 3D). Adults are viable, yet eclose at a lower
Mendelian ratio as expected (only 1/6th is homozygous mutant, instead of 1/3rd) and females
are sterile. Importantly, the adult flies show a lean phenotype: while the body weight is
reduced by ~25% (Fig. 3B), adult body structures, like wings and legs, are almost normal
sized (Fig. 3E-G). In addition, the determination of trichome number per wing area did not
show any difference between the mutants and the wildtype, demonstrating no change in cell
number and cell size (Fig. 3H). To stress the lean phenotype, we termed CG9809 ‘Spargel’,
German for ‘asparagus’, and the KG08646 allele as srl1.
In addition to this allele, we tested another P-element insertion, d04518 (7.3kb), termed srl2
(Fig. 1). This P-element is inserted at the same position as KG08646 and shows a comparable
Stefanie Katharina Tiefenböck 14

Ph.D. Thesis
downregulation in the Spargel mRNA (Fig. 3A). The larval and adult phenotypes of the srl2
mutants are the same as for the srl1 mutants (Fig. 3B) and data not shown).
As ~25% of srl transcript was still detectable in both, srl1 and srl2 (Fig. 3A), we tested a
transheterozygous combination of srl1 with Df(3R)ED5046, a deficiency that deletes the
Spargel locus as well as neighbouring genes. This led to a further reduction in Spargel
transcript levels (Fig. 3A), yet it did not lead to a further decrease in adult weight compared to
srl1 homozygous mutant animals (Fig. 3B). This suggests that srl1 is at least a strong
hypomorphic allele.
Figure 3. Spargel is required for larval development and growth. (A) Spargel transcript levels were
determined by qRT-PCR. mRNA was isolated from whole, mid-third instar larvae: +/+: 4dAED; srl1/1,srl2/2 and
srl1/Df(3R)5046: 5dAED. Expression was normalized to Actin5C (CG4027) and +/+ was set to 1. (B) Wet
weight from adult males, genotypes as indicated. Adult males were taken 2 days after eclosion. Number of
flies/genotype ≥10. (C) Shown are larval volumes of wildtype and srl1 mutants. Pictures of larvae at the
indicated time points were taken and larval volumes were determined by measuring the larval dimensions in
Adobe Photoshop and subsequent calculation in Excel using the following formula:
4/3π(Length/2)2(Diameter/2). Spargel mutants pupate (indicated as “P”) at a reduced size with a 1-day delay. (D)
Shown are pictures of wildtype and spargel mutant pupae. Pupae were imaged with a 1.6x magnification and
Stefanie Katharina Tiefenböck 15

Ph.D. Thesis
pupal volume was calculated as described above for the larval volume. (E) Picture of wildtype and spargel
mutant adult males. (F) Femur length of the adult leg. (G) Adult wings were imaged and pixel number per wing
area was determined. (H) Trichome number was counted in a defined area of the wing (700x700pixel). For (D)
to (H) Size measurements were done by using Adobe Photoshop; n >15. *** equals P<0.001; ** equals P<0.01;
* equals P<0.05; ns: not significant.
2.2.2. The spargel mutant phenotypes can be rescued by a genomic rescue construct and
a full-length UAS-Srl transgene
To test if the observed phenotypes are specific for the mutation in Spargel and do not result
from a secondary mutation in the genome, we created transgenic flies carrying a genomic
rescue construct (SrlGR; 8.7kb; Fig. 1). Although the spargel mRNA levels are only partially
restored, this line rescues all mutant phenotypes including the defect in larval development
and the reduced adult body weight (Fig. 4A-C). It also rescues the phenotypes of the
transheterozygous combination of srl1with Df(3R)ED5046 (data not shown). These results
show that the observed phenotypes are specific for a mutation in the Spargel locus.
Figure 4. Rescue of the spargel mutant phenotypes. (A) Spargel transcript levels were determined by qRT-
PCR. mRNA was isolated from whole, mid-third instar larvae (srl1/1: 5d AED; all others: 4d AED). Expression
was normalized to Actin5C (CG4027) and +/+ was set to 1. (B) Complete rescue of the reduced weight
phenotype of adult srl1/1 mutants by the genomic rescue construct, SrlGR. (C) SrlGR rescues the larval size defect
Stefanie Katharina Tiefenböck 16

Ph.D. Thesis
and the delay in larval development. Shown are larval volumes of the indicated phenotypes. “P” indicates the
start of pupation. (D) Rescue of the reduced adult body weight by hs-Gal4 driven UAS-Spargel (UAS-Srl) with
one 1.5h heat shock/day (done by Ch. Frei). (E) CG31525 mRNA was isolated from mid-3rd instar fat bodies,
quantified by qRT-PCR and normalized to gammaTub23C (CG3157). For (B) and (D): For all weight
measurements, adult males were taken 2 days after eclosion. Number of flies/genotype ≥10. *** equals P<0.001;
ns: not significant.
As another gene, CG31525, is fully encoded within the Spargel locus (Fig. 1) and since the
genomic rescue construct includes this gene, we also created a fly line expressing specifically
a full-length Spargel cDNA (including 5` and 3`UTRs) under the control of the UAS
promoter. When driven using heat-shock Gal4, UAS-Srl also suppressed the mutant
phenotypes (Fig. 4D and data not shown), except for the female sterility. This can be
explained by the fact that the vector used to create this construct, pUASt, is not expressed in
the germline. In addition, the CG31525 mRNA levels are not affected in the srl1 mutant (Fig.
4E). This demonstrates that Spargel, and not CG31525, is responsible for the observed
phenotypes.
2.2.3. Spargel mRNA is expressed in many larval tissues
To continue with the characterization of cellular phenotypes caused by the spargel mutant, we
first analyzed the temporal and spatial expression pattern of Spargel in wildtype animals using
qRT-PCR.
Searching FlyExpress, an available internet database for gene expression data, we found that
Spargel mRNA is expressed at different embryonic stages as shown by in situ hybridization
studies (Reference: Van Emden B, Ramos H, Panchanathan S, Newfeld S, and Kumar S
(2006). FlyExpress: An image-matching web-tool for finding genes with overlapping patterns
Stefanie Katharina Tiefenböck 17

Ph.D. Thesis
of expression in Drosophila embryos. (www.flyexpress.net). Arizona State University,
Tempe, Arizona 85287-5301, USA.). To get more detailed information about the expression
pattern of Spargel, we performed qRT-PCR on whole animals at different developmental
stages. Our data showed that Spargel in general is expressed at relatively low levels (Fig. 5A,
normalized to the Act5C mRNA). Starting with a modest expression at early 3rd instar,
Spargel mRNA further decreases during larval development. While its expression is still
relatively low in the pupa, Spargel reaches an expression maximum in the adult female. Data
retrieved from FlyAtlas (Chintapalli et al., 2007) (http://flyatlas.org/) confirm this expression
pattern and show that Spargel mRNA is significantly enriched in the ovaries. As srl1 mutant
female flies are sterile, this could indicate a role of Spargel in oogenesis, yet we have not
further tested this.
As we are especially interested in the growth period of the feeding animal and as srl1 mutant
animals show a strong phenotype already at larval stages (retarded growth and delayed
development), we looked at the tissue-specific expression during the mid-3rd instar. For this,
we dissected out different tissues from wildtype larvae (4d AED), including the fat body, gut,
salivary glands and brain. In this experiment we used Rp49 as normalization control because
its expression levels were comparable between the different larval tissues (in contrast to
Act5C). Spargel mRNA is expressed in all these tissues: the fat body and the salivary glands
had comparable expression levels of Spargel, gut and muscle showed a reduced expression
(Fig. 5B). Importantly, the Spargel mRNA is highly expressed in the larval brain. Although
this result might reflect an important function for Spargel within the central nervous system,
similar as its mammalian homologs (Lin et al., 2004), the functional significance of this
finding remains to be determined.
Stefanie Katharina Tiefenböck 18

Ph.D. Thesis
Figure 5. Spargel expression pattern during larval development and in different larval tissues. For (A) and
(B): Spargel levels were detected by qRT-PCR and normalized to Act5C or Rp49. (A) Animals were taken at the
indicated developmental stage. 3rd instars: early: 3d AED; mid: 4d AED; late: 5d AED; Pupa: 3d after puparium
formation; Females: 1d after eclosion (note that this is the result of a single experiment). (B) Tissues were
dissected from mid-3rd instar wildtype controls. Shown are the results of two biological replicates. Number of
tissue/experiment >25.
Stefanie Katharina Tiefenböck 19

Ph.D. Thesis
2.2.4. Spargel mutant fat body cells have changed morphology due to big lipid droplets,
but only minor defects in mitochondrial mass
Having observed the defects in larval development and on organismal size (Chapter 2.2.1.),
we next asked if we can observe cellular phenotypes that are caused by the srl1 allele and
whether these would account for the defects in animal growth.
For the following analyses, we decided to focus on the larval fat body for several reasons:
- First, we found that among the larval tissues, except for the brain, Spargel expression levels
are the highest in the fat body. This is interesting because also the mammalian PGC-1 proteins
were shown to play a crucial role in adipose tissue development and function (Puigserver et
al., 1998; Uldry et al., 2006).
- Second, the fat body plays an important role in the regulation of larval growth: as an adipose
tissue that also exerts liver-like functions, it regulates nutrient storage and release and thus
controls the organismal energy supply during the larval growth period (reviewed in (Leopold
and Perrimon, 2007). In addition, the fat body was shown to act as an endocrine tissue that
controls the growth of imaginal discs by releasing growth hormones (Kawamura et al., 1999).
- Third, the larval fat body is an endoreplicative tissue that consists of a monolayer of large
cells. This makes it relatively easy to dissect, perform immunofluorescence and obtain enough
material for a variety of experiments from even a low number of animals.
As mentioned in the Introduction (Chapter 1.2.), mammalian PGC-1 proteins were shown to
be critical in the regulation of mitochondrial biogenesis (Scarpulla, 2008). To test whether
mitochondria are affected in the srl1 mutant, we performed a first experiment to monitor
mitochondrial number in the larval fat body using MitoTracker, a mitochondrial-specific dye.
In control animals, mitochondrial staining is abundant throughout the cytoplasm (Fig. 6). In
Stefanie Katharina Tiefenböck 20

Ph.D. Thesis
spargel mutants, we detected only a minimal reduction in staining. However, this could be
due to a change in the morphology of the fat body cells in the mutant (discussed below). Thus,
using MitoTracker we can not provide strong evidence for an effect on mitochondrial mass
and additional experiments are required to analyze this more in detail. Moreover, the
MitoTracker staining cannot monitor defects in mitochondrial functions like enzymatic
activities or the respiratory capacity. Therefore we used other read-outs to perform a more
detailed analysis of the effect of Spargel on mitochondrial biogenesis. The results of these
experiments are presented and discussed in the Chapters 2.4. and 2.5.
Figure 6. Mitochondria-specific MitoTracker stainings of larval fat bodies. Age: mid-3rd instar; +/+: 4d
AED, srl1/1: 5d AED. DAPI stains the nuclei. Bar equals 20µm.
As mentioned above, during the MitoTracker experiments we observed a striking change in
the morphology of the spargel mutant fat body cells: the cytoplasm is filled with droplet-like
structures giving them an “empty” appearance compared to the wildtype control (Fig. 6). A
main function of the fat body is the storage of excess dietary fat in the form of lipid droplets.
To determine if the observed structures are lipid droplets we performed a Nile red staining
Stefanie Katharina Tiefenböck 21

Ph.D. Thesis
which specifically stains intracellular lipid stores. As shown in Figure 7A. the lipid droplets in
wildtype cells are small and numerous. In the spargel mutant fat body, however, lipid droplet
size is strongly increased. In addition, these big lipid droplets can be found throughout the
cytoplasm of the mutant fat body cells which is shown in the pictures of different cell layers
taken by differential interference contrast (DIC) microscopy (Fig. 7B).
B Section 1 Section 2 Section 3
+/+, section 1 +/+, section 3 +/+, section 2
srl1/srl1, section 1 srl1/srl1, section 2 srl1/srl1, section 3
+/+,
5d
AED
srl1/1 , 6
d A
ED
Figure 7. Spargel mutants have big lipid droplets. (A) Nile red (lipids) and DAPI (nuclei) staining of mid-3rd
instar fat body. Genotypes as indicated. (B) DIC images of different sections on late 3rd instar fat body. Arrows
Stefanie Katharina Tiefenböck 22

Ph.D. Thesis
indicate the position of the nuclei. Arrowheads mark lipid droplets. For (A) and (B): Scale bars correspond to
20µm.
Furthermore, the observed lipid droplet phenotype can be reversed by the genomic rescue
construct, SrlGR (Fig. 7A). These findings suggest a role for Spargel in the control of lipid
metabolism and we looked into this more in detail. Big lipid droplet phenotypes were
previously described in the fat body cells of larvae kept under low nutrient conditions (Zhang
et al., 2000; Colombani et al., 2003). It is believed that the change in lipid droplet morphology
helps to mobilize the fat stores by making them accessible to the TAG lipase Brummer
(Gronke et al., 2005), therefore providing other tissues with energy. Thus, the spargel mutant
phenotype could result from a systemic, starvation-like effect due to the lack of Spargel. To
investigate if lipid stores are used up to a higher extent in the mutants, we analyzed the total
organismal fat contents.
For this, we took feeding whole mid-3rd instar larvae and determined the amount of total
triacylglyceride (TAG), the storage form of fat. When normalized to total body protein or
total body weight, we did not observe any change in the total triacylglyceride (TAG) levels in
the spargel mutants relative to the wildtype (Fig. 8). Thus the lipid droplet phenotype in the
fat body does not reflect a depletion of organismal lipid contents, however, it is still possible
that the phenotype results from a direct effect of Spargel on lipid homeostasis, such as lipid
remobilization and distribution.
Stefanie Katharina Tiefenböck 23

Ph.D. Thesis
Figure 8. Spargel mutants have normal amounts of total body fat. TAG levels of feeding mid-3rd instar
larvae, normalized to total body weight or total protein. Shown are the results of three biological replicates.
Kindly provided by Nicole Egli.
Recently, Gutierrez and colleagues have described the oenocytes as major regulators of those
processes (Gutierrez et al., 2007). Oenocytes are clusters of specialized cells with hepatocyte-
like function that are found in the body wall of larvae and adults. Under fed conditions these
cells do not contain any lipids. Upon starvation, however, lipids are mobilized from the fat
body and accumulate in the oenocytes where they are processed for subsequent redistribution
to other tissues. To see if the spargel mutant oenocytes ectopically accumulate lipids even
under fed conditions, we stained the body wall of feeding mid-3rd instar larvae with Nile red.
Unfortunately, in our hands, we detected lipid accumulations already in the feeding wildtype
controls (data not shown). This is probably due to a different fly food composition used in our
lab. As our assays did not allow us to detect any changes in total lipid content or distribution,
we decided to investigate the expression response of genes involved in lipid metabolism more
in detail by microarrays (see Chapter 2.4.).
As we so far only investigated the phenotypes of whole spargel mutant animals, we can not
distinguish if the observed cellular defects in the fat body are of cell-autonomous or non-
Stefanie Katharina Tiefenböck 24

Ph.D. Thesis
autonomous origin. This question is addressed by the experiments described in the next
chapter.
2.3. Cell-autonomous versus non-autonomous effects in the spargel mutant
As described before, we detected high levels of Spargel mRNA in the brain, therefore the
observed mutant phenotypes in the fat body could be due to a systemic effect (e.g. through the
release of hormones). Alternatively, Spargel could be required in a cell-autonomous manner
in the fat body. To look into this more in detail, we induced spargel loss-of-function clones in
the fat body, and tested for mutant phenotypes.
2.3.1. Spargel is required for the cell-autonomous control of growth and survival
To analyze the cell-autonomous effect of the srl1 mutation, we used the Flp/FRT system
(Golic and Lindquist, 1989). Due to the location of Spargel on the chromosome (82B1), it was
not feasible to induce Spargel loss-of-function clones by the recombination of srl1 onto the
FRT82-chromosome. Thus, we took a reverse approach and recombined an insertion of SrlGR
(genomic rescue) on the 2nd chromosome (chromosome arm: 2R) onto the FRT42-
chromosome, and analyzed flies that are mutant for Spargel (which is located on the third
chromosome). The resulting clones are either homozygous mutant for Spargel (GFP positive)
or wildtype (GFP negative) due to the presence of two copies of SrlGR (Fig. 9D).
Stefanie Katharina Tiefenböck 25

Ph.D. Thesis
Figure 9. Spargel is required for cell-autonomous growth and survival. (A) Phalloidin and DAPI staining of
mid-3rd instar fat body. Clones were induced using the Flp/FRT system. Genotype: hs-Flp122; FRT42, Ub-
GFP/FRT42, srlGR; srl1/srl1. GFP-/- cells are wildtype (marked by arrows with open ending), GFP+/- cells are
heterozygous for srl1 and GFP+/+ cells are homozygous srl1 mutant (marked by arrows with filled arrowhead).
(B) Most fat bodies lack srl homozygous mutant twinspot cells. (C) Shown are spargel mutant clones in the wing
disc of a mid-L3 larva. Clones were induced 48h after egg deposition. Wildtype and spargel mutant clones are
indicated as in (A). (D) Schematic representation of the clone formation in the larval fat body. Clones are
induced by a heat shock during mid-embryogenesis (6-8h after egg deposition). After twinspot formation, these
cells typically divide once or twice, leading to a clone of 2 or 4 cells, respectively. After this, these cells stop
mitotic division, and endoreplicate (S-G cycles without interfering mitosis), leading to a large increase in cell
size. For (A) and (B): 20x magnification, scale bar corresponds to 50µm. For (C): 40x magnification, scale bar
corresponds to 20µm.
As shown in Figure 9A, cellular and nuclear size is decreased in the srl1 mutant clones,
suggesting a cell-autonomous requirement for Spargel during growth. Importantly, in the
majority of the analyzed fat body tissues we could not detect the spargel mutant sister cells
(Fig. 9B). This could point out a vital function for Spargel in cell survival.
Stefanie Katharina Tiefenböck 26

Ph.D. Thesis
As the number of cells per clone in the fat body is limited we aimed to look at the survival of
spargel homozygous mutant clones in a mitotic tissue. We chose the wing disc because the
number of cells per clone can easily be varied by inducing clone formation at different time
points during disc development. Furthermore, it was shown, that cells carrying a mutation that
leads to reduced “fitness” are removed from the disc epithelium by its healthy neighbour cells,
a process called cell competition. To test, if spargel mutant cells have a survival defect, we
induced Spargel loss-of-function clones in the wing disc (Fig. 9C). Interestingly, we find that
similar to the fat body, spargel mutant clones are reduced in size, and this is due to a reduced
cell number. Although the process of cell competition has not been described for the fat body,
it is most likely that the spargel mutant twin spot cells in the fat body also die and this
probably happens very early in fat body development.
Considering Spargel`s role in cell survival, the few homozygous mutant clones we obtained in
the fat body could result from additional compensatory mutations that help the cells survive
the lack of Spargel. This could partially also explain that we could not observe any cell-
autonomous changes in mitochondrial mass or lipid droplet morphology (data not shown),
therefore we cannot fully exclude a direct effect of Spargel on these processes.
2.3.2. Clonal overexpression of Spargel leads to reduced cell size in the fat body
We showed that Spargel is involved in the regulation of cell-autonomous growth and survival
by analyzing loss-of-function clones (described above). To determine the effect of increased
Spargel levels, we overexpressed UAS-Spargel (UAS-Srl) in random clones in the fat body of
wildtype larvae using the hs-Flp; Tub>CD2>Gal4, UAS-GFP system (Flip-out/Gal4-system,
(Scott et al., 2004).
Stefanie Katharina Tiefenböck 27

Ph.D. Thesis
Figure 10. The overexpression of Spargel leads to cell-autonomous growth defects. UAS-Srl was expressed
in random clones using the hs-Flp; Tub>CD2>Gal4, UAS-GFP system in wildtype background. Shown are
stainings from larval fat bodies, using MitoTracker (red) specific for mitochondria, DAPI (blue) specific for
DNA and GFP (green), which marks UAS-Srl expressing cells. Bar equals 20µm. Kindly provided by Christian
Frei.
Compared to the controls, cells overexpressing UAS-Srl are reduced in cell size (Fig. 10).
This is surprising, as we demonstrated before that spargel loss-of-function clones are smaller
and moreover, spargel mutant larvae display a general growth defect (see Chapter 2.2.1.). We
hypothesize that the small size phenotype of cells that overexpress Spargel could result from a
dosage effect and that the exact homeostasis of Spargel levels might be critical for the
induction of physiological changes. Interestingly, such an effect has not been reported in the
mammalian system upon PGC-1α overexpression. This could be due to a weaker induction of
the protein in mammals as compared to our set-up. To check if the observed dominant effect
on growth by Spargel overexpression can be rescued by a reduction in Spargel levels we
could perform the same experiment in a Spargel RNAi background. For this a recently
available Spargel RNAi fly line (Vienna Drosophila RNAi Center, Dietzl et al., 2007) could
be used.
In addition, the size defect prevents a conclusive analysis about the cell-autonomous effect of
Spargel overexpression on mitochondrial abundance as the cytoplasmic area is too strongly
affected to allow a reliable visualization of mitochondria by MitoTracker staining (Fig. 10).
Stefanie Katharina Tiefenböck 28

Ph.D. Thesis
Taken together, the phenotypic characterization of the spargel mutant shows a role for
Spargel in the regulation of larval growth and development including a mild mitochondrial
defect and a stronger lipid droplet phenotype that is specific for the larval fat body. In
addition, the analysis of loss-of-function and gain-of-function clones shows a cell-
autonomous requirement of Spargel for growth in the larval fat body, whereby Spargel levels
seem to be critical. However, by the experiments conducted so far, we can not exclude an
additional non-cell-autonomous effect of Spargel. To sort this out, we could test the effects of
tissue-specific rescues or knock-downs on the whole organism. Unfortunately, the clonal
analysis experiments could not clarify the role of Spargel on mitochondria and lipid
metabolism. In order to check the effects of Spargel on metabolic pathways we performed a
global analysis of transcriptional changes in the spargel mutant by microarrays (next chapter).
Stefanie Katharina Tiefenböck 29

Ph.D. Thesis
2.4. Microarray analysis of the spargel mutant larval fat body reveals a
requirement of Spargel for the proper expression of multiple genes involved in
mitochondrial function and energy metabolism
As discussed in the Introduction the mammalian PGC-1 proteins are a family of
transcriptional coregulators that play a key role in the control of different metabolic processes,
including lipid and glucose homeostasis, mitochondrial biogenesis and energy homeostasis
(Lin et al., 2005). To address a likely Spargel function as a transcriptional regulator, we
performed genome-wide microarray analysis using dissected fat bodies. As described in
previous experiments, feeding mid-third instar larvae were taken for all experiments (4 days
after egg deposition (AED) for control, and 5d AED for spargel mutants). The full data set
can be accessed at the NCBI database (Edgar et al., 2002) using accession number GSE14780.
GO Biological Process, >1.5x down in srl1/1 mutant fat body (P<0.05) GO Biological Process, >1.5x up in srl1/1 mutant fat body (P<0.05) GO ID P-value Term GO ID P-value Term Mitochondrial Biogenesis and Function Developmental process GO:0022900 3.45E-25 Electron (e-) transport GO:0007594 5.55E-03 Puparial adhesion GO:0006119 8.14E-24 Oxidative phosphorylation GO:0007591 4.60E-02 Molting cycle, chitin-based cuticle GO:0042773 4.67E-23 ATP synthesis coupled e- transport GO:0006091 6.81E-22 Generation of precursor metabolites and energy Lipid metabolism GO:0006120 2.18E-14 Mitochondrial electron transport, NADH to ubiquinone GO:0016042 5.74E-05 Lipid catabolic process GO:0006839 1.80E-03 Mitochondrial transport GO:0006635 9.40E-04 Fatty acid beta-oxidation GO:0007005 1.57E-02 Mitochondrial organization GO:0044242 1.44E-04 Cellular lipid catabolic process GO:0006123 2.03E-02 Mitochondrial e- transport, cytochrome c to oxygen Transcription and Translation Others GO:0006412 5.83E-49 Translation GO:0006810 1.03E-03 Transport GO:0010467 2.91E-33 Gene expression GO:0051179 3.82E-03 Localization GO:0019538 5.82E-15 Protein metabolic process GO:0042254 1.52E-30 Ribosome biogenesis and assembly GO:0016072 1.27E-18 rRNA metabolic process GO:0006457 6.45E-03 Protein folding GO:0055086 1.04E-04 Nucleobase, nucleoside and nucleotide metabolic process Cell cycle GO:0051231 1.15E-18 Spindle elongation GO:0007052 4.69E-12 Mitotic spindle organization and biogenesis GO:0000226 3.93E-06 Microtubule cytoskeleton organization/biogenesis GO:0000278 3.98E-05 Mitotic cell cycle Cellular metabolic processes GO:0008152 4.31E-36 Metabolic process GO:0044249 3.04E-18 Cellular biosynthetic process GO:0009059 2.08E-17 Macromolecule biosynthetic process GO:0044267 5.42E-15 Cellular protein metabolic process GO:0006996 2.67E-06 Organelle organization and biogenesis
Table 1. GO-Term enrichment for genes that were significantly up- or downregulated >1.5-fold in the
srl1/1 mutant fat body compared to wildtype. Shown are the GO terms that are significantly enriched (P-value
<0.05).
Stefanie Katharina Tiefenböck 30

Ph.D. Thesis
Using Affimetrix chips with 18952 probes per array, we detected 8871 probes with a present
signal in the fat body. Out of these, a total number of 2827 genes (31.87%) was more than
1.5x regulated in the srl1 mutant. Among these, the transcript levels of 1019 genes (11.49%)
were increased and 1808 genes (20.38%) showed decreased expression. Spargel transcript
itself was reduced to 29.38% (Log2 Ratio: -1.767, P-value: 0.0498) in the srl1 mutant fat
bodies. To find out which processes are mostly affected by the transcriptional deregulation of
these genes, we performed a Gene Ontology (GO) Term analysis.
Interestingly, we found only a few GO processes enriched in the spargel mutant that were
significantly upregulated and these could be manually clustered into three main GO categories
(Table 1): developmental process, lipid metabolism and general signalling and transport
events. The upregulation of genes involved in developmental processes, like puparial
adhesion and molting cycle, could be a result from the 1-day developmental delay of spargel
mutant larvae. Interestingly, many genes involved in lipid metabolism including fatty acid
beta-oxidation are upregulated (Table 2). This reflects a major deregulation of lipid
metabolism and agrees with the lipid droplet phenotype observed in the spargel mutant fat
body (Chapter 2.2.4.). Although at this timepoint we can not fully exclude a direct regulation
of certain genes involved in lipid metabolism through Spargel, a secondary effect on lipid
metabolism is more likely.
Table 2. List of selected genes involved in
lipid metabolism. Shown are the expression
data from the fat body-specific microarray
analysis described. The transcript levels of
these genes are significantly upregulated in the
spargel mutant fat body. The ratio indicates the relative fold change in gene expression between srl1/1 to control
(precise excision).
Gene Name CG Number
Ratio (srl1/1 vs. Srlwt/wt ) P-Value
ß-oxidation CptI CG12891 1.6610 0.0273 MCAD CG12262 2.9260 0.0034 Thiolase CG4581 1.6780 0.0239 CG4388 CG4389 1.5310 0.0067 Lipid homeostasis Lsd-1 CG10374 1.4180 0.0158 Lsd-2 CG9057 2.6490 0.0039 Lipase Bmm CG5295 2.1890 0.0130
Stefanie Katharina Tiefenböck 31

Ph.D. Thesis
In contrast, the enrichment for GO processes among the downregulated genes revealed a
number of different categories that were affected in the spargel mutant (Table 1). Importantly,
genes involved in mitochondrial functions, in particular oxidative phosphorylation
(OXPHOS; mostly electron transport complexes I and V), were expressed at significantly
reduced levels in the spargel mutant. In addition to the deregulation in mitochondria, only a
few non-mitochondrial functions were downregulated in the spargel mutant. These include
translation, gene expression and RNA biology, processes that are essential for the
accumulation of cellular mass. We showed before that spargel mutant larvae have growth
defects (2.2.1.), therefore this phenotype probably results from a combination of Spargel’s
effect on mitochondrial and non-mitochondrial functions. At this point, we will first continue
with the discussion of Spargel’s role in mitochondrial biology, the effect on organismal
growth will be discussed more in detail in the Chapters 2.6. and 3.
As one main function of the mammalian PGC-1 proteins is the transcriptional control of
nuclear encoded mitochondrial genes (reviewed in (Scarpulla, 2002; Scarpulla, 2008)), we
performed a detailed analysis of all predicted 313 nuclear genes encoding mitochondrial
proteins (source: MitoDrome, http://www2.ba.itb.cnr.it/MitoDrome, (Sardiello et al., 2003)).
Out of 252 detected genes, only 14.68% were upregulated (Table 3; and Appendix, section
4.1.). These included genes involved in stress response (heat-shock proteins) and fatty acid
beta-oxidation which has already been discussed above. In contrast to the relatively low
number of mitochondrial genes with increased expression, more than half (55.16%) of the
detected genes involved with mitochondrial functions were >1.5-fold downregulated in the
spargel mutant fat body (Table 3 and Appendix, section 4.1.).
Stefanie Katharina Tiefenböck 32

Ph.D. Thesis
Table 3. Categories of mitochondrial functions. Shown is the number of genes that were detected per
category. The numbers in brackets indicate the total number of genes annotated per category. Up or down
columns show the number of genes that were significantly up- or downregulated >1.5-fold in the srl1/1 mutant fat
body compared their wildtype control (Srlwt/wt).
Category # detected (of total #) up down
OXPHOS 76 (89) 6 60 TCA 29 (40) 8 12 Ribosomal proteins, protein folding, stabilization 25 (30) 3 18
Protein targeting and proteolysis 20 (30) 3 9 AA metabolism 33 (45) 6 13 Lipids 21 (24) 7 3 DNA and RNA 7 (8) 0 6 Others (Sulfur, nucleotide and cofactor metabolism, transport facilitation, cell death and others)
41 (47) 4 18
Total # 252 (313) 37 139 Percentage of detected genes 100 14.68 55.16
This included not only genes encoding proteins for mitochondrial function, like complex I-V
of the oxidative phosphorylation, but also factors that control the replication and transcription
of the mitochondrial genome, such as TFAM, mtTFB1, mtTFB2 and mtSSB. In addition,
regulators of mitochondrial translation, like the mitochondria-specific translation elongation
factor Tu (EfTuM), and a number of mitochondrial ribosomal proteins, among these mRpL12
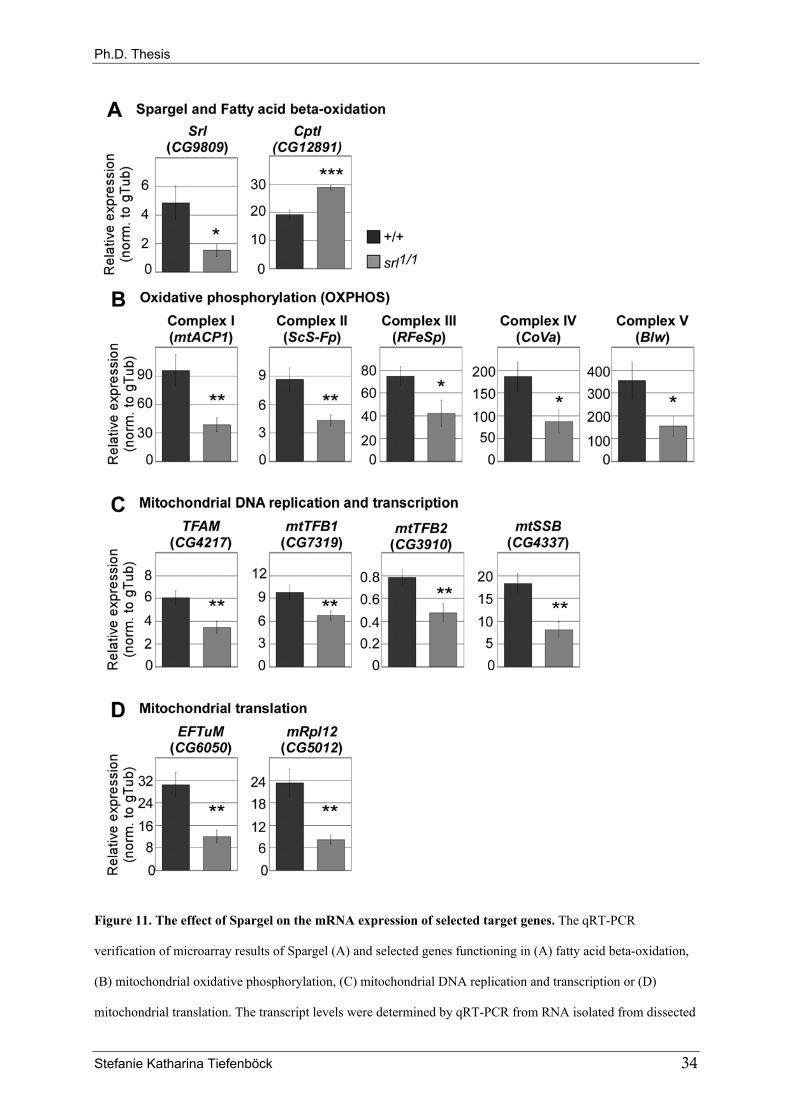
and bonsai, were affected. qRT-PCR confirmed the deregulation of these genes (Fig. 11).
Stefanie Katharina Tiefenböck 33
Ph.D. Thesis
Figure 11. The effect of Spargel on the mRNA expression of selected target genes. The qRT-PCR
verification of microarray results of Spargel (A) and selected genes functioning in (A) fatty acid beta-oxidation,
(B) mitochondrial oxidative phosphorylation, (C) mitochondrial DNA replication and transcription or (D)
mitochondrial translation. The transcript levels were determined by qRT-PCR from RNA isolated from dissected
Stefanie Katharina Tiefenböck 34

Ph.D. Thesis
fat bodies (3 biological replicates). As in the microarrays mid-third instar larvae were taken (4d AED for +/+, 5d
AED for srl1/srl1). Transcript levels were normalized to gammaTubulin23C (gTub, CG3157). In all cases, the
significance is indicated as compared to the control sample. *** equals P<0.001; ** equals P<0.01; * equals
P<0.05.
As many aspects of mitochondrial mass and function were downregulated, we further
analysed to what extent mitochondrial mass was affected in the spargel mutants and if these
mitochondria were functional. As mentioned in the introduction, PGC-1 proteins regulate the
expression of nuclear encoded mitochondrial genes by coactivating the NRF-1 and NRF-2
transcription factors as well as the nuclear receptor ERRα. In the fly only Delg, the
Drosophila homolog of NRF-2, has been shown to affect mitochondrial gene expression in
the larval fat body (Baltzer et al., submitted). Thus, we tested, if analogous to the PGC-
1/NRF-2 interaction, a similar regulatory interaction on gene expression exists in the fly.
2.5. The effect of Spargel in the control of mitochondrial mass and activity and
its in vivo interaction with Delg, the mammalian homolog of NRF-2α
2.5.1. Spargel and Delg, the Drosophila homolog of mammalian NRF-2a, share many
target genes
First, we analyzed if Spargel and Delg would have overlapping transcriptional targets. We
therefore compared fat body-specific microarray data of spargel or delg single mutants in
more detail and focused on genes encoding mitochondrial proteins. Interestingly, we found
that of all genes that are downregulated in either the spargel or the delg mutant, about half (88
genes) overlapped (Fig. 12A and Appendix, section 4.1.). This included many OXPHOS and
TCA cycle genes. In contrast, 46 genes were downregulated in the spargel, but not in the delg
Stefanie Katharina Tiefenböck 35

Ph.D. Thesis
mutant. These genes function in electron transport (complex I), DNA and RNA metabolism
and mitochondrial protein synthesis and targeting. In addition, 27 genes were affected in a
Delg-specific manner, including genes required for amino acid and fatty acid metabolism. We
conclude that Spargel and Delg share many putative target genes, but also affect transcription
independently of each other.
To verify the microarray data, we again dissected larval fat bodies, and used qRT-PCR to
quantify mRNA levels of selected genes. Glutamate dehydrogenase (Gdh), involved in amino
acid synthesis, was strongly affected in the delg, but not in the spargel mutant. Moreover, we
examined two genes that, based on chromatin immunoprecipitation experiments, are direct
Delg targets: RFeSP, the Rieske iron-sulfur protein of complex III, and Bellwether (Blw), the
ATP synthase subunit alpha of complex V (Baltzer et al., submitted). Both genes were
expressed at lower levels in either spargel or delg single mutants. Importantly, spargel delg
double mutants did not show a further decrease in RFeSP and Blw mRNA levels (Fig. 12B).
We conclude that Spargel and Delg have a common role in the expression of many genes
encoding mitochondrial proteins, possibly through Spargel-mediated coactivation of Delg.
Yet at the same time, either factor is required for expression levels of a subset of these genes
independently of the other.
Stefanie Katharina Tiefenböck 36

Ph.D. Thesis
Figure 12. Spargel and the NRF-2α homologue Delg share many putative target genes. (A) Comparison of
microarray data from srl1/1 and delg-/- single mutants using mRNA of fat bodies dissected from mid-L3 larvae.
Shown is the overlap of all nuclear encoded mitochondrial genes that are downregulated >1.5x. Processes that
are regulated in a Spargel- or Delg-specific manner, respectively, as well as overlapping gene sets are indicated
below. (B) The expression of nuclear encoded mitochondrial proteins (RFeSP, Blw and Gdh) was determined by
qRT-PCR from RNA isolated from dissected fat bodies (3 biological replicates). As above, mid-third instar
larvae were taken (4d AED for wildtype, 5d AED for spargel, 6d AED for delg, 8d AED for spargel delg).
Transcript levels were normalized to gammaTubulin23C (gTub, CG3157). In all cases, delg-/- refers to
delg613/Df(3R)ro80b. In all cases, the significance is indicated as compared to the control sample.
2.5.2. Spargel and Delg function in parallel pathways in respect to mitochondrial mass
To test whether the reduced expression of genes encoding mitochondrial proteins would result
in defective mitochondria we analyzed the mitochondrial mass and activity of the spargel
mutants more in detail. In parallel, we tested the in vivo relevance of the results from the
microarray comparisons between Spargel and Delg by analyzing the mitochondrial
phenotypes in a spargel delg double mutant. As a read-out for mitochondrial mass, we first
Stefanie Katharina Tiefenböck 37

Ph.D. Thesis
performed MitoTracker stainings on larval fat bodies of wildtype (+/+), spargel (srl1/1) and
delg (delg-/-) single mutants and the spargel delg double mutants. Similar to the stainings in
Chapter 2.2.4., control animals had abundant mitochondrial staining throughout the cytoplasm
(Fig. 13A). In spargel mutants, we detected no or only a minimal reduction in staining. In
contrast to the spargel single mutants (Baltzer et al., submitted), delg single mutants showed a
strong reduction in mitochondrial staining, where residual mitochondria are concentrated
around the nucleus. Importantly, spargel delg double mutants had a more severe phenotype
compared to the delg single mutant, where only few mitochondria are stained per cell. To
complement the MitoTracker staining, we used NAO, which specifically labels the
mitochondrial phospholipid cardiolipin. Again, spargel mutant cells showed almost no
decrease in staining compared to control, whereas delg mutants had strong defects, which
were even exacerbated in the double mutant (Fig. 13B). These data demonstrate that Spargel
is not required for mitochondrial mass under normal conditions, but becomes limiting in the
absence of Delg suggesting an additive effect of Spargel and Delg in the control of
mitochondrial mass. Furthermore, since delg single mutants but not spargel alone showed a
reduction in mitochondrial stainings, our findings imply that Delg-specific functions, such as
fatty acid and amino acid metabolism (e.g. Gdh), are rate-limiting for mitochondrial mass.
The fat body is known to release lipids and amino acids, in particular proline, providing
energy sources for other tissues (Baker and Thummel, 2007). Since proline is synthesized
from the mitochondrial TCA cycle intermediate 2-oxoglutarate, we propose that such a
function could be rate-limiting for mitochondrial mass is the fat body. In contrast, genes that
require Spargel for expression, in particular OXPHOS genes, are not determining
mitochondrial mass. In agreement, the fat body of wild type larvae does not attract tracheoles
for gas exchange (Jarecki et al., 1999), suggesting low rates of mitochondrial respiration.
Indeed, compared to other larval tissues like the gut, we detected a low inner-mitochondrial
Stefanie Katharina Tiefenböck 38

Ph.D. Thesis
membrane potential and reduced oxygen consumption in the mitochondria of the fat body
(Baltzer et al., submitted).
Figure 13. Spargel and Delg have additive effects on mitochondrial mass. (A) Mitochondria-specific
MitoTracker stainings of larval fat bodies. DAPI is shown as insets. (B) NAO stainings, specific for the
mitochondrial phospholipid cardiolipin, in unfixed larval fat bodies. Hoechst33342 is shown as insets. For (A) and
(B), bar equals 20µm. Mid-L3 larvae were used, except for the spargel delg double mutant in (A) which was
taken at age 5d AED. Kindly provided by Christian Frei.
To further test for additive defects, we measured larval growth rates. Whereas spargel or delg
single mutants pupated with a 1 or 2-day delay, respectively, double mutants grew very
slowly, showing strongly reduced size at 4 days AED, and pupation occurred with a 4-day
delay (Fig. 14). This phenotype is similar to mutants lacking the mitochondrial ribosomal
protein S15 (Galloni, 2003) or the mitochondrial protein translocator Tim50 (Sugiyama et al.,
2007), thus might be caused by additive mitochondrial defects. Alternatively, since Spargel
and Delg are required for proper expression of genes involved in translation and ribosome
biogenesis (Table 1 and Baltzer et al., submitted), non-mitochondrial functions might be
impaired in the double mutant, leading to the apparent growth defects. In either scenario,
Stefanie Katharina Tiefenböck 39

Ph.D. Thesis
although Spargel and Delg might function together in the expression of individual genes,
these factors act in parallel pathways in respect to mitochondrial mass and larval growth rates.
Figure 14. Additive effects on larval growth and development in spargel delg double mutants. (A) Additive
effect of Spargel and Delg on larval development. All larvae are at age 4d AED. Bar equals 1mm. (B) Larval
volumes of wildtype, spargel or delg single mutants, as well as spargel delg double mutants. Pictures of larvae at
the indicated time points were taken and larval volumes were determined by measuring the larval dimensions in
Adobe Photoshop and subsequent calculation in Excel using the following formula: 4/3π(Length/2)2(Diameter/2)
(Colombani et al., 2003). While spargel and delg single mutants shown modest growth defects, they pupate
(indicated as “P”) with a 1-day or 2-day delay, respectively. The spargel delg double mutants show strongly
reduced larval growth rates, and pupate with a 4-day delay. Moreover, spargel delg double mutant pupae are
significantly smaller than control or single mutant pupae. Kindly provided by Nicole Egli.
2.5.3. Oxidative phosphorylation defects in spargel delg double mutant fat bodies
To test for the functionality of the mitochondria of the single and double mutants we looked at
mitochondrial activity. For this we took several approaches. First, we performed an activity
assay for Cytochrome c oxidase (COX), which is part of complex IV in the mitochondrial
electron transport chain. Compared to the wildtype, no difference in activity could be
observed for the spargel mutant (Fig. 15). As described before (Baltzer et al., submitted) delg
Stefanie Katharina Tiefenböck 40

Ph.D. Thesis
mutants showed a higher activity. The spargel, delg double mutant fat bodies had comparable
COX activity to the delg single mutant. In contrast to the additive effect on mitochondrial
mass, Spargel and Delg show no additive effect on mitochondrial COX activity (Fig. 15).
COX activity assay
Figure 15. No additive effect of Spargel and Delg on mitochondrial COX activity. Shown is the COX
activity assay of mid-3rd instar larval fat bodies. Inset shows addition of KCN, what inhibits COX activity
(kindly provided by Nicole Egli).
Another test for OXPHOS activity is the quantification of the mitochondrial respiration. For
this, we measured oxygen consumption of dissected, digitonin-permeabilized fat bodies (Fig.
16A). The advantage of this method is that mitochondria can be studied in situ therefore the
risk of damaging or losing mitochondria during the isolation procedure is minimized and their
physiological environment is preserved (Kuznetsov et al., 2008). Compared to control,
spargel mutant fat bodies showed identical respiration upon stimulation of complex I by
pyruvate and proline (state 2). Moreover, maximal respiration (state 3; upon addition of
ADP), and uncoupled respiration not linked to ATP synthesis (state 4; after the addition the
ADP/ATP transporter inhibitor atractyloside) were not changed. When delg single mutants
were analyzed, we noted slightly reduced state 2 and state 4 respirations, as well as lower
basal oxygen consumption in the presence of the complex IV inhibitor cyanide. However,
these defects are compared to the isogenic control of the spargel mutant. When compared to
their own control, delg mutants did not show reduced respiration rates (Baltzer et al.,
submitted) suggesting less abundant yet more active mitochondria. When spargel delg double
Stefanie Katharina Tiefenböck 41

Ph.D. Thesis
mutant fat bodies were assayed, we noted increased state 2 and state 4 respiration. This is
most likely due to enhanced non-mitochondrial oxygen consumption, since we also detected a
respiration increase in the presence of cyanide. Importantly, spargel delg double mutants were
not induced to the same extent by the addition of ADP: Whereas the ratio of state 3/state 2
was at least 2.5 for control and single mutant tissues, this ratio was reduced to 2 in the double
mutant (Fig. 16B). Since this ratio is indicative of the OXPHOS capacity, these data
demonstrate respiration defects in spargel delg double mutant fat bodies. In addition, we
noted a decreased respiratory control ratio (RCR; state 3/state 4 ratio), indicative of increased
uncoupling. To further analyse the degree of coupling in the mutant mitochondria, we also
measured total fat body ATP levels. Confirming the respiration measurements, no difference
in ATP content between the spargel mutant compared to wild type could be detected (Fig.
16C). ATP levels in delg mutants were significantly upregulated further supporting the
hypothesis of more active mitochondria in this mutant (Baltzer et al., submitted). In the
spargel, delg double mutant no difference to wild type could be observed suggesting that the
coupled activity of mitochondria in the double mutants is efficient enough to reach wildtype
ATP levels. To further look into mitochondrial coupling we determined the expression levels
of uncoupling proteins. Quantitative real time PCR showed that, whereas UCP4A is not
regulated in any of the mutants, UCP4B and Bmcp are upregulated in the spargel, delg double
mutant, but not in either single mutants (Fig. 16D). This is in agreement with the increased
uncoupling observed in the double mutant compared to the single mutants. In summary, these
data show a common effect of Spargel and Delg on uncoupled respiration, but an independent
control of mitochondrial coupled respiration. Given the strong mitochondrial mass reduction
in the double mutants (Fig. 13A and 13B), it appears surprising that the tissue respires, even at
reduced capacity. However, as described above, OXPHOS is not the predominant function of
fat body mitochondria, suggesting that only minimal mitochondrial mass is required.
Moreover, a transcription-independent mechanism might compensate for reduced expression
Stefanie Katharina Tiefenböck 42

Ph.D. Thesis
of OXPHOS. Alternatively, factors that are rate-limiting for OXPHOS activity might be
controlled in a Spargel and Delg-independent manner. Future work is required to test these
models.
To finish the characterization of mitochondrial function, we quantified the mitochondrial
DNA (mtDNA), which encodes several factors required for electron transport, and which
levels were shown to correlate with OXPHOS activity (Rocher et al., 2008). When
normalized to nuclear DNA, we did not detect a change in the spargel single mutant, but
increased levels in delg single and the double mutants (Fig. 16E). Importantly, this did not
lead to enhanced mtDNA transcription, since we detected reduced transcript levels of
mitochondrial encoded ND1 (NADH-ubiquinone oxidoreductase chain 1) or COX subunit I
(Fig. 16F). Given the general correlation between mtDNA replication and transcription in
mammalian cells, this appears surprising. There are two possible explanations for this
discrepancy: first, the larval fat body is an endoreplicative tissue and cells of the delg single
mutant as well as the spargel, delg double mutant show growth defects which is often
connected with endoreplication (Edgar and Orr-Weaver, 2001). As the amount of
mitochondrial DNA was normalized to genomic DNA levels it is not completely clear
whether the mtDNA is upregulated in our case or if these cells contain less nuclear DNA.
Further analyses are necessary to clarify this. Second, a similar observation has been
described recently upon downregulation of mitochondrial transcription factor B2 (Adan et al.,
2008). Thus in Drosophila, mtDNA transcription can be uncoupled from mtDNA levels, at
least under mutant conditions and the reduced OXPHOS capacity in the spargel delg double
mutant might be caused by defects in mitochondrial transcription. Taken together, we showed
that uncoupling and non-mitochondrial respiration is upregulated in the spargel delg double
mutant, indicating a common action of the two factors on these processes. On other
mitochondrial aspects like coupled respiration, ATP levels, mtDNA content, as well as the
Stefanie Katharina Tiefenböck 43

Ph.D. Thesis
activity of COX, no additive effects could be observed in the double mutant. In agreement
with this, no additive effects on the expression of oxidative phosphorylation genes could be
detected in the double mutant (Nicole Egli, Master`s Thesis; data not shown). In summary,
these data support that Spargel and Delg function in parallel pathways in vivo.
Figure 16. Spargel and Delg function in parallel pathways. (A) Oxygen consumption of digitonin-
permeabilized dissected fat bodies. State 2: respiration after stimulation of complex I (addition of
pyruvate/proline). State 3: maximal respiration (addition of ADP). State 4: uncoupled respiration (addition of the
ADP/ATP transporter inhibitor atractyloside). KCN (complex IV inhibitor) was added to monitor background.
Respiration was normalized to total fat body protein (3 biological replicates). (B) Ratios of oxygen consumption
from D. The respiratory control ratio (RCR) reflects state 3/4. (C) ATP content was measured from the fat bodies
of mid 3rd instar larvae. (D) The expression of uncoupling proteins UCP4A, UCP4A and Bmcp was analyzed by
qRT-PCR on RNA isolated from dissected fat bodies (5 biological replicates, courtesy of Nicole Egli). (E)
Mitochondrial DNA (mtDNA) content was quantified by qPCR and normalized to nuclear DNA (nDNA) levels
from dissected fat bodies. Averages and standard deviations were calculated from 6 biological replicates. (F)
Mitochondrial-encoded COX (Subunit I) and ND1 were determined by qRT-PCR (3 biological replicates). For
(D) and (F): Transcript levels were normalized to gammaTubulin23C. We used mid 3rd instar larvae for all
experiments. In all cases, the significance is indicated as compared to the control sample.
Stefanie Katharina Tiefenböck 44

Ph.D. Thesis
2.5.4. Discussion
Our microarray analysis shows that Drosophila Spargel is predominantly required for the
proper expression of genes encoding mitochondrial proteins which is analogous to the
function of the mammalian PGC-1 proteins. Importantly, in contrast to its mammalian
homologs, Spargel is not a master regulator of mitochondrial biogenesis as we can not detect
any obvious changes in mitochondrial mass in the spargel single mutant. Rather, Spargel
becomes limiting for these functions in the absence of Delg, a functional and structural NRF-
2α homologue, suggesting an additive effect of Spargel and Delg in the control of
mitochondrial mass.
Furthermore, we showed that uncoupling and non-mitochondrial respiration is upregulated in
the spargel delg double mutant, indicating a common action of the two factors on these
processes. On other mitochondrial aspects of mitochondrial activity (respiration efficiency,
ATP content and COX activity), however, no additive effects could be observed in the double
mutant. This suggests that these two factors act not only on common downstream targets, but
also have independent functions in the larval fat body. This clearly differs from the
mammalian system, where PGC-1s and NRF-2α function together on expression of nuclear
genes encoding mitochondrial proteins. To further investigate these findings interaction
studies will be important to reveal whether Spargel and Delg interact directly and whether
Spargel has coactivator function.
Additionally, as spargel single mutants do affect the expression of genes that control
mitochondrial biogenesis (such as mitochondrial transcription and translation factors) electron
microscopy experiments should be done to look at mitochondrial morphology and
mitochondrial mass in more detail. Also, in analogy to the function of mammalian PGC-1s
during certain stress stimuli, mitochondrial function in the spargel mutant could be challenged
Stefanie Katharina Tiefenböck 45

Ph.D. Thesis
to test if Spargel is required to modulate adaptations of mitochondrial functions in response to
specific stimuli, such as increased activity, cold exposure or reactive oxygen stress.
The expression analysis of spargel mutant fat bodies showed that also non-mitochondrial
functions were affected. These include major processes involved in the regulation of growth,
like gene expression and translation. Because spargel mutant larvae display a defect in
developmental size increase, which becomes more dramatic in the spargel delg double
mutant, we further analyzed a possible function for Spargel in the control of cellular and
organismal growth.
Stefanie Katharina Tiefenböck 46

Ph.D. Thesis
2.6. Spargel is required for insulin-signalling mediated growth and controls
part of the transcriptional changes induced by insulin-signalling
2.6.1. Background
There is only little known about the regulation of mitochondria in response to growth-
promoting pathways and nutrient availability, so one main interest of my PhD thesis was to
elucidate the in vivo regulation of this process. As already mentioned in the introduction,
many of the known growth-driving pathways are well conserved in the fly: the insulin/TOR
pathway (Grewal, 2008), Myc (Eilers and Eisenman, 2008), CyclinD/Cdk4 (Datar et al.,
2000; Meyer et al., 2000) or the Hippo tumour-suppressor pathway (Saucedo and Edgar,
2007).
Out of these the insulin/TOR signalling pathway has been shown to mediate a link between
nutrients, cellular metabolism and growth (Britton et al., 2002). Important for this study,
recent microarray studies in the fly have shown that starvation, and subsequent reduced
insulin-signalling activity, leads to lower expression of genes encoding mitochondrial proteins
(Gershman et al., 2007; Teleman et al., 2008). Since the insulin-signalling pathway is well
characterized in the fly and many tools are available for genetic and biochemical studies, we
chose this pathway to analyze a functional interaction between PGC-1/Spargel, mitochondrial
biogenesis and growth control.
In flies, the insulin receptor (INR) is activated by the binding of insulin-like peptides (dILPs)
(Brogiolo et al., 2001) that are released from a cluster of median neurosectrectory cells in the
brain, the IPCs (insulin-producing cells), upon specific nutritional cues (Colombani et al.,
2003; Ikeya et al., 2002). This stimulates a signalling pathway that includes Chico, the
Stefanie Katharina Tiefenböck 47

Ph.D. Thesis
homolog of mammalian Insulin receptor substrate (IRS) as well as the downstream kinases
PI3K/Dp110 and PKB/Akt and results in the subsequent inhibition of the forkhead
transcription factor dFoxo (Grewal, 2008). Importantly, as multiple proteins have been shown
to influence insulin-signalling, this pathway is not linear, but regulates and responds to other
signalling pathways (Colombani et al., 2005; Grewal, 2008; Orme et al., 2006; Wang et al.,
2005). Accordingly, although dFoxo appears to be the predominant factor to control
transcription in respect to insulin signalling, additional transcription factors must exist, since
many genes are regulated in a dFoxo-independent manner upon starvation (Teleman et al.,
2008).
2.6.2. Insulin receptor-signalling requires Spargel to mediate its effects on cellular
growth
To analyze a possible role for Spargel within the insulin signalling-pathway, we tested if
Spargel is required for insulin-signalling to mediate its effect on growth. For this, we
ectopically induced cell-autonomous growth by the overexpression of INR (UAS-INR,
(Brogiolo et al., 2001)) in random clones that are marked with GFP using the Flip-out/Gal4
system (Tubulin>CD2>Gal4, UAS-GFP (Scott et al., 2004)) and compared the size phenotype
in the wildtype to the spargel mutant background. In wildtype fat body cells, the
overexpression of UAS-INR led to an enormous overgrowth phenotype that is characterized
by an increase in cellular and nuclear areas (Fig. 17A). Interestingly, this is accompanied by a
significant reduction in lipid droplet size as revealed by Nile red, a dye specific for lipids.
This probably reflects increased demand for energy during cell growth, coupled with
enhanced phospholipid usage for membrane synthesis. In contrast to the wildtype background,
the effects of INR overexpression on cell growth and lipid droplets are completely abrogated
in the spargel mutant background, demonstrating a requirement for Spargel.
Stefanie Katharina Tiefenböck 48

Ph.D. Thesis
To genetically characterize Spargel’s role in insulin-signalling, we generated double mutants
of spargel and chico, the latter being the Drosophila IRS-1 homologue, and the best-studied
mutant of the insulin-signalling pathway (Bohni et al., 1999). Chico mutants have
significantly reduced adult body weight, thus are similar to spargel mutants, but the effect is
stronger. Importantly, we did not observe a further weight reduction in chico spargel double
mutants (Fig. 17B), suggesting that Spargel might have an integrate role in the insulin-
signalling pathway.
Figure 17. Insulin-signalling requires Spargel to mediate its effect on growth. (A) UAS-INR was expressed
in random clones using the hs-Flp; Tub>CD2>Gal4, UAS-GFP system in wildtype or spargel mutant
background. Shown are stainings from larval fat bodies, using Nile red (red) specific for lipid, DAPI (blue)
specific for DNA and GFP (green), which marks INR expressing cells. Bar equals 20µm. (B) Weight of adult
males, 2 days after eclosion. Genotypes are indicated. *** equals P<0.001; ns: not significant.
To further elucidate the dependence on Spargel for insulin-signalling to drive growth, we
overexpressed INR (Brogiolo et al., 2001), an activated form of PI3K/Dp110 (Leevers et al.,
1996) or myristylated Akt (Stocker et al., 2002) in random clones, and measured cell size
using phalloidin, and nuclear size using DAPI (Fig. 18A). As seen in Figure 18B, the increase
in cell and nuclear sizes upon INR and Dp110CAAX expression was significantly suppressed in
Stefanie Katharina Tiefenböck 49

Ph.D. Thesis
a spargel mutant background compared to their respective controls. Interestingly, we did not
observe a difference in cellular or nuclear areas between wildtype controls and the spargel
mutant when overgrowth was induced by myrAkt expression. This suggests that Spargel
function is required downstream of INR and Dp110, but not Akt.
However, we noticed that Akt only induced a relatively mild overgrowth in the fat body cells
(Fig. 18B). This is surprising, as the allele used in this experiment was reported to be a potent
inducer of overgrowth in the eye (Stocker et al., 2002). In addition, the ectopic activation of
myrAkt did not lead to increased lipid usage as we could not detect a difference in lipid
droplet size (Fig. 18C). To confirm that myrAkt function is really activated in this system we
performed an antibody staining against dFoxo. Functional myrAkt inhibits dFoxo and leads to
a relocalization from the nucleus to the cytoplasm. As shown in Figure 18D, we find less
nuclear dFoxo in the clones overexpressing myrAkt suggesting that Akt protein is induced
and functional. One possible explanation for this relatively mild growth induction could be
that Akt has only a minor function in the regulation of cell growth in the fat body as compared
to the eye. As an alternative, an other Akt isoform than the one used for the generation of this
gain-of-function allele could be the important one in the fat body. However, these hypotheses
need to be further investigated. Thus, based on the clonal analysis of myrAkt overexpression,
we can not conclusively determine the genetic interaction of Spargel with Akt.
Stefanie Katharina Tiefenböck 50

Ph.D. Thesis
Figure 18. INR and Dp110, but not Akt require Spargel to mediate their effect on growth. (A) Phalloidin
staining (red, membranes) of wildtype fat bodies expressing UAS-INR (green) in clones. DAPI marks nuclei
(blue). Bar equals 50µm. (B) Quantification of cell area (CA) and nuclear area (NA) of clones expressing UAS-
INR, UAS-Dp110CAAX or UAS-myrAkt in wildtype or srl1/1 mutant fat bodies. Shown is the fold increase
compared to the surrounding control cells (ctrl) not expressing insulin-signalling components. n>25. (C) Clonal
expression of UAS-myrAkt in wildtype background. Shown are stainings from larval fat bodies, using Nile red
(red) specific for lipid, DAPI (blue) specific for DNA and GFP, which marks myrAkt expressing cells. (D) and
(E) Antibody staining against dFoxo (red) shows increased translocation of dFoxo out of the nucleus (DAPI,
blue) into the cytoplasm in the clones that overexpress myrAkt (green) in wildtype (D) or spargel mutant
background (E). For (C) to (E): Bar equals 20µm. For (A) and (C) to (E): Clones were induced using the hs-Flp;
Tub>CD2>Gal4, UAS-GFP system.
Stefanie Katharina Tiefenböck 51

Ph.D. Thesis
The observation that Spargel might function downstream of INR and Dp110, but probably not
Akt, was further investigated by looking at the interaction of Spargel with dFoxo. Since
dFoxo is inhibited by Akt (Junger et al., 2003; Puig et al., 2003), we were interested if Spargel
and dFoxo would function together or independently of each other. To analyze this, we
performed an α-dFoxo antibody staining of clones overexpressing myrAkt in the spargel
mutant background. Similar to the wildtype, dFoxo was relocalized from the nucleus to the
cytoplasm upon activation of myrAkt (Fig. 18E). This shows that the regulation of dFoxo by
Akt is not affected in the spargel mutant, suggesting that Spargel is not involved in the control
of dFoxo downstream of Akt. Furthermore, a spargel foxo double mutant leads to larval
lethality, while both single mutants are viable to adulthood (data not shown). Taken together,
these results show that Spargel is required downstream of INR and Dp110 to induce growth,
but acts in parallel to Akt and dFoxo.
2.6.3. Spargel mediates transcription in response to insulin-signalling in parallel to
dFoxo
As we showed that Spargel is required for insulin-signalling driven growth we hypothesized
that this could result from Spargel`s effect on the regulation of gene expression (Chapter 2.4.).
Therefore, we asked whether Spargel might function as a transcriptional regulator
downstream of insulin-signalling. To test this, we ectopically expressed INR in wildtype and
spargel mutant background and used microarray on dissected fat bodies to compare the
expression profiles. INR expression was induced by a 30min. heat-shock at 37°C using the
above described Flip-out/Gal4 system (Scott et al., 2004). To minimize indirect effects we
dissected the fat bodies relatively quickly after INR induction (13 hours after heat-shock). In
total, four different genotypes and three biological replicates per genotype were analyzed: the
overexpression of INR in the wildtype or spargel mutant background and their respective
Stefanie Katharina Tiefenböck 52

Ph.D. Thesis
controls without INR overexpression. The full data set can be accessed at the NCBI database
(Edgar et al., 2002) using accession number GSE14779.
When INR was overexpressed in a control background, we detected > 90x upregulation of the
INR transcript (Log2 ratio: 6.51, P-value: 1.879x10⁻⁶; data not shown). This lead to a
significant change in expression levels: among 9101 genes that were expressed in the fat
body, a total number of 2254 (24.76%) genes were regulated more than 1.5x (Fig. 19A), 1255
genes were upregulated and 999 were downregulated. GO term enrichment analysis showed
that processes involved in DNA replication, RNA metabolism and ribosome biogenesis are
significantly upregulated (Fig. 19B; see Appendix, section 4.2., for a full list of enriched GO
terms). This reflects the increased need for protein synthesis and the increased degree of
endoreplication during cellular growth in the fat body. Importantly, we find that many genes
encoding for mitochondrial proteins are upregulated by the overexpression of INR.
Stefanie Katharina Tiefenböck 53

Ph.D. Thesis
Figure 19. Spargel regulates part of the transcriptional changes in response to insulin-signalling. (A)
Shown are the 2254 genes that are up- or downregulated >1.5x in the microarray when INR was overexpressed
in the wildtype. Numbers in the white circle indicate how many of these were expressed in a Spargel-dependent
manner. (B) GO analysis of all insulin-responsive genes that were >1.5x up- or downregulated. The percentage
of genes that are expressed in a Spargel-dependent manner is indicated in the last column. (C) The control of
nuclear encoded mitochondrial proteins is regulated in a highly Spargel-dependent manner. (D) qRT-PCR on
RNA isolated from dissected fat bodies (3 biological replicates) confirmed the microarray data on the expression
of nuclear encoded mitochondrial proteins (mtACP1, Idh and Cyt-c-p). Transcript levels were normalized to
Actin5C (CG4027). The significance is compared as indicated.
When we looked into the genes encoding mitochondrial proteins more in detail, we found that
33 of 232 detected genes (14.22%) were induced (Fig. 19C; a full list of the expression levels
of all genes encoding mitochondrial proteins can be found in Appendix, section 4.1.). In
contrast, when INR was expressed in a spargel mutant background, significantly fewer genes
Stefanie Katharina Tiefenböck 54

Ph.D. Thesis
were INR-responsive: 8 of 232 detected (3.45%). Thus the majority (75.75%) of INR-induced
genes required Spargel, especially genes involved in OXPHOS activity, mitochondrial
ribosomal proteins as well as amino acid metabolism (Table 4). We further confirmed these
findings by qRT-PCR to detect mRNA levels of mtACP1, encoding the mitochondrial Acyl
carrier protein 1, Idh, encoding the TCA cycle enzyme Isocitrate dehydrogenase, and Cyt-c-p,
encoding Cytochrome c. While INR required Spargel to drive the expression of mtACP1 and
Idh, Cyt-c-p did not show such dependence (Fig. 19D). Importantly, the requirement on
Spargel for INR to drive gene expression was not limited to mitochondria: when the whole
genome was analyzed, 39.84% of INR-responsive genes required Spargel, in particular genes
involved in translation, RNA metabolism and transcription (Fig. 19A and 19B; Appendix,
section 4.2.). This effect was not due to differences in the expression of INR as INR transcript
levels in the spargel mutant background were induced to comparable levels as in the wildtype
sample (88.36x upregulated; Log2 ratio: 6.47, P-value: 1.039x10⁻⁶). We conclude that Spargel
is required to a large extent for the transcriptional control in response to insulin-signalling.
1473
232
3120
2316
55
25
33
62
72
9
up
01
17
37
10
5
down
00
8
10
12
4
up
TCAOXPHOS
AA metabolismLipids
Protein synthesisProtein targeting
Others
Nuclearencodedmitochondrialgenes
12
22
67
10
5
down
Total
% of total 100 14.22 7.33 3.45 9.48
Table 4. The effect of INR overexpression on the transcription levels of nuclear encoded mitochondrial
proteins sorted according to processes. Shown is the number of genes that were significantly up- or
downregulated >1.5-fold when UAS-INR was overexpressed in the wildtype or the spargel mutant.
Stefanie Katharina Tiefenböck 55

Ph.D. Thesis
Since dFoxo is known to partially mediate the transcriptional control in response to insulin-
signalling, we compared our data set to published, fat body-specific microarrays, where
control or dfoxo mutant larvae were exposed to starvation, reflecting low insulin-signalling
(Teleman et al., 2008). Remarkably, we detected only a minimal overlap between Spargel-
and dFoxo dependent genes, both for genes encoding mitochondrial proteins as well as for the
whole genome (data not shown). This together with our genetic data show that Spargel and
dFoxo are both essential to control transcription in response to insulin-signalling, yet
represent two different output branches. This does however not exclude that Spargel and
dFoxo can function together for a subset of genes. Moreover, it was shown that dFoxo
controls Spargel expression, at least in S2 cells (Gershman et al., 2007), thus giving a
molecular mechanism for such a cooperation.
2.6.4. The activation of INR leads to increased mitochondrial mass and function
The analysis of our microarray data showed that the expression of many genes encoding for
mitochondrial proteins is induced upon ectopic INR activation. This goes in line with
previous reports that have shown that starvation, and subsequent reduced insulin-signalling
activity, leads to lower expression of genes encoding mitochondrial proteins (Gershman et al.,
2007; Teleman et al., 2008). As the functional relevance of this observation was not further
investigated in these studies, we decided to analyze the effect of INR overexpression in
random clones on mitochondrial mass and activity in the larval fat body. Using MitoTracker
as a read-out for mitochondrial mass we observed an increase in mitochondrial staining in the
clones with induced INR activity compared to the control cells (Fig. 20A). Furthermore, a
Cytochrome oxidase C (COX) activity assay showed an increased intensity of the colour-
reaction in the INR overexpression clones (Fig. 20B), suggesting increased COX activity.
Stefanie Katharina Tiefenböck 56

Ph.D. Thesis
Therefore, the effect on the expression of mitochondrial proteins by activated INR signalling
lead to increased mitochondrial biogenesis and activity in the larval fat body.
B
MitoTracker Merge COX A
+/+
+/+
srl1 /s
lr1
srl1 /s
lr1
Figure 20. Overexpression of INR induces mitochondrial mass and activity. (A) MitoTracker (red) stainings
of larval fat bodies. Cells that overexpress INR are marked in green, DAPI is shown blue. Bar equals 20µm. (B)
Cytochrome C activity assay of fat bodies overexpressing INR in clones. INR expressing cells are marked with
an arrow. Bar equals 100µm. For (A) and (B): Clones were induced using the hs-Flp; Tub>CD2>Gal4, UAS-
GFP system. Fat bodies from mid-L3 larvae of wildtype and spargel mutants were used.
As the transcriptional induction of many INR-responsive genes coding for mitochondrial
proteins depended to a large extent on Spargel, we performed the same experiments in a
spargel mutant background. Interestingly, spargel could only partially rescue the effect of
INR overexpression on mitochondrial mass. In addition, COX activity remained unaffected.
Taken together these results suggest that there is at least one parallel pathway to Spargel
downstream of INR to induce mitochondrial mass and function (see also Fig. 23). A candidate
for this could be the transcription factor dMyc, which was recently shown to be downstream
of insulin-signalling in Drosophila (Teleman et al., 2008). In addition, mammalian Myc has
Stefanie Katharina Tiefenböck 57

Ph.D. Thesis
been shown to regulate the expression of many nuclear encoded mitochondrial proteins (Li et
al., 2005; Kim et al., 2008).
2.6.5. Increased Spargel protein levels in response to INR expression
Going back to our observation that Spargel is required for INR-induced growth, we
investigated a possible mechanism for this interaction. Although PGC-1α and PRC are mostly
nuclear proteins (Andersson and Scarpulla, 2001; Puigserver et al., 1998), rat PGC-1α, in
response to a stimulus, is known to translocate from the cytoplasm to the nucleus (Wright et
al., 2007). To test whether Spargel localization could be affected in response to insulin-
signalling, we generated transgenic flies bearing an HA-tagged Spargel on a genomic rescue
construct (HA-SrlGR). When tested by immunofluorescence in the larval fat body, the majority
of HA-Spargel was found in the cytoplasm with relatively little staining in the nucleus under
physiological conditions (Fig. 21A). When INR was expressed in random clones, we noted a
strong increase in HA-Spargel, both in the cytoplasm and to a large extent in the nucleus (Fig.
21C). This result is supported by our microarray study as well as by qRT-PCR, where we
detected increased Spargel transcript levels upon INR overexpression (Fig. 21B). These data
show that Spargel, at least transcriptionally, is induced by insulin-signalling, leading to
elevated Spargel protein, in particular in the nucleus, thus giving a molecular mechanism how
Spargel might mediate gene expression in response to insulin-signalling.
Stefanie Katharina Tiefenböck 58

Ph.D. Thesis
Figure 21. Insulin-signalling affects Spargel expression levels and protein localization. (A) An HA-tagged
Spargel genomic rescue construct (HA-SrlGR) was used to monitor the subcellular localization of the Spargel
protein. Antibody staining against the HA-tag (α-HA; red) shows a predominant cytoplasmic localization. (B)
Relative mRNA levels of the Spargel transcript were quantified by qRT-PCR on dissected wildtype fat bodies
with (+) or without (-) the whole body overexpression of UAS-INR (↑INR). (C) UAS-INR was expressed in
random clones, marked by GFP as described before. HA-antibody stainings (α-HA; red) and DAPI (blue) reveal
an increased localization of HA-Spargel to the nucleus compared to the neighbouring wildtype cells. For A and
B, bar equals 20µm.
2.6.6. Spargel mediates a negative feedback loop on insulin-signalling
Since signalling pathways often involve negative feedback loops to dampen signalling
activity, we analyzed our microarray data in more detail for genes encoding insulin-signalling
components. Indeed, we noted enhanced INR expression in spargel mutants (microarray;
confirmed by qRT-PCR: 1.5x change, P–value = 0.0298), suggesting increased signalling
activity. To analyze the insulin-signalling activity in the spargel mutants more in detail, we
used the tGPH reporter (Britton et al., 2002), which is a fusion protein of the PIP3-binding
pleckstrin-homology domain (PH) and GFP. In the case of high insulin-signalling activity,
Stefanie Katharina Tiefenböck 59

Ph.D. Thesis
PI3K is activated to produce increased levels of PIP3 in the cell membrane which leads to the
recruitment of tGPH to the membrane. Indeed, in the spargel mutant fat body we observe
enhanced PIP3 levels at the plasma membrane compared to the wildtype (Fig. 22A). In
addition, we monitored the phosphorylation status of Akt, which is known to correlate with
Akt activity. Using a phospho-specific Akt antibody we detected increased Akt
phosphorylation by immunoblotting (Fig. 22B), further supporting that insulin-signalling
activity is increased in the spargel mutant fat body. Thus, Spargel is not only required for
insulin-signalling, but also mediates a negative feedback loop, and thus might set a threshold
for insulin-signalling to control metabolism.
Interestingly, the role of Spargel in the regulation of insulin-signalling is fat body-specific as
we do not observe a difference in tGPH localization in other tissues, such as salivary glands or
gut (data not shown). This suggests a tissue-autonomous effect of Spargel on insulin-
signalling.
Figure 22. Spargel mediates a negative feed-back loop on insulin-signalling. (A) tGPH stainings in the larval
fat body, specific for PIP3 levels in response to PI3K activity (Britton et al., 2002). Bar equals 20µm. (B) Total
Akt and phosphorylated Akt (Ser505) levels were detected by western blot and quantified using the Odyssey
Detection system. Band intensities were normalized to the respective Tubulin control, and presented as the ratio
Stefanie Katharina Tiefenböck 60

Ph.D. Thesis
of spargel mutant compared to wildtype. Insulin-signalling was induced by the expression of UAS-INR with a
fat body specific driver (CS2-1A-Gal4). Average and standard deviation were calculated from 4 independent
experiments.
In summary, in the above described experiments we show that Spargel might have an
integrate role within the insulin-signalling pathway: it is required for INR-driven growth
downstream of Dp110, but probably acts in parallel to Akt and dFoxo. In addition, Spargel
mRNA levels and protein localization are controlled by INR-signalling and vice versa Spargel
regulates insulin-signalling activity by a negative-feedback loop. Furthermore, our microarray
analysis of transcriptional changes induced by INR overexpression showed that Spargel
mediates a large part of the insulin-signalling driven expressional response. Among this
Spargel is especially important for the control of genes encoding mitochondrial proteins
suggesting a role for Spargel in the coordination of mitochondrial biogenesis and growth.
Stefanie Katharina Tiefenböck 61

Ph.D. Thesis
3. DISCUSSION AND OUTLOOK
The aim of the study was to investigate if the predicted Drosophila homolog of mammalian
PGC-1 proteins, Spargel/CG9809, would function in the control of mitochondrial biogenesis
in the fly and whether this is linked to growth. Our study shows that Spargel is critical for the
proper expression of genes encoding mitochondrial proteins, supporting that the control of
mitochondria represents the ancestral function of the PGC-1 proteins family. Importantly, our
results show that Spargel is not a master regulator of mitochondrial biogenesis, as in the
spargel single mutant we can not detect major changes in mitochondrial mass or function
(Chapter 2.5.). Parallel pathways must exist that compensate for the lack of Spargel function
(see below). Alternatively, Spargel could be required for stimulated mitochondrial biogenesis
similar to the mammalian PGC-1 proteins. We could test this by monitoring mitochondrial
mass and function in spargel mutants that were exposed to stress stimuli, which are known to
induce mitochondrial biogenesis in mammals, such as exercise or cold treatment.
Spargel and Delg function in parallel pathways to regulate mitochondrial biogenesis
As described above, Spargel is not required for basal mitochondrial biogenesis, however, we
showed that it becomes limiting for these functions in the absence of Delg, a functional and
structural homologue of mammalian NRF-2α. This suggests that Spargel and Delg function in
different pathways to regulate mitochondrial biogenesis which contrasts the current view of
the mammalian PGC-1/NRF-2 interaction: in mammalian cells, overexpression of PGC-1α
led to increased expression of NRF-2α/GABPα (Mootha et al., 2004), and NRF-2 binding
sites in the promoters of mitochondrial transcription factors TFB1M and TFB2M were
required for the coactivation by PGC-1α and PRC (Gleyzer et al., 2005). Similarly, PRC was
shown to coactivate NRF-2β-dependent transcription (Vercauteren et al., 2008), thus it was
assumed that PGC-1 proteins and NRF-2 would function in the same pathway. Very
Stefanie Katharina Tiefenböck 62

Ph.D. Thesis
importantly, these studies focused on individual genes, but not on mitochondrial function and
mass, thus it is still unclear whether NRF-2 is functionally required for PGC-1 proteins in
respect to mitochondrial mass. Although we showed that Spargel and Delg may share many
putative target genes, our genetic interaction data indicate that these factors function in
parallel pathways in respect to mitochondrial mass and OXPHOS activity. Moreover, Delg,
but not Spargel, is required for Cyclin D/Cdk4 to stimulate mitochondrial abundance (Baltzer
et al., submitted; and data not shown), providing additional evidence that Spargel and Delg act
in two different pathways to regulate mitochondria (Fig. 23). However, more biochemical
studies are necessary to test whether Spargel and Delg can also interact directly and whether
Spargel could coactivate Delg in the expression of the identified common target genes. For
this we could use luciferase assays to monitor the increased activation of promoters that have
been shown previously to be directly bound by Delg in a ChIP experiment upon Spargel and
Delg co-overexpression (Baltzer et al., submitted).
Spargel coordinates the expression of mitochondrial proteins with insulin-stimulated
growth
Further we show that Spargel mediates a link between the expression of mitochondrial
proteins and the nutrient-sensitive insulin-signalling pathway. In mammalian cells, several
recent reports have demonstrated a functional link between insulin-signalling and PGC-1
proteins, yet the interaction appears to be complex, and is most likely tissue and/or context
dependent: Some studies showed that PGC-1 proteins were required for insulin-signalling
(Pagel-Langenickel et al., 2008; Vianna et al., 2006), whereas other studies showed an
inhibitory function for PGC-1α (Choi et al., 2008; Koo et al., 2004). In flies, where the
insulin-signalling pathway is well conserved, we demonstrate that Spargel is required for
insulin-signalling stimulated growth, functioning downstream of Dp110, but independently of
Akt and dFoxo, and mediates a negative-feedback loop. Very remarkably, Spargel mediates
Stefanie Katharina Tiefenböck 63

Ph.D. Thesis
40% of the transcriptional control in response to insulin-signalling, demonstrating that
Spargel has an integrate function in the insulin-signalling pathway. Although we showed that
INR overexpression leads to a cell-autonomous increase in mitochondrial mass and activity
(Chapter 2.6.4.), this effect only partially depended on Spargel suggesting the existance of at
least one parallel pathway to Spargel downstream of INR to induce mitochondrial mass and
function (Fig. 23). As mentioned before a candidate to test could be the transcription factor
dMyc, as it has been recently shown to be downstream of insulin-signalling in Drosophila
(Teleman et al., 2008) and in addition, mammalian Myc is proposed to regulate the expression
of many nuclear encoded mitochondrial proteins (Li et al., 2005; Kim et al., 2008). Similar to
mammalian cells, where reduced PGC-1α protein levels were observed upon knockdown of
the insulin receptor InsRβ (Pagel-Langenickel et al., 2008), we detected increased Spargel
protein levels upon INR expression, suggesting a conserved mechanism between flies and
mammals. Thus our data give genetic evidence for a functional interaction between PGC-1
proteins and insulin-signalling, demonstrating that Spargel is a master regulator of
metabolism during Drosophila growth.
Figure 23. Genetic model for Spargel’s role in mitochondrial biogenesis and growth in the Drosophila
larval fat body. The control of mitochondrial biogenesis and growth is mediated by two distinct nutrient-
sensitive pathways: insulin-signalling through Spargel and Cyclin D/Cdk4 through Delg (Baltzer et al.,
Stefanie Katharina Tiefenböck 64
Ph.D. Thesis
submitted). Whereas some genes encoding mitochondrial proteins require Spargel or Delg for proper expression
levels, some genes require both, other genes require neither of these factors. Note that we do not have
biochemical evidence for direct Spargel binding to Delg. Furthermore, additional transcription factors (TF) must
exist downstream of INR-signalling to induce mitochondrial mass and function. In addition to these
mitochondrial functions, insulin-signalling requires Spargel to drive expression of genes involved in cellular
growth, e.g. translation. Finally, Spargel mediates an inhibitory feedback loop on insulin-signalling, thus creating
a critical threshold to control the expression of metabolic genes in response to insulin-signalling. The effect on
larval growth is most likely a combination of mitochondrial, as well as non-mitochondrial functions
Spargel’s effect on larval growth results from the combination of mitochondrial as well
as non-mitochondrial functions
Furthermore, we demonstrated that Spargel is functionally required for insulin-signalling to
mediate its effect on cellular growth. However, based on our data we can not conclude that
this is exclusively linked to Spargel’s effect on mitochondria. As Spargel is also important for
non-mitochondrial processes, like gene expression and translation, its requirement for growth
could be multifunctional. In addition, the delay in development of spargel mutant larvae could
be caused by a hormonal deregulation (reviewed in Mirth and Riddiford, 2007). The molting
hormone ecdysone is a prime candidate for further investigation due to several reasons: First
of all, every developmental transition in the fly is triggered by a peak in ecdysone, making the
hormone a major determinant of developmental timing (Thummel, 2001). Thus, it is also the
master switch for the induction of metamorphosis which is delayed in the spargel mutant.
Secondly, the ecdysone receptor (EcR) is expressed in the fat body and was shown to inhibit
insulin-signalling in the later stages of larval development (Colombani et al., 2005). In
accordance, we showed that spargel mutants have increased insulin-signalling during this late
stage of larval mutants. Additionally, EcR is a nuclear hormone receptor. As the mammalian
PGC-1 proteins act as transcriptional coactivators of many nuclear hormone receptors, we
have already tested the in vivo interaction of Spargel with available nuclear hormone receptor
Stefanie Katharina Tiefenböck 65

Ph.D. Thesis
reporter lines (Palanker et al., 2006). None of these lines showed deregulated activity in a
spargel mutant background. Unfortunately, we could not test such a reporter line for EcR to
analyze a genetic interaction with Spargel. However, other experiments such as Co-IP could
help to identify direct interaction partners of Spargel and thus help to elucidate the mechanism
underlying the observed phenotypic defects in the spargel mutant.
Finally we want to mention that we did not analyse an involvement of Spargel in other
classical functions of PGC-1α and β, such as gluconeogenesis, β-oxidation and lipogenesis
(reviewed in Lin et al., 2005). However, we have evidence from our experiments that these
functions might be vertebrate-specific: first, we did not observe any changes in carbohydrate
metabolism in the microarray study of spargel mutant fat bodies. Although we did detect
changes in lipid metabolism, this might result from a secondary effect. In addition,
gluconeogenesis and β-oxidation are processes that are upregulated under starvation where
Foxo activity is high. As mentioned before, it was shown in S2 cells that Foxo inhibits
Spargel expression and that Spargel mRNA is induced upon refeeding in flies (Gershman et
al., 2007). This is supported by our results, where Spargel transcript levels increase upon INR
activation and decrease under starvation (data not shown). In analogy to this, it was recently
shown that the mRNA and protein levels of PRC, the PGC-1 related cofactor, are upregulated
upon serum stimulation of quiescent fibroblasts. This was further connected to the induction
of genes encoding mitochondrial proteins (Vercauteren et al., 2008) which is similar to what
we observe for Spargel. Given these functional homologies, Drosophila Spargel might be
closest related to PRC.
Taken together, although flies and mammals are several hundred millions apart in evolution,
our study demonstrates that Spargel and its mammalian counterparts PGC-1α, PGC1-β and
PRC have conserved functions in respect to mitochondria and insulin-signalling. Thus Spargel
Stefanie Katharina Tiefenböck 66

Ph.D. Thesis
is most likely the fly orthologue to this family of transcriptional coactivators. In the future,
this will allow us to use Drosophila as a very powerful system to understand regulatory
circuitries that control homeostasis of cellular metabolism.
Stefanie Katharina Tiefenböck 67

Ph.D. Thesis
4. APPENDIX
4.1. Summary of microarray data of all nuclear encoded mitochondrial proteins.
Shown are the log2 ratios and P-values from microarrays on 3 biological replicates. N/A: Not
detected. All microarray data are accessible at the NCBI GEO microarray database using the
following accession numbers: GSE14780 for spargel mutant vs. control (precise excision) and
GSE14779 for INR-overexpression data. Delg microarray data were taken from (Baltzer et al.,
submitted). The collection and clustering of nuclear encoded mitochondrial proteins was taken
from (Sardiello et al., 2003).
Oxidative Phosphorylation Complex I: NADH ubiquinone oxidoreductase srl1/1 vs. srlwt/wt delg/Df vs. +/Df ↑ ctrl; srl1/1 vs.
↑ ctrl; +/+ ↑ INR; +/+ vs.
↑ ctrl; +/+ ↑ INR; srl1/1 vs.
↑ ctrl; +/+
PROTEIN NAME Drosophila log2 Ratio
P-Value
log2 Ratio
P-Value
log2 Ratio
P-Value
log2 Ratio
P-Value
log2 Ratio
P-Value
13 KDA-A SUBUNIT CG8680 -0.987 0.0006 -0.396 0.2459 -0.644 0.0024 0.062 0.3265 -0.383 0.018413 KDA-B SUBUNIT CG6463 N/A N/A N/A N/A N/A N/A N/A N/A N/A N/A 15 KDA SUBUNIT CG11455 0.143 0.1269 -0.482 0.2521 -0.471 0.0055 0.107 0.0095 -0.284 0.047418 KDA SUBUNIT CG12203 -1.050 0.0201 -0.843 0.0699 -0.775 0.0047 0.123 0.1464 -0.470 0.029119 KDA SUBUNIT CG3683 -1.564 0.0111 -0.662 0.2307 -0.902 0.0021 0.089 0.1565 -0.258 0.069620 KDA SUBUNIT CG9172 -1.416 0.0039 -0.756 0.1645 -0.905 0.0003 0.434 0.0024 -0.206 0.188420 KDA SUBUNIT CG2014 0.124 0.5686 -0.542 0.0377 N/A N/A 0.122 0.2241 0.060 0.611723 KDA SUBUNIT ND23 -1.153 0.0004 -0.756 0.1280 -0.682 0.0043 0.289 0.0191 -0.004 0.978324 KDA SUBUNIT CG5703 -1.245 0.0080 -1.056 0.0868 -1.059 0.0005 0.184 0.0365 -0.363 0.031424 KDA SUBUNIT CG6485 0.699 0.1620 N/A N/A N/A N/A -0.377 0.1650 -0.530 0.055430 KDA SUBUNIT CG12079 -1.266 0.0142 -0.719 0.1670 -1.003 0.0006 0.158 0.0889 -0.382 0.059539 KDA SUBUNIT CG6020 -0.666 0.0326 -0.753 0.0911 -0.964 0.0012 0.241 0.0014 -0.236 0.046542 KDA SUBUNIT ND42 -1.364 0.0216 -0.895 0.1209 -1.110 0.0001 0.422 0.0051 -0.239 0.138249 KDA SUBUNIT CG1970 -1.276 0.0043 -1.097 0.0474 -0.850 0.0034 0.546 0.0134 -0.098 0.607549 KDA SUBUNIT CG11913 1.704 0.0560 -0.715 0.3157 N/A N/A N/A N/A N/A N/A 51 KDA SUBUNIT CG9140 -1.075 0.0420 -0.710 0.1433 -0.691 0.0024 0.480 0.0014 0.006 0.959251 KDA SUBUNIT CG8102 N/A N/A N/A N/A N/A N/A N/A N/A N/A N/A 75 KDA SUBUNIT ND75 -1.004 0.0511 -1.147 0.0545 -0.821 0.0005 0.297 0.0076 -0.191 0.1479ASHI SUBUNIT CG3192 -1.441 0.0041 -1.063 0.0557 -1.072 0.0005 0.091 0.2161 -0.397 0.0179B12 SUBUNIT CG10320 -0.424 0.0222 N/A N/A -0.251 0.0218 0.031 0.7437 -0.159 0.1054B14 SUBUNIT CG7712 -1.059 0.0732 -0.551 0.2074 -0.398 0.0323 0.204 0.0299 -0.183 0.1104B15 SUBUNIT CG12859 -0.975 0.0154 -0.498 0.2210 -0.943 0.0015 0.301 0.0134 -0.062 0.6850B17 SUBUNIT CG13240 N/A N/A N/A N/A N/A N/A N/A N/A N/A N/A B18 SUBUNIT CG5548 -1.258 0.0003 -0.495 0.2681 -0.539 0.0041 0.044 0.3309 -0.360 0.0106B22 SUBUNIT CG9306 -1.339 0.0035 -0.757 0.1884 -0.864 0.0015 0.060 0.2238 -0.432 0.0057B8 SUBUNIT CG15434 N/A N/A N/A N/A N/A N/A N/A N/A N/A N/A MLRQ SUBUNIT CG32230 -1.221 0.0018 -0.555 0.1462 -0.728 0.0012 -0.097 0.1331 -0.299 0.0240MNLL SUBUNIT CG18624 -1.128 0.0177 -0.625 0.2441 -0.624 0.0011 0.480 0.0001 0.180 0.0788PDSW SUBUNIT Pdsw -1.860 0.0086 -0.584 0.3607 -0.769 0.0018 0.254 0.0163 0.008 0.9334SGDH SUBUNIT l(3)neo18 -1.611 0.0021 -1.114 0.0740 -0.932 0.0009 0.499 0.0037 0.078 0.4718B14.5A SUBUNIT CG3621 -1.101 0.0112 -0.491 0.3366 -0.844 0.0011 0.204 0.0260 -0.150 0.3432B14.5B SUBUNIT CG12400 -1.557 0.0187 -0.263 0.5776 -1.057 0.0008 0.086 0.1562 -0.423 0.0210B16.6 SUBUNIT CG3446 -1.236 0.0067 -0.488 0.2457 -0.174 0.0577 0.254 0.0004 0.026 0.6552B17.2 SUBUNIT CG3214 -1.629 0.0069 -0.761 0.2001 -0.968 0.0021 0.067 0.0092 -0.426 0.0219ACYL CARRIER PROTEIN mtacp1 -2.135 0.0030 -0.971 0.1577 -1.012 0.0006 0.644 0.0008 -0.272 0.1800 Complex II: Succinate dehydrogenase FLAVOPROTEIN SUBUNIT Scs-fp -0.816 0.0485 -1.816 0.0035 -1.550 0.0000 0.581 0.0032 0.062 0.3119IRON-SULFUR PROTEIN SdhB -0.780 0.0659 -0.653 0.2654 -0.256 0.1564 0.304 0.0320 -0.237 0.1879CYTOCHROME B560 SUBUNIT CG6666 -1.205 0.0070 -0.643 0.2212 -0.355 0.0147 0.240 0.0007 0.037 0.3155CYTOCHROME B SMALL SUBUNIT CG10219 -1.597 0.0020 -0.789 0.1198 -0.674 0.0004 0.649 0.0003 0.050 0.7812 Complex III: Ubiquinol-cytochrome C oxidoreductase CYTOCHROME C1, HEME PROTEIN CG4769 -1.089 0.0004 -0.899 0.1230 -1.529 0.0001 0.243 0.0480 -0.288 0.1114CYTOCHROME C1, HEME PROTEIN CG14508 0.771 0.0913 -1.238 0.0724 -0.194 0.4555 0.046 0.6293 -0.138 0.140311 KDA PROTEIN Ucrh N/A N/A N/A N/A N/A N/A N/A N/A N/A N/A 14 KDA PROTEIN CG3560 -1.582 0.0306 -0.502 0.3156 -0.646 0.0022 0.362 0.0012 -0.073 0.500314 KDA PROTEIN CG17856 N/A N/A N/A N/A N/A N/A N/A N/A N/A N/A 6.4 KDA PROTEIN CG14482 -1.453 0.0206 -0.817 0.2051 -0.838 0.0009 0.320 0.0004 -0.175 0.16677.2 KDA PROTEIN ox -1.340 0.0123 -0.786 0.1602 -1.028 0.0010 -0.071 0.2740 -0.306 0.0646
Stefanie Katharina Tiefenböck 68

Ph.D. Thesis
CORE PROTEIN I CG3731 -1.069 0.0160 -0.924 0.0940 -1.369 0.0002 0.224 0.0395 -0.256 0.1619CORE PROTEIN 2 CG4169 -1.224 0.0285 -1.249 0.0461 -1.066 0.0000 0.418 0.0024 -0.061 0.6343UBIQUINONE-BINDING PROTEIN QP-C CG7580 -0.989 0.0168 -0.478 0.1292 -0.910 0.0034 -0.037 0.1774 -0.396 0.0026IRON-SULFUR SUBUNIT RFeSP -0.925 0.0039 -1.249 0.0423 -1.058 0.0008 0.133 0.0300 -0.364 0.0136 Complex IV: Cytochrome c oxidase SUBUNIT IV CG10396 0.979 0.2301 -0.351 0.6123 N/A N/A N/A N/A N/A N/A SUBUNIT IV CG10664 -1.388 0.0037 -0.583 0.2506 -0.880 0.0014 -0.010 0.7337 -0.359 0.0060POLYPEPTIDE VA CoVa -1.665 0.0016 -1.028 0.0991 -1.156 0.0010 0.047 0.5916 -0.312 0.0806POLYPEPTIDE VB CG11015 -1.855 0.0024 -0.872 0.1737 -1.020 0.0017 0.139 0.0143 -0.343 0.0152POLYPEPTIDE VB CG11043 1.213 0.0419 -0.468 0.4649 N/A N/A N/A N/A N/A N/A POLYPEPTIDE VIA CG17280 -1.269 0.0017 -0.410 0.3331 -0.630 0.0027 0.011 0.7784 -0.304 0.0205POLYPEPTIDE VIB CG18809 -0.071 0.7714 0.192 0.2611 0.056 0.6797 -0.131 0.0290 0.016 0.8546POLYPEPTIDE VIC cype -1.056 0.0163 -1.021 0.0404 -0.903 0.0007 -0.133 0.0029 -0.451 0.0016POLYPEPTIDE VIIA-HEART CG9603 -1.254 0.0019 -0.643 0.1543 -0.139 0.0839 0.047 0.2757 -0.038 0.3953POLYPEPTIDE VIIA-HEART CG18193 N/A N/A N/A N/A N/A N/A N/A N/A N/A N/A POLYPEPTIDE VIIC CG2249 -1.107 0.0244 -0.740 0.2211 -0.319 0.0140 -0.071 0.3699 -0.225 0.0065 Complex V: F0/F1 ATP synthase ALPHA CHAIN blw -0.636 0.0115 -1.229 0.0094 -1.083 0.0000 0.094 0.0358 -0.223 0.0123B CHAIN ATPsyn-b -1.126 0.0098 -0.914 0.0594 -1.287 0.0001 0.064 0.1298 -0.418 0.0062BETA CHAIN ATPsyn-beta -0.915 0.0535 -1.127 0.0127 -0.793 0.0078 0.170 0.0824 -0.026 0.8650BETA CHAIN CG5389 0.546 0.1516 -1.543 0.0229 N/A N/A 0.082 0.4625 0.113 0.2405COUPLING FACTOR 6 ATPsyn-Cf6 N/A N/A N/A N/A N/A N/A N/A N/A N/A N/A D CHAIN ATPsyn-d N/A N/A N/A N/A N/A N/A N/A N/A N/A N/A DELTA CHAIN CG2968 N/A N/A N/A N/A N/A N/A N/A N/A N/A N/A E CHAIN CG3321 -1.224 0.0017 -0.680 0.1662 -0.899 0.0007 0.026 0.5798 -0.357 0.0047EPSILON CHAIN sun -0.322 0.3645 N/A N/A -0.256 0.2422 -0.108 0.4759 -0.178 0.3332EPSILON CHAIN CG12810 N/A N/A N/A N/A N/A N/A N/A N/A N/A N/A F CHAIN CG4692 -1.731 0.0163 -0.927 0.1323 -0.786 0.0004 0.032 0.1910 -0.283 0.0154G CHAIN l(2)06225 -1.543 0.0263 -0.586 0.2808 -0.654 0.0012 0.058 0.3705 -0.296 0.0370
GAMMA CHAIN ATPsyn-gamma -1.138 0.0457 -0.912 0.0727 -1.029 0.0005 0.238 0.0106 -0.249 0.0395
LIPID-BINDING PROTEIN P1,P2,P3 CG1746 -0.957 0.0026 -0.869 0.0724 -1.376 0.0001 -0.020 0.5648 -0.673 0.0012OLIGOMYCIN SENSITIVITY CONFERRAL PROTEIN Oscp -1.149 0.0034 -1.057 0.0370 -1.158 0.0003 -0.006 0.9034 -0.460 0.0017 Others ATP SYNTHASE COUPLING FACTOR B CG10731 N/A N/A N/A N/A N/A N/A N/A N/A N/A N/A COMPLEX I INTERMEDIATE-ASSOCIATED PROTEIN 30 CG7598 -0.218 0.0889 -0.282 0.0345 -0.379 0.0240 -0.362 0.0136 -0.517 0.0138CYTOCHROME C Cyt-c-p -2.900 0.0009 -1.126 0.3200 -3.181 0.0002 1.094 0.0043 0.375 0.2537CYTOCHROME C Cyt-c-d 0.717 0.2576 -0.838 0.2723 N/A N/A 0.289 0.1692 0.001 0.9973CYTOCHROME C OXIDASE ASSEMBLY PROTEIN COX11 CG6922 N/A N/A N/A N/A N/A N/A N/A N/A N/A N/A CYTOCHROME C OXIDASE COPPER CHAPERONE CG9065 -0.920 0.0274 0.161 0.7498 -0.703 0.0008 0.206 0.0495 -0.079 0.6425CYTOCHROME OXIDASE BIOGENESIS PROTEIN OXA1 CG6404 -1.001 0.0190 -1.230 0.0677 -0.888 0.0048 0.746 0.0035 0.233 0.2830ELECTRON TRANSFER FLAVOPROTEIN ALPHA-SUBUNIT wal -0.112 0.5197 -0.347 0.2310 -0.379 0.0072 -0.122 0.1946 -0.353 0.0143ELECTRON TRANSFER FLAVOPROTEIN BETA-SUBUNIT CG7834 -0.447 0.0022 -0.217 0.4800 -0.154 0.1235 -0.391 0.0036 -0.382 0.0097ELECTRON TRANSFER FLAVOPROTEIN BETA-SUBUNIT CG12140 0.210 0.3823 -1.155 0.0005 -0.376 0.0523 -0.590 0.0065 -0.958 0.0016PROTOHEME IX FARNESYLTRANSFERASE CG5037 -1.351 0.0110 -0.973 0.1654 -1.121 0.0023 1.054 0.0007 0.539 0.0391SCO1, SCO2 PROTEIN HOMOLOG CG8885 -1.058 0.0036 -0.559 0.1872 -0.305 0.0038 0.213 0.0050 -0.037 0.7236SURFEIT LOCUS PROTEIN 1 Surf1 -0.624 0.0114 -0.439 0.1003 -0.513 0.0044 0.164 0.1687 -0.247 0.0575 Carbohydrate metabolism Tricarboxylic-acid pathway ACONITATE HYDRATASE Acon -0.873 0.0803 -0.525 0.2508 -0.153 0.2299 0.607 0.0035 0.078 0.3790ACONITATE HYDRATASE CG4706 1.879 0.0320 N/A N/A N/A N/A N/A N/A N/A N/A CITRATE SYNTHASE CG3861 N/A N/A N/A N/A N/A N/A N/A N/A N/A N/A CITRATE SYNTHASE CG14740 1.515 0.0890 -0.268 0.7174 N/A N/A N/A N/A N/A N/A DIHYDROLIPOAMIDE DEHYDROGENASE CG7430 -1.178 0.0565 -1.227 0.0435 -1.306 0.0002 0.248 0.0050 -0.386 0.0097DIHYDROLIPOAMIDE SUCCINYLTRANSFERASE COMPONENT OF 2-OXOGLUTARATE DEHYDROGENASE COMPLEX CG5214 -0.564 0.0527 -1.085 0.0435 -0.625 0.0003 0.536 0.0007 0.112 0.1785FUMARATE HYDRATASE CG4094 N/A N/A N/A N/A N/A N/A N/A N/A N/A N/A FUMARATE HYDRATASE CG4095 0.903 0.0094 -0.297 0.2956 N/A N/A N/A N/A N/A N/A FUMARATE HYDRATASE CG31874 N/A N/A N/A N/A N/A N/A N/A N/A N/A N/A ISOCITRATE DEHYDROGENASE [NAD] SUBUNIT ALPHA CG12233 N/A N/A N/A N/A N/A N/A N/A N/A N/A N/A ISOCITRATE DEHYDROGENASE [NAD] SUBUNIT BETA CG6439 -0.604 0.0547 -0.901 0.0178 -0.164 0.0772 0.212 0.1789 0.052 0.7744ISOCITRATE DEHYDROGENASE [NAD] SUBUNIT GAMMA CG5028 -0.593 0.0901 -1.103 0.0131 -0.118 0.4298 0.237 0.1726 0.170 0.3849ISOCITRATE DEHYDROGENASE [NADP] CG7176 N/A N/A N/A N/A N/A N/A N/A N/A N/A N/A MALATE DEHYDROGENASE CG7998 -0.050 0.5343 -0.662 0.0015 -0.278 0.0052 -0.132 0.0799 -0.348 0.0006MALATE DEHYDROGENASE CG10749 1.112 0.0799 N/A N/A N/A N/A N/A N/A N/A N/A MALATE DEHYDROGENASE CG10748 1.085 0.1344 -1.051 0.0837 N/A N/A N/A N/A N/A N/A 2-OXOGLUTARATE DEHYDROGENASE E1 COMPONENT CG11661 N/A N/A N/A N/A N/A N/A N/A N/A N/A N/A 2-OXOGLUTARATE DEHYDROGENASE E1 COMPONENT CG7934 N/A N/A N/A N/A N/A N/A N/A N/A N/A N/A SUCCINATE DEHYDROGENASE [UBIQUINONE] CYTOCHROME B SMALL CG10219 -1.597 0.0020 -0.789 0.1198 -0.674 0.0004 0.649 0.0003 0.050 0.7812
Stefanie Katharina Tiefenböck 69

Ph.D. Thesis
SUBUNIT SUCCINATE DEHYDROGENASE [UBIQUINONE] FLAVOPROTEIN SUBUNIT Scs-fp -0.816 0.0485 -1.816 0.0035 -1.550 0.0000 0.581 0.0032 0.062 0.3119SUCCINATE DEHYDROGENASE [UBIQUINONE] IRON-SULFUR PROTEIN SdhB -0.780 0.0659 -0.653 0.2654 -0.256 0.1564 0.304 0.0320 -0.237 0.1879SUCCINATE DEHYDROGENASE CYTOCHROME B560 SUBUNIT CG6666 -1.205 0.0070 -0.643 0.2212 -0.355 0.0147 0.240 0.0007 0.037 0.3155SUCCINYL-COA LIGASE [GDP-FORMING] ALPHA-CHAIN Scsalpha 0.395 0.0059 0.288 0.0408 0.411 0.0010 -0.533 0.0003 -0.348 0.0018SUCCINYL-COA LIGASE [GDP-FORMING] ALPHA-CHAIN CG6255 1.045 0.0734 -0.732 0.1449 -0.030 0.4897 -0.026 0.8009 -0.162 0.3320SUCCINYL-COA LIGASE [GDP-FORMING] BETA-CHAIN Sucb 0.018 0.8109 -0.962 0.0006 0.205 0.0756 -0.025 0.7578 -0.132 0.0441SUCCINYL-COA LIGASE [ADP-FORMING] BETA-CHAIN CG11963 0.363 0.0474 -0.215 0.0890 -0.191 0.3300 -0.185 0.1581 -0.577 0.0095 Pyruvate metabolism ACETYL-COA ACETYLTRANSFERASE CG10932 -1.849 0.0103 -1.382 0.0531 -0.749 0.0002 0.069 0.2367 -0.551 0.0032ALDEHYDE DEHYDROGENASE CG3752 N/A N/A N/A N/A N/A N/A N/A N/A N/A N/A ALDEHYDE DEHYDROGENASE CG6309 N/A N/A N/A N/A N/A N/A N/A N/A N/A N/A DIHYDROLIPOAMIDE ACETYLTRANSFERASE COMPONENT OF PYRUVATE DEHYDROGENASE COMPLEX CG5261 -1.275 0.0147 -1.466 0.0699 -1.206 0.0021 0.307 0.0937 -0.588 0.0281DIHYDROLIPOAMIDE DEHYDROGENASE CG7430 -1.178 0.0565 -1.227 0.0435 -1.306 0.0002 0.248 0.0050 -0.386 0.0097NADP-DEPENDENT MALIC ENZYME Mdh -0.455 0.0865 -1.731 0.0077 -2.198 0.0003 0.181 0.6601 -0.853 0.0528PHOSPHOENOLPYRUVATE CARBOXYKINASE [GTP] pepck 1.996 0.0166 0.638 0.4317 0.339 0.0152 -0.328 0.0496 0.287 0.0046PHOSPHOENOLPYRUVATE CARBOXYKINASE [GTP] CG10924 1.848 0.0078 1.368 0.1291 1.096 0.0009 -2.424 0.0001 -1.308 0.0106PYRUVATE CARBOXYLASE CG1516 0.178 0.0300 -0.933 0.0011 0.133 0.1487 -0.019 0.7747 -0.064 0.2960PYRUVATE DEHYDROGENASE E1 COMPONENT ALPHA SUBUNIT CG7010 N/A N/A N/A N/A N/A N/A N/A N/A N/A N/A PYRUVATE DEHYDROGENASE E1 COMPONENT BETA SUBUNIT CG11876 -1.240 0.0291 -1.802 0.0145 -0.979 0.0010 0.388 0.0366 -0.617 0.0121PYRUVATE DEHYDROGENASE [LIPOAMIDE]] KINASE ISOZYME 1, 2, 3, 4 Pdk -0.206 0.3210 -0.379 0.4202 0.548 0.0100 -0.191 0.3586 0.422 0.0171PYRUVATE DEHYDROGENASE [LIPOAMIDE]]-PHOSPHATASE 1, 2 CG12151 N/A N/A N/A N/A N/A N/A N/A N/A N/A N/A Others BIFUNCTIONAL METHYLENETETRAHYDROFOLATE DEHYDROGENASE/CYCLOHYDROLASE Nmdmc 0.478 0.0345 2.243 0.0003 0.100 0.7752 -0.893 0.0012 0.820 0.0202 Amino acid metabolism 2-AMINO-3-KETOBUTYRATE COENZYME A LIGASE CG10361 -0.950 0.0929 N/A N/A -0.296 0.1373 0.243 0.2212 1.339 0.01634-AMINOBUTYRATE AMINOTRANSFERASE CG7433 N/A N/A N/A N/A N/A N/A N/A N/A N/A N/A 5-AMINOLEVULINIC ACID SYNTHASE Alas -1.023 0.0709 -0.850 0.1130 0.143 0.5620 0.586 0.0686 -0.125 0.5522ACETYL-COA ACETYLTRANSFERASE CG10932 -1.849 0.0103 -1.382 0.0531 -0.749 0.0002 0.069 0.2367 -0.551 0.00323-KETOACYL-COA THIOLASE yip2 1.860 0.0006 0.410 0.4807 -0.087 0.1456 -0.855 0.0000 -0.594 0.0002ALDEHYDE DEHYDROGENASE CG3752 N/A N/A N/A N/A N/A N/A N/A N/A N/A N/A ALDEHYDE DEHYDROGENASE CG6309 N/A N/A N/A N/A N/A N/A N/A N/A N/A N/A AMINOMETHYLTRANSFERASE CG6415 -0.520 0.0378 -0.409 0.0431 -0.648 0.0005 -0.567 0.0003 -0.693 0.0000ARGINASE II arg 0.114 0.1396 -0.927 0.0197 -0.838 0.0150 0.587 0.0069 0.854 0.0074ASPARTATE AMINOTRANSFERASE CG4233 N/A N/A N/A N/A N/A N/A N/A N/A N/A N/A ASPARTATE AMINOTRANSFERASE CG8430 N/A N/A N/A N/A N/A N/A N/A N/A N/A N/A BRANCHED-CHAIN AMINO ACID AMINOTRANSFERASE CG1673 -0.631 0.2014 -1.410 0.0191 -1.348 0.0005 0.001 0.9939 -0.549 0.0097CARNITINE O-ACETYLTRANSFERASE CG5265 1.709 0.1055 -0.009 0.9894 N/A N/A 0.062 0.5232 0.049 0.7845DELTA-1-PYRROLINE-5-CARBOXYLATE DEHYDROGENASE CG7145 0.448 0.1622 -1.072 0.0583 -0.727 0.3035 -0.670 0.3004 -0.223 0.7214DELTA-1-PYRROLINE-5-CARBOXYLATE DEHYDROGENASE CG6661 1.913 0.0505 -0.306 0.6511 N/A N/A N/A N/A N/A N/A DIHYDROLIPOAMIDE DEHYDROGENASE CG7430 -1.178 0.0565 -1.227 0.0435 -1.306 0.0002 0.248 0.0050 -0.386 0.0097DIHYDROLIPOAMIDE SUCCINYLTRANSFERASE COMPONENT OF 2-OXOGLUTARATE DEHYDROGENASE COMPLEX CG5214 -0.564 0.0527 -1.085 0.0435 -0.625 0.0003 0.536 0.0007 0.112 0.1785ENOYL-COA HYDRATASE CG6543 -0.487 0.0432 -1.409 0.0238 -0.761 0.0018 -0.209 0.0419 -0.678 0.0002GLUTAMATE DEHYDROGENASE Gdh 0.217 0.2197 -1.330 0.0009 -0.706 0.0017 0.127 0.1961 -0.048 0.7210GLUTAMATE DEHYDROGENASE CG4434 1.571 0.0866 -0.484 0.5345 N/A N/A N/A N/A N/A N/A GLUTAMINASE, ISOFORMS nemy -0.331 0.2714 -0.637 0.1185 -0.721 0.1052 0.342 0.2769 -0.270 0.3522GLUTARYL-COA DEHYDROGENASE CG9547 0.495 0.0456 -0.183 0.3312 -0.144 0.4498 -0.483 0.0524 -0.210 0.2890GLUTATHIONE S-TRANSFERASE Mgstl -0.958 0.0049 -1.832 0.0028 -1.302 0.0005 0.697 0.0038 -0.110 0.3928GLUTATHIONE S-TRANSFERASE CG12628 N/A N/A N/A N/A N/A N/A N/A N/A N/A N/A GLYCINE CLEAVAGE SYSTEM H PROTEIN ppl -0.191 0.2665 0.289 0.0093 0.120 0.1843 -0.445 0.0054 -0.413 0.0067GLYCINE DEHYDROGENASE [DECARBOXYLATING] CG3999 -0.284 0.1248 0.436 0.0738 -0.479 0.0008 -0.062 0.4525 -0.690 0.00003-HYDROXYISOBUTYRATE DEHYDROGENASE CG15093 -1.995 0.0227 -3.250 0.0183 -2.221 0.0016 1.343 0.0008 0.189 0.4634HYDROXYMETHYLGLUTARYL-COA LYASE CG10399 0.224 0.3473 -1.487 0.0219 -0.008 0.9456 -0.555 0.0048 -1.015 0.0015ISOCITRATE DEHYDROGENASE [NADP] CG7176 N/A N/A N/A N/A N/A N/A N/A N/A N/A N/A
Stefanie Katharina Tiefenböck 70

Ph.D. Thesis
ISOVALERYL-COA DEHYDROGENASE CG6638 -0.946 0.0046 -0.575 0.3243 0.038 0.8504 0.2665 -0.196 0.1739LIPOAMIDE ACYLTRANSFERASE COMPONENT OF BRANCHED-CHAIN ALPHA-KETO ACID DEHYDROGENASE COMPLEX CG5599 -2.305 0.0140 -2.155 0.0961 -1.536 0.0015 0.0000 0.913 0.0107METHYLCROTONYL-COA CARBOXYLASE ALPHA CHAIN CG2118 -1.449 0.0177 -0.791 0.2147 -0.417 0.0330 0.0048 -0.050 0.7289METHYLCROTONYL-COA CARBOXYLASE ALPHA CHAIN CG3267 -1.635 0.0479 -1.311 0.1344 -0.305 0.0134 0.485 0.0061 -0.016 0.7439METHYLMALONATE-SEMIALDEHYDE DEHYDROGENASE [ACYLATING] CG17896 -0.918 0.0134 -1.133 0.0260 0.016 0.8307 0.079 0.3823 -0.290 0.0287ORNITHINE AMINOTRANSFERASE CG8782 N/A N/A N/A N/A N/A N/A N/A N/A N/A 2-OXOGLUTARATE DEHYDROGENASE E1 COMPONENT CG11661 N/A N/A N/A N/A N/A N/A N/A N/A N/A N/A 2-OXOGLUTARATE DEHYDROGENASE E1 COMPONENT CG7934 N/A N/A N/A N/A N/A N/A N/A N/A N/A N/A 2-OXOISOVALERATE DEHYDROGENASE ALPHA SUBUNIT CG8199 -2.290 0.0284 -1.676 0.1011 -0.760 0.0067 1.286 0.0005 0.324 0.17692-OXOISOVALERATE DEHYDROGENASE BETA SUBUNIT CG17691 N/A N/A N/A N/A N/A N/A N/A N/A N/A N/A PHOSPHOLIPID HYDROPEROXIDE GLUTATHIONE PEROXIDASE CG12013 N/A N/A N/A N/A N/A N/A N/A N/A N/A N/A PROLINE OXIDASE slgA -0.227 0.5055 -0.436 0.1158 N/A N/A N/A N/A 0.255 0.7371SERINE HYDROXYMETHYLTRANSFERASE CG3011 0.255 0.1342 1.271 0.0011 0.287 0.0126 -0.454 0.0034 -0.291 0.0024SUCCINATE SEMIALDEHYDE DEHYDROGENASE CG4685 0.260 0.2799 -0.342 0.1412 0.917 0.0026 0.177 0.0938 0.201 0.0684TRIFUNCTIONAL ENZYME ALPHA SUBUNIT CG4389 0.615 0.0067 -0.381 0.1103 -0.133 0.2454 -0.375 0.0360 -0.398 0.0396TRIFUNCTONAL ENZYME BETA SUBUNIT thiolase 0.747 0.0239 -0.705 0.0507 -0.337 0.0692 -0.949 0.0007 -0.766 0.0012 Metabolism of complex lipids Glycerolipid metabolism GLYCEROL-3-PHOSPHATE ACYLTRANSFERASE CG5508 -0.180 0.1780 -0.073 0.8446 0.343 0.2882 0.670 0.0164 0.471 0.0571GLYCEROL-3-PHOSPHATE DEHYDROGENASE CG8256 N/A N/A N/A N/A N/A N/A N/A N/A N/A N/A GLYCEROL-3-PHOSPHATE DEHYDROGENASE CG2137 1.221 0.0034 N/A N/A N/A N/A N/A N/A N/A N/A Fatty-acid biosynthesis ACETYL-COA ACETYLTRANSFERASE CG10932 -1.849 0.0103 -1.382 0.0531 -0.749 0.0002 0.069 0.2367 -0.551 0.00323-KETOACYL-COA THIOLASE yip2 1.860 0.0006 0.410 0.4807 -0.087 0.1456 -0.855 0.0000 -0.594 0.0002ENOYL-COA HYDRATASE CG6543 -0.487 0.0432 -1.409 0.0238 -0.761 0.0018 -0.209 0.0419 -0.678 0.0002TRIFUNCTIONAL ENZYME ALPHA SUBUNIT CG4389 0.615 0.0067 -0.381 0.1103 -0.133 0.2454 -0.375 0.0360 -0.398 0.0396TRIFUNCTONAL ENZYME BETA SUBUNIT thiolase 0.747 0.0239 -0.705 0.0507 -0.337 0.0692 -0.949 0.0007 -0.766 0.0012 Fatty acid metabolism ACYL-COA DEHYDROGENASE, MEDIUM-CHAIN SPECIFIC CG12262 1.549 0.0034 -0.185 0.7489 -0.143 0.2758 -1.765 0.0003 -1.551 0.0000ACYL-COA DEHYDROGENASE, SHORT/BRANCHED CHAIN SPECIFIC CG3902 -0.196 0.4788 -2.465 0.0029 -0.639 0.0230 -0.736 0.0005 -0.837 0.0007ACYL-COA DEHYDROGENASE, SHORT-CHAIN SPECIFIC Arc42 0.168 0.1369 -0.331 0.0391 -0.230 0.0220 -0.546 0.0033 -0.438 0.0051ACYL-COA DEHYDROGENASE, SHORT-CHAIN SPECIFIC CG4860 -0.026 0.8660 0.095 0.7619 -0.204 0.0231 -0.176 0.0187 -0.273 0.0004ACYL-COA DEHYDROGENASE, VERY-LONG-CHAIN SPECIFIC CG7461 0.045 0.7439 -0.928 0.0010 -0.530 0.0223 -0.082 0.5161 -0.074 0.5242ALDEHYDE DEHYDROGENASE CG3752 N/A N/A N/A N/A N/A N/A N/A N/A N/A N/A ALDEHYDE DEHYDROGENASE CG6309 N/A N/A N/A N/A N/A N/A N/A N/A N/A N/A ALPHA-METHYLACYL-COA RACEMASE CG9319 0.378 0.0887 -0.057 0.7650 -0.165 0.1381 -0.926 0.0002 -0.770 0.0005CARNITINE O-PALMITOYLTRANSFERASE I CPTI 0.732 0.0273 -0.109 0.7989 0.980 0.0712 0.021 0.9603 0.288 0.5596CARNITINE O-PALMITOYLTRANSFERASE II CG2107 0.235 0.1334 -1.008 0.0077 -0.473 0.0016 -0.371 0.0153 -0.521 0.0010DELTA3,5-DELTA2,4-DIENOYL-COA ISOMERASE CG9577 1.376 0.0033 0.320 0.4900 0.345 0.0146 -1.016 0.0000 -0.839 0.0019GLUTARYL-COA DEHYDROGENASE CG9547 0.495 0.0456 -0.183 0.3312 -0.144 0.4498 -0.483 0.0524 -0.210 0.28903,2-TRANS-ENOYL-COA ISOMERASE CG4598 -0.085 0.0464 -0.529 0.0102 -0.304 0.0675 -0.487 0.0073 -0.461 0.0020 CG4594 0.179 0.4767 -0.457 0.1352 -0.989 0.0006 -1.671 0.0001 -1.658 0.0000 Others ADRENODOXIN CG1319 -1.187 0.0101 -0.487 0.2691 -1.197 0.0003 0.492 0.0035 -0.607 0.0048SUCCINYL-COA:3-KETOACID-COENZYME A TRANSFERASE CG1140 -1.617 0.0048 -2.140 0.0245 -1.649 0.0001 0.716 0.0000 -0.227 0.1327 Nucleotide metabolism ADENYLATE KINASE ISOENZYME 2 (4) Adk2 -0.802 0.0014 -1.074 0.0695 -0.910 0.0043 0.337 0.0413 0.008 0.9575GTP:AMP PHOSPHOTRANSFERASE Adk3 -0.308 0.1331 -0.915 0.0094 -1.231 0.0010 -0.753 0.0039 -0.876 0.0026DIHYDROOROTATE DEHYDROGENASE Dhod -0.364 0.0225 -0.234 0.2378 -0.656 0.0013 0.012 0.7733 0.142 0.2117THYMIDINE KINASE 2 dnk -1.440 0.0263 -0.352 0.5754 -0.680 0.0203 1.372 0.0003 1.067 0.0010 Sulfur metabolism CYSTEINE DESULFURASE CG12264 -0.231 0.2110 0.708 0.0184 -0.454 0.0031 0.084 0.2577 -0.209 0.0937
0.153
1.857
0.583
N/A
Stefanie Katharina Tiefenböck 71

Ph.D. Thesis
SULFITE OXIDASE CG7280 -0.187 0.3723 -0.574 0.0794 0.084 0.1911 -0.372 0.0070 0.112 0.0337 Metabolism of Cofactors and Vitamins COPROPORPHYRINOGEN III OXIDASE Coprox -0.405 0.0515 -0.508 0.0118 -1.094 0.0002 -0.574 0.0021 -0.888 0.0003CYTOCHROME C-TYPE HEME LYASE CG6022 N/A N/A N/A N/A N/A N/A N/A N/A N/A N/A DELTA 1-PYRROLINE-5-CARBOXYLATE SYNTHETASE CG7470 0.752 0.0412 -0.228 0.2765 -0.219 0.3262 -0.744 0.0075 -0.953 0.0058FERROCHELATASE ferrochelatase -0.297 0.0413 0.105 0.5482 -0.426 0.0019 0.005 0.8805 -0.134 0.1328FOLYLPOLYGLUTAMATE SYNTHASE folc N/A N/A N/A N/A N/A N/A N/A N/A N/A N/A NADPH:ADRENODOXIN OXIDOREDUCTASE dare -0.908 0.0826 -0.635 0.0778 -0.043 0.8314 0.590 0.0073 0.542 0.0264PROTOPORPHYRINOGEN OXIDASE CG5796 N/A N/A N/A N/A N/A N/A N/A N/A N/A N/A DNA and RNA ATP-BINDING CASSETTE SUB-FAMILY E MEMBER 1 CG5651 -0.254 0.0234 0.362 0.0585 -0.061 0.3976 0.171 0.0343 -0.008 0.9154DNA POLYMERASE GAMMA, SUBUNIT 1 tam -0.638 0.0788 N/A N/A -0.150 0.1095 0.117 0.2411 0.094 0.1342DNA POLYMERASE GAMMA SUBUNIT 2 CG8969 N/A N/A N/A N/A N/A N/A N/A N/A N/A N/A DNA-DIRECTED RNA POLYMERASE CG4644 -0.730 0.0788 N/A N/A N/A N/A 1.822 0.0060 1.353 0.0031ENDONUCLEASE G CG8862 -1.305 0.0090 -0.241 0.6199 -0.444 0.0381 0.079 0.4480 -0.207 0.0727OLIGORIBONUCLEASE CG10214 -1.450 0.0133 0.099 0.8419 -0.536 0.0039 0.231 0.0973 -0.030 0.7477SINGLE-STRANDED DNA-BINDING PROTEIN mtSSB -2.025 0.0015 0.161 0.7555 -1.140 0.0002 0.395 0.0007 0.136 0.2284TRANSCRIPTION FACTOR 1 TFAM -0.891 0.0330 0.124 0.5492 -0.241 0.0031 -0.026 0.8248 -0.100 0.4288 Protein synthesis Ribosomal proteins 28S RIBOSOMAL PROTEIN S6 mRpS6 -1.342 0.0013 N/A N/A -0.107 0.4569 0.506 0.0147 0.536 0.055528S RIBOSOMAL PROTEIN S12 tko -1.562 0.0053 -0.403 0.5336 -1.109 0.0002 0.191 0.1152 -0.120 0.463228S RIBOSOMAL PROTEIN S15 bonsai -1.042 0.0069 -0.622 0.3244 -0.720 0.0018 0.725 0.0002 0.386 0.039628S RIBOSOMAL PROTEIN S16 mRpS16 -1.101 0.0197 N/A N/A -0.497 0.0114 0.428 0.0110 0.256 0.182128S RIBOSOMAL PROTEIN S17 mRpS17 -1.006 0.0333 -0.057 0.8577 -0.669 0.0011 0.113 0.2189 0.008 0.952928S RIBOSOMAL PROTEIN S21 mRpS21 -0.801 0.1321 -0.232 0.4362 -0.587 0.0006 0.156 0.2239 -0.027 0.869628S RIBOSOMAL PROTEIN S22 mRpS22 -0.978 0.0213 -0.579 0.2026 -0.603 0.0036 0.312 0.0472 -0.077 0.629728S RIBOSOMAL PROTEIN S25 mRpS25 -1.961 0.0011 -0.450 0.4929 -0.897 0.0001 0.403 0.0037 0.040 0.824428S RIBOSOMAL PROTEIN S29 mRpS29 -0.709 0.0177 -0.733 0.1192 -0.409 0.0385 0.296 0.0147 0.046 0.720760S RIBOSOMAL PROTEIN L3 mRpL3 -1.406 0.0053 -0.649 0.2356 -0.330 0.0373 0.346 0.0208 0.162 0.420560S RIBOSOMAL PROTEIN L7/L12 mRpL7-L12 N/A N/A N/A N/A N/A N/A N/A N/A N/A N/A Others ELONGATION FACTOR TS, MITOCHONDRIAL CG6412 -0.287 0.1102 -0.551 0.1366 -0.156 0.2587 0.630 0.0035 0.345 0.0772ELONGATION FACTOR TU, MITOCHONDRIAL EfTuM -1.596 0.0167 -0.401 0.5277 -0.836 0.0024 0.710 0.0058 0.226 0.2534MITOCHONDRIAL PEPTIDE CHAIN RELEASE FACTOR 1 CG5705 -0.739 0.1669 -0.681 0.0640 -0.287 0.0873 -0.159 0.1716 -0.214 0.0005PROBABLE GLUTAMYL-TRNA(GLN) AMIDOTRANSFERASE SUBUNIT B, MITOCHONDRIAL CG5463 -1.121 0.0318 -0.272 0.3364 N/A N/A 0.567 0.0028 0.291 0.1795PROBABLE LEUCYL-TRNA SYNTHETASE, MITOCHONDRIAL CG7479 N/A N/A N/A N/A N/A N/A N/A N/A N/A N/A TRANSLATION INITIATION FACTOR IF-2, MITOCHONDRIAL CG12413 -0.816 0.1271 -0.422 0.2549 -0.068 0.7262 0.453 0.0180 0.452 0.0933 Protein destination Protein folding and stabilization GRPE PROTEIN HOMOLOG 2, MITOCHONDRIAL Roe1 -1.417 0.0177 -0.609 0.2657 -0.370 0.0138 1.451 0.0000 0.731 0.004110 KDA HEAT SHOCK PROTEIN, MITOCHONDRIAL CG11267 -2.186 0.0011 0.112 0.8877 -1.130 0.0001 0.862 0.0008 0.268 0.198810 KDA HEAT SHOCK PROTEIN, MITOCHONDRIAL CG9920 1.340 0.2448 -0.438 0.5526 N/A N/A N/A N/A N/A N/A 60 KDA HEAT SHOCK PROTEIN, MITOCHONDRIAL Hsp60 -1.235 0.0216 -0.816 0.2599 -1.732 0.0014 0.957 0.0014 0.303 0.036560 KDA HEAT SHOCK PROTEIN, MITOCHONDRIAL CG7235 N/A N/A N/A N/A N/A N/A N/A N/A N/A N/A 60 KDA HEAT SHOCK PROTEIN, MITOCHONDRIAL Hsp60B 1.716 0.0461 0.165 0.8030 -0.035 0.7522 -0.177 0.1117 -0.012 0.909760 KDA HEAT SHOCK PROTEIN, MITOCHONDRIAL CG16954 N/A N/A N/A N/A N/A N/A N/A N/A N/A N/A MITOCHONDRIAL STRESS-70 PROTEIN Hsc70-5 -0.825 0.0333 -0.683 0.1484 -0.939 0.0025 0.667 0.0076 0.124 0.2361MITOCHONDRIAL STRESS-70 PROTEIN Hsc70-3 0.218 0.0046 -0.176 0.1888 -0.400 0.0111 -0.381 0.0193 -0.102 0.1774MITOCHONDRIAL STRESS-70 PROTEIN Hsc70-4 -0.096 0.3503 0.383 0.0365 -0.056 0.3193 0.231 0.0390 0.296 0.0114MITOCHONDRIAL STRESS-70 PROTEIN Hsp68 0.268 0.5109 -1.041 0.0448 0.631 0.0158 -1.609 0.0260 -1.344 0.0164MITOCHONDRIAL STRESS-70 PROTEIN Hsc70-1 N/A N/A N/A N/A N/A N/A N/A N/A N/A N/A MITOCHONDRIAL STRESS-70 PROTEIN Hsc70-2 0.855 0.0403 -0.564 0.4980 N/A N/A N/A N/A 1.462 0.0004 Protein targeting, sorting and translocation IMPORT INNER MEMBRANE Tim10 -1.476 0.0026 -0.605 0.1925 -0.336 0.0572 0.430 0.0015 0.382 0.0144
Stefanie Katharina Tiefenböck 72

Ph.D. Thesis
TRANSLOCASE SUBUNIT TIM10 IMPORT INNER MEMBRANE TRANSLOCASE SUBUNIT TIM10 Tim13 N/A N/A N/A N/A N/A N/A N/A N/A N/A N/A IMPORT INNER MEMBRANE TRANSLOCASE SUBUNIT TIM17 A Tim17a1 1.647 0.1186 N/A N/A N/A N/A N/A N/A N/A N/A IMPORT INNER MEMBRANE TRANSLOCASE SUBUNIT TIM17 A Tim17a2 N/A N/A N/A N/A N/A N/A N/A N/A N/A N/A IMPORT INNER MEMBRANE TRANSLOCASE SUBUNIT TIM17 B Tim17b1 0.591 0.2473 -0.915 0.1895 N/A N/A N/A N/A N/A N/A IMPORT INNER MEMBRANE TRANSLOCASE SUBUNIT TIM17 B Tim17b2 1.092 0.1024 -0.359 0.6400 N/A N/A N/A N/A N/A N/A IMPORT INNER MEMBRANE TRANSLOCASE SUBUNIT TIM17 B CG1724 N/A N/A N/A N/A N/A N/A N/A N/A N/A N/A IMPORT INNER MEMBRANE TRANSLOCASE SUBUNIT TIM22 CG31229 -1.368 0.0056 -0.425 0.3206 -0.857 0.0009 0.021 0.8195 -0.229 0.1650IMPORT INNER MEMBRANE TRANSLOCASE SUBUNIT TIM23 Tim23 N/A N/A N/A N/A N/A N/A N/A N/A N/A N/A IMPORT INNER MEMBRANE TRANSLOCASE SUBUNIT TIM8 A Tim8 -1.326 0.0204 0.207 0.6615 -0.957 0.0015 -0.458 0.0376 -0.572 0.0335IMPORT INNER MEMBRANE TRANSLOCASE SUBUNIT TIM9 A Tim9a -0.798 0.0273 -0.146 0.5236 -0.895 0.0002 0.152 0.0277 -0.136 0.3762IMPORT INNER MEMBRANE TRANSLOCASE SUBUNIT TIM9 B Tim9b N/A N/A N/A N/A N/A N/A N/A N/A N/A N/A IMPORT INNER MEMBRANE TRANSLOCASE SUBUNIT TIM44 CG11779 -1.298 0.0009 -0.766 0.1618 -0.699 0.0072 1.193 0.0034 0.677 0.0037METAXIN 1 CG9393 0.279 0.1702 1.580 0.0007 1.163 0.0016 -0.128 0.2429 -0.100 0.2052METAXIN 2 CG8004 -0.702 0.0605 0.035 0.8628 0.011 0.9174 -0.111 0.3520 -0.215 0.2001METAXIN 2 CG5662 0.113 0.8515 N/A N/A N/A N/A N/A N/A N/A N/A MITOCHONDRIAL IMPORT RECEPTOR SUBUNIT TOM7 CG8226 N/A N/A N/A N/A N/A N/A N/A N/A N/A N/A IMPORT RECEPTOR SUBUNIT TOM20 CG7654 N/A N/A N/A N/A N/A N/A N/A N/A N/A N/A IMPORT RECEPTOR SUBUNIT TOM20 CG14690 N/A N/A N/A N/A N/A N/A N/A N/A N/A N/A MITOCHONDRIAL IMPORT RECEPTOR SUBUNIT TOM40 Tom40 -1.641 0.0405 -0.599 0.4031 -1.756 0.0001 1.317 0.0002 0.720 0.0172MITOCHONDRIAL IMPORT RECEPTOR SUBUNIT TOM40 CG8330 N/A N/A N/A N/A N/A N/A N/A N/A N/A N/A MITOCHONDRIAL PRECURSOR PROTEINS IMPORT RECEPTOR CG6756 N/A N/A N/A N/A N/A N/A N/A N/A N/A N/A Proteolysis AFG3-LIKE PROTEIN 2 CG6512 -0.177 0.1630 0.348 0.1676 -0.552 0.0040 0.086 0.2602 -0.507 0.0088INTERMEDIATE PEPTIDASE, MITOCHONDRIAL CG7791 -0.464 0.0248 -0.487 0.1496 -0.036 0.4714 0.177 0.0166 0.086 0.1643LON PROTEASE HOMOLOG, MITOCHONDRIAL CG8798 -0.875 0.0228 -0.165 0.6546 -0.408 0.0025 0.483 0.0241 0.228 0.0965MITOCHONDRIAL PROCESSING PEPTIDASE ALPHA SUBUNIT CG8728 -0.564 0.0359 -0.429 0.2391 -0.977 0.0003 0.019 0.8528 -0.403 0.0200MITOCHONDRIAL PROCESSING PEPTIDASE BETA SUBUNIT CG3731 -1.069 0.0160 -0.924 0.0940 -1.369 0.0002 0.224 0.0395 -0.256 0.1619PARAPLEGIN CG2658 -0.299 0.4208 -0.155 0.6124 0.003 0.9827 0.197 0.2179 0.094 0.3076 ATP-DEPENDENT CLP PROTEASE ATP-BINDING SUBUNIT CLPX, MITOCHONDRIAL CG4538 0.350 0.0107 0.896 0.0011 0.914 0.0013 -0.518 0.0081 -0.208 0.0220PUTATIVE ATP-DEPENDENT CLP PROTEASE PROTEOLYTIC SUBUNIT, MITOCHONDRIAL CG5045 -0.134 0.0203 -0.067 0.4153 -0.034 0.7566 -0.058 0.7241 -0.045 0.7572 Transport facilitation ADP, ATP CARRIER PROTEIN sesB -1.194 0.0019 -1.814 0.0160 -1.153 0.0002 0.601 0.0024 0.405 0.0405ADP, ATP CARRIER PROTEIN Ant2 0.375 0.2484 -1.234 0.0165 0.166 0.1308 0.322 0.0840 0.205 0.1247ATP-BINDING CASSETTE, SUB-FAMILY B, MEMBER 10 CG3156 -1.083 0.0503 -1.099 0.0555 -0.651 0.0168 0.360 0.1587 0.093 0.6888ATP-BINDING CASSETTE, SUB-FAMILY B, MEMBER 6 CG4225 -0.394 0.3650 -0.984 0.0354 -0.182 0.2406 0.090 0.5986 -0.162 0.2294ATP-BINDING CASSETTE, SUB-FAMILY B, MEMBER 7 CG7955 -0.498 0.0349 -0.865 0.0307 -0.546 0.0030 -0.060 0.4872 0.015 0.7890ATP-BINDING CASSETTE, SUB-FAMILY B, MEMBER 8 CG1824 -0.768 0.1714 -0.516 0.2268 -0.381 0.0041 0.827 0.0009 0.484 0.0450CALCIUM-BINDING CARRIER PROTEIN ARALAR1-2 Aralar1 -0.680 0.1221 0.578 0.3120 0.113 0.6052 0.529 0.0639 0.243 0.2558CARNITINE/ACYLCARNITINE CARRIER PROTEIN colt -0.438 0.0507 -0.711 0.0515 -0.285 0.0593 0.424 0.0095 0.355 0.0331CARNITINE/ACYLCARNITINE CARRIER PROTEIN CG3476 -0.497 0.0026 -0.347 0.3661 0.010 0.8801 1.048 0.0002 0.344 0.0163FRATAXIN fh -1.471 0.0156 -0.183 0.4495 0.190 0.1226 0.156 0.2899 0.253 0.3330FOLATE TRANSPORTER/CARRIER CG8026 -0.534 0.1087 -0.892 0.0068 -0.627 0.0077 -0.259 0.0569 -0.448 0.0643ORNITHINE TRANSPORTER 1 CG1628 -1.793 0.0114 -0.727 0.2510 -0.517 0.0438 1.684 0.0011 1.068 0.0089NONSPECIFIC LIPID-TRANSFER PROTEIN Scpx 1.157 0.0104 -0.741 0.1504 -0.158 0.0735 -0.744 0.0017 -0.522 0.00072-OXOGLUTARATE/MALATE CARRIER PROTEIN CG1907 0.050 0.7315 -0.601 0.0141 -0.214 0.0709 -0.448 0.0151 -0.046 0.66252-OXOGLUTARATE/MALATE CARRIER PROTEIN CG18418 1.537 0.1006 -0.003 0.9961 N/A N/A N/A N/A N/A N/A 2-OXOGLUTARATE/MALATE CARRIER PROTEIN CG7514 N/A N/A N/A N/A N/A N/A N/A N/A N/A N/A PHOSPHATE CARRIER PROTEIN CG9090 -0.524 0.2253 -0.593 0.1292 -0.608 0.0087 0.226 0.0854 -0.207 0.2157PHOSPHATE CARRIER PROTEIN Mpcp -0.835 0.0296 -0.941 0.0288 -0.940 0.0001 0.399 0.0022 -0.124 0.3004TRICARBOXYLATE TRANSPORT PROTEIN CG31305 N/A N/A N/A N/A N/A N/A N/A N/A N/A N/A VOLTAGE-DEPENDENT ANION-SELECTIVE CHANNEL PROTEINS porin -1.105 0.0321 -0.312 0.3719 -0.619 0.0051 0.276 0.0167 -0.162 0.1912VOLTAGE-DEPENDENT ANION-SELECTIVE CHANNEL PROTEINS CG17137 N/A N/A N/A N/A N/A N/A N/A N/A N/A N/A
Stefanie Katharina Tiefenböck 73

Ph.D. Thesis
Cell rescue, defense and cell death APOPTOSIS REGULATOR BCL-2 debcl -0.030 0.8006 -0.168 0.4539 -0.011 0.8823 0.387 0.0082 0.194 0.1327PROGRAMED CELL DEATH PROTEIN 8 CG7263 -1.161 0.0179 -0.845 0.1818 -1.179 0.0003 0.834 0.0059 0.246 0.0380SUPEROXIDE DISMUTASE [MN] Sod2 -1.320 0.0276 -1.145 0.0314 -0.844 0.0017 0.108 0.2307 -0.531 0.0243THIOREDOXIN CG8517 1.130 0.1596 -0.194 0.6430 N/A N/A N/A N/A N/A N/A THIOREDOXIN CG8993 -1.173 0.0144 0.110 0.6919 -0.122 0.2438 0.040 0.5641 -0.092 0.3900THIOREDOXIN CG3719 -0.844 0.0563 -0.088 0.8072 -0.116 0.4028 0.440 0.0317 0.243 0.2712THIOREDOXIN-DEPENDENT PEROXIDE REDUCTASE Prx5037 -1.088 0.0027 -1.636 0.0206 -1.592 0.0007 0.098 0.4666 -0.431 0.0376 Others BRAIN MITOCHONDRIAL CARRIER PROTEIN-1 Bmcp -0.011 0.9527 N/A N/A 1.251 0.0029 0.518 0.0892 0.619 0.1363COMPLEMENT COMPONENT 1, Q SUBCOMPONENT BINDING PROTEIN CG6459 -1.900 0.0080 -0.363 0.5992 -1.344 0.0001 1.062 0.0000 0.551 0.0213PERIPHERAL-TYPE BENZODIAZEPINE RECEPTOR CG2789 0.032 0.6008 0.469 0.0600 -0.348 0.0111 0.016 0.9252 -0.215 0.2680UNCOUPLING PROTEIN 4 Ucp4A -0.727 0.0923 -0.824 0.0387 0.172 0.2521 0.123 0.4303 0.201 0.0387UNCOUPLING PROTEIN 4 Ucp4B 0.377 0.0452 N/A N/A N/A N/A -0.045 0.7145 N/A N/A UNCOUPLING PROTEIN 4 Ucp4C 0.471 0.3275 N/A N/A -0.024 0.6609 0.205 0.0762 0.125 0.3510
4.2. GO-Term enrichment for genes that were significantly up- or
downregulated >1.5-fold when UAS-INR was overexpressed in the wildtype.
Shown are the GO terms that are significantly enriched (P-value<0.05). The percentage of
genes that are dependent on Spargel is indicated.
Genes that are upregulated >1.5x upon overexpression of UAS-INR (1255 genes; 33.63% are Spargel dependent)
GO ID GO TERM P-Value Spargel dependence (%)
Mitochondrion GO:0005739 Mitochondrion 1.82E-02 75.75 Translation and RNA metabolism GO:0006400 tRNA modification 1.30E-04 75.00 GO:0034660 ncRNA metabolic process 1.70E-12 58.54 GO:0009451 RNA modification 2.46E-09 56.25 GO:0006396 RNA processing 2.07E-05 46.15 GO:0016072 rRNA metabolic process 2.12E-13 45.45 GO:0042254 Ribosome biogenesis 1.34E-20 39.39 Transcription and DNA replication GO:0006360 Transcription from RNA Pol(I) promoter 1.21E-03 66.67 GO:0006259 DNA metabolic process 8.09E-07 32.61 GO:0006260 DNA replication 5.13E-12 22.86 GO:0006270 DNA replication initiation 1.25E-07 18.18 GO:0006261 DNA-dependent DNA replication 9.84E-07 14.29 Others GO:0008152 Metabolic process 2.40E-04 38.22 GO:0006950 Response to stress 1.07E-02 28.81 Genes that are downregulated >1.5x upon overexpression of UAS-INR (999 genes; 47.65% are Spargel dependent)
GO ID GO TERM P-Value Spargel dependence (%)
Lipid metabolism
Stefanie Katharina Tiefenböck 74

Ph.D. Thesis
GO:0006637 Acyl-CoA metabolic process 1.57E-02 50.00 GO:0030258 Lipid modification 4.71E-02 37.50 GO:0006629 Lipid metabolic process 7.07E-04 47.50 Transport GO:0016192 Vesicle-mediated transport 1.20E-02 72.30 GO:0006810 Transport 1.51E-03 55.60 Signalling GO:0007264 Small GTPase mediated signal transduction 1.76E-02 63.00 GO:0007154 Cell communication 2.32E-02 58.70 GO:0007242 Intracellular signaling cascade 3.42E-03 56.30 Developmental process GO:0007594 Puparial adhesion 6.09E-03 28.60 GO:0007591 Molting cycle, chitin-based cuticle 1.32E-02 50.00 Others GO:0007031 Peroxisome organization 6.63E-04 0.00 GO:0048878 Chemical homeostasis 2.53E-04 60.00 GO:0051234 Establishment of localization 4.19E-03 56.00
Stefanie Katharina Tiefenböck 75

Ph.D. Thesis
5. MATERIALS AND METHODS
Fly Stocks
For this study the following fly lines were used: Srl1 (P{SUPor-P}CG9809KG08646),
Df(3R)ED5046, Df(3R)ro80b, hs-Gal4 and FRT42 (+/- Ubi-GFP) were obtained from the
Bloomington Stock Center (Indiana University, USA). The predicted insertion site of the P-
element leading to the srl1 allele, P{SUPor-P}CG9809KG08646, was confirmed using inverse
PCR (iPCR) according to the protocol available at the Gene Disruption Project homepage
(http://flypush.imgen.bcm.tmc.edu/pscreen/; (Bellen et al., 2004)). The srl2 line
(P{XP}CG9809d04518) was obtained from the Exelixis Collection (Harvard Medical School,
USA).
We also used: delg613 (Schulz et al., 1993a), chico1/2 (Bohni et al., 1999), foxo21/25 (Junger et
al., 2003), UAS-INR (Brogiolo et al., 2001), UAS-Dp110CAAX (Leevers et al., 1996), UAS-
myrAkt/PKB (Stocker et al., 2002), hs-Flp122; Tubulin>CD2>Gal4, UAS-GFP (Scott et al.,
2004), tGPH (Britton et al., 2002), and CS2-Gal4 (kindly provided by M. Pankratz).
To produce the genetically matched control for srl1 mutants, the P-element, P{SUPor-
P}CG9809KG08646, was removed by precise excision using standard procedures and the correct
sequence of the locus was confirmed by sequencing. To create transgenic flies, we cloned the
full genomic region of Spargel (8.7kb) into the pCaSpeR4 vector using the NotI and EcoRI
restriction sites. For HA-SrlGR, we added a 2xHA-tag at the N-terminus of Spargel by PCR
and subcloned the resulting 2kb PCR product into endogenous NaeI and NheI restriction sites
of the SrlGR genomic rescue construct. The UAS-Srl transgene was created by inserting the
coding sequence of Spargel (isoform CG9809-RB) including 5`and 3`UTRs into pUAST at
EcoRI and NotI restriction sites. We used microinjection into the embryos of yw; +; +
Stefanie Katharina Tiefenböck 76

Ph.D. Thesis
background to produce transgenic flies according to standard procedures. The correct
sequence of all constructs was confirmed before injection into the embryos.
Fly husbandry
Flies were kept at 25°C, 60% humidity and a 12 hours day-night light-cycle. For experiments,
flies were kept under non-crowded conditions (50 larvae/tube; these were transferred 1 day
after egg deposition from an apple agar plate to tubes with standard food). If not indicated
differently, we used feeding, mid-3rd instar larvae for all experiments: 4d AED (after egg
deposition) for wildtype; 5d AED for spargel mutants (srl1), 6d AED for delg mutants
(delg613/Df(3R)ro80b); 8d AED for the spargel delg double mutant (srl1, delg613/ srl1,
Df(3R)ro80b).
Fly weight and larval size measurements
Adult males were collected two days after eclosion and shock-frozen in liquid nitrogen. The
wet weight was assessed using a MX microbalance (Mettler Toledo). For larval size
determination, larvae were collected at a given timepoint and drowned in PBS at 4°C over
night, aligned on a glass slide and imaged at 1.6x magnification with an AxioCam HCr
camera (Zeiss) in combination with AxioVision software. Larval dimensions were measured
using Photoshop tools and the volume was calculated using the formula below, where l is the
length and d is the diameter of the larva, as described previously (Colombani et al., 2003).
=2
2
23
4 dlV π
Stainings and Microscopy
We used the hs-Flp; Tub>CD2>Gal4, UAS-GFP system (Scott et al., 2004) to induce clones:
for clones in the fat body we incubated embryos 6-8 hours after egg deposition for 1 hour in a
Stefanie Katharina Tiefenböck 77

Ph.D. Thesis
37°C waterbath, for clones in the wing disc a 14 minute-incubation 48 hours after egg
deposition was applied.
Nile red and MitoTracker stainings, as well as the COX activity assay were performed as
described in the Master’s thesis of Nicole Egli. In short, for Nile red (Molecular Probes) and
MitoTracker red (Molecular Probes) stainings, five larvae were inverted and fixed in 8%
Paraformaldehyde for 45min. (Nile red) and 20min. respectively (MitoTracker). After
washing (3 x 30min.) in 0.2% TritonX-100 in PBS and 0.2% - 1% Tween-20 in PBS,
respectively the larvae were stained for 30min. with Nile red (1:5000 dilution of a 1% stock in
DMSO) and 45min. with MitoTracker (330nM in PBS 1% Tween-20), respectively. The
nuclei were visualized using DAPI (4',6-diamidino-2-phenylindole). After the larvae were
washed (3 x 30min.), fat bodies were mounted on slides and covered with Vectashield
mounting medium (Vector Labs).
For the Cytochrome c oxidase (COX) activity assay two times five larvae were inverted and
fixed in 1% glutaraldehyde/PBS solution for ten minutes. Carcasses were rinsed with 0.1M
sodium acetate pH 5.5 and stained with staining solution (100mg DAB (Sigma) in 0.1M
sodium acetate, 0.5mL of 1% MnCl2 solution, and 50µl of 0.1% H2O2) or control solution
(10mM KCN added to staining solution) for 3.5 - 4 hours at 37°C. Larvae were rinsed with
dH2O to stop the reaction. Fat body was then dissected and mounted in 80% glycerol.
For cardiolipin detection, NAO (1mM; Sigma) was added to unfixed, inverted larvae in PBS,
stained for 15min in the dark, fat bodies were mounted in 80% glycerol and samples were
imaged within 2h. Hoechst33342 (Molecular Probes) was used at 0.5mg/ml. NAO stainings
were performed by Ch. Frei.
Stefanie Katharina Tiefenböck 78

Ph.D. Thesis
For immunofluorescence, inverted larvae were fixed for 90min. in 8% Paraformaldehyde. The
carcasses were washed with PBS containing raising concentrations of TritonX-100 (0.2%-1%)
and blocked in blocking solution (milkpowder, diluted in PBS + 1% TritonX-100) at 4°C over
night. After washing with PBS containing decreasing concentrations of TritonX-100 (1%-
0.2%) the larvae were stained with an mouse α-HA (12CA5, 1/500 dilution, homemade)
antibody for 2h. After washing (3 x 30min.), the secondary antibody Alexa Fluor 568 (goat
anti mouse, 1/10000 dilution, Invitrogen) was added and incubated for 1.5h. Nuclei were
visualized using DAPI. The carcasses were then washed over night, the fat bodies were
mounted on slides and covered with Vectrashield the next day.
For phalloidin stainings, we treated the larvae as described for the immunofluorescence
without the blocking step overnight. Alexa Fluor546-phalloidin (Invitrogen) was added at
0.8U/200 ml in PBS + 0.2% Triton X-100, stained for 60min, washed and mounted as
described before. To determine cellular and nuclear areas we used Adobe Photoshop.
Images were taken on a Deltavision Olympus K70 microscope using CoolSnap HQ camera
(Photometrics) and a 40x objective. Serial Z-sections were acquired at 0.2µm distance and
deconvoluted using Softworx software (Applied Precision). Shown are the projections of the
maximal intensities from six subsequent sections. For phalloidin and COX stainings, the
AxioPlan2 Imaging microscope (Zeiss) was used.
Oxygen consumption assay
For the measurement of mitochondrial oxygen (O2) consumption, fat bodies of 40 to 50 mid
third instar larvae were isolated and transferred into mitochondrial medium B (Kuznetsov et
al., 2008). O2 consumption was measured using a Clark electrode located in a chamber of
2mL volume at room temperature (Oxygraph). For permeabilization of cellular membranes
Stefanie Katharina Tiefenböck 79

Ph.D. Thesis
25ng/µl digitonin was added. Complex I was stimulated through the addition of pyruvate and
proline (10mM each). 2mM ADP was added to stimulate state 3 respiration. 50µM
atractyloside was added to uncouple mitochondrial respiration. Inhibition of cytochrome c
oxidase was obtained by the addition of 0.5mM KCN. Concentrations equal final
concentrations. All chemicals were obtained from Sigma.
ATP measurements
Fat bodies from 10 mid third instar larvae were dissected, and ATP was measured using the
ATP Bioluminescence Assay Kit CLSII (Roche). ATP concentrations were determined by
measuring luciferase activity using the MicroLumat Plus LB96V Luminometer (Berthold)
microplate reader, and normalized to ATP standards.
Measurement of Triglycerides
Five mid third instar larvae were shock frozen in liquid nitrogen and homogenized in 0.05%
Tween-20/PBS using the Retsch Homogenizator MM200 with a frequency of 25/s for two
times 30 seconds. Triglycerides were determined using the Serum Triglyceride Determination
Kit (Sigma #TR0100). Protein amount was measured using Bio Rad Protein Assay and BSA
as protein standard. Measurements were performed on five biological replicates as described
previously (Gronke et al., 2003).
Western blot
Western blots were performed according to standard procedures. For the detection of
phosphorylated Akt, we induced insulin-signalling CS2-1A-Gal4-driven UAS-Dp110CAAX,
and dissected the fat bodies from 6 mid 3rd instar larvae per sample. Total Akt Antibody
(#9272) and Phospho-Drosophila Akt (Ser505) Antibody (#4054; both from Cell Signalling)
were used at 1/500, anti-Tubulin (Sigma) at 1/2000. Quantifications were done using the
Stefanie Katharina Tiefenböck 80
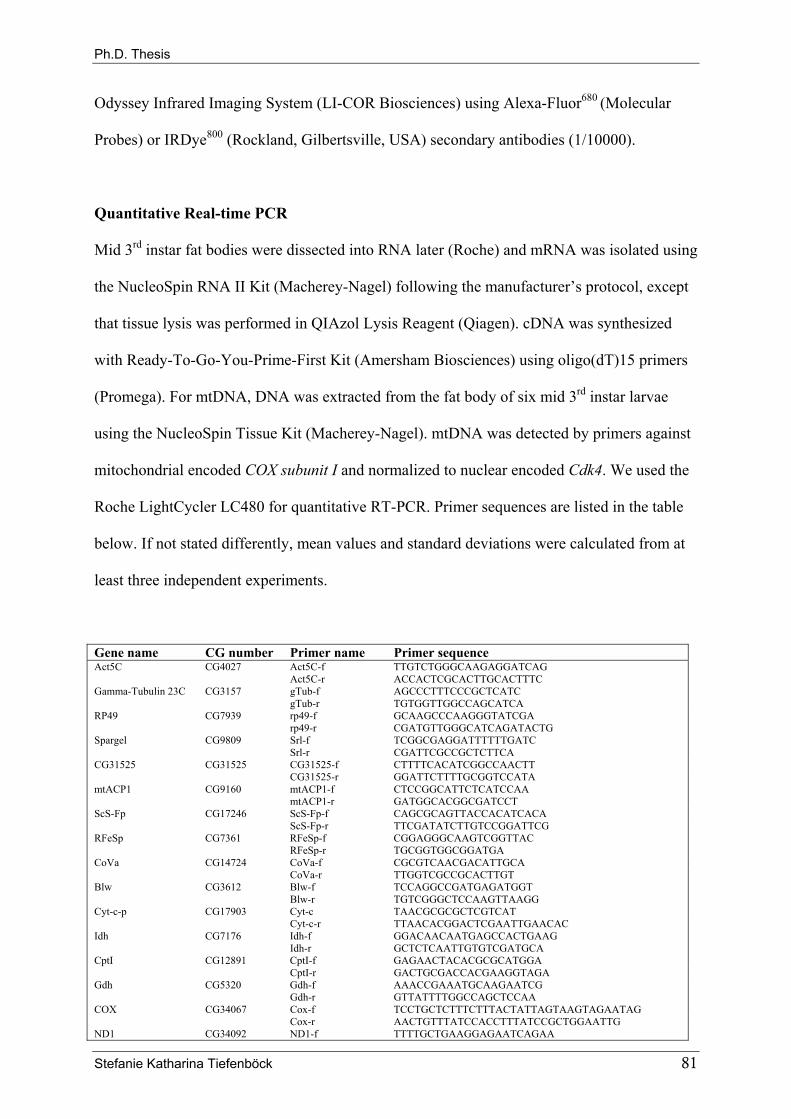
Ph.D. Thesis
Odyssey Infrared Imaging System (LI-COR Biosciences) using Alexa-Fluor680 (Molecular
Probes) or IRDye800 (Rockland, Gilbertsville, USA) secondary antibodies (1/10000).
Quantitative Real-time PCR
Mid 3rd instar fat bodies were dissected into RNA later (Roche) and mRNA was isolated using
the NucleoSpin RNA II Kit (Macherey-Nagel) following the manufacturer’s protocol, except
that tissue lysis was performed in QIAzol Lysis Reagent (Qiagen). cDNA was synthesized
with Ready-To-Go-You-Prime-First Kit (Amersham Biosciences) using oligo(dT)15 primers
(Promega). For mtDNA, DNA was extracted from the fat body of six mid 3rd instar larvae
using the NucleoSpin Tissue Kit (Macherey-Nagel). mtDNA was detected by primers against
mitochondrial encoded COX subunit I and normalized to nuclear encoded Cdk4. We used the
Roche LightCycler LC480 for quantitative RT-PCR. Primer sequences are listed in the table
below. If not stated differently, mean values and standard deviations were calculated from at
least three independent experiments.
Gene name CG number Primer name Primer sequence Act5C CG4027 Act5C-f TTGTCTGGGCAAGAGGATCAG Act5C-r ACCACTCGCACTTGCACTTTC Gamma-Tubulin 23C CG3157 gTub-f AGCCCTTTCCCGCTCATC gTub-r TGTGGTTGGCCAGCATCA RP49 CG7939 rp49-f GCAAGCCCAAGGGTATCGA rp49-r CGATGTTGGGCATCAGATACTG Spargel CG9809 Srl-f TCGGCGAGGATTTTTTGATC Srl-r CGATTCGCCGCTCTTCA CG31525 CG31525 CG31525-f CTTTTCACATCGGCCAACTT CG31525-r GGATTCTTTTGCGGTCCATA mtACP1 CG9160 mtACP1-f CTCCGGCATTCTCATCCAA mtACP1-r GATGGCACGGCGATCCT ScS-Fp CG17246 ScS-Fp-f CAGCGCAGTTACCACATCACA ScS-Fp-r TTCGATATCTTGTCCGGATTCG RFeSp CG7361 RFeSp-f CGGAGGGCAAGTCGGTTAC RFeSp-r TGCGGTGGCGGATGA CoVa CG14724 CoVa-f CGCGTCAACGACATTGCA CoVa-r TTGGTCGCCGCACTTGT Blw CG3612 Blw-f TCCAGGCCGATGAGATGGT Blw-r TGTCGGGCTCCAAGTTAAGG Cyt-c-p CG17903 Cyt-c TAACGCGCGCTCGTCAT Cyt-c-r TTAACACGGACTCGAATTGAACAC Idh CG7176 Idh-f GGACAACAATGAGCCACTGAAG Idh-r GCTCTCAATTGTGTCGATGCA CptI CG12891 CptI-f GAGAACTACACGCGCATGGA CptI-r GACTGCGACCACGAAGGTAGA Gdh CG5320 Gdh-f AAACCGAAATGCAAGAATCG Gdh-r GTTATTTTGGCCAGCTCCAA COX CG34067 Cox-f TCCTGCTCTTTCTTTACTATTAGTAAGTAGAATAG Cox-r AACTGTTTATCCACCTTTATCCGCTGGAATTG ND1 CG34092 ND1-f TTTTGCTGAAGGAGAATCAGAA
Stefanie Katharina Tiefenböck 81

Ph.D. Thesis
ND1-r AAGCCAAACCCCCTCTTCTA TFAM CG4217 Tfam-f CACCTCGACGGTGGTAATCT Tfam-r AAGACCCTGGAGGAGCAGTT mtSSB CG4337 mtSSB-f TGGCATCGTGTAGTGGTGTT mtSSB-r CTGGTCGGTGATCTCTCCAT mtTFB1M CG7319 mtTFB1M-f GACTCAATTGCCGTTTCACC mtTFB1M-r CGCATGCTAAAAGTGACG mtTFB2M CG3910 mtTFB2M-f TCCGGTGCTGGGTACTTTAC mtTFB2M-r TATGCGTCGAAACTGGGATT EFTuM CG6050 EFTum-f CGTGGTGTTCATCAACAAGG EFTum-r ACCACAGGGATCTTGTCACC mRpL12 CG5012 mRpL12-f GGCGCCATCATCGAGATC mRpL12-r GCTAAACGCAAAGTGGATAAACG UCP4A CG6492 UCP4A-f CTTTCTGCCCTGCTGGATAC UCP4A-r GTTCGAAGGACAGCCAGAAG UCP4B CG18340 UCP4B-f GCCAGCGTACTAACGAATCC UCP4B-r CTGTCCCTCCATTTGCATTT Bmcp CG7314 Bmcp-f CTATCGACACGACGAAGACG Bmcp-r CGAGAACGATTGGTCGATTT Cdk4 CG5072 Cdk4-f CTGGTGCAACTAACGGTTTC Cdk4-r CCTGGTAGTTGAACGGATCG
Microarray and GO analysis
mRNA from 18-20 fat bodies of feeding, mid 3rd instar larvae was isolated as described
above. UAS-INR was expressed in the whole animal using the hs-Flp; Tub>CD2>Gal4, UAS-
GFP system and larval fat bodies were dissected 13h after a 30min heat shock at 37°C.
Microarrays were performed by the Functional Genomics Center Zurich (FGCZ;
http://www.fgcz.ethz.ch) using the one-cycle Affimetrix workflow. Original data, data
processing and quality control as well as protocols for labelling, hybridization and scanning
procedures can be viewed at the NCBI database (Edgar et al., 2002), using accession number
GSE14779 and GSE14780. GO analysis was performed with the GOTermFinder Software
(Boyle et al., 2004).
Statistical analysis
In all experiments, significance was determined using the Student’s t-distribution (two-tailed;
two-sample equal variances). *** equals P<0.001; ** equals P<0.01; * equals P<0.05; ns: not
significant.
Stefanie Katharina Tiefenböck 82
Ph.D. Thesis
6. ACKNOWLEDGEMENTS
My time as a Ph.D. student at ETH Zurich was an interesting and often also challenging
experience for me. During this period, many people have contributed directly or indirectly to
the success of my doctorial work and shall be acknowledged at this point.
First of all I want to thank my supervisor Prof. Dr. Christian Frei for the chance to perform
my Ph.D. work in his lab. I am very grateful for his guidance and support during the last four
years. I want to thank my colleagues, Claudia, Nan, Mojca and Wally for the friendly and
stimulating working atmosphere. I am especially grateful to Nicole Egli, my former Master’s
student, who worked together with me on the characterization of the spargel delg double
mutant. I also want to thank our previous lab members, Mark Marti and Christiane Sprenger,
for their excellent technical assistance.
I wish to express my gratitude to the members of my Ph.D. thesis committee, Prof. Dr.
Wilhelm Krek, Prof. Dr. Pierre Léopold and Prof. Dr. Walter Wahli for valuable discussions
and comments on my experimental work. I want to acknowledge the members of the Krek,
Hafen, Gallant and Boop labs for fly stocks, reagents and helpful suggestions on my project,
as well as the Functional Genomics Center Zurich for help with the microarray technique.
Most of all, I am grateful to my parents, Herta and Johann, my sisters, Katharina and Barbara,
and Marko for their loving support, continuous encouragement and patience during times I
have needed it most.
Stefanie Katharina Tiefenböck 83

Ph.D. Thesis
7. CURRICULUM VITAE
First and Last Name: Stefanie Katharina Tiefenböck
Affiliation: Department of Biology, ETH Zurich, 8093 Zurich, Switzerland
Email: [email protected]
Nationality: Austrian
Date of Birth: 29.10.1980
Gender, Civil status: Female, Unmarried
01.2005 – 2009 Eidgenössische Technische Hochschule (ETH) Zürich, Switzerland
Doctorial studies at the Institute of Cell Biology
PhD thesis: “The Drosophila PGC-1 homologue Spargel coordinates mitochondrial
biogenesis to insulin signalling”, Prof. Dr. Christian Frei
Member of the MLS Lifescience Zurich Graduate School
10.1999 – 07.2004 University of Vienna, Austria Diploma studies: Molecular Biology
Diploma thesis: “Studies on the Allergenicity of processed foods with animal origin (II):
Optimization of an Affinity Chromatographic Test System“, Institute of Cell Biology at
the Vienna Biocenter (VBC)
Ao. Prof. Dr. Fritz Pittner, part of the EU-project REDALL
09.1991 – 07.1999 Grammar School, BG/BRG Stainach, Austria
(humanistic focus with Latin, English, French, Italian)
Final exam: Matura (passed with distinction)
07.2003 – 08.2003 Sandoz Kundl, Novartis Pharma AG (Kundl, Austria)
08.2002 – 09.2002 Novartis Pharma AG (Basel, Switzerland)
04.2008 Awarded the first prize for the Best Talk at the Swiss Drosophila Meeting
09.2007 Invitation to speak at the European Drosophila Meeting 2007 in Vienna
01.2003 and 01.2004 Scholarship for academic achievement by the University of Vienna
Personal information
Education and Training
Internships
Awards and Honours
Languages
German (mothertongue), English (fluently), French and Italian (basics)
Stefanie Katharina Tiefenböck 84
Ph.D. Thesis
8. REFERENCES
Adan, C., Matsushima, Y., Hernandez-Sierra, R., Marco-Ferreres, R., Fernandez-
Moreno, M. A., Gonzalez-Vioque, E., Calleja, M., Aragon, J. J., Kaguni, L. S. and
Garesse, R. (2008). Mitochondrial transcription factor B2 is essential for metabolic function
in Drosophila melanogaster development. J Biol Chem 283, 12333-42.
Andersson, U. and Scarpulla, R. C. (2001). Pgc-1-related coactivator, a novel, serum-
inducible coactivator of nuclear respiratory factor 1-dependent transcription in mammalian
cells. Mol Cell Biol 21, 3738-49.
Baker, K. D. and Thummel, C. S. (2007). Diabetic larvae and obese flies-emerging studies
of metabolism in Drosophila. Cell Metab 6, 257-66.
Bellen, H. J., Levis, R. W., Liao, G., He, Y., Carlson, J. W., Tsang, G., Evans-Holm, M.,
Hiesinger, P. R., Schulze, K. L., Rubin, G. M. et al. (2004). The BDGP gene disruption
project: single transposon insertions associated with 40% of Drosophila genes. Genetics 167,
761-81.
Bohni, R., Riesgo-Escovar, J., Oldham, S., Brogiolo, W., Stocker, H., Andruss, B. F.,
Beckingham, K. and Hafen, E. (1999). Autonomous control of cell and organ size by
CHICO, a Drosophila homolog of vertebrate IRS1-4. Cell 97, 865-75.
Boyle, E. I., Weng, S., Gollub, J., Jin, H., Botstein, D., Cherry, J. M. and Sherlock, G.
(2004). GO::TermFinder--open source software for accessing Gene Ontology information and
finding significantly enriched Gene Ontology terms associated with a list of genes.
Bioinformatics 20, 3710-5.
Britton, J. S., Lockwood, W. K., Li, L., Cohen, S. M. and Edgar, B. A. (2002).
Drosophila's insulin/PI3-kinase pathway coordinates cellular metabolism with nutritional
conditions. Dev Cell 2, 239-49.
Stefanie Katharina Tiefenböck 85
Ph.D. Thesis
Brogiolo, W., Stocker, H., Ikeya, T., Rintelen, F., Fernandez, R. and Hafen, E. (2001).
An evolutionarily conserved function of the Drosophila insulin receptor and insulin-like
peptides in growth control. Curr Biol 11, 213-21.
Chintapalli, V. R., Wang, J. and Dow, J. A. (2007). Using FlyAtlas to identify better
Drosophila melanogaster models of human disease. Nat Genet 39, 715-20.
Choi, C. S., Befroy, D. E., Codella, R., Kim, S., Reznick, R. M., Hwang, Y. J., Liu, Z. X.,
Lee, H. Y., Distefano, A., Samuel, V. T. et al. (2008). Paradoxical effects of increased
expression of PGC-1alpha on muscle mitochondrial function and insulin-stimulated muscle
glucose metabolism. Proc Natl Acad Sci U S A 105, 19926-31.
Clementi, E. and Nisoli, E. (2005). Nitric oxide and mitochondrial biogenesis: a key to long-
term regulation of cellular metabolism. Comp Biochem Physiol A Mol Integr Physiol 142,
102-10.
Colombani, J., Bianchini, L., Layalle, S., Pondeville, E., Dauphin-Villemant, C.,
Antoniewski, C., Carre, C., Noselli, S. and Leopold, P. (2005). Antagonistic actions of
ecdysone and insulins determine final size in Drosophila. Science 310, 667-70.
Colombani, J., Raisin, S., Pantalacci, S., Radimerski, T., Montagne, J. and Leopold, P.
(2003). A nutrient sensor mechanism controls Drosophila growth. Cell 114, 739-49.
Datar, S. A., Jacobs, H. W., de la Cruz, A. F., Lehner, C. F. and Edgar, B. A. (2000). The
Drosophila cyclin D-Cdk4 complex promotes cellular growth. Embo J 19, 4543-54.
DeSimone, S., Coelho, C., Roy, S., VijayRaghavan, K. and White, K. (1996). ERECT
WING, the Drosophila member of a family of DNA binding proteins is required in imaginal
myoblasts for flight muscle development. Development 122, 31-9.
DeSimone, S. M. and White, K. (1993). The Drosophila erect wing gene, which is important
for both neuronal and muscle development, encodes a protein which is similar to the sea
urchin P3A2 DNA binding protein. Mol Cell Biol 13, 3641-9.
Stefanie Katharina Tiefenböck 86

Ph.D. Thesis
Dietzl, G., Chen, D., Schnorrer, F., Su, K. C., Barinova, Y., Fellner, M., Gasser, B.,
Kinsey, K., Oppel, S., Scheiblauer, S. et al. (2007). A genome-wide transgenic RNAi
library for conditional gene inactivation in Drosophila. Nature 448, 151-6.
Edgar, B. A. and Orr-Weaver, T. L. (2001). Endoreplication cell cycles: more for less. Cell
105, 297-306.
Edgar, R., Domrachev, M. and Lash, A. E. (2002). Gene Expression Omnibus: NCBI gene
expression and hybridization array data repository. Nucleic Acids Res 30, 207-10.
Eilers, M. and Eisenman, R. N. (2008). Myc's broad reach. Genes Dev 22, 2755-66.
Evans, M. J. and Scarpulla, R. C. (1989). Interaction of nuclear factors with multiple sites
in the somatic cytochrome c promoter. Characterization of upstream NRF-1, ATF, and intron
Sp1 recognition sequences. J Biol Chem 264, 14361-8.
Finck, B. N. and Kelly, D. P. (2006). PGC-1 coactivators: inducible regulators of energy
metabolism in health and disease. J Clin Invest 116, 615-22.
Frei, C., Galloni, M., Hafen, E. and Edgar, B. A. (2005). The Drosophila mitochondrial
ribosomal protein mRpL12 is required for Cyclin D/Cdk4-driven growth. Embo J 24, 623-34.
Galloni, M. (2003). Bonsai, a ribosomal protein S15 homolog, involved in gut mitochondrial
activity and systemic growth. Dev Biol 264, 482-94.
Garesse, R. and Kaguni, L. S. (2005). A Drosophila model of mitochondrial DNA
replication: proteins, genes and regulation. IUBMB Life 57, 555-61.
Gershman, B., Puig, O., Hang, L., Peitzsch, R. M., Tatar, M. and Garofalo, R. S. (2007).
High-resolution dynamics of the transcriptional response to nutrition in Drosophila: a key role
for dFOXO. Physiol Genomics 29, 24-34.
Gleyzer, N., Vercauteren, K. and Scarpulla, R. C. (2005). Control of mitochondrial
transcription specificity factors (TFB1M and TFB2M) by nuclear respiratory factors (NRF-1
and NRF-2) and PGC-1 family coactivators. Mol Cell Biol 25, 1354-66.
Stefanie Katharina Tiefenböck 87

Ph.D. Thesis
Golic, K. G. and Lindquist, S. (1989). The FLP recombinase of yeast catalyzes site-specific
recombination in the Drosophila genome. Cell 59, 499-509.
Goto, A., Matsushima, Y., Kadowaki, T. and Kitagawa, Y. (2001). Drosophila
mitochondrial transcription factor A (d-TFAM) is dispensable for the transcription of
mitochondrial DNA in Kc167 cells. Biochem J 354, 243-8.
Grewal, S. S. (2008). Insulin/TOR signaling in growth and homeostasis: A view from the fly
world. Int J Biochem Cell Biol.
Gronke, S., Beller, M., Fellert, S., Ramakrishnan, H., Jackle, H. and Kuhnlein, R. P.
(2003). Control of fat storage by a Drosophila PAT domain protein. Curr Biol 13, 603-6.
Gronke, S., Mildner, A., Fellert, S., Tennagels, N., Petry, S., Muller, G., Jackle, H. and
Kuhnlein, R. P. (2005). Brummer lipase is an evolutionary conserved fat storage regulator in
Drosophila. Cell Metab 1, 323-30.
Gutierrez, E., Wiggins, D., Fielding, B. and Gould, A. P. (2007). Specialized hepatocyte-
like cells regulate Drosophila lipid metabolism. Nature 445, 275-80.
Huang, N., vom Baur, E., Garnier, J. M., Lerouge, T., Vonesch, J. L., Lutz, Y.,
Chambon, P. and Losson, R. (1998). Two distinct nuclear receptor interaction domains in
NSD1, a novel SET protein that exhibits characteristics of both corepressors and coactivators.
Embo J 17, 3398-412.
Ikeya, T., Galic, M., Belawat, P., Nairz, K. and Hafen, E. (2002). Nutrient-dependent
expression of insulin-like peptides from neuroendocrine cells in the CNS contributes to
growth regulation in Drosophila. Curr Biol 12, 1293-300.
Jarecki, J., Johnson, E. and Krasnow, M. A. (1999). Oxygen regulation of airway
branching in Drosophila is mediated by branchless FGF. Cell 99, 211-20.
Junger, M. A., Rintelen, F., Stocker, H., Wasserman, J. D., Vegh, M., Radimerski, T.,
Greenberg, M. E. and Hafen, E. (2003). The Drosophila forkhead transcription factor
Stefanie Katharina Tiefenböck 88

Ph.D. Thesis
FOXO mediates the reduction in cell number associated with reduced insulin signaling. J Biol
2, 20.
Kawamura, K., Shibata, T., Saget, O., Peel, D. and Bryant, P. J. (1999). A new family of
growth factors produced by the fat body and active on Drosophila imaginal disc cells.
Development 126, 211-9.
Kelly, D. P. and Scarpulla, R. C. (2004). Transcriptional regulatory circuits controlling
mitochondrial biogenesis and function. Genes Dev 18, 357-68.
Kim, J., Lee, J.H. and Iyer, V.R. (2008). Global identification of Myc target genes reveals
its direct role in mitochondrial biogenesis and its E-box usage in vivo. PLoS ONE. Mar 12;
3(3):e1798.
King-Jones, K. and Thummel, C. S. (2005). Nuclear receptors-a perspective from
Drosophila. Nat Rev Genet 6, 311-23.
Koo, S. H., Satoh, H., Herzig, S., Lee, C. H., Hedrick, S., Kulkarni, R., Evans, R. M.,
Olefsky, J. and Montminy, M. (2004). PGC-1 promotes insulin resistance in liver through
PPAR-alpha-dependent induction of TRB-3. Nat Med 10, 530-4.
Kressler, D., Schreiber, S. N., Knutti, D. and Kralli, A. (2002). The PGC-1-related protein
PERC is a selective coactivator of estrogen receptor alpha. J Biol Chem 277, 13918-25.
Kuznetsov, A. V., Veksler, V., Gellerich, F. N., Saks, V., Margreiter, R. and Kunz, W. S.
(2008). Analysis of mitochondrial function in situ in permeabilized muscle fibers, tissues and
cells. Nat Protoc 3, 965-76.
Lai, L., Leone, T. C., Zechner, C., Schaeffer, P. J., Kelly, S. M., Flanagan, D. P.,
Medeiros, D. M., Kovacs, A. and Kelly, D. P. (2008). Transcriptional coactivators PGC-
1alpha and PGC-lbeta control overlapping programs required for perinatal maturation of the
heart. Genes Dev 22, 1948-61.
Leevers, S. J., Weinkove, D., MacDougall, L. K., Hafen, E. and Waterfield, M. D. (1996).
The Drosophila phosphoinositide 3-kinase Dp110 promotes cell growth. Embo J 15, 6584-94.
Stefanie Katharina Tiefenböck 89

Ph.D. Thesis
Lelliott, C. J., Medina-Gomez, G., Petrovic, N., Kis, A., Feldmann, H. M., Bjursell, M.,
Parker, N., Curtis, K., Campbell, M., Hu, P. et al. (2006). Ablation of PGC-1beta results in
defective mitochondrial activity, thermogenesis, hepatic function, and cardiac performance.
PLoS Biol 4, e369.
Leone, T. C., Lehman, J. J., Finck, B. N., Schaeffer, P. J., Wende, A. R., Boudina, S.,
Courtois, M., Wozniak, D. F., Sambandam, N., Bernal-Mizrachi, C. et al. (2005). PGC-
1alpha deficiency causes multi-system energy metabolic derangements: muscle dysfunction,
abnormal weight control and hepatic steatosis. PLoS Biol 3, e101.
Leopold, P. and Perrimon, N. (2007). Drosophila and the genetics of the internal milieu.
Nature 450, 186-8.
Li, F., Wang, Y., Zeller, K.I., Potter, J.J., Wonsey, D.R., O'Donnell, K.A., Kim, J.W.,
Yustein, J.T., Lee, L.A., Dang, C.V. (2005) Myc stimulates nuclearly encoded
mitochondrial genes and mitochondrial biogenesis. Mol Cell Biol. Jul;25(14):6225-34.
Lin, J., Handschin, C. and Spiegelman, B. M. (2005). Metabolic control through the PGC-1
family of transcription coactivators. Cell Metab 1, 361-70.
Lin, J., Puigserver, P., Donovan, J., Tarr, P. and Spiegelman, B. M. (2002a). Peroxisome
proliferator-activated receptor gamma coactivator 1beta (PGC-1beta ), a novel PGC-1-related
transcription coactivator associated with host cell factor. J Biol Chem 277, 1645-8.
Lin, J., Wu, H., Tarr, P. T., Zhang, C. Y., Wu, Z., Boss, O., Michael, L. F., Puigserver,
P., Isotani, E., Olson, E. N. et al. (2002b). Transcriptional co-activator PGC-1 alpha drives
the formation of slow-twitch muscle fibres. Nature 418, 797-801.
Lin, J., Wu, P. H., Tarr, P. T., Lindenberg, K. S., St-Pierre, J., Zhang, C. Y., Mootha, V.
K., Jager, S., Vianna, C. R., Reznick, R. M. et al. (2004). Defects in adaptive energy
metabolism with CNS-linked hyperactivity in PGC-1alpha null mice. Cell 119, 121-35.
Stefanie Katharina Tiefenböck 90

Ph.D. Thesis
Matsushima, Y., Adan, C., Garesse, R. and Kaguni, L. S. (2005). Drosophila
mitochondrial transcription factor B1 modulates mitochondrial translation but not
transcription or DNA copy number in Schneider cells. J Biol Chem 280, 16815-20.
Matsushima, Y., Garesse, R. and Kaguni, L. S. (2004). Drosophila mitochondrial
transcription factor B2 regulates mitochondrial DNA copy number and transcription in
schneider cells. J Biol Chem 279, 26900-5.
Meyer, C. A., Jacobs, H. W., Datar, S. A., Du, W., Edgar, B. A. and Lehner, C. F. (2000).
Drosophila Cdk4 is required for normal growth and is dispensable for cell cycle progression.
Embo J 19, 4533-42.
Mirth, C. K. and Riddiford, L. M. (2007). Size assessment and growth control: how adult
size is determined in insects. Bioessays 29, 344-55.
Monsalve, M., Wu, Z., Adelmant, G., Puigserver, P., Fan, M. and Spiegelman, B. M.
(2000). Direct coupling of transcription and mRNA processing through the thermogenic
coactivator PGC-1. Mol Cell 6, 307-16.
Mootha, V. K., Handschin, C., Arlow, D., Xie, X., St Pierre, J., Sihag, S., Yang, W.,
Altshuler, D., Puigserver, P., Patterson, N. et al. (2004). Erralpha and Gabpa/b specify
PGC-1alpha-dependent oxidative phosphorylation gene expression that is altered in diabetic
muscle. Proc Natl Acad Sci U S A 101, 6570-5.
Orme, M. H., Alrubaie, S., Bradley, G. L., Walker, C. D. and Leevers, S. J. (2006). Input
from Ras is required for maximal PI(3)K signalling in Drosophila. Nat Cell Biol 8, 1298-302.
Pagel-Langenickel, I., Bao, J., Joseph, J. J., Schwartz, D. R., Mantell, B. S., Xu, X.,
Raghavachari, N. and Sack, M. N. (2008). PGC-1alpha integrates insulin signaling,
mitochondrial regulation, and bioenergetic function in skeletal muscle. J Biol Chem 283,
22464-72.
Stefanie Katharina Tiefenböck 91

Ph.D. Thesis
Palanker, L., Necakov, A. S., Sampson, H. M., Ni, R., Hu, C., Thummel, C. S. and
Krause, H. M. (2006). Dynamic regulation of Drosophila nuclear receptor activity in vivo.
Development 133, 3549-62.
Puig, O., Marr, M. T., Ruhf, M. L. and Tjian, R. (2003). Control of cell number by
Drosophila FOXO: downstream and feedback regulation of the insulin receptor pathway.
Genes Dev 17, 2006-20.
Puigserver, P., Adelmant, G., Wu, Z., Fan, M., Xu, J., O'Malley, B. and Spiegelman, B.
M. (1999). Activation of PPARgamma coactivator-1 through transcription factor docking.
Science 286, 1368-71.
Puigserver, P., Rhee, J., Donovan, J., Walkey, C. J., Yoon, J. C., Oriente, F., Kitamura,
Y., Altomonte, J., Dong, H., Accili, D. et al. (2003). Insulin-regulated hepatic
gluconeogenesis through FOXO1-PGC-1alpha interaction. Nature 423, 550-5.
Puigserver, P., Wu, Z., Park, C. W., Graves, R., Wright, M. and Spiegelman, B. M.
(1998). A cold-inducible coactivator of nuclear receptors linked to adaptive thermogenesis.
Cell 92, 829-39.
Rocher, C., Taanman, J. W., Pierron, D., Faustin, B., Benard, G., Rossignol, R., Malgat,
M., Pedespan, L. and Letellier, T. (2008). Influence of mitochondrial DNA level on cellular
energy metabolism: implications for mitochondrial diseases. J Bioenerg Biomembr 40, 59-67.
Ryan, M. T. and Hoogenraad, N. J. (2007). Mitochondrial-nuclear communications. Annu
Rev Biochem 76, 701-22.
Sardiello, M., Licciulli, F., Catalano, D., Attimonelli, M. and Caggese, C. (2003).
MitoDrome: a database of Drosophila melanogaster nuclear genes encoding proteins targeted
to the mitochondrion. Nucleic Acids Res 31, 322-4.
Saucedo, L. J. and Edgar, B. A. (2007). Filling out the Hippo pathway. Nat Rev Mol Cell
Biol 8, 613-21.
Stefanie Katharina Tiefenböck 92

Ph.D. Thesis
Scarpulla, R. C. (2002). Transcriptional activators and coactivators in the nuclear control of
mitochondrial function in mammalian cells. Gene 286, 81-9.
Scarpulla, R. C. (2008). Transcriptional paradigms in mammalian mitochondrial biogenesis
and function. Physiol Rev 88, 611-38.
Schreiber, S. N., Emter, R., Hock, M. B., Knutti, D., Cardenas, J., Podvinec, M.,
Oakeley, E. J. and Kralli, A. (2004). The estrogen-related receptor alpha (ERRalpha)
functions in PPARgamma coactivator 1alpha (PGC-1alpha)-induced mitochondrial
biogenesis. Proc Natl Acad Sci U S A 101, 6472-7.
Schulz, R. A., Hogue, D. A. and The, S. M. (1993a). Characterization of lethal alleles of D-
elg, an ets proto-oncogene related gene with multiple functions in Drosophila development.
Oncogene 8, 3369-74.
Schulz, R. A., The, S. M., Hogue, D. A., Galewsky, S. and Guo, Q. (1993b). Ets oncogene-
related gene Elg functions in Drosophila oogenesis. Proc Natl Acad Sci U S A 90, 10076-80.
Scott, R. C., Schuldiner, O. and Neufeld, T. P. (2004). Role and regulation of starvation-
induced autophagy in the Drosophila fat body. Dev Cell 7, 167-78.
Sonoda, J., Mehl, I. R., Chong, L. W., Nofsinger, R. R. and Evans, R. M. (2007). PGC-
1beta controls mitochondrial metabolism to modulate circadian activity, adaptive
thermogenesis, and hepatic steatosis. Proc Natl Acad Sci U S A 104, 5223-8.
Stocker, H., Andjelkovic, M., Oldham, S., Laffargue, M., Wymann, M. P., Hemmings, B.
A. and Hafen, E. (2002). Living with lethal PIP3 levels: viability of flies lacking PTEN
restored by a PH domain mutation in Akt/PKB. Science 295, 2088-91.
Stroumbakis, N. D., Li, Z. and Tolias, P. P. (1994). RNA- and single-stranded DNA-
binding (SSB) proteins expressed during Drosophila melanogaster oogenesis: a homolog of
bacterial and eukaryotic mitochondrial SSBs. Gene 143, 171-7.
Sugiyama, S., Moritoh, S., Furukawa, Y., Mizuno, T., Lim, Y. M., Tsuda, L. and
Nishida, Y. (2007). Involvement of the mitochondrial protein translocator component tim50
Stefanie Katharina Tiefenböck 93

Ph.D. Thesis
in growth, cell proliferation and the modulation of respiration in Drosophila. Genetics 176,
927-36.
Teleman, A. A., Hietakangas, V., Sayadian, A. C. and Cohen, S. M. (2008). Nutritional
control of protein biosynthetic capacity by insulin via Myc in Drosophila. Cell Metab 7, 21-
32.
Thummel, C.S. (2001). Molecular mechanisms of developmental timing in C. elegans and
Drosophila. Dev Cell. Oct;1(4):453-65.
Uldry, M., Yang, W., St-Pierre, J., Lin, J., Seale, P. and Spiegelman, B. M. (2006).
Complementary action of the PGC-1 coactivators in mitochondrial biogenesis and brown fat
differentiation. Cell Metab 3, 333-41.
Vercauteren, K., Gleyzer, N. and Scarpulla, R. C. (2008). PGC-1-related coactivator
complexes with HCF-1 and NRF-2beta in mediating NRF-2(GABP)-dependent respiratory
gene expression. J Biol Chem 283, 12102-11.
Vianna, C. R., Huntgeburth, M., Coppari, R., Choi, C. S., Lin, J., Krauss, S., Barbatelli,
G., Tzameli, I., Kim, Y. B., Cinti, S. et al. (2006). Hypomorphic mutation of PGC-1beta
causes mitochondrial dysfunction and liver insulin resistance. Cell Metab 4, 453-64.
Virbasius, J. V. and Scarpulla, R. C. (1991). Transcriptional activation through ETS
domain binding sites in the cytochrome c oxidase subunit IV gene. Mol Cell Biol 11, 5631-8.
Wallace, D. C. (2005). A mitochondrial paradigm of metabolic and degenerative diseases,
aging, and cancer: a dawn for evolutionary medicine. Annu Rev Genet 39, 359-407.
Wang, M. C., Bohmann, D. and Jasper, H. (2005). JNK extends life span and limits growth
by antagonizing cellular and organism-wide responses to insulin signaling. Cell 121, 115-25.
Wernette, C. M., Conway, M. C. and Kaguni, L. S. (1988). Mitochondrial DNA
polymerase from Drosophila melanogaster embryos: kinetics, processivity, and fidelity of
DNA polymerization. Biochemistry 27, 6046-54.
Stefanie Katharina Tiefenböck 94

Ph.D. Thesis
Wright, D. C., Han, D. H., Garcia-Roves, P. M., Geiger, P. C., Jones, T. E. and Holloszy,
J. O. (2007). Exercise-induced mitochondrial biogenesis begins before the increase in muscle
PGC-1alpha expression. J Biol Chem 282, 194-9.
Wu, Z., Puigserver, P., Andersson, U., Zhang, C., Adelmant, G., Mootha, V., Troy, A.,
Cinti, S., Lowell, B., Scarpulla, R. C. et al. (1999). Mechanisms controlling mitochondrial
biogenesis and respiration through the thermogenic coactivator PGC-1. Cell 98, 115-24.
Yoon, J. C., Puigserver, P., Chen, G., Donovan, J., Wu, Z., Rhee, J., Adelmant, G.,
Stafford, J., Kahn, C. R., Granner, D. K. et al. (2001). Control of hepatic gluconeogenesis
through the transcriptional coactivator PGC-1. Nature 413, 131-8.
Zhang, H., Stallock, J. P., Ng, J. C., Reinhard, C. and Neufeld, T. P. (2000). Regulation of
cellular growth by the Drosophila target of rapamycin dTOR. Genes Dev 14, 2712-24.
Stefanie Katharina Tiefenböck 95


![Sommaire des numéros des Travaux de l’Institut de ... · Aurélie LACAN, João Fiadeiro, I am Here. Cartographie d'un parcours sensible, 5 p. [Article] Mattia SCARPULLA, Danses](https://img.pdfslide.net/doc/110x75/5c4e811793f3c30e02148b84/sommaire-des-numeros-des-travaux-de-linstitut-de-aurelie-lacan-joao.jpg)