Embed Size (px)
Citation preview
Research Collection
Doctoral Thesis
Improving eco-efficiency of low-input cropping systems by theuse of life cycle assessment and integrative approach
Author(s): Kulak, Michal Adam
Publication Date: 2014
Permanent Link: https://doi.org/10.3929/ethz-a-010192606
Rights / License: In Copyright - Non-Commercial Use Permitted
This page was generated automatically upon download from the ETH Zurich Research Collection. For moreinformation please consult the Terms of use.
ETH Library
DISS ETH NO 21872
IMPROVING ECO-EFFICIENCY OF LOW-INPUT CROPPING SYSTEMS BY THE USE OF LIFE
CYCLE ASSESSMENT AND INTEGRATIVE APPROACH
A thesis submitted to attain the degree of
DOCTOR OF SCIENCES OF ETH ZURICH
(Dr Sc. ETH Zurich)
Presented by
MICHAL ADAM KULAK
Master of Science (MSc) in Innovation and Design for Sustainability, Cranfield University
Born on 30.12.1985
Citizen of Poland
Accepted on the recommendation of:
Prof. Emmanuel Frossard, ETH Zurich
Dr Thomas Nemecek, Agroscope
Prof. Steve Evans, University of Cambridge
2014

2
3
TABLE OF CONTENTS
List of abbreviations ........................................................................................................................ 4
Abstract ........................................................................................................................................... 5
Zusammenfassung ........................................................................................................................... 7
Résumé ............................................................................................................................................ 9
General introduction ....................................................................................................................... 11
Chapter 1. How eco-efficient are low-input cropping systems in Western Europe and
what can be done to improve their eco-efficiency? ......................................................... 23
Chapter 2. Life cycle assessment of several alternative bread supply chains in Europe ................ 53
Chapter 3. Using LCA and integrative design for improving eco-efficiency. The case of
Bread in France. ................................................................................................................ 75
Discussion ........................................................................................................................................ 95
References ....................................................................................................................................... 115
Appendix A. Life Cycle Inventories for Chapter 2 ............................................................................ 130
Appendix B. Life Cycle Inventories for Chapter 3 ............................................................................ 141
Acknowledgements ......................................................................................................................... 147
4
LIST OF ABBREVIATIONS
AD Anaerobic digestion
FAO Food and Agriculture Organization of the United Nations
FU Functional Unit
GWP Global Warming Potential
LCA Life Cycle Assessment
LER Land Equivalent Ratio
LICS Low-Input Cropping Systems
N Nitrogen
NFT Nitrogen Fixing Trees
P Phosphorus
SI Sustainable Intensification
5
ABSTRACT
Low-input cropping systems (LICS) in Europe are characterised by mostly lower environmental
impacts per unit of land compared to high-input agriculture, but their benefits remain unclear when
productivity is taken into account. The research described in this thesis was conducted with two
goals: i.) to assess the eco-efficiency of European low-input cereal-based cropping systems, where
eco-efficiency is understood as the ratio of environmental impacts to production quantity and ii.) to
identify factors limiting eco-efficiency and assess the potential for improvements.
The first part of the thesis provides a review of the current literature on the relationship
between the application of agricultural inputs to cropping systems and environmental impacts
quantified with the use of product Life Cycle Assessment (LCA). Various interventions are also
reviewed that can improve this ratio. The empirical evidence shows that eco-efficient cropping
systems require application of optimum instead of minimum quantities of external inputs. These
optimum rates can be lowered by utilising positive synergies between crops to minimise waste of
nutrients and water and by utilising locally produced organic waste; both from within the farm as
well as from the surrounding sociotechnical environment. Strategies such as switching cultivars,
mixing cultivars, no-tillage, intercropping or anaerobic digestion can improve eco-efficiency at the
same level of agricultural inputs, but they will not be effective under all conditions. Choices of inputs
and their levels need to be considered under the specific agro-climatic and socio-economic regimes.
In the second part of the study, environmental impacts of several cases of bread from LICS
were compared to standard references with the use of LCA. The selection of cases covered two
different European climatic zones: Temperate oceanic and Mediterranean and two different scales of
production: farms below 10 ha and over 70 ha. Primary data were collected directly from producers.
Standard references were assumed to be breads made of cereals cultivated with standard methods,
processed in industrial mill and bakery and distributed through the supermarket. The study produced
highly variable results depending on farm management, year, location and organisation of the
distribution chain. Neither LICS nor on-farm processing was observed to guarantee reductions in
environmental impacts, although numerous opportunities for system improvements were identified
over the course of this analysis.
In the third part of the study, a structured, multi-stakeholder procedure was followed to
identify opportunities for improvements in two cases from France. Results of LCA with highlights of
processes responsible for the largest share of environmental impacts were disclosed to stakeholders
during the collaborative design workshop. Teams of participants consisting of plant breeders,
6
agronomists and representatives of farmer’s associations were asked to map out opportunities for
system improvements. Improvement scenarios were consulted with producers and only approved
solutions were considered in further LCA simulations. Conservative models revealed potential
reduction of 47% in the Global Warming Potential per kg of bread at one farm and 40% reduction for
aquatic eutrophication at the other one. Results suggest that in addition to biophysical limitations,
farms may suffer from the lack of innovation, suboptimal management and the lack of access to
reliable environmental information.
The research described in this thesis has shown that the level of farm-external inputs cannot
be used as a proxy of environmental performance. Although there are visible trends between the
application of inputs to cropping systems and environmental impacts of their products, final results
are highly dependent on a number of other factors. LICS are not per se more eco-efficient than high-
input agriculture. However, they can potentially have similar or better performance with their proper
organisation. Although some of the limiting factors are external and independent of the farmer-such
as the electricity mix of the country in which the production is located, eco-efficiency can be highly
influenced by management decisions made by farmers. There is a scope for large improvements of
eco-efficiency within LICS, but the supply of environmental information may be necessary to support
making the right design decisions.
7
ZUSAMMENFASSUNG
Low-Input-Anbausysteme in Europa haben meistens geringere Umweltwirkungen pro Flächeneinheit
als die High-Input-Landwirtschaft, ihre Vorteile sind jedoch nicht eindeutig, wenn die Produktivität
berücksichtigt wird. Die in dieser Dissertation beschriebene Forschung befasste sich mit zwei
Hauptzielen: i.) Die Beurteilung der Ökoeffizienz europäischer Low-Input-Systeme für den
Getreideanbau, wobei unter Ökoeffizienz das Verhältnis von Umweltwirkungen zum Produktion zu
verstehen ist. ii.) Die Identifizierung limitierender Faktoren und des Verbesserungspotenzials.
Der erste Teil der Dissertation besteht in einer systematischen Prüfung der aktuellen
Literatur zum Verhältnis zwischen dem landwirtschaftlichen Input von Anbausystemen und den
Umweltwirkungen, die mit Hilfe der Produkt-Ökobilanz (Life Cycle Assessment) quantifiziert werden.
Es wurden auch zahlreiche Massnahmen untersucht, welche die Leistungsfähigkeit der Systeme
verbessern können. Die empirischen Daten zeigen, dass eine gute Ökoeffizienz von Anbausystemen
nicht mit einer minimalen, sondern mit einer optimalen Menge von Inputs erreicht wird. Diese
optimale Inputmenge kann reduziert werden durch die Nutzung von Synergien zwischen
verschiedenen Kulturen, welche die Nährstoff- und Wasserverluste verringern, sowie durch die
Nutzung lokaler organischer Abfälle, die entweder im Landwirtschaftsbetrieb selber oder im nahen
soziotechnischen Umfeld anfallen. Strategien wie Züchtung, Sortenmischungen, Direktsaat,
Mischkulturen oder Biogasanlagen können die Ökoeffizienz bei gleichem Input verbessern, sind aber
nicht unter allen Bedingungen wirksam. Welche Inputs in welcher Menge eingesetzt werden, hängt
von den spezifischen agroklimatischen und sozioökonomischen Gegebenheiten ab.
Im zweiten Teil der Studie wurden die Umweltwirkungen der Herstellung von Brot aus
verschiedenen Low-Input-Betrieben mit Referenzstandards verglichen. Die Betriebe wurden so
gewählt, dass zwei Klimazonen Europas (gemässigtes ozeanisches und mediterranes Klima) und zwei
Betriebsgrössen (unter 10 ha und über 70 ha) vertreten waren. Die Basisdaten wurden direkt bei den
Produzenten erhoben. Als Referenz galten Brote aus dem Supermarkt, wobei das Getreide mit
Standard-Methoden produziert wurde. Die Studie ergab je nach Betriebsführung, Jahr, Standort und
Organisation der Vertriebskette sehr unterschiedliche Resultate. Weder die Low-Input-
Bewirtschaftung noch die Verarbeitung auf dem Landwirtschaftsbetrieb führte zu einer zuverlässigen
Reduktion der Umweltwirkungen. Im Laufe der Analyse konnten jedoch zahlreiche Möglichkeiten
identifiziert werden, mit denen sich Verbesserungen des Systems erzielen liessen.
Im dritten Teil der Studie wurden verschiedene Akteure einbezogen, um
Verbesserungsmöglichkeiten für zwei Fallbeispiele in Frankreich zu finden. Dazu wurden den
Akteuren im Rahmen eines partizipativen Design-Workshops die Ökobilanzen vorgelegt, bei denen
8
die Prozesse mit den grössten Umweltwirkungen aufgeführt waren. Die Teilnehmerteams, bestehend
aus Pflanzenzüchtern, Agronomen und Vertretern der Bauernverbände, erarbeiteten dann
Möglichkeiten für Systemverbesserungen. Die Verbesserungsszenarien wurden Produzenten
vorgelegt und nur für weitere Simulationen berücksichtigt, wenn sie deren Zustimmung fanden.
Konservative Modelle ergaben eine potenzielle Reduktion des Treibhauspotentials pro Kilogramm
Brot um mindestens 47% beim einen Betrieb und eine Reduktion der aquatischen Eutrophierung um
40% beim anderen Betrieb. Die Ergebnisse lassen vermuten, dass die Landwirtschaftsbetriebe nicht
nur aufgrund von biophysikalischen Aspekten an Grenzen stossen, sondern auch durch fehlende
Innovation, eine suboptimale Betriebsführung und ein Mangel an zuverlässigen
Umweltinformationen.
Die in dieser Dissertation beschriebene Forschung zeigt, dass zwischen den Inputs von
Anbausystemen und den Umweltwirkungen der erzeugten Produkte Zusammenhänge bestehen, die
sich mit Ökobilanzen beschreiben lassen. Wenn die Inputs extrem reduziert werden, ist das Ergebnis
aus Sicht der Ökoeffizienz nicht optimal. Die Ökoeffizienz hängt auch wesentlich von anderen
Komponenten des Anbausystems sowie von der Verarbeitung, vom Vertrieb und vom
soziotechnischen Umfeld ab. Low-Input-Anbausysteme sind nicht per se ökoeffizienter als High-
Input-Systeme. Sie können aber bei einer geeigneten Organisation bessere Ergebnisse erzielen. Zwar
lassen sich nicht alle begrenzenden Faktoren mit der Betriebsführung beeinflussen, die Ökoeffizienz
hängt aber doch stark von betriebsspezifischen Entscheidungen ab. Es besteht innerhalb der Low-
Input-Landwirtschaft Spielraum für wesentliche Verbesserungen der Ökoeffizienz. Damit die richtigen
Entscheidungen getroffen werden können, müssen jedoch ausreichende Umweltinformationen zur
Verfügung stehen.
9
RÉSUMÉ
En Europe, les systèmes culturaux à faible niveau d’intrants se caractérisent par des impacts
environnementaux généralement plus faibles par unité de surface par rapport à l’agriculture
intensive, mais leurs performances environnementales restent inconnues. Les recherches décrites
dans la présente thèse avaient deux objectifs principaux: i.) évaluer l’éco-efficience des systèmes de
cultures de céréales européens à faibles intrants exprimée par le rapport entre production et impacts
sur l’environnement et ii.) identifier les facteurs handicapants afin d’évaluer le potentiel
d’amélioration.
La première partie de la thèse conduit une revue systématique de la littérature sur le rapport
entre l’application des intrants agricoles dans les systèmes culturaux et l’impact environnemental
quantifié grâce aux analyses de cycle de vie (Life Cycle Assessment, LCA). Différentes interventions
sont également présentées, comme étant susceptibles d’améliorer les rendements. L’expérience
montre que l’éco-efficience des systèmes culturaux implique l’application de quantités optimales et
non minimales d’intrants externes. Ces quantités optimales peuvent être réduites en exploitant les
synergies entre les cultures afin de minimiser les pertes d’éléments nutritifs et d’eau ainsi qu’en
utilisant les déchets organiques locaux; à l’échelle de la ferme comme à l’échelle de l’environnement
socio-technique proche. Les stratégies telles que la sélection, le mélange des variétés, le semis direct,
les cultures intercalaires ou la digestion anaérobique peuvent accroître l’éco-efficience avec le même
niveau d’intrants agricoles, mais elles ne fonctionnent pas dans toutes les conditions. Le choix des
intrants et de leurs quantités doit tenir compte des régimes agroclimatiques et socio-économiques
spécifiques.
La deuxième partie de l’étude consistait à comparer les impacts environnementaux de
différents types de pains issus de l’agriculture à faibles intrants à des pains de référence. Les cas
étudiés ont été sélectionnés dans deux zones climatiques européennes: la zone tempérée océanique
et la zone méditerranéenne, pour deux niveaux de production différents: exploitations de moins de
10 ha et de plus de 70 ha. Les données de base ont été recueillies directement chez les producteurs.
Les pains de référence étaient supposés être des pains faits à partir de céréales cultivées selon les
méthodes modernes, fabriqués par des moulins et des boulangeries industriels et distribués en
supermarchés. L’étude a donné des résultats extrêmement variables suivant la gestion de la ferme,
l’année, la situation géographique de l’exploitation et l’organisation de la chaîne de distribution. On a
constaté que ni l’agriculture à faible niveau d’intrants, ni la transformation sur le site ne
garantissaient la réduction des impacts environnementaux, bien que de nombreuses possibilités pour
améliorer les systèmes aient pu être identifiées durant l’analyse.
10
La troisième partie de l’étude a suivi une procédure structurée, associant l’ensemble des
parties intéressées afin d’identifier les possibilités d’amélioration dans deux cas en France. Les
résultats d’analyses de cycles de vie joints aux processus-phares responsables de la majeure partie
des impacts environnementaux ont été communiqués aux parties intéressées durant l’atelier de
conception interdisciplinaire. On a demandé à des équipes de participants composées de
sélectionneurs, d’agronomes et de représentants des associations d’agriculteurs d’esquisser les
possibilités d’amélioration des systèmes. Les scénarios d’amélioration ont fait l’objet de
concertations avec les producteurs et seules les solutions approuvées ont été retenues pour les
simulations. Les modèles conservateurs ont indiqué des possibilités de réduction d’au moins 47% du
potentiel de réchauffement climatique global par kilo de pain dans une exploitation et de 40% de
réduction de l’eutrophisation aquatique dans une autre. Les résultats suggèrent qu’outre les limites
biophysiques, les exploitations souffrent du manque d’innovation, d’un management insuffisant et
du manque d’informations environnementales fiables.
Les recherches décrites dans la présente thèse ont montré qu’il existe des liens visibles entre
l’application d’intrants dans les systèmes culturaux et les impacts environnementaux de leurs
produits, liens qui peuvent être mis en évidence grâce aux analyses de cycle de vie. Du point de vue
de l’éco-efficience, il ne serait pas idéal de réduire la quantité des intrants à un niveau extrêmement
bas. Le résultat final de l’éco-efficience dépend également largement d’une autre composante du
système cultural, celle qui réunit fabrication, distribution et contexte socio-technique. Les systèmes
culturaux à faible niveau d’intrants ne sont pas plus éco-efficients en soi que l’agriculture intensive.
Cependant, avec une bonne organisation, ils peuvent avoir des performances similaires ou
supérieures. Bien que certains facteurs limitants soient indépendants de l’agriculteur, une grande
part de l’éco-efficience peut être influencée par les décisions de management spécifiques au site. Il
est donc possible d’améliorer encore l’éco-efficience dans l’agriculture à faible niveau d’intrants,
mais il est indispensable de réunir des informations sur l’environnement afin d’aider à prendre les
bonnes décisions en termes de conception.
11
GENERAL INTRODUCTION
12
Evolution of European cropping systems
Satisfaction of nutritional needs occupies significant portion of time and energy for all living
organisms, but humans managed to reduce the required effort to the minimum. The invention of
cropping systems was the first big step in this direction, allowing societies to switch from hunting and
gathering towards the agriculturally based organisation. A cropping system is a part of an agricultural
production system. It is defined by an area of land that is managed in a homogenous manner for
plant cultivation: with the same crops, in the same rotation and using the same technical means
(Sebillotte, 1990). Throughout the history, people constantly tried to increase their productivity – the
amount of useful output relative to the amount of invested inputs. In the second part of the 20th
century in Europe, the major and rapid improvements in land and labour productivity occurred when
high yielding cultivars of wheat and hybrids of maize were developed in formal breeding programs
(Kharkwal and Roy, 2004). These developments were coupled with the increased application of
synthetic, water soluble fertilisers and pesticides. As a result, per hectare yields of wheat and barley
in Western Europe have more than doubled between 1960s and 2000s and nearly tripled for maize
(FAOSTAT, 2012b). Technological changes of the last century brought significant improvements in
food security and labour productivity (Broadberry, 2009) and the area under agricultural production
in Europe in the last 30 years could slightly decrease (FAOSTAT, 2013). Relatively high levels of
fertilisers and pesticides applied in modern agriculture, however, raised numerous concerns over
their negative externalities (Pretty et al., 2000, Pimentel et al., 1992). In 1990s, the global production
of mineral, water soluble fertilisers had already been directly responsible for 1.2% of the world’s
energy use and 1.2% of greenhouse gas emissions (Kongshaug, 1998). Releases of even more
greenhouse gases follow their application to the fields. Applying nitrogen, both in mineral and
organic form, causes emission of nitrous oxide that is responsible for 4.8% of all anthropogenic
greenhouse gas emissions (Baumert, 2005, IPCC, 2007, Smith et al., 2000). Excessive supply of
nutrients caused problems of water eutrophication and acidification in many parts of the world
(Tilman et al., 2002). The excessive use of pesticides can have negative effects on human health and
13
ecosystems (Hellweg and Geisler, 2003, RIVM, 1992). Phosphorus is constantly mined for agriculture
in the form of the phosphate rock and its reserves are limited (Cordell et al., 2009) while global
trends show further increases in the demand and supply of agricultural inputs.
Low-input cropping systems (LICS) and their environmental impacts
Concerns over the negative externalities of modern agriculture in Europe led to the renewed
interested in traditional forms of farming. LICS is a part of a low-input farming system. Low-input
farming system have been defined as a farming system, where consumption of “external inputs” is
minimised and the use of internal resources maximised (Liebhardt et al., 1989, Parr et al., 1990,
Gosme et al., 2010). In agriculture, “external inputs” are commonly understood as those coming from
outside the farm: mainly fertilisers, pesticides and energy. The term “low-input farming” is often
confused with “organic farming”, but these two terms should not be used as synonyms. Organic
farms can apply high quantities of organic fertilisers and plant protection products that are allowed
within their certification schemes. LICSs, on the other hand, have relatively low material throughput,
meaning that less physical inputs is applied per ha but also less is produced as compared to high-
input systems. Low grain prices in 1990s paired with subsidies to less intensive modes of production
stimulated the re-emergence of such systems in the European Union (EU). Despite lower expected
yields, reducing inputs has been shown to allow European farmers maintaining their incomes (Loyce
et al., 2012, Bouchard et al., 2008). This is partly due to reduced costs and partly that many farmers
practicing low-input agriculture in Europe cultivate rare crops or ancient varieties profiting from price
premiums that consumers are willing to pay for these foods (Piergiovanni, 2013, Bouchard et al.,
2008). The European Environment Agency defines low-input farms in Europe as those spending less
than €80 ha−1a−1 on fertilizers, crop protection and concentrated feedstuffs (EEA, 2005). It has been
estimated, that the share of such farms within the total agricultural area of the EU-12 increased from
26% to 28% between 1990 and 2010 (EEA, 2005). Low-input systems have been supported by the
European Common Agricultural Policy, largely based on the assumption that negative environmental
14
impacts of arable intensification (Tilman et al., 2002, Stoate et al., 2001) can be reduced by switching
to less intensive methods of farming. However, broader environmental consequences from switching
back to low-input farming methods remain unclear. LICSs have been shown to cause less damage to
vascular plant richness than high-input agriculture (Kleijn et al., 2009), although there are species of
animals that prefer higher-intensity landscapes (Kleijn et al., 2001). Hodgson et al. (2010)
demonstrated that benefits from increasing intensity in part of the agricultural landscape and sparing
a fraction of land for biodiversity can be higher than low-intensity farming over the whole area.
Tuomisto (2012b) arrived at the opposite conclusions, showing benefits of low-input farming even if
the saved land, would be used for other uses, including the natural woodlands. There is evidence
that the systematic use of techniques such as manuring, mulching and cover cropping which are
practiced in LICSs can help to build up the lost soil organic matter (Johnston et al., 2009, Buyanovsky
and Wagner, 1998), and therefore potentially provide carbon sequestration benefits. On the other
hand, a relatively high amount of organic matter needs to be systematically applied to increase the
soil carbon (Johnston et al., 2009) and this biomass needs to be produced somewhere else.
Furthermore, there is an evidence of correlation between the level of nitrogen in the soil and the
amount of soil organic matter (Conant et al., 2005). The shortage of nutrients within the LICS may
stimulate the microbial communities, what enhances the decomposition of soil carbon and actually
increase the release of CO2 instead of sequestering it (Leifeld, 2013). LICSs are also producing less
food as compared to high-input agriculture. Rapid increases in food prices on the global market
between 2005 and 2011 brought productivity issues back on political and research agendas. Even
though the production of food in the European Union currently exceeds the needs of its citizens,
questions arise about opportunity costs of low-input farming. It has been estimated, that the global
agricultural production will have to increase by 70-100% in the near future to address the needs of
growing and increasingly wealthy world population (Bruinsma, 2009, HM Government, 2011, Royal
Society, 2009, Godfray et al., 2010). Given the fact that 18% of global anthropogenic greenhouse gas
emissions is already attributed to land conversions (Baumert, 2005) there is a strong case for
15
increasing production on the existing land to avoid further conversion of non-agricultural land and all
the resulting negative environmental consequences. Model projections suggest that production
increases on the existing land will have to be coupled in the future with significant reductions of
impacts that agricultural systems have on the environment. This is due to the fact that emissions
from today’s intensive (high-input) systems, if scaled up, would go beyond the capacity of the Earth
to absorb them (Foley et al., 2011, Godfray, 2011, Tilman et al., 2011). This creates the need for
developing new farming systems with higher levels of productivity per unit of land but lower impacts
on the environment.
The concept of eco-efficiency and its relevance to agricultural systems
Relationships between levels of production and environmental impacts of a production system can
be described by its eco-efficiency. World Business Council for Sustainable Development defined eco-
efficiency as being achieved by the provision of “competitively priced goods and services that satisfy
human needs and bring quality of life, while progressively reducing ecological impacts and resource
intensity throughout the life cycle, to a level at least in line with the Earth’s estimated carrying
capacity” (Schmidheiny, 1992). Large-scale improvements in eco-efficiency of businesses present one
of the visions for the transition of global society towards sustainability (Elkington, 1998, Hawken et
al., 2010). Huppes and Ishikawa (2005) distinguished four basic types of eco-efficiency (Table 1). In
this thesis, under the term improving eco-efficiency I understand reducing environmental intensity of
a production system or increasing environmental productivity. The extent to which eco-efficiency of
current economic systems will have to be improved over the next 40 years has been intensively
debated since 1970s (Reijnders, 1998). Model predictions have produced variable but always
significant numbers with estimates varying between factor 4 and 50. From the macro-economic
perspective, food and agriculture in high-income countries are among the least eco-efficient sectors
of the economy. Consumption of agricultural products is already responsible for 20% to 50% of all
major environmental impacts (Tukker et al., 2006), while the value added by agricultural production
16
in industrialised economies accounts for less than 3 % of GDP (World Bank, 2013). Food is a basic
human need and maintaining the production of diverse and nutritious products is an imperative of
food security. There is therefore a strong case for improving the eco-efficiency of agricultural systems
and in particular, the food production eco-efficiency.
Table 1. Four basic types of eco-efficiency adapted from Huppes and Ishikawa (2005).
Environmental productivity:
Production value per unit of environmental impact
Improvement cost:
Cost per unit of environmental improvement
Environmental intensity:
Environmental impact per unit of production value
Environmental cost-effectiveness:
Environmental improvement per unit of cost)
Methods for measuring eco-efficiency that can be applied to agriculture
The use of various methods has been reported in the previous literature for measuring eco-efficiency
in agriculture, including approaches such as Data Envelopment Analysis (Beltran-Esteve et al., 2012,
Picazo-Tadeo et al., 2011, Shortall and Barnes, 2013, Azad and Ancev, 2010), accounting of nitrogen
or nutrient use efficiencies (Carberry et al., 2013, Kuosmanen and Kuosmanen, 2013, Tilman et al.,
2001) or Life Cycle Assessment (Jan et al., 2012). Life Cycle Assessment (LCA) is a method that allows
to consider the broadest system boundary and the broadest range of environmental impacts
(Finnveden and Moberg, 2005). The use of holistic methods and consideration of the widest possible
scales and timeframes is necessary for the fair assessment of all production systems, but agricultural
systems in particular. Environmental impacts from agriculture have spatial rather than point or linear
character and are highly dispersed. Taking nitrous oxide emissions as an example, the production of
adipic acid that is used in nylon production is the single biggest industrial source of nitrous oxide
emissions, with all world emissions coming from only 255 to 600 point sources. Nitrous oxide
17
emissions measured at any given point in the fields are relatively small. Nevertheless, the global area
of farmland makes agriculture responsible for the majority of this greenhouse gas’s emission while
industry including nylon production makes up only 20% (Penman et al., 2000). The second reason is
that considering the broad range of environmental impacts is necessary to avoid burden shifting. The
relationship between carbon footprint and pesticide application presents an illustrative example. The
production and application of glyphosate is not particularly greenhouse gas intensive (Hischier et al.,
2010), cropping systems with glyphosate applications can therefore be characterised by lower GWP
per product unit than those with low or no use of pesticides if the pesticide application allows for
some yield increase. However, following their release to the environment, pesticides have negative
effects on human toxicity and ecosystems what is not incorporated in carbon footprint but would be
revealed in toxicity-related impact categories (Hellweg and Geisler, 2003). The application of Life
Cycle Assessment is regulated by international standards (ISO, 2006a, ISO, 2006b) and several
voluntary initiatives throughout the agri-food sector have been undertaken to further unify the
procedure and reduce the uncertainty of derived results, such as the ENVI-FOOD protocol (Camillo et
al., 2012).
The role of design in improving eco-efficiency
The first environmental policies were directed at preventing some specific emissions from entering
the environment or cleaning up those that have entered it (so-called “end-of-pipe” solutions). Today,
it is recognised that most of the environmental impacts of products, services and systems can be
addressed before the harmful substances are released or even formulated - through interventions at
the design stage (Graedel and Allenby, 1995). Ecodesign can be defined as a development process
considering complete life cycle of a product or service, where environmental impacts at all stages of
the life cycle are addressed to develop products and services with the lowest possible environmental
impacts (Glavič and Lukman, 2007, ISO/TR14062, 2002). Brezet (1997) distinguished four types of
ecodesign innovations, depending on the extent of changes: i.) product improvement, ii.) redesign,
18
iii.) product function and iv) system innovation. Product function innovation is not restricted to the
product itself, but the way its function is fulfilled, while system innovation includes changes in the
entire technological system (products, supply chains, infrastructure and institutional networks).
Ecodesign support tools based on LCA are increasingly applied in industry with the aim of reducing
environmental impacts of products, so far mostly by large firms and specifically from the electric and
electronic sectors (Kobayashi et al., 2005, Aoe, 2007, Toshiba, 2012, Takagi, 2000, Saling et al., 2002,
Knight and Jenkins, 2009). LCA-based eco-design tools have also been used by companies from the
agri-food sector (Schenker and Lundquist, 2010, Dutilh, 1998) but innovations at the agricultural
stage remain rarely reported, despite the significance of impacts that agricultural systems have on
the environment. McDevitt and Milà i Canals (2011) used LCA to identify breeding priorities for UK
oat that would lead to the highest reductions of environmental impacts along the whole product life
cycle. This led to the conclusion, that some of the biggest environmental improvements of porridge
can be achieved by modifying crop viscosity and flake liquid absorption and the reduction of cooking
time. De Jonge (2004) evaluated eco-efficiency improvement of fungicide by the internal Research
and Development (R&D) investments of a chemical company, demonstrating threefold reduction in
life cycle human toxicity over time, eightfold in terrestrial eco-toxicity and sevenfold in aquatic eco-
toxicity while providing the same crop protection function. Kulak et al. (2013) used LCA to identify
crops that would allow for the biggest savings of greenhouse gas emissions while cultivating at the
peri-urban community farm in London. The analysis showed that some crops, like beans and
courgettes have the capacity to provide large reductions of greenhouse gas emissions, while others,
like strawberries are better to be supplied from the conventional, supermarket-based food supply
system. Hayer et al. (2012) demonstrated with the use of LCA, that the eco-efficiency of French
cropping systems within the same region can be influenced by choices of cropping sequences.
Integrative approaches to eco-design
19
Most of the past eco-design innovations in agriculture focused on optimisation of single elements of
the cropping system design, such as the pesticide (de Jonge, 2004) or a cultivar (McDevitt and Milà i
Canals, 2011). However, the final environmental performance of the cropping system will be
determined by multiple processes. By optimising only one component of the system in question, only
incremental improvements in eco-efficiency can be achieved. Whole System Design (Integrative
Design) is an approach that has its roots in the field of industrial design. It emphasises the need to
look at the whole system instead of its parts to achieve significant improvements in system efficiency
(Stasinopoulos et al., 2009). The concept implies the need for the integration of actors and the use of
trans-disciplinary skills in a design process to provide radical improvements (Charnley et al., 2011).
Case studies of application showed factor 10 improvements in energy efficiency of a building (Lovins,
2010) or radical reductions in fuel use of a hydrogen-based vehicle (Charnley et al., 2011). Anarow et
al., (2003) gave Integrated Pest Management (IPM) as an example from agriculture. The approach is
based on the knowledge of life cycles of pests and encourages large number of small strategic
interventions that cumulatively result in an effective pest control. Integrated Nutrient Management
can be used as another example, an approach to farm management that encourages increasing the
utilisation of nutrients within cropping system and decreasing losses through utilising interactions
between all the environmental components involved in nutrient cycling, as well as considering of the
socio-economic aspects to ensure technology adoption (Frossard et al., 2009).
The potential role of integrative design in improving eco-efficiency of low-input cropping systems
Eco-efficiency improvement (understood as increasing environmental productivity or reducing
environmental intensity as defined in Table 1) can be achieved in three ways: i.) by reducing
environmental impacts while maintaining productivity, ii.) by increasing production while maintaining
environmental impacts or iii.) by the combination of both approaches. Literature gives numerous
examples of integrated solutions for increasing production in a cropping system in a sustainable
manner (sustainable intensification). These include such approaches as Conservation Agriculture (CA)
20
(Murray, 2012, Pretty, 2009, World Bank, 2004), diversification of species (Cassman, 1999, Murray,
2012), integrated pest and nutrient managements (FAO, 2011, Frossard et al., 2009, Murray, 2012,
Pretty, 2009, World Bank, 2004), agroforestry systems (Cassman, 1999, Dore et al., 2011, FAO, 2011,
Pretty, 2009), precision agriculture (Cassman, 1999, World Bank, 2004), reintegrating crop and
livestock production (Dore et al., 2011, FAO, 2011, Pretty, 2009, Pretty, 2011, Vayssières et al., 2011)
or mixing cultivars and species (Dore et al., 2011, FAO, 2011). The current literature however lacks
critical, systematic assessments of their performance. The cases of local food (Edwards-Jones et al.,
2008) or organic food (Tuomisto et al., 2012b) demonstrated that human perceptions of what
sustainable systems might look like can be different to the picture shown by the quantification of
resource flows.
Goal and objectives of the thesis
The goals of this study were twofold: i.) to assess the eco-efficiency of low-input cropping systems in
Europe in relation to standard methods of production and ii.) to quantify the potential improvements
that can be achieved through the application of integrative design approach supported by LCA.
The study had following objectives to fulfil these goals:
1. To review the existing evidence on the ratio of production to environmental impacts in
European low-input cropping systems and strategies that can bring improvements.
2. To quantify environmental impacts of products from several real-life low-input cropping
systems and to compare these systems to current patterns of crop production in Europe.
3. To develop and apply a new methodology coupling benefits of integrative approaches to
cropping system design and LCA and to quantify the improvement potential in case study
systems.
21
Structure of the thesis
The thesis consists of three chapters and a general discussion.
Chapter one addresses the first objective of the research project. This chapter provides a review of
literature on relationships between the reduction of external inputs to cropping systems and their
eco-efficiency, measured as the ratio of environmental impacts assessed by LCA to the quantity of
product.
The second chapter addresses the second objective. It describes the application of product LCA to
evaluate eco-efficiency of several low-input producers from Europe aiming at implementing eco-
innovations at the level of food supply chain and at producing bread with low environmental
impacts. Results per kg of bread at the consumer table are compared to product equivalents from
supermarket-based supply chains.
The third chapter addresses the third objective. It describes the methodology that can be applied for
improving eco-efficiency of farming systems based on the collaboration of researchers and farmers
and the use of LCA as an information support tool. The application of methodology was tested
through collaboration with two producers from France. In the method, LCA allows to locate hot-spots
requiring the greatest attention to improve environmental performance and new ideas are
generated through interdisciplinary discussions. The stakeholder feedback allows ruling out the
solutions that would not be accepted by producers and their customers.
The three chapters are followed by a cross-sectional discussion. It starts by highlighting the
contributions of the thesis to the current state of knowledge. This is followed by the discussion on
limitations of different aspects of the method that can be improved in the future as well as its
advantages. The thesis is summarised by concluding remarks.

22
23
CHAPTER 1.
HOW ECO-EFFICIENT ARE LOW-INPUT CROPPING SYSTEMS IN
WESTERN EUROPE AND WHAT CAN BE DONE TO IMPROVE THEIR
ECO-EFFICIENCY?
This chapter is an adapted version of the following publication:
KULAK, M., NEMECEK, T., FROSSARD, E. & GAILLARD, G. 2013. How Eco-Efficient Are Low-Input
Cropping Systems in Western Europe, and What Can Be Done to Improve Their Eco-Efficiency?
Sustainability, 5, 3722-3743.
24
1. Introduction
Common Agricultural Policy and a number of national policies were introduced in XXth century
Europe to increase food security. This goal has been achieved with remarkable success in the western
part of the continent, where it has been paired with the rapid economic growth. Today, Western
Europe is one of the world’s most agriculturally productive regions, whose mean wheat yield
between 1990 and 2011 was 2.5 times higher than the global average, and almost 3 times higher
than Eastern Europe’s (FAOSTAT, 2013). Agricultural developments significantly increased land
productivity whilst reducing labour requirements (Eurostat, 2013). These productivity gains,
however, were achieved at some external cost. It is well recognised that agricultural intensification
was coupled with the increased use of synthetic fertilisers, pesticides and irrigation water, and that
this created a number of sustainability challenges (Stoate et al., 2001, Tilman et al., 2002). Concerns
over the nutrient pollution and loss of ecosystem services caused by intensive production resulted in
a renewed interest in, and public support for, more extensive modes of production, such as LICSs.
Although losses from pests and diseases in LICSs can be partially mitigated by cultivating crops and
varieties that have higher resistance (Loyce et al., 2012), overall yield is expected to be lower
because of the lower absolute yield potential (Gosme et al., 2010).
Due to the concerns over the ability of humanity to feed itself in the future, researchers from
the Food and Agriculture Organization of the United Nations (FAO) and a number of other
organisations called for an increase in global food production on existing agricultural land with a
simultaneous reduction of its impacts on the environment (IAASTD, 2009, Royal Society, 2009,
Murray, 2012, HM Government, 2011). The term ‘intensification’ emphasises the necessity of
achieving productivity increases, but global sustainable intensification (SI) does not mean that yields
must be increased in all regions (Garnett et al., 2013). Western Europe is among the few areas in the
world with relatively high levels of food security and the highest levels of domestic supply quantity of
25
agricultural goods (FAOSTAT, 2012a). As intensive agricultural systems have already caused
significant damage to the environment in this region (Stoate et al., 2001), it is therefore reasonable
to seek for improvements in eco-efficiency of European agriculture rather than further sole yield
increases.
The objectives of this chapter are twofold:
1) to review the evidence from LCA regarding the effect of reducing agricultural inputs on eco-
efficiency; and
2.) to identify interventions for improving eco-efficiency of LICSs.
Eco-efficiency can be expressed in quantitative terms as a relationship between
environmental impact and the production value (Table 1). In this study, we looked at the changes in
the quantity of product, assuming that the rate of change in product quantity at a constant price will
correspond to the rate of change in monetary value. At present, Life Cycle Assessment (LCA) is the
most standardised and widely applied method allowing to quantify environmental impacts of
products, services and activities throughout their life cycles (Finnveden et al., 2009). LCA can be
applied to evaluate cropping systems by using the ratio of quantitative environmental indicators to
productive functional units, thereby allowing the systematic comparison of eco-efficiency between
systems. LCA is widely applied in the agri-food sector (Corson and Van der Werf, 2012) with the most
common use being the comparison of environmental impacts at farm scale between organic and
conventional farming systems, as illustrated in a recent meta-analysis dedicated to this subject
(Tuomisto et al., 2012b). To date, far less research has been devoted to the evaluation of cropping
systems with different levels of external inputs, and to identifying practical solutions for their
improvement.
2. Methodology
26
Goal and scope definition is the first step of every LCA study (ISO, 2006a), as it determines
the assumptions and methodological choices. For the purpose of achieving the first objective of this
chapter, we selected studies that were solely dedicated to comparing cropping systems at different
fertilisation levels. Since LCAs are spatially explicit (Roches et al., 2010), we included only those with
the study subject located in Western Europe. In Haas et al.’s study (2001), we excluded the impact
categories of biodiversity, landscape image and animal husbandry, since these were expressed per
farm, and were therefore not related to any uniform product-related functional unit that would allow
to make conclusions over eco-efficiency. We also excluded results for the impact categories of
groundwater quality and surface-water quality, as they were calculated as a function of nutrient use,
and hence provided no additional information to the impact category ‘eutrophication’. Due to the
differing approaches that were used across studies to characterise land-use impacts, we used the
impact category “land occupation” to ensure comparability. Defined as the surface area of
agricultural land that must be occupied for one year to deliver the given functional unit, land
occupation was calculated on the basis of yield. To better illustrate the relationship between external
input levels and eco-efficiency, we compiled LCA results for bread-wheat production from two
independent studies (Brentrup et al., 2004, Nemecek et al., 2011a,b) in a graphic form. To allow
comparability, original eutrophication units from Nemecek et al. (2011a,b) which were nitrogen
equivalents were converted to phosphorus equivalents using conversion factors from Hauschild and
Wenzel (1998). We also employed Agri-LCI models from Cranfield University (Williams et al., 2006,
Cranfield University, 2006) to estimate the environmental impacts of wheat production in the UK at
fertilisation levels corresponding to those of Brentrup et al. (2004), and included these results for
comparison. The list of potential strategies for improving eco-efficiency was compiled from review
articles on sustainable intensification (FAO, 2011, Flavell, 2010, Royal Society, 2009, Murray, 2012,
World Bank, 2004, Pretty, 2009, Cassman, 1999, Dore et al., 2011, Pretty, 1997, Vayssières et al.,
2011), and those for which LCA studies could be found were included in the review. Based on
previous knowledge, we supplemented the list with nutrient-recycling technologies. It is worth
27
mentioning that the list of techniques reviewed in this chapter is exemplary, and other, more
effective techniques may exist for improving cropping system eco-efficiency. We used Agri-LCI
models to simulate the consequences of reduction in tillage. For simplicity’s sake, we limited the
comparison to one impact category (‘net greenhouse-gas balance’) while discussing the
environmental impacts of various feedstocks for anaerobic digestion. In the final part of the chapter,
we addressed some limitations of LCA methodology for assessing the performance of low-input
systems.
3. Environmental impacts of LICSs
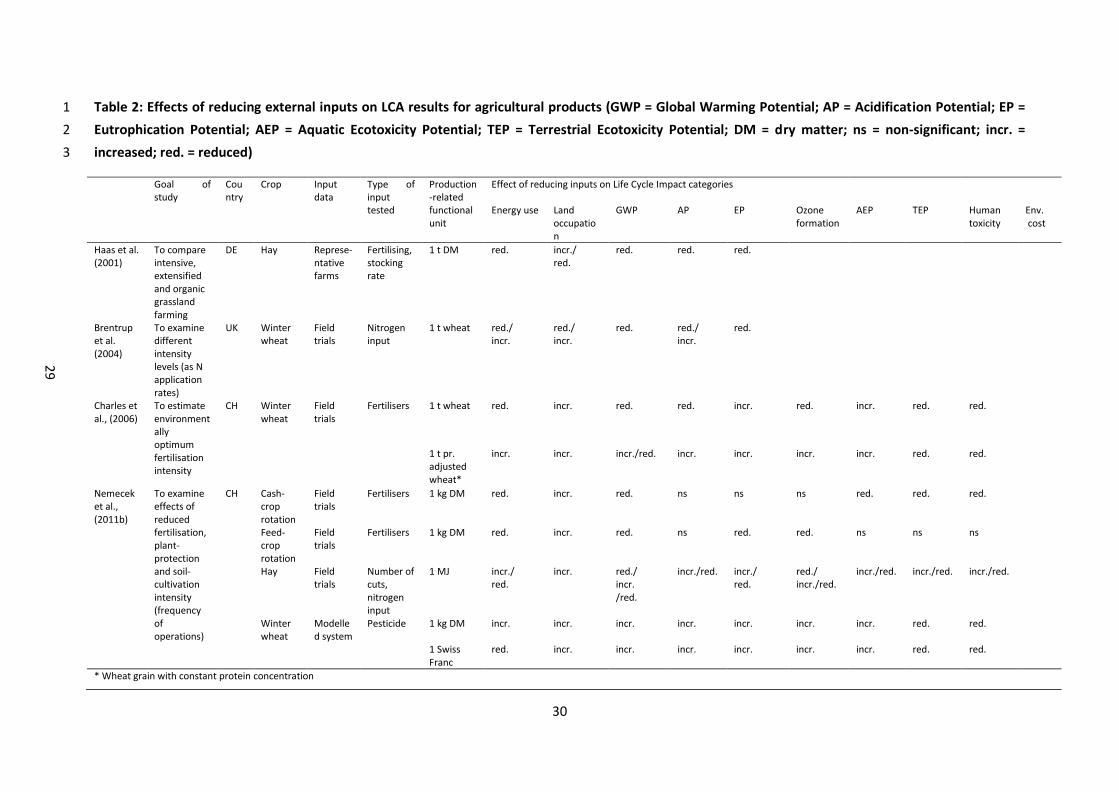
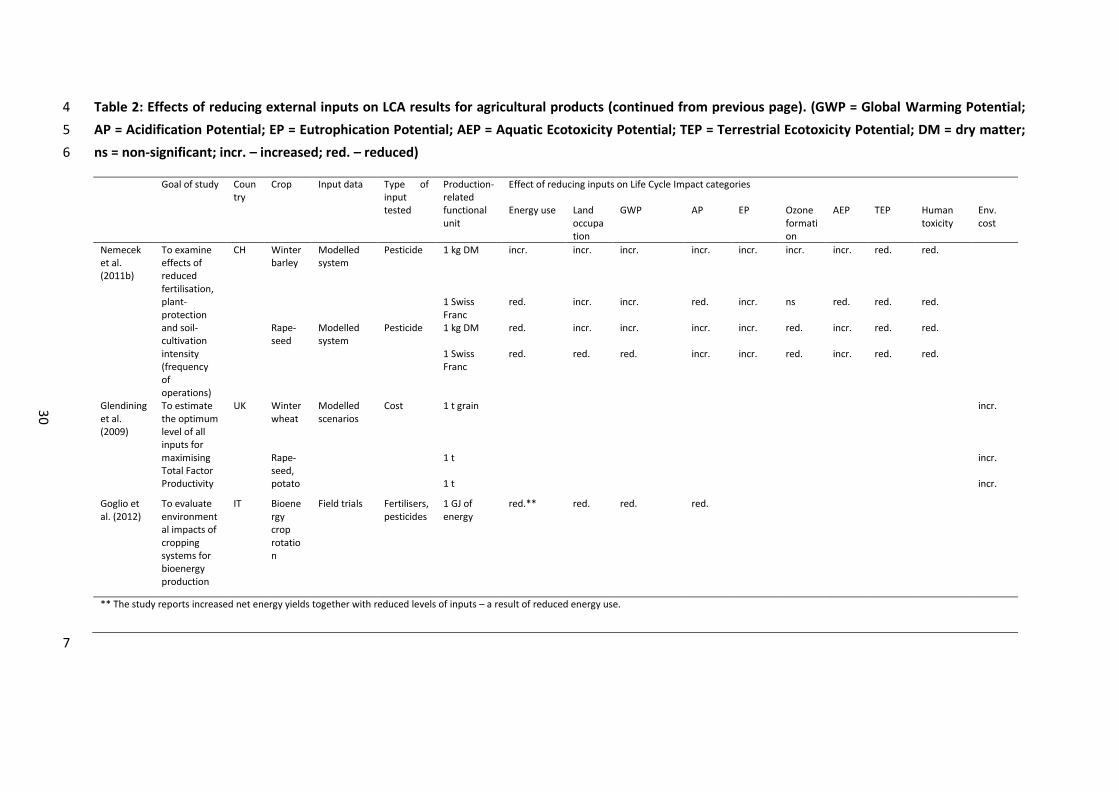
Table 2 gives an overview of LCA studies from Western Europe on cropping systems with
different levels of external inputs. The study of Haas et al. (2001) showed a reduction in all
environmental impacts except for land occupation per tonne of harvested grass when external input
levels were reduced. However, the relative differences in mean yield in the study were relatively low:
11.8 t ha-1 in the intensive, 10.5 t ha-1 in the extensified and 10.7 t ha-1 in the organic system.
Although it is known that mineral fertilisers were used in the intensive and not in the extensified and
organic systems, the rates of application of organic fertilisers were not reported. Brentrup et al.'s
study (2004) was based on a long-term field trial from the Rothamsted research station in the UK.
Environmental impacts at seven different nitrogen (N) fertilisation levels were investigated, from 0 to
288 kg N ha-1, with other inputs kept at constant rates. Environmental impacts per tonne of wheat
were shown to decrease here proportionally to decreasing levels of N for two of the analysed impact
categories: ‘Global Warming Potential’ and ‘Eutrophication Potential’. Despite this, energy use and
acidification were shown to decrease and increase again when levels of N were too low. At a very
high fertilisation level, land occupation could be reduced by reducing N, but was generally observed
to be increasing together with reduced inputs due to reduced yields. Charles et. al. (2006) performed
a study in Switzerland in which four fertilisation treatments for wheat were analysed: 100 kg N ha-1,
140 kg N ha-1,180 kg N ha-1, and 220 kg N ha-1, with P and K adjusted proportionally to nitrogen levels.
28
All impact categories except for land occupation, eutrophication and aquatic ecotoxicity were shown
to decrease per tonne of wheat grain when N was reduced. Functional unit (FU) represents the
function (product or service) of the analysed system, based on which the comparison in LCA study is
made (ISO, 2006a). When 1 t of wheat with constant protein content was used as a FU, nearly all
environmental impacts increased along with a reduction in N, owing to the positive relationship
between N fertilisation and protein content of grains. Nemecek et al., (2011b) showed that all impact
categories except for land occupation were reduced or unaffected in a cash-crop rotation and a feed-
crop rotation. In the grassland systems investigated, however, energy use, acidification,
eutrophication, aquatic ecotoxicity, terrestrial ecotoxicity and human toxicity all increased along with
a reduction in fertilisation, and decreased again at very low levels of fertilisation, while for ozone
formation and the Global Warming Potential (GWP) the opposite result was found -the highest
environmental impacts were at the highest and lowest fertilisation levels. Modelled cropping systems
for winter wheat and barley showed increases per product unit for nearly all impact categories
considered, except for those related to toxicity, and – in the case of rapeseed – ozone formation.
When ‘Swiss Franc of revenue’ was used as a FU, the result was more favourable for low-input
production, partially owing to the direct payments for this type of cultivation in Switzerland.
Glendining et al., (2009) coupled LCA models from Williams et al., (2006) with the economic
valuation of ecosystem services. The starting point of the analysis was current levels of intensity in
the UK, and several scenarios for nationwide reductions in inputs to wheat production were
examined. The study showed that environmental damage to ecosystem services will increase for all
products analysed if farmers in the UK reduce input levels. This was owed to increasing land
requirements, and agricultural land use was assigned a high environmental cost due to the potential
damage caused to natural ecosystems in case of agricultural expansion. Goglio et al., (2012)
investigated cropping systems for first-generation bioenergy production with different levels of
external inputs in Italy, showing that environmental impacts per MJ of energy produced can be
lowest at low levels of external inputs.
29
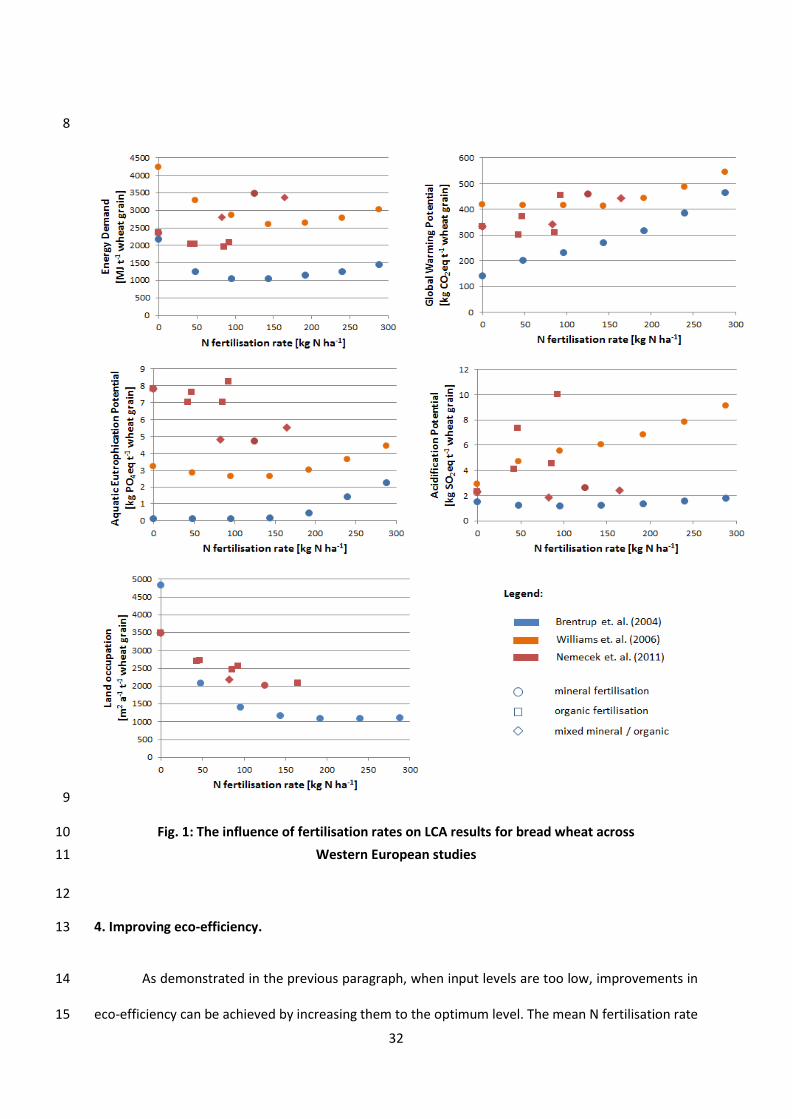
Figure 1 illustrates the relationships between nitrogen application to bread wheat and
environmental impacts per tonne of harvested grain across different studies. It is worth mentioning
that wheat has a strong response to N fertilisation, and results for less N demanding crops would
probably be more favourable for low-input production. The results from both Williams et al. (2006)
and Brentrup et al. (2004) reveal an optimum point for energy use at the moderate application rates,
between 100 and 200 kg, although there is a difference of a factor of 2 between the absolute values.
Both studies show that reducing or increasing nitrogen below or above an optimum level will cause
diminishing of eco-efficiency. Nemecek et al. (2011b) revealed a reduction in energy demand with
increased fertilisation rates, although the absolute levels of applied nitrogen remained below 200 kg
N ha-1. There is a clear difference between organic and mineral fertilisation, with the latter being
characterised by higher energy demand. Brentrup et al. (2004) revealed a close-to-linear relationship
between increased nitrogen levels and GWP, while in Williams et al. (2006) GWP remains constant at
lower levels, followed by a rapid increase at higher levels of fertilisation. Large differences between
studies at lower fertilisation levels are presumably due to differences in modelling assumptions for
greenhouse-gas emissions from unfertilised soils. Although more dispersed, results of Nemecek et.
al. (2011b) show increases along with increased fertilisation. In both Williams et al. (2006) and
Brentrup et al. (2004), the eutrophication potential appears to remain steady or decrease slightly
with increasing fertilisation at lower rates, then increase at higher rates above 200 kg N per ha.
Nemecek et al.’s (2011b) results show a much higher Eutrophication Potential for organic
fertilisation. Although Acidification Potential increases proportionally to nitrogen application in
Williams et al.'s model (2006), according to Brentrup et al. (2004) it decreases slightly before
increasing again. Nemecek et al.'s study (2011b) reveals higher results for the organically fertilised
cases. The non-linearity of results shows the importance of factors other than quantity of N for eco-
efficiency results.
30
Table 2: Effects of reducing external inputs on LCA results for agricultural products (GWP = Global Warming Potential; AP = Acidification Potential; EP = 1
Eutrophication Potential; AEP = Aquatic Ecotoxicity Potential; TEP = Terrestrial Ecotoxicity Potential; DM = dry matter; ns = non-significant; incr. = 2
increased; red. = reduced) 3
Goal of study
Country
Crop Input data
Type of input tested
Production-related functional unit
Effect of reducing inputs on Life Cycle Impact categories
Energy use Land occupation
GWP AP EP Ozone formation
AEP TEP Human toxicity
Env. cost
Haas et al. (2001)
To compare intensive, extensified and organic grassland farming
DE Hay Represe-ntative farms
Fertilising, stocking rate
1 t DM red. incr./ red.
red. red. red.
Brentrup et al. (2004)
To examine different intensity levels (as N application rates)
UK Winter wheat
Field trials
Nitrogen input
1 t wheat red./ incr.
red./ incr.
red. red./ incr.
red.
Charles et al., (2006)
To estimate environmentally optimum fertilisation intensity
CH Winter wheat
Field trials
Fertilisers 1 t wheat red. incr. red. red. incr. red. incr. red. red.
1 t pr. adjusted wheat*
incr. incr. incr./red. incr. incr. incr. incr. red. red.
Nemecek et al., (2011b)
To examine effects of reduced fertilisation, plant-protection and soil- cultivation intensity (frequency of operations)
CH Cash-crop rotation
Field trials
Fertilisers 1 kg DM red. incr. red. ns ns ns red. red. red.
Feed-crop rotation
Field trials
Fertilisers 1 kg DM red. incr. red. ns red. red. ns ns ns
Hay Field trials
Number of cuts, nitrogen input
1 MJ incr./ red.
incr. red./ incr. /red.
incr./red. incr./ red.
red./ incr./red.
incr./red. incr./red. incr./red.
Winter wheat
Modelled system
Pesticide 1 kg DM incr. incr. incr. incr. incr. incr. incr. red. red.
1 Swiss Franc
red. incr. incr. incr. incr. incr. incr. red. red.
* Wheat grain with constant protein concentration
29
31
Table 2: Effects of reducing external inputs on LCA results for agricultural products (continued from previous page). (GWP = Global Warming Potential; 4
AP = Acidification Potential; EP = Eutrophication Potential; AEP = Aquatic Ecotoxicity Potential; TEP = Terrestrial Ecotoxicity Potential; DM = dry matter; 5
ns = non-significant; incr. – increased; red. – reduced) 6
Goal of study Country
Crop Input data Type of input tested
Production-related functional unit
Effect of reducing inputs on Life Cycle Impact categories
Energy use Land occupation
GWP AP EP Ozone formation
AEP TEP Human toxicity
Env. cost
Nemecek et al. (2011b)
To examine effects of reduced fertilisation, plant-protection and soil- cultivation intensity (frequency of operations)
CH Winter barley
Modelled system
Pesticide 1 kg DM incr. incr. incr. incr. incr. incr. incr. red. red.
1 Swiss Franc
red. incr. incr. red. incr. ns red. red. red.
Rape- seed
Modelled system
Pesticide 1 kg DM red. incr. incr. incr. incr. red. incr. red. red.
1 Swiss Franc
red. red. red. incr. incr. red. incr. red. red.
Glendining et al. (2009)
To estimate the optimum level of all inputs for maximising Total Factor Productivity
UK Winter wheat
Modelled scenarios
Cost 1 t grain incr.
Rape- seed,
1 t incr.
potato 1 t incr.
Goglio et al. (2012)
To evaluate environmental impacts of cropping systems for bioenergy production
IT Bioenergy crop rotation
Field trials Fertilisers, pesticides
1 GJ of energy
red.** red. red. red.
** The study reports increased net energy yields together with reduced levels of inputs – a result of reduced energy use.
7
30
32
8
9
Fig. 1: The influence of fertilisation rates on LCA results for bread wheat across 10
Western European studies 11
12
4. Improving eco-efficiency. 13
As demonstrated in the previous paragraph, when input levels are too low, improvements in 14
eco-efficiency can be achieved by increasing them to the optimum level. The mean N fertilisation rate 15
33
for arable crops in Western Europe between 2002 and 2010 was 123 kg N ha -1 (FAOSTAT, 2013). 16
Taking wheat production as an example (Fig. 1), this appears to be within or even slightly below the 17
optimum levels for eco-efficiency. This could lead to the conclusions that current fertiliser application 18
levels are optimal, and that further reductions in inputs would generally increase the level of damage 19
to ecosystem services (Glendining et al., 2009). Viewing eco-efficiency as a function of input levels, 20
however, is an oversimplification, since inputs to the production process can also be substituted. The 21
substitution of inputs will influence eco-efficiency, it is therefore possible to manipulate this value by 22
switching between different types of inputs instead of increasing them. Changing the crop from 23
wheat to another crop less dependent on nitrogen fertilisation provides more output from the same 24
rate of natural resources invested, thereby improving eco-efficiency. 25
4.1. Reduced tillage, conservation tillage and no-till farming 26
Crop-production technologies that reduce tillage and leave at least 30% of crop residues on 27
the soil surface are referred to as conservation tillage (Jarecki and Lal, 2003). Reduction in tillage is an 28
essential component of a wider set of practices known as Conservation Agriculture (Govaerts et al., 29
2009). A more specific system of sowing crops with less than 5 cm of disturbance to the soil structure 30
and in which 30 – 100% of the soil surface is covered with plant residues is known as no-till, direct 31
drilling or zero tillage (Soane et al., 2012). In the past, the adoption of no-till farming was believed to 32
sequester atmospheric carbon and mitigate climate change (Lal, 2004, West and Post, 2002). 33
Numerous LCA studies have been conducted that incorporate these effects into the greenhouse gas 34
balance, mainly in the context of biofuel production (Kim and Dale, 2005, Borzęcka-Walker et al., 35
2013, Syp et al., 2012, Gelfand et al., 2013). Recently, however, these assumptions have been called 36
into question, since no differences in carbon pool between the soil under no-till and conventional 37
cultivation can systematically be observed when the entire soil profile is measured (Baker et al., 38
2007, Blanco-Canqui and Lal, 2008). Table 3 reviews the results of LCA studies on the effects of no-39
tillage cultivation without assuming carbon sequestration benefits. Based on the results of a field 40
34
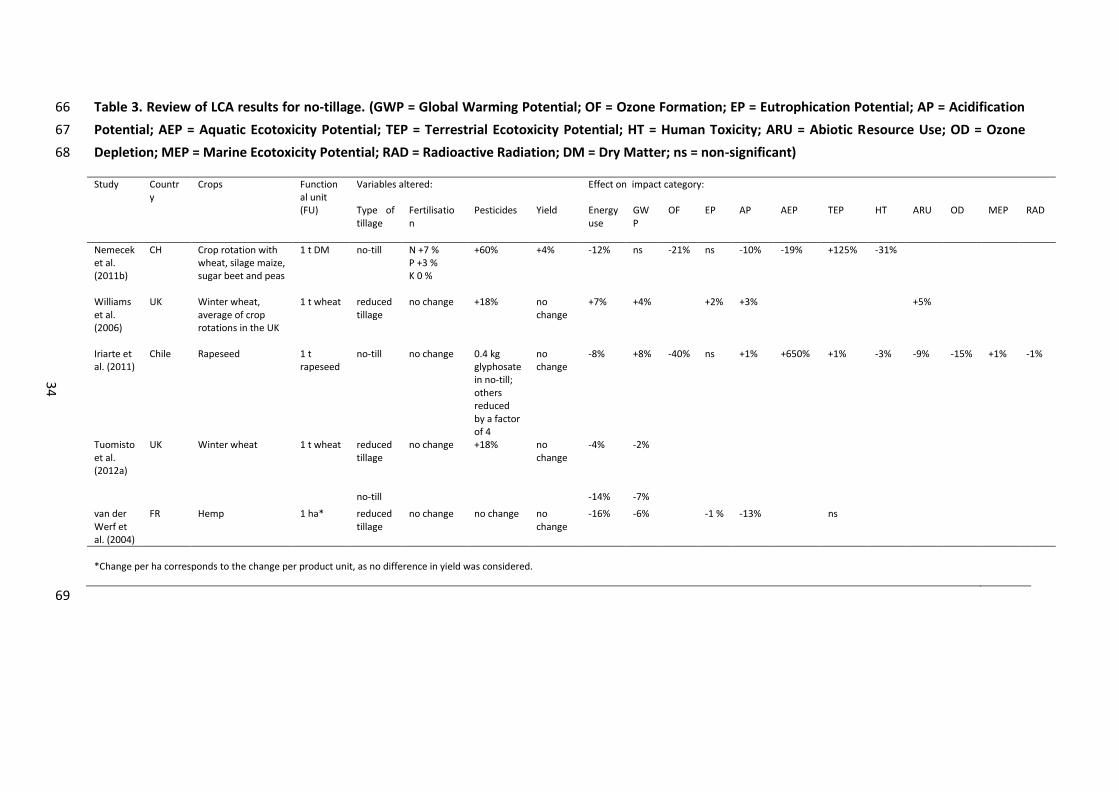
experiment conducted in Switzerland, (Nemecek et al., 2011b) showed that introducing no-till 41
practices can reduce some environmental impacts such as human toxicity, but also increase others, 42
like terrestrial ecotoxicity due to the necessity for the application of pesticides, and in addition may 43
have no effect on eutrophication and GWP per product unit. The yield in the cropping-system 44
experiment increased by 4% over that of conventional tillage, but this may be partially owing to the 45
increase in N and P fertilisation. Williams et al., (2006) model assumes the need to increase various 46
pesticides by 18% in order to maintain the same yield levels when adopting reduced-tillage practices. 47
Modelling the switch from conventional to reduced-tillage practices reveals slight increases in the 48
environmental impacts. In Iriarte et al. ’s study (2011) on rapeseed production in Chile, no-till 49
practices reduced ozone formation potential by 40%, but increased aquatic ecotoxicity by 650% due 50
to the application of glyphosate. Studies conducted by Tuomisto et al. (2012a) and Van Der Werf 51
(2004) revealed slight reductions in the environmental impacts. 52
All LCA studies considered here assumed no decrease in yields after the application of no-53
tillage systems. The adoption of these techniques could therefore be of interest to farmers, as they 54
enable savings in diesel and labour associated with soil preparation. It should be borne in mind, 55
however, that yields can also decline substantially following the adoption of no-tillage methods, 56
especially when weed control by herbicides is not sufficient. Soane et al. (2012) performed a meta-57
analysis of experiments conducted in Europe, in which yields from no-till and plough-based farming 58
would be compared. Their findings indicate that whilst the adoption of no-tillage in conventional 59
agriculture can increase yields in dry regions of south-western Europe, no-till would most likely cause 60
reductions in yield in northern Europe, with its higher annual rainfall. The key benefit of no-tillage is 61
improved water retention of the soil. The adoption of this technique, however, requires effective 62
weed control. This presents an important limiting factor for most European low-input farmers, 63
especially those that have certificates of organic farming that forbid the use of synthetic pesticides. 64
65
35
Table 3. Review of LCA results for no-tillage. (GWP = Global Warming Potential; OF = Ozone Formation; EP = Eutrophication Potential; AP = Acidification 66
Potential; AEP = Aquatic Ecotoxicity Potential; TEP = Terrestrial Ecotoxicity Potential; HT = Human Toxicity; ARU = Abiotic Resource Use; OD = Ozone 67
Depletion; MEP = Marine Ecotoxicity Potential; RAD = Radioactive Radiation; DM = Dry Matter; ns = non-significant) 68
Study Country
Crops Functional unit
Variables altered: Effect on impact category:
(FU) Type of tillage
Fertilisation
Pesticides Yield Energy use
GWP
OF EP AP AEP TEP HT ARU OD MEP RAD
Nemecek et al. (2011b)
CH Crop rotation with wheat, silage maize, sugar beet and peas
1 t DM no-till N +7 % P +3 % K 0 %
+60% +4% -12% ns -21% ns -10% -19% +125% -31%
Williams et al. (2006)
UK Winter wheat, average of crop rotations in the UK
1 t wheat reduced tillage
no change +18% no change
+7% +4% +2% +3% +5%
Iriarte et al. (2011)
Chile Rapeseed 1 t rapeseed
no-till no change 0.4 kg glyphosate in no-till; others reduced by a factor of 4
no change
-8% +8% -40% ns +1% +650% +1% -3% -9% -15% +1% -1%
Tuomisto et al. (2012a)
UK Winter wheat 1 t wheat reduced tillage
no change +18% no change
-4% -2%
no-till -14% -7%
van der Werf et al. (2004)
FR Hemp 1 ha* reduced tillage
no change no change no change
-16% -6% -1 % -13% ns
*Change per ha corresponds to the change per product unit, as no difference in yield was considered.
69
34
36
4.2. Legumes and crop rotations 70
Crop rotation can potentially improve yields in LICSs without increasing environmental 71
burdens. This is mainly due to two effects: i.) the elimination or reduction of crop-specific pathogens 72
(phytosanitary effects) or weeds, and ii.) Symbiotic or Biological Nitrogen Fixation (SNF/BNF) by 73
leguminous crops. Some legumes can also improve phosphorus availability for the plants following 74
them in the rotation (Hocking et al., 2002, Muchane et al., 2010, Pypers et al., 2007), whilst others, 75
such as alfalfa (Medicago sativa) can improve water uptake from the subsoil for the subsequent 76
crops (Gaiser et al., 2012). None of these mechanisms requires the investment of additional non-77
renewable resources, nor do any of them cause substantial emissions to the environment. Several 78
LCA studies evaluated the effects of introducing legumes into cropping systems (Table 4). Nemecek 79
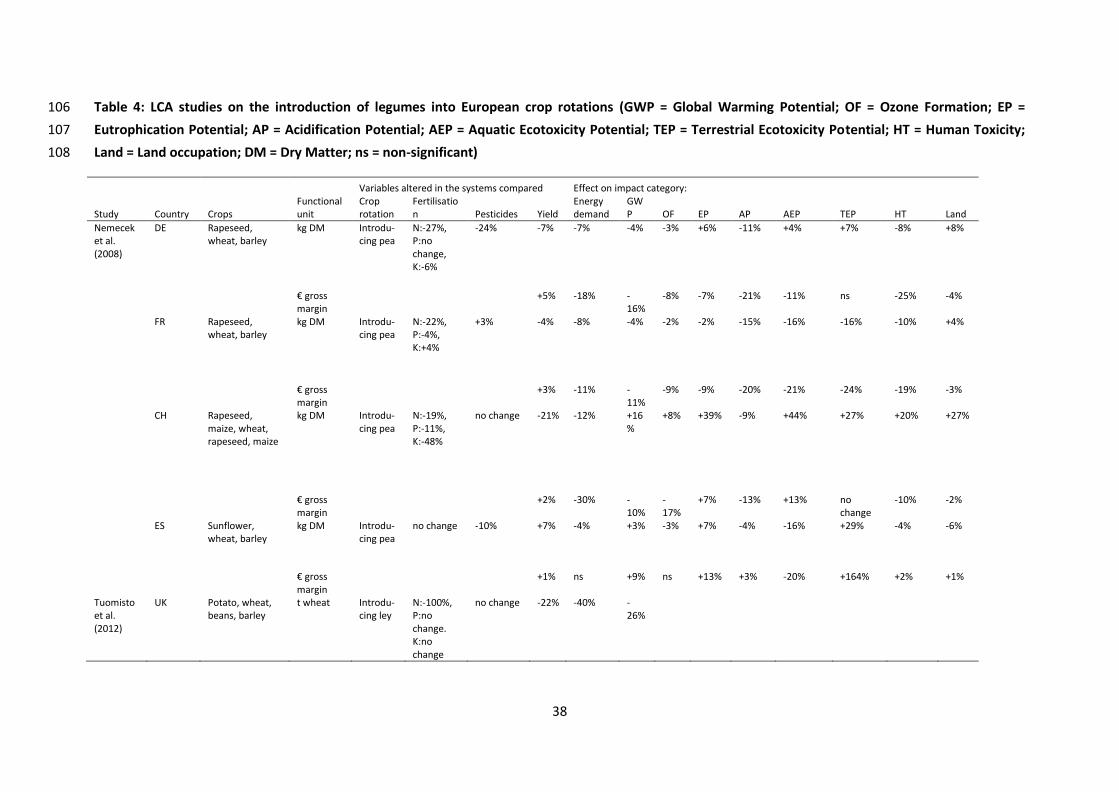
et al. (2008) quantified the effects of introducing peas into several crop rotations across Europe. 80
Experiments in Germany and France showed a reduction in environmental impacts for most of the 81
impact categories considered, due to the replacement of nitrogen fertilisers. The gross margin was 82
also higher with grain legumes, despite the slightly lower grain yield which made these reductions 83
even greater when quantified per financial FU. By contrast, the experiment showed an increase in 84
GWP, eutrophication potential, terrestrial ecotoxicity, human toxicity, and land use per unit of 85
harvested dry matter. This was because of the combined effect of lower physical yield from 86
introduced crops and increased nitrate leaching. Nevertheless, most of the impact categories showed 87
net reductions when quantified per unit of gross margin, owing to the higher financial yield. In a 88
cropping system used in Spain, grain legumes were introduced into low-input crop rotation with 89
sunflower. This led to increases in most of the environmental impacts considered, since no mineral 90
fertiliser was replaced in the process. In one of the modelled scenarios, Tuomisto et al., (2012a) 91
demonstrated that replacing all mineral fertiliser by leys in conventional crop rotation in the UK 92
would reduce energy demand by 40% and GWP by 26%, despite the reduction in absolute grain yield. 93
As previously mentioned, the ability of leguminous crops to fix nitrogen is not the only 94
benefit of growing crops in rotation. Numerous experiments have shown that soybean yields are 95
37
increased when this crop is grown in rotation with non-leguminous crops (Chen et al., 2001, 96
Crookston et al., 1991, Howard et al., 1998, Long and Todd, 2001, West et al., 1996). Changing from 97
soybean to another crop breaks the lifecycle of soybean cyst nematodes. Crop rotation was also 98
shown to suppress ‘take-all’, a major disease of wheat caused by the pathogen Gaeumannomyces 99
graminis var tritici (Kirkegaard et al., 2008) and responsible for losses in temperate climates. Some 100
wheat pathogens such as Rhizoctonia solani, however, have a wide host range (Cook et al., 2002), 101
and not all other crops will be effective in suppressing them. There are also pathogens such as 102
Bipolaris sorokiniana that require several years without the host plant to be effective (Kirkegaard et 103
al., 2008). 104
105
38
Table 4: LCA studies on the introduction of legumes into European crop rotations (GWP = Global Warming Potential; OF = Ozone Formation; EP = 106
Eutrophication Potential; AP = Acidification Potential; AEP = Aquatic Ecotoxicity Potential; TEP = Terrestrial Ecotoxicity Potential; HT = Human Toxicity; 107
Land = Land occupation; DM = Dry Matter; ns = non-significant) 108
Variables altered in the systems compared Effect on impact category:
Study Country Crops Functional unit
Crop rotation
Fertilisation Pesticides Yield
Energy demand
GWP OF EP AP AEP TEP HT Land
Nemecek et al. (2008)
DE Rapeseed, wheat, barley
kg DM Introdu-cing pea
N:-27%, P:no change, K:-6%
-24% -7% -7% -4% -3% +6% -11% +4% +7% -8% +8%
€ gross margin
+5% -18% -16%
-8% -7% -21% -11% ns -25% -4%
FR Rapeseed, wheat, barley
kg DM Introdu-cing pea
N:-22%, P:-4%, K:+4%
+3% -4% -8% -4% -2% -2% -15% -16% -16% -10% +4%
€ gross margin
+3% -11% -11%
-9% -9% -20% -21% -24% -19% -3%
CH Rapeseed, maize, wheat, rapeseed, maize
kg DM Introdu-cing pea
N:-19%, P:-11%, K:-48%
no change -21% -12% +16%
+8% +39% -9% +44% +27% +20% +27%
€ gross margin
+2% -30% -10%
-17%
+7% -13% +13% no change
-10% -2%
ES Sunflower, wheat, barley
kg DM Introdu-cing pea
no change -10% +7% -4% +3% -3% +7% -4% -16% +29% -4% -6%
€ gross margin
+1% ns +9% ns +13% +3% -20% +164% +2% +1%
Tuomisto et al. (2012)
UK Potato, wheat, beans, barley
t wheat Introdu-cing ley
N:-100%, P:no change. K:no change
no change -22% -40% -26%
39
4.3 Intercropping 109
The practice of growing multiple crops in space at the same time is known as intercropping 110
(Vandermeer, 1989, Whitmore and Schröder, 2007). The hypothesis is that when grown together, 111
certain plant species can use resources complementarily and more efficiently despite the 112
competition for space, some of the nutrients, light or water. This efficiency can be measured by the 113
Land Equivalent Ratio (LER) indicator, which is defined as the relative area needed to achieve the 114
same yield as in intercropping when growing two crops separately under the same conditions. The 115
LER value over 1 suggests that there is a benefit from mixing. The intercropping of cereals with 116
legumes is the most common combination in Europe, with legumes being sown at the same time or 117
just before cereals. Numerous field experiments have confirmed the positive effects of such 118
interactions (Picard et al., 2010, Carof et al., 2007, Hauggaard-Nielsen et al., 2006, Pelzer et al., 2012, 119
Hauggaard-Nielsen et al., 2009). According to (Andersen et al., 2004), intercropping peas with canola 120
(rapeseed) produces greater productivity gains than for most common barley/pea mixtures. 121
Silvoarable agroforestry systems present another form of intercropping, where strips of 122
widely spaced trees are incorporated into arable land (Graves et al., 2011). In the past, this type of 123
farming was widely practised in Europe, with trees diversifying the farmer’s income with fruits, 124
fodder and wood, preventing wind and water erosion, and providing shade for farm workers and 125
livestock (Eichhorn et al., 2006). The most common silvoarable cropping systems in Europe are arable 126
crops grown together with poplars (Populus sp.) or willows (Salix sp.) for biomass production 127
(Dupraz, 1998, Graves et al., 2010). These systems were shown to provide better land-use efficiency 128
ratios than cereals or trees grown as the sole crops (Grünewald et al., 2007). An important limitation 129
of agroforestry systems of particular relevance to low-input farming is the risk of negative nutrient 130
balance. Poplars and willows produce a great deal of biomass, which is then exported from the 131
system together with all the embodied nutrients. The problem of nitrogen abundance may be 132
addressed by cultivating leguminous trees, also referred to as Nitrogen Fixing Trees (NFT’s) (Sanchez 133
40
et al., 1997). Research on NFT’s in agroforestry has mostly been conducted in humid/sub-humid or 134
arid/semi-arid areas (Danso et al., 1992). In Africa, trees such as Gliricidia, Sesbania and Tephrosia 135
have been successfully used to improve maize yields by bringing in nitrogen (Akinnifesi et al., 2010, 136
Ndufa et al., 2009). Used to restore degraded land, the black locust tree Robinia pseudoacacia L. has 137
proven to grow well in Europe on contaminated post-mining sites, outperforming the most popular 138
poplars and willows in terms of biomass production (Grünewald et al., 2009, Grünewald et al., 2007). 139
Although NFT’s could be effective in nitrogen-deficient cropping systems, they will not solve the 140
problem of phosphorus and potassium deficiencies. 141
Although not a form of intercropping per se, cultivar mixtures are another way to improve 142
land-use efficiency by growing a variety of plants in the same space. Mixed cultivars of crops can 143
provide higher yields than pure stands, as was confirmed in a meta-analysis by Kiaer et al (2009). As 144
with crop rotation, however, mixing will not always yield positive results. The meta-analysis showed 145
the range of effects between -30% to +100%, depending on the growing period and the species 146
mixed. Functionally chosen cultivar mixtures can be used to control common diseases such as 147
powdery mildews and rusts (Mundt, 2002), but special care must be taken to choose the right 148
varieties and sowing densities. 149
To date, the applications of LCA to intercropping systems are rare. Table 5 shows the results 150
of a one-year experiment with wheat and pea intercropping in France. Growing the two crops 151
together produced reductions in environmental impacts per tonne of wheat ranging from 15% in the 152
case of eutrophication to 60% for GWP, despite the increased energy requirements for grain 153
separation. One interesting result was the greater reduction under the ‘zero nitrogen fertilisation’ 154
conditions, presumably due to the greater effectiveness of biological nitrogen fixation. The study, 155
however, was based on a one-year experiment, and crop yield under zero-fertilisation conditions 156
would most likely decrease over time, offsetting some or all of the environmental improvement. 157
158
159
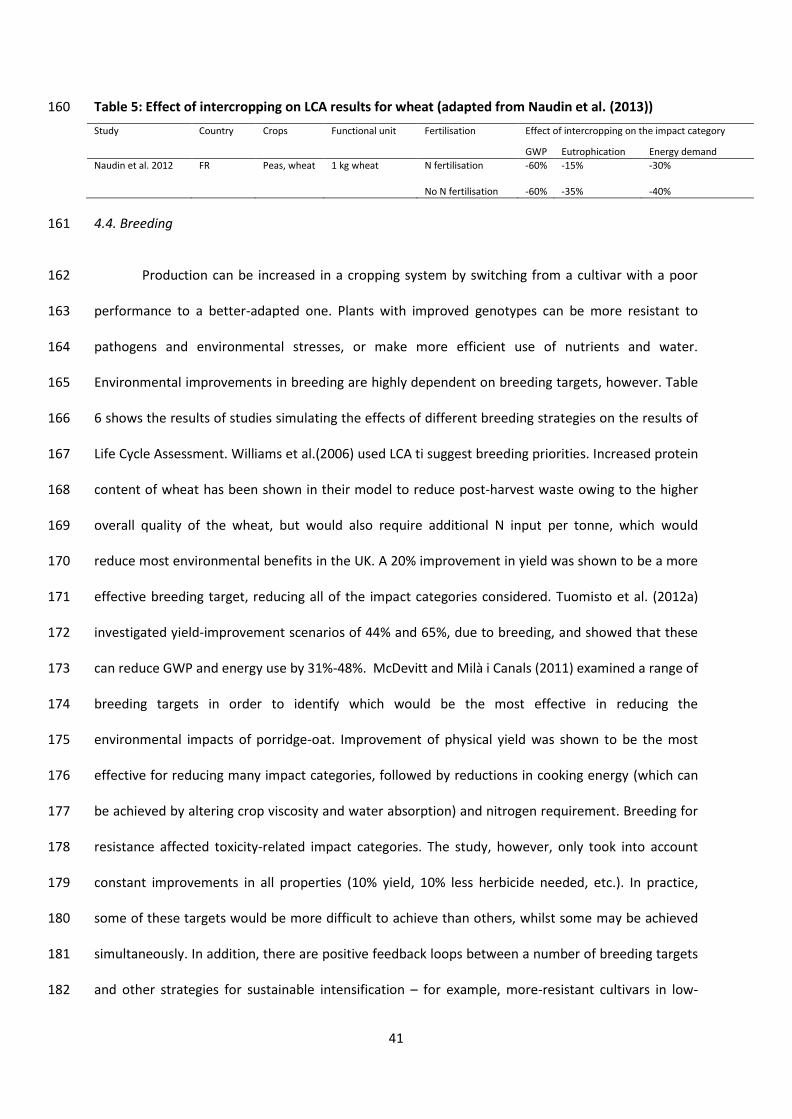
41
Table 5: Effect of intercropping on LCA results for wheat (adapted from Naudin et al. (2013)) 160
Study Country Crops Functional unit Fertilisation Effect of intercropping on the impact category
GWP Eutrophication Energy demand
Naudin et al. 2012
FR Peas, wheat 1 kg wheat N fertilisation -60% -15% -30%
No N fertilisation -60% -35% -40%
4.4. Breeding 161
Production can be increased in a cropping system by switching from a cultivar with a poor 162
performance to a better-adapted one. Plants with improved genotypes can be more resistant to 163
pathogens and environmental stresses, or make more efficient use of nutrients and water. 164
Environmental improvements in breeding are highly dependent on breeding targets, however. Table 165
6 shows the results of studies simulating the effects of different breeding strategies on the results of 166
Life Cycle Assessment. Williams et al.(2006) used LCA ti suggest breeding priorities. Increased protein 167
content of wheat has been shown in their model to reduce post-harvest waste owing to the higher 168
overall quality of the wheat, but would also require additional N input per tonne, which would 169
reduce most environmental benefits in the UK. A 20% improvement in yield was shown to be a more 170
effective breeding target, reducing all of the impact categories considered. Tuomisto et al. (2012a) 171
investigated yield-improvement scenarios of 44% and 65%, due to breeding, and showed that these 172
can reduce GWP and energy use by 31%-48%. McDevitt and Milà i Canals (2011) examined a range of 173
breeding targets in order to identify which would be the most effective in reducing the 174
environmental impacts of porridge-oat. Improvement of physical yield was shown to be the most 175
effective for reducing many impact categories, followed by reductions in cooking energy (which can 176
be achieved by altering crop viscosity and water absorption) and nitrogen requirement. Breeding for 177
resistance affected toxicity-related impact categories. The study, however, only took into account 178
constant improvements in all properties (10% yield, 10% less herbicide needed, etc.). In practice, 179
some of these targets would be more difficult to achieve than others, whilst some may be achieved 180
simultaneously. In addition, there are positive feedback loops between a number of breeding targets 181
and other strategies for sustainable intensification – for example, more-resistant cultivars in low-182
42
input systems would bring about improved yields, and might enable the adoption of more-resource-183
efficient techniques such as no-tillage. 184
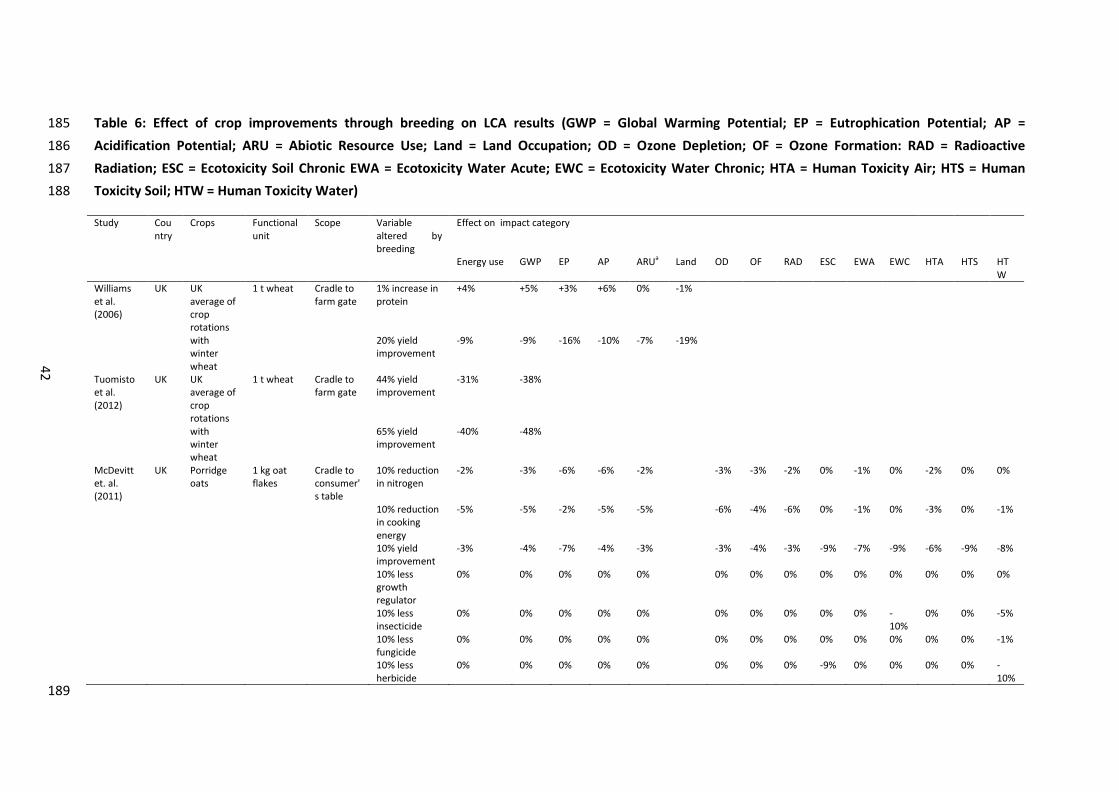
43
Table 6: Effect of crop improvements through breeding on LCA results (GWP = Global Warming Potential; EP = Eutrophication Potential; AP = 185
Acidification Potential; ARU = Abiotic Resource Use; Land = Land Occupation; OD = Ozone Depletion; OF = Ozone Formation: RAD = Radioactive 186
Radiation; ESC = Ecotoxicity Soil Chronic EWA = Ecotoxicity Water Acute; EWC = Ecotoxicity Water Chronic; HTA = Human Toxicity Air; HTS = Human 187
Toxicity Soil; HTW = Human Toxicity Water) 188
Study Country
Crops Functional unit
Scope Variable altered by breeding
Effect on impact category
Energy use GWP EP AP ARUa Land OD OF RAD ESC EWA EWC HTA HTS HTW
Williams et al. (2006)
UK UK average of crop rotations with winter wheat
1 t wheat Cradle to farm gate
1% increase in protein
+4% +5% +3% +6% 0% -1%
20% yield improvement
-9% -9% -16% -10% -7% -19%
Tuomisto et al. (2012)
UK UK average of crop rotations with winter wheat
1 t wheat Cradle to farm gate
44% yield improvement
-31% -38%
65% yield improvement
-40% -48%
McDevitt et. al. (2011)
UK Porridge oats
1 kg oat flakes
Cradle to consumer's table
10% reduction in nitrogen
-2% -3% -6% -6% -2% -3% -3% -2% 0% -1% 0% -2% 0% 0%
10% reduction in cooking energy
-5% -5% -2% -5% -5% -6% -4% -6% 0% -1% 0% -3% 0% -1%
10% yield improvement
-3% -4% -7% -4% -3% -3% -4% -3% -9% -7% -9% -6% -9% -8%
10% less growth regulator
0% 0% 0% 0% 0% 0% 0% 0% 0% 0% 0% 0% 0% 0%
10% less insecticide
0% 0% 0% 0% 0% 0% 0% 0% 0% 0% -10%
0% 0% -5%
10% less fungicide
0% 0% 0% 0% 0% 0% 0% 0% 0% 0% 0% 0% 0% -1%
10% less herbicide
0% 0% 0% 0% 0% 0% 0% 0% -9% 0% 0% 0% 0% -10%
189
42
44
Although the importance of breeding for sustainable intensification is well recognised (FAO,
2011, Royal Society, 2009, HM Government, 2011), just which varieties should be used in low-input
farming systems with their increased stress levels is the subject of debate. Since modern cultivars
were selected under the rich supply of inputs – mineral fertilisers, pesticides and irrigation water –
some scientists argue that these might not be optimal for low-input systems (van Bueren et al.,
2011). This is supported by the argument that the traits of particular relevance to stressful
environments – disease resistance and nitrogen, phosphorus and water-use efficiencies – can be
overlooked during the conventional breeding process under high-input conditions, where most
limiting factors are eliminated (Phillips and Wolfe, 2005, Ceccarelli, 1994, Ceccarelli et al., 1992, Fess
et al., 2011). Others question this hypothesis, claiming that varieties developed under optimal
growing conditions will also most likely be the best performers in stressed environments (Guarda et
al., 2004, Tester and Langridge, 2010), so that special selection under conditions of reduced
fertilisation is unnecessary. To provide the answer to this question, a number of special breeding
programmes have recently been launched for organic and low-input agriculture. Using modern
breeding techniques such as marker-assisted selection, useful traits can be introduced into modern
cultivars from old varieties, from similar species, or – with the use of genetic engineering – from a
wide range of other organisms, including non-plants. Currently, glyphosate resistance is the most
widespread trait introduced by genetic engineering. These varieties are of no use under low-input
conditions, where pesticides are absent. However, insect-resistant crops – developed by engineering
the protein of Bacillus thuringiensis bacteria into plants – were shown to improve yields and
potentially provide environmental benefits by reducing the need for insecticides (Kooistra et al.,
2006, Park et al., 2011, Sanahuja et al., 2011). Since increased pest pressure is one of the key limiting
factors in low-input farming systems, these crops can be of high interest in the future.
4.5. Recycling biomass
45
Nutrients in plant residues, manures and other organic materials can be recycled either via
direct incorporation into the soil, or via the composting process and the application of decomposed
organic matter onto fields. European low-input farmers frequently produce and apply composts
made of on-farm materials, such as woodchips, bark, manure, straw, crop residues and surplus grass
(Leroy, 2008). The application of nitrogen in the form of manure or compost will be characterised by
lower energy use per kg of N applied than mineral fertiliser, but sometimes higher eutrophication
and acidification due to the higher risk of ammonia leaching (Tuomisto et al., 2012b). Although on-
farm composts can be very effective in supplying nutrients, improving soil quality and increasing
yields (D'Hose et al., 2012), they have their limitations. Soluble nutrient content may be relatively
low, depending on substrate composition, composting techniques chosen, and the length of the
composting process. During decomposition there will also be some nutrient leaching, as well as
emissions of nitrous oxide and methane, both of which are potent greenhouse gases. Instead of
being directly incorporated or composted, harvest residues and manures can be used as a feedstock
for biogas production, with the remaining digestate spread onto the fields as a fertiliser. The
fertilising value of digestate is dependent upon the feedstock used, but the digestate is generally
characterised by higher ammonia content, higher pH and lower C:N ratio than the substrate (Möller
and Müller, 2012).
Table 7 provides a review of LCA studies concerning the agricultural use of spent digestate.
Anaerobic digestion technology has primarily been researched as an option for managing organic
waste or producing energy, as is clearly reflected in the choice of functional units for these studies
(Tables 7 and 8). Kong et al. (2012) compared four organic-waste-treatment scenarios with LCA in
California. All systems analysed provided negative emission balances, and AD was shown to result in
a greater reduction of greenhouse-gas emissions than composting, but a lower reduction than landfill
with gas collection. Demonstrated reductions were due to the replacement of energy from fossil
fuels, but also to assumed carbon-sequestration effects from applying organic nutrients to soils, for
which solid evidence is currently lacking (Leifeld, 2013). By contrast, no account was taken of
46
potentially avoided emissions owing to the replacement of other fertilisers, or emissions arising from
other uses of organic waste. Poeschl et al. (2012) compared the environmental impacts of various AD
feedstocks in Germany. In their study, credits were given for replacing electricity from fossil fuels, as
well as for replacing mineral fertilisers that would otherwise be applied to the fields. Negative
greenhouse-gas emission balances were found for all options except grass silage and whole wheat-
plant silage, and considerable differences in achievable reductions were spotted between different
feedstocks. Despite the need for sterilisation, substrates produced from industry waste were shown
to be the most effective in reducing greenhouse-gas emissions, followed by straw, corn silage and
cattle manure. Corn silage, however, has been shown to cause major land-use-related impacts, since
the crop is cultivated purely for bioenergy production (Poeschl et al., 2012). Lansche and Müller
(2012) pointed out that using cattle manure for anaerobic digestion prevents emissions from the on-
farm storage of manure. However, fertilisers are not replaced as in the case of corn or grass silage,
since the nutrients from the manure would in any case be applied to the fields. Under such
assumptions, cattle manure was still shown to provide the highest reduction in GHG emissions,
owing to the avoidance of storage emissions. The study also showed that unlike corn or grass silage,
pure cattle manure can provide negative eutrophication and acidification balances (Lansche and
Müller, 2012). Tuomisto et al. (2012a) investigated the effect of switching from mineral fertilisers to
the application of spent digestate from food waste as one of the scenarios for wheat-crop rotation in
the UK. Yielding a 54% reduction in energy demand and a 64% reduction in GWP per tonne of
harvested wheat, this option was the most effective in reducing environmental impacts out of all
investigated scenarios.
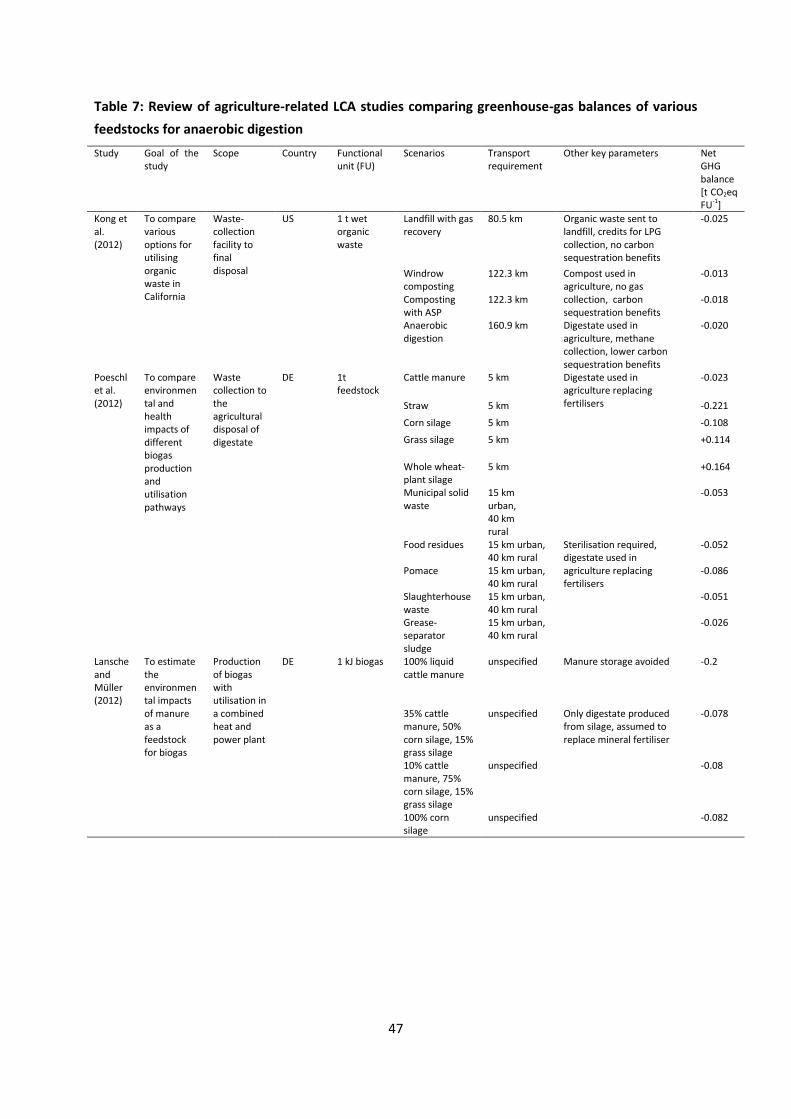
47
Table 7: Review of agriculture-related LCA studies comparing greenhouse-gas balances of various
feedstocks for anaerobic digestion
Study Goal of the study
Scope Country Functional unit (FU)
Scenarios Transport requirement
Other key parameters Net GHG balance [t CO2eq FU-1]
Kong et al. (2012)
To compare various options for utilising organic waste in California
Waste- collection facility to final disposal
US 1 t wet organic waste
Landfill with gas recovery
80.5 km Organic waste sent to landfill, credits for LPG collection, no carbon sequestration benefits
-0.025
Windrow composting
122.3 km Compost used in agriculture, no gas collection, carbon sequestration benefits
-0.013
Composting with ASP
122.3 km -0.018
Anaerobic digestion
160.9 km Digestate used in agriculture, methane collection, lower carbon sequestration benefits
-0.020
Poeschl et al. (2012)
To compare environmental and health impacts of different biogas production and utilisation pathways
Waste collection to the agricultural disposal of digestate
DE 1t feedstock
Cattle manure 5 km Digestate used in agriculture replacing fertilisers
-0.023
Straw 5 km -0.221
Corn silage 5 km -0.108
Grass silage 5 km +0.114
Whole wheat-plant silage
5 km +0.164
Municipal solid waste
15 km urban, 40 km rural
-0.053
Food residues 15 km urban, 40 km rural
Sterilisation required, digestate used in agriculture replacing fertilisers
-0.052
Pomace 15 km urban, 40 km rural
-0.086
Slaughterhouse waste
15 km urban, 40 km rural
-0.051
Grease-separator sludge
15 km urban, 40 km rural
-0.026
Lansche and Müller (2012)
To estimate the environmental impacts of manure as a feedstock for biogas
Production of biogas with utilisation in a combined heat and power plant
DE
1 kJ biogas
100% liquid cattle manure
unspecified Manure storage avoided -0.2
35% cattle manure, 50% corn silage, 15% grass silage
unspecified Only digestate produced from silage, assumed to replace mineral fertiliser
-0.078
10% cattle manure, 75% corn silage, 15% grass silage
unspecified -0.08
100% corn silage
unspecified -0.082
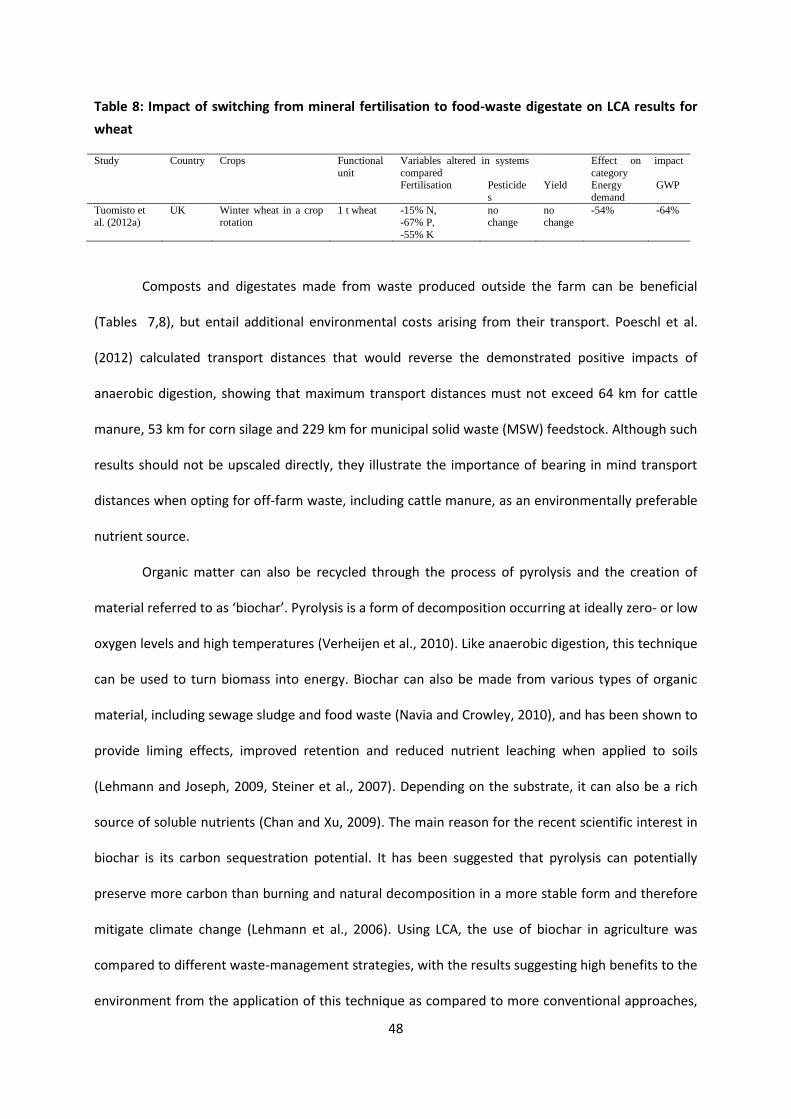
48
Table 8: Impact of switching from mineral fertilisation to food-waste digestate on LCA results for
wheat
Study Country Crops Functional
unit
Variables altered in systems
compared
Effect on impact
category Fertilisation Pesticide
s
Yield Energy
demand
GWP
Tuomisto et al. (2012a)
UK Winter wheat in a crop rotation
1 t wheat -15% N, -67% P,
-55% K
no change
no change
-54% -64%
Composts and digestates made from waste produced outside the farm can be beneficial
(Tables 7,8), but entail additional environmental costs arising from their transport. Poeschl et al.
(2012) calculated transport distances that would reverse the demonstrated positive impacts of
anaerobic digestion, showing that maximum transport distances must not exceed 64 km for cattle
manure, 53 km for corn silage and 229 km for municipal solid waste (MSW) feedstock. Although such
results should not be upscaled directly, they illustrate the importance of bearing in mind transport
distances when opting for off-farm waste, including cattle manure, as an environmentally preferable
nutrient source.
Organic matter can also be recycled through the process of pyrolysis and the creation of
material referred to as ‘biochar’. Pyrolysis is a form of decomposition occurring at ideally zero- or low
oxygen levels and high temperatures (Verheijen et al., 2010). Like anaerobic digestion, this technique
can be used to turn biomass into energy. Biochar can also be made from various types of organic
material, including sewage sludge and food waste (Navia and Crowley, 2010), and has been shown to
provide liming effects, improved retention and reduced nutrient leaching when applied to soils
(Lehmann and Joseph, 2009, Steiner et al., 2007). Depending on the substrate, it can also be a rich
source of soluble nutrients (Chan and Xu, 2009). The main reason for the recent scientific interest in
biochar is its carbon sequestration potential. It has been suggested that pyrolysis can potentially
preserve more carbon than burning and natural decomposition in a more stable form and therefore
mitigate climate change (Lehmann et al., 2006). Using LCA, the use of biochar in agriculture was
compared to different waste-management strategies, with the results suggesting high benefits to the
environment from the application of this technique as compared to more conventional approaches,
49
owing to the displacement of electricity from fossil fuels and the assumed carbon storage (Roberts et
al., 2009, Ibarrola et al., 2012). Carbon sequestration benefits have not yet been confirmed in any
long-term experiments, however. More evidence is therefore needed before such assumptions on
carbon sequestration should be made in agricultural LCA.
6. Conclusions
Reducing farm-external inputs may lead to either an improvement or diminishing of eco-
efficiency, depending on the crop, its yields, initial level of inputs, and environmental impacts
considered. Since wheat is a nitrogen-demanding crop, its ratio of N fertilisation to eco-efficiency
presents an illustrative example. For energy use, it tends to follow a U-shaped curve. This means an
optimum fertilisation level can be identified above and below which the environmental impact per
product unit will increase. For GWP, increased environmental impacts will most likely be observed
with increased fertilisation. At low fertilisation levels, however, increased N input leads to relatively
low increases in GWP, and relatively high increases in productivity. This relationship changes at
higher fertilisation levels, where additional N input causes substantial increases in greenhouse-gas
emissions. Nutrient-related environmental impacts highly depend on the type of fertiliser used.
Organic fertilisers have higher eutrophication potential under the same level of N than synthetic
ones. Eco-efficiency can be influenced by swapping out crops and a number of other changes at the
cropping-system design stage. Increasing and reducing external inputs presents only one of the
available options.
The main weakness of low-input farming systems is their lower land-use efficiency. Reduced
inputs lead to reduced physical yields in nearly all cases. This does not necessarily equate with a
diminishing of eco-efficiency, since the overall economic value of outputs can be increased by
cultivating crops with higher value. Nevertheless, the performance of LICSs can be improved for all
impact categories if physical yield per unit of land can be increased without corresponding increases
50
in the environmental impacts. Such ‘sustainable intensification’ in a cropping-system level can be
achieved through a number of agronomic interventions.
Intercropping, variety mixtures and crop rotations are examples of strategies that utilise
positive interactions between diverse plants to improve eco-efficiency. However, the design and
maintenance of diverse, eco-efficient cropping systems is a knowledge-intensive endeavour. To
ensure complementarity, species and their varieties must to be carefully chosen according to their
functionality. The right balance between productivity and resistance needs to be maintained to
maximise input-use efficiency. Productivity can also be affected by sowing density and choice of
cultivars. Diverse but poorly designed cropping systems are likely to suffer from worse eco-efficiency
than homogenous structures.
Although eco-efficiency can be improved by using better-adapted cultivars, the effectiveness
of this strategy is highly dependent upon the traits that were among the breeding objectives. There is
a trade-off between productivity and resistance, but efforts should not be focused on improving just
one of these characteristics. In low-input systems, they are both highly relevant to eco-efficiency.
The choice of inputs applied to the cropping system is more important than whether said
inputs were produced on- or off-farm, but transport of inputs can also play a role. Eco-efficient
cropping systems should strive to recycle nutrients produced on-farm, such as manure and harvest
residues, as well as those produced in the surrounding production systems, such as livestock
production, households and the food industry. The regional availability of these nutrients will vary
and can determine the choice of input. Anaerobic digestion improves the eco-efficiency of nutrient
recycling as compared to composting and direct application by eliminating some of the methane and
nitrous oxide emissions caused by storing biomass in the open air, and by generating useful
electricity and heat.
More research is needed to increase our understanding of the trade-offs between
environmental impacts and productivity in LICSs, and of the strategies for improving the eco-
efficiency of these systems. LCA studies on intercropping, agroforestry systems and various designs
51
of crop rotations should be conducted to advance the state of knowledge on strategies for improving
yields without increasing environmental impacts. More research is needed on the trade-offs between
different breeding objectives, as well as on the effects of new seeds on LCA results. Anaerobic
digestion deserves more attention from researchers and policymakers in terms of its potential for
recycling biomass and improving crop yields, rather than just as an option to utilise organic waste.
Biochar appears to be a promising solution for improving eco-efficiency in agriculture, but a long-
term experiment is needed to confirm its carbon sequestration benefits.

52
53
CHAPTER 2.
LIFE CYCLE ASSESSMENT OF SEVERAL ALTERNATIVE BREAD SUPPLY
CHAINS IN EUROPE.
This chapter is an adapted version of the following publication:
KULAK, M., NEMECEK, T., FROSSARD, E, CHABLE, V. & GAILLARD, G. 2014. Life Cycle Assessment of
Alternative Bread Supply Chains in Europe. (undergoing the peer-review).
54
1. Introduction
Scientists are divided over several contrasting perspectives on how to mitigate negative
environmental impacts of agriculture and to achieve sustainable food security (Garnett, 2013,
Garnett and Godfray, 2012). One particular vision entails that the current “industrial” food-system
model predominating in high-income countries is based on an excessively high level of inputs, and
that this must shift to a more self-sufficient structure resembling a natural ecosystem in its
complexity and diversity (Pretty, 1995). The term ‘agro-ecology’ is used to describe the science at the
interface of agriculture and ecology (Altieri, 1995) using “ecosystem approach” as a guiding paradigm
for designing agricultural systems (Thrupp, 1998). Although exact procedures and techniques are not
clearly defined, high levels of plant diversity (Ratnadass et al., 2012) and genetic diversity (Altieri,
2004) are seen as important parts of the system. The use of farm-external inputs, especially mineral
fertilisers and pesticides, is discouraged. The approach stresses the importance of conserving
landraces, local breeds of domestic animals, indigenous plants and traditional knowledge (Altieri,
2004).
In Italy, recent years have seen a growing demand for products made from ancient varieties,
landraces or even wheat ancestors, such as emmer (T. dicoccum) and spelt (T spelta) (Guarda et al.,
2004, Piergiovanni, 2013). Landraces are plant populations possessing distinctive properties, but
generally lacking formal breeding improvements (Villa et al., 2005), i.e. the type of plant material
dominating agricultural production before the 20th century. In France, there are currently 69 active
associations of farmers cultivating landraces under low-input fertilisation regimes (Réseau Semences
Paysannes, 2012). To reduce the use of external inputs, some farmers go as far as to using draught
animals for field operations (PROMMATA, 2013). Maintaining genetic heterogeneity in the fields is
seen as an important element of the cropping system (Réseau Semences Paysannes, 2012). Due to
this heterogeneity, products may fail to comply with the quality standards of modern processing
industries. Many farmers process the grain themselves and distribute products directly to end
consumers. The term ‘alternative food network’ describes a network of producers, consumers and
55
other actors that emerge as a result of consumer demand for alternatives to the standardised stock
of products available in modern supermarkets (Renting et al., 2003). A dedicated term, paysan-
boulanger (French for ‘farmer-baker’) was coined in France for a type of entrepreneur involved in
both farming and bread production (Demeulenaere and Bonneuil, 2010). Consumers can purchase
the paysan-boulanger’s products either directly on the farm, or at dedicated shops and food
cooperatives.
Although a number of LCA studies to date have dealt with the production and supply of
bread (Andersson and Ohlsson, 1999, Bimpeh et al., 2006, Braschkat et al., 2003, Espinoza-Orias et
al., 2011, van Geerken et al., 2006, Korsaeth et al., 2012, Meisterling et al., 2009, Moudry et al., 2013,
Nielsen and Nielsen, 2003b, Prem et al., 2007), it remains unclear whether the introduction of
alternative bread supply chains based on traditional LICS causes reductions or increases in
environmental impacts from food, or what aspects of such production can be beneficial from an
environmental perspective. Historical developments in bread supply chains were studied with LCA by
van Geerken et al. (2006), who showed that photochemical oxidation and GWP per kg of bread have
decreased over the last 200 years in Belgium. This is because brushwood and coal were used
intensively in 19th century ovens, and wheat was transported on coal-powered ships. By contrast,
acidification and eutrophication potentials were shown to have increased over time as a result of the
increased use of water-soluble mineral fertilisers in modern agriculture. The environmental impacts
from agricultural mechanisation are also a matter of controversy. Spugnoli and Dainelli, (2013)
suggested that the switch from mechanical traction to animal draught power in a developed country
increases the primary energy consumption and the global warming potential per unit of cultivated
area. Cerutti et al. (2014) demonstrated the benefits of animal labour, thus arriving at the opposite
conclusion. Most studies comparing organic and conventional wheat production confirm the lower
GWP and energy use of the former over the latter (Chapter 1). This would lower these environmental
impacts for bread if variables other than the origin of wheat were kept constant. In spite of all this,
industrial processing was shown to be preferable over local bakeries and the domestic bread-making
56
(Bimpeh et al., 2006; Braschkat et al., 2003). Andersson and Ohlsson (1999) also showed that there is
a tipping point above which increased distances in bread supply chains outweigh the benefits from
economies of scale.
The aim of the study described in this chapter was to determine whether the introduction of
alternative bread supply chains – based on LICSs, on-farm processing and direct distribution can
reduce environmental impacts of food. Four cases of alternative commercial bread supply chains
were studied. Cases were selected to cover two different European climatic zones (Temperate
Oceanic and Mediterranean), as well as two contrasting production scales (farms of fewer than 10 ha
and more than 70 ha). Environmental impacts over the entire value chain were quantified via LCA
and compared to standard references (bread from industrial bakeries as distributed through
supermarkets in the countries in question). In two cases, wheat production in the standard
references was modelled on the average practices of farmers in the regions of Béauce, France and
Castilla y Léon, Spain. Primary data were also collected from a high-input organic producer in
Northern Portugal.
2. Methodology
LCA follows a procedure consisting of four interrelated stages: (i) Goal and scope definition;( ii) Life-
cycle inventory (LCI); ( iii) Life-cycle impact assessment (LCIA); and (iv) interpretation (ISO, 2006a,
ISO, 2006b)
2.1. Goal and scope definition
Alternative food networks provide consumers with an alternative to the standard range of products
available in the supermarket. The two variants will differ in their composition, leading to differences
in perceived organoleptic and aesthetic qualities. We assumed that this difference is one of the main
factors driving the consumer’s decision to buy alternative products. Choosing to purchase bread from
the farmer will induce a number of changes in the environmental footprint of the consumer’s diet. In
order to address the goal of the study, we need to know whether the balance of these changes for
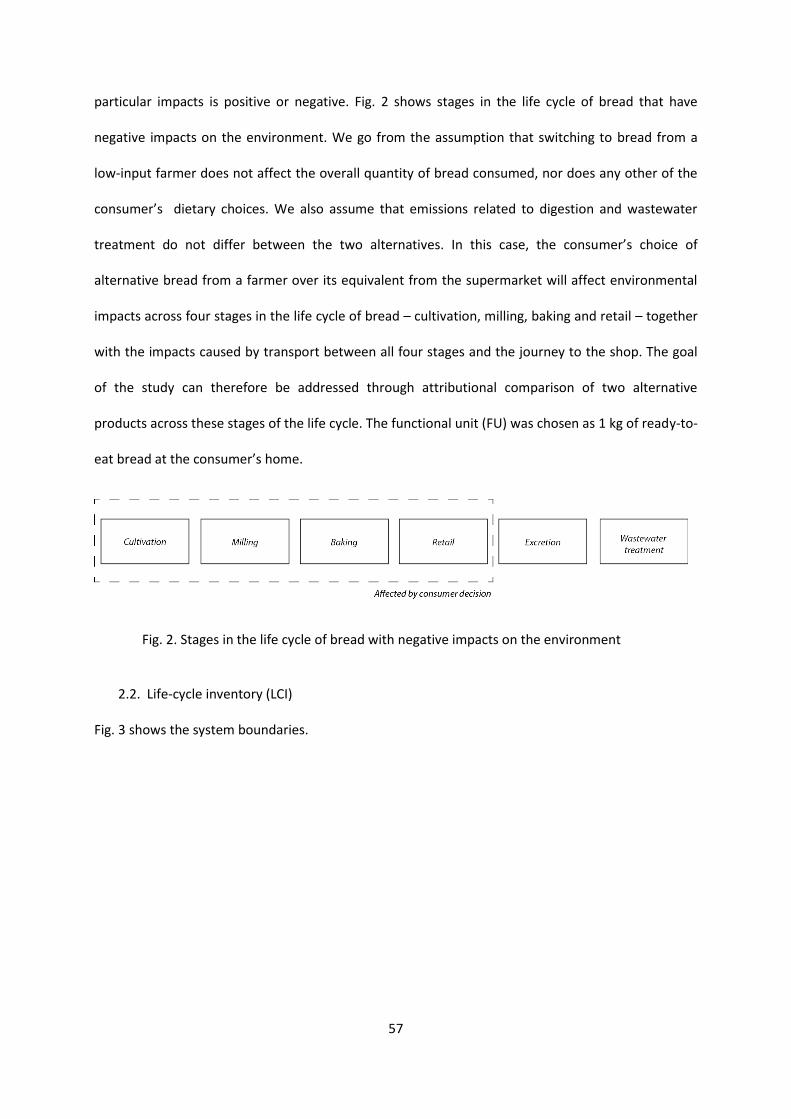
57
particular impacts is positive or negative. Fig. 2 shows stages in the life cycle of bread that have
negative impacts on the environment. We go from the assumption that switching to bread from a
low-input farmer does not affect the overall quantity of bread consumed, nor does any other of the
consumer’s dietary choices. We also assume that emissions related to digestion and wastewater
treatment do not differ between the two alternatives. In this case, the consumer’s choice of
alternative bread from a farmer over its equivalent from the supermarket will affect environmental
impacts across four stages in the life cycle of bread – cultivation, milling, baking and retail – together
with the impacts caused by transport between all four stages and the journey to the shop. The goal
of the study can therefore be addressed through attributional comparison of two alternative
products across these stages of the life cycle. The functional unit (FU) was chosen as 1 kg of ready-to-
eat bread at the consumer’s home.
Fig. 2. Stages in the life cycle of bread with negative impacts on the environment
2.2. Life-cycle inventory (LCI)
Fig. 3 shows the system boundaries.
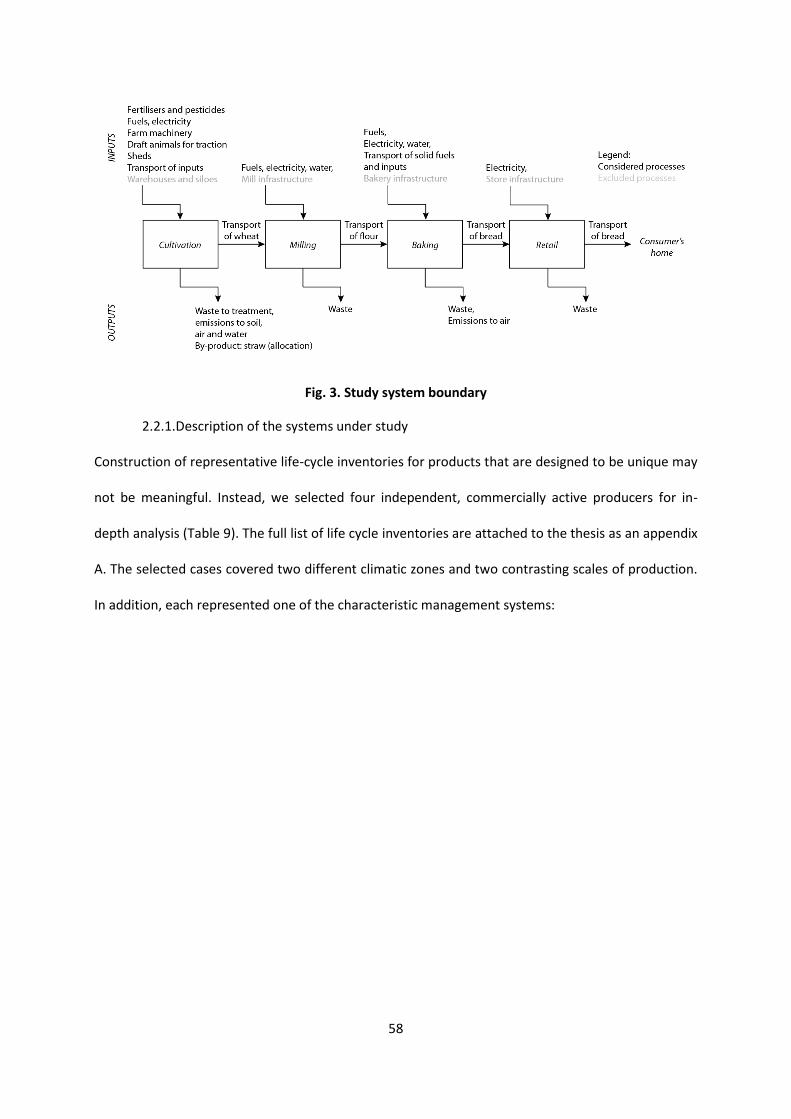
58
Fig. 3. Study system boundary
2.2.1. Description of the systems under study
Construction of representative life-cycle inventories for products that are designed to be unique may
not be meaningful. Instead, we selected four independent, commercially active producers for in-
depth analysis (Table 9). The full list of life cycle inventories are attached to the thesis as an appendix
A. The selected cases covered two different climatic zones and two contrasting scales of production.
In addition, each represented one of the characteristic management systems:
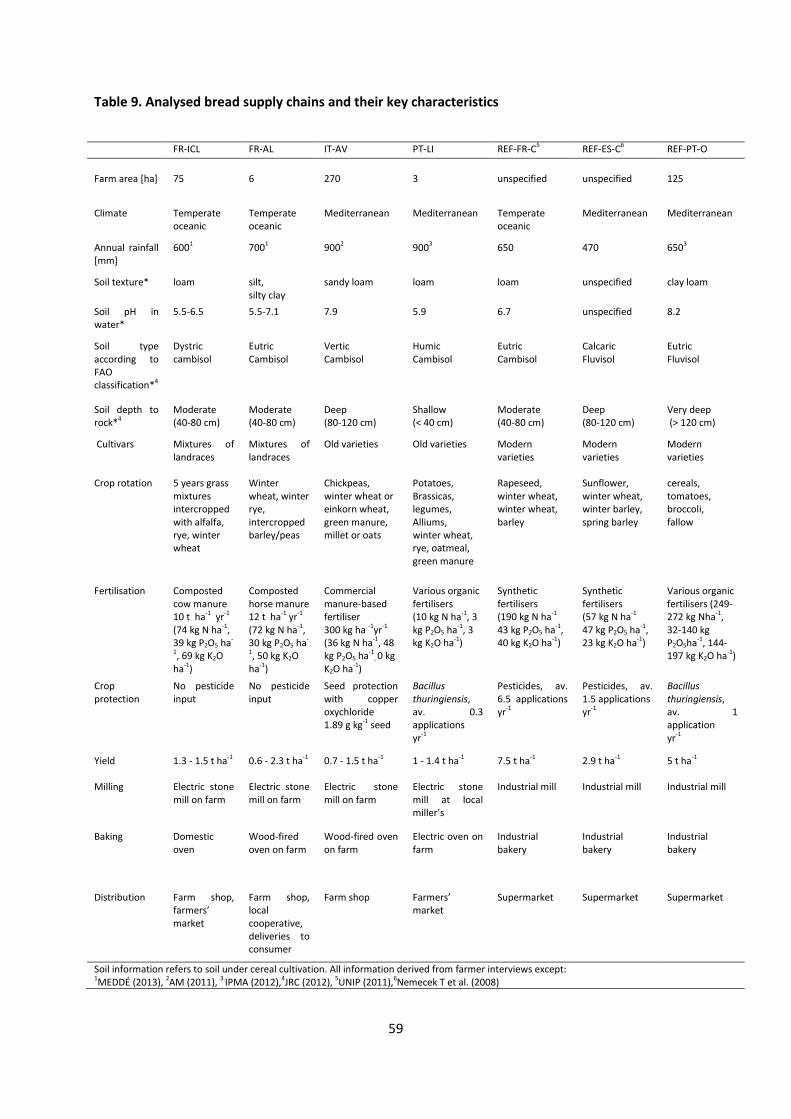
59
Table 9. Analysed bread supply chains and their key characteristics
FR-ICL FR-AL IT-AV PT-LI REF-FR-C5 REF-ES-C6 REF-PT-O
Farm area [ha] 75 6 270 3 unspecified unspecified 125
Climate Temperate oceanic
Temperate oceanic
Mediterranean Mediterranean Temperate oceanic
Mediterranean Mediterranean
Annual rainfall [mm]
6001 7001 9002 9003 650 470 6503
Soil texture* loam silt, silty clay
sandy loam loam loam unspecified clay loam
Soil pH in water*
5.5-6.5 5.5-7.1 7.9 5.9 6.7 unspecified 8.2
Soil type according to FAO classification*4
Dystric cambisol
Eutric Cambisol
Vertic Cambisol
Humic Cambisol
Eutric Cambisol
Calcaric Fluvisol
Eutric Fluvisol
Soil depth to rock*4
Moderate (40-80 cm)
Moderate (40-80 cm)
Deep (80-120 cm)
Shallow (< 40 cm)
Moderate (40-80 cm)
Deep (80-120 cm)
Very deep (> 120 cm)
Cultivars Mixtures of landraces
Mixtures of landraces
Old varieties Old varieties
Modern varieties
Modern varieties
Modern varieties
Crop rotation 5 years grass mixtures intercropped with alfalfa, rye, winter wheat
Winter wheat, winter rye, intercropped barley/peas
Chickpeas, winter wheat or einkorn wheat, green manure, millet or oats
Potatoes, Brassicas, legumes, Alliums, winter wheat, rye, oatmeal, green manure
Rapeseed, winter wheat, winter wheat, barley
Sunflower, winter wheat, winter barley, spring barley
cereals, tomatoes, broccoli, fallow
Fertilisation Composted cow manure 10 t ha-1 yr-1 (74 kg N ha-1, 39 kg P2O5 ha-
1, 69 kg K2O ha-1)
Composted horse manure 12 t ha-1 yr-1
(72 kg N ha-1, 30 kg P2O5 ha-
1, 50 kg K2O ha-1)
Commercial manure-based fertiliser 300 kg ha -1yr-1 (36 kg N ha-1, 48 kg P2O5 ha-1
, 0 kg K2O ha-1)
Various organic fertilisers (10 kg N ha-1, 3 kg P2O5 ha-1, 3 kg K2O ha-1)
Synthetic fertilisers (190 kg N ha-1
43 kg P2O5 ha-1, 40 kg K2O ha-1)
Synthetic fertilisers (57 kg N ha-1 47 kg P2O5 ha-1, 23 kg K2O ha-1)
Various organic fertilisers (249-272 kg Nha-1, 32-140 kg P2O5ha-1, 144-197 kg K2O ha-1)
Crop protection
No pesticide input
No pesticide input
Seed protection with copper oxychloride 1.89 g kg-1 seed
Bacillus thuringiensis, av. 0.3 applications yr-1
Pesticides, av. 6.5 applications yr-1
Pesticides, av. 1.5 applications yr-1
Bacillus thuringiensis, av. 1 application yr-1
Yield
1.3 - 1.5 t ha-1
0.6 - 2.3 t ha-1 0.7 - 1.5 t ha-1 1 - 1.4 t ha-1 7.5 t ha-1 2.9 t ha-1 5 t ha-1
Milling Electric stone mill on farm
Electric stone mill on farm
Electric stone mill on farm
Electric stone mill at local miller’s
Industrial mill
Industrial mill
Industrial mill
Baking
Domestic oven
Wood-fired oven on farm
Wood-fired oven on farm
Electric oven on farm
Industrial bakery
Industrial bakery
Industrial bakery
Distribution
Farm shop, farmers’ market
Farm shop, local cooperative, deliveries to consumer
Farm shop Farmers’ market
Supermarket Supermarket Supermarket
Soil information refers to soil under cereal cultivation. All information derived from farmer interviews except: 1MEDDÉ (2013), 2AM (2011), 3.IPMA (2012),4JRC (2012), 5UNIP (2011),6Nemecek T et al. (2008)
60
a.) FR-ICL – LICS combined with livestock production in France
On this farm, cereal production is combined with the production of beef, milk and cheese. The
farmer cultivates wheat landraces. Plants were selected to provide large quantities of firm straw,
which is used as livestock bedding. The grain is milled on-farm and flour is sold in paper bags, either
directly on-farm or at the farmers’ market. Consumers use the flour to bake bread at home.
b.) FR-AL–Horse farming in France
This farmer uses horses for a number of field operations: sowing, manure spreading and mowing.
Landraces of wheat and rye are cultivated here under a reduced-tillage regime. Most of the feed for
the two draught horses is covered by hay from the farm and pea/barley mixtures. Horse manure
mixed with straw is composted on-site for six months and used as a fertiliser. The grain is milled on-
farm and the bran fed to the horses. The dough is kneaded by hand and the bread baked in a wood-
fired oven, the wood for which is transported from the forest by horse-drawn cart. Forty percent of
production is sold directly at the farm, 35% through a local cooperative, and the rest through twice-
weekly deliveries to consumers’ homes.
c.) IT-AV - Ancient varieties in Italy
With 270 ha of land under cultivation, the main products of this farm are bread, pasta, chickpea flour
and oats. The rotation consists of cereals followed by leguminous crops every second year. The farm
is located in a hilly area, with an average slope of 25%. The farmer grows a variety of old wheat
cultivars on separate plots. The grain is milled on-farm and flours consist of a mixture of various
cultivars, with the different proportions reflecting the desired organoleptic quality of the bread.
During the data-collection period, the bread was baked on-farm in a wood-fired oven. As a result of a
partnership developed with an olive-oil producer, the farmer had plans to use the residues from olive
pressings as a fuel for baking. Products are distributed on-farm, mainly to representatives of groups
of consumers coming from the city located 45 km away.
d.) PT-LI – Small-scale labour-intensive production in Portugal
61
The farmer cultivates wheat and rye as well as a variety of vegetables on 3 ha of land. Owing to the
small scale, many processes are performed by hand or with the use of simple human-powered tools.
This includes sowing, harvesting, baling, manure spreading and application of plant-protection
products. A tractor is hired for tillage and soil preparation. Small quantities of sheep manure are used
as a fertiliser. Grains are taken to the local miller. The sourdough bread is made of 50% rye and 50%
wheat flour. Baking is done in an electric oven. Previously, the farmer used a wood-fired oven, but
ceased doing so before the data-collection period owing to the change in market requirements.
Switching to an electric oven allowed him to bake smaller batches but with a higher frequency. We
considered wood-burning as an additional scenario for the analysis. The product is distributed via the
farmers’ market.
2.2.2. Establishing life-cycle inventories for grain cultivation
Data for three years 2008, 2009 and 2010 were collected via a series of direct, semi-structured
interviews with producers and further correspondence via post and e-mail. Consideration of three
years was necessary in order to reflect the variability of results owing to differences in yields, farm
management and weather events. The French reference scenario FR-REF was based on the data
provided by the Eure-et-Loire region chamber of agriculture, and represents the practices of
conventional wheat farmers in the Beauce region of France (UNIP, 2011). Due to the lack of
representative datasets for wheat cultivation in Italy, we used data for conventional wheat
production from the Castilla y León region in Spain (Nemecek and Baumgartner, 2006, von
Richthofen et al., 2006), which is located within the same climatic region as the Italian case study.
Data for the Portuguese reference scenario were collected from a large-scale organic farmer in the
Santarém District. Field emissions for all analysed systems were calculated using the Swiss
Agricultural Life-Cycle Assessment (SALCA) model (Gaillard and Nemecek, 2009). This tool allows
quantifying direct and induced nitrous oxide (N2O) emissions from fertilised soils according to the
updated IPCC emission factors (IPCC, 2006). Ammonia (NH3) losses are calculated according to the
models of Asman (1992) and Menzi et al. (1997). Phosphorus emissions to ground- and surface
62
waters were calculated according to the guidelines of Prasuhn (2006). Nitrate leaching and heavy-
metal emissions were determined according to Richner et al. (2006) and the model of Freiermuth
(2006), respectively. Methane emissions from enteric fermentation in draught animals were derived
from IPCC emission factors (2006). All processes related to livestock rearing were included. Pesticide
applications were considered as emissions of their active ingredients to agricultural soil. Life-cycle
inventories for the indirect emissions associated with the production and supply of fertilisers,
pesticides, farm machinery and other infrastructure were derived from the ecoinvent database v 2.2
(Hischier et al., 2010).
2.2.3. Establishing life-cycle inventories for processing, distribution and retail
Data related to processing and distribution of bread from low-input farming systems were collected
directly from producers. Because there was no survey of FR-ICL customers on home-baking methods,
we assumed that a domestic electric oven was used to bake two standard 0.75 kg loaves of bread for
half an hour, as consistent with most recipes found in cookery books. The energy used by an electric
oven for baking was taken from the European Council Directive 92/75/EEC specifications concerning
the energy labelling of household electric ovens for a medium-sized device of energy-efficiency class
D (we took the median of the seven classes presented in the regulation). Secondary data were used
to establish inventories of standard references. The distance from farm to mill travelled by cereals
was assumed to be the same as the average haulage distance by road for products derived from
agriculture, hunting and forestry, as well as for fish and other fishing products. The said distance was
calculated for each country and year based on the database of the Directorate-General of the
European Commission (Eurostat, 2013). Life-cycle inventories for milling were derived from the
Danish LCA Food Database (Nielsen and Nielsen, 2003a) and regionalised. This involved changing
electricity mixes and cereals used in the Danish study to those of the respective locations in France,
Spain and Portugal. Due to the absence of a life-cycle inventory for ascorbic acid, an average
European inventory for organic chemicals from ecoinvent was used. Distances between mill and
bakery and bakery and retailer were assumed to be the same as the average annual national road-
63
transport distances for food products, beverages and tobacco in the respective countries (Eurostat,
2013). Inputs and outputs associated with industrial bread production were derived from (Nielsen
and Nielsen, 2003b), and electricity mixes were adjusted to local conditions. Although the use of salt
was not reported in the case of the Danish bread, we assumed the addition of 10g of salt per kg of
industrial bread to ensure consistency with other analysed cases. The use of energy and fuel for
lighting, heating, ventilation and air conditioning in the supermarket was adapted from (Tassou et al.,
2009). According to the study, 144 kg of bread can be displayed in 1 m2 of retail space in the
supermarket. We assumed that the bread was displayed at room temperature for 24 hours, and that
5% of the bread delivered to the shop was wasted and sent to landfill. This is a higher wastage rate
than the 2% for all food products in the supermarket assumed by Tassou et al. (2009), owing to the
fact that bread has a maximum shelf-life of 24 hours. The use of LDPE plastic bags was included in the
inventory for the shopping trip. Tassou et al. (2009) reports that the average plastic shopping bag
weights 10 g and can be loaded with up to 4.5 kg of purchases, but can contain no more than 2.4 kg
of bread owing to its size. A 2.4 kg load was thus assumed per plastic bag. (Rizet and Keita, 2005)
estimated an average distance to the supermarket in France of 9 km and the average shopping
basket as 15 kg. We assumed that a petrol-engine passenger vehicle (European average) was used for
the shopping trip, and that among the other usual items, two 750 g loaves would be purchased
during the shopping trip.
2.2.4. Allocation procedures
FR-ICL cultivates varieties of cereals that have a Harvest Index of 0.5, meaning that the ratio of grain
to total aboveground biomass is 0.5. The straw exits the cropping system and is utilised as livestock
bedding. Economic allocation was used to assign environmental burdens to the straw. The prices of
wheat and rye were derived from FAO statistics (FAOSTAT, 2013), and the price of straw from farmer
interviews. Depending on the year in question, this yielded allocation factors of 0.29 to 0.35 for
straw. Mass allocation was applied to account for all transport emissions when bread was
transported along with other items.
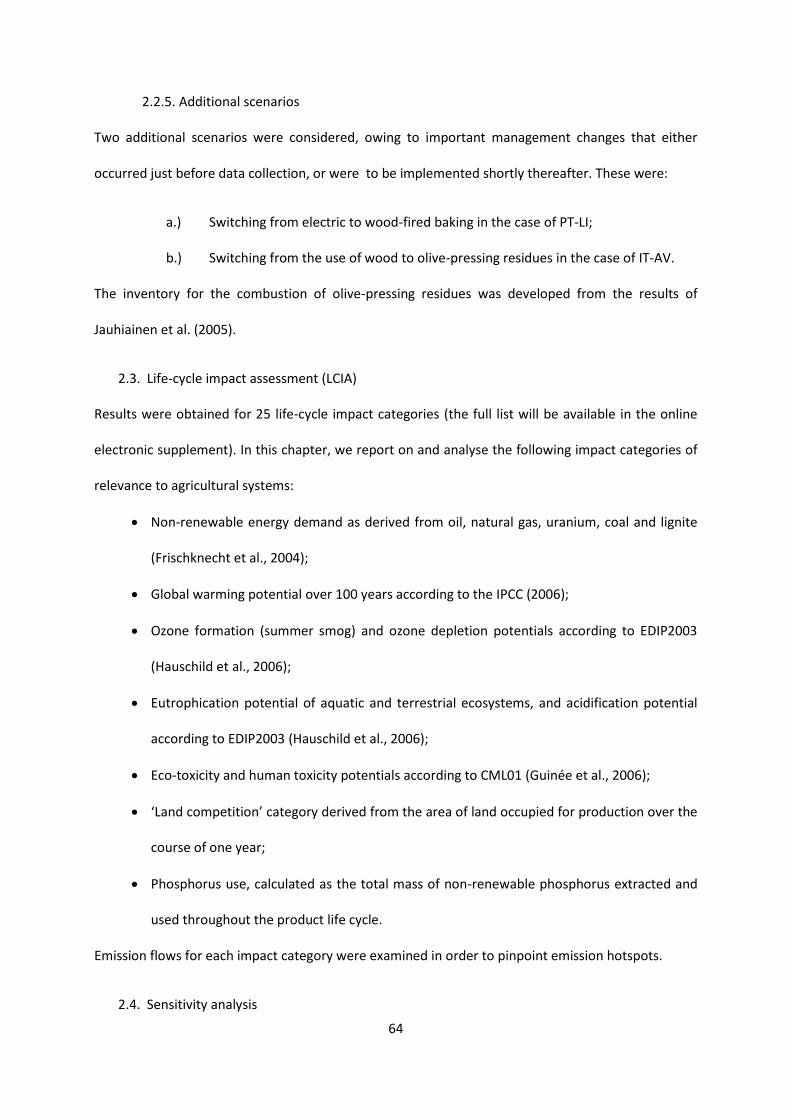
64
2.2.5. Additional scenarios
Two additional scenarios were considered, owing to important management changes that either
occurred just before data collection, or were to be implemented shortly thereafter. These were:
a.) Switching from electric to wood-fired baking in the case of PT-LI;
b.) Switching from the use of wood to olive-pressing residues in the case of IT-AV.
The inventory for the combustion of olive-pressing residues was developed from the results of
Jauhiainen et al. (2005).
2.3. Life-cycle impact assessment (LCIA)
Results were obtained for 25 life-cycle impact categories (the full list will be available in the online
electronic supplement). In this chapter, we report on and analyse the following impact categories of
relevance to agricultural systems:
Non-renewable energy demand as derived from oil, natural gas, uranium, coal and lignite
(Frischknecht et al., 2004);
Global warming potential over 100 years according to the IPCC (2006);
Ozone formation (summer smog) and ozone depletion potentials according to EDIP2003
(Hauschild et al., 2006);
Eutrophication potential of aquatic and terrestrial ecosystems, and acidification potential
according to EDIP2003 (Hauschild et al., 2006);
Eco-toxicity and human toxicity potentials according to CML01 (Guinée et al., 2006);
‘Land competition’ category derived from the area of land occupied for production over the
course of one year;
Phosphorus use, calculated as the total mass of non-renewable phosphorus extracted and
used throughout the product life cycle.
Emission flows for each impact category were examined in order to pinpoint emission hotspots.
2.4. Sensitivity analysis
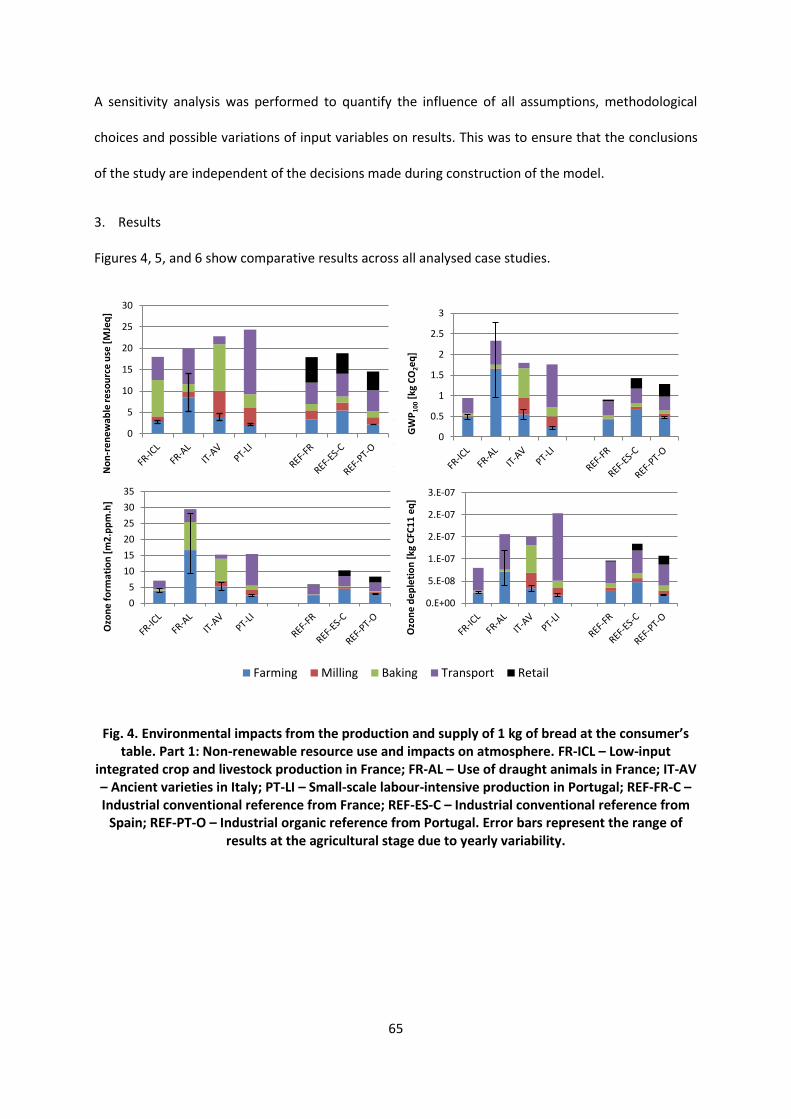
65
A sensitivity analysis was performed to quantify the influence of all assumptions, methodological
choices and possible variations of input variables on results. This was to ensure that the conclusions
of the study are independent of the decisions made during construction of the model.
3. Results
Figures 4, 5, and 6 show comparative results across all analysed case studies.
Fig. 4. Environmental impacts from the production and supply of 1 kg of bread at the consumer’s table. Part 1: Non-renewable resource use and impacts on atmosphere. FR-ICL – Low-input
integrated crop and livestock production in France; FR-AL – Use of draught animals in France; IT-AV – Ancient varieties in Italy; PT-LI – Small-scale labour-intensive production in Portugal; REF-FR-C – Industrial conventional reference from France; REF-ES-C – Industrial conventional reference from
Spain; REF-PT-O – Industrial organic reference from Portugal. Error bars represent the range of results at the agricultural stage due to yearly variability.
0
0.5
1
1.5
2
2.5
3
3.5
4
4.5
FR1 FR2 IT PT REF-FR REF-ES-C REF-PT-O
Farming Milling Baking Transport Retail
0
0.5
1
1.5
2
2.5
3
GW
P10
0 [
kg C
O2e
q]
0
5
10
15
20
25
30
No
n-r
en
ew
able
re
sou
rce
use
[M
Jeq
]
0
5
10
15
20
25
30
35
Ozo
ne
fo
rmat
ion
[m
2.p
pm
.h]
0.E+00
5.E-08
1.E-07
2.E-07
2.E-07
3.E-07
Ozo
ne
de
ple
tio
n [
kg C
FC1
1 e
q]
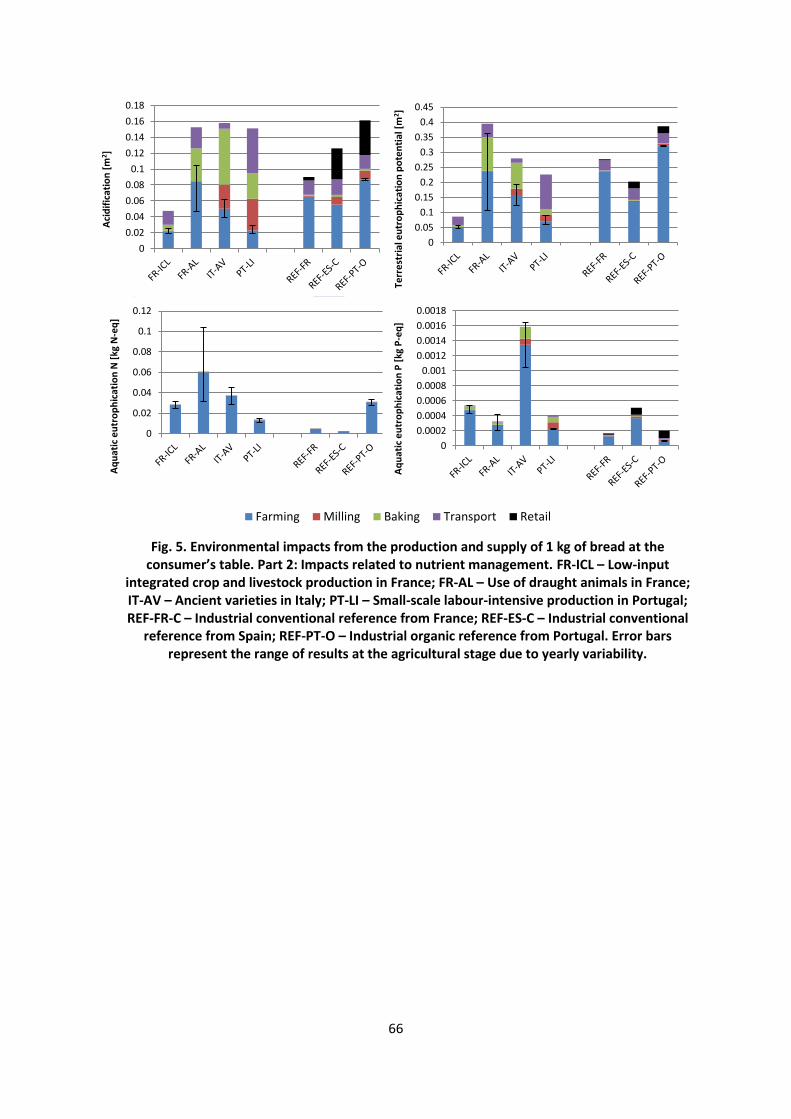
66
Fig. 5. Environmental impacts from the production and supply of 1 kg of bread at the
consumer’s table. Part 2: Impacts related to nutrient management. FR-ICL – Low-input integrated crop and livestock production in France; FR-AL – Use of draught animals in France; IT-AV – Ancient varieties in Italy; PT-LI – Small-scale labour-intensive production in Portugal; REF-FR-C – Industrial conventional reference from France; REF-ES-C – Industrial conventional
reference from Spain; REF-PT-O – Industrial organic reference from Portugal. Error bars represent the range of results at the agricultural stage due to yearly variability.
0
0.5
1
1.5
2
2.5
3
3.5
4
4.5
FR1 FR2 IT PT REF-FR REF-ES-C REF-PT-O
Farming Milling Baking Transport Retail
0
0.02
0.04
0.06
0.08
0.1
0.12
0.14
0.16
0.18A
cid
ific
atio
n [
m2 ]
0
0.05
0.1
0.15
0.2
0.25
0.3
0.35
0.4
0.45
Terr
est
rial
eu
tro
ph
icat
ion
po
ten
tial
[m
2]
0
0.02
0.04
0.06
0.08
0.1
0.12
Aq
uat
ic e
utr
op
hic
atio
n N
[kg
N-e
q]
0
0.0002
0.0004
0.0006
0.0008
0.001
0.0012
0.0014
0.0016
0.0018
Aq
uat
ic e
utr
op
hic
atio
n P
[kg
P-e
q]
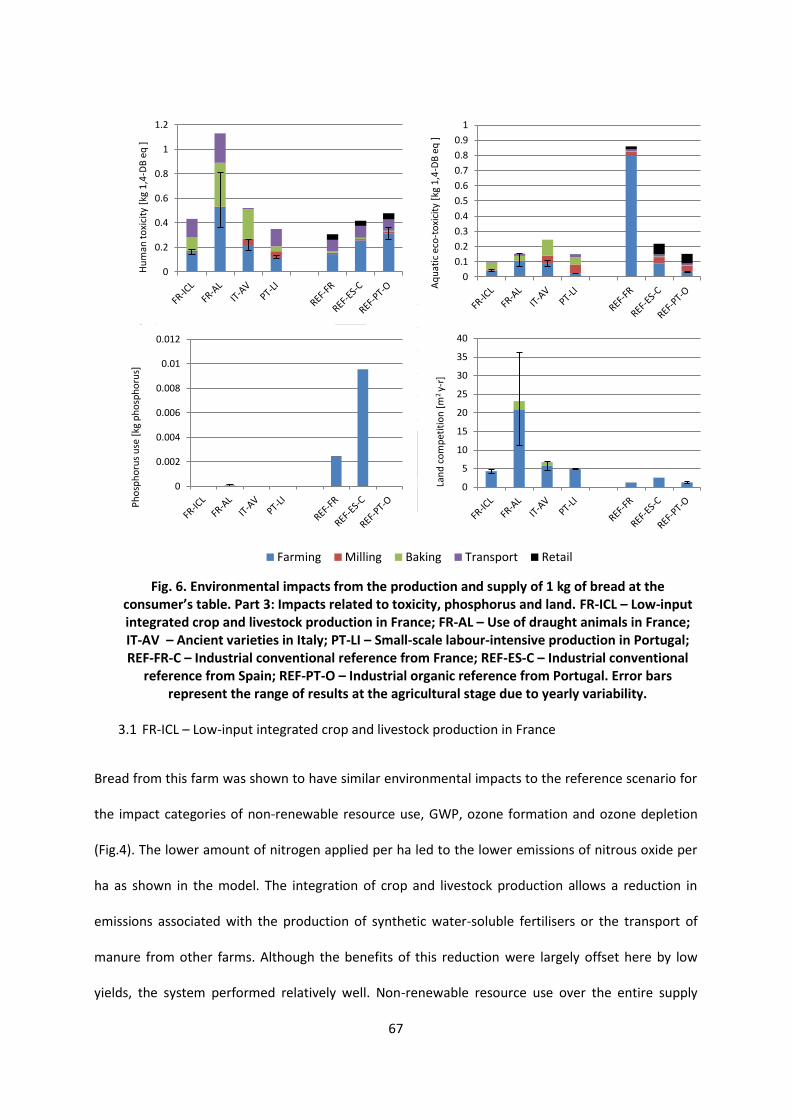
67
Fig. 6. Environmental impacts from the production and supply of 1 kg of bread at the
consumer’s table. Part 3: Impacts related to toxicity, phosphorus and land. FR-ICL – Low-input integrated crop and livestock production in France; FR-AL – Use of draught animals in France; IT-AV – Ancient varieties in Italy; PT-LI – Small-scale labour-intensive production in Portugal; REF-FR-C – Industrial conventional reference from France; REF-ES-C – Industrial conventional
reference from Spain; REF-PT-O – Industrial organic reference from Portugal. Error bars represent the range of results at the agricultural stage due to yearly variability.
3.1 FR-ICL – Low-input integrated crop and livestock production in France
Bread from this farm was shown to have similar environmental impacts to the reference scenario for
the impact categories of non-renewable resource use, GWP, ozone formation and ozone depletion
(Fig.4). The lower amount of nitrogen applied per ha led to the lower emissions of nitrous oxide per
ha as shown in the model. The integration of crop and livestock production allows a reduction in
emissions associated with the production of synthetic water-soluble fertilisers or the transport of
manure from other farms. Although the benefits of this reduction were largely offset here by low
yields, the system performed relatively well. Non-renewable resource use over the entire supply
0
0.5
1
1.5
2
2.5
3
3.5
4
4.5
FR1 FR2 IT PT REF-FR REF-ES-C REF-PT-O
Farming Milling Baking Transport Retail
0
0.2
0.4
0.6
0.8
1
1.2
Hu
man
to
xici
ty [
kg 1
,4-D
B e
q ]
0
0.1
0.2
0.3
0.4
0.5
0.6
0.7
0.8
0.9
1
Aq
uat
ic e
co-t
oxi
city
[kg
1,4
-DB
eq
]
0
0.002
0.004
0.006
0.008
0.01
0.012
Ph
osp
ho
rus
use
[kg
ph
osp
ho
rus]
0
5
10
15
20
25
30
35
40
Lan
d c
om
pet
itio
n [
m2
y-r]
68
chain was dominated by domestic baking. Emissions associated with distribution were similar in both
the analysed supply chain and the reference. Despite shorter distances, small-scale distribution for
this farm is associated with smaller loads per vehicle, and therefore results in a similar fuel
consumption and material use per product unit to the industrial system. Alternative bread from LICS
was shown to have lower acidification and terrestrial eutrophication potentials owing to the
avoidance of synthetic water-soluble N fertiliser in its production (Fig. 5.). By contrast, aquatic
eutrophication potentials for N and P were higher due to the use of manure and increased ammonia
emissions. Human toxicity was higher in the low-input system owing to the fact that more diesel was
burned per product unit with the lower yield per ha. On the other hand, ecotoxicity was much lower
due to the absence of pesticides. Since only recycled phosphorus was applied, phosphorus-use
impact on this farm was negligible compared to the reference. Owing to the difference in yields, the
impact on land competition was higher than in the reference (Fig. 6).
3.2 FR-AL – Draught animals in France
Most of the environmental impacts for this farm were higher than for both the other low-input
producer (FR-ICL) and for the reference (FR-REF, Fig. 4,5,6). A relatively large amount of resources
were consumed here for the upkeep of the horses, whilst heavy machinery was used anyway for the
most resource-intensive activities such as hay-baling and ploughing. Yield variability was also high,
with wheat yields in 2008 being more than double of those in 2010. The higher environmental
impacts in 2010 were the result of unsuccessful management experiments conducted by the farmer
over the course of the year (information obtained via personal communication). As a result of baking
with wood, the impacts on non-renewable resource use, GWP and ozone depletion were lower than
for the reference, but ozone formation was higher owing to emissions from wood combustion. All
nutrient-related impacts (Fig. 5) were higher than in the reference, owing to the size of the area
devoted to the cultivation of both cereals and horse feed. Human toxicity was much higher here than
in the reference scenario (Fig. 6), partly as a result of burning fuel for farming and partly from
69
burning wood. Although ecotoxicity and phosphorus use were much lower for the same reasons as in
the previous case mentioned, land requirement was shown to be more than ten times higher than in
the reference scenario.
3.3 IT-AV – Ancient varieties in Italy
At this farm, milling and kneading were both done with the use of electricity and these processes
were shown to be less energy-efficient than in the industrial scenario. Moreover, baking with wood
caused airborne emissions of polycyclic aromatic hydrocarbons and other substances, increasing
ozone-formation potential, acidification and terrestrial eutrophication potentials (Fig 5). Despite the
small quantities of manure applied, the model exhibited a high aquatic eutrophication potential
owing to the fact that the very high slopes increased the risk of surface runoff. Human toxicity was
lower at the agricultural stage than in the reference, but baking with wood led to higher human-
toxicity impacts (Fig. 6.). Phosphorus use, however, was considerably lower than in the reference.
3.4 PT-LI – Small-scale labour-intensive production in Portugal
At the agricultural stage, this system revealed similar non-renewable resource use to the large-scale
high-input organic producer, but lower GWP, ozone formation and ozone depletion than the latter. A
large proportion of emissions are avoided here since sowing, weeding and harvesting are done by
hand. The comparative advantage at the agricultural stage is offset by the higher impacts from
milling, baking and distribution. Here, the small size of the operation led to a lower energy efficiency
per product unit and increased vehicle-kilometres due to more frequent journeys to the miller and
market. Consequently, acidification and terrestrial eutrophication potentials were lower at the
agricultural stage, but similar at the level of the entire value chain. Because of the lower amount of
organic fertiliser applied, impact on aquatic eutrophication N was lower than from the large-scale
organic producer, whilst impact on aquatic eutrophication P was lower than for the reference at the
agricultural stage, but similar to it at the overall supply chain level owing to the contribution made by
70
milling and baking. Human toxicity was lower than in the reference, mainly due to the avoidance of
diesel combustion for farming operations. Ecotoxicity and phosphorus use were similar, and both
relatively low, in the farm and in the reference, since no pesticides were applied and no mined P was
used in both cases.
3.5 Additional baking scenarios
Table 10 shows the influence of changes in baking methods on the environmental performance of
low-input breads from Italy and Portugal. The switch from electric to wood-fired oven was shown to
reduce non-renewable resource use and GWP. The rate of decrease in resource use was dependent
on the electricity mix of the country in question. Both Italy and Portugal have electricity mixes largely
dependent on fossil fuels. The analysis also revealed that impacts on ozone formation and human
toxicity are due to increase. The switch from wood to residues from olive pressing on the Italian farm
led to reductions in eutrophication and acidification potentials, but very large increases in human
toxicity due to the emission of benzene.
Table 10. Relative change in results per kg of bread at consumer’s table after changes to the
baking method
NRE GWP OF OD AP TEP
AEP-N
AEP-P
ET HT P LC
A -11% -11% +7% -6% -12% +6% 0 -18% -24% +17% -2% +18%
B -1% -4% +30% -1% -9% -13% 0 -1% -5% +182%
-3% -14%
A Use of wood-fired oven instead of electric oven for baking in the case of PT 1 B Use of olive residues instead of wood as baking fuel in the case of IT NRE – Non-renewable resource use; GWP – Global warming potential; OF – ozone formation; OD – ozone depletion; AP – Acidification potential; TEP – Terrestrial eutrophication potential; AEP – Aquatic eutrophication potential; ET – Eco-toxicity; HT – Human toxicity; P – Phosphorus use; LC– Land competition
4. Discussion
71
In the first subsection, we discuss the direct environmental impacts of alternative bread supply
chains based on LICS quantified in our model. This is followed by a discussion of the broader, indirect
effects of contrasting land uses.
4.1. Direct environmental impacts
The study findings show clearly that switching to products from alternative food supply chains based
on LICSs does not necessarily reduce environmental impacts, nor does it necessarily increase them.
Low-input, low-output systems will most likely have lower environmental impacts per unit of area
than modern agriculture, as demonstrated e.g. for traditional apple production in Italy (Cerutti et al.,
2013). A reduction of impacts per area, however, does not contribute to a reduction in the total
impacts from the consumption of food on the environment, unless it is coupled with a reduction in
the quantity and composition of food consumed per citizen, or a reduction in population size.
Improving eco-efficiency, however – where this is understood as reducing environmental impacts per
quantity of product – can produce this reduction in total impacts.
Low-input farmers seek to reduce the amount of farm-external inputs used and to minimise
the impact of their activities on the environment as described by Parr et al. (1990). Lower use of
purchased seeds, fertilisers and pesticides can, however, increase the need for diesel, electricity,
machinery and other infrastructure to produce the same quantity of food. Van der Werf et al. (2007)
suggested that product LCA supports intensive high-input and high-output systems that may cause
local environmental problems. Our analysis demonstrated that this is not always the case, and that
low-yielding systems can also be more eco-efficient than high-input ones. The wide variability of
results suggests that there is scope for significant improvements in eco-efficiency within low-input
agriculture.
Supermarket-based production systems were associated with lower environmental impacts
per kg of bread in three out of four cases, despite increased travel distances. This confirms the
findings of other studies investigating the influence of scale in bread production on the
72
environmental impacts of bread (Andersson and Ohlsson, 1999; Bimpeh et al., 2006). Despite this,
cases of IT-AV and FR-ICL demonstrated that local bread supply chains can also be advantageous over
supermarket-based supply. As for the comparison of different baking modes, the switch from electric
to wood-fired ovens for baking was beneficial for reducing impacts on climate change and resource
use, but also increased human toxicity due to i.e. the release of polycyclic aromatic hydrocarbons.
The case of olive residues used as fuel demonstrated that recycling biomass for energy production
will not always be more eco-efficient than using fossil energy.
4.2 . Broader aspects of land use
This chapter confirmed that low-input systems are land-use-intensive. Both quantity and quality of
land use have important implications for biodiversity. Low-input arable systems in Europe cause
significantly less damage to vascular-plant richness than systems with high input levels (Kleijn et al.,
2009). As mentioned in the introduction, both quality and quantity of land use have important
implications on biodiversity. It has been suggested that low-input, low-output systems may have
knock-on effects in the form of indirect land-use change (iLUC) (van der Werf et al., 2007). iLUC
occurs when pressure from new agricultural activity on the land in question brings about changes in
land use elsewhere (Gnansounou et al., 2008). iLUC effects should be considered when making
decisions at the macroeconomic level, for example where large-scale conversion to low-input
farming in Europe is the issue. At the product level, it is difficult to demonstrate the causal link
between the production of bread from a LICS and indirect land-use changes. Between 1961 and
2009, the total area under cereal cultivation in both western and southern Europe decreased slightly
(FAOSTAT, 2012). Consequently, there is no reason to suggest that the introduction of low-input
wheat or rye caused local deforestation. Given that the total amount of wheat imported into Europe
has increased, however, iLUC effects may be suggested to be occurring outside of Europe. Between
1961 and 2009, for example, the quantity of wheat imported into Europe increased by a factor of
2.269, i.e. slightly faster than the domestic production, which increased by a factor of 2.008. In
73
western Europe, still much more is produced than imported. Over the last 50 years, the ratio of
domestic wheat production to imported wheat has increased from 2.59 to 3.46, while the exported
quantity has increased by a factor of 13 (FAOSTAT, 2013). In southern Europe the situation is
different: the ratio of domestic production to import quantity has fallen from 3.53 in 1961 to just
0.92 in 2009, meaning that more wheat is currently imported than produced in this region. However,
the average wheat yield in southern Europe has increased 2.29-fold in the last 50 years, while the
cultivated area has shrunk by 56%. This suggests that the relative increase in imports is due more to a
shift from wheat to other crops or land uses than it is to the introduction of low-input farms. Rather
than attributing the responsibility for land-use changes to low-input farmers, we would suggest the
opposite causality, viz., that low-input farming systems are being implemented in Europe because
the large domestic supply of agricultural goods makes it affordable to do so at the moment.
4. Conclusions
Unless coupled with restraints on demand, switching to traditional, LICSs and local
processing and distribution is not sufficient to effect reductions in the total environmental
impacts from producing food.
Low-input farmers aim to minimise the use of external inputs, save their own seed, apply less
fertiliser and avoid pesticides. Benefits from this approach may be offset by lower yields and
the need to use more land, fuel, machinery and other infrastructure per product unit. This is
not necessarily always the case, however. The study described in this chapter has shown that
agricultural systems that are both low-input and highly eco-efficient can also be found.
Centralisation of processing and distribution generally reduces unit environmental costs of
bread production despite increased distances in the supply chain. Even so, our results
demonstrate that well-organised local supply chains are an exception to this rule, and are
able to achieve a similar environmental performance to centralised systems.
74
CHAPTER 3.
USING LCA AND INTEGRATIVE DESIGN FOR IMPROVING
ECO-EFFICIENCY. THE CASE OF BREAD IN FRANCE.
This chapter is an adapted version of the following publication:
KULAK, M., NEMECEK, T., FROSSARD, E., & GAILLARD, G. 2014. Using integrative design and LCA to
improve eco-efficiency of food supply chains – the case of alternative bread in France. (undergoing
the peer-review).
75
1. Introduction
According to sustainability theorists, the process of transition to a more sustainable path of human
development requires breakthroughs of eco-innovations out of socio-technical niches (Elzen and
Wieczorek, 2005, Geels, 2002). Eco-innovation can be broadly defined as any activity of an actor that
results in new ideas, products, behaviours or processes that contribute to some specific sustainability
targets or reduce anthropogenic environmental burdens (Klemmer et al., 1999). The development of
new ideas is therefore a prerequisite of the transition to sustainability. The improvement of impacts
posed by the sociotechnical system on the environment can be achieved in two ways: i.) through
changes in consumption or/and ii.) through improvements of production systems - methods used to
create goods and services that satisfy our needs (Holstein and Tanenbaum, 2014). To provide
absolute reduction of environmental impacts through changes in production systems, improvements
need to be directed at significantly better eco-efficiency or resource productivity (Reijnders, 1998).
Agricultural systems are among those production systems that will require significant eco-
efficiency improvements. The growing and increasingly wealthy world population is demanding
increasingly more food (Alexandratos, 2009, Godfray et al., 2010) while its production and supply is
already responsible for a lion share of all anthropogenic environmental burdens (Tukker et al., 2006,
Tilman et al., 2011). If sufficient food and land is available, plants can be used to sequester carbon
and provide replacements for many goods that are currently derived from non-renewable resources
(Gleeson et al., 2012). The European Union policy plan for rural development lists fostering
innovation and promoting resource efficiency in agriculture among its key priorities for the years
2014-2020 (European Commision, 2013). Nevertheless, the exact methods by which these goals will
be achieved remain unclear.
Some of the past policy interventions in the European food system may potentially lead to
inefficiencies caused by the overlooked negative consequences occurring outside of the narrowly
76
defined system boundary. Organic agriculture (European Commision, 2013) or locally produced foods
that are both currently promoted by the European policy (Kneafsey et al., 2013) present two
examples of narrowly defined system boundaries. LCA studies revealed, that depending on the other
components of the farming and the food system architecture, local production can be associated
with higher or lower environmental burdens than imported products (Edwards-Jones et al., 2008)
and similarly, the switch from mineral to organic fertiliser and avoiding pesticides does not guarantee
lower environmental impacts (Tuomisto et al., 2012b). Developing resource-efficient agricultural
systems is going to require more systemic approaches.
Whole System Design (Integrative Design) is an approach that has its roots in the field of
industrial design. It aims to address inefficiencies in resource productivity of products, processes and
systems by targeting improvements simultaneously across whole systems instead of their parts
(Lovins, 2010, Stasinopoulos et al., 2009, Charnley et al., 2011). The concept of Whole System Design
emphasises the importance of developing partnerships and utilising synergies between elements of
system architecture to develop more sustainable solutions. The principles include i.e. expansion of
system boundary (Charnley et al., 2011), integration of multiple stakeholders (Lovins, 2010) utilising
benefits from simultaneous application of multiple technologies (Lovins, 2010) and involving experts
from multiple disciplines. The importance of both integrative and collaborative approaches to
agricultural system design were previously discussed with relation to productivity (Bawden et al.,
1984, Edwards, 1989). Integrative methods have been used in agricultural research to aid
development through the adoption of more productive farming techniques (Douxchamps et al.,
2013), to assess sustainable land use options in mountain regions (Huber et al., 2013, Brand et al.,
2013) or to develop innovative farming systems in developed countries (Bouma et al., 2011, Sherren
et al., 2010).
The effectiveness of integrative approaches for improving environmental performance of
industrial systems and products can be measured with single performance indicators, such as energy
77
efficiency (Lovins, 2010) or fuel efficiency (Charnley et al., 2011). In agri-food systems, these
indicators are not sufficient to evaluate the sustainability. As mentioned in the introduction,
environmental, social and economic impacts of food supply chains are complex and dispersed along
large spatial scales and long timeframes. Life cycle based approaches are necessary for evaluating
their environmental performance. According to our knowledge, there is a lack of studies from the
agri-food sector combining integrative approaches to design and LCA. Partidário et al. (2007) used
LCA and multicriteria decision making to assess sustainability performance of integrated solution for
people with a reduced access to food. The study however was focused on food preparation and
distribution, while the majority of environmental impacts of diets comes from primary production
(Garnett, 2011, Muñoz et al., 2010).
The research described in this paper was aimed at answering two questions : i.) Can
interdisciplinary collaboration between researchers and stakeholders be utilised to create more eco-
efficient food value chains and ii.) what is the potential role of LCA in supporting the process. Two
case studies of alternative bread supply chains in Western France were studied. The following section
of the article introduces the case studies and provides details of the applied methodological
framework. This is followed by a section describing quantitative results of LCA as well as qualitative
information gathered through the observation of interaction between scientists and farmers. In the
subsequent section, we discuss the factors limiting eco-efficiency of innovative and alternative
farming systems in Europe, highlight the benefits from applying integrative approaches integrated
with LCA and draw some recommendations for policymakers. The last section provides concluding
remarks.
2. Methodology
2.1. Introduction of case studies
78
A brief description of two French cases subject to this analysis has been provided in Chapter two of
the thesis. Below I provide a more detailed description of both systems and highlight differences in
LCA models constructed for the purpose of Chapters two and three.
2.1.1. Description of system FR-ICL – bread from integrated crop and livestock production.
The life cycle of bread from FR-ICL starts at the organic farm of 75 ha located in Pays de la Loire
region of western France. This farmer produced flour, meat and dairy products in a closely integrated
manner, meaning that co-products of one process were utilised as inputs to another one and
according to the farmer, waste was avoided whenever possible. Cereals were cultivated in a seven
years crop rotation, out of which 5 years were occupied as a grassland. Leguminous plants Medicago
Sativa were grown within the grassland mixture, fixing nitrogen from the air and reducing the need
for fertilisation of grasslands and subsequent crops. Cultivated variety mixtures of wheat and rye
were selected over the years with two major goals: i.) to produce large quantities of straw that can
be used as bedding for animals, and ii.) to produce desired organoleptic properties of bread. Farmer
reported during the interview to select the plants with “firm, long straw, that can stand still”.
Growing mixtures was perceived as important part of the system, as according to him, genetic
diversity allows to reduce losses from pest and diseases. The only fertiliser applied was a by-product
of livestock production - composted cow manure. No plant protection products were used. Cereals
were grown on slightly acidic loams with relatively low yields, between 1.3 and 1.5 t ha-1. The hay
produced from mixtures of grasses provided feedstuff for cows. The water for cows came from the
pond and rainwater harvested on the roof of the building, the electric fence was powered by solar
panels. Milk was either sold in recyclable bottles or processed into cheese. The whey that remained
from cheese-making served as a feedstuff for pigs. The farmer grinded the cereals in a farm-scale mill
and produced flour, while the remaining bran was fed to the animals. The product was sold directly
to the consumer –either on farm or at the weekly market in town. Consumers had been buying the
flour to bake the bread at home.
79
2.1.2. Description of system FR-AL– bread from horse farming.
FR-AL represents the bread made at a farm located in Brittany. At the time of data collection, it had 6
ha of cultivated area. Two working horses were substituting the tractor for some of the farming
operations. Although a large proportion of tasks was still performed with the use of tractor during
the data collection period, the stated objective of the farmer was to systematically substitute
mechanical traction with animal labour. In 2008, the farm was less than 10 years old and
experimenting with various mixtures of cereals and their varieties. The goal of the farmer was to
develop varieties of grains that are better adapted to local conditions and bread-making. The yields
between 2008 and 2010 were characterised by a high variability, achieving from 0.6 to 2.3 t of grain
yield per ha. Most of the feedstuff for horses was produced on farm. Horses were fed by hay
produced at permanent meadow, barley and pea grown in intercropping as a part of the crop
rotation and bran left after flour making. The grains were milled on farm and sourdough bread was
baked in a wood-fired oven. The wood was bought from the nearby forest and transported with the
use of horses. Once a year, customers subscribed to the service and decided on the quantity of bread
needed throughout the year. Consumers had the flexibility to request the bread with certain
properties, eg. gluten-free or salt-free, otherwise the recipe was developed by the producer. The
product was supplied to customers either through home deliveries, on farm shop or the local
cooperative specialised in marketing and distribution of organic products.
2.2. Description of a design procedure
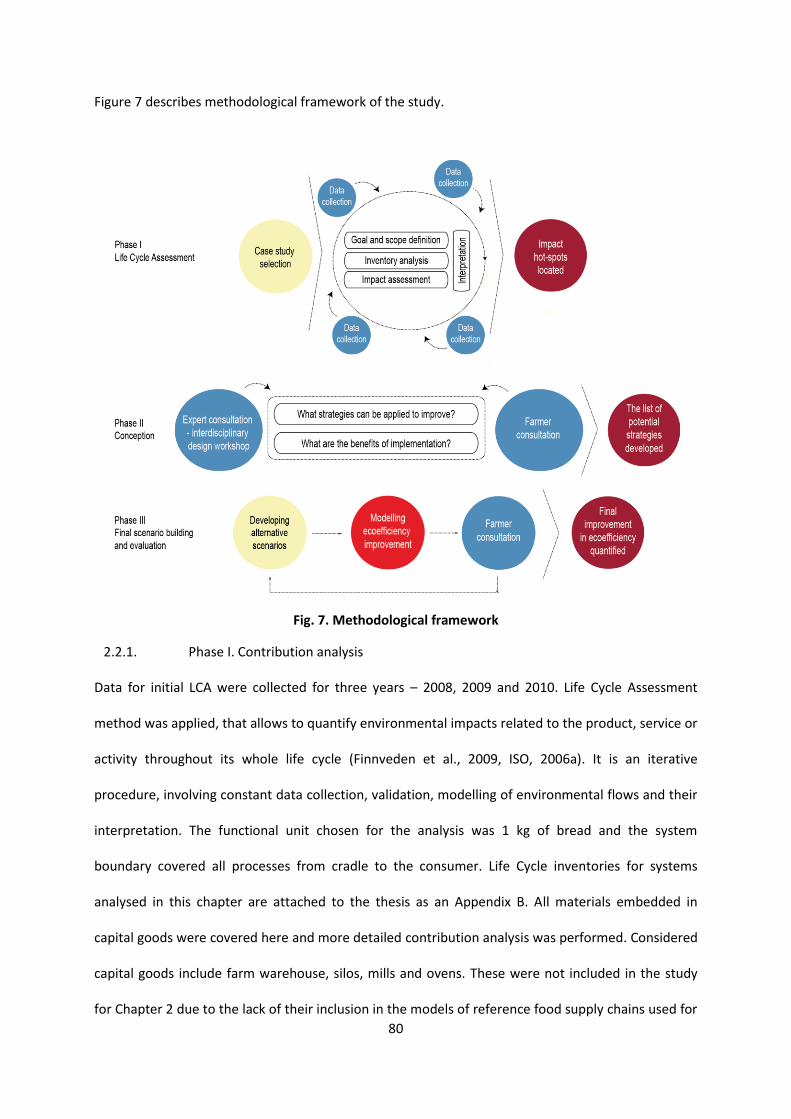
80
Figure 7 describes methodological framework of the study.
2.2.1. Phase I. Contribution analysis
Data for initial LCA were collected for three years – 2008, 2009 and 2010. Life Cycle Assessment
method was applied, that allows to quantify environmental impacts related to the product, service or
activity throughout its whole life cycle (Finnveden et al., 2009, ISO, 2006a). It is an iterative
procedure, involving constant data collection, validation, modelling of environmental flows and their
interpretation. The functional unit chosen for the analysis was 1 kg of bread and the system
boundary covered all processes from cradle to the consumer. Life Cycle inventories for systems
analysed in this chapter are attached to the thesis as an Appendix B. All materials embedded in
capital goods were covered here and more detailed contribution analysis was performed. Considered
capital goods include farm warehouse, silos, mills and ovens. These were not included in the study
for Chapter 2 due to the lack of their inclusion in the models of reference food supply chains used for
Fig. 7. Methodological framework
81
comparison. Eco-design study as compared to cross-sectional LCA study requires more detailed
contribution analysis due to the fact that the knowledge is needed for the exploration of various
improvement options. Life Cycle Inventories for the production and disposal of domestic ovens were
derived from Jungbluth (1997). The domestic oven is of multifunctional use. We derived the
allocation factor for bread based on the ratio of time occupied for baking to the product lifetime. For
farm warehouses and silos, adapted inventories from ecoinvent database v 2.2 were used (Hischier
et al., 2010). Silos were allocated to different grains based on the volume taken up for storage.
Buildings and the general storage infrastructure that is shared for the production of all goods on farm
was allocated between products on the basis of economic allocation. The adaptation of buildings
involved changing the quantity of concrete used for building foundations to those corresponding to
the situation on farm and changing electricity mixes from Swiss to French conditions. Due to the lack
of life cycle inventories for farm-scale mill and steel wood-fired oven, an average inventory for
agricultural machinery from ecoinvent database was used instead. Results of LCA were presented to
the producers.
2.2.2. Phase II. Conception
Results accompanied by the farm description and few photographs were presented during a
collaborative design workshop. Participants consisted of a consortium of researchers: plant breeders,
food quality researchers, agronomists, as well as several representatives of seed companies and
farmer’s associations. The description included geographical location of the case, its size, soil
characteristics, information on the management of cropping systems and market characteristics. 21
experts were divided into 5 groups and worked together to propose farm-specific management
innovations that can improve eco-efficiency. At least one scientist in each group had personally
visited the farm prior to the workshop and therefore had the knowledge of factors limiting the crop
growth that could be shared with other participants. The groups were also aimed to be
interdisciplinary. Participants were presented with cards containing the open list of potential
solutions based on the existing literature on eco-efficiency of LICSs (chapter 1) but some were also
82
left blank to encourage participants to develop their own ideas. For each strategy selected,
researchers were asked to provide qualitative information on the relative cost of implementation
and potential improvements in yield that can be achieved through the introduction of this strategy.
Each workshop was followed by presentations of group representatives on the rationale behind their
choices of options and the discussion in plenum.
2.2.3. Phase III.: Final scenario building and evaluation
Results of the collaborative design workshop were consulted with farmers. Each strategy proposed
by expert groups was discussed one by one in a semi-structured interview. Strategies rejected by the
farmer were excluded from further analysis. Producers were also encouraged to provide their own
ideas for improving eco-efficiency or propose other management changes to be analysed with LCA.
The list of solutions established as a result of the consultations was used to model environmental
impacts of improvement scenarios. This was done iteratively, through modelling the effects of each
strategy implementation on the environmental impacts with the use of LCA. Different combinations
of improvement measures were tested to derive the most effective one for reducing environmental
impacts.
3. Results
3.1. Phase I – LCA contribution analysis
Figures 8 and 9 provide the contribution of particular processes to the total result across 13 analysed
impact categories. Environmental impacts from capital goods were shown to be of minor importance
in the overall footprint of bread with the exception of storage buildings that contributed to 30% of
phosphorus use from FR-ICL, 30% of aquatic ecotoxicity and 29% of aquatic eutrophication P from
FR-AL. The use of phosphorus in FR-ICL was caused by small quantities of phosphoric acid making up
the generic inventory for “inorganic chemicals” that is used in the ecoinvent database to characterise
cement production (Hischier et al., 2010). This value is therefore highly uncertain as it is sensitive to
the choice of chemicals in the generic inventory – “inorganic chemicals”. However, the fact that
83
results are sensitive to such marginal values suggests that the absolute phosphorus use in the whole
system is relatively low. The relative contribution to aquatic ecotoxicity and aquatic eutrophication P
in FR-AL were related to copper use and in particular to the disposal of sulfidic tailings in the process
of copper concentrate beneficiation. Both farmers were avoiding the use of synthetic, water soluble
fertilisers and provided only recycled nutrients to plants in the form of composted manure. This
saved non-renewable resource use from fertiliser manufacturing as compared to conventional
farming but added some potential nitrate leaching and ammonia emissions, resulting in elevated
eutrophication N and toxicity. Due to relatively low grain yields, both systems had relatively high
impacts on land competition as compared to more conventional farming systems. Low-yields in LICSs
increase impacts related to farming operations, such as ploughing, cultivating or combine harvesting
and emissions from capital goods, such as buildings. The process of milling was shown to be of minor
importance in the overall emission balance. However, baking revealed to play an important role. In
FR-ICL, the large contribution of baking to the non-renewable resource use was caused by consumer
baking at home which is less efficient than in large bakeries. This confirmed the finding of Bimpeh et
al. (2006). In FR-AL, baking with wood contributed to ozone formation, acidification, terrestrial
eutrophication and human toxicity. Transport of bread has showed to play an important role
reaching up to 60% in the case of ozone depletion potential for both systems. Most of the emissions
were caused by consumer driving to purchase the bread on farm.
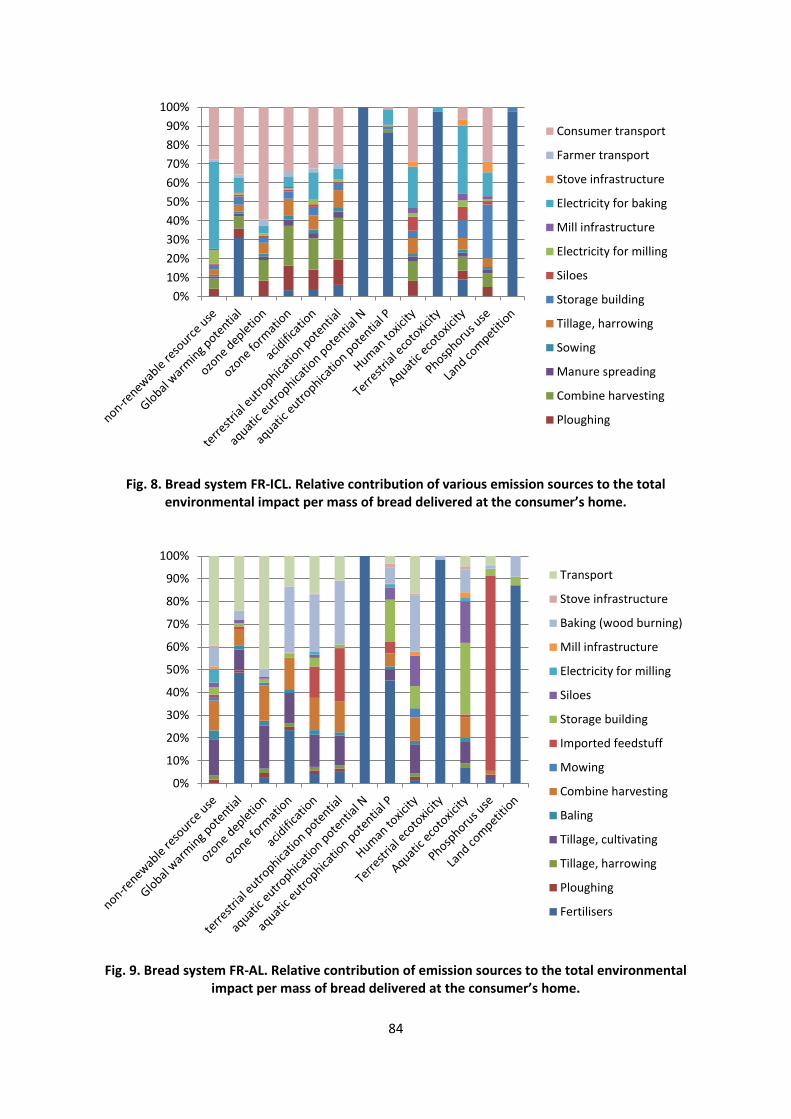
84
Fig. 8. Bread system FR-ICL. Relative contribution of various emission sources to the total environmental impact per mass of bread delivered at the consumer’s home.
Fig. 9. Bread system FR-AL. Relative contribution of emission sources to the total environmental impact per mass of bread delivered at the consumer’s home.
0%
10%
20%
30%
40%
50%
60%
70%
80%
90%
100%
Consumer transport
Farmer transport
Stove infrastructure
Electricity for baking
Mill infrastructure
Electricity for milling
Siloes
Storage building
Tillage, harrowing
Sowing
Manure spreading
Combine harvesting
Ploughing
0%
10%
20%
30%
40%
50%
60%
70%
80%
90%
100%
Transport
Stove infrastructure
Baking (wood burning)
Mill infrastructure
Electricity for milling
Siloes
Storage building
Imported feedstuff
Mowing
Combine harvesting
Baling
Tillage, cultivating
Tillage, harrowing
Ploughing
Fertilisers
85
3.2. Phase II - Conception
Results of a collaborative design workshop are presented in Table 11. Experts selected and suggested
a number of farm-specific interventions that would improve the output in a sustainable manner and
contribute to a reduction of the environmental impacts. Solutions were related to genetic
improvements of cultivated crops and farm management. Participants selected most of the solutions
from the “ready-to-use” pool suggested by workshop facilitators: selection of cultivars or cropping
system organisation in space and time. In addition, scientists provided specific recommendations on
varieties, species and systems that could provide potential improvements in eco-efficiency in specific
agro-ecological conditions at these farms. During the follow-up interview, producers discussed the
relevance of applying the suggested improvements to their systems.
Table 11: Proposals generated during the collaborative design workshop
Changing crop sequence (with proposed sequences)
Introduction of legumes into crop rotations (with proposed species)
Introduction of other cash crops (with proposed species)
Introduction of agroforestry (with proposed species)
Changing the breeding strategy (select for higher yield)
Changing soil pH (liming of acidic soils)
Adapting nutrient management strategies (changing quantities and types of applied fertilisers)
Intercropping (with proposed alternative species and management patterns)
3.2.1. FR-ICL.
The producer A was not willing to adapt significant changes in crop rotations. This was due to
the fact, that according to the farmer crop rotations were established for a long time and high
proportion of grasslands mixed with leguminous plants in the rotation was required to produce the
feedstuff required for livestock. The secondary function of meadow was, as perceived by the farmer,
to provide nutrients and improve the soil structure. The mixtures of rye cultivated at the farm have
86
shown to have better performance than wheat in terms of grain yield. The increase of rye in the flour
recipe could therefore reduce environmental impacts and, according to the farmer, may still be
accepted by the consumer. The grain yield per ha could significantly be increased by the introduction
of underground drainage. According to the producer, the yield could be doubled this way although
he expressed some concern over the increased nitrate leaching potential and losses of carbon. The
producer also expressed interest in the technology of anaerobic digestion due to the large quantities
of farmyard manure available at the farm. He was considering it for some time and anaerobic
digestion instead of composting could allow reducing the energy bills.
3.2.2. FR-AL.
The second producer has agreed that increasing the proportion of rye in the recipe of his
bread would be acceptable by his customers. In fact, he has already started to implement this
strategy within the project duration. The farmer explained, that customers generally prefer white
bread, but they are happy to purchase darker one after the explanation that rye is better adapted to
farm conditions and therefore its production is more eco-efficient. He has also started to expand the
cropped surface. There was a further demand for his farm produce and the increase of throughput
allows improving his perceived economic sustainability, reducing emissions from capital goods and
avoiding the need for purchasing external feedstuff for horses. The other accepted strategy was to
switch varieties to achieve higher grain yield, since the mixture that was grown on farm during the
data collection period provided very low yields. According to both the farmer and the expert group,
there is a potential for significant improvement of yield through breeding.
3.3. Phase III. - Scenario building and evaluation
In this phase of the project, impacts from the implementation of scenarios developed in a
collaborative design process (Table 12) were modelled with the use of Life Cycle Assessment. System
modelling approach was used to evaluate the environmental impacts from scenario implementation
87
at the level of the whole farm. This means that possible feedbacks from design decisions were taken
into account in the model. These effects are described in the subsequent sub-sections.
Table 12: Solutions generated in response to farmer feedback
FR-ICL FR-AL
Increase the proportion of rye in the flour Increase the proportion of rye in the bread recipe
Apply field drainage Increase farm area
Anaerobic digestion of cow manure instead of
composting
Select varieties for higher yield
Anaerobic digestion of horse manure and surplus
straw
3.3.1. FR-ICL
The first simulated design decision was to increase the proportion of rye flour. This change altered
the proportion of areas under wheat and rye cultivation on farm as well as allocation factors for
capital goods. Figure 10 shows the impact of this decision on the results of LCA. The increase in
cropped rye area to 50% of the overall surface caused the farm production to increase without
increasing the amount of inputs. The yield was assumed in this scenario to be the same as the
average between 2008, 2009 and 2010. According to the farmer, drainage of fields would allow for
100% of increase in grain yields. Predicting the yields is associated with a high uncertainty, in this
scenario we made a conservative assumption of 40% yield increase. This resulted in the simulated
yield of 2.15 t ha-1 for wheat and 3.38 t ha-1 for rye. This has caused further reductions of
environmental impacts for all of the considered impact categories. To ensure that the new system
does not lead to nutrient depletion, we assumed that 40% more nutrients needs to be added to the
soil. The farm has surplus manure, which is sold to other farmers. The life cycle inventories for
anaerobic digestion of cattle manure and straw were derived from Poeschl et al. (2012). Only
airborne emissions were considered in simulations, with the inclusion of all processes related to the
production of anaerobic digestion plant, its maintenance and distribution of digestate to agricultural
land. The biogas was considered to be turned into electricity, replacing that from the grid. As
compared to the scenario without it, anaerobic digestion of manure reduced the GWP but increased
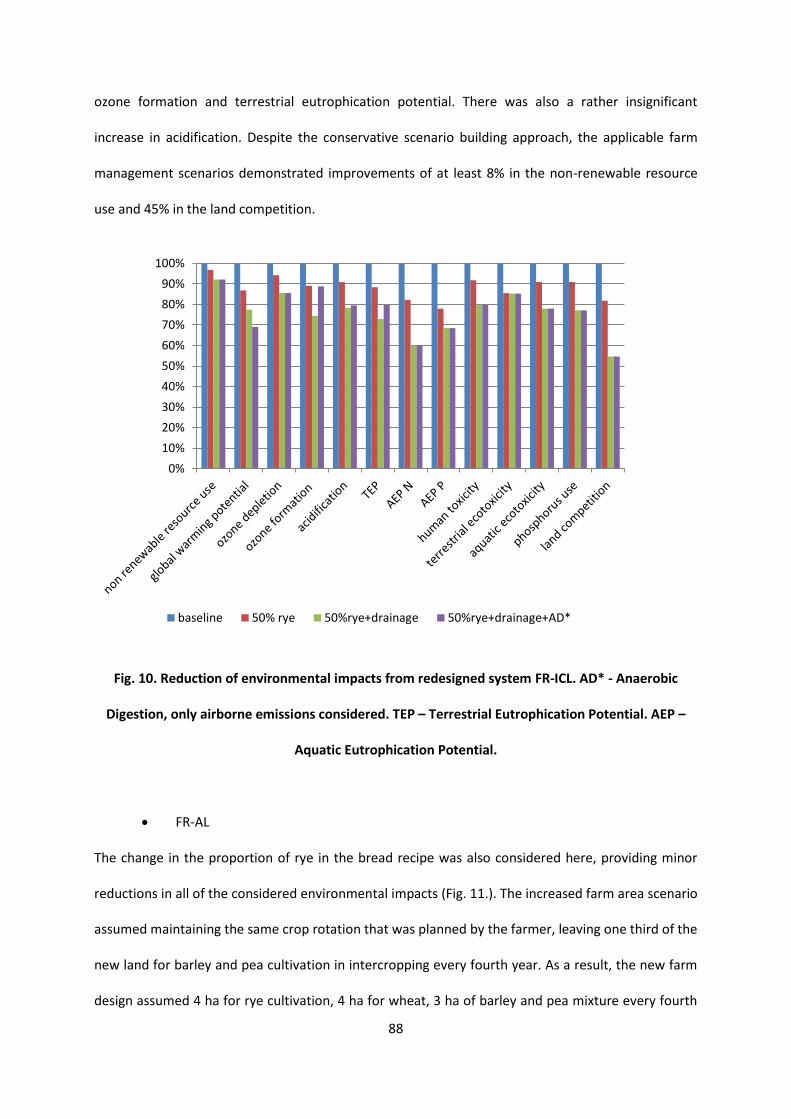
88
ozone formation and terrestrial eutrophication potential. There was also a rather insignificant
increase in acidification. Despite the conservative scenario building approach, the applicable farm
management scenarios demonstrated improvements of at least 8% in the non-renewable resource
use and 45% in the land competition.
Fig. 10. Reduction of environmental impacts from redesigned system FR-ICL. AD* - Anaerobic
Digestion, only airborne emissions considered. TEP – Terrestrial Eutrophication Potential. AEP –
Aquatic Eutrophication Potential.
FR-AL
The change in the proportion of rye in the bread recipe was also considered here, providing minor
reductions in all of the considered environmental impacts (Fig. 11.). The increased farm area scenario
assumed maintaining the same crop rotation that was planned by the farmer, leaving one third of the
new land for barley and pea cultivation in intercropping every fourth year. As a result, the new farm
design assumed 4 ha for rye cultivation, 4 ha for wheat, 3 ha of barley and pea mixture every fourth
0%
10%
20%
30%
40%
50%
60%
70%
80%
90%
100%
baseline 50% rye 50%rye+drainage 50%rye+drainage+AD*
89
year and 2.5 ha of permanent meadow. Due to the increase in the cultivated area, 37% more land
was available for feedstuff production. In this scenario, we have therefore assumed less need for
purchased external feedstuff, respectively. However, the two horses were demonstrated to be no
longer able to cover all the fertiliser requirements so the purchase of additional external manure was
considered in the simulation. The fertilising rate was assumed to be the same as currently employed
by the farmer – 12 t ha-1. The increase in farm area caused the amount of applied animal manure on
farm to increase from 40 to 72 tons. The results of LCA for this scenario revealed further reductions
for most of the impact categories. The exception was the impact on aquatic eutrophication potential
N which increased due to increased manure application. For the scenario involving yield increase
from breeding, we have assumed the maximum yield achieved from switching to higher yielding
cultivars as 2.5 t ha-1 for wheat and 3.5 t ha-1 for rye. It is worth mentioning, that conventional
farmers in France achieved on average 7.1 t ha-1 for wheat and 5 t ha-1 for rye between 2008 and
2010 (FAOSTAT, 2013). Similarly to the previous case, the use of manure per ha was scaled to match
the requirements of increased crop output. The final quantity of manure throughput was 97 tonnes.
After the doubling of area and slight increase in yield, it was estimated that the farm will have a
surplus of 7.77 wheat and 10.8 t rye straw per year. In the anaerobic digestion scenario, we have
considered that this straw may be fed directly into the digester instead of being used as animal
bedding. In terms of reducing emissions, pure straw has been demonstrated to be a more effective
feedstock than mixed manure and straw (Poeschl et al., 2012). The anaerobic digestion scenario
produced reductions in GWP on the one hand and increases in ozone formation of roughly the same
magnitude.
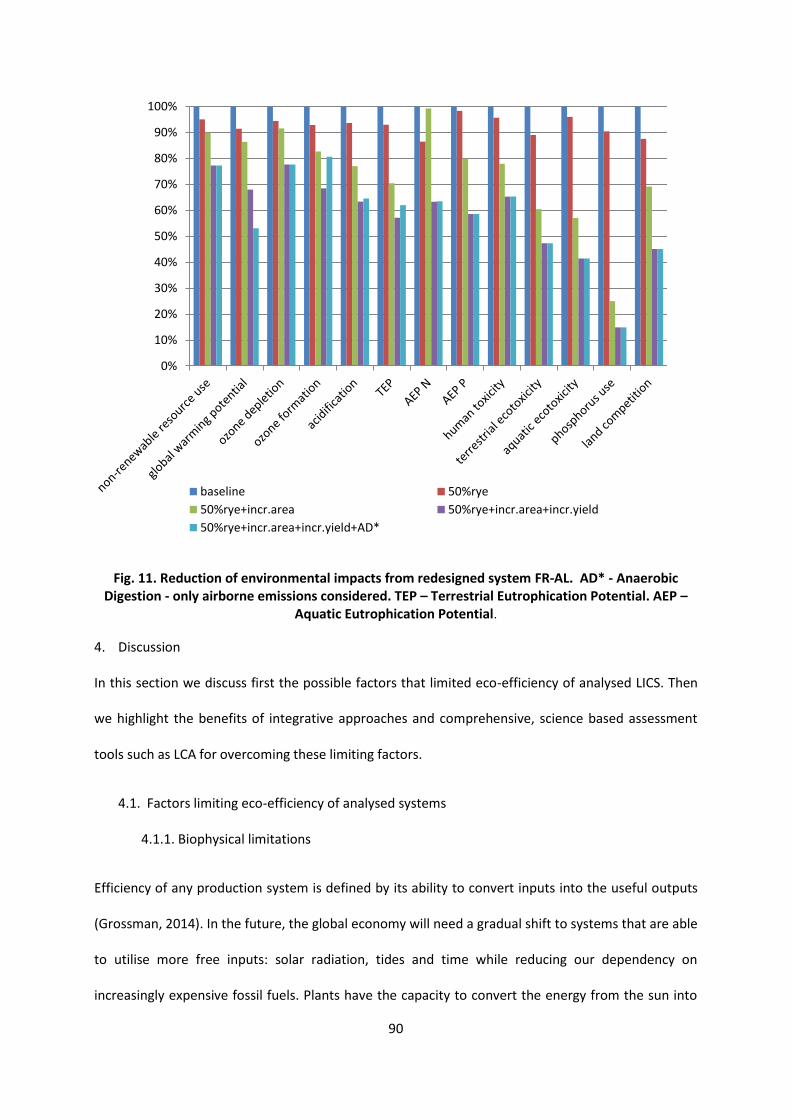
90
Fig. 11. Reduction of environmental impacts from redesigned system FR-AL. AD* - Anaerobic Digestion - only airborne emissions considered. TEP – Terrestrial Eutrophication Potential. AEP –
Aquatic Eutrophication Potential.
4. Discussion
In this section we discuss first the possible factors that limited eco-efficiency of analysed LICS. Then
we highlight the benefits of integrative approaches and comprehensive, science based assessment
tools such as LCA for overcoming these limiting factors.
4.1. Factors limiting eco-efficiency of analysed systems
4.1.1. Biophysical limitations
Efficiency of any production system is defined by its ability to convert inputs into the useful outputs
(Grossman, 2014). In the future, the global economy will need a gradual shift to systems that are able
to utilise more free inputs: solar radiation, tides and time while reducing our dependency on
increasingly expensive fossil fuels. Plants have the capacity to convert the energy from the sun into
0%
10%
20%
30%
40%
50%
60%
70%
80%
90%
100%
baseline 50%rye
50%rye+incr.area 50%rye+incr.area+incr.yield
50%rye+incr.area+incr.yield+AD*
91
food and biomass. Both farms analysed in the study applied very small quantities of fertilisers, did
not use any pesticides and produced their own seeds. This was done with the goal of bringing down
the consumed amount of farm-external inputs, one of the principles of low-input agriculture as
defined by Parr et al., (1990). The reduction of fertilisers causes a reduction of yields, while some of
the remaining inputs like fuel, machinery and farm infrastructure remain stable. Avoiding modern
varieties allows farmers to maintain the genetic heterogeneity in the fields and avoid the necessity to
purchase patented seeds. However, the mixtures of old varieties are characterised by lower grain
yield and possibly lower nutrient use efficiency than modern varieties (Guarda et al., 2004). Lower
nutrient use efficiency will likely to have negative impacts on eco-efficiency. Instead of absolute
reductions, farmers should aim to achieve equilibrium between inputs, as eco-efficiency can be
limited by their imbalance (Chapter 1). Local agro-ecological conditions present another potentially
limiting factor. Choosing the crops and varieties that are better adapted to local conditions is more
effective from the eco-efficiency perspective than producing for local market at all cost. Williams
(2007) has shown that with the extreme example of roses. Production in Kenya for UK market was
found to cause factor 10 less energy use and factor 16 less greenhouse gas emissions than in heated
greenhouses in the Netherlands, despite the necessity to transport the product for long distance by
plane. In the present study, one farm was characterised by acidic soils and the other one by
hydromorphic properties. If the soil and climate are not suitable for wheat, it would be reasonable to
switch to other crops or land uses. Such changes however need to be evaluated together with
consequences on other parts of the farm and surrounding sociotechnical landscape. In the case of
producer A, without cereals the farmer would need to find another material for animal bedding. The
producer B would have to find markets for new products.
4.1.2. Personal preferences and a lack of knowledge
The fact that producers were interested in the results of LCA and willing to adapt some of the
management changes suggest the lack of knowledge among the limiting factors. This knowledge can
be divided into two types i.) knowledge on environmental impacts of particular patterns of
92
management and ii.) knowledge of the possible improvement options. The fact that farmers were
not willing to adopt some of the suggested improvement measures indicates the existence of other
limiting factors. One of the suggestions for improving FR-ICL was to develop bread-making or to start
partnership with a baker instead of letting customers to make the bread at home, which is relatively
energy-intensive (Fig. 2.). The farmer stated, that he believes it is interesting that his customers bake
the bread at home and he prefers to let them choose how their bread looks like and how it is made.
The producer B was willing to influence the product consumption. He stated that his customers are
happy to consume the bread made with higher proportion of rye than wheat after the explanation
that growing wheat is not very eco-efficient on his farm. This farmer, however was not willing to
abandon the production with horses. The farmer expressed the belief that past agricultural systems
were less resource intensive and he saw the production with horses as an important element of his
production system. Such preconceptions and personal preferences of producers may have an effect
on eco-efficiency and are usually ignored in optimization models.
4.1.3 Economic limitations
Although cost-benefit analysis was not performed in the present study, it is evident that some of the
proposed solutions will be associated with certain investment costs. This is especially relevant for
draining the fields or installing anaerobic digestion units. These strategies require relatively high
investment of financial as well as natural capital, since new materials will be used and some
emissions will be caused during the construction process. The need for financial investment may
pose a barrier for some producers. However, the initial investments may also pay off in the long term
– both environmentally as demonstrated in LCA but also financially due to the fact that more money,
resources and emissions may be saved as a result of the installation than consumed during its
construction, maintenance and disposal. In further steps a cost benefit analysis would be needed to
test whether these effects are present.
93
4.2 Benefits of combining integrative approaches and LCA
Mouron et al., (2006a) suggested that eco-efficient orchard management requires cognitive skills and
non-linear thinking. The same principles can be applied to cereal-based cropping systems. The
participation of multiple actors in the design process enriched the pool of knowledge as well as
creativity. The first type of knowledge supplied in the current study was the explicit agronomic
knowledge. Ingram (2008) has shown that farmers in England generally lack scientific knowledge for
sustainable soil management. This knowledge was provided in the present study by experts from
various disciplines of plant science, mainly breeders and agronomists. The second type of necessary
information is the environmental one. This information was supplied by LCA models and knowledge
of environmental scientists. Collado-Ruiz and Ostad-Ahmad-Ghorabi (2010) demonstrated that the
supply of environmental information may have negative effects on creativity in an eco-design
process. Previous attempts of eco-innovation in the food sector however teach us that the absence
of empirical environmental data and reliance on “gut feeling” is not sufficient to develop more eco-
efficient modes of production. In this study, farmers were given the knowledge but were willing to
adapt only one solution generated in the interdisciplinary scientific workshop: namely the switch to a
different crop variety in the case of FR-AL (see differences between Table 11 and Table 12). On the
other hand, they were able to propose many of the improvements themselves during the discussion
over the results of LCA. This suggests that during the design workshop researchers either did not
have sufficient knowledge to appropriately evaluate the situation on farm, or did not take into
account personal preferences of the farmer. On the other hand, the supply of environmental
information allowed farmers to come up with innovative solutions.
5. Conclusions
The present case study of bread has demonstrated, that:
94
Inter-disciplinary, multi-stakeholder approaches can be utilised for improving eco-efficiency
of LICSs.
The lack of innovation, suboptimal management and the lack of access to reliable
environmental information present some of the key factors limiting their eco-efficiency
Systematic, science-based assessment tools, such as Life Cycle Assessment can successfully
be utilised to support the process of agricultural eco-innovation and eco-design.

95
DISCUSSION
96
Contribution of the thesis to the current state of knowledge
The present study has contributed to the existing body of research in several ways:
This is the first systematic evaluation of environmental impacts of products from cereal-
based LICSs at the level of the whole value chain
The previous literature on the environmental impacts of food lacked holistic evaluations of
products from LICSs at the level of the whole supply chain. The great majority of LCA literature in the
agricultural sector has been dedicated to general comparisons between organic and conventional or
other types of farming systems (see (Tuomisto et al., 2012b) for a meta-analysis on this subject) or
the contribution of transport to the environmental impacts of agricultural products, comparing
“local” with “non-local production” (Holmes, 2012). Several recent studies investigated the
relationship between the level of intensity and environmental impacts in wheat cropping systems
(Brentrup et al., 2004, Charles et al., 2006, Nemecek et al., 2011a,b) thus allowing to draw some
conclusions about low-input farming (see Chapter 1). These studies however were based on either
field experiments with modern varieties under mineral fertilisation (Charles et al., 2006, Brentrup et
al., 2004) or modern varieties under mineral and organic fertilisation at the level of 0 or 43 kg N ha-1
a-1 and higher (Nemecek et al., 2011a,b). Up to date, there has been no LCA study investigating eco-
efficiency of old varieties or variety mixtures of wheat that can be found cultivated by European low-
input farmers under the conditions of very limited fertilisation - between 0 and 43 kg N ha-1 a-1. Such
systems are characterised by very low yields. Because they are mixtures, their products can also have
heterogeneous physicochemical properties like density and gluten content. This makes them
inadequate for processing and distribution through the dominant supply chains involving large scale
manufacturers and retailers who demand uniform quality standards. Low-input farmers cultivating
these varieties can be found milling the grains themselves, baking on farm and selling directly to end
consumers. This introduces a number of differences in environmental impacts of their products
compared to conventional supply chains and therefore requires performing the analysis at the whole
97
chain level. Previous studies on bread assessed relationships between the environmental impacts
and a limited number of factors like scale of production (Andersson and Ohlsson, 1999), type of
farming and baking (Bimpeh et al., 2006) or the combination of several of these factors (Braschkat et
al., 2003). This study revealed that isolating single factors for LCA study does not always lead to
meaningful conclusions and instead, environmental evaluations should be done in a holistic manner.
At each stage of the bread life cycle, there is a large variability of environmental impacts between
particular systems. These impacts are highly dependent on a large number of external and internal
factors; from pedo-climatic conditions of the farm through the choice of cultivars, crop rotations and
farming methods up to the fuel use for baking, distance to the consumer and the electricity mix of
the country in which the farm is located. It is impossible to make general recommendations over the
environmental superiority of one system over another based on a limited number of factors, such as
the type of fertiliser used (mineral or organic), level of crop or genetic diversity (diversified systems
versus monocultures), distance to the consumer (local or non-local) or the yield. Systems modelling
revealed that significant improvements in eco-efficiency can be achieved with LCA while maintaining
distinctive product properties: old varieties, low-input farming, on-farm processing, farming with
horses or direct contact between the producer and consumer. The main factor limiting eco-efficiency
of analysed supply chains was the lack of innovation and knowledge on the contribution of different
processes to the overall environmental impact and opportunities for improvements (for example it
was unknown that environmental improvement can be achieved through increasing the proportion
of rye in the bread recipe).
Insight on the use of eco-efficiency to assess performance of LICSs
Several authors suggested that product- based LCAs and studies looking at the efficiency of
agricultural systems are generally supporting intensive systems with higher material throughput
(high input- high output) and such systems cause a number of local environmental problems
(Garnett, 2013, van der Werf et al., 2007) . This study revealed, that it is not necessarily always the
98
case. At the agricultural stage, the low-input integrated bread and meat producer from France and
small-scale labour-intensive producer from Portugal showed better performance on most of the
impact categories than their high-input counterparts. This suggests that low-input systems can also
be efficient with their proper organisation. The possible reason why high-input systems are usually
performing better in product LCAs than low-input systems might lay in the high level of knowledge
required for the efficient organisation of LICSs. Designing them requires finding the right balance
between numerous elements of their architecture. Crops, their varieties and their mixtures need to
be carefully selected to maintain high levels of productivity and provide resistance to specific pests
and diseases. Cover crops need to be sown and harvested at the right time in order to provide
enough nitrogen to the subsequent crops and at the same time not take too much of the agricultural
land over time out of production. Animal manures are rich in nutrients, but the nitrogen availability
and uptake is limited as compared to mineral, water soluble fertilisers thus increasing the risk of
nitrate leaching and ammonia emissions. Many farmers may not have sufficient knowledge to
manage LICSs efficiently.
First application of LCA and integrative design for improving agricultural systems
To date, academic literature lacked practical examples of using principles of integrative design and
LCA to develop more sustainable agricultural systems. Terms “whole system design” or “integrative
design” stem from the field of industrial design and examples of practical applications include more
sustainable buildings (Reed, 2009, Lovins, 2010), industrial systems (Stasinopoulos et al., 2009,
Lovins, 2010) or vehicles (Lovins, 2010, Charnley et al., 2011). Partidário et al. (2007) used multi-
stakeholder approach to develop sustainable food supply system for people with reduced access to
food. A multi-criteria assessment has showed that the new solution allowed to improve
environmental, economic and social impacts. The process however was focused on optimising post-
agricultural stages, mainly food preparation and distribution, while agriculture is responsible for the
largest share of environmental impacts of foods. The present study demonstrated that in the case of
99
bread, this ranges between 10 % and 60% for most of the impact categories such as non-renewable
resource use, GWP and human toxicity and up to 90-100% for eutrophication potential, eco-toxicity
and land occupation. The contribution of agriculture is even greater for products of animal origin. For
beef, 80% and more of all the environmental impacts is concentrated at the agricultural stage, even
with consideration of shipping the meat between continents (Mieleitner et al., 2012, Audsley et al.,
2009).
General discussion
In this sub-chapter, main advantages, disadvantages and controversies surrounding all of the
methods applied in the study are discussed.
Eco-efficiency and the rebound effect
The concept of eco-efficiency has been criticised as insufficient to provide sustainability
improvements. Eco-efficiency is about achieving “more with less”. Critics argue that this distracts
public attention from the main challenge which is the absolute reduction of anthropogenic
environmental burdens. Due to the fact that so-called double win (reduction in the environmental
impacts and the increase in profitability) or triple win situations (including improvements of social
aspects) can be demonstrated with eco-efficiency the issue of “rebound effect” is often raised
(Garnett, 2013). Rebound effect is a term that has initially been used in the field of Energy economics
(Druckman et al., 2011) but has now been extended to the broader discussion about the
environmental impacts of production and consumption systems (Hertwich, 2005). Weidema et al.
(2008) broadly defined rebound effect as a situation, where changes in the production system imply
liberation or binding of a scarce consumption or production factor: money, time, space or
technology. These effects were considered in their input-output LCA model quantifying improvement
options across the meat and dairy sector in the EU (Weidema et al., 2008). According to this
definition, some rebound effects were also considered in the present study, for example by
100
considering the need for additional import of feedstuff in improvement scenario of FR-ICL in Chapter
3. Hereby I would like to discuss more narrow but very common understanding of rebound effect,
implying that marginal cost savings from improvements in efficiency provide incentive to the overall
expansion of activity and increased number of units that are produced and consumed. This at the
end may lead to the offset of savings- “rebounds”, or even increases of environmental impacts -
“backfire effect”. It has been suggested that if the food gets cheaper through the use of more
efficient technology, people will consume more of it (Bundgaard et al., 2012) or spend their spare
money on other, potentially more resource depleting activities, such as flying for overseas holidays.
Such extrapolation of rebound effects from the field of energy economics to agricultural systems is
oversimplified. Hertwich (2005) pointed out two significant differences between energy economics
and industrial ecology with respect to consideration of rebound effects. The first is that improving
eco-efficiency, unlike energy efficiency, will not always be coupled with savings of costs. This issue is
even more relevant in agriculture than in industry, since unlike industry, farmers currently do not
have to pay fees for causing emissions. Secondly, Hertwich (2005) suggested that reduction of cost
for products that provide the same function but are relatively more eco-efficient may lead to so-
called positive spillover effects instead of rebounds. Because of lower price, consumers can choose
environmentally friendly food product, such as more eco-efficient bread, instead of its more resource
intensive alternative rather than buying more of it. The result would then be the overall reduction of
environmental impacts. The possible rebound effect that may occur in this situation is an economic
one. The money spared by spending less on food over a long period of time will be either put to a
bank as savings or used to purchase another good or service. This other good or service can be more
or less resource depleting. If we consider the correlation between economic growth and
environmental burdens (what is a matter of controversy), we will indeed have some rebound effect.
However, as mentioned in the introduction, food and agriculture in industrialised countries is among
the most resource depleting (Tukker et. al. 2006) and least profitable (World Bank, 2013) sectors of
the economy. It is therefore reasonable to suggest, that spending the same, fixed amount of money
101
on anything other than food will be associated with lower environmental impacts. To illustrate this
with an example: the spared money from cheaper and more eco-efficient bread can be used to pay
for overseas holiday. However, it takes a lot of cheaper and more eco-efficient breads before one can
save up enough money for holiday. Therefore, the extent of spared emissions through all substituted
breads will be greater than released emissions during the flight for holiday that was bought for
spared money.
Limitations of product based LCA and approaches to tackling them
There are several challenges in using product LCA in the process of designing more eco-efficient
agricultural systems.
The issue of multi-functionality
Besides products, agricultural systems deliver a range of other services for the society. These co-
functions are dependent on the region of the world where the production is located. In Brazil for
example, there has been a rapid increase in export-oriented agricultural production over the last 15
years (FAOSTAT, 2013). The expansion of agricultural land for cattle ranching and soybean cultivation
led to the conversion of rainforests, releasing vast amounts of carbon and threatening habitats rich in
biodiversity (Santilli et al., 2005). Production of commodities and contribution to the economic
growth are two functions clearly dominating here. There will also be a mostly negative impact on
biodiversity, since clear-cutting of forests is threatening the habitats of many endangered species. In
Europe, the situation is different. Agricultural lands have been embedded in rural landscapes for
several centuries and currently there is no further expansion of agricultural land (FAOSTAT, 2013).
Changes in the production here are related more to the changes in the intensity of farming rather
than to the changes in the agricultural area. Biodiversity evolved here over the centuries together
with agriculture and today, many rare species of plants and animals are dependent on agricultural
landscapes. Agricultural systems are also integral part of the landscape, providing aesthetic
102
pleasures of mountain grasslands in Switzerland or stone walls and hedgerows in the United
Kingdom. The product LCA approach that has been applied in this study does not capture some of
the positive co-functions of agricultural systems. This may appear as a risk of losing them while
implementing design solutions targeted at improving eco- efficiency. The problem of multi-
functionality has been dealt with to some degree in the previous studies in several ways:
o Using multiple functional units
Using multiple functional units (FU) has been the most widely used approach to multi-functionality in
agricultural LCAs. In cropping systems, the area-based functional unit has been the most frequent
one in use in addition to product-based FU (Haas et al., 2001, Basset-Mens and Van Der Werf, 2005,
Charles et al., 2006, Mouron et al., 2006b, Hayashi, 2006, Nemecek et al., 2011a,b). Several studies
considered even more FU, adding financial approach based on the farm gross margin (Cerutti et al.,
2013, Nemecek et al., 2011a,b), nutrition-based FU based on the protein content in grains (Charles et
al., 2006) or MJ of produced digestible energy (Hersener et al., 2011). Consideration of multiple FU
can provide detailed information on the extent of environmental impacts related to each one of the
analysed functions: maintaining agricultural land (area-based FU), income generation for the farmer
(financial FU) or satisfaction of nutritional needs (nutrition-based FU). This makes multifunctional LCA
a viable approach to provide policymakers with detailed information on all potential benefits and
drawbacks of a particular farming system or technology for different stakeholder groups.
Multifunctional LCA however presents some drawbacks from the eco-design perspective. One of
them is the difficulty in the interpretation of results. The results of product-based LCA and area-
based LCA are often presented together. Without the detailed knowledge, these two approaches can
then be understood as complementary and of equal value. Such reasoning can lead to the wrong
decision, for example if weighting factors are applied to make the final choice of one solution over
the other (Hayashi, 2013). Product-based LCA covers exactly the same level of inputs and outputs as
the area-based LCA with the difference that in the area-based LCA the productivity of the cropping
103
system is not factored in. This FU has therefore no relevance to eco-efficiency. None of the
previously mentioned FU allows capturing all of the ecosystem services. Reducing impacts per area
does not necessarily have to contribute to improving the landscape, increasing biodiversity, or
providing other ecosystem services.
o Considering additional Life Cycle Impact Assessment categories
Some of the ecosystem services provided by agriculture can be factored in through the extension of
the analysis into the additional impact categories. One of such impact categories is biodiversity.
Several studies have included biodiversity as an impact category in LCA (Tuomisto et al., 2012c,
Nemecek et al., 2011a,b) although the applied approaches differ. Current methods applied for
biodiversity in agricultural LCA at the mid-point level can be divided into two categories i.) land use
based assessments and ii.) farming systems based assessments. Both of these have some major
drawbacks that need to be addressed in the future. Land use based approaches use characterisation
factors across different forms of land use thus assessing trade-offs between the quantity and quality
of land use and subsequent effects on biodiversity. This approach has been used by (Tuomisto et al.,
2012c) who compared impacts on biodiversity between contrasting farming systems in the UK. It was
assumed that lower yielding farming systems will require more land that otherwise would be used
for woodlands and the biodiversity score was calculated based on the change in the vascular plant
species between the agriculture and the woodland, using Potentially Disappeared Fraction of species
(PDF) values from De Schryver et al. (2010). This approach is limited, since as mentioned already in
Chapter 2, there is no evidence of agriculturally caused deforestation in Europe and the direct
relationship between reducing production in Europe and deforestation in other parts of the globe
remains unclear. On the other hand, this method does not take into account the influence of farm
management on farmland biodiversity, the type of biodiversity that is depending on agricultural
landscapes. Jeanneret et al. (2007) developed a method allowing to evaluate the effects of farm
management operations on farmland biodiversity. The method is based on 11 indicator species
104
groups among plants, birds, mammals, amphibians, molluscs, spiders, ground beetles, bees and
grasshoppers. Characterisation of impact is based on a scoring system related to the reaction of
particular specie to a particular agricultural activity. This is followed by aggregation of all processes
and species and normalisation resulting in relative biodiversity scores – the maximum score being a
cropping system with the maximum benefit and lowest harm to biodiversity. This approach allows
considering a variety of on-farm biodiversity, but it doesn’t take into account the relationship
between farmland and other parts of the landscape, for example lakes and forests. It also does not
cover genetic biodiversity in the case of farms cultivating rare cultivars of crops or preserving rare
breeds of animals or biodiversity of soil biota. The approach is also country-specific and its extension
to other parts of the world would require collection of vast amount of data on species and their
sensitivities to farming operations. Despite biodiversity, there is a range of other ecosystem services.
Maintenance of soil quality has been incorporated as additional impact category in some of the
cropping system LCAs (Oberholzer et al., 2012, Cowell and Clift, 2000, Garrigues et al., 2012).
Reisner et al. (2002) developed an approach allowing to assess the impact of various farming systems
in Switzerland on landscape quality. Future developments in LCA should continue developing and
regionalisation of these methods. Consideration of additional impact categories at the mid-point
level reduces the risk of improving eco-efficiency at the expense of ecosystem services. However, the
multitude of mid-point indicators increases data requirements and adds complexity to the decision-
making process due to the possible trade-offs between various life cycle impact categories.
o Economic valuation of ecosystem services
The incorporation of the wide range of ecosystem services as a co-function of agricultural systems
can be achieved through coupling of environmental economics and LCA. Chatterton et al. (2012)
used economic valuation of ecosystem services to estimate the value of livestock sector in the UK
taking into account the provisioning services (production of meat, milk, eggs and employment),
regulatory services (mainly costs in the form of emissions to the environment) and cultural services
105
(landscape, biodiversity conservation and recreation). The study revealed that although the majority
of livestock sector value is generated through provisioning services (£5337 million), the cultural
services are also important with their value estimated at £748 million. These results could be
downscaled from the national level to the farm or product level. De Boer (2012) used a similar
approach, using economic allocation based on Common Agricultural Policy payments to subtract the
value of ecosystem services from the environmental impact of animal products. Economic valuation
may allow for easier communication to stakeholders than standard end-point indicators since all the
results are expressed in monetary values and not abstract units such as eco-points. Its limitation
however is that it introduces some subjectivity as different stakeholders may assign different values
to different ecosystem services. For example, the model of Chatterton (2012) considered two
situations while accounting for services related to employment: i.) as a positive contribution since
generation of jobs will have positive effects on the economy and ii.) as a cost since the necessity to
pay the labour presents a burden for the producer. These two considerations had significant effect
on the estimation of the value of provisioning services. This does not present a problem in case of
estimating the relative contribution of different systems to the overall benefits of livestock sector for
the whole country and when all the assumptions and their effects are clearly described and tested in
a sensitivity analysis such as in the case of Chatterton’s study (2012). However, when going to the
product level, exclusion of the portion of impacts for ecosystem services becomes problematic. The
model of de Boer (2012) makes an assumption that CAP payments accurately reflect the provision of
ecosystem services. Based on this, allocation factor for ecosystem services is derived. This was up to
46% in the presented study for grazing livestock system, meaning that up to 46% of all impacts will
be excluded from the study scope and allocated to ecosystem services. Depending on the interest of
stakeholder, such exclusions may be accused of “greenwashing”. Economic valuation adds additional
uncertainty to the results of LCA models.
106
o Ecosystem services in the present study
The potential risk of losing ecosystem services was evaluated in this study in the process of
generating improvement scenarios. As a result, only careful improvement measures were proposed
so that there is a very little to no risk of damage to ecosystem services or other cultural values that
were not considered in LCA models. Farmers were left to conserve genetic diversity in the fields
through the cultivation of landraces and mixtures of cultivars. No changes in the vegetation or
management was considered that could have potentially negative effects on biodiversity. The farmer
using draught horses was left in the scenario using them, so that there is no loss of cultural co-
functions. As impact assessment methods evolve in the future to consider broader range of
ecosystem services, there will be a bigger scope for the development of improvement scenarios
without the risk of losing these services.
The issue of uncertainty
Critics of Life Cycle Assessment point out that its results are associated with a high level of
uncertainty. However, it is not always recognised that conclusions follow the completeness check,
sensitivity check and consistency check, all three to ensure that conclusions remain independent of
uncertainties (ISO, 2006b). In this sub-chapter, I will describe the sources of uncertainty that are
specific to agricultural LCA, their influence on the process of eco-design in this study and possible
approaches to quantifying and tackling them.
o Input data uncertainty
The first source of uncertainty comes from the fact that data for agricultural LCAs are commonly
collected from human subjects and therefore are subjected to bias and may not accurately reflect
the situation on farm. Depending on the time spent for data collection; the information given by the
farmer can have different degrees of accuracy. It is not possible to completely avoid this type of
uncertainty, but it is possible to take precautions. In this study, the interviewees were assured over
107
the anonymity of provided information, so that there was no incentive for providing the false
statements. Interviewees can also make mistakes, so the datasets were validated against results
from other farms and studies. Uncertainty was also reduced through prioritisation of data collection
towards the most relevant sources of information from the LCA perspective. The success of such
prioritisation process will be dependent on the previous experience of LCA practitioner, since it is not
always obvious which type of information is most relevant for which type of farms and their
products. It would be useful if industry or governmental institutes determined the guidelines for on-
farm data collection in agricultural LCAs, allowing data collection according to the level of their
importance for final results.
o Database uncertainty
Database uncertainty can be described as uncertainty arising from the difference between the mean
value in the database of life cycle inventories to the actual situation. This type of uncertainty can be
quantified with the use of Monte Carlo methods that are based on repeated random sampling of
input variables from a range of assumed probability distributions and running the model. Table 13
shows values derived from uncertainty analysis for wheat from the farm FR-ICL for selected impact
categories. The result was derived from 1000 random sampling runs in the software Simapro. Result
for aquatic eutrophication and the use of phosphorus are characterised by relatively high coefficient
of variation (CV) compared to the other impact categories. This indicates a higher extent of variability
of results for these impact categories, therefore higher uncertainty of results for these impact
categories, but has nothing to do with significance. Significance of differences in results can be dealt
with to some extent by repeated comparisons of two systems and counting the number of
occurrences when the result A was lower or higher than B. If in 90 % or 95 % of Monte Carlo runs the
result is favourable for the same product, the result can be considered significant. Table 14 shows
results of such uncertainty analysis conducted with the use of Simapro for bread from the farm FR 1
and the final improvement scenarios. Following previous principles, these results indicate that the
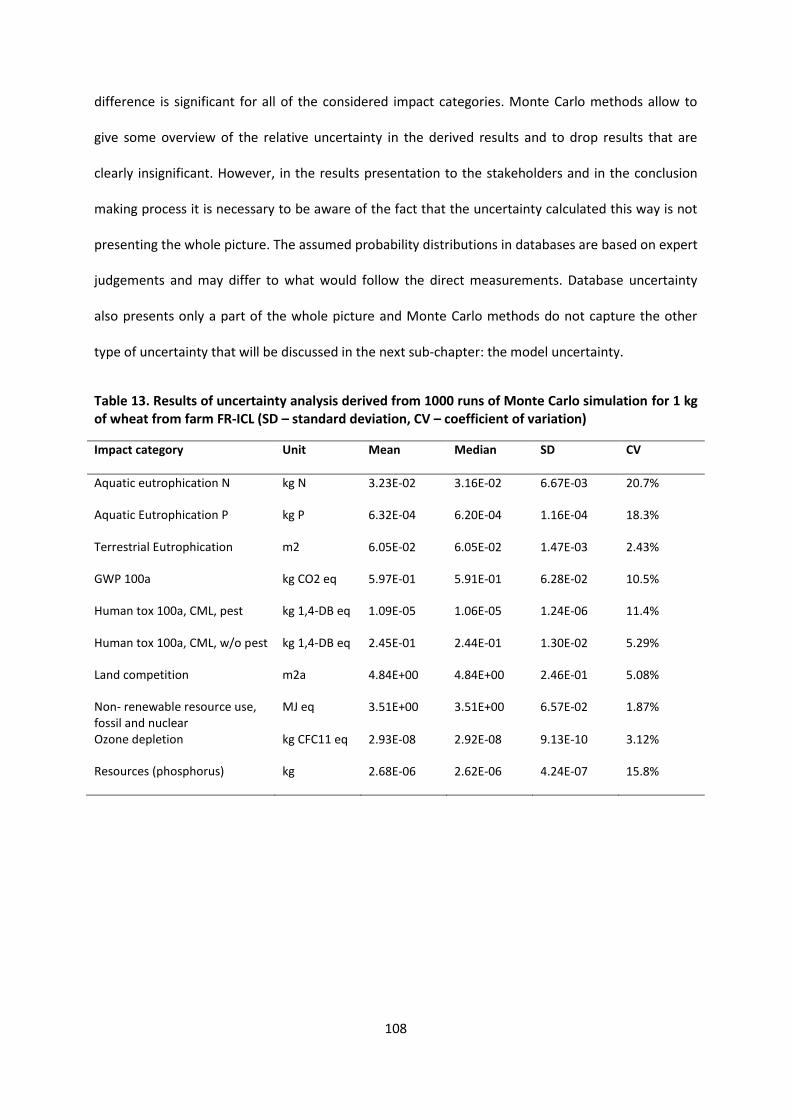
108
difference is significant for all of the considered impact categories. Monte Carlo methods allow to
give some overview of the relative uncertainty in the derived results and to drop results that are
clearly insignificant. However, in the results presentation to the stakeholders and in the conclusion
making process it is necessary to be aware of the fact that the uncertainty calculated this way is not
presenting the whole picture. The assumed probability distributions in databases are based on expert
judgements and may differ to what would follow the direct measurements. Database uncertainty
also presents only a part of the whole picture and Monte Carlo methods do not capture the other
type of uncertainty that will be discussed in the next sub-chapter: the model uncertainty.
Table 13. Results of uncertainty analysis derived from 1000 runs of Monte Carlo simulation for 1 kg of wheat from farm FR-ICL (SD – standard deviation, CV – coefficient of variation)
Impact category Unit Mean Median SD CV
Aquatic eutrophication N kg N 3.23E-02 3.16E-02 6.67E-03 20.7%
Aquatic Eutrophication P kg P 6.32E-04 6.20E-04 1.16E-04 18.3%
Terrestrial Eutrophication m2 6.05E-02 6.05E-02 1.47E-03 2.43%
GWP 100a kg CO2 eq 5.97E-01 5.91E-01 6.28E-02 10.5%
Human tox 100a, CML, pest kg 1,4-DB eq 1.09E-05 1.06E-05 1.24E-06 11.4%
Human tox 100a, CML, w/o pest kg 1,4-DB eq 2.45E-01 2.44E-01 1.30E-02 5.29%
Land competition m2a 4.84E+00 4.84E+00 2.46E-01 5.08%
Non- renewable resource use, fossil and nuclear
MJ eq 3.51E+00 3.51E+00 6.57E-02 1.87%
Ozone depletion kg CFC11 eq 2.93E-08 2.92E-08 9.13E-10 3.12%
Resources (phosphorus) kg 2.68E-06 2.62E-06 4.24E-07 15.8%
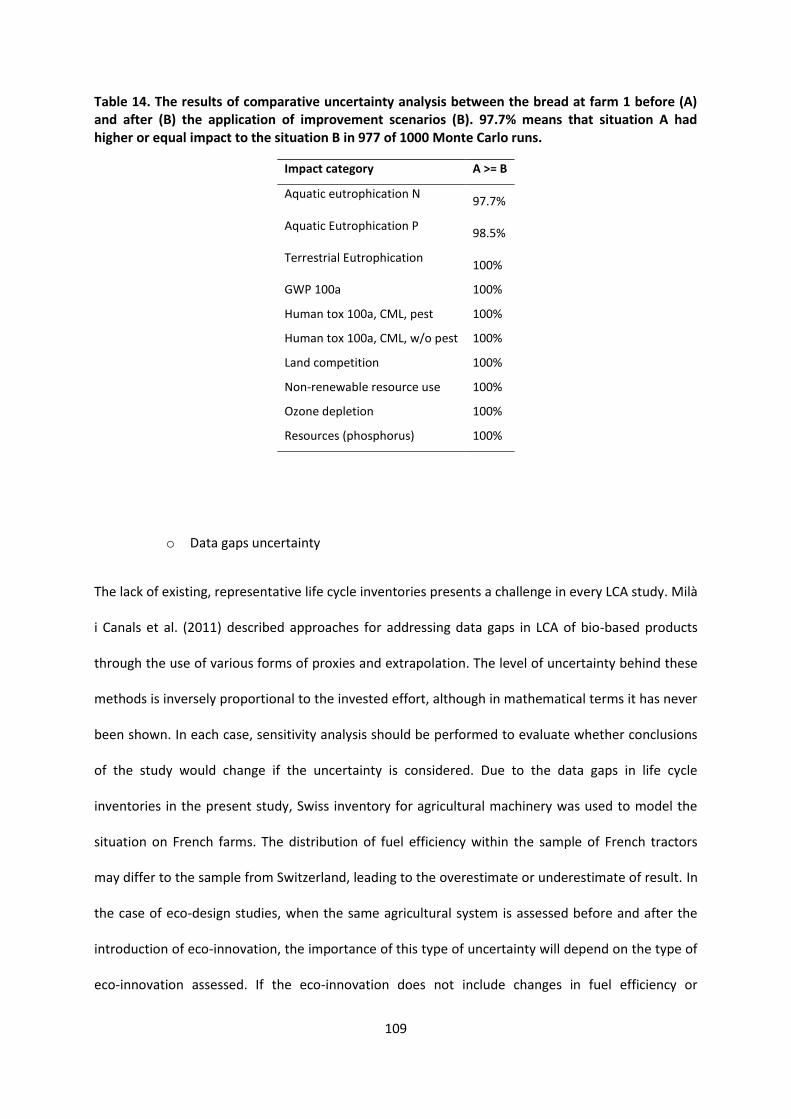
109
Table 14. The results of comparative uncertainty analysis between the bread at farm 1 before (A) and after (B) the application of improvement scenarios (B). 97.7% means that situation A had higher or equal impact to the situation B in 977 of 1000 Monte Carlo runs.
Impact category A >= B
Aquatic eutrophication N 97.7%
Aquatic Eutrophication P 98.5%
Terrestrial Eutrophication 100%
GWP 100a 100%
Human tox 100a, CML, pest 100%
Human tox 100a, CML, w/o pest 100%
Land competition 100%
Non-renewable resource use 100%
Ozone depletion 100%
Resources (phosphorus) 100%
o Data gaps uncertainty
The lack of existing, representative life cycle inventories presents a challenge in every LCA study. Milà
i Canals et al. (2011) described approaches for addressing data gaps in LCA of bio-based products
through the use of various forms of proxies and extrapolation. The level of uncertainty behind these
methods is inversely proportional to the invested effort, although in mathematical terms it has never
been shown. In each case, sensitivity analysis should be performed to evaluate whether conclusions
of the study would change if the uncertainty is considered. Due to the data gaps in life cycle
inventories in the present study, Swiss inventory for agricultural machinery was used to model the
situation on French farms. The distribution of fuel efficiency within the sample of French tractors
may differ to the sample from Switzerland, leading to the overestimate or underestimate of result. In
the case of eco-design studies, when the same agricultural system is assessed before and after the
introduction of eco-innovation, the importance of this type of uncertainty will depend on the type of
eco-innovation assessed. If the eco-innovation does not include changes in fuel efficiency or
110
frequency of farming operations, this uncertainty can be considered insignificant. Even though the
absolute result may be overestimated or underestimated due to the fact that Swiss inventory was
used instead of the French one, the relative ranking of eco-efficiency (before and after the
improvement) remains the same. If the improvement in eco-efficiency involves the fuel use, then the
result of comparable LCA will overestimate or underestimate the real improvement. In this case,
conservative values should be used that will underestimate the degree of tested improvement option
rather than those that will overestimate it. This was the approach applied in the present study.
Improvement scenarios did not include changes in the frequency of farming operations per ha, but
did include changes in the yield and therefore conservative choices were made in modelling yield
improvement scenarios. This type of model uncertainty should be tackled in the eco-design study
through the use of sensitivity analysis. All uncertain methodological choices during the model
construction should be tested over their capacity to influence the study conclusions and only
conclusions that are independent of model uncertainty should be reported. The study in Chapter 3 of
this thesis includes an illustrative example. LCA results revealed potential improvement of 85% in the
phosphorus use in FR-AL (Fig. 11.), but this result was not reported in the conclusions of Chapter 3.
This was due to the dependency of the value on data gaps uncertainty. The large reduction of
phosphorus use was caused largely by the reduction in the amount of hay imported to the farm,
which had a high embodied phosphorus impact. Through the interview with the farmer, an
information was gathered over the quantity of imported hay and the fact that it comes from organic
producer. The details on farming practices of the hay supplier, in particular quantities and forms of
applied phosphorus, were unknown. The inventory used for modelling environmental impacts of
imported hay was taken from ecoinvent database and was based on the representative data sample
of organic hay producers in Switzerland. The subsequent sensitivity analysis revealed, that if this
inventory was changed to the hay coming from extensive production in Switzerland, results would
change as the hay from extensive production is associated with significantly less phosphorus use
111
impact per t product. In this case, the improvement scenarios would produce much lower reduction
in phosphorus use, the conclusion over the large phosphorus reduction therefore cannot be drawn.
o Model uncertainty
Some unquantified uncertainty is also embedded in numerous models that are used to describe
biophysical processes in LCA. Nitrous oxide emissions were determined in this study based on the
revised IPCC guidelines (IPCC, 2006). The current version of these guidelines suggests using 1%
emission factor for agricultural fertilisers, meaning that for every tonne of nitrogen applied to the soil
10 kg will be released as nitrous oxide. To this, indirect emissions are added due to potential nitrate
leaching, run-off and nitrogen deposition. The new guidelines suggest uncertainty range of emission
factor from 0.003-0.03. However, it is difficult to quantify the factual uncertainty in these estimates.
Large-scale biogeochemical processes, such as climate change, cannot be replicated many times to
quantify the uncertainty range. The emission factors are constantly being revised, based on new
scientific evidence of interactions between elements of environment and the new data coming from
measurements in increasingly larger geographical areas. For example, the 2006 IPCC guidelines
removed N from nitrogen fixing crops as N input for nitrous oxide emissions based on the recent
evidence that this type of nitrogen does not lead to direct nitrous oxide emissions. However, it
included consideration of N losses from drained fields and N mineralisation due to the loss of soil
organic matter. The uncertainty of models reduces in time together with the advancements in
science therefore models need to be constantly updated and most recent emission factors should
always be used for the analysis.
Advantages of LCA
Despite its drawbacks, LCA has a lot of advantages. Environmental impacts of cropping systems
cannot be determined “on the go” with the sole use of direct measurements. Selected fluxes of
emissions can be measured on- farm with the use of various methods including chromatography or
112
isotope analysis. However, in order to have the whole picture of environmental impacts, a
simultaneous measurement of all emission fluxes: carbon dioxide, nitrous oxide, methane, ammonia
and heavy metals would be needed. Assuming that all on-farm emissions can be measured directly
(what is practically impossible to achieve), this still does not provide enough information. Design
decisions taken on farm affect numerous upstream and downstream processes in the overall socio-
technical system. This includes resource use and emissions in the production of agricultural inputs,
food processing, food transportation and consumption. In this study, the farmer decision to grow
mixtures of landraces had an effect on the processing. The decision to sell flour rather than finished
bread affected how much energy is used in the baking process. Despite the broad picture, LCA
maintains the scientific rigour of natural sciences. In the present study, economic allocation to divide
impacts between co-products was the only use of non-physical units. All models used to describe
relationships between various elements of nature and technosphere, such as the impact of various
greenhouse gases on climate change over the 100 years’ timeframe, were based on measurable
physical relationships. This is as opposed to some other approaches to sustainability assessment, for
example eMergy assessment that uses theoretical units solar emergy joules (SEJ) based on rough
estimates of processes occurring in nature for millions of years (Odum et al., 2000), the endpoint LCA
method “Ecological scarcity” incorporating political targets into the environmental impact
assessment (Frischknecht et al., 2009) or the previously mentioned combined
environmental/economic approaches for valuing ecosystem services. Staying at the level of mid-
point analysis with physical units can also provide benefits for communication. Environmental
impacts quantified with kilograms of carbon dioxide equivalent, litres of water, kilograms of
phosphorus or square meters of occupied land have the potential to be better understood by
stakeholders without the detailed methodological knowledge, which is not the case with ecopoints
or SEJs.
113
Opportunities for further research
In the course of this study, several research gaps have been identified. Addressing these issues will
provide better understanding of strategies for improving eco-efficiency of cropping systems:
Life Cycle Assessment of strategies for utilising positive synergies between plants: various
forms of inter-cropping, agroforestry and innovative crop rotations with leguminous crops.
These strategies have the potential for improving eco-efficiency, but better understanding of
the effective patterns of their organization is needed.
Further developments of impact assessment methods to include all the environmental
impacts and ecosystem services relevant to cropping systems. In particular, spatially explicit
methods for the assessment of on-farm biodiversity and soil quality are needed.
More representative datasets of life cycle inventories to reduce uncertainty should be
developed. The issues of particular concern for LICSs would be differences in the design and
fuel efficiencies of agricultural machinery across different countries.
To conduct similar studies outside Europe, adaptations are needed in biophysical models
used to estimate field emissions to consider differences in emission factors across various
spatial and temporal scales.
114
Concluding remarks:
This study has demonstrated, that the level of farm-external inputs cannot be used as a
proxy for environmental assessment. Products of LICSs do not necessarily have lower or higher
impacts than their high-input counterparts. Eco-efficient cropping system management requires
application of optimum, instead of minimum or maximum levels of inputs. Whether the input is
produced on farm or off the farm is not important from the product life cycle perspective, but the
actual distance and the mode of transportation can play an important role. Eco-efficiency of cropping
systems is also highly dependent on other components of the cropping system design and can be
improved in various other ways than increasing or reducing the amount of farm-external inputs.
Switching crops, varieties and rotations or installing anaerobic digestion units can potentially
improve eco-efficiency under the low level of inputs, but system-specific evaluations of their effects
are needed. Decisions at the cropping system level can affect further stages in the product life cycle,
such as processing and distribution. The final result of LCA depends on a large number of factors:
from farming operations through the processing, electricity mix of the country of production up to
the way consumers have to organise their shopping. Evaluation at the level of the whole value chain
and in the specific agro-ecological and socio-economic conditions is needed for the fair
environmental assessment of specific cropping systems.
The collaborative eco-design procedure with two producers revealed, that among biophysical
limitations, farmers may suffer from the lack of innovation, suboptimal management and a lack of
access to reliable environmental data. Integrative approaches based on the collaboration of multiple
stakeholders can be very effective for overcoming these barriers. There is a potential for significant
improvements in eco-efficiency within European low-input agriculture, but the transfer of knowledge
and the use of systematic, science-based assessment tools, such as LCA may be needed to support
decision making on farms.
115
REFERENCES:
AKINNIFESI, F. K., AJAYI, O. C., SILESHI, G., CHIRWA, P. W. & CHIANU, J. 2010. Fertiliser trees for sustainable food security in the maize-based production systems of East and Southern Africa. A review. Agronomy for Sustainable Development, 30, 615-629.
ALEXANDRATOS, N. 2009. Proceedings of a Technical Meeting of Experts, How to feed the world in 2050. Rome: FAO.
ALTIERI, M. A. 1995. Agroecology: the science of sustainable agriculture, Westview Press. Boulder, CO.
ALTIERI, M. A. 2004. Linking ecologists and traditional farmers in the search for sustainable agriculture. Frontiers in Ecology and the Environment, 2, 35-42.
ANAROW, B., GREENER, C., GUPTA, V., KINSLEY, M., HENDERSON, J. & PAGE, C. 2003. Environmental Project No.807. Whole-Systems Framework for Sustainable Consumption and Production. Danish Environmental Protection Agency. Danish Ministry of Environment.
ANDERSEN, M. K., HAUGGAARD-NIELSEN, H., AMBUS, P. & JENSEN, E. S. 2004. Biomass production, symbiotic nitrogen fixation and inorganic N use in dual and tri-component annual intercrops. Plant and Soil, 266, 273-287.
ANDERSSON, K. & OHLSSON, T. 1999. Life cycle assessment of bread produced on different scales. The International Journal of Life Cycle Assessment, 4, 25-40.
AOE, T. 2007. Eco-efficiency and ecodesign in electrical and electronic products. Journal of Cleaner Production, 15, 1406-1414.
ASMAN, W. A. H. 1992. Ammonia emission in Europe: updated emission and emission variations. Report. Bilthoven: Dutch National Institute of Public Health and Environmental Protection.
AUDSLEY, E., BRANDERM M., CHATTERTON, J., MURPHY-BOKERN, D., WEBSTER, C. & WILLIAMS, A. 2009. How low can we go? An assessment of greenhouse gas emissions from the UK food system and the scope to reduce them by 2050. London, UK: FCRN-WWF.
AZAD, M. A. & ANCEV, T. 2010. Using ecological indices to measure economic and environmental performance of irrigated agriculture. Ecological Economics, 69, 1731-1739.
BAKER, J. M., OCHSNER, T. E., VENTEREA, R. T. & GRIFFIS, T. J. 2007. Tillage and soil carbon sequestration - What do we really know? Agriculture Ecosystems & Environment, 118, 1-5.
BASSET-MENS, C. & VAN DER WERF, H. M. G. 2005. Scenario-Based Environmental Assessment of Farming Systems: the Case of Pig Production in France. Agriculture Ecosystems & Environment, 105, 127-144.
BAUMERT, K. A., HERZOG, T., AND J PERSHING, J. 2005. Navigating the numbers: Greenhouse gas data and international climate change policy., World Resources Institute.
BAWDEN, R. J., MACADAM, R. D., PACKHAM, R. J. & VALENTINE, I. 1984. Systems thinking and practices in the education of agriculturalists. Agricultural systems, 13, 205-225.
BELTRAN-ESTEVE, M., GOMEZ-LIMON, J. A. & PICAZO-TADEO, A. J. 2012. Assessing the impact of agri-environmental schemes on the eco-efficiency of rain-fed agriculture. Spanish Journal of Agricultural Research, 10, 911-925.
BIMPEH, M., DJOKOTO, E., DOE, H. & JEQUIER, R. 2006. Life Cycle Assessment (LCA) of the Production of Home made and Industrial Bread in Sweden. KTH, Sweden.
BLANCO-CANQUI, H. & LAL, R. 2008. No-tillage and soil-profile carbon sequestration: An on-farm assessment. Soil Science Society of America Journal, 72, 693-701.
BORZĘCKA-WALKER, M., FABER, A., JAROSZ, Z., SYP, A. & PUDEŁKO, R. 2013. Greenhouse gas emissions from rape seed cultivation for FAME production in Poland. Journal of Food, Agriculture & Environment, 11, 1064-1068.
116
BOUCHARD, C., BERNICOT, M. H., FÉLIX, I., GUÉRIN, O., LOYCE, C., OMON, B. & ROLLAND, B. 2008. Associer des itinéraires techniques de niveau d’intrants variés à des variétés rustiques de blé tendre: évaluation économique, environnementale et énergétique. Courrier de l’Environnement de l’INRA, 55, 53-57. In French
BOUMA, J., VAN ALTVORST, A., EWEG, R., SMEETS, P. & VAN LATESTEIJN, H. 2011. 6 The Role of Knowledge When Studying Innovation and the Associated Wicked Sustainability Problems in Agriculture. Advances in agronomy, 113, 283.
BRAND, F. S., SEIDL, R., LE, Q. B., BRANDLE, J. M. & SCHOLZ, R. W. 2013. Constructing Consistent Multiscale Scenarios by Transdisciplinary Processes: the Case of Mountain Regions Facing Global Change. Ecology and Society, 18.
BRASCHKAT, J., PATYK, A., QUIRIN, M. & REINHARDT, G. 2003. Life Cycle Assessment of bread production - a comparison of eight different scenarios. . In: HALBERG, N. (ed.) DIAS Report. Life Cycle Assessment in the Agri-food sector. Proceedings from the 4-th International Conference, October 6-8, 2003. Bygholm, Denmark.
BRENTRUP, F., KÜSTERS, J., LAMMEL, J., BARRACLOUGH, P. & KUHLMANN, H. 2004. Environmental Impact Assessment of Agricultural Production Systems Using the Life Cycle Assessment (Lca) Methodology - II. The Application to N Fertilizer Use in Winter Wheat Production Systems. European Journal of Agronomy, 20, 265-279.
BREZET, H. 1997. Dynamics in ecodesign practice. Industry and Environment, 20, 21-4. BROADBERRY, S. 2009. Agriculture and structural change: lessons from the UK experience in an
international context. In: LAINS, P. & PINILLA, V. (eds.) Agriculture and economic development in Europe since 1870. Oxon: Routledge.
BRUINSMA, J. The resource outlook to 2050: by how much do land, water and crop yields need to increase by 2050? How to feed the World in 2050. Proceedings of a technical meeting of experts, 24-26 June 2009. 2009 Rome, Italy.
BUNDGAARD, A. M., DALGAARD, R., THRANE, M. & PRAPASPONGSA, T. 2012. Assessment of digestibility improving enzymes potential to reduce greenhouse gas emissions in broiler production. In: CORSON, M. S. & VAN DER WERF, H. M. G. (eds.) Proceedings of the 8th International Conference on Life Cycle Assessment in the Agri-Food Sector (LCA Food 2012), 1-4 October 2012,. Saint Malo, France: INRA, Rennes, France.
BUYANOVSKY, G. A. & WAGNER, G. H. 1998. Carbon cycling in cultivated land and its global significance. Global Change Biology, 4, 131-141.
CAMILLO, D. C., JEAN-CHRISTOPHE, B., DAVID, P., BALÁZS, P., CHRISTIAN, B., URS, S., HENRY, K., LARS, L., NICOLAS, M., NICOLE, U., LAURA, D., ØYVIND, V., COEN, B., NATHANIEL, P., HANS, B., RUDI, S., PASCAL, G., HERBERT, A., JEAN-PIERRE, R. & ANNA, P. ENVIFOOD Protocol: launch of the collectively-agreed sectorial methodology for assessing the environmental performance of food and drink products in Europe. 8th Int. Conference on LCA in the Agri-Food Sector, 1-4 Oct 2012 p. 37-40, 2012 St. Malo. INRA.
CARBERRY, P. S., LIANG, W.-L., TWOMLOW, S., HOLZWORTH, D. P., DIMES, J. P., MCCLELLAND, T., HUTH, N. I., CHEN, F., HOCHMAN, Z. & KEATING, B. A. 2013. Scope for improved eco-efficiency varies among diverse cropping systems. Proceedings of the National Academy of Sciences of the United States of America, 110, 8381-8386.
CAROF, M., DE TOURDONNET, S., SAULAS, P., LE FLOCH, D. & ROGER-ESTRADE, J. 2007. Undersowing wheat with different living mulches in a no-till system. I. Yield analysis. Agronomy for Sustainable Development, 27, 347-356.
CASSMAN, K. G. 1999. Ecological intensification of cereal production systems: Yield potential, soil quality, and precision agriculture. Proceedings of the National Academy of Sciences of the United States of America, 96, 5952-5959.
CECCARELLI, S. 1994. Specific adaptation and breeding for marginal conditions. Euphytica, 77, 205-219.
117
CECCARELLI, S., GRANDO, S. & HAMBLIN, J. 1992. Relationship between barley-grain yield measured in low-yielding and high-yielding environments. Euphytica, 64, 49-58.
CERUTTI, A. K., BRUUN, S., DONNO, D., BECCARO, G. L. & BOUNOUS, G. 2013. Environmental sustainability of traditional foods: the case of ancient apple cultivars in Northern Italy assessed by multifunctional LCA. Journal of Cleaner Production, 52, 245-252.
CERUTTI, A. K., CALVO, A. & BRUUN, S. 2014. Comparison of the environmental performance of light mechanization and animal traction using a modular LCA approach. Journal of Cleaner Production, 64, 396-403.
CHAN, K., Y. & XU, Z. 2009. Biochar- Nutrient Properties and Their Enhancement. In: LEHMAN, J. & JOSEPH, S. (eds.) Biochar for Environmental Management. Science and Technology. London: Earthscan.
CHARLES, R., JOLLIET, O., GAILLARD, G. & PELLET, D. 2006. Environmental analysis of intensity level in wheat crop production using life cycle assessment. Agriculture Ecosystems & Environment, 113, 216-225.
CHARNLEY, F., LEMON, M. & EVANS, S. 2011. Exploring the process of whole system design. Design Studies, 32, 156-179.
CHATTERTON, J., AUDSLEY, E., GRAVES, A., MORRIS, J. & WILLIAMS, A. 2012. Using systems-based LCA to investigate the environmental and economic impacts and benefits of the livestock sector in the UK. In: CORSON, M. S. & VAN DER WERF, H. M. G. (eds.) Proceedings of the 8th International Conference on Life Cycle Assessment in the Agri-Food Sector (LCA Food 2012), 1-4 October 2012,. Saint-Malo, France: INRA - Rennes, France.
CHEN, S. Y., PORTER, P. M., REESE, C. D. & STIENSTRA, W. C. 2001. Crop sequence effects on soybean cyst nematode and soybean and corn yields. Crop Science, 41, 1843-1849.
COLLADO-RUIZ, D. & OSTAD-AHMAD-GHORABI, H. 2010. Influence of environmental information on creativity. Design Studies, 31, 479-498.
CONANT, R. T., PAUSTIAN, K., DEL GROSSO, S. J. & PARTON, W. J. 2005. Nitrogen pools and fluxes in grassland soils sequestering carbon. Nutrient Cycling in Agroecosystems, 71, 239-248.
COOK, R. J., SCHILLINGER, W. F. & CHRISTENSEN, N. W. 2002. Rhizoctonia root rot and take-all of wheat in diverse direct-seed spring cropping systems. Canadian Journal of Plant Pathology-Revue Canadienne De Phytopathologie, 24, 349-358.
CORDELL, D., DRANGERT, J. O. & WHITE, S. 2009. The story of phosphorus: Global food security and food for thought. Global Environmental Change-Human and Policy Dimensions, 19, 292-305.
CORSON, M. S. & VAN DER WERF, H. M. G. Book of Abstracts of the 8th International Conference on Life Cycle Assessment in the Agri-Food Sector (LCA Food 2012), . In: CORSON, M. S. & VAN DER WERF, H. M. G., eds., 1-4 October 2012 2012 Saint Malo, France. INRA, Rennes.
COWELL, S. J. & CLIFT, R. 2000. A methodology for assessing soil quantity and quality in life cycle assessment. Journal of Cleaner Production, 8, 321-331.
CRANFIELD UNIVERSITY. 2006. Agri-LCI model [Online]. Available: http://www.cranfield.ac.uk/sas/cerf/lca.html [Accessed 27 February 2014].
CROOKSTON, R. K., KURLE, J. E., COPELAND, P. J., FORD, J. H. & LUESCHEN, W. E. 1991. ROTATIONAL CROPPING SEQUENCE AFFECTS YIELD OF CORN AND SOYBEAN. Agronomy Journal, 83, 108-113.
D'HOSE, T., COUGNON, M., DE VLIEGHER, A., WILLEKENS, K., VAN BOCKSTAELE, E. & REHEUL, D. 2012. Farm Compost Application: Effects on Crop Performance. Compost Science & Utilization, 20, 49-56.
DANSO, S. K. A., BOWEN, G. D. & SANGINGA, N. 1992. Biological nitrogen fixation in trees in agroecosystems. Plant and Soil, 141, 177-196.
DE BOER, I. J. M. Accounting for multi-functionality of livestock in environmental impact assessments of livestock products. 6. Ökobilanz-Platform Landwirtschaft: Ökologische Bewertung von Fleisch, 13 September 2012 2012 Zurich, Switzerland. In German.
118
DE JONGE, A. M. 2004. Eco-efficiency improvement of a crop protection product: the perspective of the crop protection industry. Crop Protection, 23, 1177-1186.
DE SCHRYVER, A. M., GOEDKOOP, M. J., LEUVEN, R. S. & HUIJBREGTS, M. A. 2010. Uncertainties in the application of the species area relationship for characterisation factors of land occupation in life cycle assessment. The International Journal of Life Cycle Assessment, 15, 682-691.
DEMEULENAERE, É. & BONNEUIL, C. 2010. Cultiver la biodiversité. Semences et identité paysanne. Les mondes agricoles en politique. De la fin des paysans au retour de la question agricole, 73-92. In French.
DORE, T., MAKOWSKI, D., MALEZIEUX, E., MUNIER-JOLAIN, N., TCHAMITCHIAN, M. & TITTONELL, P. 2011. Facing up to the paradigm of ecological intensification in agronomy: Revisiting methods, concepts and knowledge. European Journal of Agronomy, 34, 197-210.
DOUXCHAMPS, S., RAO, I. M., PETERS, M., VAN DER HOEK, R., SCHMIDT, A., MARTENS, S., POLANIA, J., MENA, M., BINDER, C. R., SCHÖLL, R., QUINTERO, M., KREUZER, M., FROSSARD, E. & OBERSON, A. 2013. Farm-Scale Tradeoffs Between Legume Use as Forage versus Green Manure: The Case of Canavalia brasiliensis. Agroecology and Sustainable Food Systems, 38, 25-45.
DRUCKMAN, A., CHITNIS, M., SORRELL, S. & JACKSON, T. 2011. Missing carbon reductions? Exploring rebound and backfire effects in UK households. Energy Policy, 39, 3572-3581.
DUPRAZ, C. 1998. Adequate design of control treatments in long term agroforestry experiments with multiple objectives. Agroforestry Systems, 43, 35-48.
DUTILH, C. 1998. Unilever. Managing a Material World: Perspectives in Industrial Ecology.: Springer. EDWARDS-JONES, G., CANALS, L. M. I., HOUNSOME, N., TRUNINGER, M., KOERBER, G., HOUNSOME,
B., CROSS, P., YORK, E. H., HOSPIDO, A., PLASSMANN, K., HARRIS, I. M., EDWARDS, R. T., DAY, G. A. S., TOMOS, A. D., COWELL, S. J. & JONES, D. L. 2008. Testing the assertion that 'local food is best': the challenges of an evidence-based approach. Trends in Food Science & Technology, 19, 265-274.
EDWARDS, C. A. 1989. The importance of integration in sustainable agricultural systems. Agriculture, Ecosystems & Environment, 27, 25-35.
EEA 2005. Agriculture and environment in EU-15 – the IRENA indicator report. Copenhagen: European Environment Agency.
EICHHORN, M. P., PARIS, P., HERZOG, F., INCOLL, L. D., LIAGRE, F., MANTZANAS, K., MAYUS, M., MORENO, G., PAPANASTASIS, V. P., PILBEAM, D. J., PISANELLI, A. & DUPRAZ, C. 2006. Silvoarable systems in europe - past, present and future prospects. Agroforestry Systems, 67, 29-50.
ELKINGTON, J. 1998. Cannibals with forks. The triple bottom line of 21st century, Canada, New Society publishers.
ELZEN, B. & WIECZOREK, A. 2005. Transitions towards sustainability through system innovation. Technological Forecasting and Social Change, 72, 651-661.
ESPINOZA-ORIAS, N., STICHNOTHE, H. & AZAPAGIC, A. 2011. The carbon footprint of bread. International Journal of Life Cycle Assessment, 16, 351-365.
EUROPEAN COMMISION 2013. Rural Development in the European Union. Statistical and Economic Information. Report 2013. Brussels: European Commission Directorate-General for Agriculture and Rural Development.
EUROSTAT. 2013. Statistics database. [Online]. Luxembourg: Directorate-General of the European Commission. Available: http://epp.eurostat.ec.europa.eu/portal/page/portal/eurostat/home/ [Accessed 27 February 2014].
FAO 2011. Save and grow. A policymaker's guide to the sustainable intensification of smallholder crop production, Rome, FAO.
119
FAOSTAT. 2013. Statistical Database of the Food and Agriculture Organization of the United Nations [Online]. Available: http://faostat.fao.org/ [Accessed 27 February 2014].
FESS, T., L., KOTCON, J., B. & BENEDITO, A. 2011. Crop breeding for Low Input Agriculture: A Sustainable Response to Feed a Growing Population. Sustainability, 3, 1742-1772.
FINNVEDEN, G. & MOBERG, A. 2005. Environmental systems analysis tools - an overview. Journal of Cleaner Production, 13, 1165-1173.
FINNVEDEN, G. R., HAUSCHILD, M. Z., EKVALL, T., GUINÉE, J., HEIJUNGS, R., HELLWEG, S., KOEHLER, A., PENNINGTON, D. & SUH, S. 2009. Recent developments in Life Cycle Assessment. Journal of Environmental Management, 91, 1-21.
FLAVELL, R. 2010. Knowledge and technologies for sustainable intensification of food production. New Biotechnology, 27, 505-516.
FOLEY, J. A., RAMANKUTTY, N., BRAUMAN, K. A., CASSIDY, E. S., GERBER, J. S., JOHNSTON, M., MUELLER, N. D., O'CONNELL, C., RAY, D. K., WEST, P. C., BALZER, C., BENNETT, E. M., CARPENTER, S. R., HILL, J., MONFREDA, C., POLASKY, S., ROCKSTROM, J., SHEEHAN, J., SIEBERT, S., TILMAN, D. & ZAKS, D. P. M. 2011. Solutions for a cultivated planet. Nature, 478, 337-342.
FREIERMUTH, R. 2006. Modell zur Berechnung der Schwermetallflüsse in der Landwirtschaftlichen Ökobilanz. Agroscope FAL Reckenholz. In German.
FRISCHKNECHT, R., JUNGBLUTH, N., ALTHAUS, H. J., DOKA, G., HELLWEG, S., HISCHIER, R., NEMECEK, T., MARGNI, M. & SPIELMANN, M. 2004. Implementation of Life Cycle Assessment Methods - Ecoinvent Data v1.1. Dübendorf: Swiss Centre for Life Cycle Inventories (Ecoinvent).
FRISCHKNECHT, R., STEINER, R. & JUNGBLUTH, N. 2009. The ecological scarcity method - Eco-factors 2006. A method for impact assessment in LCA. Environmental studies no. 0906. Bern: Federal Office for the Environment.
FROSSARD, E., BÜNEMANN, E., JANSA, J., OBERSON, A. & FELLER, C. 2009. Concepts and practices of nutrient management in agro-ecosystems: Can we draw lessons from history to design future sustainable agricultural production systems? Bodenkultur, 60, 43-60.
GAILLARD, G. & NEMECEK, T. Swiss Agricultural Life Cycle Assessment (SALCA): An integrated environmental assessment concept for agriculture. Int. Conf. "Integrated Assessment of Agriculture and Sustainable Development, Setting the Agenda for Science and Policy", 2009 Egmond aan Zee, The Netherlands. AgSAP Office, Wageningen University, 134-135.
GAISER, T., PERKONS, U., KUPER, P. M., PUSCHMANN, D. U., PETH, S., KAUTZ, T., PFEIFER, J., EWERT, F., HORN, R. & KOPKE, U. 2012. Evidence of improved water uptake from subsoil by spring wheat following lucerne in a temperate humid climate. Field Crops Research, 126, 56-62.
GARNETT, T. 2011. Where are the best opportunities for reducing greenhouse gas emissions in the food system (including the food chain)? Food Policy, 36, 23-32.
GARNETT, T. 2013. Three perspectives on sustainable food security: efficiency, demand restraint, food system transformation. What role for LCA? Journal of Cleaner Production.
GARNETT, T., APPLEBY, M., BALMFORD, A., BATEMAN, I., BENTON, T., BLOOMER, P., BURLINGAME, B., DAWKINS, M., DOLAN, L. & FRASER, D. 2013. Sustainable intensification in agriculture: premises and policies. Science, 341, 33-34.
GARNETT, T. & GODFRAY, H. C. J. 2012. Sustainable intensification in agriculture. Navigating a course through competing food system priorities. Oxford, UK: Food Climate Research NetworkOxford Martin Programme on the Future of Food.
GARRIGUES, E., CORSON, M., WALTER, C., ANGERS, D. A. & VAN DER WERF, H. 2012. Soil-quality indicators in LCA: method presentation with a case study. In: CORSON, M. S. & VAN DER WERF, H. M. G. (eds.) Proceedings of the 8th International Conference on Life Cycle Assessment in the Agri-Food Sector (LCA Food 2012), 1-4 October 2012,. Saint-Malo, France: INRA-Rennes.
GEELS, F. W. 2002. Technological transitions as evolutionary reconfiguration processes: a multi-level perspective and a case-study. Research policy, 31, 1257-1274.
120
GELFAND, I., SAHAJPAL, R., ZHANG, X., IZAURRALDE, R. C., GROSS, K. L. & ROBERTSON, G. P. 2013. Sustainable bioenergy production from marginal lands in the US Midwest. Nature, 493, 514-+.
GLAVIČ, P. & LUKMAN, R. 2007. Review of sustainability terms and their definitions. Journal of Cleaner Production, 15, 1875-1885.
GLEESON, E., HÄNI, M., HAYNES, A., IMER, D., KULAK, M., PFISTER, B., BELLER, S., SVOZIL, J., ULLRICH, B. & ZIELIS, S. PhD Symposium. Plants replacing fossil fuels? 2012 Zurich, Switzerland. Zurich-Basel Plant Science Center.
GLENDINING, M. J., DAILEY, A. G., WILLIAMS, A. G., VAN EVERT, F. K., GOULDING, K. W. T. & WHITMORE, A. P. 2009. Is it possible to increase the sustainability of arable and ruminant agriculture by reducing inputs? Agricultural Systems, 99, 117-125.
GNANSOUNOU, E., PANICHELLI, L., DAURIAT, A. & VILLEGAS, J. D. 2008. Accounting for indirect land-use changes in GHG balances of biofuels. Review of current approaches. Lausanne, Switzerland: Ecole Polytechnique Federale de Lausanne.
GODFRAY, H. C. J. 2011. Food for thought. Proceedings of the National Academy of Sciences of the United States of America, 108, 19845-19846.
GODFRAY, H. C. J., BEDDINGTON, J. R., CRUTE, I. R., HADDAD, L., LAWRENCE, D., MUIR, J. F., PRETTY, J., ROBINSON, S., THOMAS, S. M. & TOULMIN, C. 2010. Food Security: The Challenge of Feeding 9 Billion People. Science, 327, 812-818.
GOGLIO, P., BONARI, E. & MAZZONCINI, M. 2012. LCA of cropping systems with different external input levels for energetic purposes. Biomass & Bioenergy, 42, 33-42.
GOSME, M., SUFFERT, F. & JEUFFROY, M. H. 2010. Intensive versus low-input cropping systems: What is the optimal partitioning of agricultural area in order to reduce pesticide use while maintaining productivity? Agricultural Systems, 103, 110-116.
GOVAERTS, B., VERHULST, N., CASTELLANOS-NAVARRETE, A., SAYRE, K. D., DIXON, J. & DENDOOVEN, L. 2009. Conservation Agriculture and Soil Carbon Sequestration: Between Myth and Farmer Reality. Critical Reviews in Plant Sciences, 28, 97-122.
GRAEDEL, T. E. & ALLENBY, B. R. 1995. Industrial Ecology, New Jersey, Prentice-Hall. GRAVES, A. R., BURGESS, P. J., LIAGRE, F., TERREAUX, J. P., BORREL, T., DUPRAZ, C., PALMA, J. &
HERZOG, F. 2011. Farm-SAFE: the process of developing a plot- and farm-scale model of arable, forestry, and silvoarable economics. Agroforestry Systems, 81, 93-108.
GRAVES, A. R., BURGESS, P. J., PALMA, J., KEESMAN, K. J., VAN DER WERF, W., DUPRAZ, C., VAN KEULEN, H., HERZOG, F. & MAYUS, M. 2010. Implementation and calibration of the parameter-sparse Yield-SAFE model to predict production and land equivalent ratio in mixed tree and crop systems under two contrasting production situations in Europe. Ecological Modelling, 221, 1744-1756.
GROSSMAN, M. 2014. Efficiency. Encyclopaedia Britannica. Academic edition. GRÜNEWALD, H., BÖHM, C., QUINKENSTEIN, A., GRUNDMANN, P., EBERTS, J. & VON WÜHLISCH, G.
2009. Robinia pseudoacacia. A Lesser Known Tree Species for Biomass Production. BioEnergy Research, 2, 123-133.
GRÜNEWALD, H., BRANDT, B. K. V., SCHNEIDER, B. U., BENS, O., KENDZIA, G. & HÄTTL, R. F. 2007. Agroforestry systems for the production of woody biomass for energy transformation purposes. Ecological Engineering, 29, 319-328.
GUARDA, G., PADOVAN, S. & DELOGU, G. 2004. Grain yield, nitrogen-use efficiency and baking quality of old and modern Italian bread-wheat cultivars grown at different nitrogen levels. European Journal of Agronomy, 21, 181-192.
GUINÉE, J., VAN OERS, L., DE KONING, A. & TAMIS, W. 2006. Life Cycle Approaches for Conservation Agriculture. CML Report. Leiden: Leiden University.
HAAS, G., WETTERICH, F. & KÖPKE, U. 2001. Comparing intensive, extensified and organic grassland farming in southern Germany by process life cycle assessment. Agriculture Ecosystems & Environment, 83, 43-53.
121
HAUGGAARD-NIELSEN, H., ANDERSEN, M. K., JORNSGAARD, B. & JENSEN, E. S. 2006. Density and relative frequency effects on competitive interactions and resource use in pea-barley intercrops. Field Crops Research, 95, 256-267.
HAUGGAARD-NIELSEN, H., GOODING, M., AMBUS, P., CORRE-HELLOU, G., CROZAT, Y., DAHLMANN, C., DIBET, A., VON FRAGSTEIN, P., PRISTERI, A., MONTI, M. & JENSEN, E. S. 2009. Pea-barley intercropping and short-term subsequent crop effects across European organic cropping conditions. Nutrient Cycling in Agroecosystems, 85, 141-155.
HAUSCHILD, M. Z., POTTING, J., HERTEL, O., SCHÖPP, W. & BASTRUP-BIRK, A. 2006. Spatial differentiation in the characterisation of photochemical ozone formation. The EDIP2003 methodology. International Journal of Life Cycle Assessment, 11, 72-80.
HAUSCHILD, M. Z. & WENZEL, H. 1998. Environmental assessment of products. Vol. 2: Scientific background, London, Chapman & Hall.
HAWKEN, P., LOVINS, A. B. & LOVINS, L. H. 2010. Natural capitalism: the next industrial revolution, Earthscan. London.
HAYASHI, K. 2006. Environmental indicators for agricultural management: integration of decision making. International Journal of materials & structural reliability, 4, 115-127.
HAYASHI, K. 2013. Practical recommendations for supporting agricultural decisions through life cycle assessment based on two alternative views of crop production: the example of organic conversion. The International Journal of Life Cycle Assessment, 18, 331-339.
HAYER, F., BONNIN, E., CARROUÉE, B., GAILLARD, G., NEMECEK, T., SCHNEIDER, A., VIVIER, CH. Designing sustainable crop rotations using life cycle assessment of crop sequences 8 th Int. Conference on LCA in the Agri-Food Sector, 1-4 Oct 2012 2012 St. Malo, France. INRA.
HELLWEG, S. & GEISLER, G. 2003. Life cycle impact assessment of pesticides. The International Journal of Life Cycle Assessment, 8, 310-312.
HERSENER, J.-L., BAUMGARTNER, D. U., DUX, D., AESCHBACHER, U., ALIG, M., BLASER, S., GAILLARD, G., GLODÉ, M., JAN, P., JENNI, M., MIELEITNER, J., MÜLLER, G., NEMECEK, T., RÖTHELI, E. & SCHMID, D. 2011. Zentrale Auswertung von Ökobilanzen landwirtschaftlicher Betriebe (ZA-ÖB) - Schlussbericht. Zürich: Forschungsanstalt Agroscope Reckenholz-Tänikon ART.
HERTWICH, E. G. 2005. Consumption and the Rebound Effect: An Industrial Ecology Perspective. Journal of Industrial Ecology, 9, 85-98.
HISCHIER, R., ALTHAUS H.-J. & BAUER, C., BÜSSER S., DOKA, G., FRISCHKNECHT R., KLEIJER A., LEUENBERGER M., NEMECEK, T., SIMONS A. 2010. Documentation of changes implemented in ecoinvent Data v2.2. Final report ecoinvent data v2.2. Dübendorf, Switzerland: Swiss Centre for Life Cycle Inventories.
HM GOVERNMENT 2011. Foresight. The Future of Food and Farming. Final Project Report. London: The Government Office for Science.
HOCKING, P., RANDALL, P., HORST, W. J., SCHENK, M. K., BÜRKERT, A., CLAASSEN, N., FLESSA, H., FROMMER, W. B., GOLDBACH, H., OLFS, H. W., RÖMHELD, V., SATTELMACHER, B., SCHMIDHALTER, U., SCHUBERT, S., WIRÉN, N. & WITTENMAYER, L. 2002. Better growth and phosphorus nutrition of sorghum and wheat following organic acid secreting crops. Plant Nutrition. Springer Netherlands.
HODGSON, J. A., KUNIN, W. E., THOMAS, C. D., BENTON, T. G. & GABRIEL, D. 2010. Comparing organic farming and land sparing: optimizing yield and butterfly populations at a landscape scale. Ecology Letters, 13, 1358-1367.
HOLMES, M., WILTSHIRE, J., WYNN, S., FAWCETT, CH., NICHOLSON, CH., PHILLIPS, K., THORMAN, R., KENDAL, R., JONES, M., ATTWOOD, J., SOUTHERN, R., DAWSON, A., BROOKS, M., JONAS, M., WHITEHEAD, I., MEMORY, J., SHEPHERD, R., FOSTER, CH., MARTINDALE, W. 2012. Understanding the environmental impacts of consuming foods that are produced locally in season. Final report of the project FO0412. Defra Publications. London.
HOLSTEIN, W. & TANENBAUM, M. 2014. production system. Encyclopaedia Britannica Academic Edition. Encyclopaedia Britannica.
122
HOWARD, D. D., CHAMBERS, A. Y. & LESSMAN, G. M. 1998. Rotation and fertilization effects on corn and soybean yields and soybean cyst nematode populations in a no-tillage system. Agronomy Journal, 90, 518-522.
HUBER, R., RIGLING, A., BEBI, P., BRAND, F. S., BRINER, S., BUTTLER, A., ELKIN, C., GILLET, F., GRET-REGAMEY, A., HIRSCHI, C., LISCHKE, H., SCHOLZ, R. W., SEIDL, R., SPIEGELBERGER, T., WALZ, A., ZIMMERMANN, W. & BUGMANN, H. 2013. Sustainable Land Use in Mountain Regions Under Global Change: Synthesis Across Scales and Disciplines. Ecology and Society, 18.
HUPPES, G. & ISHIKAWA, M. 2005. Eco-efficiency and its terminology. Journal of Industrial Ecology, 9, 43-46.
IAASTD 2009. International Assessment of Agricultural Knowledge, Washington D.C., Island Press. IBARROLA, R., SHACKLEY, S. & HAMMOND, J. 2012. Pyrolysis biochar systems for recovering
biodegradable materials: A life cycle carbon assessment. Waste Management, 32, 859-868. INGRAM, J. 2008. Are farmers in England equipped to meet the knowledge challenge of sustainable
soil management? An analysis of farmer and advisor views. Journal of Environmental Management, 86, 214-228.
IPCC 2006. 2006 IPCC Guidelines for National Greenhouse Gas Inventories. Volume 4: Agriculture, forestry and other land use. In: SIMON EGGLESTON, LEANDRO BUENDIA, KYOKO MIWA, NGARA, T. & TANABE, K. (eds.). Kanagawa, Japan: IGES.
IPCC 2007. Climate Change 2007: Synthesis Report. Geneva: IPCC. IRIARTE, A., RIERADEVALL, J. & GABARRELL, X. 2011. Environmental impacts and energy demand of
rapeseed as an energy crop in Chile under different fertilization and tillage practices. Biomass & Bioenergy, 35, 4305-4315.
IISO 2006a. ISO 14040 - Environmental management - Life cycle assessment - Principles and framework. International Organization for Standardization. Geneva
ISO 2006b. ISO 14044 - Environmental management - Life cycle assessment - Requirements and guidelines. International Organization for Standardization. Geneva
ISO/TR14062 2002. Environmental management, integrating environmental aspects into product design and development. International Organization for Standardization. Geneva.
JAN, P., DUX, D., LIPS, M., ALIG, M. & DUMONDEL, M. 2012. On the link between economic and environmental performance of Swiss dairy farms of the alpine area. International Journal of Life Cycle Assessment, 17, 706-719.
JARECKI, M. K. & LAL, R. 2003. Crop management for soil carbon sequestration. Critical Reviews in Plant Sciences, 22, 471-502.
JAUHIAINEN, J., MARTIN-GULLON, I., CONESA, J. A. & FONT, R. 2005. Emissions from pyrolysis and combustion of olive oil solid waste. Journal of analytical and applied pyrolysis, 74, 512-517.
JEANNERET, P., HUGUENIN-ELIE, O., BAUMGARTNER, D., KNUCHEL, R. F., GAILLARD, G., NEMECEK, T. & WEIBEL, P. 2007. Estimation of grassland management impact on biodiversity. Permanent and temporary grassland: plant, environment and economy. Proceedings of the 14th Symposium of the European Grassland Federation, Ghent, Belgium, 3-5 September 2007.
JOHNSTON, A. E., POULTON, P. R. & COLEMAN, K. 2009. Soil organic matter: its importance in sustainable agriculture and carbon dioxide fluxes. Advances in agronomy, 101, 1-57.
JUNGBLUTH, N. 1997. UNS Working Paper No. 16. Life-Cycle-Assessment for Stoves and Ovens. . Zürich, Switzerland: ETH Zürich.
KHARKWAL, M. C. & ROY, D. 2004. A Century of Advances in Plant Breeding Methodologies. In: JAIN, H. K. & KHARKWAL, M. C. (eds.) Plant Breeding. Springer Netherlands.
KIAER, L. P., SKOVGAARD, I. M. & OSTERGARD, H. 2009. Grain yield increase in cereal variety mixtures: A meta-analysis of field trials. Field Crops Research, 114, 361-373.
KIM, S. & DALE, B. E. 2005. Environmental Aspects of Ethanol Derived From No-Tilled Corn Grain: Nonrenewable Energy Consumption and Greenhouse Gas Emissions. Biomass & Bioenergy, 28, 475-489.
123
KIRKEGAARD, J., CHRISTEN, O., KRUPINSKY, J. & LAYZELL, D. 2008. Break crop benefits in temperate wheat production. Field Crops Research, 107, 185-195.
KLEIJN, D., BERENDSE, F., SMIT, R. & GILISSEN, N. 2001. Agri-environment schemes do not effectively protect biodiversity in Dutch agricultural landscapes. Nature, 413, 723-725.
KLEIJN, D., KOHLER, F., BÁLDI, A., BATÁRY, P., CONCEPCIÓN, E. D., CLOUGH, Y., DÍAZ, M., GABRIEL, D., HOLZSCHUH, A., KNOP, E., KOVÁCS, A., MARSHALL, E. J. P., TSCHARNTKE, T. & VERHULST, J. 2009. On the relationship between farmland biodiversity and land-use intensity in Europe. Proceedings of the Royal Society B: Biological Sciences, 276, 903-909.
KLEMMER, P., LEHR, U. & LOEBBE, K. 1999. Environmental Innovation. Volume 3 of publications from a Joint Project on Innovation Impacts of Environmental Policy Instruments. Synthesis Report of a project commissioned by the German Ministry of Research and Technology, Analytica-Verlag, Berlin.
KNEAFSEY, M., VENN, L., SCHMUTZ, U., BALÁZS, B., TRENCHARD, L., EYDEN-WOOD, T., BOS, E., SUTTON, G. & BLACKETT, M. 2013. Short Food Supply Chains and Local Food Systems in the EU. A State of Play of their Socio-Economic Characteristics. JRC Scientific and Policy Reports. JRC. Report EUR 25911 EN. Seville.
KNIGHT, P. & JENKINS, J. O. 2009. Adopting and applying eco-design techniques: a practitioners perspective. Journal of Cleaner Production, 17, 549-558.
KOBAYASHI, Y., KOBAYASHI, H., HONGU, A. & SANEHIRA, K. 2005. A Practical Method for Quantifying Eco‐efficiency Using Eco‐design Support Tools. Journal of Industrial Ecology, 9, 131-144.
KONG, D., SHAN, J., IACOBONI, M. & MAGUIN, S. R. 2012. Evaluating greenhouse gas impacts of organic waste management options using life cycle assessment. Waste Management & Research, 30, 800-812.
KONGSHAUG, G. 1998. Energy consumption and greenhouse gas emissions in fertilizer production. IFA Technical Conference, 28 September - 1 October 1998 Marrakech, Morocco. International Fertilizer Industry Association, 2-19.
KOOISTRA, K. J., PYBURN, R. & TERMORSHUIZEN, A. J. 2006. The sustainability of cotton. Consequences for man and environment. Wageningen: Wetenschapswinkel Wageningen Universiteit en Reseachcentrum.
KORSAETH, A., JACOBSEN, A. Z., ROER, A. G., HENRIKSEN, T. M., SONESSON, U., BONESMO, H., SKJELVAG, A. O. & STROMMAN, A. H. 2012. Environmental life cycle assessment of cereal and bread production in Norway. Acta Agriculturae Scandinavica Section a-Animal Science, 62, 242-253.
KULAK, M., GRAVES, A. & CHATTERTON, J. 2013. Reducing greenhouse gas emissions with urban agriculture: A Life Cycle Assessment perspective. Landscape and Urban Planning, 111, 68-78.
KUOSMANEN, N. & KUOSMANEN, T. 2013. Modeling Cumulative Effects of Nutrient Surpluses in Agriculture: A Dynamic Approach to Material Balance Accounting. Ecological Economics, 90, 159-167.
LAL, R. 2004. Soil carbon sequestration impacts on global climate change and food security. Science, 304, 1623-1627.
LANSCHE, J. & MULLER, J. 2012. Life cycle assessment of energy generation of biogas fed combined heat and power plants: Environmental impact of different agricultural substrates. Engineering in Life Sciences, 12, 313-320.
LEHMANN, J., GAUNT, J. & RONDON, M. 2006. Bio-char sequestration in terrestrial ecosystems. A review. Mitigation and Adaptation Strategies for Global Change. 11, 395-419.
LEHMANN, J. & JOSEPH, S. 2009. Biochar for Environmental Management, London, Earthscan. LEIFELD, J. 2013. Low-input farming: a way towards climate-friendly agriculture? Carbon
Management, 4, 31-41. LEROY, B. 2008. Soil food web, C and N transformations and soil structure: interactions and feedback
mechanisms as a function of the quality of exogenous organic matter. PhD thesis.
124
LIEBHARDT, W. C., ANDREWS, R. W., CULIK, M. N., HARWOOD, R. R., JANKE, R. R., RADKE, J. K. & RIEGERSCHWARTZ, S. L. 1989. CROP PRODUCTION DURING CONVERSION FROM CONVENTIONAL TO LOW-INPUT METHODS. Agronomy Journal, 81, 150-159.
LONG, J. H. & TODD, T. C. 2001. Effect of crop rotation and cultivar resistance on seed yield and the soybean cyst nematode in full-season and double-cropped soybean. Crop Science, 41, 1137-1143.
LOVINS, A. 2010. Integrative Design: A Disruptive Source of Expanding Returns to Investments in Energy Efficiency. Rocky Mountain Institute.
LOYCE, C., MEYNARD, J. M., BOUCHARD, C., ROLLAND, B., LONNET, P., BATAILLON, P., BERNICOT, M. H., BONNEFOY, M., CHARRIER, X., DEBOTE, B., DEMARQUET, T., DUPERRIER, B., FÉLIX, I., HEDDADJ, D., LEBLANC, O., LELEU, M., MANGIN, P., MÉAUSOONE, M. & DOUSSINAULT, G. 2012. Growing winter wheat cultivars under different management intensities in France: A multicriteria assessment based on economic, energetic and environmental indicators. Field Crops Research, 125, 167-178.
MCDEVITT, J. E. & MILÀ I CANALS, L. 2011. Can life cycle assessment be used to evaluate plant breeding objectives to improve supply chain sustainability? A worked example using porridge oats from the UK. International Journal of Agricultural Sustainability, 9, 484-494.
MEISTERLING, K., SAMARAS, C. & SCHWEIZER, V. 2009. Decisions to reduce greenhouse gases from agriculture and product transport: LCA case study of organic and conventional wheat. Journal of Cleaner Production, 17, 222-230.
MENZI, H., FRICK, R. & KAUFMANN, R. 1997. Ammoniak-Emissionen in der Schweiz: Ausmass und technische Beurteilung des Reduktionspotentials. Schriftenreihe der FAL. Zürich-Reckenholz: Eidgenössische Forschungsanstalt für Agrarökologie und Landbau. In German.
MIELEITNER, J., ALIG, M., GRANDL, F., NEMECEK, T. & GAILLARD, G. 2012. 8. Environmental impact of beef – role of slaughtering, meat processing and transport In: CORSON, M. S. & VAN DER WERF, H. M. G. (eds.) Proceedings of the 8th International Conference on Life Cycle Assessment in the Agri-Food Sector (LCA Food 2012),1-4 October 2012,. Saint Malo, France: INRA, Rennes, .
MILÀ I CANALS, L., AZAPAGIC, A., DOKA, G., JEFFERIES, D., KING, H., MUTEL, C., NEMECEK, T., ROCHES, A., SIM, S., STICHNOTHE, H., THOMA, G. & WILLIAMS, A. 2011. Approaches for Addressing Life Cycle Assessment Data Gaps for Bio-based Products. Journal of Industrial Ecology, 15, 707-725.
MÖLLER, K. & MÜLLER, T. 2012. Effects of anaerobic digestion on digestate nutrient availability and crop growth: A review. Engineering in Life Sciences, 12, 242-257.
MOUDRY, J., JR., JELINKOVA, Z., PLCH, R., MOUDRY, J., KONVALINA, P. & HYSPLER, R. 2013. The emissions of greenhouse gases produced during growing and processing of wheat products in the Czech Republic. Journal of Food Agriculture & Environment, 11, 1133-1136.
MOURON, P., NEMECEK, T., SCHOLZ, R. W. & WEBER, O. 2006a. Management influence on environmental impacts in an apple production system on Swiss fruit farms: Combining life cycle assessment with statistical risk assessment. Agriculture, Ecosystems and Environment, 114, 311-322.
MOURON, P., SCHOLZ, R. W., NEMECEK, T. & WEBER, O. 2006b. Life cycle management on Swiss fruit farms: Relating environmental and income indicators for apple-growing. Ecological Economics, 58, 561-578.
MUCHANE, M., JAMA, B., OTHIENO, C., OKALEBO, R., ODEE, D., MACHUA, J. & JANSA, J. 2010. Influence of improved fallow systems and phosphorus application on arbuscular mycorrhizal fungi symbiosis in maize grown in western Kenya. Agroforestry Systems, 78, 139-150.
MUNDT, C., C. 2002. Use of Multiline Cultivars and Cultivar Mixtures for Disease Management. 40, 381-410.
125
MUÑOZ, I., I CANALS, L. M. & FERNÁNDEZ-ALBA, A. R. 2010. Life cycle assessment of the average Spanish diet including human excretion. The International Journal of Life Cycle Assessment, 15, 794-805.
MURRAY, W., J. 2012. Sustainable Crop Production Intensification. In: BURLINGAME, B. & DERNINI, S. (eds.) Proceedings of the International Scientific Symposium Biodiversity and Sustainable Diets United Against Hunger, 3–5 November 2010 FAO Headquarters, Rome. Rome: FAO Nutrition and Consumer Protection Division.
NAUDIN, C., VAN DER WERF, H. M. G., JEUFFROY, M., H. & CORRE-HELLOU, G. LCA applied to pea-wheat intercrops: the significance of allocation. In: CORSON, M. S. & VAN DER WERF, H. M. G., eds. 8th International Conference on LCA in the Agri-Food Sector, 2013 St. Malo, France. INRA-Rennes.
NAVIA, R. & CROWLEY, D. E. 2010. Closing the loop on organic waste management: biochar for agricultural land application and climate change mitigation. Waste Management & Research, 28, 479-480.
NDUFA, J. K., GATHUMBI, S. M., KAMIRI, H. W., GILLER, K. E. & CADISCH, G. 2009. Do Mixed-Species Legume Fallows Provide Long-Term Maize Yield Benefit Compared with Monoculture Legume Fallows? Agronomy Journal, 101, 1352-1362.
NEMECEK, T. & BAUMGARTNER, D. 2006. Environmental Impacts of Introducing Grain Legumes into European Crop Rotations and Pig Feed Formulas. Concerted Action GL-Pro WP4: Environmental Analysis. Zürich-Affoltern: Agroscope Reckenholz-Tänikon Research Station ART.
NEMECEK, T., DUBOIS, D., HUGUENIN-ELIE, O. & GAILLARD, G. 2011a. Life cycle assessment of Swiss farming systems: I. Integrated and organic farming. Agricultural Systems, 104, 217-232.
NEMECEK, T., HUGUENIN-ELIE, O., DUBOIS, D., GAILLARD, G., SCHALLER, B. & CHERVET, A. 2011b. Life cycle assessment of Swiss farming systems: II. Extensive and intensive production. Agricultural Systems, 104, 233-245.
NEMECEK, T., VON RICHTHOFEN, J.-S., DUBOIS, G., CASTA, P., CHARLES, R. & PAHL, H. 2008. Environmental impacts of introducing grain legumes into European crop rotations. European Journal of Agronomy, 28, 380-393.
NIELSEN, A. M. & NIELSEN, P. H. 2003a. LCA Food Database. Flour and oat flakes production (Produktion af mel og havregryn). 2.-O LCA consultants.
NIELSEN, A. M. & NIELSEN, P. H. 2003b. LCA Food Database. Industrial baking of bread (Industriel brødbagning). 2. -O LCA consultants.
OBERHOLZER, H.-R., KNUCHEL, R.F., WEISSKOPF, P. & GAILLARD, G., 2012. A novel method for soil quality in life cycle assessment using several soil indicators. Agronomy for Sustainable Development, 32: 639-649..
ODUM, H. T., BROWN, M. T. & BRANDT-WILLIAMS, S. L. 2000. Introduction and global budget. Handbook of Emergy Evaluation: A compendium of data for emergy computation issued in a series of folios., Center for Environmental Policy. University of Florida.
PARK, J. R., MCFARLANE, I., PHIPPS, R. H. & CEDDIA, G. 2011. The role of transgenic crops in sustainable development. Plant Biotechnology Journal, 9, 2-21.
PARR, J. F., PAPENDICK, R. I., YOUNGBERG, I. G. & MEYER, R. E. 1990. Sustainable agriculture in the United States. In: C.A. EDWARDS, R. L., P. MADDEN, R. MILLER, G. HOUSE (EDS.), SUSTAINABLE AGRICULTURE SYSTEMS, Sustainable Agricultural Systems. Ankeny, CA: Soil and Water Conservation Society.
PARTIDÁRIO, P. J., LAMBERT, J. & EVANS, S. 2007. Building more sustainable solutions in production–consumption systems: the case of food for people with reduced access. Journal of Cleaner Production, 15, 513-524.
PELZER, E., BAZOT, M., MAKOWSKI, D., CORRE-HELLOU, G. N. L., NAUDIN, C., Al RIFAï, M., BARANGER, E., BEDOUSSAC, L., BIARNÈS, V. R., BOUCHENY, P., CARROUÉE, B., DORVILLEZ, D., FOISSY, D., GAILLARD, B., GUICHARD, L., MANSARD, M.-C., OMON, B., PRIEUR, L. C., YVERGNIAUX, M.,
126
JUSTES, E. & JEUFFROY, M.-H. L. N. 2012. Pea-wheat intercrops in low-input conditions combine high economic performances and low environmental impacts. European Journal of Agronomy, 40, 39-53.
PENMAN, J., KRUGER, D., GALBALLY, I., HIRAISHI, T., NYENZI, B., EMMANUEL, S., BUENDIA, L., HOPPAUS, R., MARTINSEN, T. & MEIJER, J. 2000. Good practice guidance and uncertainty management in national greenhouse gas inventories, IPCC National Greenhouse Cost Inventories programme, Technical Support Unit.
PHILLIPS, S. L. & WOLFE, M. S. 2005. Evolutionary plant breeding for low input systems. Journal of Agricultural Science, 143, 245-254.
PICARD, D., GHILOUFI, M., SAULAS, P. & DE TOURDONNET, S. 2010. Does undersowing winter wheat with a cover crop increase competition for resources and is it compatible with high yield? Field Crops Research, 116, 206-206.
PICAZO-TADEO, A. J., GOMEZ-LIMON, J. A. & REIG-MARTINEZ, E. 2011. Assessing farming eco-efficiency: A Data Envelopment Analysis approach. Journal of Environmental Management, 92, 1154-1164.
PIERGIOVANNI, A. R. 2013. Evaluation of genetic variation and grain quality of old bread wheat varieties introduced in north-western Italian environments. Genetic Resources and Crop Evolution, 60, 325-333.
PIMENTEL, D., ACQUAY, H., BILTONEN, M., RICE, P., SILVA, M., NELSON, J., LIPNER, V., GIORDANO, S., HOROWITZ, A. & D'AMORE, M. 1992. Environmental and economic costs of pesticide use. BioScience, 42, 750-760.
POESCHL, M., WARD, S. & OWENDE, P. 2012. Environmental impacts of biogas deployment - Part II: life cycle assessment of multiple production and utilization pathways. Journal of Cleaner Production, 24, 184-201.
PRASUHN, V. 2006. Erfassung der PO4-Austräge für die Ökobilanzierung - SALCA-Phosphor. Zürich: Agroscope FAL Reckenholz. In German.
PREM, W., HECHENBICHLER, J., LÖRCHER, M., MANHART, H. & HÜLSBERGEN, K.-J. Berlin. Energieeffizienz im ökologischen Landbau - am Beispiel der Wertschöpfungskette "Brot". In: ZIKELI, S., CLAUPEIN, W., DABBERT, S., KAUFMANN, B., MÜLLER, T. & VALLE ZÁRATE, A., eds. Beiträge zur 9. Wissenschaftstagung Ökologischer Landbau, 20.-23.3.2007 2007 Universität Hohenheim. net: Verlag Dr. Köster, 855-858. In German.
PRETTY, J. 1995. Regenerating Agriculture: Policies and Practice for Sustainability and Self-Reliance, London, Joseph Henry Press, International Institute for Environment and Development.
PRETTY, J., 1997. The sustainable intensification of agriculture. Natural Resources Forum, 21, 247-256 PRETTY, J. 2009. Can Ecological Agriculture Feed Nine Billion People? Monthly Review-an
Independent Socialist Magazine, 61, 46-58. PRETTY, J. 2011. Sustainable intensification in Africa. International Journal of Agricultural
Sustainability, 9, 3-4. PRETTY, J. N., BRETT, C., GEE, D., HINE, R. E., MASON, C. F., MORISON, J. I. L., RAVEN, H., RAYMENT,
M. D. & VAN DER BIJL, G. 2000. An assessment of the total external costs of UK agriculture. Agricultural Systems, 65, 113-136.
PROMMATA. 2013. Bienvenue à PROMMATA [Online]. Available: http://www.prommata.org/ [Accessed 26th August 2013].
PYPERS, P., HUYBRIGHS, M., DIELS, J., ABAIDOO, R., SMOLDERS, E. & MERCKX, R. 2007. Does the enhanced P acquisition by maize following legumes in a rotation result from improved soil P availability? Soil Biology & Biochemistry, 39, 2555-2566.
RATNADASS, A., FERNANDES, P., AVELINO, J. & HABIB, R. 2012. Plant species diversity for sustainable management of crop pests and diseases in agroecosystems: a review. Agronomy for sustainable development, 32, 273-303.
REED, B. 2009. The integrative design guide to green building: Redefining the practice of sustainability, John Wiley & Sons.
127
REIJNDERS, L. 1998. The Factor X Debate:Setting Targets for Eco-Efficiency. Journal of Industrial Ecology, 2, 13-22.
REISNER, Y., SCHÜPBACH, B. & JEANNERET, P. Biodiversität und Landschaftsästhetik in der Ökobilanzierung. Ökobilanzen: Beitrag zu einer nachhaltigen Landwirtschaft, FAL Tagung 18.1.2002 2002. NE, 22-24. In German.
RENTING, H., MARSDEN, T. K. & BANKS, J. 2003. Understanding alternative food networks: exploring the role of short food supply chains in rural development. Environment and Planning A, 35, 393-411.
RÉSEAU SEMENCES PAYSANNES. 2012. Le journal des rencontres. [online]. Available : http://www.semencespaysannes.org/images/imagesFCK/image/accueil/WEB2_RSP_journal_rencontres-MSP.pdf [Accessed 27 February 2014]. In French.
RICHNER, W., OBERHOLZER, H.-R., FREIERMUTH, R. & WALTHER, U. 2006. Modell zur Beurteilung des Nitratauswaschungspotenzials in Ökobilanzen - SALCA-NO3. Unter Berücksichtigung der Bewirtschaftung (Fruchtfolge, Bodenbearbeitung, N-Düngung), der mikrobiellen Nitratbildung im Boden, der Stickstoffaufnahme durch die Pflanzen und verschiedener Bodeneigenschaften. Agroscope FAL Reckenholz. In German.
RIVM 1992. The Environment in Europe: A Global Perspective. In: RIVM (ed.). Bilthoven. RIZET, C. & KEITA, B. 2005. Chaînes logistiques et Consommation d’énergie : cas du Yaourt et du Jean.
Paris: INRETS - French National Research Institute for Transport and Security. In French. ROBERTS, K. G., GLOY, B. A., JOSEPH, S., SCOTT, N. R. & LEHMANN, J. 2009. Life Cycle Assessment of
Biochar Systems: Estimating the Energetic, Economic, and Climate Change Potential. Environmental Science & Technology, 44, 827-833.
ROCHES, A., NEMECEK, T., GAILLARD, G., PLASSMANN, K., SIM, S., KING, H. & MILA I CANALS, L. 2010. MEXALCA: a modular method for the extrapolation of crop LCA. International Journal of Life Cycle Assessment, 15, 842-854.
ROYAL SOCIETY 2009. Reaping the benefits: science and the sustainable intensification of global agriculture. London.
SALING, P., KICHERER, A., DITTRICH-KRÄMER, B., WITTLINGER, R., ZOMBIK, W., SCHMIDT, I., SCHROTT, W. & SCHMIDT, S. 2002. Eco-efficiency analysis by BASF: the method. The International Journal of Life Cycle Assessment, 7, 203-218.
SANAHUJA, G., BANAKAR, R., TWYMAN, R. M., CAPELL, T. & CHRISTOU, P. 2011. Bacillus thuringiensis: a century of research, development and commercial applications. Plant Biotechnology Journal, 9, 283-300.
SANCHEZ, P. A., BURESH, R. J. & LEAKEY, R. R. B. 1997. Trees, soils, and food security. Philosophical Transactions of the Royal Society B-Biological Sciences, 352, 949-960.
SANTILLI, M., MOUTINHO, P., SCHWARTZMAN, S., NEPSTAD, D., CURRAN, L. & NOBRE, C. 2005. Tropical deforestation and the Kyoto Protocol. Climatic Change, 71, 267-276.
SCHENKER, U. & LUNDQUIST, L. Requirements and Use of Screening Life Cycle Assessment and Ecodesign Tools at Nestlé. 7th International Conference on Life Cycle Assessment in the Agri-Food Sector. , September 22-24, 2010 2010 Bari, Italy.
SCHMIDHEINY, S. 1992. Changing Course: A Global Business Perspective on Development and the Environment Massachusets: MIT Press.
SEBILLOTTE, M. Some concepts for analysing farming and cropping systems and for understanding their different effects. . In: SCAIFE, A., ed. Proceedings of the 1st Congress of European Society of Agronomy, 5-7 th December 1990 Paris. 1-16.
SHERREN, K., FISCHER, J., CLAYTON, H., SCHIRMER, J. & DOVERS, S. 2010. Integration by case, place and process: transdisciplinary research for sustainable grazing in the Lachlan River catchment, Australia. Landscape Ecology, 25, 1219-1230.
SHORTALL, O. K. & BARNES, A. P. 2013. Greenhouse gas emissions and the technical efficiency of dairy farmers. Ecological Indicators, 29, 478-488.
128
SMITH, K., BOUWMAN, L. & BRAATZ, B. 2000. N2O: Direct emissions from agricultural soils. In: PENMAN, J. (ed.) Good practice guidance and uncertainty management in national greenhouse gas inventories. . Global Environmental Strategies (IGES) for the IPCC.
SOANE, B. D., BALL, B. C., ARVIDSSON, J., BASCH, G., MORENO, F. & ROGER-ESTRADE, J. 2012. No-till in northern, western and south-western Europe: A review of problems and opportunities for crop production and the environment. Soil & Tillage Research, 118, 66-87.
SPUGNOLI, P. & DAINELLI, R. 2013. Environmental comparison of draught animal and tractor power. Sustainability Science, 8, 61-72.
STASINOPOULOS, P., SMITH, M., H., HARGROVES, K. & DESHA, C. 2009. Whole System Design. An integrated Approach to Sustainable Engineering, London, Earthscan.
STEINER, C., TEIXEIRA, W. G., LEHMANN, J., NEHLS, T., DE MACEDO, J. L. V., BLUM, W. E. H. & ZECH, W. 2007. Long term effects of manure, charcoal and mineral fertilization on crop production and fertility on a highly weathered Central Amazonian upland soil. Plant and Soil, 291, 275-290.
STOATE, C., BOATMAN, N. D., BORRALHO, R. J., CARVALHO, C. R., SNOO, G. R. D. & EDEN, P. 2001. Ecological impacts of arable intensification in Europe. Journal of Environmental Management, 63, 337-365.
SYP, A., JAROSZ, Z., FABER, A., BORZECKA-WALKER, M. & PUDELKO, R. 2012. Greenhouse gas emissions from winter wheat cultivation for bioethanol production in Poland. Journal of Food Agriculture & Environment, 10, 1169-1172.
TAKAGI, T. 2000. Eco-design towards green productivity. In: GILBERT, S. (ed.) Greening Supply Chain: Enhancing Competitiveness Through Green Productivity. APO.
TASSOU, S., HADAWEY, A., GE, Y. & MARRIOT, D. 2009. Final report on project FO0405: Greenhouse gas impacts of food retailing.
TESTER, M. & LANGRIDGE, P. 2010. Breeding Technologies to Increase Crop Production in a Changing World. Science, 327, 818-822.
THRUPP, L. A. 1998. Cultivating diversity: agrobiodiversity and food security, World Resources Institute.
TILMAN, D., BALZER, C., HILL, J. & BEFORT, B. L. 2011. Global food demand and the sustainable intensification of agriculture. Proceedings of the National Academy of Sciences of the United States of America, 108, 20260-20264.
TILMAN, D., CASSMAN, K. G., MATSON, P. A., NAYLOR, R. & POLASKY, S. 2002. Agricultural sustainability and intensive production practices. Nature, 418, 671-677.
TILMAN, D., FARGIONE, J., WOLFF, B., D'ANTONIO, C., DOBSON, A., HOWARTH, R., SCHINDLER, D., SCHLESINGER, W. H., SIMBERLOFF, D. & SWACKHAMER, D. 2001. Forecasting agriculturally driven global environmental change. Science, 292, 281-284.
TOSHIBA. 2012. CSR Report [Online]. Available: http://www.toshiba.co.jp/csr/en/ [Accessed on 22nd of October 2013].
TUKKER, A., HUPPES, G., GUINÉE, J., HEIJUNGS, R., DE KONING, A., VAN OERS, L., SUH, S., GEERKEN, T., VAN HOLDERBEKE, M., JANSEN, B. & NIELSEN, P. 2006. Environmental Impact of Products (EIPRO). Analysis of the life cycle environmental impacts related to the final consumption of the EU-25. Technical Report.
TUOMISTO, H., HODGE, I., RIORDAN, P. & MACDONALD, D. 2012a. Comparing global warming potential, energy use and land use of organic, conventional and integrated winter wheat production. Annals of Applied Biology, 161, 116-126.
TUOMISTO, H., HODGE, I., RIORDAN, P. & MACDONALD, D. 2012b. Does organic farming reduce environmental impacts?–A meta-analysis of European research. Journal of Environmental Management, 112, 309-320.
TUOMISTO, H. L., HODGE, I. D., RIORDAN, P. & MACDONALD, D. W. 2012c. Comparing energy balances, greenhouse gas balances and biodiversity impacts of contrasting farming systems with alternative land uses. Agricultural Systems, 108, 42-49.
129
UNIP 2011. Union Nationale Interprofessionnelle des Plantes Riches en Protéines. Amélioration des performances économiques et environnementales de systèmes de culture avec pois, colza et blé. Rapport final. Ministere de l'agriculture et de la peche. In French.
VAN BUEREN, E. T. L., JONES, S. S., TAMM, L., MURPHY, K. M., MYERS, J. R., LEIFERT, C. & MESSMER, M. M. 2011. The need to breed crop varieties suitable for organic farming, using wheat, tomato and broccoli as examples: A review. NJAS-Wageningen journal of life sciences, 58, 193-205.
VAN DER WERF, H. M. G. 2004. Life Cycle Analysis of Field Production of Fibre Hemp, the Effect of Production Practices on Environmental Impacts. Euphytica, 140, 13-23.
VAN DER WERF, H. M. G., TZILIVAKIS, J., LEWIS, K. & BASSET-MENS, C. 2007. Environmental impacts of farm scenarios according to five assessment methods. Agriculture, Ecosystems & Environment, 118, 327-338.
VAN GEERKEN, T. H., SCHOLLIERS, D., DE VOOGHT, C., SPIRINCKX, V., VAN HOLDERBEKE, M. & VERCALSTEREN, A. 2006. Case study - bread. Sustainability developments of product systems, 1800-2000. . The Belgian Science Policy.
VANDERMEER, J. 1989. The Ecology of Intercropping., Cambridge, UK, Cambridge University Press. VAYSSIÈRES, J., VIGNE, M., ALARY, V. & LECOMTE, P. 2011. Integrated participatory modelling of
actual farms to support policy making on sustainable intensification. Agricultural Systems, 104, 146-161.
VERHEIJEN, F. G. A., JEFFERY, S., BASTOS, A. C., VAN DER VELDE, M. & DIAFAS, I. 2010. Biochar Applications to Soils. A Critical Scientific Review of Effects on Soil Properties, Processes and Functions. EUR 24099 EN. Luxembourg: Office for the Official Publications of the European Communities.
VILLA, T. C. C., MAXTED, N., SCHOLTEN, M. & FORD-LLOYD, B. 2005. Defining and identifying crop landraces. Plant genetic resources: characterization and utilization, 3, 373-384.
VON RICHTHOFEN, J.-S., PAHL, H. & NEMECEK, T. 2006. Deliverable 3.2 - Economic interest of grain legumes in European crop rotations. European extension network for the development of grain legumes production in the EU “GL-Pro”. Muenster, Germany.
WEIDEMA, B. P., WESNÆS, M., HERMANSEN, J., KRISTENSEN, T. & HALBERG, N. 2008. Environmental Improvement Potentials of Meat and Dairy Products. EC-JRC report EUR 23491 EN.
WEST, T. D., GRIFFITH, D. R., STEINHARDT, G. C., KLADIVKO, E. J. & PARSONS, S. D. 1996. Effect of tillage and rotation on agronomic performance of corn and soybean: Twenty-year study on dark silty clay loam soil. Journal of Production Agriculture, 9, 241-248.
WEST, T. O. & POST, W. M. 2002. Soil organic carbon sequestration rates by tillage and crop rotation: A global data analysis. Soil Science Society of America Journal, 66, 1930-1946.
WHITMORE, A. P. & SCHRÖDER, J. J. 2007. Intercropping reduces nitrate leaching from under field crops without loss of yield: A modelling study. European Journal of Agronomy, 27, 81-88.
WILLIAMS, A. 2007. Comparative Study of Cut Roses for the British Market Produced in Kenya and the Netherlands-Précis Report forWorld Flowers-12 February 2007.
WILLIAMS, A. G., AUDSLEY, E. & SANDARS, D. L. 2006. Determining the environmental burdens and resource use in the production of agricultural and horticultural commodities. Defra project report IS0205. Bedford: Cranfield University, DEFRA.
WORLD BANK. 2004. Investments in Sustainable Agricultural Intensification. Agricultural Investment Sourcebook. Module 4. World Bank. Washington, DC.
WORLD BANK. 2013. Data. Agriculture, Value added (percentage of GDP) [Online]. Available: http://data.worldbank.org/ [Accessed 26th February 2014].
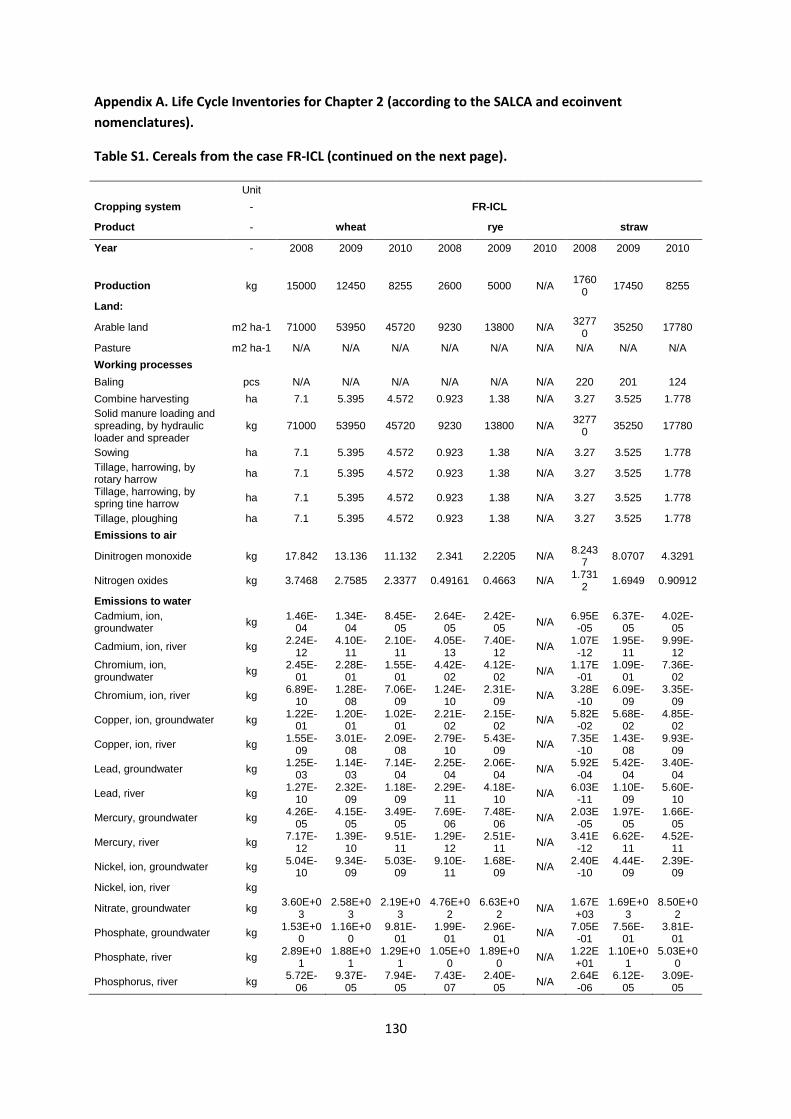
130
Appendix A. Life Cycle Inventories for Chapter 2 (according to the SALCA and ecoinvent
nomenclatures).
Table S1. Cereals from the case FR-ICL (continued on the next page).
Unit
Cropping system - FR-ICL
Product - wheat rye straw
Year - 2008 2009 2010 2008 2009 2010 2008 2009 2010
Production kg 15000 12450 8255 2600 5000 N/A 1760
0 17450 8255
Land:
Arable land m2 ha-1 71000 53950 45720 9230 13800 N/A 3277
0 35250 17780
Pasture m2 ha-1 N/A N/A N/A N/A N/A N/A N/A N/A N/A
Working processes
Baling pcs N/A N/A N/A N/A N/A N/A 220 201 124
Combine harvesting ha 7.1 5.395 4.572 0.923 1.38 N/A 3.27 3.525 1.778
Solid manure loading and spreading, by hydraulic loader and spreader
kg 71000 53950 45720 9230 13800 N/A 3277
0 35250 17780
Sowing ha 7.1 5.395 4.572 0.923 1.38 N/A 3.27 3.525 1.778
Tillage, harrowing, by rotary harrow
ha 7.1 5.395 4.572 0.923 1.38 N/A 3.27 3.525 1.778
Tillage, harrowing, by spring tine harrow
ha 7.1 5.395 4.572 0.923 1.38 N/A 3.27 3.525 1.778
Tillage, ploughing ha 7.1 5.395 4.572 0.923 1.38 N/A 3.27 3.525 1.778
Emissions to air
Dinitrogen monoxide kg 17.842 13.136 11.132 2.341 2.2205 N/A 8.243
7 8.0707 4.3291
Nitrogen oxides kg 3.7468 2.7585 2.3377 0.49161 0.4663 N/A 1.731
2 1.6949 0.90912
Emissions to water
Cadmium, ion, groundwater
kg 1.46E-
04 1.34E-
04 8.45E-
05 2.64E-
05 2.42E-
05 N/A
6.95E-05
6.37E-05
4.02E-05
Cadmium, ion, river kg 2.24E-
12 4.10E-
11 2.10E-
11 4.05E-
13 7.40E-
12 N/A
1.07E-12
1.95E-11
9.99E-12
Chromium, ion, groundwater
kg 2.45E-
01 2.28E-
01 1.55E-
01 4.42E-
02 4.12E-
02 N/A
1.17E-01
1.09E-01
7.36E-02
Chromium, ion, river kg 6.89E-
10 1.28E-
08 7.06E-
09 1.24E-
10 2.31E-
09 N/A
3.28E-10
6.09E-09
3.35E-09
Copper, ion, groundwater kg 1.22E-
01 1.20E-
01 1.02E-
01 2.21E-
02 2.15E-
02 N/A
5.82E-02
5.68E-02
4.85E-02
Copper, ion, river kg 1.55E-
09 3.01E-
08 2.09E-
08 2.79E-
10 5.43E-
09 N/A
7.35E-10
1.43E-08
9.93E-09
Lead, groundwater kg 1.25E-
03 1.14E-
03 7.14E-
04 2.25E-
04 2.06E-
04 N/A
5.92E-04
5.42E-04
3.40E-04
Lead, river kg 1.27E-
10 2.32E-
09 1.18E-
09 2.29E-
11 4.18E-
10 N/A
6.03E-11
1.10E-09
5.60E-10
Mercury, groundwater kg 4.26E-
05 4.15E-
05 3.49E-
05 7.69E-
06 7.48E-
06 N/A
2.03E-05
1.97E-05
1.66E-05
Mercury, river kg 7.17E-
12 1.39E-
10 9.51E-
11 1.29E-
12 2.51E-
11 N/A
3.41E-12
6.62E-11
4.52E-11
Nickel, ion, groundwater kg 5.04E-
10 9.34E-
09 5.03E-
09 9.10E-
11 1.68E-
09 N/A
2.40E-10
4.44E-09
2.39E-09
Nickel, ion, river kg
Nitrate, groundwater kg 3.60E+0
3 2.58E+0
3 2.19E+0
3 4.76E+0
2 6.63E+0
2 N/A
1.67E+03
1.69E+03
8.50E+02
Phosphate, groundwater kg 1.53E+0
0 1.16E+0
0 9.81E-
01 1.99E-
01 2.96E-
01 N/A
7.05E-01
7.56E-01
3.81E-01
Phosphate, river kg 2.89E+0
1 1.88E+0
1 1.29E+0
1 1.05E+0
0 1.89E+0
0 N/A
1.22E+01
1.10E+01
5.03E+00
Phosphorus, river kg 5.72E-
06 9.37E-
05 7.94E-
05 7.43E-
07 2.40E-
05 N/A
2.64E-06
6.12E-05
3.09E-05
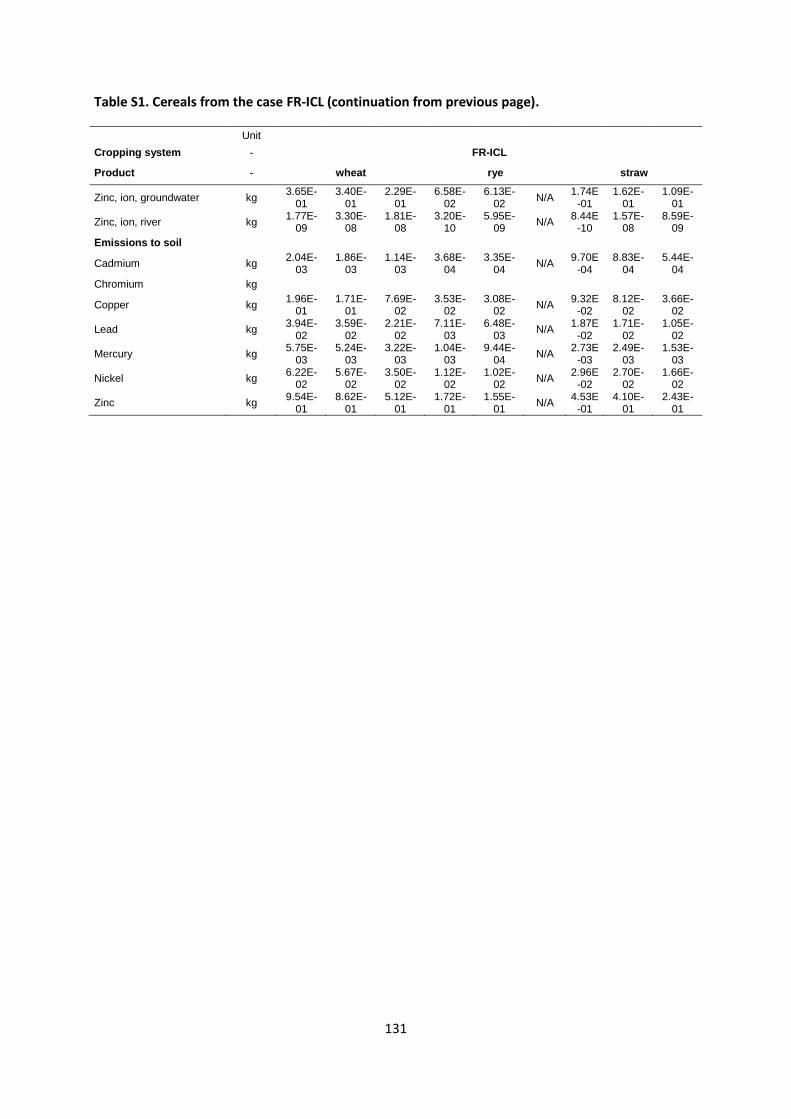
131
Table S1. Cereals from the case FR-ICL (continuation from previous page).
Unit
Cropping system - FR-ICL
Product - wheat rye straw
Zinc, ion, groundwater kg 3.65E-
01 3.40E-
01 2.29E-
01 6.58E-
02 6.13E-
02 N/A
1.74E-01
1.62E-01
1.09E-01
Zinc, ion, river kg 1.77E-
09 3.30E-
08 1.81E-
08 3.20E-
10 5.95E-
09 N/A
8.44E-10
1.57E-08
8.59E-09
Emissions to soil
Cadmium kg 2.04E-
03 1.86E-
03 1.14E-
03 3.68E-
04 3.35E-
04 N/A
9.70E-04
8.83E-04
5.44E-04
Chromium kg
Copper kg 1.96E-
01 1.71E-
01 7.69E-
02 3.53E-
02 3.08E-
02 N/A
9.32E-02
8.12E-02
3.66E-02
Lead kg 3.94E-
02 3.59E-
02 2.21E-
02 7.11E-
03 6.48E-
03 N/A
1.87E-02
1.71E-02
1.05E-02
Mercury kg 5.75E-
03 5.24E-
03 3.22E-
03 1.04E-
03 9.44E-
04 N/A
2.73E-03
2.49E-03
1.53E-03
Nickel kg 6.22E-
02 5.67E-
02 3.50E-
02 1.12E-
02 1.02E-
02 N/A
2.96E-02
2.70E-02
1.66E-02
Zinc kg 9.54E-
01 8.62E-
01 5.12E-
01 1.72E-
01 1.55E-
01 N/A
4.53E-01
4.10E-01
2.43E-01
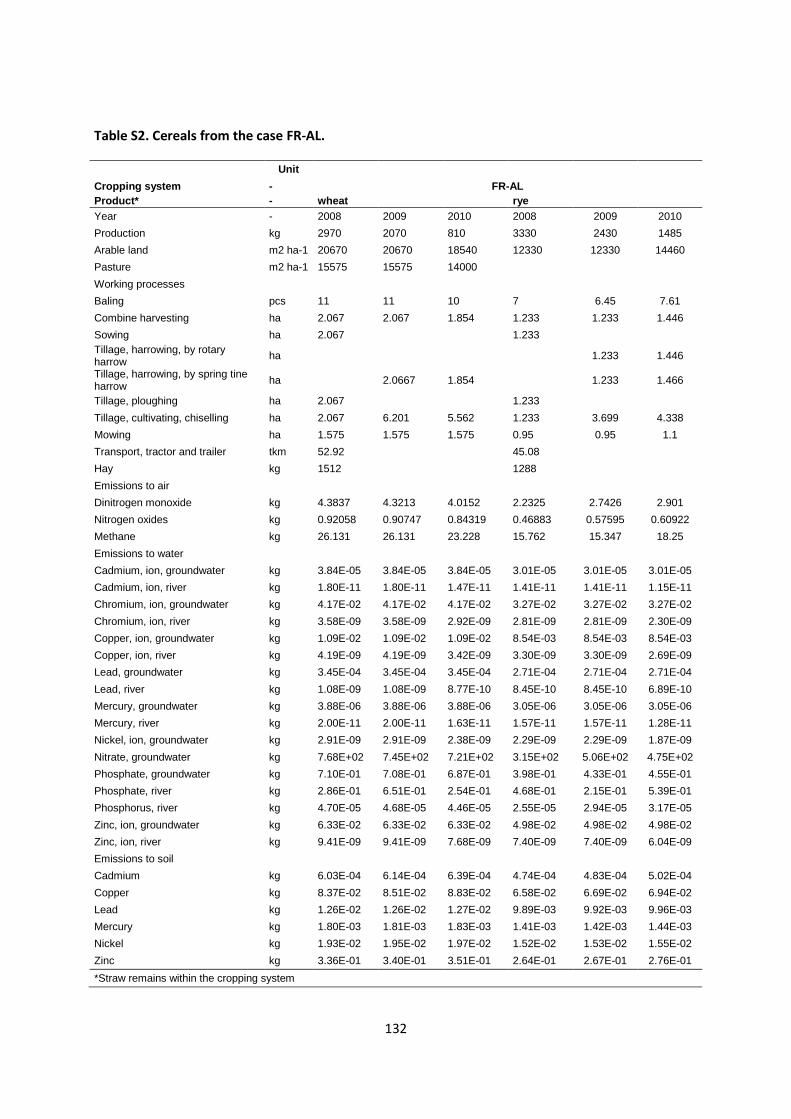
132
Table S2. Cereals from the case FR-AL.
Unit
Cropping system - FR-AL
Product* - wheat rye
Year - 2008 2009 2010 2008 2009 2010
Production kg 2970 2070 810 3330 2430 1485
Arable land m2 ha-1 20670 20670 18540 12330 12330 14460
Pasture m2 ha-1 15575 15575 14000
Working processes
Baling pcs 11 11 10 7 6.45 7.61
Combine harvesting ha 2.067 2.067 1.854 1.233 1.233 1.446
Sowing ha 2.067
1.233
Tillage, harrowing, by rotary harrow
ha
1.233 1.446
Tillage, harrowing, by spring tine harrow
ha
2.0667 1.854
1.233 1.466
Tillage, ploughing ha 2.067
1.233
Tillage, cultivating, chiselling ha 2.067 6.201 5.562 1.233 3.699 4.338
Mowing ha 1.575 1.575 1.575 0.95 0.95 1.1
Transport, tractor and trailer tkm 52.92
45.08
Hay kg 1512
1288
Emissions to air
Dinitrogen monoxide kg 4.3837 4.3213 4.0152 2.2325 2.7426 2.901
Nitrogen oxides kg 0.92058 0.90747 0.84319 0.46883 0.57595 0.60922
Methane kg 26.131 26.131 23.228 15.762 15.347 18.25
Emissions to water
Cadmium, ion, groundwater kg 3.84E-05 3.84E-05 3.84E-05 3.01E-05 3.01E-05 3.01E-05
Cadmium, ion, river kg 1.80E-11 1.80E-11 1.47E-11 1.41E-11 1.41E-11 1.15E-11
Chromium, ion, groundwater kg 4.17E-02 4.17E-02 4.17E-02 3.27E-02 3.27E-02 3.27E-02
Chromium, ion, river kg 3.58E-09 3.58E-09 2.92E-09 2.81E-09 2.81E-09 2.30E-09
Copper, ion, groundwater kg 1.09E-02 1.09E-02 1.09E-02 8.54E-03 8.54E-03 8.54E-03
Copper, ion, river kg 4.19E-09 4.19E-09 3.42E-09 3.30E-09 3.30E-09 2.69E-09
Lead, groundwater kg 3.45E-04 3.45E-04 3.45E-04 2.71E-04 2.71E-04 2.71E-04
Lead, river kg 1.08E-09 1.08E-09 8.77E-10 8.45E-10 8.45E-10 6.89E-10
Mercury, groundwater kg 3.88E-06 3.88E-06 3.88E-06 3.05E-06 3.05E-06 3.05E-06
Mercury, river kg 2.00E-11 2.00E-11 1.63E-11 1.57E-11 1.57E-11 1.28E-11
Nickel, ion, groundwater kg 2.91E-09 2.91E-09 2.38E-09 2.29E-09 2.29E-09 1.87E-09
Nitrate, groundwater kg 7.68E+02 7.45E+02 7.21E+02 3.15E+02 5.06E+02 4.75E+02
Phosphate, groundwater kg 7.10E-01 7.08E-01 6.87E-01 3.98E-01 4.33E-01 4.55E-01
Phosphate, river kg 2.86E-01 6.51E-01 2.54E-01 4.68E-01 2.15E-01 5.39E-01
Phosphorus, river kg 4.70E-05 4.68E-05 4.46E-05 2.55E-05 2.94E-05 3.17E-05
Zinc, ion, groundwater kg 6.33E-02 6.33E-02 6.33E-02 4.98E-02 4.98E-02 4.98E-02
Zinc, ion, river kg 9.41E-09 9.41E-09 7.68E-09 7.40E-09 7.40E-09 6.04E-09
Emissions to soil
Cadmium kg 6.03E-04 6.14E-04 6.39E-04 4.74E-04 4.83E-04 5.02E-04
Copper kg 8.37E-02 8.51E-02 8.83E-02 6.58E-02 6.69E-02 6.94E-02
Lead kg 1.26E-02 1.26E-02 1.27E-02 9.89E-03 9.92E-03 9.96E-03
Mercury kg 1.80E-03 1.81E-03 1.83E-03 1.41E-03 1.42E-03 1.44E-03
Nickel kg 1.93E-02 1.95E-02 1.97E-02 1.52E-02 1.53E-02 1.55E-02
Zinc kg 3.36E-01 3.40E-01 3.51E-01 2.64E-01 2.67E-01 2.76E-01
*Straw remains within the cropping system
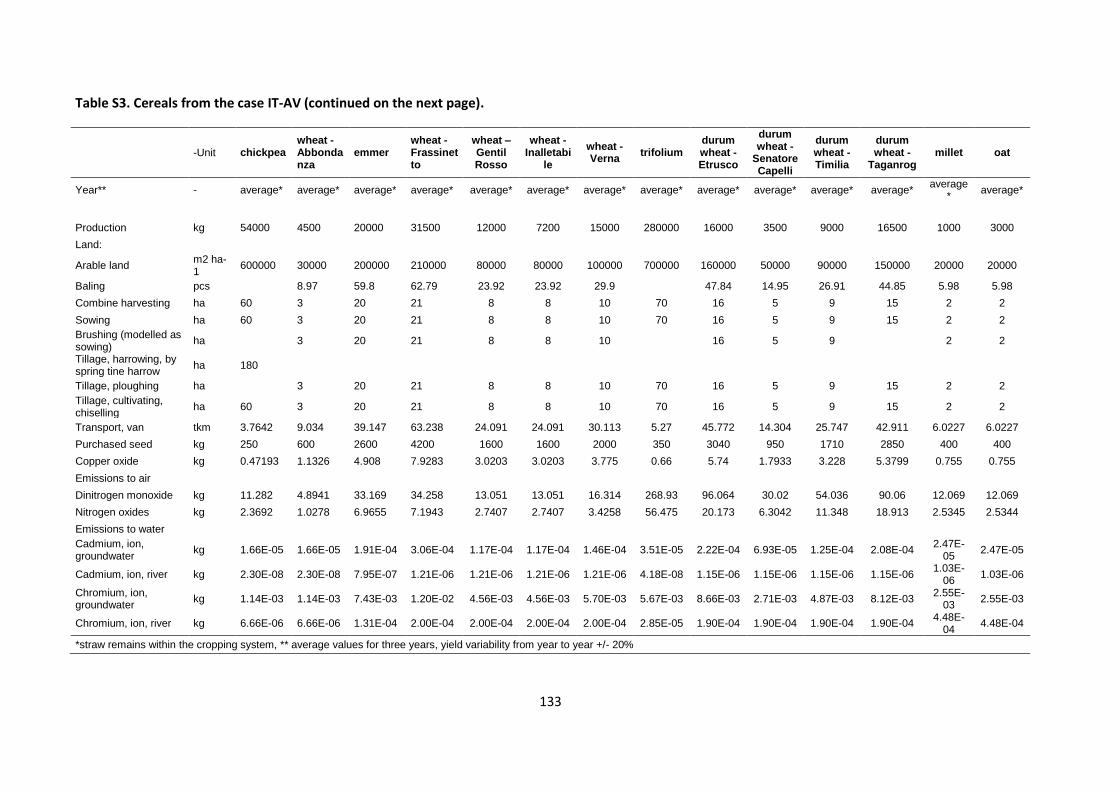
133
Table S3. Cereals from the case IT-AV (continued on the next page).
-Unit chickpea
wheat - Abbondanza
emmer wheat - Frassinetto
wheat – Gentil Rosso
wheat - Inalletabi
le
wheat - Verna
trifolium durum wheat - Etrusco
durum wheat -
Senatore Capelli
durum wheat - Timilia
durum wheat -
Taganrog millet oat
Year** - average* average* average* average* average* average* average* average* average* average* average* average* average
* average*
Production kg 54000 4500 20000 31500 12000 7200 15000 280000 16000 3500 9000 16500 1000 3000
Land:
Arable land m2 ha-1
600000 30000 200000 210000 80000 80000 100000 700000 160000 50000 90000 150000 20000 20000
Baling pcs
8.97 59.8 62.79 23.92 23.92 29.9
47.84 14.95 26.91 44.85 5.98 5.98
Combine harvesting ha 60 3 20 21 8 8 10 70 16 5 9 15 2 2
Sowing ha 60 3 20 21 8 8 10 70 16 5 9 15 2 2
Brushing (modelled as sowing)
ha
3 20 21 8 8 10
16 5 9
2 2
Tillage, harrowing, by spring tine harrow
ha 180
Tillage, ploughing ha
3 20 21 8 8 10 70 16 5 9 15 2 2
Tillage, cultivating, chiselling
ha 60 3 20 21 8 8 10 70 16 5 9 15 2 2
Transport, van tkm 3.7642 9.034 39.147 63.238 24.091 24.091 30.113 5.27 45.772 14.304 25.747 42.911 6.0227 6.0227
Purchased seed kg 250 600 2600 4200 1600 1600 2000 350 3040 950 1710 2850 400 400
Copper oxide kg 0.47193 1.1326 4.908 7.9283 3.0203 3.0203 3.775 0.66 5.74 1.7933 3.228 5.3799 0.755 0.755
Emissions to air
Dinitrogen monoxide kg 11.282 4.8941 33.169 34.258 13.051 13.051 16.314 268.93 96.064 30.02 54.036 90.06 12.069 12.069
Nitrogen oxides kg 2.3692 1.0278 6.9655 7.1943 2.7407 2.7407 3.4258 56.475 20.173 6.3042 11.348 18.913 2.5345 2.5344
Emissions to water
Cadmium, ion, groundwater
kg 1.66E-05 1.66E-05 1.91E-04 3.06E-04 1.17E-04 1.17E-04 1.46E-04 3.51E-05 2.22E-04 6.93E-05 1.25E-04 2.08E-04 2.47E-
05 2.47E-05
Cadmium, ion, river kg 2.30E-08 2.30E-08 7.95E-07 1.21E-06 1.21E-06 1.21E-06 1.21E-06 4.18E-08 1.15E-06 1.15E-06 1.15E-06 1.15E-06 1.03E-
06 1.03E-06
Chromium, ion, groundwater
kg 1.14E-03 1.14E-03 7.43E-03 1.20E-02 4.56E-03 4.56E-03 5.70E-03 5.67E-03 8.66E-03 2.71E-03 4.87E-03 8.12E-03 2.55E-
03 2.55E-03
Chromium, ion, river kg 6.66E-06 6.66E-06 1.31E-04 2.00E-04 2.00E-04 2.00E-04 2.00E-04 2.85E-05 1.90E-04 1.90E-04 1.90E-04 1.90E-04 4.48E-
04 4.48E-04
*straw remains within the cropping system, ** average values for three years, yield variability from year to year +/- 20%
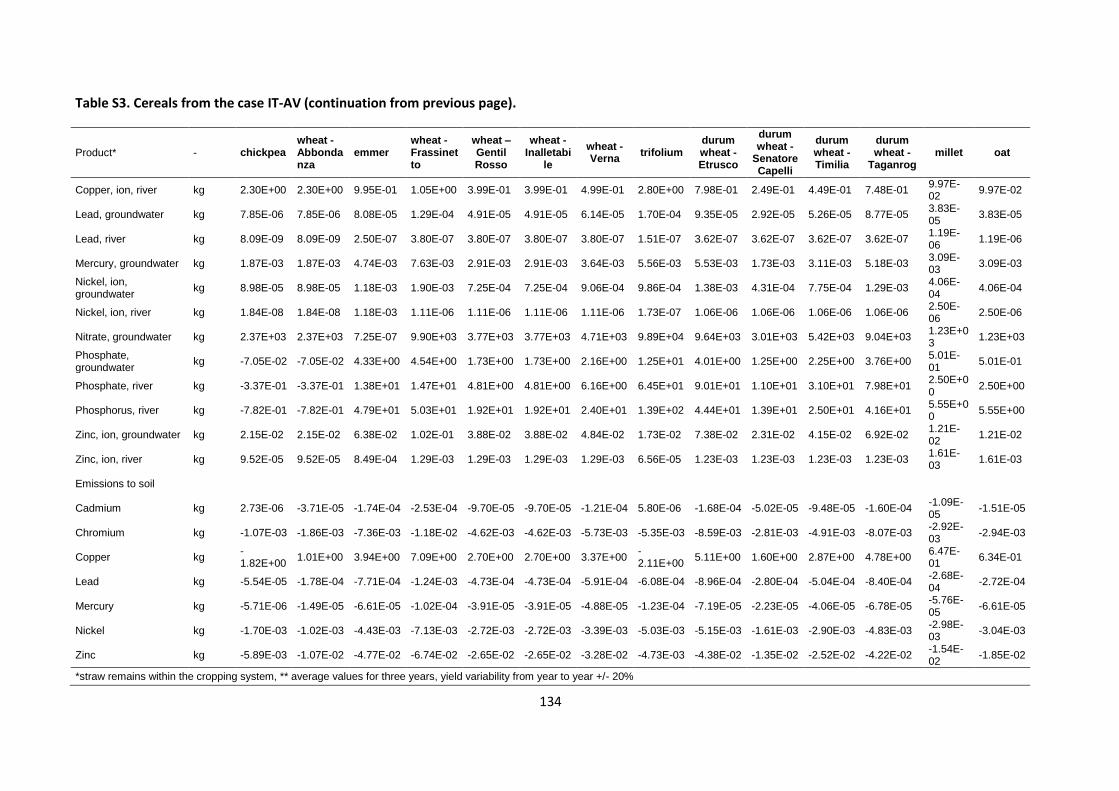
134
Table S3. Cereals from the case IT-AV (continuation from previous page).
Product* - chickpea wheat - Abbondanza
emmer wheat - Frassinetto
wheat – Gentil Rosso
wheat - Inalletabi
le
wheat - Verna
trifolium durum wheat - Etrusco
durum wheat -
Senatore Capelli
durum wheat - Timilia
durum wheat -
Taganrog millet oat
Copper, ion, river kg 2.30E+00 2.30E+00 9.95E-01 1.05E+00 3.99E-01 3.99E-01 4.99E-01 2.80E+00 7.98E-01 2.49E-01 4.49E-01 7.48E-01 9.97E-02
9.97E-02
Lead, groundwater kg 7.85E-06 7.85E-06 8.08E-05 1.29E-04 4.91E-05 4.91E-05 6.14E-05 1.70E-04 9.35E-05 2.92E-05 5.26E-05 8.77E-05 3.83E-05
3.83E-05
Lead, river kg 8.09E-09 8.09E-09 2.50E-07 3.80E-07 3.80E-07 3.80E-07 3.80E-07 1.51E-07 3.62E-07 3.62E-07 3.62E-07 3.62E-07 1.19E-06
1.19E-06
Mercury, groundwater kg 1.87E-03 1.87E-03 4.74E-03 7.63E-03 2.91E-03 2.91E-03 3.64E-03 5.56E-03 5.53E-03 1.73E-03 3.11E-03 5.18E-03 3.09E-03
3.09E-03
Nickel, ion, groundwater
kg 8.98E-05 8.98E-05 1.18E-03 1.90E-03 7.25E-04 7.25E-04 9.06E-04 9.86E-04 1.38E-03 4.31E-04 7.75E-04 1.29E-03 4.06E-04
4.06E-04
Nickel, ion, river kg 1.84E-08 1.84E-08 1.18E-03 1.11E-06 1.11E-06 1.11E-06 1.11E-06 1.73E-07 1.06E-06 1.06E-06 1.06E-06 1.06E-06 2.50E-06
2.50E-06
Nitrate, groundwater kg 2.37E+03 2.37E+03 7.25E-07 9.90E+03 3.77E+03 3.77E+03 4.71E+03 9.89E+04 9.64E+03 3.01E+03 5.42E+03 9.04E+03 1.23E+03
1.23E+03
Phosphate, groundwater
kg -7.05E-02 -7.05E-02 4.33E+00 4.54E+00 1.73E+00 1.73E+00 2.16E+00 1.25E+01 4.01E+00 1.25E+00 2.25E+00 3.76E+00 5.01E-01
5.01E-01
Phosphate, river kg -3.37E-01 -3.37E-01 1.38E+01 1.47E+01 4.81E+00 4.81E+00 6.16E+00 6.45E+01 9.01E+01 1.10E+01 3.10E+01 7.98E+01 2.50E+00
2.50E+00
Phosphorus, river kg -7.82E-01 -7.82E-01 4.79E+01 5.03E+01 1.92E+01 1.92E+01 2.40E+01 1.39E+02 4.44E+01 1.39E+01 2.50E+01 4.16E+01 5.55E+00
5.55E+00
Zinc, ion, groundwater kg 2.15E-02 2.15E-02 6.38E-02 1.02E-01 3.88E-02 3.88E-02 4.84E-02 1.73E-02 7.38E-02 2.31E-02 4.15E-02 6.92E-02 1.21E-02
1.21E-02
Zinc, ion, river kg 9.52E-05 9.52E-05 8.49E-04 1.29E-03 1.29E-03 1.29E-03 1.29E-03 6.56E-05 1.23E-03 1.23E-03 1.23E-03 1.23E-03 1.61E-03
1.61E-03
Emissions to soil
Cadmium kg 2.73E-06 -3.71E-05 -1.74E-04 -2.53E-04 -9.70E-05 -9.70E-05 -1.21E-04 5.80E-06 -1.68E-04 -5.02E-05 -9.48E-05 -1.60E-04 -1.09E-05
-1.51E-05
Chromium kg -1.07E-03 -1.86E-03 -7.36E-03 -1.18E-02 -4.62E-03 -4.62E-03 -5.73E-03 -5.35E-03 -8.59E-03 -2.81E-03 -4.91E-03 -8.07E-03 -2.92E-03
-2.94E-03
Copper kg -1.82E+00
1.01E+00 3.94E+00 7.09E+00 2.70E+00 2.70E+00 3.37E+00 -2.11E+00
5.11E+00 1.60E+00 2.87E+00 4.78E+00 6.47E-01
6.34E-01
Lead kg -5.54E-05 -1.78E-04 -7.71E-04 -1.24E-03 -4.73E-04 -4.73E-04 -5.91E-04 -6.08E-04 -8.96E-04 -2.80E-04 -5.04E-04 -8.40E-04 -2.68E-04
-2.72E-04
Mercury kg -5.71E-06 -1.49E-05 -6.61E-05 -1.02E-04 -3.91E-05 -3.91E-05 -4.88E-05 -1.23E-04 -7.19E-05 -2.23E-05 -4.06E-05 -6.78E-05 -5.76E-05
-6.61E-05
Nickel kg -1.70E-03 -1.02E-03 -4.43E-03 -7.13E-03 -2.72E-03 -2.72E-03 -3.39E-03 -5.03E-03 -5.15E-03 -1.61E-03 -2.90E-03 -4.83E-03 -2.98E-03
-3.04E-03
Zinc kg -5.89E-03 -1.07E-02 -4.77E-02 -6.74E-02 -2.65E-02 -2.65E-02 -3.28E-02 -4.73E-03 -4.38E-02 -1.35E-02 -2.52E-02 -4.22E-02 -1.54E-02
-1.85E-02
*straw remains within the cropping system, ** average values for three years, yield variability from year to year +/- 20%
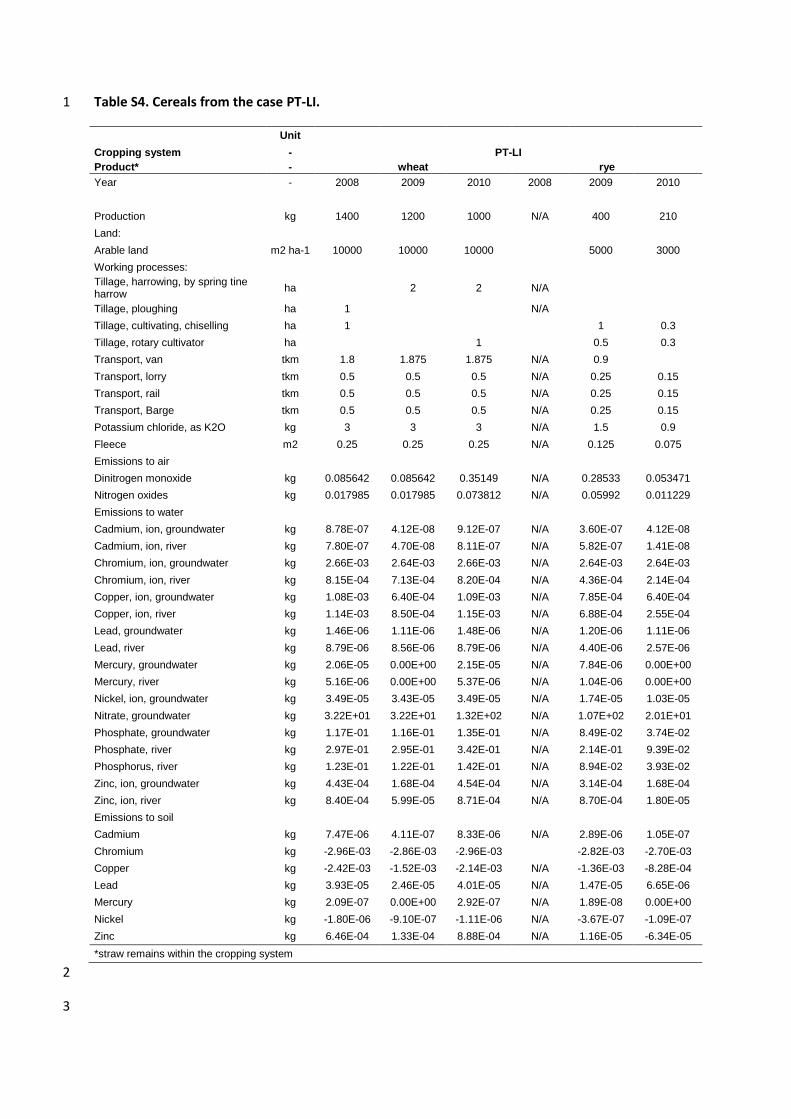
Table S4. Cereals from the case PT-LI. 1
Unit
Cropping system - PT-LI
Product* - wheat rye
Year - 2008 2009 2010 2008 2009 2010
Production kg 1400 1200 1000 N/A 400 210
Land:
Arable land m2 ha-1 10000 10000 10000
5000 3000
Working processes:
Tillage, harrowing, by spring tine harrow
ha
2 2 N/A
Tillage, ploughing ha 1
N/A
Tillage, cultivating, chiselling ha 1
1 0.3
Tillage, rotary cultivator ha
1
0.5 0.3
Transport, van tkm 1.8 1.875 1.875 N/A 0.9
Transport, lorry tkm 0.5 0.5 0.5 N/A 0.25 0.15
Transport, rail tkm 0.5 0.5 0.5 N/A 0.25 0.15
Transport, Barge tkm 0.5 0.5 0.5 N/A 0.25 0.15
Potassium chloride, as K2O kg 3 3 3 N/A 1.5 0.9
Fleece m2 0.25 0.25 0.25 N/A 0.125 0.075
Emissions to air
Dinitrogen monoxide kg 0.085642 0.085642 0.35149 N/A 0.28533 0.053471
Nitrogen oxides kg 0.017985 0.017985 0.073812 N/A 0.05992 0.011229
Emissions to water
Cadmium, ion, groundwater kg 8.78E-07 4.12E-08 9.12E-07 N/A 3.60E-07 4.12E-08
Cadmium, ion, river kg 7.80E-07 4.70E-08 8.11E-07 N/A 5.82E-07 1.41E-08
Chromium, ion, groundwater kg 2.66E-03 2.64E-03 2.66E-03 N/A 2.64E-03 2.64E-03
Chromium, ion, river kg 8.15E-04 7.13E-04 8.20E-04 N/A 4.36E-04 2.14E-04
Copper, ion, groundwater kg 1.08E-03 6.40E-04 1.09E-03 N/A 7.85E-04 6.40E-04
Copper, ion, river kg 1.14E-03 8.50E-04 1.15E-03 N/A 6.88E-04 2.55E-04
Lead, groundwater kg 1.46E-06 1.11E-06 1.48E-06 N/A 1.20E-06 1.11E-06
Lead, river kg 8.79E-06 8.56E-06 8.79E-06 N/A 4.40E-06 2.57E-06
Mercury, groundwater kg 2.06E-05 0.00E+00 2.15E-05 N/A 7.84E-06 0.00E+00
Mercury, river kg 5.16E-06 0.00E+00 5.37E-06 N/A 1.04E-06 0.00E+00
Nickel, ion, groundwater kg 3.49E-05 3.43E-05 3.49E-05 N/A 1.74E-05 1.03E-05
Nitrate, groundwater kg 3.22E+01 3.22E+01 1.32E+02 N/A 1.07E+02 2.01E+01
Phosphate, groundwater kg 1.17E-01 1.16E-01 1.35E-01 N/A 8.49E-02 3.74E-02
Phosphate, river kg 2.97E-01 2.95E-01 3.42E-01 N/A 2.14E-01 9.39E-02
Phosphorus, river kg 1.23E-01 1.22E-01 1.42E-01 N/A 8.94E-02 3.93E-02
Zinc, ion, groundwater kg 4.43E-04 1.68E-04 4.54E-04 N/A 3.14E-04 1.68E-04
Zinc, ion, river kg 8.40E-04 5.99E-05 8.71E-04 N/A 8.70E-04 1.80E-05
Emissions to soil
Cadmium kg 7.47E-06 4.11E-07 8.33E-06 N/A 2.89E-06 1.05E-07
Chromium kg -2.96E-03 -2.86E-03 -2.96E-03
-2.82E-03 -2.70E-03
Copper kg -2.42E-03 -1.52E-03 -2.14E-03 N/A -1.36E-03 -8.28E-04
Lead kg 3.93E-05 2.46E-05 4.01E-05 N/A 1.47E-05 6.65E-06
Mercury kg 2.09E-07 0.00E+00 2.92E-07 N/A 1.89E-08 0.00E+00
Nickel kg -1.80E-06 -9.10E-07 -1.11E-06 N/A -3.67E-07 -1.09E-07
Zinc kg 6.46E-04 1.33E-04 8.88E-04 N/A 1.16E-05 -6.34E-05
*straw remains within the cropping system
2
3
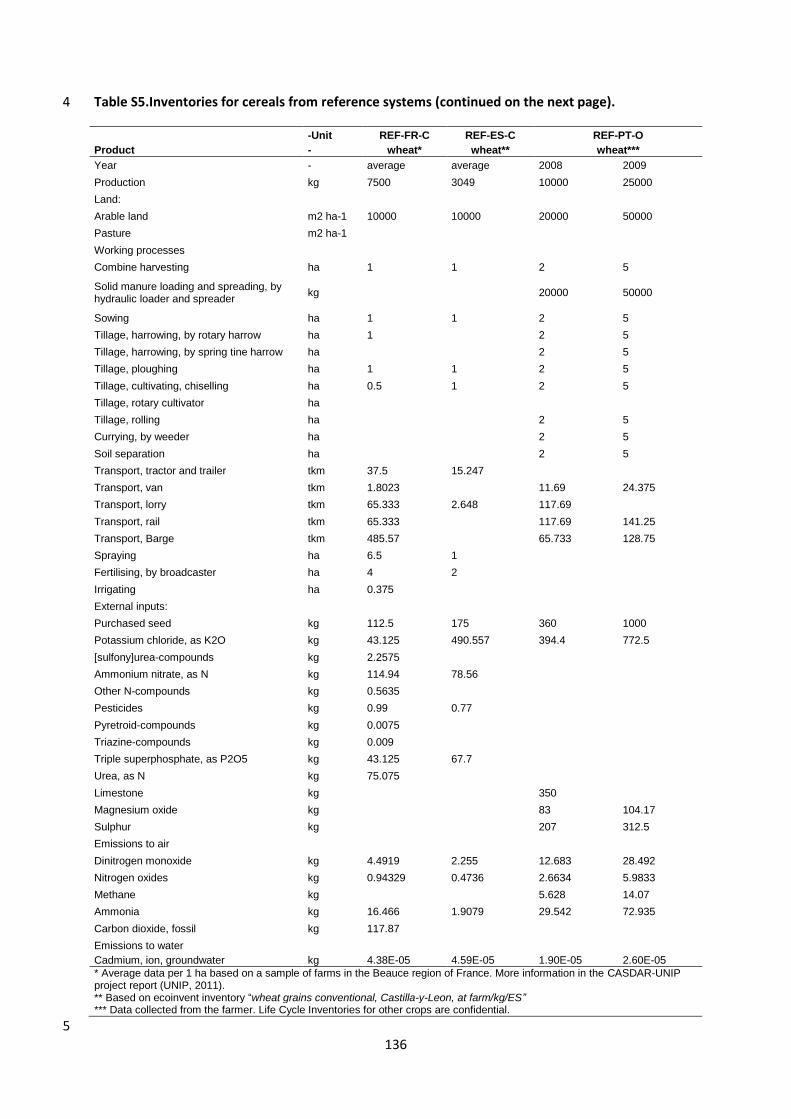
136
Table S5.Inventories for cereals from reference systems (continued on the next page). 4
-Unit REF-FR-C REF-ES-C REF-PT-O
Product - wheat* wheat** wheat***
Year - average average 2008 2009
Production kg 7500 3049 10000 25000
Land:
Arable land m2 ha-1 10000 10000 20000 50000
Pasture m2 ha-1
Working processes
Combine harvesting ha 1 1 2 5
Solid manure loading and spreading, by hydraulic loader and spreader
kg
20000 50000
Sowing ha 1 1 2 5
Tillage, harrowing, by rotary harrow ha 1
2 5
Tillage, harrowing, by spring tine harrow ha
2 5
Tillage, ploughing ha 1 1 2 5
Tillage, cultivating, chiselling ha 0.5 1 2 5
Tillage, rotary cultivator ha
Tillage, rolling ha
2 5
Currying, by weeder ha
2 5
Soil separation ha
2 5
Transport, tractor and trailer tkm 37.5 15.247
Transport, van tkm 1.8023
11.69 24.375
Transport, lorry tkm 65.333 2.648 117.69
Transport, rail tkm 65.333
117.69 141.25
Transport, Barge tkm 485.57
65.733 128.75
Spraying ha 6.5 1
Fertilising, by broadcaster ha 4 2
Irrigating ha 0.375
External inputs:
Purchased seed kg 112.5 175 360 1000
Potassium chloride, as K2O kg 43.125 490.557 394.4 772.5
[sulfony]urea-compounds kg 2.2575
Ammonium nitrate, as N kg 114.94 78.56
Other N-compounds kg 0.5635
Pesticides kg 0.99 0.77
Pyretroid-compounds kg 0.0075
Triazine-compounds kg 0.009
Triple superphosphate, as P2O5 kg 43.125 67.7
Urea, as N kg 75.075
Limestone kg
350
Magnesium oxide kg
83 104.17
Sulphur kg
207 312.5
Emissions to air
Dinitrogen monoxide kg 4.4919 2.255 12.683 28.492
Nitrogen oxides kg 0.94329 0.4736 2.6634 5.9833
Methane kg
5.628 14.07
Ammonia kg 16.466 1.9079 29.542 72.935
Carbon dioxide, fossil kg 117.87
Emissions to water
Cadmium, ion, groundwater kg 4.38E-05 4.59E-05 1.90E-05 2.60E-05
* Average data per 1 ha based on a sample of farms in the Beauce region of France. More information in the CASDAR-UNIP project report (UNIP, 2011). ** Based on ecoinvent inventory “wheat grains conventional, Castilla-y-Leon, at farm/kg/ES” *** Data collected from the farmer. Life Cycle Inventories for other crops are confidential.
5
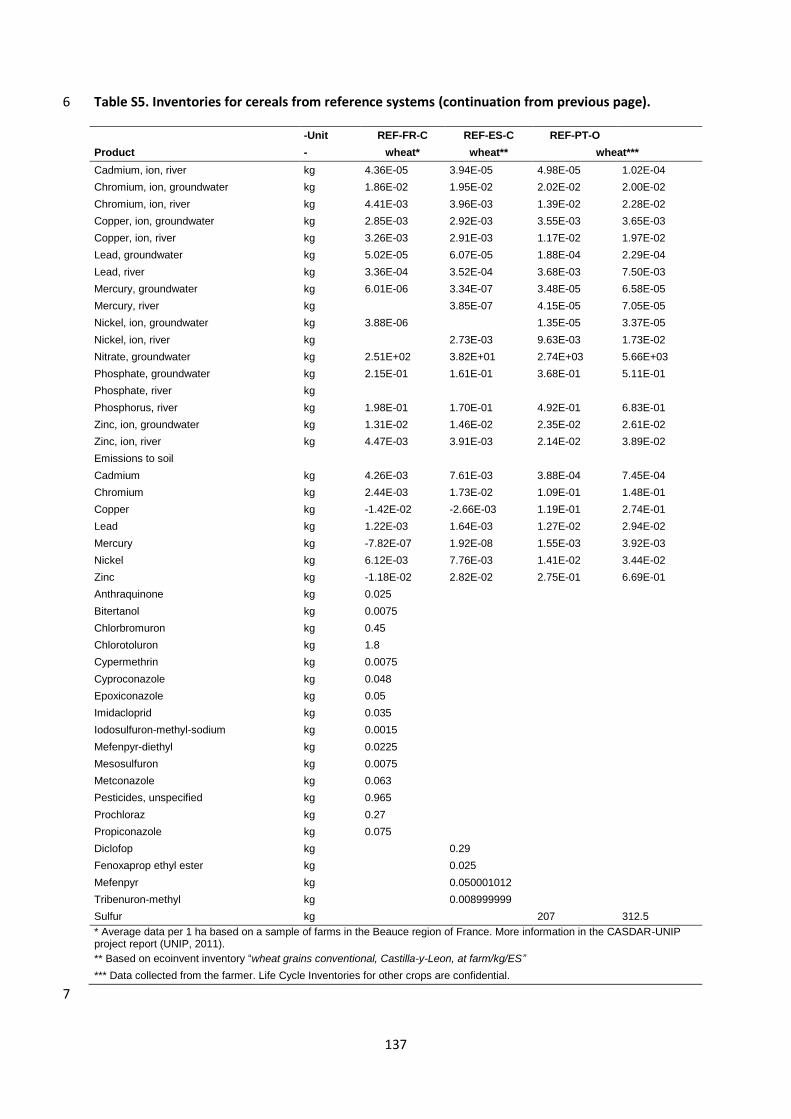
137
Table S5. Inventories for cereals from reference systems (continuation from previous page). 6
-Unit REF-FR-C REF-ES-C REF-PT-O
Product - wheat* wheat** wheat***
Cadmium, ion, river kg 4.36E-05 3.94E-05 4.98E-05 1.02E-04
Chromium, ion, groundwater kg 1.86E-02 1.95E-02 2.02E-02 2.00E-02
Chromium, ion, river kg 4.41E-03 3.96E-03 1.39E-02 2.28E-02
Copper, ion, groundwater kg 2.85E-03 2.92E-03 3.55E-03 3.65E-03
Copper, ion, river kg 3.26E-03 2.91E-03 1.17E-02 1.97E-02
Lead, groundwater kg 5.02E-05 6.07E-05 1.88E-04 2.29E-04
Lead, river kg 3.36E-04 3.52E-04 3.68E-03 7.50E-03
Mercury, groundwater kg 6.01E-06 3.34E-07 3.48E-05 6.58E-05
Mercury, river kg
3.85E-07 4.15E-05 7.05E-05
Nickel, ion, groundwater kg 3.88E-06
1.35E-05 3.37E-05
Nickel, ion, river kg
2.73E-03 9.63E-03 1.73E-02
Nitrate, groundwater kg 2.51E+02 3.82E+01 2.74E+03 5.66E+03
Phosphate, groundwater kg 2.15E-01 1.61E-01 3.68E-01 5.11E-01
Phosphate, river kg
Phosphorus, river kg 1.98E-01 1.70E-01 4.92E-01 6.83E-01
Zinc, ion, groundwater kg 1.31E-02 1.46E-02 2.35E-02 2.61E-02
Zinc, ion, river kg 4.47E-03 3.91E-03 2.14E-02 3.89E-02
Emissions to soil
Cadmium kg 4.26E-03 7.61E-03 3.88E-04 7.45E-04
Chromium kg 2.44E-03 1.73E-02 1.09E-01 1.48E-01
Copper kg -1.42E-02 -2.66E-03 1.19E-01 2.74E-01
Lead kg 1.22E-03 1.64E-03 1.27E-02 2.94E-02
Mercury kg -7.82E-07 1.92E-08 1.55E-03 3.92E-03
Nickel kg 6.12E-03 7.76E-03 1.41E-02 3.44E-02
Zinc kg -1.18E-02 2.82E-02 2.75E-01 6.69E-01
Anthraquinone kg 0.025
Bitertanol kg 0.0075
Chlorbromuron kg 0.45
Chlorotoluron kg 1.8
Cypermethrin kg 0.0075
Cyproconazole kg 0.048
Epoxiconazole kg 0.05
Imidacloprid kg 0.035
Iodosulfuron-methyl-sodium kg 0.0015
Mefenpyr-diethyl kg 0.0225
Mesosulfuron kg 0.0075
Metconazole kg 0.063
Pesticides, unspecified kg 0.965
Prochloraz kg 0.27
Propiconazole kg 0.075
Diclofop kg
0.29
Fenoxaprop ethyl ester kg
0.025
Mefenpyr kg
0.050001012
Tribenuron-methyl kg
0.008999999
Sulfur kg
207 312.5
* Average data per 1 ha based on a sample of farms in the Beauce region of France. More information in the CASDAR-UNIP project report (UNIP, 2011).
** Based on ecoinvent inventory “wheat grains conventional, Castilla-y-Leon, at farm/kg/ES”
*** Data collected from the farmer. Life Cycle Inventories for other crops are confidential.
7
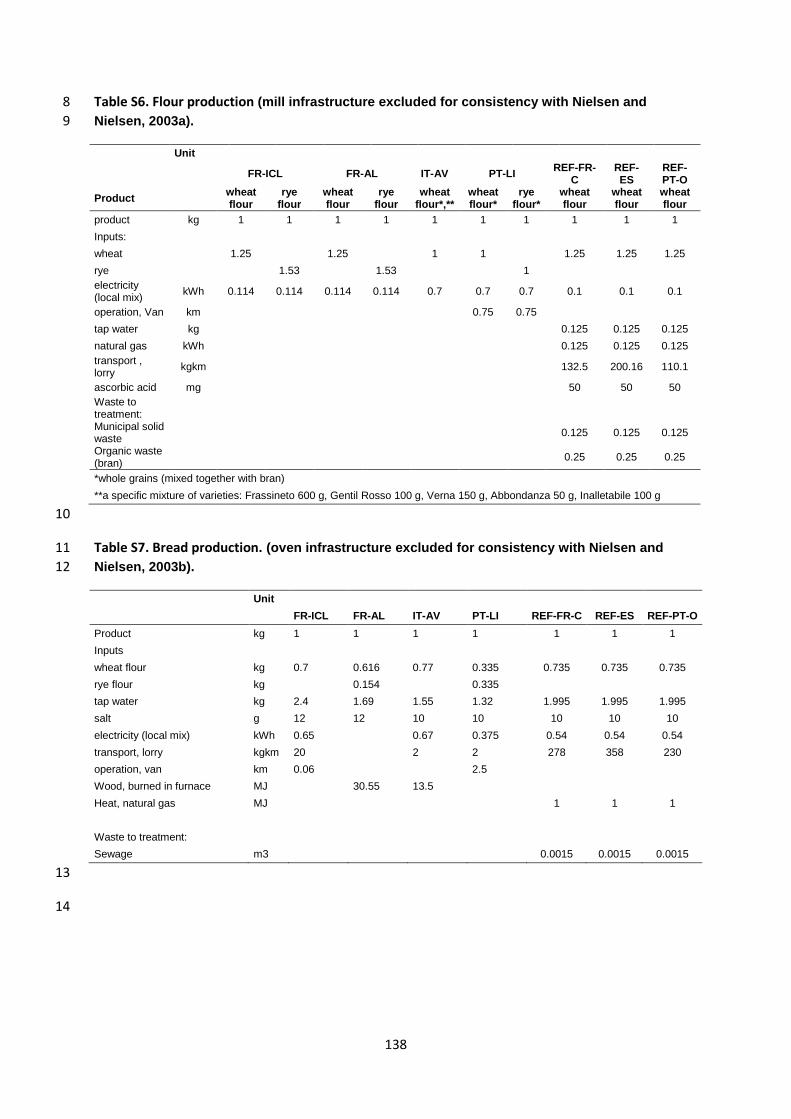
138
Table S6. Flour production (mill infrastructure excluded for consistency with Nielsen and 8
Nielsen, 2003a). 9
Unit
FR-ICL FR-AL IT-AV PT-LI
REF-FR-C
REF-ES
REF-PT-O
Product
wheat flour
rye flour
wheat flour
rye flour
wheat flour*,**
wheat flour*
rye flour*
wheat flour
wheat flour
wheat flour
product kg 1 1 1 1 1 1 1 1 1 1
Inputs:
wheat
1.25
1.25
1 1
1.25 1.25 1.25
rye
1.53
1.53
1
electricity (local mix)
kWh 0.114 0.114 0.114 0.114 0.7 0.7 0.7 0.1 0.1 0.1
operation, Van km
0.75 0.75
tap water kg
0.125 0.125 0.125
natural gas kWh
0.125 0.125 0.125
transport , lorry
kgkm
132.5 200.16 110.1
ascorbic acid mg
50 50 50
Waste to treatment: Municipal solid waste
0.125 0.125 0.125
Organic waste (bran)
0.25 0.25 0.25
*whole grains (mixed together with bran)
**a specific mixture of varieties: Frassineto 600 g, Gentil Rosso 100 g, Verna 150 g, Abbondanza 50 g, Inalletabile 100 g
10
Table S7. Bread production. (oven infrastructure excluded for consistency with Nielsen and 11
Nielsen, 2003b). 12
Unit
FR-ICL FR-AL IT-AV PT-LI REF-FR-C REF-ES REF-PT-O
Product kg 1 1 1 1 1 1 1
Inputs
wheat flour kg 0.7 0.616 0.77 0.335 0.735 0.735 0.735
rye flour kg
0.154
0.335
tap water kg 2.4 1.69 1.55 1.32 1.995 1.995 1.995
salt g 12 12 10 10 10 10 10
electricity (local mix) kWh 0.65
0.67 0.375 0.54 0.54 0.54
transport, lorry kgkm 20
2 2 278 358 230
operation, van km 0.06
2.5
Wood, burned in furnace MJ
30.55 13.5
Heat, natural gas MJ
1 1 1
Waste to treatment:
Sewage m3
0.0015 0.0015 0.0015
13
14
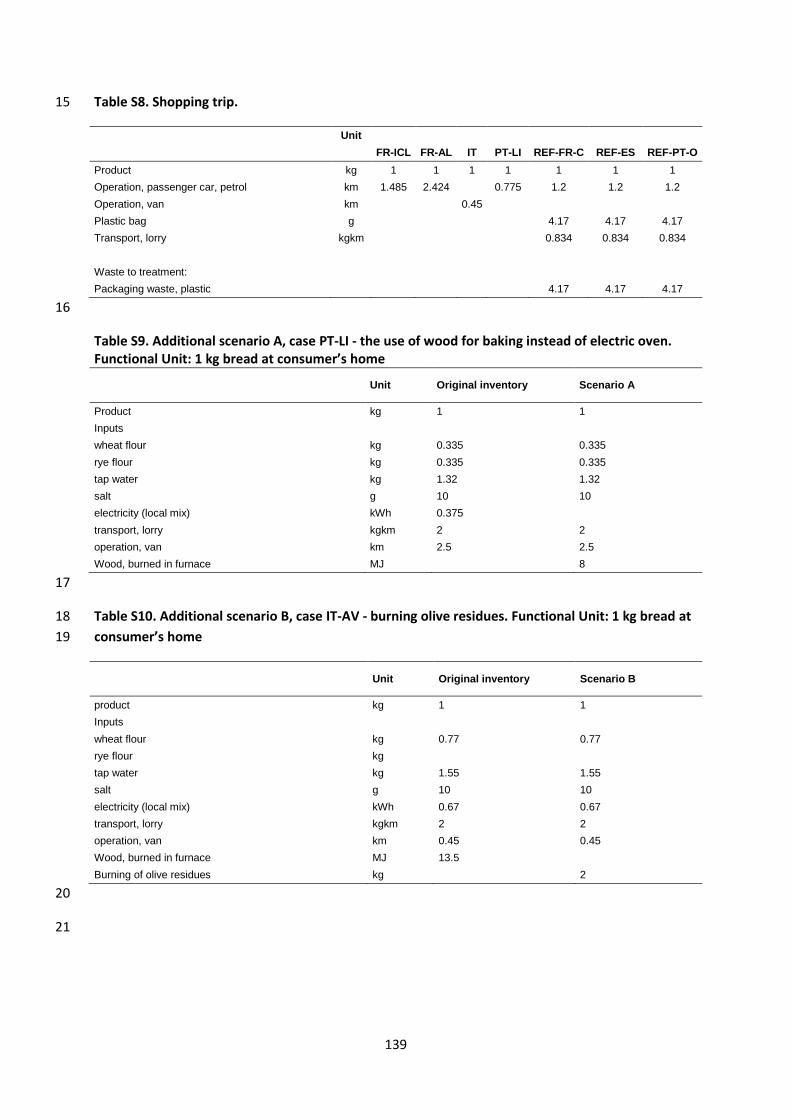
139
Table S8. Shopping trip. 15
Unit
FR-ICL FR-AL IT PT-LI REF-FR-C REF-ES REF-PT-O
Product kg 1 1 1 1 1 1 1
Operation, passenger car, petrol km 1.485 2.424
0.775 1.2 1.2 1.2
Operation, van km
0.45
Plastic bag g
4.17 4.17 4.17
Transport, lorry kgkm
0.834 0.834 0.834
Waste to treatment:
Packaging waste, plastic
4.17 4.17 4.17
16
Table S9. Additional scenario A, case PT-LI - the use of wood for baking instead of electric oven. Functional Unit: 1 kg bread at consumer’s home
Unit Original inventory Scenario A
Product kg 1 1
Inputs
wheat flour kg 0.335 0.335
rye flour kg 0.335 0.335
tap water kg 1.32 1.32
salt g 10 10
electricity (local mix) kWh 0.375
transport, lorry kgkm 2 2
operation, van km 2.5 2.5
Wood, burned in furnace MJ
8
17
Table S10. Additional scenario B, case IT-AV - burning olive residues. Functional Unit: 1 kg bread at 18
consumer’s home 19
Unit Original inventory Scenario B
product kg 1 1
Inputs
wheat flour kg 0.77 0.77
rye flour kg
tap water kg 1.55 1.55
salt g 10 10
electricity (local mix) kWh 0.67 0.67
transport, lorry kgkm 2 2
operation, van km 0.45 0.45
Wood, burned in furnace MJ 13.5
Burning of olive residues kg
2
20
21
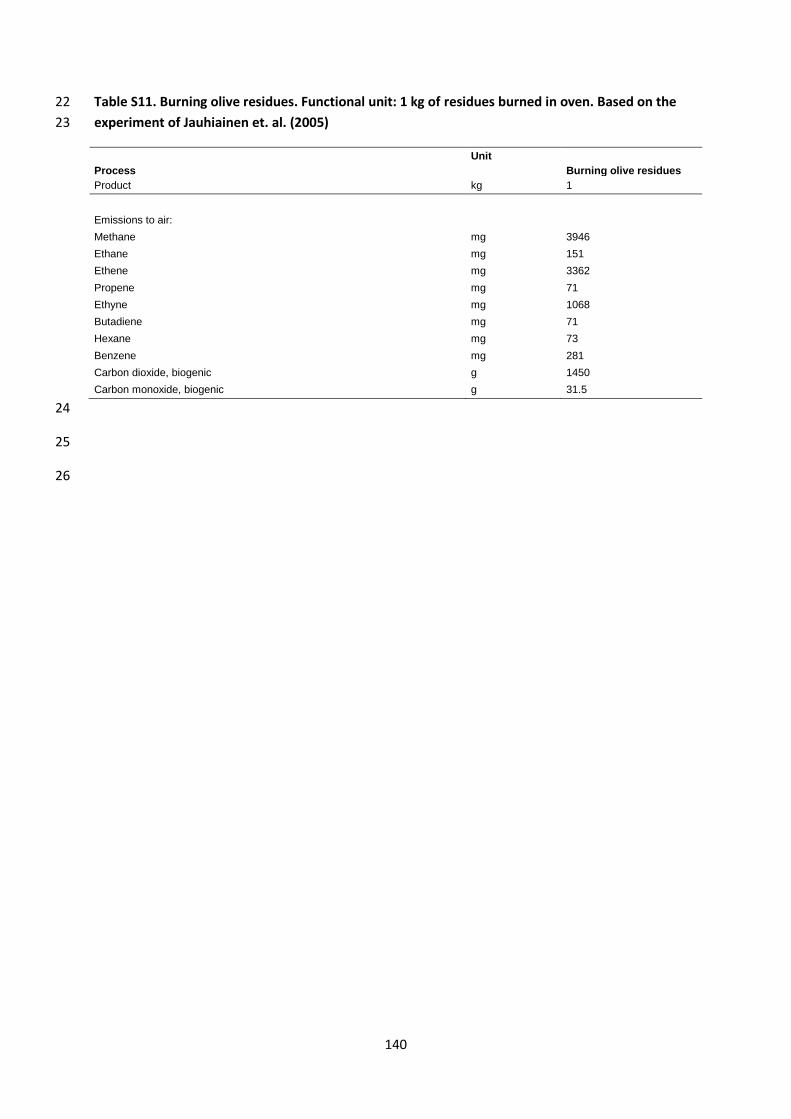
140
Table S11. Burning olive residues. Functional unit: 1 kg of residues burned in oven. Based on the 22
experiment of Jauhiainen et. al. (2005) 23
Unit
Process
Burning olive residues
Product kg 1
Emissions to air:
Methane mg 3946
Ethane mg 151
Ethene mg 3362
Propene mg 71
Ethyne mg 1068
Butadiene mg 71
Hexane mg 73
Benzene mg 281
Carbon dioxide, biogenic g 1450
Carbon monoxide, biogenic g 31.5
24
25
26
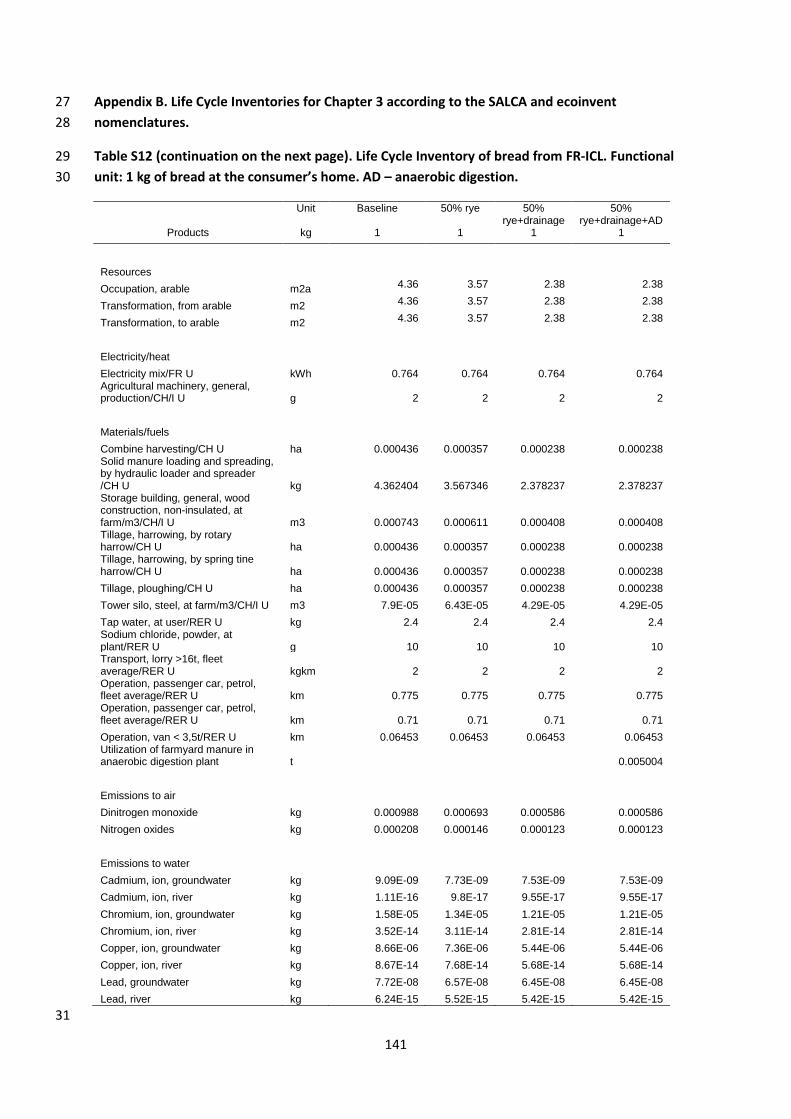
141
Appendix B. Life Cycle Inventories for Chapter 3 according to the SALCA and ecoinvent 27
nomenclatures. 28
Table S12 (continuation on the next page). Life Cycle Inventory of bread from FR-ICL. Functional 29
unit: 1 kg of bread at the consumer’s home. AD – anaerobic digestion. 30
Unit Baseline 50% rye 50% rye+drainage
50% rye+drainage+AD
Products kg 1 1 1 1
Resources Occupation, arable m2a 4.36 3.57 2.38 2.38
Transformation, from arable m2 4.36 3.57 2.38 2.38
Transformation, to arable m2 4.36 3.57 2.38 2.38
Electricity/heat Electricity mix/FR U kWh 0.764 0.764 0.764 0.764
Agricultural machinery, general, production/CH/I U g 2 2 2 2
Materials/fuels Combine harvesting/CH U ha 0.000436 0.000357 0.000238 0.000238
Solid manure loading and spreading, by hydraulic loader and spreader /CH U kg 4.362404 3.567346 2.378237 2.378237 Storage building, general, wood construction, non-insulated, at farm/m3/CH/I U m3 0.000743 0.000611 0.000408 0.000408 Tillage, harrowing, by rotary harrow/CH U ha 0.000436 0.000357 0.000238 0.000238 Tillage, harrowing, by spring tine harrow/CH U ha 0.000436 0.000357 0.000238 0.000238
Tillage, ploughing/CH U ha 0.000436 0.000357 0.000238 0.000238
Tower silo, steel, at farm/m3/CH/I U m3 7.9E-05 6.43E-05 4.29E-05 4.29E-05
Tap water, at user/RER U kg 2.4 2.4 2.4 2.4 Sodium chloride, powder, at plant/RER U g 10 10 10 10 Transport, lorry >16t, fleet average/RER U kgkm 2 2 2 2 Operation, passenger car, petrol, fleet average/RER U km 0.775 0.775 0.775 0.775 Operation, passenger car, petrol, fleet average/RER U km 0.71 0.71 0.71 0.71
Operation, van < 3,5t/RER U km 0.06453 0.06453 0.06453 0.06453 Utilization of farmyard manure in anaerobic digestion plant t
0.005004
Emissions to air Dinitrogen monoxide kg 0.000988 0.000693 0.000586 0.000586
Nitrogen oxides kg 0.000208 0.000146 0.000123 0.000123
Emissions to water Cadmium, ion, groundwater kg 9.09E-09 7.73E-09 7.53E-09 7.53E-09
Cadmium, ion, river kg 1.11E-16 9.8E-17 9.55E-17 9.55E-17
Chromium, ion, groundwater kg 1.58E-05 1.34E-05 1.21E-05 1.21E-05
Chromium, ion, river kg 3.52E-14 3.11E-14 2.81E-14 2.81E-14
Copper, ion, groundwater kg 8.66E-06 7.36E-06 5.44E-06 5.44E-06
Copper, ion, river kg 8.67E-14 7.68E-14 5.68E-14 5.68E-14
Lead, groundwater kg 7.72E-08 6.57E-08 6.45E-08 6.45E-08
Lead, river kg 6.24E-15 5.52E-15 5.42E-15 5.42E-15
31
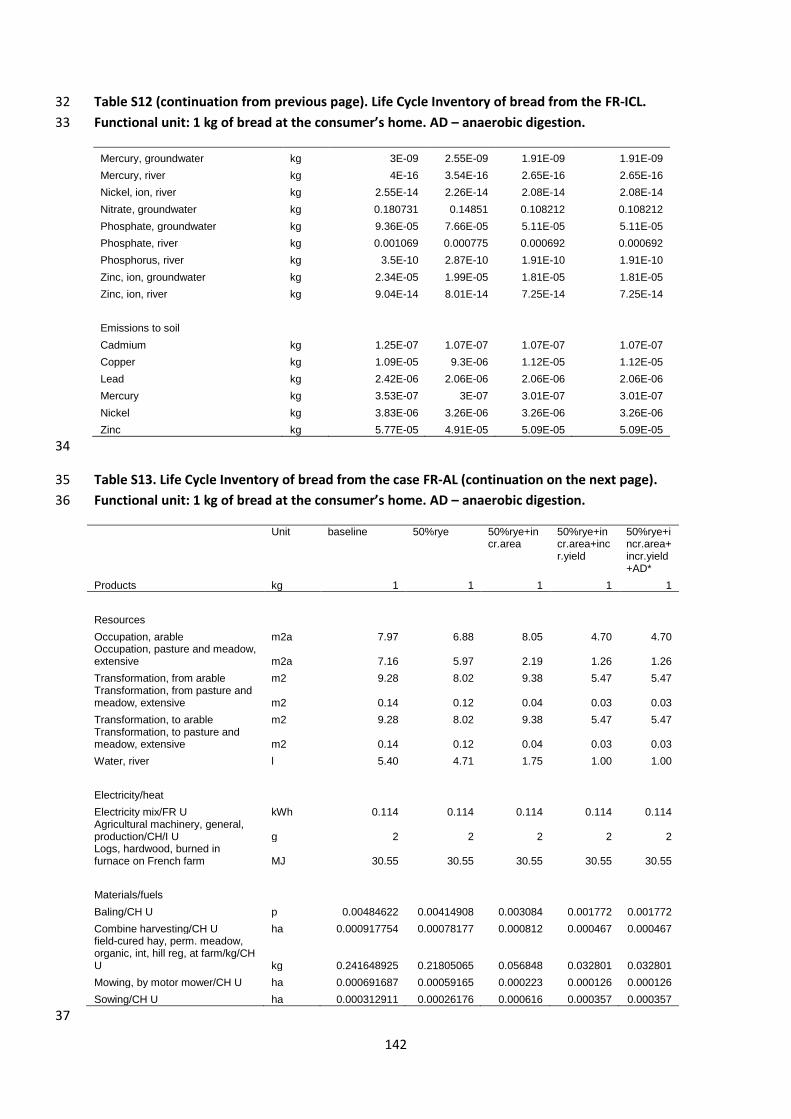
142
Table S12 (continuation from previous page). Life Cycle Inventory of bread from the FR-ICL. 32
Functional unit: 1 kg of bread at the consumer’s home. AD – anaerobic digestion. 33
Mercury, groundwater kg 3E-09 2.55E-09 1.91E-09 1.91E-09
Mercury, river kg 4E-16 3.54E-16 2.65E-16 2.65E-16
Nickel, ion, river kg 2.55E-14 2.26E-14 2.08E-14 2.08E-14
Nitrate, groundwater kg 0.180731 0.14851 0.108212 0.108212
Phosphate, groundwater kg 9.36E-05 7.66E-05 5.11E-05 5.11E-05
Phosphate, river kg 0.001069 0.000775 0.000692 0.000692
Phosphorus, river kg 3.5E-10 2.87E-10 1.91E-10 1.91E-10
Zinc, ion, groundwater kg 2.34E-05 1.99E-05 1.81E-05 1.81E-05
Zinc, ion, river kg 9.04E-14 8.01E-14 7.25E-14 7.25E-14
Emissions to soil
Cadmium kg 1.25E-07 1.07E-07 1.07E-07 1.07E-07
Copper kg 1.09E-05 9.3E-06 1.12E-05 1.12E-05
Lead kg 2.42E-06 2.06E-06 2.06E-06 2.06E-06
Mercury kg 3.53E-07 3E-07 3.01E-07 3.01E-07
Nickel kg 3.83E-06 3.26E-06 3.26E-06 3.26E-06
Zinc kg 5.77E-05 4.91E-05 5.09E-05 5.09E-05
34
Table S13. Life Cycle Inventory of bread from the case FR-AL (continuation on the next page). 35
Functional unit: 1 kg of bread at the consumer’s home. AD – anaerobic digestion. 36
Unit baseline 50%rye 50%rye+incr.area
50%rye+incr.area+incr.yield
50%rye+incr.area+incr.yield+AD*
Products kg 1 1 1 1 1
Resources Occupation, arable m2a 7.97 6.88 8.05 4.70 4.70
Occupation, pasture and meadow, extensive m2a 7.16 5.97 2.19 1.26 1.26
Transformation, from arable m2 9.28 8.02 9.38 5.47 5.47 Transformation, from pasture and meadow, extensive m2 0.14 0.12 0.04 0.03 0.03
Transformation, to arable m2 9.28 8.02 9.38 5.47 5.47 Transformation, to pasture and meadow, extensive m2 0.14 0.12 0.04 0.03 0.03
Water, river l 5.40 4.71 1.75 1.00 1.00
Electricity/heat Electricity mix/FR U kWh 0.114 0.114 0.114 0.114 0.114
Agricultural machinery, general, production/CH/I U g 2 2 2 2 2 Logs, hardwood, burned in furnace on French farm MJ 30.55 30.55 30.55 30.55 30.55
Materials/fuels
Baling/CH U p 0.00484622 0.00414908 0.003084 0.001772 0.001772
Combine harvesting/CH U ha 0.000917754 0.00078177 0.000812 0.000467 0.000467 field-cured hay, perm. meadow, organic, int, hill reg, at farm/kg/CH U kg 0.241648925 0.21805065 0.056848 0.032801 0.032801
Mowing, by motor mower/CH U ha 0.000691687 0.00059165 0.000223 0.000126 0.000126
Sowing/CH U ha 0.000312911 0.00026176 0.000616 0.000357 0.000357
37
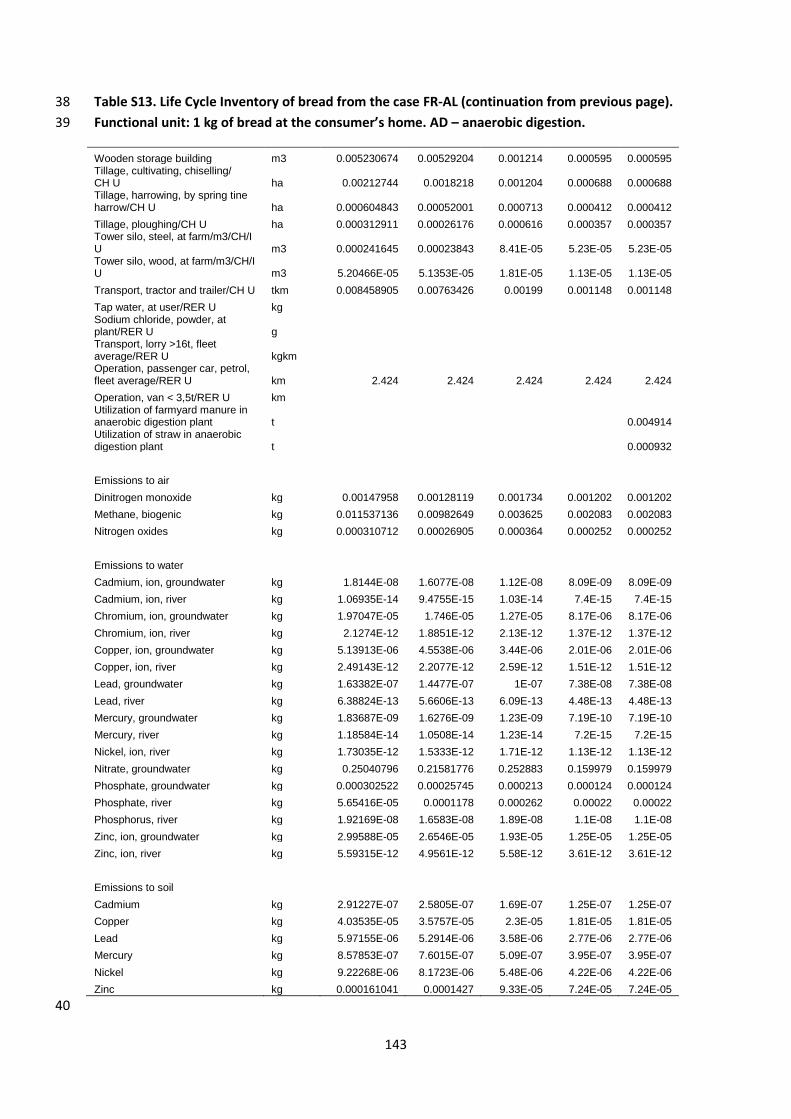
143
Table S13. Life Cycle Inventory of bread from the case FR-AL (continuation from previous page). 38
Functional unit: 1 kg of bread at the consumer’s home. AD – anaerobic digestion. 39
Wooden storage building m3 0.005230674 0.00529204 0.001214 0.000595 0.000595 Tillage, cultivating, chiselling/ CH U ha 0.00212744 0.0018218 0.001204 0.000688 0.000688 Tillage, harrowing, by spring tine harrow/CH U ha 0.000604843 0.00052001 0.000713 0.000412 0.000412
Tillage, ploughing/CH U ha 0.000312911 0.00026176 0.000616 0.000357 0.000357 Tower silo, steel, at farm/m3/CH/I U m3 0.000241645 0.00023843 8.41E-05 5.23E-05 5.23E-05 Tower silo, wood, at farm/m3/CH/I U m3 5.20466E-05 5.1353E-05 1.81E-05 1.13E-05 1.13E-05
Transport, tractor and trailer/CH U tkm 0.008458905 0.00763426 0.00199 0.001148 0.001148
Tap water, at user/RER U kg Sodium chloride, powder, at plant/RER U g Transport, lorry >16t, fleet average/RER U kgkm Operation, passenger car, petrol, fleet average/RER U km 2.424 2.424 2.424 2.424 2.424
Operation, van < 3,5t/RER U km Utilization of farmyard manure in anaerobic digestion plant t 0.004914 Utilization of straw in anaerobic digestion plant t
0.000932
Emissions to air
Dinitrogen monoxide kg 0.00147958 0.00128119 0.001734 0.001202 0.001202
Methane, biogenic kg 0.011537136 0.00982649 0.003625 0.002083 0.002083
Nitrogen oxides kg 0.000310712 0.00026905 0.000364 0.000252 0.000252
Emissions to water
Cadmium, ion, groundwater kg 1.8144E-08 1.6077E-08 1.12E-08 8.09E-09 8.09E-09
Cadmium, ion, river kg 1.06935E-14 9.4755E-15 1.03E-14 7.4E-15 7.4E-15
Chromium, ion, groundwater kg 1.97047E-05 1.746E-05 1.27E-05 8.17E-06 8.17E-06
Chromium, ion, river kg 2.1274E-12 1.8851E-12 2.13E-12 1.37E-12 1.37E-12
Copper, ion, groundwater kg 5.13913E-06 4.5538E-06 3.44E-06 2.01E-06 2.01E-06
Copper, ion, river kg 2.49143E-12 2.2077E-12 2.59E-12 1.51E-12 1.51E-12
Lead, groundwater kg 1.63382E-07 1.4477E-07 1E-07 7.38E-08 7.38E-08
Lead, river kg 6.38824E-13 5.6606E-13 6.09E-13 4.48E-13 4.48E-13
Mercury, groundwater kg 1.83687E-09 1.6276E-09 1.23E-09 7.19E-10 7.19E-10
Mercury, river kg 1.18584E-14 1.0508E-14 1.23E-14 7.2E-15 7.2E-15
Nickel, ion, river kg 1.73035E-12 1.5333E-12 1.71E-12 1.13E-12 1.13E-12
Nitrate, groundwater kg 0.25040796 0.21581776 0.252883 0.159979 0.159979
Phosphate, groundwater kg 0.000302522 0.00025745 0.000213 0.000124 0.000124
Phosphate, river kg 5.65416E-05 0.0001178 0.000262 0.00022 0.00022
Phosphorus, river kg 1.92169E-08 1.6583E-08 1.89E-08 1.1E-08 1.1E-08
Zinc, ion, groundwater kg 2.99588E-05 2.6546E-05 1.93E-05 1.25E-05 1.25E-05
Zinc, ion, river kg 5.59315E-12 4.9561E-12 5.58E-12 3.61E-12 3.61E-12
Emissions to soil
Cadmium kg 2.91227E-07 2.5805E-07 1.69E-07 1.25E-07 1.25E-07
Copper kg 4.03535E-05 3.5757E-05 2.3E-05 1.81E-05 1.81E-05
Lead kg 5.97155E-06 5.2914E-06 3.58E-06 2.77E-06 2.77E-06
Mercury kg 8.57853E-07 7.6015E-07 5.09E-07 3.95E-07 3.95E-07
Nickel kg 9.22268E-06 8.1723E-06 5.48E-06 4.22E-06 4.22E-06
Zinc kg 0.000161041 0.0001427 9.33E-05 7.24E-05 7.24E-05
40
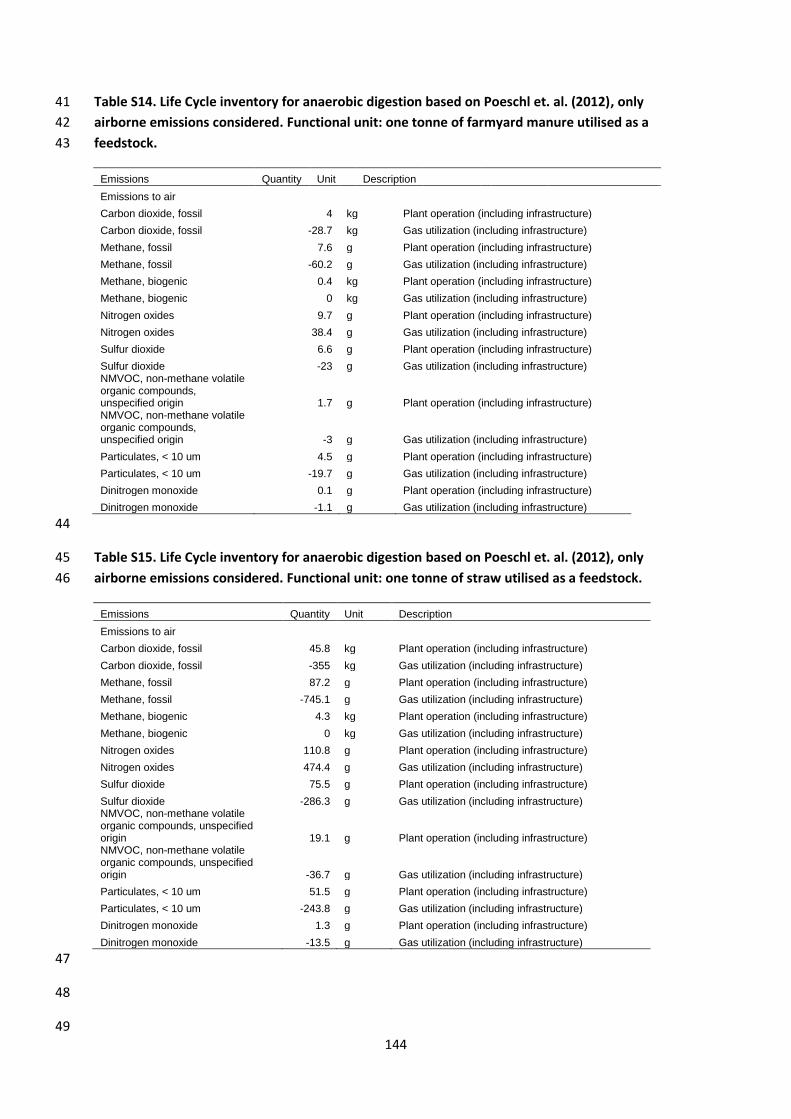
144
Table S14. Life Cycle inventory for anaerobic digestion based on Poeschl et. al. (2012), only 41
airborne emissions considered. Functional unit: one tonne of farmyard manure utilised as a 42
feedstock. 43
Emissions Quantity Unit Description
Emissions to air Carbon dioxide, fossil 4 kg Plant operation (including infrastructure)
Carbon dioxide, fossil -28.7 kg Gas utilization (including infrastructure)
Methane, fossil 7.6 g Plant operation (including infrastructure)
Methane, fossil -60.2 g Gas utilization (including infrastructure)
Methane, biogenic 0.4 kg Plant operation (including infrastructure)
Methane, biogenic 0 kg Gas utilization (including infrastructure)
Nitrogen oxides 9.7 g Plant operation (including infrastructure)
Nitrogen oxides 38.4 g Gas utilization (including infrastructure)
Sulfur dioxide 6.6 g Plant operation (including infrastructure)
Sulfur dioxide -23 g Gas utilization (including infrastructure) NMVOC, non-methane volatile organic compounds, unspecified origin 1.7 g Plant operation (including infrastructure) NMVOC, non-methane volatile organic compounds, unspecified origin -3 g Gas utilization (including infrastructure)
Particulates, < 10 um 4.5 g Plant operation (including infrastructure)
Particulates, < 10 um -19.7 g Gas utilization (including infrastructure)
Dinitrogen monoxide 0.1 g Plant operation (including infrastructure)
Dinitrogen monoxide -1.1 g Gas utilization (including infrastructure)
44
Table S15. Life Cycle inventory for anaerobic digestion based on Poeschl et. al. (2012), only 45
airborne emissions considered. Functional unit: one tonne of straw utilised as a feedstock. 46
Emissions Quantity Unit Description
Emissions to air Carbon dioxide, fossil 45.8 kg Plant operation (including infrastructure)
Carbon dioxide, fossil -355 kg Gas utilization (including infrastructure)
Methane, fossil 87.2 g Plant operation (including infrastructure)
Methane, fossil -745.1 g Gas utilization (including infrastructure)
Methane, biogenic 4.3 kg Plant operation (including infrastructure)
Methane, biogenic 0 kg Gas utilization (including infrastructure)
Nitrogen oxides 110.8 g Plant operation (including infrastructure)
Nitrogen oxides 474.4 g Gas utilization (including infrastructure)
Sulfur dioxide 75.5 g Plant operation (including infrastructure)
Sulfur dioxide -286.3 g Gas utilization (including infrastructure) NMVOC, non-methane volatile organic compounds, unspecified origin 19.1 g Plant operation (including infrastructure) NMVOC, non-methane volatile organic compounds, unspecified origin -36.7 g Gas utilization (including infrastructure)
Particulates, < 10 um 51.5 g Plant operation (including infrastructure)
Particulates, < 10 um -243.8 g Gas utilization (including infrastructure)
Dinitrogen monoxide 1.3 g Plant operation (including infrastructure)
Dinitrogen monoxide -13.5 g Gas utilization (including infrastructure)
47
48
49
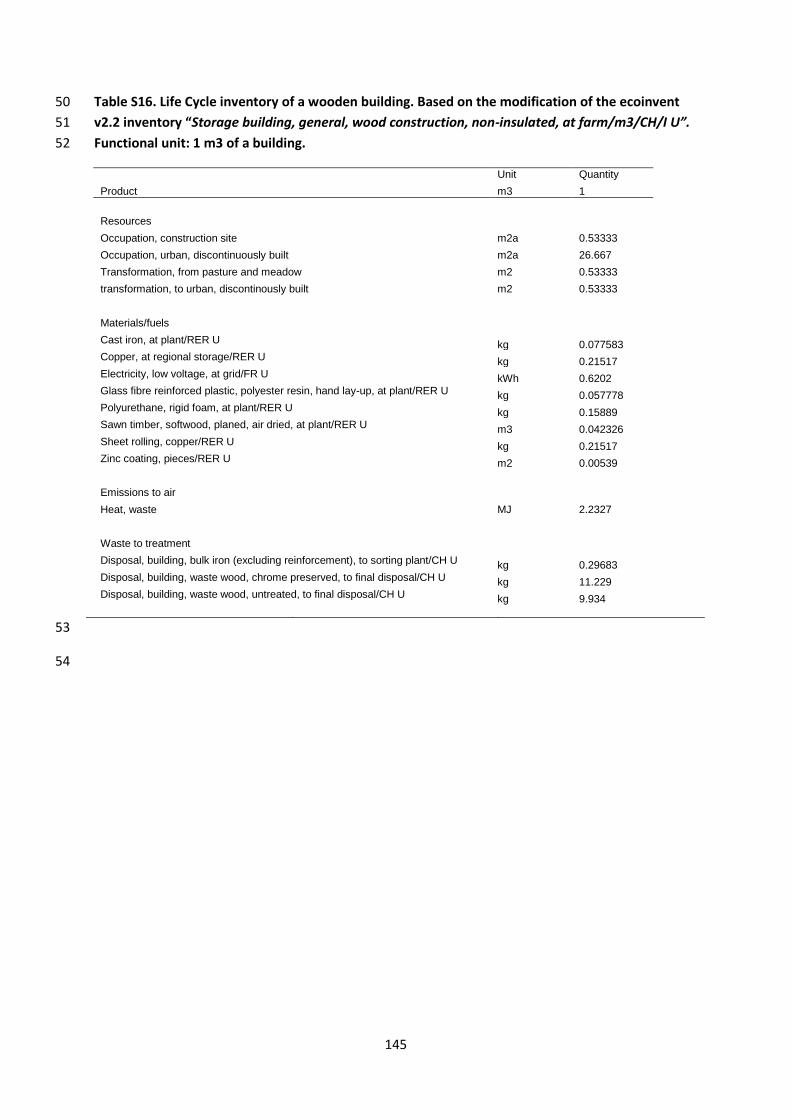
145
Table S16. Life Cycle inventory of a wooden building. Based on the modification of the ecoinvent 50
v2.2 inventory “Storage building, general, wood construction, non-insulated, at farm/m3/CH/I U”. 51
Functional unit: 1 m3 of a building. 52
Unit Quantity
Product m3 1
Resources
Occupation, construction site m2a 0.53333
Occupation, urban, discontinuously built m2a 26.667
Transformation, from pasture and meadow m2 0.53333
transformation, to urban, discontinously built m2 0.53333
Materials/fuels
Cast iron, at plant/RER U kg 0.077583 Copper, at regional storage/RER U kg 0.21517 Electricity, low voltage, at grid/FR U kWh 0.6202 Glass fibre reinforced plastic, polyester resin, hand lay-up, at plant/RER U kg 0.057778 Polyurethane, rigid foam, at plant/RER U kg 0.15889 Sawn timber, softwood, planed, air dried, at plant/RER U m3 0.042326 Sheet rolling, copper/RER U kg 0.21517 Zinc coating, pieces/RER U m2 0.00539
Emissions to air
Heat, waste MJ 2.2327
Waste to treatment
Disposal, building, bulk iron (excluding reinforcement), to sorting plant/CH U kg 0.29683 Disposal, building, waste wood, chrome preserved, to final disposal/CH U kg 11.229 Disposal, building, waste wood, untreated, to final disposal/CH U kg 9.934
53
54
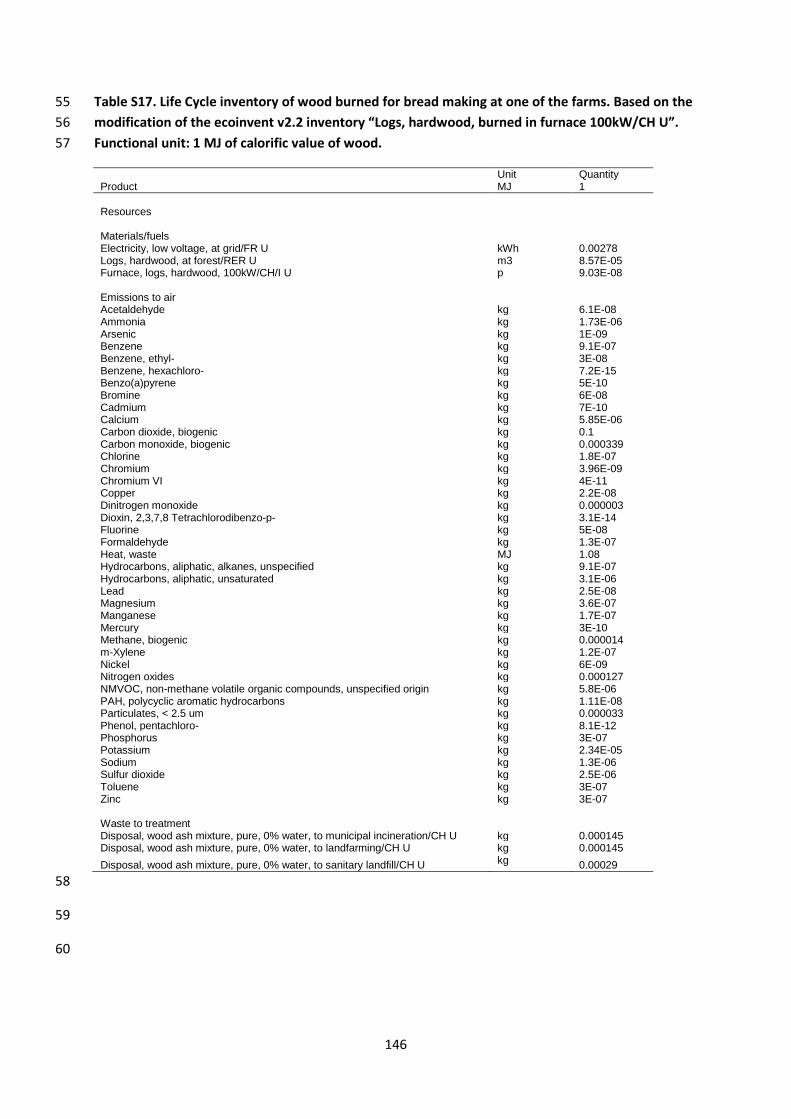
146
Table S17. Life Cycle inventory of wood burned for bread making at one of the farms. Based on the 55
modification of the ecoinvent v2.2 inventory “Logs, hardwood, burned in furnace 100kW/CH U”. 56
Functional unit: 1 MJ of calorific value of wood. 57
Unit Quantity Product MJ 1
Resources Materials/fuels Electricity, low voltage, at grid/FR U kWh 0.00278 Logs, hardwood, at forest/RER U m3 8.57E-05 Furnace, logs, hardwood, 100kW/CH/I U p 9.03E-08 Emissions to air Acetaldehyde kg 6.1E-08 Ammonia kg 1.73E-06 Arsenic kg 1E-09 Benzene kg 9.1E-07 Benzene, ethyl- kg 3E-08 Benzene, hexachloro- kg 7.2E-15 Benzo(a)pyrene kg 5E-10 Bromine kg 6E-08 Cadmium kg 7E-10 Calcium kg 5.85E-06 Carbon dioxide, biogenic kg 0.1 Carbon monoxide, biogenic kg 0.000339 Chlorine kg 1.8E-07 Chromium kg 3.96E-09 Chromium VI kg 4E-11 Copper kg 2.2E-08 Dinitrogen monoxide kg 0.000003 Dioxin, 2,3,7,8 Tetrachlorodibenzo-p- kg 3.1E-14 Fluorine kg 5E-08 Formaldehyde kg 1.3E-07 Heat, waste MJ 1.08 Hydrocarbons, aliphatic, alkanes, unspecified kg 9.1E-07 Hydrocarbons, aliphatic, unsaturated kg 3.1E-06 Lead kg 2.5E-08 Magnesium kg 3.6E-07 Manganese kg 1.7E-07 Mercury kg 3E-10 Methane, biogenic kg 0.000014 m-Xylene kg 1.2E-07 Nickel kg 6E-09 Nitrogen oxides kg 0.000127 NMVOC, non-methane volatile organic compounds, unspecified origin kg 5.8E-06 PAH, polycyclic aromatic hydrocarbons kg 1.11E-08 Particulates, < 2.5 um kg 0.000033 Phenol, pentachloro- kg 8.1E-12 Phosphorus kg 3E-07 Potassium kg 2.34E-05 Sodium kg 1.3E-06 Sulfur dioxide kg 2.5E-06 Toluene kg 3E-07 Zinc kg 3E-07 Waste to treatment Disposal, wood ash mixture, pure, 0% water, to municipal incineration/CH U kg 0.000145 Disposal, wood ash mixture, pure, 0% water, to landfarming/CH U kg 0.000145
Disposal, wood ash mixture, pure, 0% water, to sanitary landfill/CH U kg 0.00029
58
59
60
147
ACKNOWLEDGEMENTS: 61
This work would not be realised without the support of many kind people. 62
I would like to thank my supervisors: Thomas Nemecek, Emmanuel Frossard and Gérard Gaillard for 63
sharing their priceless knowledge and all the guidance that led towards the successful completion of 64
the project. 65
Many thanks to Steve Evans for lectures that inspired this thesis and for accepting the role of the 66
external examiner. 67
Thanks to the five anonymous farmers who supplied the data, especially two French farmers who 68
were bothered multiple times during the process of scenario development. 69
Acknowledgements are owed to all researchers who assisted with data collection, especially 70
Veronique Chable, Mads Ville Markussen, Elena Tavella, Riccardo Bocci, Livia Ortolani, Daniela Santos 71
and Laurence Smith. Special thanks to Carolina Passeira for the work realised within the frame of her 72
master thesis at the University of Porto. 73
Hanne Østergård for many interesting discussions and for providing comments to the manuscripts. 74
Regula Wolz for linguistic services. 75
European Commision for funding this work through the grant no. KBBE-245058-SOLIBAM. 76
Thanks to all my colleagues from the LCA group of Agroscope and the group of plant nutrition at ETH 77
Zurich for countless inspiring talks. 78
Finally, to my family and friends for the patience and mental support. 79