Embed Size (px)
Citation preview
RIIO-2 Framework - Information Revealing Devices (IRDs) & Return Adjustment Mechanisms (RAMs)
Network companies workshop
28 March 2018

Aims and agenda for todayFocus on the potential impact and response by network companies
2
Key areas we wish to explore with you in today’s sessions:• Ways of encouraging network companies to submit plans which reflect the best view of their cost and
with ambitious output targets • Ways to implement business plans categorisation schemes and the sequence of submissions which
will encourage high quality and ambitious business plans • The level and distribution of returns which would represent a good balance between incentivising
high performance, and mitigating the risk of systematic over performance• Ways of setting sharing factors which represent a good balance between sharing benefits with
consumers and incentivising performance
The primary aim of today’s workshop is to understand the potential impact of our proposals on network companies and to explore possible ways of implementation
Time Item Leading
11:10-11:30 Introduction James Veaney
11:30:12:00 Description of IRDs & RAMs proposals Shai Hassid
12:00-12:20 Lunch break
12:20-13:10 Session 1: Information revealing devices James Veaney
13:10-14:00 Session 2: Return adjustment mechanisms James Veaney
Agenda
Why are we looking into IRDs and RAMs?Companies have been achieving high returns which might not be aligned with the level of risk to which they are exposed
3
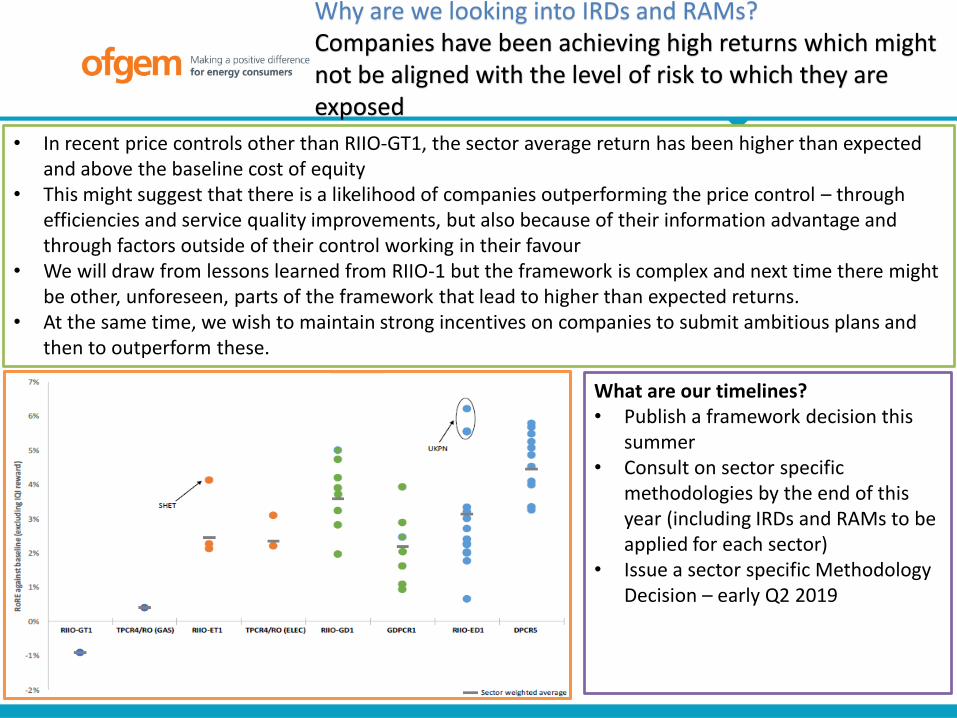
• In recent price controls other than RIIO-GT1, the sector average return has been higher than expected and above the baseline cost of equity
• This might suggest that there is a likelihood of companies outperforming the price control – through efficiencies and service quality improvements, but also because of their information advantage and through factors outside of their control working in their favour
• We will draw from lessons learned from RIIO-1 but the framework is complex and next time there might be other, unforeseen, parts of the framework that lead to higher than expected returns.
• At the same time, we wish to maintain strong incentives on companies to submit ambitious plans and then to outperform these.
What are our timelines? • Publish a framework decision this
summer • Consult on sector specific
methodologies by the end of this year (including IRDs and RAMs to be applied for each sector)
• Issue a sector specific Methodology Decision – early Q2 2019
IQI might have not achieved the desirable behaviour in RIIO-1How could we improve it?
4
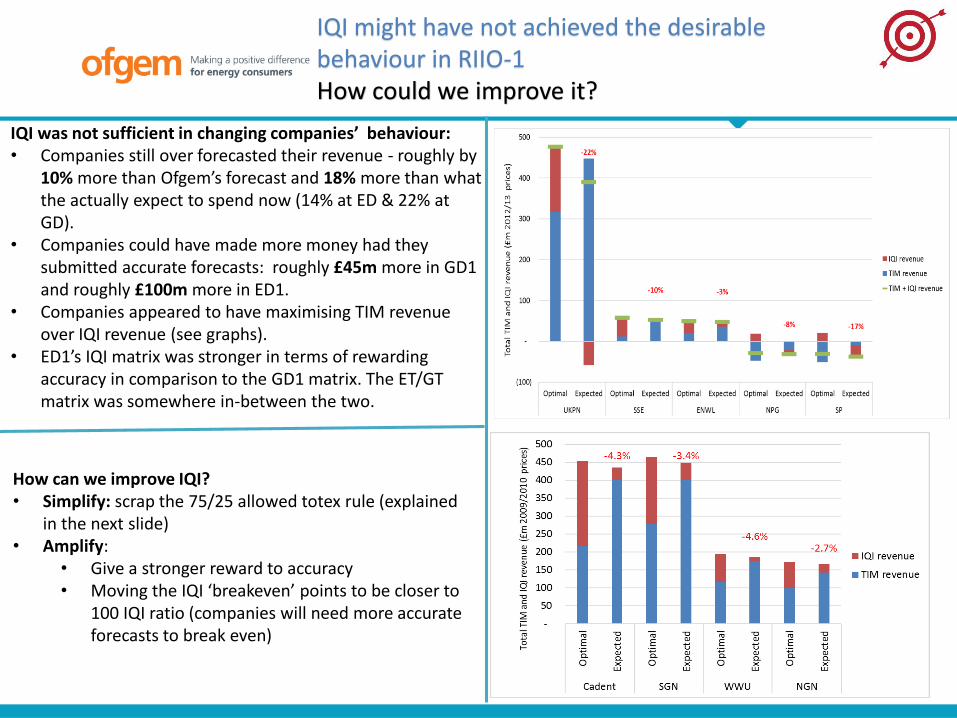
IQI was not sufficient in changing companies’ behaviour:• Companies still over forecasted their revenue - roughly by
10% more than Ofgem’s forecast and 18% more than what the actually expect to spend now (14% at ED & 22% at GD).
• Companies could have made more money had they submitted accurate forecasts: roughly £45m more in GD1 and roughly £100m more in ED1.
• Companies appeared to have maximising TIM revenue over IQI revenue (see graphs).
• ED1’s IQI matrix was stronger in terms of rewarding accuracy in comparison to the GD1 matrix. The ET/GT matrix was somewhere in-between the two.
How can we improve IQI?• Simplify: scrap the 75/25 allowed totex rule (explained
in the next slide)• Amplify:
• Give a stronger reward to accuracy• Moving the IQI ‘breakeven’ points to be closer to
100 IQI ratio (companies will need more accurate forecasts to break even)
The 75-25 totex interpolation rule Does it make any difference?
5
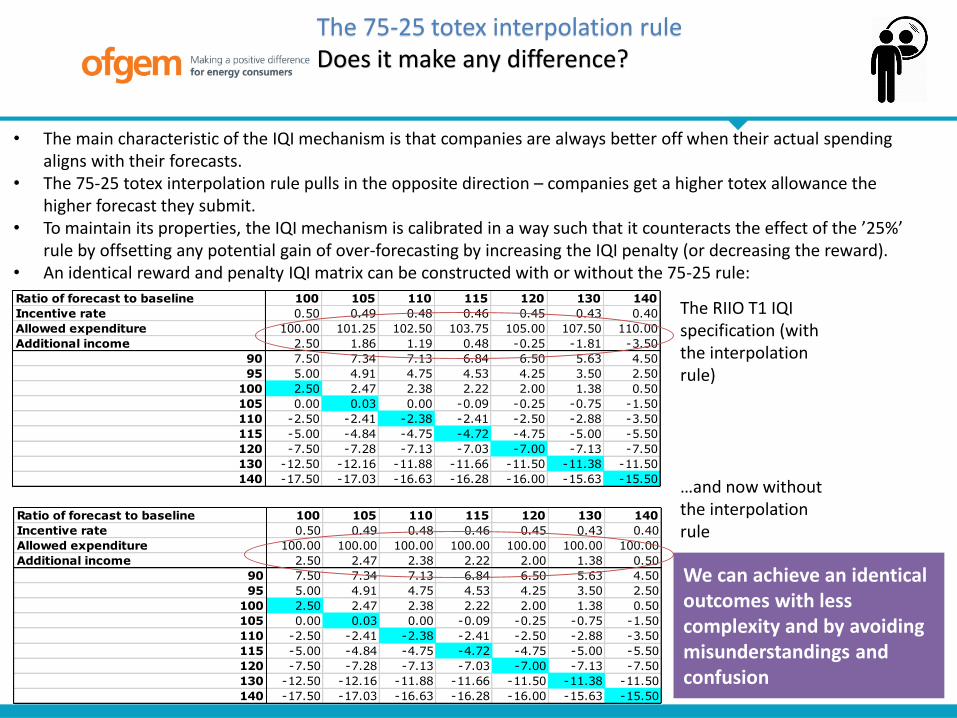
• The main characteristic of the IQI mechanism is that companies are always better off when their actual spending aligns with their forecasts.
• The 75-25 totex interpolation rule pulls in the opposite direction – companies get a higher totex allowance the higher forecast they submit.
• To maintain its properties, the IQI mechanism is calibrated in a way such that it counteracts the effect of the ’25%’ rule by offsetting any potential gain of over-forecasting by increasing the IQI penalty (or decreasing the reward).
• An identical reward and penalty IQI matrix can be constructed with or without the 75-25 rule:
Ratio of forecast to baseline 100 105 110 115 120 130 140
Incentive rate 0.50 0.49 0.48 0.46 0.45 0.43 0.40
Allowed expenditure 100.00 101.25 102.50 103.75 105.00 107.50 110.00
Additional income 2.50 1.86 1.19 0.48 -0.25 -1.81 -3.50
90 7.50 7.34 7.13 6.84 6.50 5.63 4.50
95 5.00 4.91 4.75 4.53 4.25 3.50 2.50
100 2.50 2.47 2.38 2.22 2.00 1.38 0.50
105 0.00 0.03 0.00 -0.09 -0.25 -0.75 -1.50
110 -2.50 -2.41 -2.38 -2.41 -2.50 -2.88 -3.50
115 -5.00 -4.84 -4.75 -4.72 -4.75 -5.00 -5.50
120 -7.50 -7.28 -7.13 -7.03 -7.00 -7.13 -7.50
130 -12.50 -12.16 -11.88 -11.66 -11.50 -11.38 -11.50
140 -17.50 -17.03 -16.63 -16.28 -16.00 -15.63 -15.50
Ratio of forecast to baseline 100 105 110 115 120 130 140
Incentive rate 0.50 0.49 0.48 0.46 0.45 0.43 0.40
Allowed expenditure 100.00 100.00 100.00 100.00 100.00 100.00 100.00
Additional income 2.50 2.47 2.38 2.22 2.00 1.38 0.50
90 7.50 7.34 7.13 6.84 6.50 5.63 4.50
95 5.00 4.91 4.75 4.53 4.25 3.50 2.50
100 2.50 2.47 2.38 2.22 2.00 1.38 0.50
105 0.00 0.03 0.00 -0.09 -0.25 -0.75 -1.50
110 -2.50 -2.41 -2.38 -2.41 -2.50 -2.88 -3.50
115 -5.00 -4.84 -4.75 -4.72 -4.75 -5.00 -5.50
120 -7.50 -7.28 -7.13 -7.03 -7.00 -7.13 -7.50
130 -12.50 -12.16 -11.88 -11.66 -11.50 -11.38 -11.50
140 -17.50 -17.03 -16.63 -16.28 -16.00 -15.63 -15.50
The RIIO T1 IQI specification (with the interpolation rule)
…and now without the interpolation rule
We can achieve an identical outcomes with less complexity and by avoiding misunderstandings and confusion
Ofwat’s PR19 proposals ‘Ambition’ matrix coupled with a more granular assessment of business plans
6
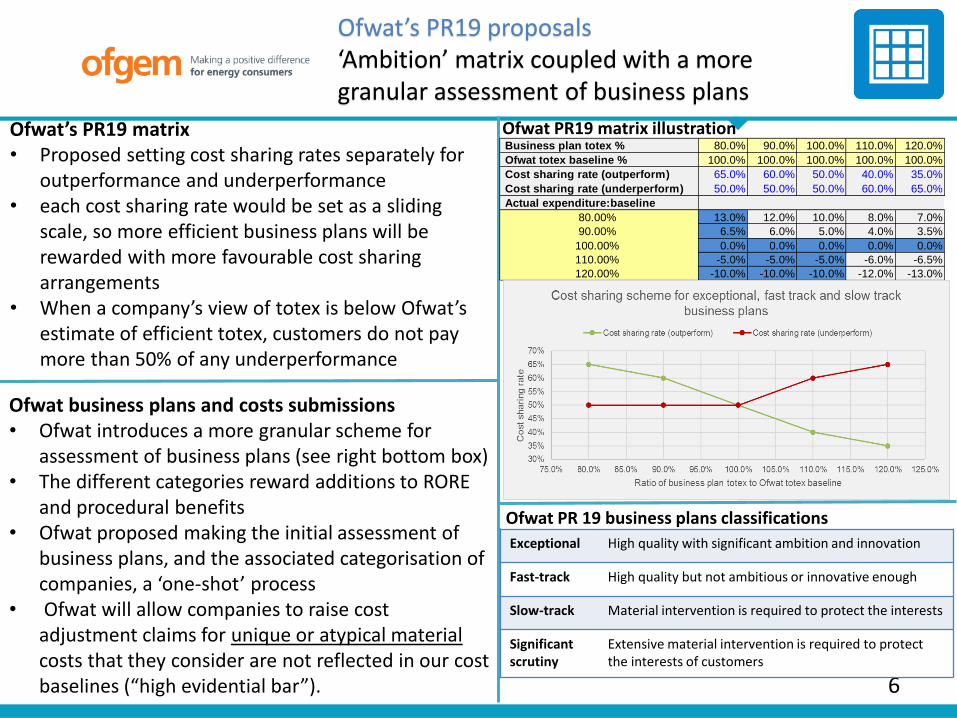
Ofwat’s PR19 matrix • Proposed setting cost sharing rates separately for
outperformance and underperformance • each cost sharing rate would be set as a sliding
scale, so more efficient business plans will be rewarded with more favourable cost sharing arrangements
• When a company’s view of totex is below Ofwat’sestimate of efficient totex, customers do not pay more than 50% of any underperformance
Ofwat business plans and costs submissions• Ofwat introduces a more granular scheme for
assessment of business plans (see right bottom box)• The different categories reward additions to RORE
and procedural benefits• Ofwat proposed making the initial assessment of
business plans, and the associated categorisation of companies, a ‘one-shot’ process
• Ofwat will allow companies to raise cost adjustment claims for unique or atypical material costs that they consider are not reflected in our cost baselines (“high evidential bar”).
Business plan totex % 80.0% 90.0% 100.0% 110.0% 120.0%
Ofwat totex baseline % 100.0% 100.0% 100.0% 100.0% 100.0%
Cost sharing rate (outperform) 65.0% 60.0% 50.0% 40.0% 35.0%
Cost sharing rate (underperform) 50.0% 50.0% 50.0% 60.0% 65.0%
Actual expenditure:baseline
80.00% 13.0% 12.0% 10.0% 8.0% 7.0%
90.00% 6.5% 6.0% 5.0% 4.0% 3.5%
100.00% 0.0% 0.0% 0.0% 0.0% 0.0%
110.00% -5.0% -5.0% -5.0% -6.0% -6.5%
120.00% -10.0% -10.0% -10.0% -12.0% -13.0%
Exceptional High quality with significant ambition and innovation
Fast-track High quality but not ambitious or innovative enough
Slow-track Material intervention is required to protect the interests
Significant scrutiny
Extensive material intervention is required to protect the interests of customers
Ofwat PR 19 business plans classifications
Ofwat PR19 matrix illustration
7
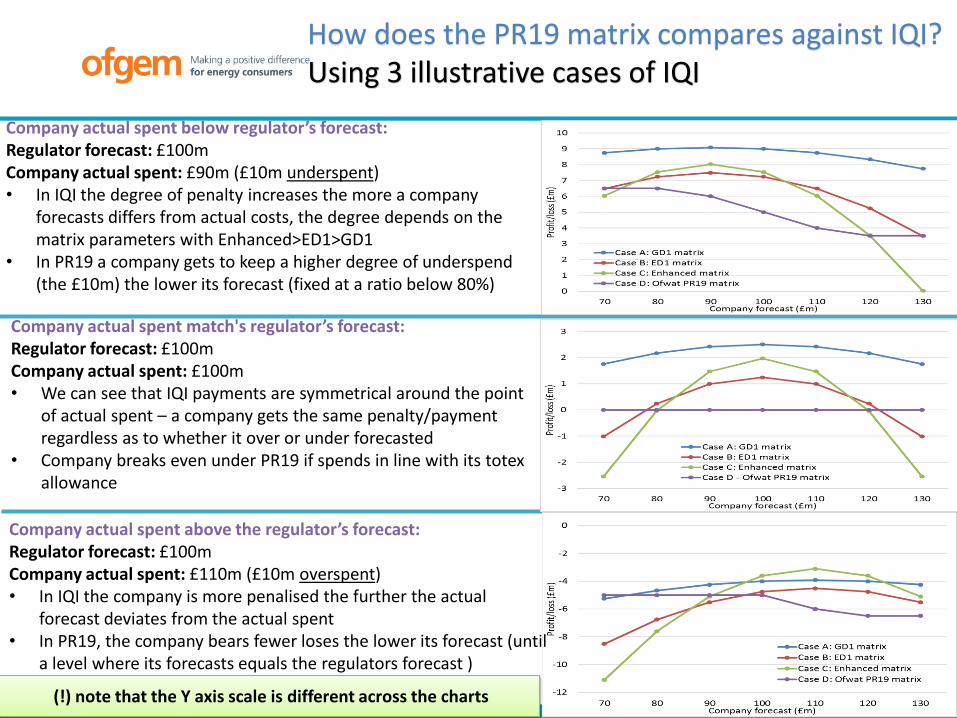
How does the PR19 matrix compares against IQI?Using 3 illustrative cases of IQI
Company actual spent match's regulator’s forecast:Regulator forecast: £100mCompany actual spent: £100m• We can see that IQI payments are symmetrical around the point
of actual spent – a company gets the same penalty/payment regardless as to whether it over or under forecasted
• Company breaks even under PR19 if spends in line with its totexallowance
Company actual spent below regulator’s forecast:Regulator forecast: £100mCompany actual spent: £90m (£10m underspent)• In IQI the degree of penalty increases the more a company
forecasts differs from actual costs, the degree depends on the matrix parameters with Enhanced>ED1>GD1
• In PR19 a company gets to keep a higher degree of underspend (the £10m) the lower its forecast (fixed at a ratio below 80%)
Company actual spent above the regulator’s forecast:Regulator forecast: £100mCompany actual spent: £110m (£10m overspent)• In IQI the company is more penalised the further the actual
forecast deviates from the actual spent• In PR19, the company bears fewer loses the lower its forecast (until
a level where its forecasts equals the regulators forecast )
(!) note that the Y axis scale is different across the charts
8
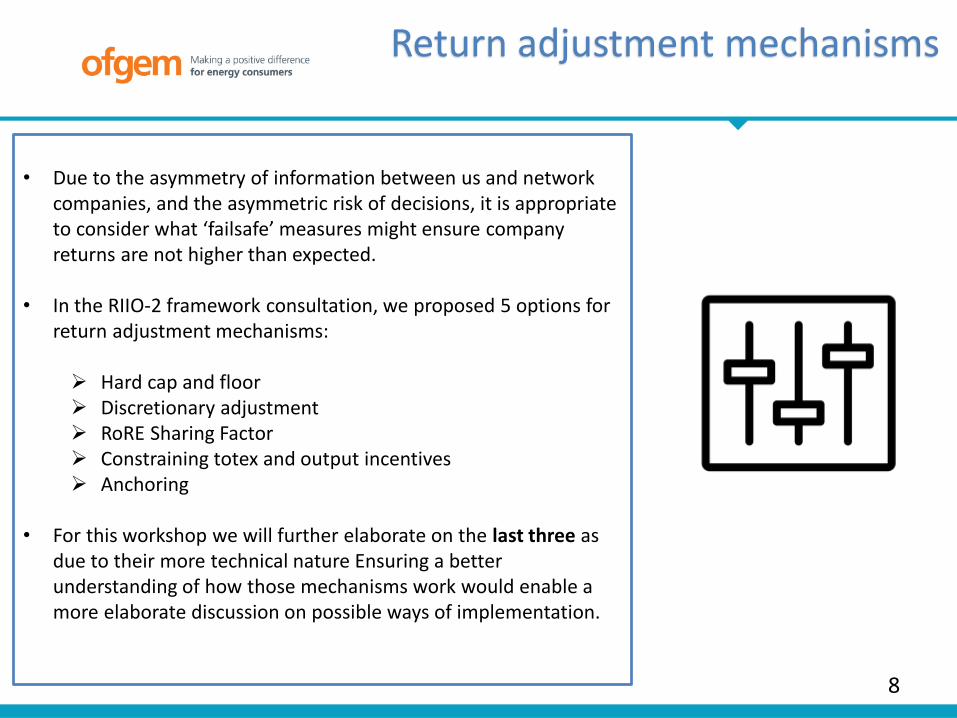
Return adjustment mechanisms
• Due to the asymmetry of information between us and network companies, and the asymmetric risk of decisions, it is appropriate to consider what ‘failsafe’ measures might ensure company returns are not higher than expected.
• In the RIIO-2 framework consultation, we proposed 5 options for return adjustment mechanisms:
Hard cap and floor Discretionary adjustment RoRE Sharing Factor Constraining totex and output incentives Anchoring
• For this workshop we will further elaborate on the last three as due to their more technical nature Ensuring a better understanding of how those mechanisms work would enable a more elaborate discussion on possible ways of implementation.
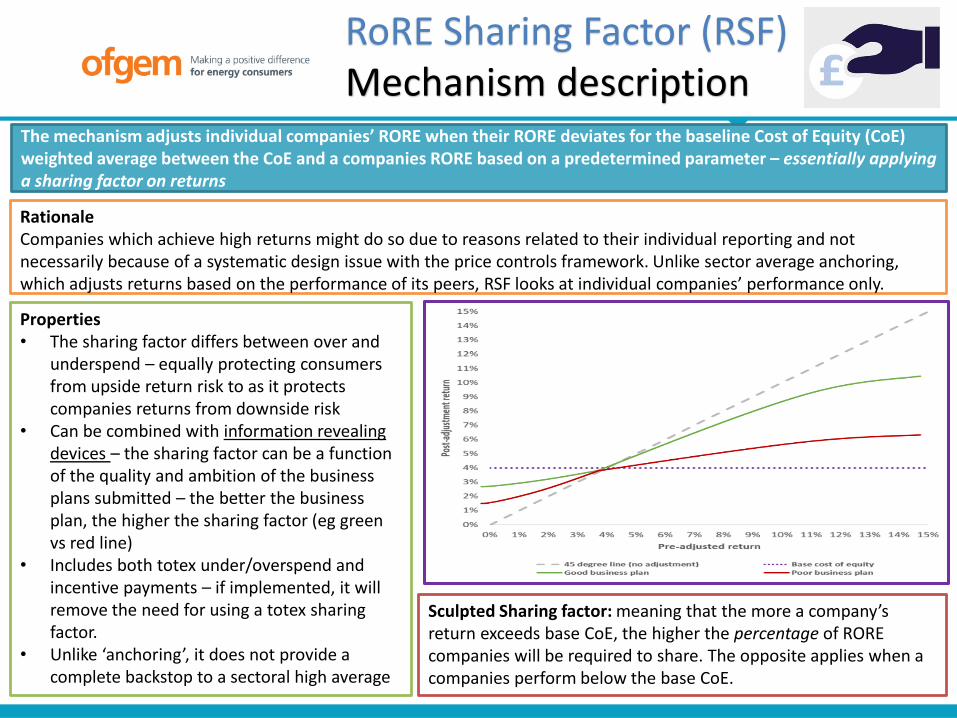
RoRE Sharing Factor (RSF)Mechanism description
9
The mechanism adjusts individual companies’ RORE when their RORE deviates for the baseline Cost of Equity (CoE) weighted average between the CoE and a companies RORE based on a predetermined parameter – essentially applying a sharing factor on returns
Rationale Companies which achieve high returns might do so due to reasons related to their individual reporting and not necessarily because of a systematic design issue with the price controls framework. Unlike sector average anchoring, which adjusts returns based on the performance of its peers, RSF looks at individual companies’ performance only.
Properties• The sharing factor differs between over and
underspend – equally protecting consumers from upside return risk to as it protects companies returns from downside risk
• Can be combined with information revealing devices – the sharing factor can be a function of the quality and ambition of the business plans submitted – the better the business plan, the higher the sharing factor (eg green vs red line)
• Includes both totex under/overspend and incentive payments – if implemented, it will remove the need for using a totex sharing factor.
• Unlike ‘anchoring’, it does not provide a complete backstop to a sectoral high average
Sculpted Sharing factor: meaning that the more a company’s return exceeds base CoE, the higher the percentage of RORE companies will be required to share. The opposite applies when a companies perform below the base CoE.
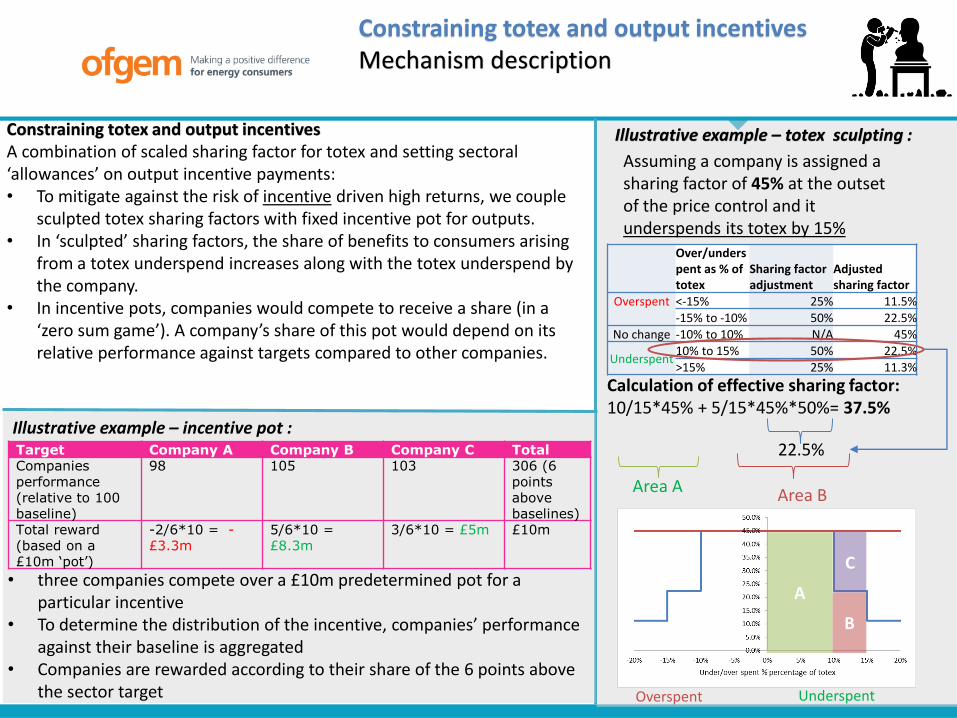
Assuming a company is assigned a sharing factor of 45% at the outset of the price control and it underspends its totex by 15%
Calculation of effective sharing factor:10/15*45% + 5/15*45%*50%= 37.5%
Illustrative example – totex sculpting :
Over/underspent as % of totex
Sharing factor adjustment
Adjusted sharing factor
Overspent <-15% 25% 11.5%-15% to -10% 50% 22.5%
No change -10% to 10% N/A 45%
Underspent10% to 15% 50% 22.5%>15% 25% 11.3%
22.5%
Area B Area A
UnderspentOverspent
A
B
C
Constraining totex and output incentivesA combination of scaled sharing factor for totex and setting sectoral ‘allowances’ on output incentive payments:• To mitigate against the risk of incentive driven high returns, we couple
sculpted totex sharing factors with fixed incentive pot for outputs. • In ‘sculpted’ sharing factors, the share of benefits to consumers arising
from a totex underspend increases along with the totex underspend by the company.
• In incentive pots, companies would compete to receive a share (in a ‘zero sum game’). A company’s share of this pot would depend on its relative performance against targets compared to other companies.
Illustrative example – incentive pot :Target Company A Company B Company C Total Companies performance (relative to 100 baseline)
98 105 103 306 (6 points above baselines)
Total reward (based on a £10m ‘pot’)
-2/6*10 = -£3.3m
5/6*10 = £8.3m
3/6*10 = £5m £10m
• three companies compete over a £10m predetermined pot for a particular incentive
• To determine the distribution of the incentive, companies’ performance against their baseline is aggregated
• Companies are rewarded according to their share of the 6 points above the sector target
Constraining totex and output incentivesMechanism description
AnchoringMechanism description
11
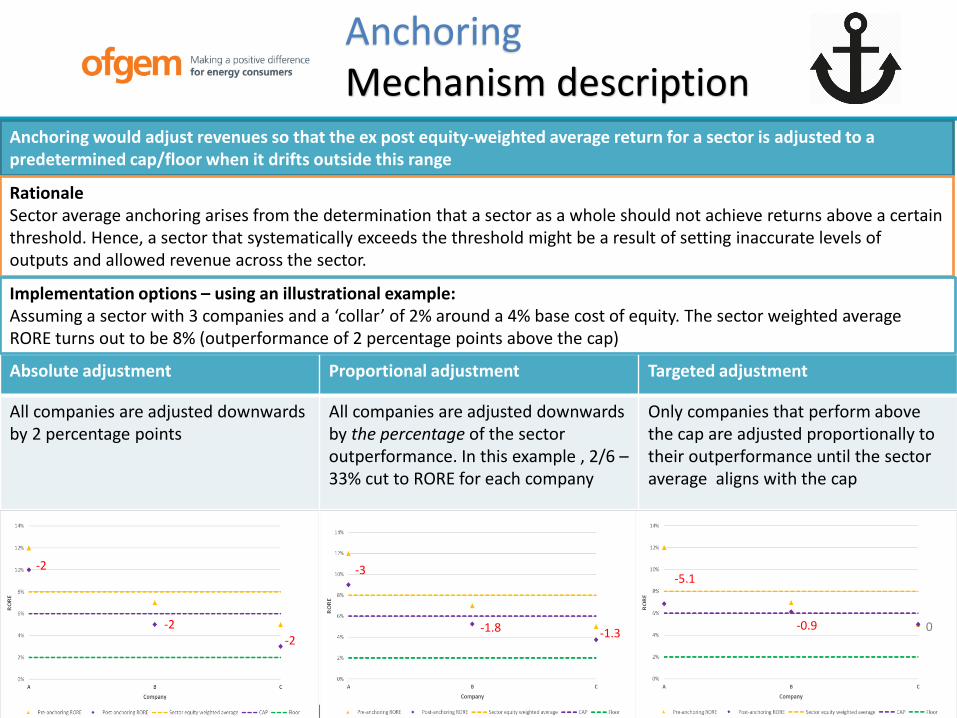
Anchoring would adjust revenues so that the ex post equity-weighted average return for a sector is adjusted to a predetermined cap/floor when it drifts outside this range
Rationale Sector average anchoring arises from the determination that a sector as a whole should not achieve returns above a certain threshold. Hence, a sector that systematically exceeds the threshold might be a result of setting inaccurate levels of outputs and allowed revenue across the sector.
Absolute adjustment Proportional adjustment Targeted adjustment
All companies are adjusted downwards by 2 percentage points
All companies are adjusted downwards by the percentage of the sector outperformance. In this example , 2/6 –33% cut to RORE for each company
Only companies that perform above the cap are adjusted proportionally to their outperformance until the sector average aligns with the cap
Implementation options – using an illustrational example: Assuming a sector with 3 companies and a ‘collar’ of 2% around a 4% base cost of equity. The sector weighted average RORE turns out to be 8% (outperformance of 2 percentage points above the cap)
-2
-2-2
-3
-1.8 -1.3
-5.1
-0.9 0

Lunch break
12
13
Session 1: Information Revealing Devices
Sharing factor matrices• Is IQI a good mechanism to deal with systematic over
forecasting of totex? • Is there a benefit in retaining the 75-25 allowed totex
interpolation rule given that the IQI reward offsets its effect?
• Is a PR19 styled sharing factor mechanism a more suitable alternative? Are there other alternatives?
Business plans submissions assessment • Should we introduce more categories other than fast-
tracked and slow-tracked? • What is the most suitable reward mechanism for different
categories (eg. higher sharing factors, addition to CoE, procedural benefits)?
• Is there a benefit in retaining a second business plan submission? If so, how could we retain the incentive to produce a competitive and well justified business plan in the first submission?
14
Session 2: Return adjustment mechanisms
Return ranges and distribution• How could we improve the distinction between well
performing and poor performing companies while mitigating sector systematic over performance?
• What should the relationship be between incentive strength and likely distribution of returns across a sector?
• How would you benchmark the performance of regulated network utilities to those of other industries?
Sharing factors • How would sculpted sharing factors (either on totex or
RORE) affect companies' behaviour in terms of preparing and delivering a business plan?
• What is the link between sharing factor levels and the incentive to find cost efficiencies? Is there any evidencewhich suggests that below a certain level, lowering sharing factors leads to reduced performance and less innovation?
Metrics• Which is the most suitable metric to base return
adjustments to network companies? Is it RORE? Should it also account for cost indexed measures such as cost of debt?

Concluding remarks
15