Embed Size (px)
Citation preview

Rio de Janeiro, March 6, 2015.
Consumption grows by 3.0% Quality indicators improve by 32.9% (DEC) and 20.6% (FEC)
� Total energy consumption grew by 3.0% year-on-year, totaling 6,694 in 4Q14, 2.5% higher than in 4Q13,
driven by the growth of 4.9% in the residential segment and 6.0% in the commercial segment. � In 2014, net revenue, excluding construction revenue, was R$8,289.9 million, an upturn of 25.6% in relation
to 2013. In the quarter, also excluding construction revenue, net revenue totaled R$2,988.6 million, 75.7% above the figure recorded in 4Q13, primarily explained by the recognition of the regulatory asset or liability (CVA) balance in the distributor’s net revenue. Net revenue, excluding construction revenue and the booking of CVA, would have come to R$7,270.0 million in 2014, a 10.1% increase in relation to 2014, and R$1,968.8 million in 4Q14, a 15.7% increase in relation to 4Q13.
� Consolidated EBITDA1 closed the year at R$1,809.7 million, moving up by 6.7% over 2013. In 4Q14, consolidated EBITDA was R$933.9 million, up 173.3% from 4Q13, chiefly due to the recognition of CVA balance in Light SESA and equity income gain from the dilution of the generation company’s stake in Renova Energia. Excluding these effects, EBITDA would have totaled R$1,332.4 million in 2014, down 14.1% on the adjusted EBITDA recorded in 2013, and R$288.0 million in 4Q14, a 5.5% decrease in relation to 4Q13.
� In 2014, net income was R$662.8 million, a 12.9% increase over 2013. In 4Q14, net income totaled R$520.1 million, moving up by 303.2% in relation to 4Q13. Excluding the recognition of CVA balance and equity income gain, net income came to R$299.1 million in 2014, a 39.1% reduction in relation to 2013, and R$45.1 million in 4Q14, a 56.8% decrease from the adjusted income recorded in 4Q13 .
� Non-technical energy losses in the last 12 months, calculated as a percentage of billed energy in the low-voltage market (ANEEL criterion), posted a reduction of 0.4 p.p. from 3Q14, reaching 40.9% in December 2014.
� The Operating Quality Indicators DEC (equivalent length of interruption indicator) and FEC (equivalent frequency of interruption indicator) came to 12.35 hours and 6.60 times, respectively, an improvement of 32.9% and 20.6% in relation to the same period last year.
� Collections totaled 98.6% of billed consumption in 2014, down 2.0 p.p. from 2013. Provisions for Past Due Accounts (PCLD) represented 1.3% of the distribution company’s gross billed energy in 2014.
� The Company closed December with net debt of R$6,076.5 million, an increase of 9.6% over September 2014. The net debt/EBITDA ratio stood at 3.70x.
� On March 6, 2015, the Board of Directors proposed the distribution of R$157.4 million, R$0.7719 per share, as dividends, referring to the results of fiscal year ended December 31, 2014. This proposal is subject to approval by the Annual Shareholders’ Meeting to be called.
BM&FBOVESPA: LIGT3 Conference Call: IR Contacts: OTC: LGSXY Date: 03/09/2015 Phone: +55 (21) 2211-7392/2828/2660 Total shares: 203,934,060 shares Time: 3:00 p.m. Brazil // 2:00 p.m. US ET Fax: +55 (21) 2211-2787 Free Float Total: 97,629,475 shares (47.87%) Phone: +55 (11) 2188 0155 // +1 (646) 843 6054 Email: [email protected] Market Cap (03/05/15): R$ 2.712 milhões Webcast: ri.light.com.br Website: ri.light.com.br
1 EBITDA is not a recognized measure under BRGAAP or IFRS. It is used by the Company as an additional measure of performance of its operations, and it should not be considered
individually or as an alternative to net income or operating income, as a measure of operating performance, or as an indicator of liquidity. The EBITDA presented is calculated in accordance with CVM Instruction 527/2012 and represents net income +income and social contribution tax + net financial expenses + depreciation and amortization. The reconciliation is shown on Exhibit II.
4Q14 4Q13 Var. % 2014 2013 Var. %
Grid Load* 9,886 9,507 4.0% 38,006 36,600 3.8%
Billed Energy - Captive Market 5,453 5,182 5.2% 21,500 20,391 5.4%
Consumption in the concession area 6,694 6,531 2.5% 26,493 25,717 3.0%
Transported Energy - TUSD 1,241 1,348 -7.9% 4,993 5,326 -6.3%
Sold Energy - Generation 1,119 1,245 -10.1% 4,526 4,888 -7.4%
Commercializated Energy (Esco) 1,358 1,022 32.8% 5,338 4,155 28.5%
4Q14 4Q13 Var. % 2014 2013 Var. %
Net Revenue** 2,989 1,701 75.7% 8,290 6,602 25.6%
EBITDA 934 342 173.3% 1,810 1,697 6.7%
EBITDA Margin** 31.2% 20.1% 11.2 p.p. 21.8% 25.7% -3.9 p.p.
Net Income 520 129 303.2% 663 587 12.9%
Net Debt 6,076 4,025 51.0% 6,076 4,025 51.0%
Capex 425 155 173.4% 1,054 845 24.7%
* Own Load + network use
** Does not consider construction revenue
Operational Highlights (GWh)
Financial Highlights (R$ MN)

2
Presentation of 4Q13 results (comparative period)
Management reassessed the criterion for the presentation of contractual debt amortization with the
pension plan in the cash flow statement, which led to a reclassification of the 2013 period for
comparison purposes.
For more information, see Exhibit VI of this report.

3
Table of Contents 1. The Company ........................................................................................................................................... 4
2.1 Distribution ......................................................................................................................................... 5 Energy Balance ................................................................................................................................. 7 Operating Quality .......................................................................................................................... 13
2.2 Generation ........................................................................................................................................ 14 2.3 Commercialization and Services ....................................................................................................... 15
3. Financial Performance ........................................................................................................................... 16 3.1 Net Revenue ..................................................................................................................................... 16
Consolidated ....................................................................................................................................... 16 Distribution ......................................................................................................................................... 17 Generation .......................................................................................................................................... 18 Commercialization and Services ......................................................................................................... 18
3.2 Costs and Expenses .......................................................................................................................... 19 Consolidated ....................................................................................................................................... 19 Distribution ......................................................................................................................................... 19 Generation .......................................................................................................................................... 23 Commercialization and Services ......................................................................................................... 23
3.3 EBITDA .............................................................................................................................................. 24 Consolidated .................................................................................................................................. 24 Distribution .................................................................................................................................... 25 Generation ..................................................................................................................................... 26 Commercialization and Services .................................................................................................... 26
3.4 Consolidated Financial Result ........................................................................................................... 27 3.5 Debt .................................................................................................................................................. 28 3.6 Net Income ....................................................................................................................................... 31 3.7 Investments ...................................................................................................................................... 33
Generation Capacity Expansion Projects ...................................................................................... 34 4. Cash Flow ................................................................................................................................................ 38 6. Capital Markets ...................................................................................................................................... 40 7. Recent Events ......................................................................................................................................... 42 8. Disclosure Program................................................................................................................................. 44 EXHIBIT I ..................................................................................................................................................... 45 EXHIBIT II .................................................................................................................................................... 46 EXHIBIT III ................................................................................................................................................... 46 EXHIBIT IV ................................................................................................................................................... 48 EXHIBIT V .................................................................................................................................................... 49 EXHIBIT VI ................................................................................................................................................... 50

4
1. The Company
Light S.A. is a holding company that controls subsidiaries and affiliated companies in three main business segments:
energy distribution, generation and commercialization/services. In order to increase the transparency of its results
and provide investors with a better basis for evaluation, Light also presents its results by business segment. The
Company’s corporate structure on December 31, 2014 is shown below:
OPERATING INDICATORS - DISTRIBUTION 4Q14 4Q13 Var. %
Nº of Consumers (thousand) 4,222 4,118 2.5%
Nº of Employees 4,282 4,293 -0.3%
Average provision tariff - R$/MWh 445 416 6.9%
Average provision tariff - R$/MWh (w/out taxes) 316 287 10.0%
Average energy purchase cost¹ - R$/MWh 163 133 22.9%
OPERATING INDICATORS - GENERATION 4Q14 4Q13 Var. %
Installed generation capacity (MW)* 971 941 3.2%
Assured energy (MW)* 694 685 1.2%
Pumping and internal losses (MW) 87 87 -
Available energy (Average MW)* 607 598 1.4%
Net Generation (GWh) 820 1,226 -33.1%
Load Factor 63.5% 61.8% 1.7 p.p.
¹Does not include purchase on spot.
* Includes proportionate share of associates

5
2. Operating Performance
2.1 Distribution
Total energy consumption in Light SESA’s concession area (captive clients + transport of free clients) came to 6,694
GWh in 4Q14, 2.5% up from the same period in 2013, due to an increase in all classes, except for the industrial
segment, which posted a 7.9% decrease, reflecting the lower consumption by electro-intensive industries (steel and
aluminum producers and chemical companies).
In the residential segment, consumption reached 2,203 GWh in the quarter, accounting for 32.9% of the total
market, a growth of 4.9% in relation of 4Q13. In 4Q14, the average temperature was 1.1°C higher than in 4Q13.
Commercial clients consumed 2,153 GWh in the quarter, representing 32.2% of the total, 6.0% up from 4Q13. The
commercial segment’s constant growth in recent years has been fueled by the expansion of the consumer base and
the increasing use and ownership of refrigeration equipment in commercial establishments, especially retailers.
Industrial consumption amounted to 1,326 GWh in 4Q14, equivalent to 19.8% of the total market, 7.9% down from
the same period last year. The industrial segment’s captive clients maintained their consumption in line with 4Q13,
while free clients posted a decrease of 10.3% in relation to the same period last year.
The other consumption segments, which accounted for 15.1% of the total market, recorded an increase of 5.3% in
consumption in relation to the fourth quarter of 2013. The rural and public utility categories reported respective
increases of 9.3% and 3.1%, while the government category posted a reduction of 1.4% in relation to 4Q13.

6
Total energy consumption in Light SESA’s concession area (captive clients + transport of free clients2) came to 26,493
GWh in 2014, 3.0% up in relation to 2013.
Residential consumption accounted for 33.8% of the total market and totaled 8,950 GWh in 2014, 7.7% up over
2013, reflecting the upturn in consumption in all quarters of the year, led by the first quarter (+13.6%), due to the
high temperatures in the summer of 2014.
Commercial clients consumed 8,328 GWh in the year, 4.9% up over 2013. As with residential consumption,
commercial consumption recorded growth in all quarters of 2014.
In 2014, industrial consumption amounted to 5,296 GWh, 6.6% less than in 2013, due to reduced consumption in the
steel/aluminum and chemical sectors. Excluding this effect, industrial consumption would have recorded a growth of
1.0% in relation to 2013. The industrial segment’s captive clients maintained their consumption in line with 2013,
while free clients recorded a decrease of 8.7% over 2013.
The other consumption segments, which accounted for 14.8% of the total market, recorded an increase of 3.2% over
2013. The rural, government and public utility categories reported increases of 26.8%, 1.5% and 2.8%, respectively, in
relation to 2013. This higher consumption in the rural category is explained by the reclassification of some clients,
who were previously treated as industrial, as a result of Aneel Resolution 414.
2 In view of ANEEL’s market ratification during the tariff revision process, consumption by the free client CSN has been reincluded as of 4Q13.

7
Energy Balance
521.3 8,949.8
Captive Billed Industrial
Energy 1,395.8
5,239.8 21,500.4
Commercial
30,523.9 7,449.3
Losses + Non Billed
7,854.3 31,089.6 Energy (**) Others
9,023.5 3,705.5
6,351.0
2,796.8
7,439.1
887.3
(*) Others = Purchase in Spot - Sale in Spot.
(**) Includes unbilled energy.
(***) Other transmission lines with less than 230 Kv
Note: 1) At Light S.A., there is intercompany power purchase/sale elimination.
2) Power purchase data as of 01/12/2014 (subject to change).
DIT Losses 134.9
COTAS
ANGRA I & II
Required E.
(CCEE)
DISTRIBUTION ENERGETIC BALANCE - GWh
Position: January - December 2014
PROINFAResidential
ITAIPU
(CCEE)
Own load
Light
AUCTIONS
(CCEE)
NORTE FLU
(CCEE)
Basic netw. Losses 430.7
OTHERS(*)
(CCEE)
1,7%
16,9%
25,3%
20,4%
9,0%
24,0%
2,9%
Energy Balance (GWh) 4Q14 4Q13 Var. % 2014 2013 Var. %
= Grid Load 9,886 9,507 4.0% 38,006 36,600 3.8%
- Energy transported to utilities 656 673 -2.4% 2,522 2,608 -3.3%
- Energy transported to free customers 1,231 1,340 -8.1% 4,960 5,339 -7.1%
= Own Load 7,998 7,495 6.7% 30,524 28,653 6.5%
- Captive market consumption 5,453 5,182 5.2% 21,500 20,391 5.4%
Low Voltage Market 3,651 3,446 6.0% 14,472 13,579 6.6%
Medium Voltage Market 1,801 1,737 3.7% 7,029 6,812 3.2%
= Losses + Non Billed Energy 2,546 2,312 10.1% 9,024 8,262 9.2%

8
Energy Losses
In the last 12 months, non-technical energy losses totaled 5,927 GWh, accounting for 40.9% of billed energy in the
low-voltage market (ANEEL criterion), 0.4 p.p. less than in the 12 months ended September 2014. In comparison with
the 12 months ended December 2013, when non-technical energy losses totaled 42.2% of the low-voltage market,
there was a reduction of 1.3 p.p.
Light SESA’s total energy losses amounted to 8,847 GWh, or 23.3% of the grid load, in the 12 months through
December 2014.
In order to continue reducing non-technical energy losses, Light is investing in initiatives that include conventional
fraud inspection procedures, the upgrading of network and measurement systems, and the Zero Loss Area program
(APZ). Among these initiatives, the following stand out:
• Consumer unit regularizations: The Company conducted 61,219 regularization procedures in the low, medium,
and high-voltage segments in 2014, 5.6% up from 57,962 in 2013. Energy incorporation totaled 279.1 GWh in 2014,
13.7% up from the 245.6 GWh reported in 2013. Recovered energy increased by 16.6% to 179.7 GWh in 2014, versus
154.1 GWh in 2013.
Number of Normalizations 4Q14 4Q13 Var. % 2014 2013 Var. %
= Total 14,288 13,598 5.1% 61,219 57,962 5.6%
- High / Medium Voltage 247 167 47.9% 842 962 -12.5%
- Low Voltage 14,041 13,431 4.5% 60,377 57,000 5.9%
Direct low voltage 11,344 12,570 -9.8% 50,664 52,666 -3.8%
Indirect low voltage 2,697 861 213.2% 9,713 4,334 124.1%

9
• Installation of remote electronic metering devices: SMC
(centralized metering system) devices are installed in areas with
high loss rates, with or without the support of Pacifying Police
Units (UPPs). The UPPs give Light more room for maneuver in
regard to combating default or energy theft. The Company
installed 10,141 such devices in UPP-protected areas in 4Q14,
resulting in the incorporation of 15.0 GWh. In areas outside the
sphere of the UPPs, Light installed 41,195 devices, with the
incorporation of 26.9 GWh. As a result, the Company closed
2014 with 622,000 installed electronic meters, 190,000 units
(+44.0%) more than at the end of December 2013. In May 2014, the Company announced that Landis+Gyr
Equipamentos de Medição Ltda (“Landis+Gyr”) was chosen as the supplier of equipment and services for the
automation of overhead and underground networks for an Integrated System using smart grids and devices in the
distribution system (“Smart Grid Project”). After the work statement phase, the contract was signed in September
2014, encompassing the supply of approximately 1 million metering devices in the next five years for R$750 million.
Currently, Light and Landis+Gyr are adjusting the information technology environment in order to receive this new
communications solution.
• Zero Loss Areas: In August 2012, the Company created the APZ Project, based on a combination of electronic
metering and a shielded network, supported by dedicated teams of technicians and commercial relations personnel
with clearly defined targets, whose compensation is tied to improving loss and default indicators in their respective
areas. A typical APZ has around 17,000 clients. The project, known commercially as "Light Legal", which receives
support from SEBRAE in regard to the training of partnering micro-entrepreneurs, has 37 operational APZs and
624,000 clients in the Baixada Fluminense region and the city’s south, west and north sides.
10
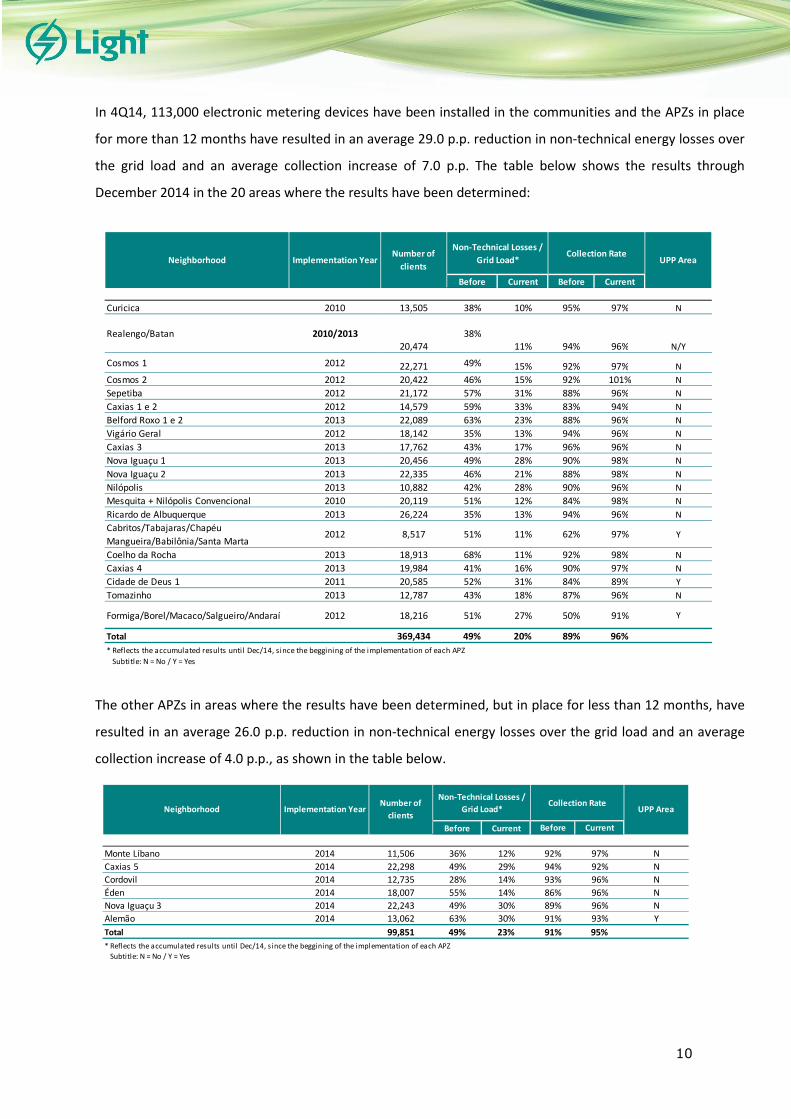
In 4Q14, 113,000 electronic metering devices have been installed in the communities and the APZs in place
for more than 12 months have resulted in an average 29.0 p.p. reduction in non-technical energy losses over
the grid load and an average collection increase of 7.0 p.p. The table below shows the results through
December 2014 in the 20 areas where the results have been determined:
The other APZs in areas where the results have been determined, but in place for less than 12 months, have
resulted in an average 26.0 p.p. reduction in non-technical energy losses over the grid load and an average
collection increase of 4.0 p.p., as shown in the table below.
Before Current Before Current
Curicica 2010 13,505 38% 10% 95% 97% N
Realengo/Batan 2010/201320,474
38%11% 94% 96% N/Y
Cosmos 1 2012 22,271 49% 15% 92% 97% N
Cosmos 2 2012 20,422 46% 15% 92% 101% N
Sepetiba 2012 21,172 57% 31% 88% 96% N
Caxias 1 e 2 2012 14,579 59% 33% 83% 94% N
Belford Roxo 1 e 2 2013 22,089 63% 23% 88% 96% N
Vigário Geral 2012 18,142 35% 13% 94% 96% N
Caxias 3 2013 17,762 43% 17% 96% 96% N
Nova Iguaçu 1 2013 20,456 49% 28% 90% 98% N
Nova Iguaçu 2 2013 22,335 46% 21% 88% 98% N
Nilópolis 2013 10,882 42% 28% 90% 96% N
Mesquita + Nilópolis Convencional 2010 20,119 51% 12% 84% 98% N
Ricardo de Albuquerque 2013 26,224 35% 13% 94% 96% N
Cabritos/Tabajaras/Chapéu
Mangueira/Babilônia/Santa Marta2012 8,517 51% 11% 62% 97% Y
Coelho da Rocha 2013 18,913 68% 11% 92% 98% N
Caxias 4 2013 19,984 41% 16% 90% 97% N
Cidade de Deus 1 2011 20,585 52% 31% 84% 89% Y
Tomazinho 2013 12,787 43% 18% 87% 96% N
Formiga/Borel/Macaco/Salgueiro/Andaraí 2012 18,216 51% 27% 50% 91% Y
Total 369,434 49% 20% 89% 96%
UPP Area
* Reflects the accumulated results until Dec/14, since the beggining of the implementation of each APZ
Subtitle: N = No / Y = Yes
Neighborhood Implementation YearNumber of
clients
Non-Technical Losses /
Grid Load*Collection Rate
Before Current Before Current
Monte Líbano 2014 11,506 36% 12% 92% 97% N
Caxias 5 2014 22,298 49% 29% 94% 92% N
Cordovil 2014 12,735 28% 14% 93% 96% N
Éden 2014 18,007 55% 14% 86% 96% N
Nova Iguaçu 3 2014 22,243 49% 30% 89% 96% N
Alemão 2014 13,062 63% 30% 91% 93% Y
Total 99,851 49% 23% 91% 95%
* Reflects the accumulated results unti l Dec/14, since the beggining of the implementation of each APZ
Subtitle: N = No / Y = Yes
Neighborhood Implementation YearNumber of
clients
Non-Technical Losses /
Grid Load*Collection Rate
UPP Area

11
Complementing the 26 areas where the results have already been determined, the table below shows the 11
APZs in the implementation phase, without recorded results, totaling 37 operating areas. The total of clients
still with no results is approximately 155,000.
Rio das Pedras 2014 12,654 83% 75% N
Comunidades Centro 2014 17,005 62% 89% Y
Vilar dos Teles 1 2014 13,046 61% 97% N
Comunidades Estácio 2014 12,388 70% 90% Y
Rosali 1 2014 13,156 41% 94% N
Rosali 2 2014 14,282 33% 97% N
Rosali 3 2014 15,865 25% 97% N
Rosali 5 2014 15,036 54% 98% N
Caxias 6 2014 14,544 39% 96% N
Areia Branca 1 2014 15,463 65% 96% N
Areia Branca 5 2014 11,627 40% 95% N
Total 155,066
Neighborhood Implementation YearNumber of
clients
Non-Technical
Losses / Grid Load*Collection Rate UPP Area
12
Collection
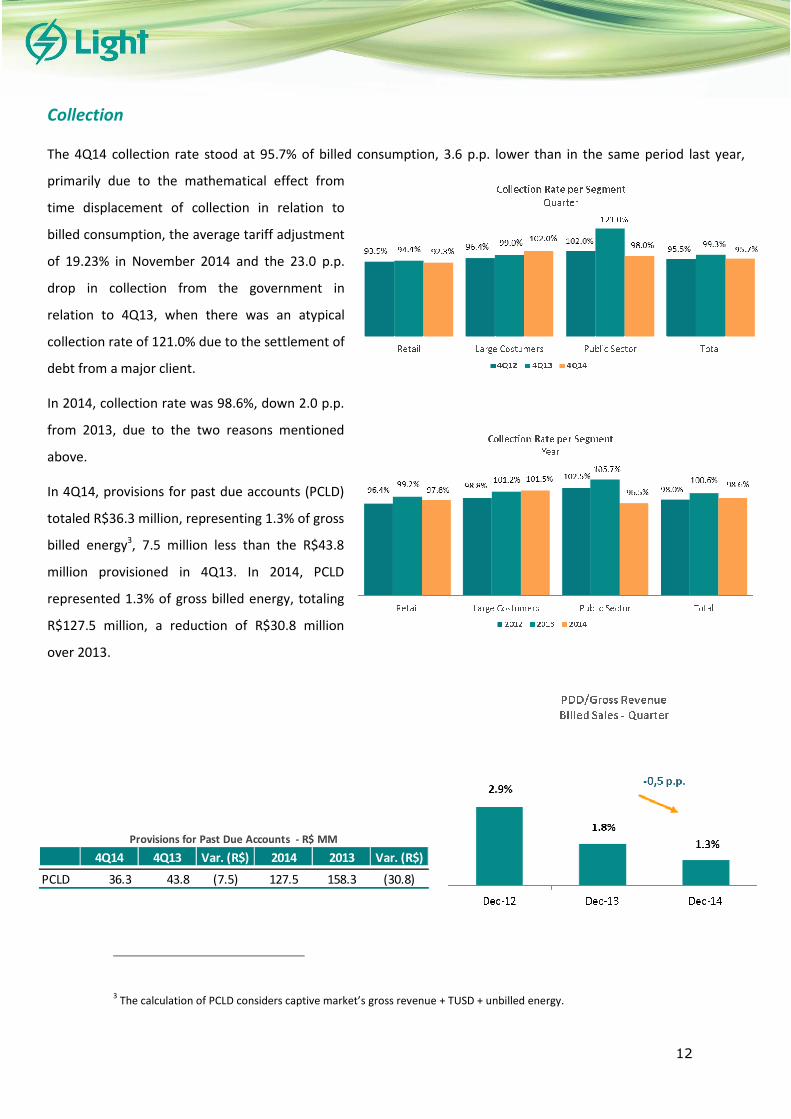
The 4Q14 collection rate stood at 95.7% of billed consumption, 3.6 p.p. lower than in the same period last year,
primarily due to the mathematical effect from
time displacement of collection in relation to
billed consumption, the average tariff adjustment
of 19.23% in November 2014 and the 23.0 p.p.
drop in collection from the government in
relation to 4Q13, when there was an atypical
collection rate of 121.0% due to the settlement of
debt from a major client.
In 2014, collection rate was 98.6%, down 2.0 p.p.
from 2013, due to the two reasons mentioned
above.
In 4Q14, provisions for past due accounts (PCLD)
totaled R$36.3 million, representing 1.3% of gross
billed energy3, 7.5 million less than the R$43.8
million provisioned in 4Q13. In 2014, PCLD
represented 1.3% of gross billed energy, totaling
R$127.5 million, a reduction of R$30.8 million
over 2013.
3 The calculation of PCLD considers captive market’s gross revenue + TUSD + unbilled energy.
4Q14 4Q13 Var. (R$) 2014 2013 Var. (R$)
PCLD 36.3 43.8 (7.5) 127.5 158.3 (30.8)
Provisions for Past Due Accounts - R$ MM

13
Operating Quality
In 4Q14, in the overhead distribution network, 98 medium-voltage distribution circuits were inspected/maintained,
1,206 transformers were replaced and 33,169 trees were pruned. In the underground distribution network, 5,957
transformer vaults and 13,959 manholes were inspected. In addition, 98 transformers, 78 switches and 290
protectors were maintained.
In the last 12 months, the moving average of the equivalent length of interruption indicator (DEC), expressed in time,
registered 12.35 hours, 32.88% down from the same period last year, while that of the equivalent frequency of
interruption indicator (FEC), expressed in occurrences, stood at 6.60 times, a drop of 20.58% in relation to the same
period last year.
All indicators in 4Q14 reflect the improved performance of the network thanks to the reorganization of processes in
the distribution area and the initiatives implemented through the action plan initiated in June 2013. More intensive
tree pruning and energy network preventive maintenance measures are having a positive impact on results, ensuring
an improved DEC and FEC performance. The improvement in the quality indicators in 2014 reflected in the reduction
of 30.1% of expenses with DIC/FIC when compared with 2013.

14
2.2 Generation
Light Energia sold 1,119.1 GWh in 4Q14, net of energy purchases, 10.1% down year-on-year.
No energy was sold on the captive market (ACR) in 2014, due to the expiration of the last existing captive energy sale
contracts in December 2013. These contracts were renegotiated on the free market (ACL), whose 4Q14 energy sales
moved up by 34.4% as a result.
Net spot market purchases came to 41.4 GWh in 4Q14, versus total sales net of purchases of 113.0 GWh in 4Q13.
This result was due to the low GSF (Generation Scaling Factors), in turn caused by the national system’s exceptionally
poor hydrological conditions, impacted by low average rainfall and the consequent period depletion of hydro plant
reservoirs.
The GSF in October, November and December 2014 came to 87.67%, 87.73% and 87.84%, respectively, versus
103.31%, 103.36% and 107.97% in the same months in 2013. The average GSF in 4Q14 was 87.24%, 17.64 p.p. lower
than the figure recorded in the same period in 2013. The average GSF in 2014 stood at 90.61%, 6.6 p.p. below the
average GSF reported in 2013.
In 2014, energy sales on the free market (ACL) increased by 25.6% over 2013, while spot market sales (net of
purchases) recorded a sharp reduction between the periods.
LIGHT ENERGIA (GWh) 4Q14 4Q13 Var. % 2014 2013 Var. %
Regulated Contracting Environment Sales - 268.1 - - 1,044.3 -
Free Contracting Environment Sales 1,160.5 863.2 34.4% 4,556.5 3,627.5 25.6%
Spot Sales (CCEE) (41.4) 113.4 - (30.1) 216.3 -113.9%
Total 1,119.1 1,244.8 -10.1% 4,526.3 4,888.1 -7.4%
15
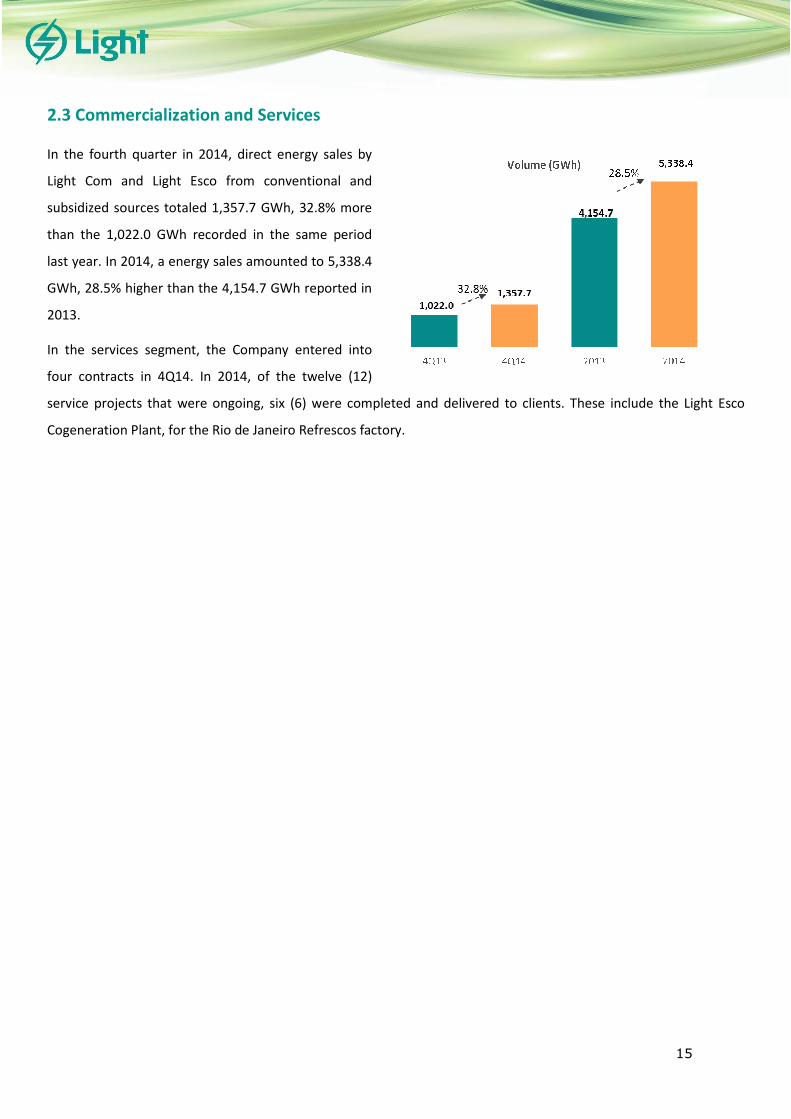
2.3 Commercialization and Services
In the fourth quarter in 2014, direct energy sales by
Light Com and Light Esco from conventional and
subsidized sources totaled 1,357.7 GWh, 32.8% more
than the 1,022.0 GWh recorded in the same period
last year. In 2014, a energy sales amounted to 5,338.4
GWh, 28.5% higher than the 4,154.7 GWh reported in
2013.
In the services segment, the Company entered into
four contracts in 4Q14. In 2014, of the twelve (12)
service projects that were ongoing, six (6) were completed and delivered to clients. These include the Light Esco
Cogeneration Plant, for the Rio de Janeiro Refrescos factory.

16
3. Financial Performance
3.1 Net Revenue
Consolidated
Consolidated net operating revenue totaled 3,294.7 million in 4Q14, 59.5% more than in 4Q13. Excluding revenue
from construction, which has a neutral effect on net income, consolidated net revenue totaled 2,988.6 million in
4Q14, moving up by 75.7%, due to market growth and the booking of CVA in the revenue. Excluding revenue from
construction and the booking of CVA, net revenue came to R$1,968.8 million in the quarter, an increase of 15.7% in
relation to 4Q13.
The distribution and commercialization/service segments recorded respective upturns of 82.2% and 62.6%, while net
operating revenue from the generation segment fell by 13.0%.
In 2014, net revenue moved up by 24.4%. Excluding revenue from construction, consolidated net revenue totaled
grew by 25.6% in relation to 2013, due to market growth and the booking of CVA in the revenue.
Net Revenue (R$ MN) 4Q14 4Q13 Var.% 2014 2013 Var.%
Distribution
Billed consumption 1,456.6 1,340.5 8.7% 5,591.1 5,354.1 4.4%
Non billed energy 139.6 39.1 257.2% 104.7 (75.1) -
Network use (TUSD) 129.0 109.3 18.1% 465.5 491.7 -5.3%
Short-Term (Spot) - - - 60.6 37.8 60.5%
Others 27.5 32.9 -16.3% 76.1 88.1 -13.6%
CVA 1,019.8 - - 1,019.8 - -
Subtotal (a) 2,772.6 1,521.8 82.2% 7,317.8 5,896.5 24.1%
Construction Revenue¹ 306.1 365.0 -16.1% 940.5 820.3 14.7%
Subtotal (a') 3,078.7 1,886.8 63.2% 8,258.3 6,716.8 23.0%
Generation
Generation Sale (ACR+ACL) 126.7 119.6 5.9% 502.1 504.9 -0.6%
Short-Term - 24.3 - 89.5 43.7 104.7%
Others 2.6 4.6 -43.9% 9.9 10.0 -0.9%
Subtotal (b) 129.2 148.5 -13.0% 601.6 558.7 7.7%
Commercialization and Services
Energy Sales 214.7 121.8 76.3% 862.0 566.5 52.2%
Services 6.4 14.2 -54.9% 37.2 35.2 5.8%
Subtotal (c) 221.1 135.9 62.6% 899.2 601.7 49.5%
Others and Eliminations (d) (134.3) (105.2) 27.6% (528.7) (454.8) 16.2%
Total w/out construction revenue (a+b+c+d) 2,988.6 1,701.0 75.7% 8,289.9 6,602.0 25.6%
Total (a'+b+c+d) 3,294.7 2,066.0 59.5% 9,230.4 7,422.3 24.4%
¹ The subsidiary Light SESA counts revenues and costs, with zero margin, related to services of construction or improvement in
infrastructure used in services of electricity distribution.

17
In 2014, , excluding revenue from construction and the booking of CVA, net revenue came to R$7,270.0 million in
2014, 10.1% higher than in 2013.
Distribution
Net revenue from distribution totaled R$3,078.7 million in 4Q14, an increase of 63.2% in relation to 4Q13. Excluding
revenue from construction, net revenue came to R$2,772.6 million in 4Q14, 82.2% up on the same period last year.
This result can be explained by: (i) the R$1,019.8 million recognition of CVA balance in the distributor’s net revenue
as of December 20144 (excluding this effect, net revenue grew 15.2% in the quarter); (ii) the 257.2% increase in
unbilled energy, provisioned for in accordance with the billing scale, due to high temperatures in December 2014;
(iii) the average tariff adjustment of 19.23% as of November 7, 2014; (iv) the 2.5% upturn in energy in the quarter.
Revenue from demand surplus and exceeding reactive energy totaled R$13.0 million this quarter and revenue from
the tariff difference related to the special treatment of non-technical losses in the concession area amounted to
R$66.4 million, both of which treated as special obligations. Although they are billed, they have not been included in
net revenue since the last tariff revision in November 2013. The distribution market consists mostly of the
residential and commercial segments, which together accounted for 61.8% of 4Q14 energy consumption and 73.6%
of sales revenue.
4 On December 10, 2014, a fourth amendment was signed to the concession contract for distribution by the subsidiary Light SESA, which ensured the right and duty that the remaining balances of any insufficiency or reimbursement of the tariff at the end of the concession will be added or deducted from the compensation amount, which allowed for the recognition of the balances of these regulatory assets and liabilities.

18
Excluding revenue from construction, net revenue from distribution came to R$7,317.8 million in 2014, an increase
of 24.1% over 2013 explained by: (i) the recognition of CVA balance in the distributor’s net revenue as of December
(excluding this effect, net revenue grew 6.8% in 2014); (ii) the increase in unbilled energy; (iii) the annual tariff
adjustment as of November 7, 2014; (iv) the 3.0% upturn in energy consumption in the year. In 2014, revenue from
surplus demand and excess reactive energy totaled R$50.2 million, while revenue from the tariff difference related
to the special treatment of non-technical losses in the concession area amounted to R$186.5 million.
Generation
Net revenue from generation totaled R$129.2 million in 4Q14, 13.0% lower than the R$148.5 million recorded in
4Q13. This reduction is explained by the decreased availability of energy for sale, in view of a larger deficit in GSF in
relation to the same period in 2013. As a result, 41.4 GWh had to be purchased on the spot market in order to fulfill
the contracts entered into in 4Q14, while in 4Q13 the generator recorded sales, net of purchases, of 113.4 GWh.
The average sale price on the free market, net of taxes, was R$109.2/MWh in 4Q14, 3.2% higher than the
R$106.1/MWh recorded in 4Q13 (weighted by the free and captive markets). After the termination of contracts in
the regulated market in December 2013, the trading company became responsible for the sale to end clients.
In 2014, net revenue from generation totaled R$601.6 million, an upturn of 7.7% over 2013, explained by the higher
availability of energy sold on the spot market in the first quarter of 2014 for an average price of R$658.3/MWh.
Commercialization and Services
Net revenue from commercialization and services stood at R$221.1 million in 4Q14, 62.6% up from 4Q13.
In 4Q14, net revenue from energy resales increased by 76.3% over 4Q13, fueled by the 32.8% year-on-year upturn in
sales volume in 4Q14 versus 4Q13, due to the reallocation of Light Energia’s terminated contracts, as the sale to end
clients started to be performed by the trading company. The average sale price, net of taxes, was R$158.1/MWh in
4Q14, versus R$118.8/MWh in 4Q13.
2014 net revenue totaled 899.2 million, 49.5% higher than in 2013, due to the substantial period increase in energy
sales volume.
19
3.2 Costs and Expenses
Consolidated
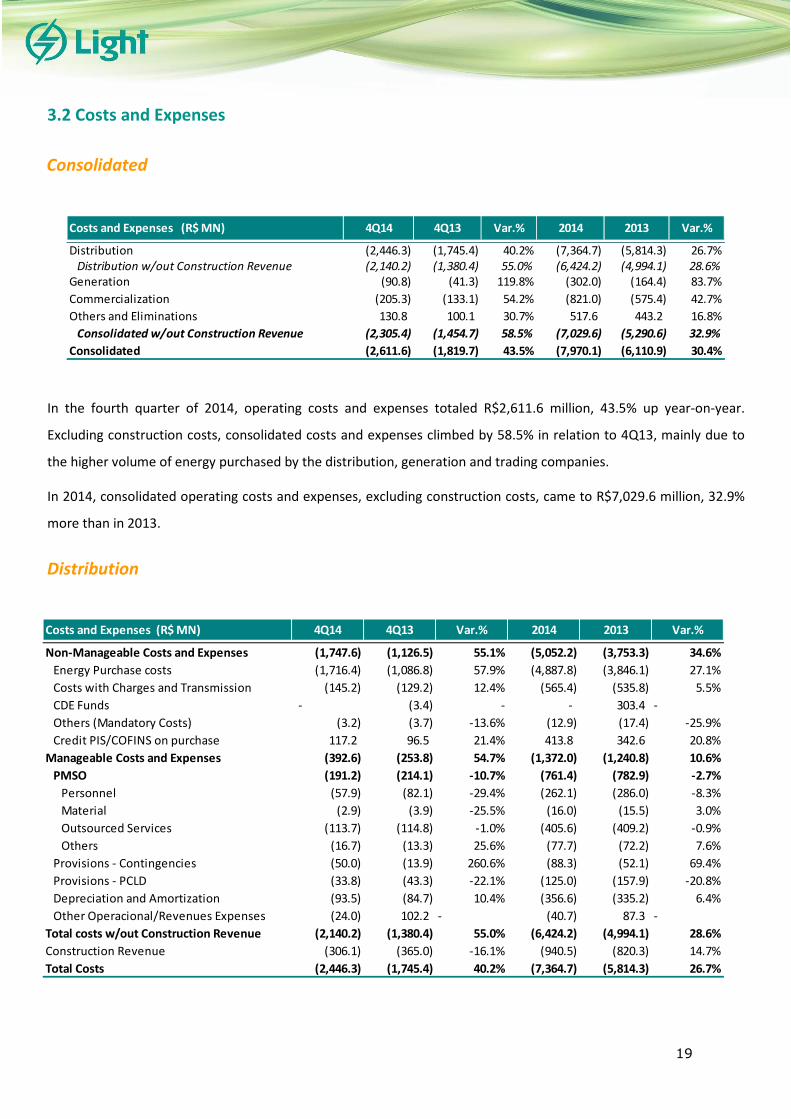
In the fourth quarter of 2014, operating costs and expenses totaled R$2,611.6 million, 43.5% up year-on-year.
Excluding construction costs, consolidated costs and expenses climbed by 58.5% in relation to 4Q13, mainly due to
the higher volume of energy purchased by the distribution, generation and trading companies.
In 2014, consolidated operating costs and expenses, excluding construction costs, came to R$7,029.6 million, 32.9%
more than in 2013.
Distribution
Costs and Expenses (R$ MN) 4Q14 4Q13 Var.% 2014 2013 Var.%
Distribution (2,446.3) (1,745.4) 40.2% (7,364.7) (5,814.3) 26.7%Distribution w/out Construction Revenue (2,140.2) (1,380.4) 55.0% (6,424.2) (4,994.1) 28.6%
Generation (90.8) (41.3) 119.8% (302.0) (164.4) 83.7%
Commercialization (205.3) (133.1) 54.2% (821.0) (575.4) 42.7%
Others and Eliminations 130.8 100.1 30.7% 517.6 443.2 16.8%
Consolidated w/out Construction Revenue (2,305.4) (1,454.7) 58.5% (7,029.6) (5,290.6) 32.9%
Consolidated (2,611.6) (1,819.7) 43.5% (7,970.1) (6,110.9) 30.4%
Costs and Expenses (R$ MN) 4Q14 4Q13 Var.% 2014 2013 Var.%
Non-Manageable Costs and Expenses (1,747.6) (1,126.5) 55.1% (5,052.2) (3,753.3) 34.6%
Energy Purchase costs (1,716.4) (1,086.8) 57.9% (4,887.8) (3,846.1) 27.1%
Costs with Charges and Transmission (145.2) (129.2) 12.4% (565.4) (535.8) 5.5%
CDE Funds - (3.4) - - 303.4 -
Others (Mandatory Costs) (3.2) (3.7) -13.6% (12.9) (17.4) -25.9%
Credit PIS/COFINS on purchase 117.2 96.5 21.4% 413.8 342.6 20.8%
Manageable Costs and Expenses (392.6) (253.8) 54.7% (1,372.0) (1,240.8) 10.6%
PMSO (191.2) (214.1) -10.7% (761.4) (782.9) -2.7%
Personnel (57.9) (82.1) -29.4% (262.1) (286.0) -8.3%
Material (2.9) (3.9) -25.5% (16.0) (15.5) 3.0%
Outsourced Services (113.7) (114.8) -1.0% (405.6) (409.2) -0.9%
Others (16.7) (13.3) 25.6% (77.7) (72.2) 7.6%
Provisions - Contingencies (50.0) (13.9) 260.6% (88.3) (52.1) 69.4%
Provisions - PCLD (33.8) (43.3) -22.1% (125.0) (157.9) -20.8%
Depreciation and Amortization (93.5) (84.7) 10.4% (356.6) (335.2) 6.4%
Other Operacional/Revenues Expenses (24.0) 102.2 - (40.7) 87.3 -
Total costs w/out Construction Revenue (2,140.2) (1,380.4) 55.0% (6,424.2) (4,994.1) 28.6%
Construction Revenue (306.1) (365.0) -16.1% (940.5) (820.3) 14.7%
Total Costs (2,446.3) (1,745.4) 40.2% (7,364.7) (5,814.3) 26.7%

20
In 4Q14, distribution costs and expenses moved up by 40.2% over 4Q13. Excluding construction costs, total costs and
expenses grew by 55.0% from 4Q13. In 2014, distribution costs and expenses moved up by 26.7%, while total costs
and expenses, excluding construction costs, increased by 28.6%.
Non-Manageable Costs and Expenses
In 4Q14, non-manageable costs and expenses came to R$1,747.6 million, 55.1% higher than in the same period in
2013, chiefly due to the increases of 57.9% in costs with energy
purchases and 12.4% in expenses related to charges and transmission.
The increase in purchased energy costs in 4Q14 was a reflection of: (i)
higher costs associated with hydrological risk resulting from quotas,
due to larger deficit in GSF; (ii) contracting through the A-1 Auction, in
December 2013, and the A-0 Auction, in April 2014, at R$
177.22/MWh and R$ 268.33/MWh, respectively, higher than the
prices covered by the tariff; (iii) annual contractual adjustments; (iv)
the increase in the average difference settlement price (PLD) from
R$333.3/MWh in 4Q13 to R$727.5/MWh in 4Q14, which resulted in
higher expenses with Availability Contracts, due to thermal plant
dispatch by the National System Operator (ONS) as a result of
depleted hydro plant reservoirs. Due to adverse hydrological
conditions, in April 2014, Conta-ACR (“Captive Market Account”) was
created, aiming to cover—partially or fully—the costs incurred by
energy distribution companies in the period from February to
December 2014 arising from involuntary exposure to the spot market
and thermal power acquisition linked to Availabilities Contract for Sale
of Electricity in the Regulated Environment (CCEAR-D). Since the funds
provided under the Account were sufficient for settlements only until
October 2014, settlements related to the November and December
2014, which in Light SESA’s case total R$471 million, were postponed
until March 31, 2015. A new disbursement of funds under the Account is being negotiated by the Government.

21
Costs with charges and transmission climbed by 12.4% in 4Q14, mainly due to the 63.1% upturn in energy
transmission expenses as a result of higher volumes contracted with the basic network, together with the increase in
the network usage charge.
The average purchased energy cost, excluding spot market purchases, amounted to R$163.4/MWh in 4Q14, 29.6%
more than the R$126.0/MWh recorded in 4Q13. Including spot market purchases, the average purchased energy
cost came to R$239.7/MWh in 4Q14, higher than the 4Q13 average of R$131.7/MWh. The following table gives a
breakdown of non-manageable costs:
In 2014, the 27.1% increase in purchased energy costs resulted from: (i) higher costs associated with hydrological risk
resulting from quotas; (ii) contracting at auctions for higher amounts than the prices covered by the tariff; (iii) annual
contractual adjustments; (iv) the increase in the average difference settlement price (PLD) from R$272.3/MWh in
2013 to R$690.0/MWh in 2014.
Costs with charges and transmission climbed by 5.5% in 2014, primarily due to the 44.8% surge in energy
transmission expenses as a result of higher volumes contracted with the basic network, together with the increase in
the network usage charge.
Non-Manageable Costs and Expenses (R$ MN) 4Q14 4Q13 Var.% 2014 2013 Var.%
Energy Purchase costs (1,716.4) (1,086.8) 57.9% (4,887.8) (3,846.1) 27.1%
Itaipu (195.6) (172.5) 13.4% (711.6) (654.7) 8.7%
TPP Norte Fluminense (298.9) (279.0) 7.1% (1,139.9) (1,089.0) 4.7%
Short-Term Energy (Spot) (809.0) (108.7) 644.5% (2,397.4) (443.1) 441.0%
Risco Hidrológico (319.6) (0.6) 54805.8% (517.7) (102.6) 404.5%
Exposição das Cotas - - - - (160.4) -
Demais (489.5) (108.1) 352.8% (1,879.7) (180.1) 943.8%
Energy auction (605.0) (498.5) 21.4% (2,424.2) (1,827.0) 32.7%
Availabilities Contracts (269.3) (203.0) 32.7% (1,327.0) (870.2) 52.5%
Others (335.7) (295.5) 13.6% (1,097.2) (956.8) 14.7%
CDE Funds 99.6 27.3 264.9% 1,647.5 319.6 415.5%
Hydrological risk 46.0 27.3 68.4% 82.8 159.2 -48.0%
Quotas Exposure 81.1 - - 1,335.9 160.4 732.8%
Availabilities Contracts 43.1 - - 312.2 - -
CONER (Power Reserve) (70.6) - - (83.4) - -
Other Credits 92.5 (55.4) - 137.9 (151.9) -
Costs with Charges and Transmission (145.2) (129.2) 12.4% (565.4) (535.8) 5.5%
System Service Charge (ESS) (23.0) (41.6) -44.7% (95.1) (320.5) -70.3%
CDE - ESS 13.4 9.1 47.6% 13.4 178.0 -92.5%
Transported Energy (93.6) (57.4) 63.1% (315.1) (217.7) 44.8%
Other Charges (41.9) (39.3) 6.8% (168.5) (175.7) -4.1%
CDE Funds
Others (Mandatory Costs) (3.2) (3.7) - (12.9) (17.4) -
Credit PIS / COFINS on purchase 117.2 96.5 21.4% 413.8 342.6 20.8%
Total (1,747.6) (1,126.5) 55.1% (5,052.2) (3,753.3) 34.6%
22
Manageable Costs and Expenses
In 4Q14, manageable operating costs and expenses, comprising personnel, materials, outsourced services,
provisions, depreciation, other operating revenue/expenses and others, totaled R$392.6 million, 54.7% up from
4Q13.
Costs and expenses from personnel, materials, outsourced services and others (PMSO) totaled R$191.2 million in
4Q14, 10.7% less than in the same period last year, mainly due to the 29.4% reduction in the personnel line, partially
offset by the 25.6% in the others line. This 29.4% reduction in the personnel line was primarily due to: (i) the higher
volume invested in labor capitalization in the quarter, and (ii) recognition of bonus payments to the management in
December 2013. In 4Q14, costs and expenses from materials and outsourced services remained in line with 4Q13.
The 25.6% upturn in the others line can be explained by higher own electricity consumption, expenses with
advertising campaigns to raise awareness about efficient energy use and with cultural projects.
The provisions line totaled R$50.0 million in 4Q14, 260.6% higher than in 4Q13, mainly driven by provisions for risks
related to civil lawsuits amounting to R$39.0 million, partially offset by the 22.1% reduction in provisions for past
due accounts (PCLD), from R$43.3 million in 4Q13 to R$33.8 million in this quarter.
The depreciation and amortization line increased by 10.4% in 4Q14 over 4Q13, due to higher investments as a result
of the incorporation of more assets into the network in 2014.
In 4Q14, the other operating revenue/expenses line totaled expenses of R$24.0 million, versus revenue of R$102.2
million in 4Q13, reflecting the recognition of R$124.8 million related to the New Repositioning Value (VNR) which
took place in the 2013 Tariff Revision.

23
Generation
Light Energia’s 4Q14 costs and expenses amounted to R$90.8 million, 119.8% above the figure recorded in 4Q13, due
to the higher volume of spot market energy purchases as a result of the low GSF values in the quarter.
In 4Q14, costs and expenses were broken down as follows: personnel (6.9%), materials and outsourced services
(6.1%), CUSD/CUST/purchased energy (63.7%), and depreciation and others (23.3%). PMSO per MWh generated by
Light Energia’s plants in the quarter came to R$15.7/MWh, versus R$16.8/MWh in 4Q13.
In 2014, costs and expenses were broken down as follows: personnel (8.0%), materials and outsourced services
(6.0%), CUSD/CUST/ purchased energy (58.7%), and depreciation and others (27.3%). PMSO per MWh generated by
Light Energia’s plants came to R$14.6/MWh, versus R$15.4/MWh in 2013.
Commercialization and Services
Costs and expenses totaled R$205.3 million in 4Q14, 54.2% higher than in the fourth quarter of 2013, as a result of
the increase in the materials and outsourced services line, due to purchase of energy and carbon dioxide for co-
generation project, and the 49.4% upturn in costs from energy purchased for resale, due to the higher volume of
energy traded and purchase prices in 4Q14.
In 2014, costs and expenses increased by 42.7% over 2013, mainly due to the increase in energy purchased for sale.
Operating Costs and Expenses (R$ MN) 4Q14 4Q13 Var.% 2014 2013 Var.%
Personnel (6.3) (6.4) -1.8% (24.0) (23.7) 1.4%
Material and Outsourced Services (5.5) (4.8) 14.5% (18.3) (18.5) -1.5%
CUSD / CUST / Purchased Energy (57.8) (7.4) 682.2% (177.3) (34.4) 415.4%
Depreciation (13.7) (13.5) 1.3% (54.1) (55.4) -2.4%
Other Operacional/Revenues Expenses (0.3) - - (0.4) (0.3) 52.8%
Others (includes provisions) (7.2) (9.2) -21.8% (28.0) (32.1) -12.8%
Total (90.8) (41.3) 119.8% (302.0) (164.4) 83.7%
Operating Costs and Expenses (R$ MN) 4Q14 4Q13 Var.% 2014 2013 Var.%
Personnel (2.8) (2.2) 30.4% (9.8) (8.2) 19.6%
Material and Outsourced Services (13.4) (0.8) 1633.2% (30.3) (18.0) 68.0%
Purchased Energy (184.0) (123.2) 49.4% (764.3) (540.9) 41.3%
Depreciation (1.3) (0.0) 2687.5% (4.1) (0.2) 2234.2%
Other Operacional/Revenues Expenses (0.2) (5.7) -96.9% (7.2) (5.7) 25.3%
Others (includes provisions) (3.5) (1.2) 192.6% (5.3) (2.3) 127.1%
Total (205.3) (133.1) 54.2% (821.0) (575.4) 42.7%

24
3.3 EBITDA5
Consolidated
Consolidated EBITDA totaled R$933.9 million in 4Q14, 173.3% above the consolidated EBITDA reported in 4Q13. This
upturn was mainly driven by the distribution and generation segments, with respective increases of 221.0% and
63.7%. The EBITDA margin expanded from 20.1% in 4Q13 to 31.2% in 4Q14.
The 4Q14 EBITDA can be primarily explained by the booking of CVA in the distribution company’s revenue and the
equity income gain of R$143.2 million in the generation company, due to the dilution of Light Energia’s stake in
Renova Energia, from 21.9% to 15.9% of the total capital stock.
Adjusting the 4Q14 EBITDA (i) for the R$502.8 million CVA balance until September 30, 2014, and (ii) the equity
income gain of R$143.2 million, adjusted EBITDA would total R$288.0 million in 4Q14, a decrease of 5.5% in
comparison with the 4Q13 EBITDA of R$304.7 million, also adjusted for (i) CVA, and (ii) the recognition totaling
R$124.8 million related to the New Repositioning Value (VNR) in 2013.
5 EBITDA is not a recognized measure under BRGAAP or IFRS. It is used by the Company as an additional measure of performance of its operations, and it should not be considered
individually or as an alternative to net income or operating income, as a measure of operating performance, or as an indicator of liquidity. The EBITDA presented is calculated in accordance with CVM Instruction 527/2012 and represents net income +income and social contribution tax + net financial expenses + depreciation and amortization. The reconciliation
is shown on Exhibit II..
R$ MM 4Q14 4Q13 Var.% 2014 2013 Var.%
Reported EBITDA 933.9 341.0 173.9% 1,809.7 1,696.8 6.7%
CVA Adjustment (502.8) 87.8 - (334.2) (21.0) -
EBITDA Adjusted by CVA 431.1 428.8 0.5% 1,475.5 1,675.8 -12.0%
Equity Pikup Adjustment (143.2) - - (143.2) - -
VNR Adjustment - (124.8) - - (124.8) -
Adjusted EBITDA 288.0 304.7 -5.5% 1,332.4 1,551.1 -14.1%
Consolidated EBITDA (R$ MN) 4Q14 4Q13 Var.% 2014 2013 Var.%
Distribution 725.9 226.1 221.0% 1,250.2 1,237.7 1.0%
Generation 196.0 119.8 63.7% 491.3 444.1 10.6%
Commercialization 17.0 2.8 518.0% 82.1 26.3 212.3%
Others and eliminations (5.1) (6.9) -26.9% (13.9) (11.3) 23.4%
Total 933.9 341.7 173.3% 1,809.7 1,696.8 6.7%
EBITDA Margin (%) 31.2% 20.1% 11.2 p.p. 21.8% 25.7% -3.9 p.p.
Regulatory Assets and Liabilities - 87.8 - - (21.0) -
Adjusted EBITDA 933.9 429.5 117.4% 1,809.7 1,675.8 8.0%

25
Adjusting the 2014 EBITDA (i) for the R$334.2 million CVA balance until December 31, 2014, and (ii) the equity
income gain of R$143.2 million, adjusted EBITDA would total R$1332.4 million in 2014, a decrease of 14.1% in
comparison with the 2013 EBITDA of R$1.551,1 million, also adjusted for (i) CVA, and (ii) the recognition totaling
R$124.8 million related to the New Repositioning Value (VNR) in 2013.
This decrease in the EBITDA can be explained by the water crisis, which impacted the generation company, as well as
by the third tariff revision cycle, with a reduction in the distribution company’s regulatory WACC.
Distribution
The distribution company’s EBITDA totaled R$725.9 million in 4Q14, 221.0% up year-on-year, mainly due to the
booking of CVA in the net revenue.
In 2014, the distribution company’s EBITDA was R$1,250.2 million, moving up by 1.0% in relation to 2013, impacted
by the booking of CVA. The EBITDA margin stood at 21.8% in 2014, 3.9 p.p. down from 2013.

26
Adjusting the distribution company’s EBITDA for the R$502.8 million CVA balance until September 30, 2014, and the
R$334.2 million CVA balance until December 31, 2014, Light SESA’s EBITDA would come to R$223.2 million in 4Q14
and R$916.0 million in 2014, posting an increase of 18.0% in relation to the R$189.2 million recorded in 4Q13 and a
reduction of 16.1% in relation to the R$1,091.9 million recorded in 2013, adjusted for the CVA and the booking of
R$124.8 million referring to the New Positioning Value (VNR) in 2013. The upturn in the 4Q14 EBITDA can be
explained by the reduction in Light SESA’s costs and expenses from personnel, materials, outsourced services and
others (PMSO) in relation to 4Q13, while the downturn in the 2014 EBITDA can be chiefly explained by the third tariff
revision cycle, with a reduction in the regulatory WACC.
Generation
In 4Q14, Light Energia’s EBITDA totaled R$196.0 million, climbing by 63.7% from the same quarter in 2013, due to
the equity income gain of R$143.2 million from the dilution of Light Energia’s stake in Renova Energia. In 4Q14, the
EBITDA margin stood at 151.7%, 71.0 p.p. higher than in 4Q13.
When adjusted for the equity income gain from the dilution in Renova Energia, the generation company’s EBITDA
came to R$52.1 million in 4Q14, a decrease of 56.5% from 4Q13, primarily explained by the lower GSF values in the
period.
In 2014, EBITDA totaled R$491.3 million, 10.6% up on 2013, accompanied by an EBITDA margin of 81.7%, 2.2 p.p. up
in relation to 2013.
When adjusted for the equity income gain, the generation company’s EBITDA came to R$353.7 million in 2014, a
reduction of 20.4% over 2013, which can also be explained by the lower GSF values in the period.
Commercialization and Services
EBITDA from commercialization and services totaled R$17.0 million in 4Q14, a surge of 518.0% in relation to
4Q13, driven by the growth of 32.8% in energy sales volume and higher prices in 4Q14.
In 2014, EBITDA came to R$82.1 million, 212.3% higher than in 2013.
EBITDA margin stood at 7.7% in 4Q14, 5.7 p.p. up from 4Q13, while the 2014 EBITDA margin stood at 9.1%, 4.8 p.p.
above the margin recorded in 2013.
27
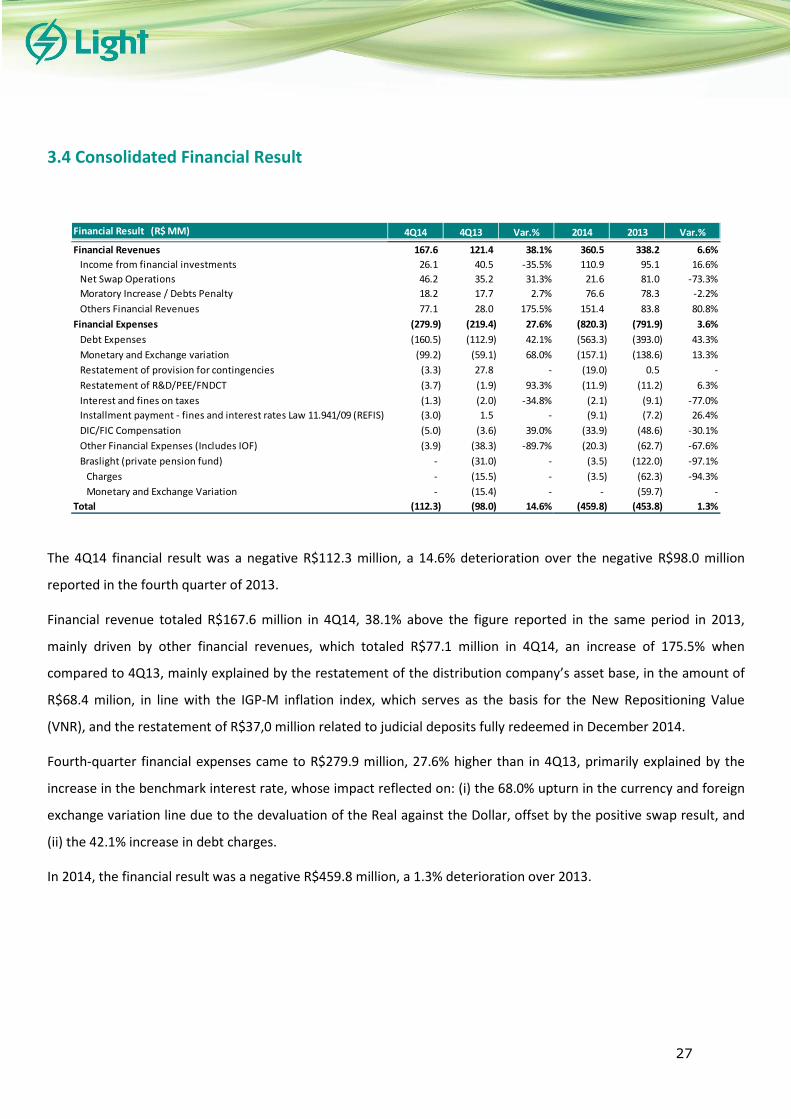
3.4 Consolidated Financial Result
The 4Q14 financial result was a negative R$112.3 million, a 14.6% deterioration over the negative R$98.0 million
reported in the fourth quarter of 2013.
Financial revenue totaled R$167.6 million in 4Q14, 38.1% above the figure reported in the same period in 2013,
mainly driven by other financial revenues, which totaled R$77.1 million in 4Q14, an increase of 175.5% when
compared to 4Q13, mainly explained by the restatement of the distribution company’s asset base, in the amount of
R$68.4 milion, in line with the IGP-M inflation index, which serves as the basis for the New Repositioning Value
(VNR), and the restatement of R$37,0 million related to judicial deposits fully redeemed in December 2014.
Fourth-quarter financial expenses came to R$279.9 million, 27.6% higher than in 4Q13, primarily explained by the
increase in the benchmark interest rate, whose impact reflected on: (i) the 68.0% upturn in the currency and foreign
exchange variation line due to the devaluation of the Real against the Dollar, offset by the positive swap result, and
(ii) the 42.1% increase in debt charges.
In 2014, the financial result was a negative R$459.8 million, a 1.3% deterioration over 2013.
Financial Result (R$ MM) 4Q14 4Q13 Var.% 2014 2013 Var.%
Financial Revenues 167.6 121.4 38.1% 360.5 338.2 6.6%
Income from financial investments 26.1 40.5 -35.5% 110.9 95.1 16.6%
Net Swap Operations 46.2 35.2 31.3% 21.6 81.0 -73.3%
Moratory Increase / Debts Penalty 18.2 17.7 2.7% 76.6 78.3 -2.2%
Others Financial Revenues 77.1 28.0 175.5% 151.4 83.8 80.8%
Financial Expenses (279.9) (219.4) 27.6% (820.3) (791.9) 3.6%
Debt Expenses (160.5) (112.9) 42.1% (563.3) (393.0) 43.3%
Monetary and Exchange variation (99.2) (59.1) 68.0% (157.1) (138.6) 13.3%
Restatement of provision for contingencies (3.3) 27.8 - (19.0) 0.5 -
Restatement of R&D/PEE/FNDCT (3.7) (1.9) 93.3% (11.9) (11.2) 6.3%
Interest and fines on taxes (1.3) (2.0) -34.8% (2.1) (9.1) -77.0%
Installment payment - fines and interest rates Law 11.941/09 (REFIS) (3.0) 1.5 - (9.1) (7.2) 26.4%
DIC/FIC Compensation (5.0) (3.6) 39.0% (33.9) (48.6) -30.1%
Other Financial Expenses (Includes IOF) (3.9) (38.3) -89.7% (20.3) (62.7) -67.6%
Braslight (private pension fund) - (31.0) - (3.5) (122.0) -97.1%
Charges - (15.5) - (3.5) (62.3) -94.3%
Monetary and Exchange Variation - (15.4) - - (59.7) -
Total (112.3) (98.0) 14.6% (459.8) (453.8) 1.3%
28
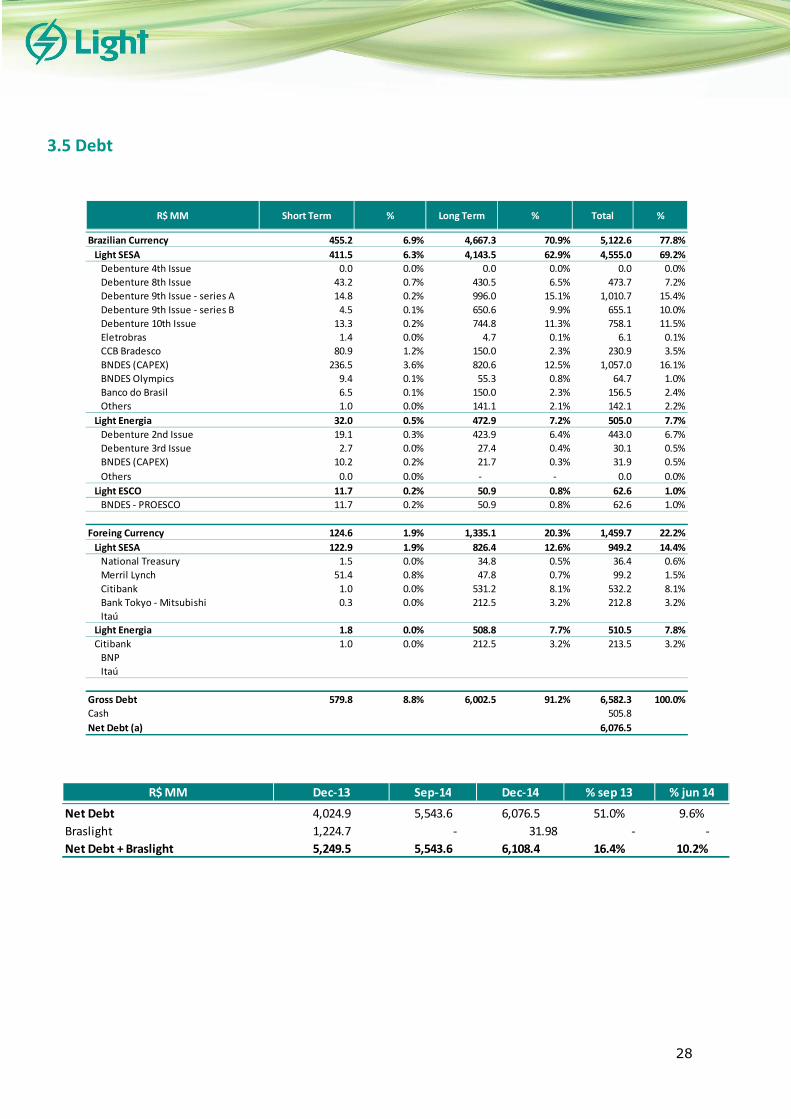
3.5 Debt
R$ MM Short Term % Long Term % Total %
Brazilian Currency 455.2 6.9% 4,667.3 70.9% 5,122.6 77.8%
Light SESA 411.5 6.3% 4,143.5 62.9% 4,555.0 69.2%
Debenture 4th Issue 0.0 0.0% 0.0 0.0% 0.0 0.0%
Debenture 8th Issue 43.2 0.7% 430.5 6.5% 473.7 7.2%
Debenture 9th Issue - series A 14.8 0.2% 996.0 15.1% 1,010.7 15.4%
Debenture 9th Issue - series B 4.5 0.1% 650.6 9.9% 655.1 10.0%
Debenture 10th Issue 13.3 0.2% 744.8 11.3% 758.1 11.5%
Eletrobras 1.4 0.0% 4.7 0.1% 6.1 0.1%
CCB Bradesco 80.9 1.2% 150.0 2.3% 230.9 3.5%
BNDES (CAPEX) 236.5 3.6% 820.6 12.5% 1,057.0 16.1%
BNDES Olympics 9.4 0.1% 55.3 0.8% 64.7 1.0%
Banco do Brasil 6.5 0.1% 150.0 2.3% 156.5 2.4%
Others 1.0 0.0% 141.1 2.1% 142.1 2.2%
Light Energia 32.0 0.5% 472.9 7.2% 505.0 7.7%
Debenture 2nd Issue 19.1 0.3% 423.9 6.4% 443.0 6.7%
Debenture 3rd Issue 2.7 0.0% 27.4 0.4% 30.1 0.5%
BNDES (CAPEX) 10.2 0.2% 21.7 0.3% 31.9 0.5%
Others 0.0 0.0% - - 0.0 0.0%
Light ESCO 11.7 0.2% 50.9 0.8% 62.6 1.0%
BNDES - PROESCO 11.7 0.2% 50.9 0.8% 62.6 1.0%
Foreing Currency 124.6 1.9% 1,335.1 20.3% 1,459.7 22.2%
Light SESA 122.9 1.9% 826.4 12.6% 949.2 14.4%
National Treasury 1.5 0.0% 34.8 0.5% 36.4 0.6%
Merril Lynch 51.4 0.8% 47.8 0.7% 99.2 1.5%
Citibank 1.0 0.0% 531.2 8.1% 532.2 8.1%
Bank Tokyo - Mitsubishi 0.3 0.0% 212.5 3.2% 212.8 3.2%
Itaú
Light Energia 1.8 0.0% 508.8 7.7% 510.5 7.8%
Citibank 1.0 0.0% 212.5 3.2% 213.5 3.2%
BNP
Itaú
Gross Debt 579.8 8.8% 6,002.5 91.2% 6,582.3 100.0%
Cash 505.8
Net Debt (a) 6,076.5
R$ MM Dec-13 Sep-14 Dec-14 % sep 13 % jun 14
Net Debt 4,024.9 5,543.6 6,076.5 51.0% 9.6%
Braslight 1,224.7 - 31.98 - -
Net Debt + Braslight 5,249.5 5,543.6 6,108.4 16.4% 10.2%
29
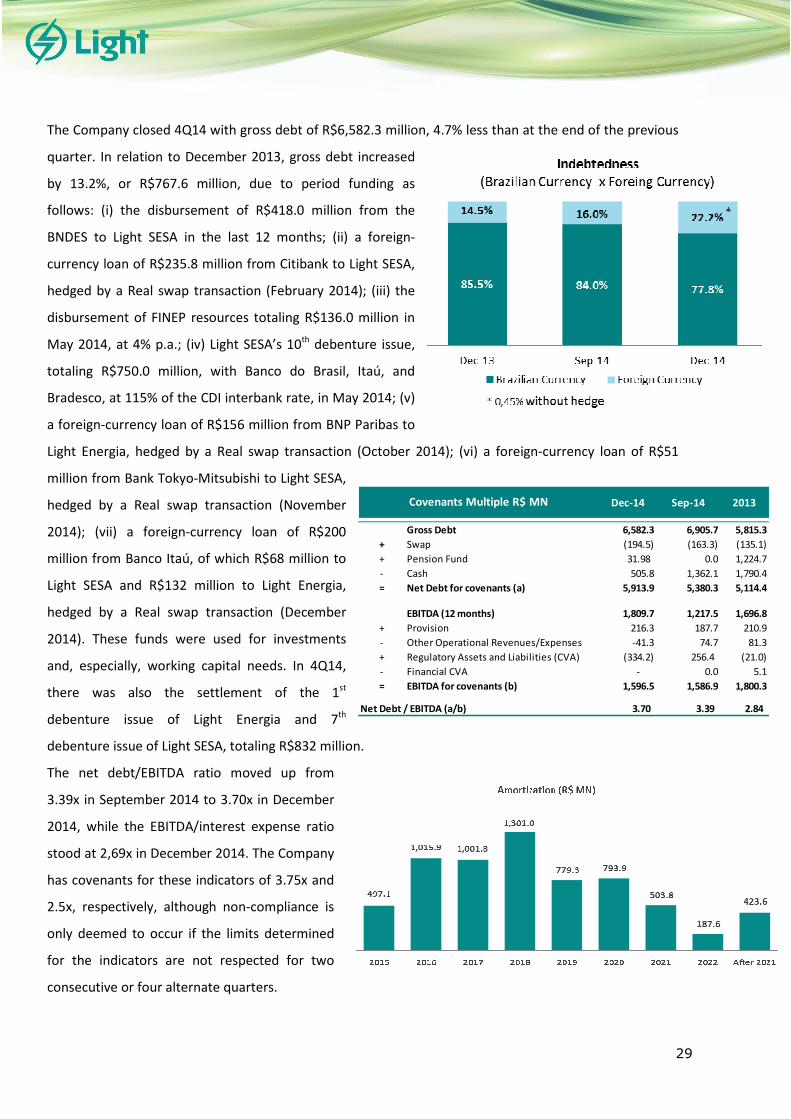
The Company closed 4Q14 with gross debt of R$6,582.3 million, 4.7% less than at the end of the previous
quarter. In relation to December 2013, gross debt increased
by 13.2%, or R$767.6 million, due to period funding as
follows: (i) the disbursement of R$418.0 million from the
BNDES to Light SESA in the last 12 months; (ii) a foreign-
currency loan of R$235.8 million from Citibank to Light SESA,
hedged by a Real swap transaction (February 2014); (iii) the
disbursement of FINEP resources totaling R$136.0 million in
May 2014, at 4% p.a.; (iv) Light SESA’s 10th debenture issue,
totaling R$750.0 million, with Banco do Brasil, Itaú, and
Bradesco, at 115% of the CDI interbank rate, in May 2014; (v)
a foreign-currency loan of R$156 million from BNP Paribas to
Light Energia, hedged by a Real swap transaction (October 2014); (vi) a foreign-currency loan of R$51
million from Bank Tokyo-Mitsubishi to Light SESA,
hedged by a Real swap transaction (November
2014); (vii) a foreign-currency loan of R$200
million from Banco Itaú, of which R$68 million to
Light SESA and R$132 million to Light Energia,
hedged by a Real swap transaction (December
2014). These funds were used for investments
and, especially, working capital needs. In 4Q14,
there was also the settlement of the 1st
debenture issue of Light Energia and 7th
debenture issue of Light SESA, totaling R$832 million.
The net debt/EBITDA ratio moved up from
3.39x in September 2014 to 3.70x in December
2014, while the EBITDA/interest expense ratio
stood at 2,69x in December 2014. The Company
has covenants for these indicators of 3.75x and
2.5x, respectively, although non-compliance is
only deemed to occur if the limits determined
for the indicators are not respected for two
consecutive or four alternate quarters.
Dec-14 Sep-14 2013
Gross Debt 6,582.3 6,905.7 5,815.3
+ Swap (194.5) (163.3) (135.1)
+ Pension Fund 31.98 0.0 1,224.7
- Cash 505.8 1,362.1 1,790.4
= Net Debt for covenants (a) 5,913.9 5,380.3 5,114.4
EBITDA (12 months) 1,809.7 1,217.5 1,696.8
+ Provision 216.3 187.7 210.9
- Other Operational Revenues/Expenses -41.3 74.7 81.3
+ Regulatory Assets and Liabilities (CVA) (334.2) 256.4 (21.0)
- Financial CVA - 0.0 5.1
= EBITDA for covenants (b) 1,596.5 1,586.9 1,800.3
3.70 3.39 2.84
Covenants Multiple R$ MN
Net Debt / EBITDA (a/b)
30
The Company’s debt has an average term to maturity of 4.4 years and the average cost of Real-
denominated debt was 11.2% p.a. At the close of 4Q14, 22.2% of total debt was denominated in foreign
currency, but, considering the FX hedge horizon, only 0.45% of this total was exposed to foreign currency
risk. Light’s FX hedge policy consists of protecting cash flow from foreign-currency-denominated debt
falling due within the next 24 months (principal and interest) through the use of non-cash swap
instruments with premier financial institutions. Funding via Central Bank Resolution 4131, from Merrill
Lynch, BNP, Citibank, Bank Tokyo-Mitsubishi and Itaú, was contracted with swaps for the entire term of
the debt.
31
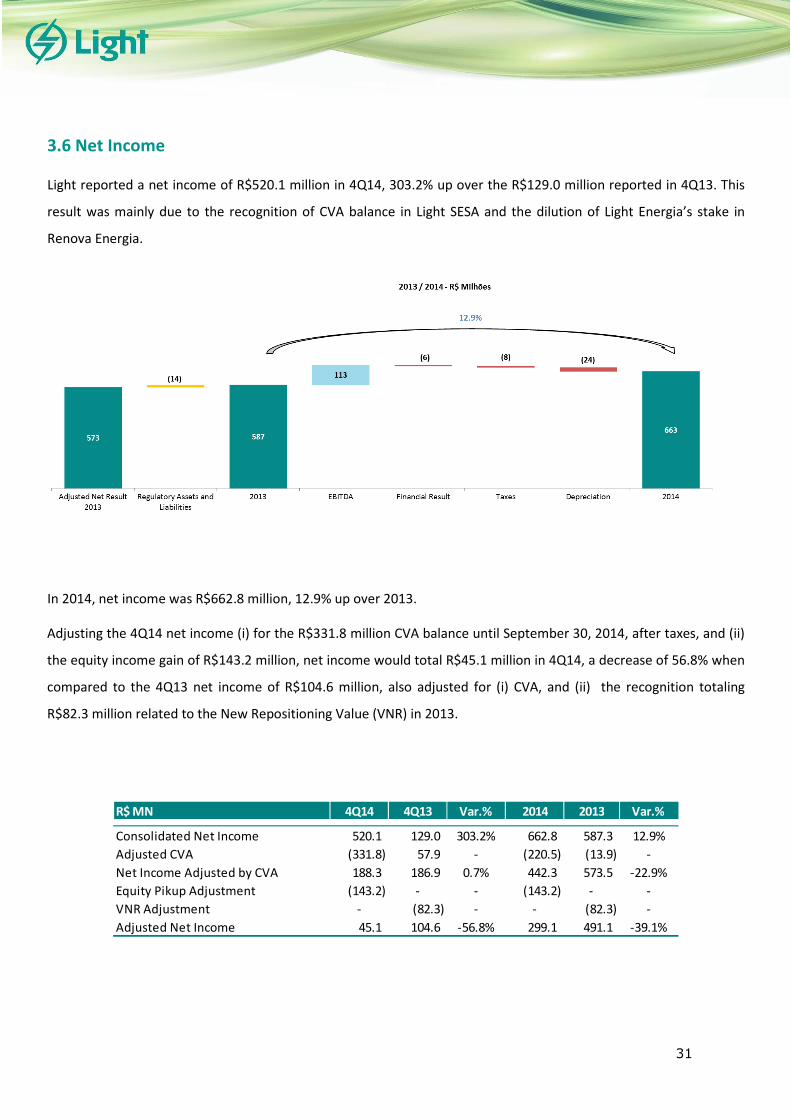
3.6 Net Income
Light reported a net income of R$520.1 million in 4Q14, 303.2% up over the R$129.0 million reported in 4Q13. This
result was mainly due to the recognition of CVA balance in Light SESA and the dilution of Light Energia’s stake in
Renova Energia.
In 2014, net income was R$662.8 million, 12.9% up over 2013.
Adjusting the 4Q14 net income (i) for the R$331.8 million CVA balance until September 30, 2014, after taxes, and (ii)
the equity income gain of R$143.2 million, net income would total R$45.1 million in 4Q14, a decrease of 56.8% when
compared to the 4Q13 net income of R$104.6 million, also adjusted for (i) CVA, and (ii) the recognition totaling
R$82.3 million related to the New Repositioning Value (VNR) in 2013.
R$ MN 4Q14 4Q13 Var.% 2014 2013 Var.%
Consolidated Net Income 520.1 129.0 303.2% 662.8 587.3 12.9%
Adjusted CVA (331.8) 57.9 - (220.5) (13.9) -
Net Income Adjusted by CVA 188.3 186.9 0.7% 442.3 573.5 -22.9%
Equity Pikup Adjustment (143.2) - - (143.2) - -
VNR Adjustment - (82.3) - - (82.3) -
Adjusted Net Income 45.1 104.6 -56.8% 299.1 491.1 -39.1%

32
Adjusting the 2014 net income (i) for the R$220.5 million CVA balance until December 31, 2014, after taxes, and (ii)
the equity income gain of R$143.2 million, net income would total R$299.1 million in 2014, a decrease of 39.1%
when compared to the 2013 net income of R$491.1 million, also adjusted for (i) CVA, and (ii) the recognition totaling
R$82.3 million related to the New Repositioning Value (VNR) in 2013.

33
3.7 Investments
In 2014, Light invested R$1,054.0 million, 24.7% more than in 2013.
The distribution segment absorbed the lion’s share of R$932.1 million (representing 88.4% of the total), 30.8% up on
2013. Of this total: (i) R$548.9 million went to the development and expansion of distribution networks in order to
keep pace with market growth, strengthen the network and improve quality, including R$71.9 million for specific
investments in the World Cup and the Olympic Games; (ii) R$359.7 million went to the energy loss project (network
protection, electronic meters, and fraud regularization).
Commercialization and energy efficiency investments fell by 74.1% over 2013 to R$15.8 million in 2014, due to the
completion of a major co-generation project in April 2014.
CAPEX (R$MN) 2014 Partic. % 2013 Partic. % Var %
Distribution 932.1 88.4% 712.6 84.3% 30.8%
Network reinforcement and expansion 548.9 58.9% 498.6 70.0% 10.1%
Losses 359.7 38.6% 192.1 27.0% 87.2%
Others 23.4 2.5% 21.8 3.1% 7.3%
Administration 57.0 5.4% 40.2 4.8% 41.7%
Commercial./ Energy Efficiency 15.8 1.5% 61.0 7.2% -74.1%
Generation 49.2 4.7% 31.3 3.7% 57.4%
Total 1054.0 100.0% 845.0 100.0% 24.7%

34
Generation Capacity Expansion Projects
One of the pillars of Light’s Strategic Plan is to increase the share of energy generation in its results. With this in
mind, the Company has announced several projects to boost installed generating capacity, which now totals 971
MW. With the incorporation of the scheduled expansion projects, the position on December 31 was as follows:
Existing Power Plants
Installed
Capacity
(MW)*
Assured
Energy
(MWm)*
Operation
Start Act Date
Concession /
Authorization
Expiration Date
Fontes Nova 132 104 1942 jun-96 2026
Nilo Peçanha 380 335 1953 jun-96 2026
Pereira Passos 100 51 1962 jun-96 2026
Ilha dos Pombos 187 115 1924 jun-96 2026
Santa Branca 56 32 1999 jun-96 2026
Elevatórias - (87) - - -
SHPP Paracambi¹ 13 10 2012 fev-01 2031
Renova² 104 47 2008 dez-03 2033
Total 971 607
New Projects
Installed
Capacity
(MW)*
Assured
Energy
(MWm)*
Operation
Start
SHPP Lajes³ 17 15 May-16
Belo Monte4 280 114 jul-05
Guanhães¹ 22 13 jul-05
Dores de Guanhães 7 4 -
Senhora do Pôrto 6 3 -
Jacaré 5 3 -
Fortuna II 5 3 -
Renova² 295 145
A-3 2011 35 17 jun-15
A-5 2012 3 2 jan-17
LER 2013 25 12 set-15
A-5 2013 56 29 May-18
A-5 2014 17 9 Jan-19
PPA 64 35 2015/2016
Free Market I 3 2 jan-16
Free Market II 16 8 jan-17
Free Market III 5 3 set-15
Free Market IV** 54 23 -
LER 2014 (Wind Power) 7 3 out-17
LER 2014 (Solar Power) 8 2 out-17
HYBRID-SOLAR 1 0 jan-16
Total 614 287
*Light's proportional Participation
¹ 51% Light
² 21.86% da Light / Considera que Renova detém 60% da Chipley, que por sua vez détem 51% da Brasil PCH
³Previsão de geração média de 15 MWm42.49% Light
2051
2052
2050
2031
**Including the exercise of the option by Cemig GT for an interest of up to 50% in the
2037
2050
2050
2051
2038
2048
2032
2032
2031
2047
2037
2051
2032
Current Generation Park
Generation Capacity Expansion Projects
Concession / Authorization
Expiration Date
2026
2045

35
The fourth quarter of 2014 was marked by the following events related to projects for expanding Light’s generating
capacity:
Lajes SHP
• This project comprises the construction of the Lajes SHP, with an installed generating capacity of 17 MW, in the
old powerhouse of the Fontes Velha power plant, which was decommissioned in 1989. A Special Purpose Entity
(SPE), called Lajes Energia S.A., a closely-held company and wholly-owned subsidiary of Light Energia S.A., was
created to implement, construct, operate, and maintain the SHP. The project will not involve substantial works
related to dams, but the construction of a water main from the valve house and adjustments to the power house. In
addition to generating electric power, the SHP will directly benefit water supply in the Metropolitan Region of Rio de
Janeiro by significantly improving the reliability and operational flexibility of the Lajes Complex.
The basic project has already been approved by Aneel. In June 2013, Aneel altered the public service exploration
regime to independent energy producer. As a result, the SHP obtained a 50% reduction in TUSD and TUST fees. The
E.P.C. (Engineering, Procurement, Construction) contract was signed in August 2014, triggering the beginning of the
field activities. Operational start-up is scheduled for the first half of 2016, given that the project has already been
granted an installation license.
Guanhães Energia
• In February 2012, Light Energia acquired a 51% interest on Guanhães Energia S.A. and Cemig acquired the other
49%. Guanhães is responsible for the implementation and exploration of the following SHPs: Dores de Guanhães (14
MW), Senhora do Porto (12 MW), Fortuna II (9 MW) and Jacaré (9 MW), all of which located on the Guanhães and
Corrente Grande Rivers, in the state of Minas Gerais, with a joint installed capacity of 44 MW.
The project has been impacted by geological and environmental problems which have postponed the start-up date.
Belo Monte Hydroelectric Power Plant
• In October 2011, Amazônia Energia, owned by Light (25.5%) and Cemig (74.5%), acquired 9.77% of Norte Energia,
the consortium responsible for building and operating the Belo Monte Hydroelectric Power Plant. Located on the
Xingu River in the state of Pará, Belo Monte is the largest 100% Brazilian hydro plant and the fourth largest in the
world. It has an installed capacity of 11,233 MW and assured energy of 4,571 MW, sufficient to supply around 18
million homes. The energy generated by the Pimental and Belo Monte sites will supply the National Integrated
System through a 2,100-kilometer transmission Line to be constructed between the states of Para and Minas Gerais.

36
The concession for the construction of this line is held by a consortium comprising Furnas, State Grid Brazil Holding
and Eletronorte.
In November, Norte Energia concluded the concreting of the columns at the Pimental site. At the Belo Monte site,
the efforts are currently focused on the civil works required for the descent of the turbines’ pre-distributor.
In December, the National Water Agency (ANA) issued the Resolution 2,046 allowing the filling of the reservoir in any
month of 2015, provided that the recommendations are observed, an important landmark for the beginning of
generation at the Complementary Power House in November 2015. By December 2014, 70% of the civil works had
been concluded.
Additionally, with respect to the reports in the press in late 2014 pointing to a potential delay in the plant’s entry into
operation, Norte Energia released two official press releases stating that:
i. The generation in the Main Powerhouse of the power plant and Belo Monte, responsible for 97% of all of the
energy from the hydroelectric power plant, will begin in March 2016, which is the date set in the concession
contract;
ii. The Complementary Powerhouse (233MW), at the Pimental site, responsible for 3% of the power generation of
the Belo Monte Hydroelectric Power Plant, will begin operating in November 2015;
iii. The Company is taking and will take all reasonable steps to not be burdened by acts outside of its governance, as
they are a matter of law, which the administration cannot forgo.
iv. Independent of the request made to ANEEL to consider the facts to be without responsibility, Norte Energia has
worked tirelessly to minimize the impact of third parties on the scheduled work, in order to minimize any adverse
effects for the country and its shareholders.
Renova Energia (“Renova”)
• In July 2014, the wind farms which won Energy Reserve Auction 2009 (LER 2009), with 294.4 MW of installed
capacity, began commercial operations. Since then, their energy output has been booked in accordance with the
provisions set forth in the commercial contract entered into between Renova and the Electric Energy
Commercialization Chamber (CCEE). It is worth emphasizing that, pursuant to the contract, since the wind farms had
been ready in June 2012, they had already received the revenue from the amount of energy sold at the auction.
In September 2014, the 1st issue of non-share-convertible debentures, with security interest and an additional
personal guarantee, in two series, for public distribution with restricted placement efforts, by Renova’s indirect
subsidiary, Renova Wind Participações SA, totaling R$146.0 million, was approved. These debentures will
complement long-term financing and will be issued as infrastructure debentures, since the projects were prioritized
37
by the decrees published by the Ministry of Mines and Energy (MME). The funds will be allocated to the Alto Sertão II
Complex, comprising LER 2010 LEN and A-3 2011, totaling 386.1 MW of installed capacity.
On October 27, 2014, Renova’s Board of Directors held a meeting to approve Renova’s partial capital increase
totaling one billion, five hundred and fifty million, two hundred and sixty-four thousand, nine hundred and eighty-
three reais and nineteen centavos (R$1,550,264,983.19) through the issue of eighty-seven million, one hundred and
ninety-six thousand, nine hundred and one (87,196,901) non-par registered common shares, at an issue price of
R$17.7789 per share. As a result, Light Energia’s interest in Renova was reduced from 21.9% to 15.9% of the total
capital stock and from 32.2% to 21.2% of the total common stock, with all shares in the controlling block being
maintained.
On October 31, 2014, Renova Energia, a subsidiary of Light Energia S.A., traded at the 2014 Reserve Energy Auction
(“LER 2014”) 150.4 MW of installed capacity, corresponding to average 42.7 MW wind and solar energy. The
agreements will have 20-year duration, and energy will start to be supplied in October 2017. 43.5 MW of installed
capacity were traded, with 20.9 MW average wind energy to be generated by three wind parks, located in the state
of Bahia, by the average amount of R$138.90/MWh (reference date of October 2014). In addition, 106.9 MW of
installed capacity were traded, with 21.8 MW average solar energy to be generated by four solar parks, also located
in the state of Bahia, by the average amount of R$220.30/MWh (reference date of October 2014).
38
4. Cash Flow
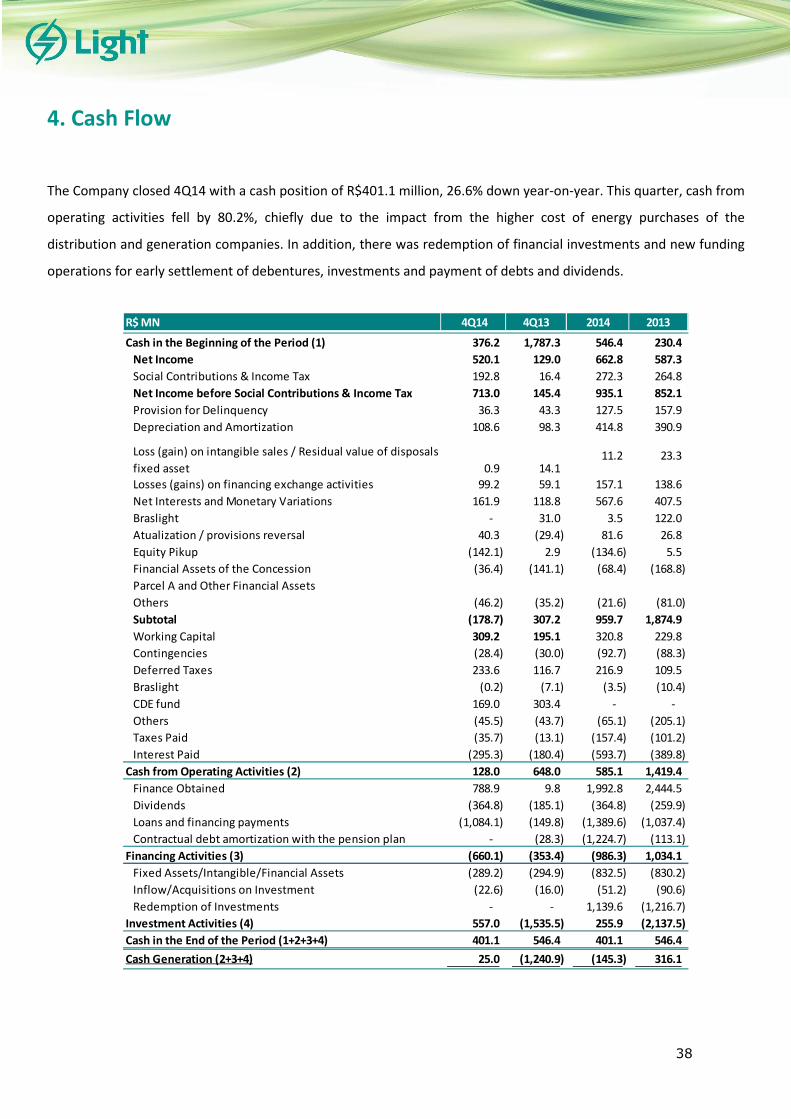
The Company closed 4Q14 with a cash position of R$401.1 million, 26.6% down year-on-year. This quarter, cash from
operating activities fell by 80.2%, chiefly due to the impact from the higher cost of energy purchases of the
distribution and generation companies. In addition, there was redemption of financial investments and new funding
operations for early settlement of debentures, investments and payment of debts and dividends.
R$ MN 4Q14 4Q13 2014 2013
Cash in the Beginning of the Period (1) 376.2 1,787.3 546.4 230.4
Net Income 520.1 129.0 662.8 587.3
Social Contributions & Income Tax 192.8 16.4 272.3 264.8
Net Income before Social Contributions & Income Tax 713.0 145.4 935.1 852.1
Provision for Delinquency 36.3 43.3 127.5 157.9
Depreciation and Amortization 108.6 98.3 414.8 390.9
Loss (gain) on intangible sales / Residual value of disposals
fixed asset 0.9 14.1 11.2 23.3
Losses (gains) on financing exchange activities 99.2 59.1 157.1 138.6
Net Interests and Monetary Variations 161.9 118.8 567.6 407.5
Braslight - 31.0 3.5 122.0
Atualization / provisions reversal 40.3 (29.4) 81.6 26.8
Equity Pikup (142.1) 2.9 (134.6) 5.5
Financial Assets of the Concession (36.4) (141.1) (68.4) (168.8)
Parcel A and Other Financial Assets
Others (46.2) (35.2) (21.6) (81.0)
Subtotal (178.7) 307.2 959.7 1,874.9
Working Capital 309.2 195.1 320.8 229.8
Contingencies (28.4) (30.0) (92.7) (88.3)
Deferred Taxes 233.6 116.7 216.9 109.5
Braslight (0.2) (7.1) (3.5) (10.4)
CDE fund 169.0 303.4 - -
Others (45.5) (43.7) (65.1) (205.1)
Taxes Paid (35.7) (13.1) (157.4) (101.2)
Interest Paid (295.3) (180.4) (593.7) (389.8)
Cash from Operating Activities (2) 128.0 648.0 585.1 1,419.4
Finance Obtained 788.9 9.8 1,992.8 2,444.5
Dividends (364.8) (185.1) (364.8) (259.9)
Loans and financing payments (1,084.1) (149.8) (1,389.6) (1,037.4)
Contractual debt amortization with the pension plan - (28.3) (1,224.7) (113.1)
Financing Activities (3) (660.1) (353.4) (986.3) 1,034.1
Fixed Assets/Intangible/Financial Assets (289.2) (294.9) (832.5) (830.2)
Inflow/Acquisitions on Investment (22.6) (16.0) (51.2) (90.6)
Redemption of Investments - - 1,139.6 (1,216.7)
Investment Activities (4) 557.0 (1,535.5) 255.9 (2,137.5)
Cash in the End of the Period (1+2+3+4) 401.1 546.4 401.1 546.4
Cash Generation (2+3+4) 25.0 (1,240.9) (145.3) 316.1
39
5. Corporate Governance
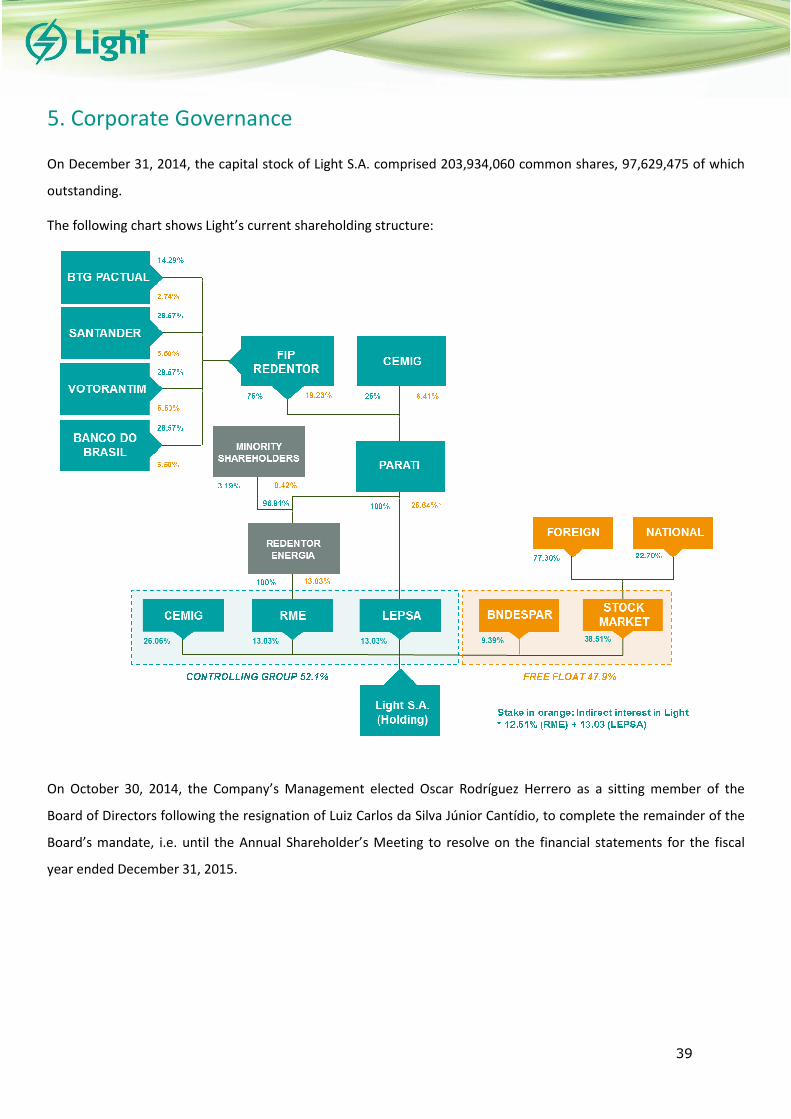
On December 31, 2014, the capital stock of Light S.A. comprised 203,934,060 common shares, 97,629,475 of which
outstanding.
The following chart shows Light’s current shareholding structure:
On October 30, 2014, the Company’s Management elected Oscar Rodríguez Herrero as a sitting member of the
Board of Directors following the resignation of Luiz Carlos da Silva Júnior Cantídio, to complete the remainder of the
Board’s mandate, i.e. until the Annual Shareholder’s Meeting to resolve on the financial statements for the fiscal
year ended December 31, 2015.

40
6. Capital Markets
Light’s shares have been listed in the BM&FBovespa’s Novo Mercado trading segment since July 2005, therefore
adhering to best corporate governance practices and the principles of transparency and equity, in addition to
granting special rights to minority shareholders. Light S.A.’s shares are included in the following indices: Ibovespa,
IGC (Corporate Governance Index), IEE (Electric Power Index), IBrX (Brazil Index), ISE (Corporate Sustainability Index),
ITAG (Special Tag Along Stock Index) and IDIV (Dividend Index). They are also traded on the U.S. over-the-counter
(OTC) market as Level 1 ADRs under the ticker LGSXY.
At the end of December 2014, Light S.A.’s shares (LIGT3) were priced at R$17.02. The Company’s market cap (no. of
shares x share price) closed the quarter at approximately R$3,471 million.
On November 26, 2014, Light S.A. was included, for the eighth consecutive year, in the portfolio of the Corporate
Sustainability Index (ISE) of BM&FBovespa.
The charts below give a breakdown of the Company’s free float in December 2014.
Daily Average 4Q14 4Q13 2014 2013
Number of shares traded (Thousand) 678 830 828 909
Number of Transactions 3,548 2,989 3,456 3,168
Traded Volume (R$ Million) 13.4 16.8 16.3 17.1
Quotation per shares: (Closing)* R$ 17.02 R$ 20.09 R$ 17.02 R$ 20.09
Share Valuing -17.7% 19.8% -15.3% 4.0%
IEE Valuing -1.6% -2.9% 3.5% -8.8%
Ibovespa Valuing -7.6% -1.6% -2.9% -15.5%
*Ajusted by earnings.
BM&F BOVESPA (spot market) - LIGT3

41
The chart below shows the performance of Light’s stock from December 30, 2013 to March 5, 2015.

42
Dividends
On December 17, 2014, the dividends approved at the Annual Shareholders’ Meeting held on April 24, 2014 were
paid, in the amount of three hundred sixty-four million, eight hundred thirty-eight thousand, thirty-three reais and
thirty-four centavos (R$364,838,033.34), with thirty-two million, eighteen thousand, seven hundred ninety-three
reais and fifty-three centavos (R$32,018,793.53) corresponding to the mandatory minimum dividends, and three
hundred thirty-two million, eight hundred nineteen thousand, two hundred thirty-nine reais and eighty-one centavos
(R$332,819,239.81) related to net income for fiscal year 2013. The net amount per share is R$1.789, without the
retention of withholding tax, pursuant to Article 10 of Law 9249/95. Shares have been traded ex-dividends as of April
25, 2014.
On March 6, 2015, the Board of Directors approved the proposal to distribute R$157,422,432.59, R$0.7719 per
share, in dividends, related to the results from the fiscal year ended December 31, 2014. This amount represents a
dividend yield of 5,8% and corresponds to a payout equivalent to the mandatory minimum of 25% of the net income
for the year adjusted for the legal reserve. In accordance with the Company’s Board of Directors criterion, such
distribution is consistent with the lack of predictability of the hydrological situation and the current condition of the
Brazilian electric sector. The proposal will be submitted for approval by the Annual Shareholders’ Meeting.
Dividends paid, dividend yield and payout

43
7. Recent Events
� On February 5, 2015, the Extraordinary Shareholders’ Meeting and the Board of Directors’ Meeting of the
Company resolved on the election of members for the Board of Directors and Board of Executive Officers of Light
S.A., which are now composed as follows:
Board of Directors
Sitting members Alternate members
Nelson José Hubner Moreira Samy Kopit Moscovitch
Giles Carriconde Azevedo César Vaz de Melo Fernandes
Fernando Henrique Schüffner Neto Fabiano Maia Pereira
Marcello Lignani Siqueira Eduardo Lima Andrade Ferreira
Marco Antônio de Rezende Teixeira Rogério Sobreira Bezerra
Ana Marta Horta Veloso José Augusto Gomes Campos
Fabiano Macanhan Fontes Carlos Antonio Decezaro
Oscar Rodríguez Herrero Marcelo Pedreira Oliveira
Guilherme Narciso de Lacerda Jálisson Lage Maciel
Silvio Artur Meira Starling Eduardo Maculan Vincentini
Carlos Alberto da Cruz Magno dos Santos Filho
Board of Executive Officers
Paulo Roberto Ribeiro Pinto Chief Executive Officer
João Batista Zolini Carneiro CFO and Investor Relations Officer
Andreia Ribeiro Junqueira e Souza Human Resources Officer
Ailton Fernando Dias Corporate Management Officer
Luis Fernando de Almeida Guimarães Energy Officer
Cláudio Bernardo Guimarães de Moraes Business Development Officer
Ricardo Cesar Costa Rocha Distribution Officer
Fernando Antônio Fagundes Reis Legal Office
Luiz Antônio Rodrigues Elias Communication Officer
� At a public meeting held on February 27, the Brazilian Electricity Regulatory Agency (Aneel) approved the
extraordinary average tariff increase of 22.48%, for the subsidiary Light SESA, in force as of March 2, 2015. It is
worth mentioning that the residential consumers will notice a lower than the average increase, of 21.06%. The
Extraordinary Tariff Revision (“RTE”) is envisaged in the distributors’ concession agreements, allowing Aneel to
review their tariffs when there is a financial imbalance in the agreements resulting from changes in the
concession’s non-manageable costs, such as charges and energy purchase costs. The items taken into
consideration for the extraordinary readjustment of 22.48% were as follows: (i) new CDE Quotas (18.19%), and (ii)
Itaipu Tariff and other Energy Contracts (4.29%).
� At the Board of Directors’ Meeting held on March 6, 2014, the Annual Shareholder’ Meeting was called, to be
held on April 10, 2015, to resolve on the following matters: (i) to take the Management’s accounts, to examine,
discuss and vote on the financial statements referring to the fiscal year ended December 31, 2014; (ii) to resolve
on the allocation of net income for fiscal year 2014; (iii) to elect and install the Fiscal Council’s members; (iv) to

44
establish the overall annual compensation for the Management and Fiscal Council; and (v) the election of
members for the Board of Directors.

45
8. Disclosure Program
Forward-looking statements
The information on the Company’s operations and its Management’s expectations regarding its future performance has not been
reviewed by the independent auditors.
Statements about future events are subject to risks and uncertainties. These statements are based on beliefs and assumptions of
our Management, and on information currently available to the Company. Statements about future events include information
about our intentions, beliefs or current expectations, as well as of the Company's Board of Directors and Officers. Exceptions
related to statements and information about the future also include information about operating results, likely or presumed, as
well as statements that are preceded by, followed by, or including words such as "believes", "might", "will", "continues",
"expects", "estimates", "intends", "anticipates", or similar expressions. Statements and information about the future are not a
guarantee of performance. They involve risks, uncertainties and assumptions because they refer to future events, thus depending
on circumstances that might or might not occur. Future results and creation of value to shareholders might significantly differ
Teleconference
Brazil: +55 (11) 2188 0155
USA: +1 (646) 843-6054
Other countries: +1 866 890 2584
Access code: Light
Schedule
03/09/2015, Monday, at 3:00 p.m. (Brasília Time) and at 2:00 p.m.
(Eastern Time), with simultaneous translation to English
Access conditions:
Webcast: link on site www.light.com.br/ri (portuguese and english)
Conference Call - Dial number:
Contact e-mail Phone
Gustavo Werneck Souza [email protected] +55 21 2211-2560
Mariana da Silva Rocha [email protected] +55 21 2211-2814
Bruna Dutra Alvarenga [email protected] +55 21 2211-2660
Leonardo Dias Wanderley [email protected] +55 21 2211-28280 0 0
IR Team

46
from the ones expressed or suggested by forward-looking statements. Many of the factors that will determine these results and
values are beyond LIGHT S.A.'s control or forecast capacity.
EXHIBIT I
Selected Financial Information - R$ million
LIGHT SESA 4Q14 4Q13 Var. % 2014 2013 Var. %
Net Operating Revenue 3,078.7 1,886.8 63.2% 8,258.3 6,716.8 23.0%
Operating Expense (2,422.3) (1,847.6) 31.1% (7,323.9) (5,901.7) 24.1%
Other Operating Revenues/Expenses (24.0) 102.2 - (40.7) 87.3 -
Operating Result 632.4 141.4 347.2% 893.6 902.4 -1.0%
EBITDA 725.9 226.1 221.0% 1,250.2 1,237.7 1.0%
Financial Result (77.9) (66.1) 17.8% (367.4) (361.5) 1.6%
Result before taxes and interest 554.5 75.3 636.8% 526.2 541.0 -2.7%
Net Income 367.0 85.0 331.9% 349.1 386.4 -9.7%
EBITDA Margin* 26.2% 14.9% 11.3 p.p. 45.1% 21.0% 24.1 p.p.
* Does not consider Construction Revenue
LIGHT ENERGIA 4Q14 4Q13 Var. % 2014 2013 Var. %
Net Operating Revenue 129.2 148.5 -13.0% 601.6 558.7 7.7%
Operating Expense (90.5) (41.3) 119.1% (301.6) (164.1) 83.8%
Other Operating Revenues/Expenses (0.3) - - (0.4) (0.3) 52.8%
Operating Result 38.4 107.2 -64.1% 299.5 394.3 -24.0%
Equity Pickup 143.9 (1.0) - 137.6 (5.6) -
EBITDA 196.0 119.8 63.7% 491.3 444.1 10.6%
Financial Result (36.9) (22.7) 63.0% (105.4) (89.0) 18.5%
Result before taxes and interest 145.3 83.6 73.9% 331.8 299.7 10.7%
Net Income 145.4 57.6 152.3% 267.7 199.2 34.4%
EBITDA Margin 151.7% 80.6% 71.0 p.p. 81.7% 79.5% 2.2 p.p.
COMMERCIALIZATION AND SERVICES 4Q14 4Q13 Var. % 2014 2013 Var. %
Net Operating Revenue 221.1 135.9 62.6% 899.2 601.7 49.5%
Operating Expense (205.1) (127.4) 61.0% (813.8) (569.7) 42.8%
Other Operating Revenues/Expenses (0.2) (5.7) -96.9% (7.2) (5.7) 25.3%
Operating Result 15.8 2.8 465.5% 78.2 26.2 198.2%
Equity Pickup (0.1) (0.1) 23.3% (0.1) (0.1) 39.7%
EBITDA 17.0 2.8 518.0% 82.1 26.3 212.3%
Financial Result 2.0 1.8 15.0% 12.0 6.4 87.5%
Result before taxes and interest 17.7 4.5 296.7% 90.0 32.5 177.0%
Net Income 11.7 4.4 169.3% 58.6 23.2 152.9%
EBITDA Margin 7.7% 2.0% 5.7 p.p. 9.1% 4.4% 4.8 p.p.

47
EXHIBIT II
Selected Consolidated Financial Information6 - R$ million
(*) EBITDA is not a recognized measure under BRGAAP or IFRS. It is used by the Company as an additional measure of performance of its operations, and it should not considered individually or as an alternative to net income or operating income, as a measure of operating performance, or as an indicator of liquidity. The table below presents the reconciliation in accordance with CVM Instruction 527/2012:
4Q14 4Q13 Var.% 2014 2013 Var.%
A Net Operating Revenue 520,1 129,0 303,2% 662,8 587,3 12,9%
B Social Contributions & Income Tax (26,7) (18,5) 44,5% (120,3) (122,0) -1,4%
C Deferred Income Tax (166,1) 2,1 - (152,0) (142,8) 6,5%
A - (B + C) EBIT 713,0 145,4 390,4% 935,1 852,1 9,7%
D Depreciation (108,6) (98,3) 10,4% (414,8) (390,9) 6,1%
E Financial Expenses Revenue (112,3) (98,0) 14,6% (459,7) (453,8) 1,3%
(A) + (B) + (C ) + (D) + (E) EBITDA 933,9 341,7 173,3% 1.809,7 1.696,8 6,7%
EBITDA
R$ MN
6 The consolidated financial statements include Light S.A. and its subsidiaries and affiliates. In these financial
statements, the balances of receivables and payables, revenues and expenses between the companies were eliminated.
Consolidated - R$ MN 4Q14 4Q13 Var. % 2,014 2,013 Var. %
NET OPERATING REVENUE 3,294.7 2,066.0 59.5% 9,230.4 7,422.3 24.4%
OPERATING EXPENSE (2,611.6) (1,819.7) 43.5% (7,970.1) (6,110.9) 30.4%
PMSO (235.8) (248.2) -5.0% (902.2) (921.8) -2.1%
Personnel (68.7) (92.8) -26.0% (302.1) (323.8) -6.7%
Material (8.1) (3.5) 131.1% (27.0) (18.3) 47.9%
Outsourced Services (130.8) (124.6) 5.0% (451.8) (456.2) -1.0%
Others (28.2) (27.3) 3.3% (121.3) (123.6) -1.9%
Purchased Energy (1,850.2) (1,146.9) 61.3% (5,448.0) (3,848.3) 41.6%
Depreciation (108.6) (98.3) 10.4% (414.8) (390.9) 6.1%
Provisions (86.3) (57.7) 49.6% (216.3) (210.9) 2.5%
Construction Revenue (306.1) (365.0) -16.1% (940.5) (820.3) 14.7%
Other Operating Revenuess/Expenses (24.5) 96.4 - (48.3) 81.3 -
OPERATING RESULT 683.2 246.3 177.4% 1,260.3 1,311.3 -3.9%
EQUITY PICKUP 142.1 (2.9) - 134.6 (5.5) -
EBITDA (1) 933.9 341.7 173.3% 1,809.7 1,696.8 6.7%
FINANCIAL RESULT (112.3) (98.0) 14.6% (459.7) (453.8) 1.3%
Financial Income 192.5 121.4 58.6% 442.9 338.2 31.0%
Financial Expenses (304.9) (219.4) 39.0% (902.7) (791.9) 14.0%
RESULT BEFORE TAXES AND INTEREST 713.0 145.4 390.4% 935.1 852.1 9.7%
SOCIAL CONTRIBUTIONS & INCOME TAX (26.7) (18.5) 44.5% (120.3) (122.0) -1.4%
DEFERRED INCOME TAX (166.1) 2.1 - (152.0) (142.8) 6.5%
NET INCOME 520.1 129.0 303.2% 662.8 587.3 12.9%

48
EXHIBIT III
Consolidated Balance Sheet - R$ million
ASSETS 12/30/2014 12/31/2013
Current 2,955.3 3,495.8
Cash & Cash Equivalents 401.1 546.4
Marketable securities 104.7 1,244.0
Receivable Accounts 1,380.7 1,223.4
Inventories 34.0 29.7
Recoverable Taxes 120.2 161.0
Prepaid Expenses 14.9 15.8
Parcel A and Other Financial Assets 577.5 -
Other Current Assets 322.2 275.5
Non-current 10,678.9 9,506.5
Receivable Accounts 211.5 209.4
Deferred Taxes 473.8 622.8
Parcel A and Other Financial Assets 536.7 -
Concession financial assets 2,446.4 1,926.2
Others Non-current Assets 534.8 464.9
Investiments 826.6 642.2
Fixed Assets 1,705.1 1,678.7
Intangible 3,943.9 3,962.1 0.0 -
Total Assets 13,634.2 13,002.2 0 0
LIABILITIES 12/30/2014 12/31/20131/0/1900 0
Current 2,924.8 3,318.5
Suppliers 1,560.4 907.3
Fiscal obligations 289.1 198.6
Loans and Financing 482.2 591.5
Debentures 97.7 51.0
Others Obligations 225.2 1,408.6
Provisions 112.8 129.5
Dividends and interest on equity to be paid 157.4 32.0 0 -
Non-current 7,080.8 6,206.6
Loans and Financing 2,729.3 1,823.5
Debentures 3,273.1 3,349.3
Others Obligations 342.9 263.7
Deferred Taxes 222.7 226.4
Provisions 512.8 543.7 0 -
Shareholders' Equity 3,628.6 3,477.1
Realized Joint Stock 2,225.8 2,225.8
Profit Reserves 1,090.7 565.6
Additional Proposed Dividend - 332.8
Asset Valuation Adjustments 409.8 429.5
Other comprehensive income (97.7) (76.6)
Accumulated Profit/Loss of Exercise - - 0 -
Total Liabilities 13,634.2 13,002.2

49
EXHIBIT IV
Regulatory Assets and Liabilities
On December 10, 2014, a fourth amendment was signed to the concession contract for distribution by the subsidiary Light SESA, which ensured the right and duty that the remaining balances of any insufficiency or reimbursement of the tariff at the end of the concession will be added or deducted from the compensation amount, which allowed for the recognition of the balances of these regulatory assets and liabilities.
R$ Million Dec-14 Sep-14 Jun-14 Mar-14 dec/13 sep/13 Jun-13 Mar-13 dec/12
TOTAL ASSET 1316.7 619.7 501.7 361.4 428.7 627.6 653.0 500.6 365.7
TOTAL LIABILITIES (296.9) (116.9) (65.4) (45.5) (94.5) (381.2) (77.4) (44.3) (10.6)
TOTAL DIFFERENCE 1,019.8 502.8 436.2 315.9 334.2 246.4 575.6 456.3 355.2
Net difference (quarter) 517.1 66.5 120.3 (18.3) 87.8 (329.2) 119.3 101.2 138.0
Net difference (YTD) 685.7 168.6 102.1 (18.3) (21.0) (108.8) 220.4 101.2 330.4
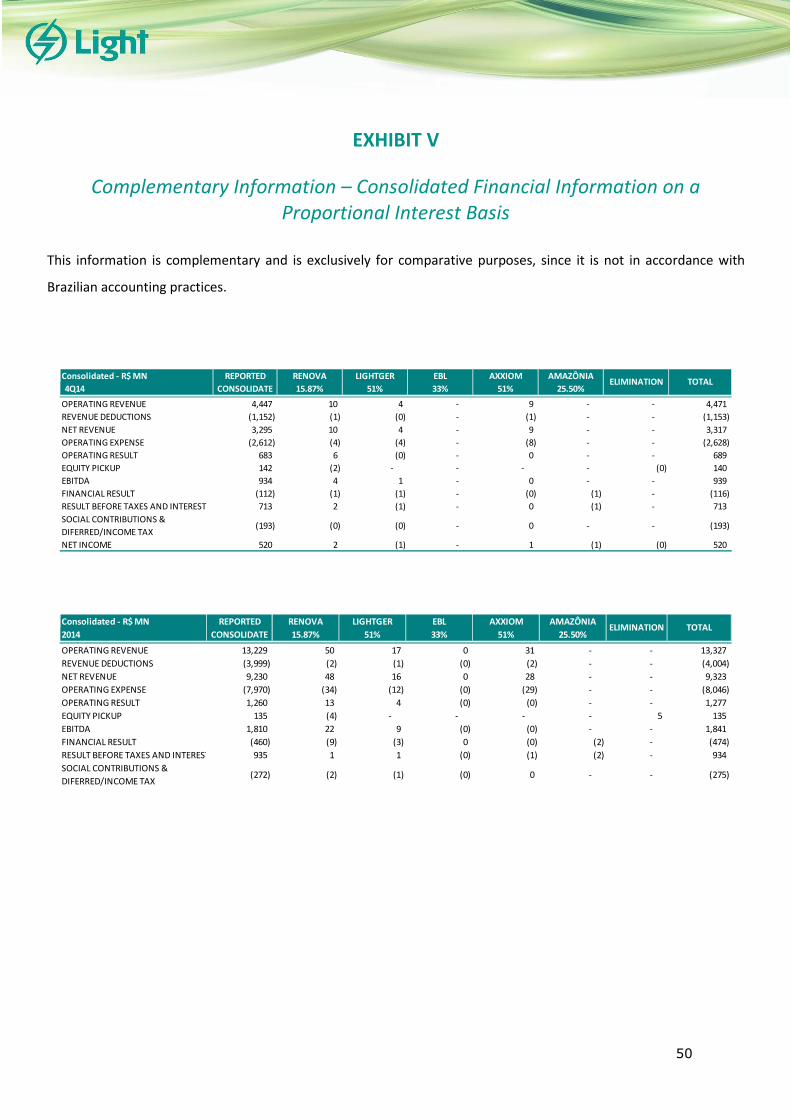
50
EXHIBIT V
Complementary Information – Consolidated Financial Information on a
Proportional Interest Basis
This information is complementary and is exclusively for comparative purposes, since it is not in accordance with
Brazilian accounting practices.
Consolidated - R$ MN RENOVA LIGHTGER EBL AXXIOM AMAZÔNIA
4Q14 15.87% 51% 33% 51% 25.50%
OPERATING REVENUE 4,447 10 4 - 9 - - 4,471
REVENUE DEDUCTIONS (1,152) (1) (0) - (1) - - (1,153)
NET REVENUE 3,295 10 4 - 9 - - 3,317
OPERATING EXPENSE (2,612) (4) (4) - (8) - - (2,628)
OPERATING RESULT 683 6 (0) - 0 - - 689
EQUITY PICKUP 142 (2) - - - - (0) 140
EBITDA 934 4 1 - 0 - - 939
FINANCIAL RESULT (112) (1) (1) - (0) (1) - (116)
RESULT BEFORE TAXES AND INTEREST 713 2 (1) - 0 (1) - 713
SOCIAL CONTRIBUTIONS &
DIFERRED/INCOME TAX(193) (0) (0) - 0 - - (193)
NET INCOME 520 2 (1) - 1 (1) (0) 520
REPORTED
CONSOLIDATEELIMINATION TOTAL
Consolidated - R$ MN RENOVA LIGHTGER EBL AXXIOM AMAZÔNIA
2014 15.87% 51% 33% 51% 25.50%
OPERATING REVENUE 13,229 50 17 0 31 - - 13,327
REVENUE DEDUCTIONS (3,999) (2) (1) (0) (2) - - (4,004)
NET REVENUE 9,230 48 16 0 28 - - 9,323
OPERATING EXPENSE (7,970) (34) (12) (0) (29) - - (8,046)
OPERATING RESULT 1,260 13 4 (0) (0) - - 1,277
EQUITY PICKUP 135 (4) - - - - 5 135
EBITDA 1,810 22 9 (0) (0) - - 1,841
FINANCIAL RESULT (460) (9) (3) 0 (0) (2) - (474)
RESULT BEFORE TAXES AND INTEREST 935 1 1 (0) (1) (2) - 934
SOCIAL CONTRIBUTIONS &
DIFERRED/INCOME TAX(272) (2) (1) (0) 0 - - (275)
REPORTED
CONSOLIDATEELIMINATION TOTAL

51
EXHIBIT VI
The Management reassessed the criterion for presenting the amortization of the contractual debt with the pension
plan in the cash flow statement. The purpose of this reclassification was to align this presentation criterion with best
corporate practices in the same sector.
The consolidated financial information for the fourth quarter of 2014 is in accordance with the new practice.
However, for comparison purposes, the adjustments are presented below:
Cash Flow - R$ MNPublished
4Q13Adjustments
Reclassified
4Q13
Cash in the Beginning of the Period (1) 1,787.3 - 1,787.3
Net Income 129.0 - 129.0
Social Contributions & Income Tax 16.4 - 16.4
Net Income before Social Contributions & Income Tax 145.4 - 145.4
Provision for Delinquency 43.3 - 43.3
Depreciation and Amortization 98.3 - 98.3 Loss (gain) on intangible sales / Residual value of
disposals fixed asset14.1 - 14.1
Losses (gains) on financing exchange activities 59.1 - 59.1
Net Interests and Monetary Variations 118.8 - 118.8
Braslight 31.0 - 31.0
Atualization / provisions reversal (29.4) - (29.4)
Equity Pikup 2.9 - 2.9
Financial Assets of the Concession (141.1) - (141.1)
Others (35.2) - (35.2)
Subtotal 307.2 - 307.2
Working Capital 195.1 - 195.1
Contingencies (30.0) - (30.0)
Deferred Taxes 116.7 - 116.7
Braslight (35.4) 28.3 (7.1)
CDE fund 303.4 - 303.4
Others (43.7) - (43.7)
Taxes Paid (13.1) - (13.1)
Interest Paid (180.4) - (180.4)
Cash from Operating Activities (2) 619.8 28.3 648.0
Finance Obtained 9.8 - 9.8
Dividends (185.1) - (185.1)
Loans and financing payments (149.8) - (149.8)
Contractual debt amortization with the pension plan - (28.3) (28.3)
Financing Activities (3) (325.2) (28.3) (353.4)
Fixed Assets/Intangible/Financial Assets (294.9) - (294.9)
Inflow/Acquisitions on Investment (16.0) - (16.0)
Redemption of Investments (1,224.7) - (1,224.7)
Investment Activities (4) (1,535.5) - (1,535.5)
Cash in the End of the Period (1+2+3+4) 546.4 - 546.4
Cash Generation (2+3+4) (1,240.9) - (1,240.9)

52
Cash Flow - R$ MNPublished
2013Adjustments
Reclassified
2013
Cash in the Beginning of the Period (1) 230.4 - 230.4
Net Income 587.3 - 587.3
Social Contributions & Income Tax 264.8 - 264.8
Net Income before Social Contributions & Income Tax 852.1 - 852.1
Provision for Delinquency 157.9 - 157.9
Depreciation and Amortization 390.9 - 390.9
Loss (gain) on intangible sales / Residual value of
disposals fixed asset23.3 - 23.3
Losses (gains) on financing exchange activities 138.6 - 138.6
Net Interests and Monetary Variations 407.5 - 407.5
Braslight 122.0 - 122.0
Atualization / provisions reversal 26.8 - 26.8
Equity Pikup 5.5 - 5.5
Financial Assets of the Concession (168.8) - (168.8)
Dilution of Renova's Gain - - -
Others (81.0) - (81.0)
Subtotal 1,874.9 - 1,874.9
Working Capital 229.8 - 229.8
Contingencies (88.3) - (88.3)
Deferred Taxes 109.5 - 109.5
Braslight (123.5) 113.1 (10.4)
CDE fund - - -
Others (205.1) - (205.1)
Taxes Paid (101.2) - (101.2)
Interest Paid (389.8) - (389.8)
Cash from Operating Activities (2) 1,306.3 113.1 1,419.4
Finance Obtained 2,444.5 - 2,444.5
Dividends (259.9) - (259.9)
Loans and financing payments (1,037.4) - (1,037.4)
Contractual debt amortization with the pension plan - (113.1) (113.1)
Financing Activities (3) 1,147.2 (113.1) 1,034.1
Fixed Assets/Intangible/Financial Assets (830.2) - (830.2)
Inflow/Acquisitions on Investment (90.6) - (90.6)
Redemption of Investments (1,216.7) - (1,216.7)
Investment Activities (4) (2,137.5) - (2,137.5)
Cash in the End of the Period (1+2+3+4) 546.4 - 546.4
Cash Generation (2+3+4) 316.1 - 316.1

ASSETS 12.31.2014 12.31.2013 12.31.2014 12.31.2013
Cash and cash equivalents 4 14,412 26,802 401,138 546,429
Marketable securities 5 - - 104,698 1,244,000
Consumers, concessionaires, permissionaires and clients 6 - - 1,380,679 1,223,413
Inventories - - 33,967 29,662
Taxes and contributions 7 11 - 89,657 105,821
Income tax and social contribution 7 226 6,442 30,556 55,140
Portion A and other financial items 9 - - 577,458 -
Prepaid expenses 254 270 14,910 15,800
Dividends and interest on equity receivable 12 150,152 36,153 - 234
Receivables from services rendered 140 143 38,009 29,811
Receivables from swap transactions 35 - - 1,557 31,150
Other receivables 11 4,248 6,146 282,623 214,296
TOTAL CURRENT ASSETS 169,443 75,956 2,955,252 3,495,756
Consumers, concessionaires, permissionaires and clients 6 - - 211,547 209,414
Taxes and contributions 7 - - 89,233 88,777
Deferred taxes 8 - - 473,823 622,835
Portion A and other financial items 9 536,712 -
Concessions' financial assets 10 - - 2,446,443 1,926,226
Escrow deposits 20 312 305 233,073 263,316
Receivables from swap transactions 35 - - 209,734 110,064
Other receivables 11 - - 2,786 2,786
Investments 12 3,621,983 3,449,076 826,647 642,203
Property, plant and equipment 13 672 672 1,705,087 1,678,722
Intangible assets 14 - - 3,943,857 3,962,108
TOTAL NON-CURRENT ASSETS 3,622,967 3,450,053 10,678,942 9,506,451
TOTAL ASSETS 3,792,410 3,526,009 13,634,194 13,002,207
The notes are an integral part of the financial information.
Convenience translation into English from the original previously issued in Portuguese
LIGHT S.A.
(In thousands of reais)
Notes
Consolidated
BALANCE SHEETS
AS AT DECEMBER 31, 2014 AND 2013
Parent Company

54
LIABILITIES12.31.2014 12.31.2013 12.31.2014 12.31.2013
Suppliers 15 1,351 295 1,560,390 907,262
Taxes and contributions 16 77 11,048 253,571 115,102
Income tax and social contribution 16 13 2 35,548 83,516
Loans and financing 17 - - 482,180 591,470
Debentures 18 - - 97,657 51,030
Payable swap transactions 35 - - 14,490 -
Dividends and interest on equity payable 26 157,422 32,019 157,422 32,019
Estimated liabilities 1,288 1,543 53,812 66,576
Regulatory charges 19 - - 58,978 62,884
Post-employment benefits 22 4 3 123 1,224,736
Other payables 23 2,729 3,059 210,601 183,867
TOTAL CURRENT LIABILITIES 162,884 47,969 2,924,772 3,318,462
Loans and financing 17 - - 2,729,317 1,823,497
Debentures 18 - - 3,273,147 3,349,314
Payable swap transactions 35 - - 2,280 -
Taxes and contributions 16 - - 232,525 187,640
Deferred taxes 8 - - 222,668 226,410
Provisions 20 - - 512,786 543,655
Post-employment benefits 22 - - 31,976 -
Other payables 23 901 901 76,098 76,090
TOTAL NON-CURRENT LIABILITIES 901 901 7,080,797 6,206,606
SHAREHOLDERS' EQUITY
Capital stock 25 2,225,822 2,225,822 2,225,822 2,225,822
Profit reserves 25 1,090,697 565,614 1,090,697 565,614
Proposed additional dividends 26 - 332,819 - 332,819
Equity valuation adjustments 25 409,824 429,498 409,824 429,498
Other comprehensive income 25 (97,718) (76,614) (97,718) (76,614)
Retained earnings - - - -
TOTAL SHAREHOLDERS' EQUITY 3,628,625 3,477,139 3,628,625 3,477,139
TOTAL LIABILITIES AND SHAREHOLDERS' EQUITY 3,792,410 3,526,009 13,634,194 13,002,207
The notes are an integral part of the financial information.
Convenience translation into English from the original previously issued in Portuguese
LIGHT S.A.
Notes
Consolidated
(In thousands of reais)
BALANCE SHEETS
AS AT DECEMBER 31, 2014 AND 2013
Parent Company
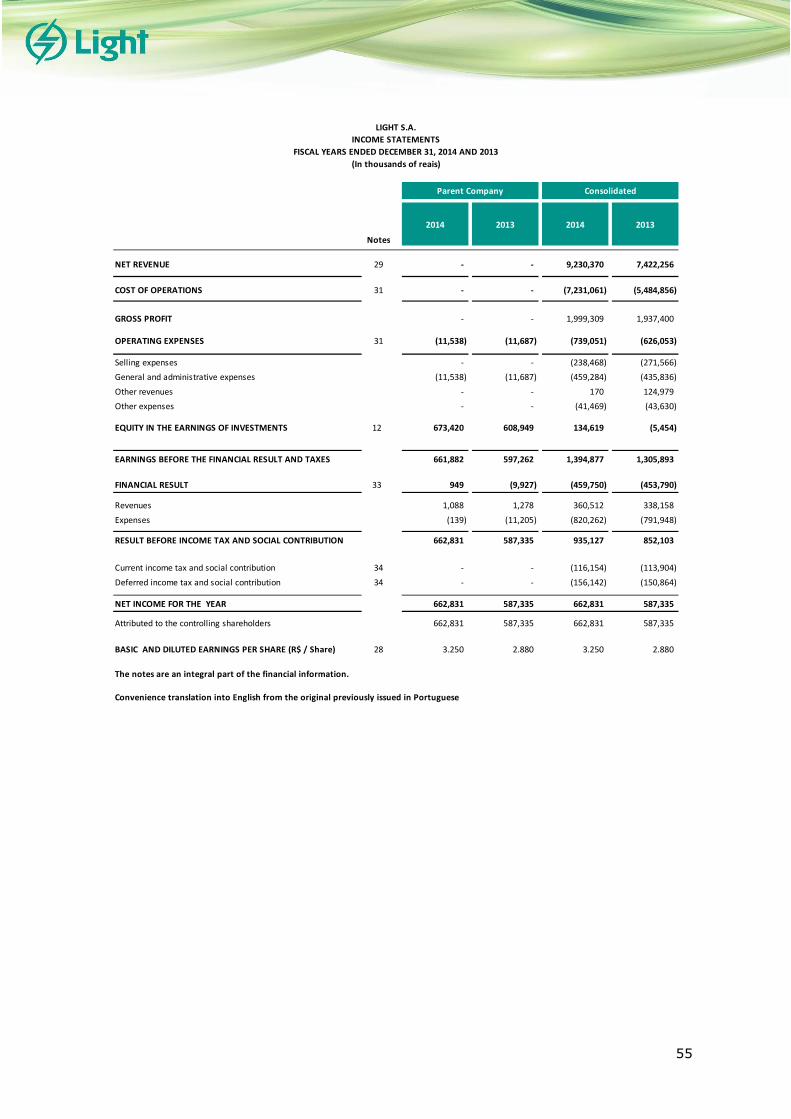
55
2014 2013 2014 2013
NET REVENUE 29 - - 9,230,370 7,422,256
COST OF OPERATIONS 31 - - (7,231,061) (5,484,856)
GROSS PROFIT - - 1,999,309 1,937,400
OPERATING EXPENSES 31 (11,538) (11,687) (739,051) (626,053)
Selling expenses - - (238,468) (271,566)
General and administrative expenses (11,538) (11,687) (459,284) (435,836)
Other revenues - - 170 124,979
Other expenses - - (41,469) (43,630)
EQUITY IN THE EARNINGS OF INVESTMENTS 12 673,420 608,949 134,619 (5,454)
EARNINGS BEFORE THE FINANCIAL RESULT AND TAXES 661,882 597,262 1,394,877 1,305,893
FINANCIAL RESULT 33 949 (9,927) (459,750) (453,790)
Revenues 1,088 1,278 360,512 338,158
Expenses (139) (11,205) (820,262) (791,948)
RESULT BEFORE INCOME TAX AND SOCIAL CONTRIBUTION 662,831 587,335 935,127 852,103
Current income tax and social contribution 34 - - (116,154) (113,904)
Deferred income tax and social contribution 34 - - (156,142) (150,864)
NET INCOME FOR THE YEAR 662,831 587,335 662,831 587,335
Attributed to the controlling shareholders 662,831 587,335 662,831 587,335
BASIC AND DILUTED EARNINGS PER SHARE (R$ / Share) 28 3.250 2.880 3.250 2.880
The notes are an integral part of the financial information.
Convenience translation into English from the original previously issued in Portuguese
INCOME STATEMENTS
LIGHT S.A.
Notes
Consolidated
(In thousands of reais)
FISCAL YEARS ENDED DECEMBER 31, 2014 AND 2013
Parent Company

56
2014 2013 2014 2013
Net income for the year 662,831 587,335 662,831 587,335
Other comprehensive income not reclassified to profit or in subsequent periods
Gains (losses) on actuarial liabilities, net of tax effects (21,104) 95,383 (21,104) 95,383
TOTAL COMPREHENSIVE RESULT 641,727 682,718 641,727 682,718
Attributed to the controlling shareholders 641,727 682,718 641,727 682,718
The notes are an integral part of the financial information.
Convenience translation into English from the original previously issued in Portuguese
Consolidated
LIGHT S.A.
Parent Company
(In thousands of reais)
STATEMENTS OF COMPREHENSIVE INCOME
FISCAL YEARS ENDED DECEMBER 31, 2014 AND 2013
CAPITAL STOCKLEGAL
RESERVE
RETAINED
EARNINGS
PROPOSED
ADDITIONAL
DIVIDENDS
EQUITY
VALUATION
ADJUSTMENTS
OTHER
COMPREHENSIVE
RESULTS
RETAINED
EARNINGS
(ACCUMULATED
LOSSES)
TOTAL
BALANCE ON JANUARY 01, 2013 2,225,822 197,007 59,528 91,770 451,556 (171,997) 171,997 3,025,683
Total comprehensive income:
Net income for the fiscal year - - - - - - 587,335 587,335
Other comprehensive income not reclassified to profit in subsequent periods
Gain of actuarial liabilities, net of taxes - - - - - 95,383 - 95,383
Dividends deliberated by the Annual Shareholders' Meeting and paid (R$0.45/share) - - - (91,770) - - - (91,770)
Realization of equity valuation adjustment - - - - (22,058) - 22,058 -
Allocation of net income for the year:
Recognition of legal reserve - 29,367 - - - - (29,367) -
Addition to minimum mandatory dividends 25% (R$0.16/share) - - - - - - (32,019) (32,019)
Interest on equity declared and paid (R$0.53/share) - - - - - - (107,473) (107,473)
Additional dividends proposed (R$1.63/share) - - - 332,819 - - (332,819) -
Recognition of earnings retention reserve - - 279,712 - - - (279,712) -
BALANCE ON DECEMBER 31, 2013 2,225,822 226,374 339,240 332,819 429,498 (76,614) - 3,477,139
Total comprehensive income:
Net income for the fiscal year - - - - - - 662,831 662,831
Other comprehensive income not reclassified to profit in subsequent periods
Loss of actuarial liabilities, net of taxes - - - - - (21,104) - (21,104)
Realization of equity valuation adjustment - - - - (19,674) - 19,674 -
Dividends deliberated by the Annual Shareholders' Meeting and paid (R$1.63 /share) - - - (332,819) - - - (332,819)
Allocation of net income for the year:
Recognition of legal reserve - 33,142 - - - - (33,142) -
Minimum mandatory dividends - 25% (R$0.7719 / share) - - - - - - (157,422) (157,422)
Recognition of earnings retention reserve - - 491,941 - - - (491,941) -
BALANCE ON DECEMBER 31, 2014 2,225,822 259,516 831,181 - 409,824 (97,718) - 3,628,625
The notes are an integral part of the financial information.
Convenience translation into English from the original previously issued in Portuguese
PROFIT RESERVES
LIGHT S.A.
FISCAL YEARS ENDED DECEMBER 31, 2014 AND 2013
(In thousands of reais)
STATEMENTS OF CHANGES IN SHAREHOLDERS´ EQUITY - PARENT COMPANY AND CONSOLIDATED

57
2014 2013 2014 2013 Restated
Net cash generated by operating activities 404,955 281,539 585,474 1,419,426
Cash generated by (used in) operations (10,589) (21,614) 960,127 1,874,881
Net income before income tax and social contribution 662,831 587,335 935,127 852,103
Allowance for doubtful accounts - - 127,517 157,884
Depreciation and amortization - - 414,835 390,940
Loss from the sale of intangible asset /property, plant and equipment - - 11,607 23,281
Foreign exchange and monetary losses (gains) from financial activities - - 157,086 138,622
Provisions for contingencies, escrow deposits / monetary adjustments - - 81,621 26,809
Adjustment to present value and prepayment of receivables - - (944) 9,903
Interest expense on loans, financing and debentures - - 568,531 397,637
Charges and monetary variation of post-employment obligations - - 3,539 122,035
Swap variation - - (21,618) (80,950)
Equity in the earnings (loss) of investments (673,420) (608,949) (134,619) 5,454
Remuneration of concessions' financial assets - - (68,385) (168,837)
Portion A and other financial items - - (1,114,170) -
(Increase)/Decrease in Assets and Liabilities 415,544 303,153 (374,653) (455,455)
Marketable securities - - (290) (12,034)
Consumers, concessionaires and permissionaires - - (285,972) 130,403
Dividends and interest on equity received 417,918 309,847 1,168 -
Taxes and contributions 6,205 (2,584) 44,034 15,285
Inventories - - (4,305) 686
Receivables from services rendered 3 - (8,198) 12,360
Prepaid expenses 16 (79) 890 (13,846)
Deposits related to litigation (7) (16) 10,456 (40,161)
Other 1,898 148 (68,327) (72,536)
Suppliers 1,056 (163) 631,482 92,487
Estimated liabilities (255) 1,151 (12,764) 19,750
Taxes and contributions (10,960) (4,712) 172,901 94,208
Regulatory charges - - (3,906) (48,832)
Provisions - - (92,703) (88,265)
Post-employment benefits - - (3,486) (10,405)
Other liabilities (330) (439) (4,506) (43,571)
Interests paid - - (593,716) (389,825)
Income tax and social contributions paid - - (157,411) (101,159)
Net cash generated by (used in) investing activities (52,507) (40,291) 255,506 (2,137,450)
Acquisition of property, plant and equipment - - (114,332) (124,746)
Acquisition of intangible assets - - (718,551) (705,423)
Investment acquisitions (52,507) (40,291) (51,203) (90,581)
Redemption of financial investments - - 1,224,666 -
Financial investments - - (85,074) (1,216,700)
Net cash generated by (used in) financing activities (364,838) (259,915) (986,271) 1,034,097
Dividends and interest on equity paid (364,838) (259,915) (364,838) (259,915)
Loans, financing and debentures - - 1,992,789 2,444,531
Amortization of loans, financing and debentures - - (1,389,556) (1,037,407)
Amortization of contractual debt with pension plan - - (1,224,666) (113,112)
Net increase (decrease) in cash and cash equivalents (12,390) (18,667) (145,291) 316,073
Cash and cash equivalents at the beginning of fiscal year 26,802 45,469 546,429 230,356
Cash and cash equivalents at the end of fiscal year 14,412 26,802 401,138 546,429
The notes are an integral part of the financial information.
Convenience translation into English from the original previously issued in Portuguese
Parent Company Consolidated
LIGHT S.A.
STATEMENT OF CASH FLOW
FISCAL YEARS ENDED DECEMBER 31, 2014 AND 2013
(In thousands of reais)

58
2014 2013 2014 2013
Revenues - - 13,150,691 10,625,426
Sale of goods, products and services - - 12,288,827 9,963,026
Revenue related to the construction of own assets - - 989,381 820,284
Allowance/Reversal of allowance for doubtful accounts - - (127,517) (157,884)
Inputs acquired from third parties (5,987) (6,199) (6,936,131) (5,270,211)
Cost of products, goods and services sold - - (5,447,953) (4,094,368)
Material, energy, outsourced services and other (5,987) (6,199) (1,488,178) (1,175,843)
Gross value added (5,987) (6,199) 6,214,560 5,355,215
Retentions - - (414,835) (390,940)
Depreciation and amortization - - (414,835) (390,940)
Net value added produced (5,987) (6,199) 5,799,725 4,964,275
Value added received in transfer 674,508 610,227 495,131 332,704
Equity in the earnings (loss)of investments 673,420 608,949 134,619 (5,454)
Financial revenues 1,088 1,278 360,512 338,158
Total value added to distribute 668,521 604,028 6,294,856 5,296,979
Distribution of value added 668,521 604,028 6,294,856 5,296,979
Personnel 5,075 5,102 347,671 342,752
Direct remuneration 4,664 4,703 261,931 259,481
Benefits 274 189 54,903 52,973
Government Severance Fund for Employees (FGTS) 137 210 24,596 22,754
Other - - 6,241 7,544
Taxes, fees and contributions 505 417 4,334,528 3,474,763
Federal 505 417 1,893,649 1,226,874
State - - 2,430,626 2,235,097
Municipal - - 10,253 12,792
Value distributed to providers of capital 110 11,174 949,826 892,129
Interest 110 11,174 851,654 812,994
Rental - - 80,182 56,357
Other - - 17,990 22,778
Value distributed to shareholders 662,831 587,335 662,831 587,335
Dividends and interest on equity 157,422 472,311 157,422 472,311
Retained earnings 505,409 115,024 505,409 115,024
The notes are an integral part of the financial information.
Convenience translation into English from the original previously issued in Portuguese
ConsolidatedParent Company
FISCAL YEARS ENDED DECEMBER 31, 2014 AND 2013
STATEMENTS OF VALUE ADDED
LIGHT S.A.
(In thousands of reais)

59
NOTES TO THE INDIVIDUAL AND CONSOLIDATED FINANCIAL
STATEMENTS FOR THE YEARS ENDED DECEMBER 31, 2014 AND 2013

1
In thousands of Brazilian reais – R$, unless stated otherwise
1. OPERATIONS The corporate purpose of Light S.A. (Company or “Light”), a publicly-held company headquartered in the City of Rio de Janeiro/RJ - Brazil, is to hold equity interests in other companies, as partner or shareholder, and the direct or indirect exploration, as applicable, of electric power services, including electric power generation, transmission, sale and distribution systems, as well as other related services. The Company is listed in the New Market (Novo Mercado) segment of the BM&FBOVESPA São Paulo Securities, Commodities and Futures Exchange (BM&FBOVESPA), under the ticker LIGT3, and in the U.S. over-the-counter (OTC) market, under the ticker LGSXY. 2. GROUP’S ENTITIES a) Direct Subsidiaries
Light Serviços de Eletricidade S.A. (Light SESA – 100%) – a publicly-held corporation, headquartered in the city and state of Rio de Janeiro, engaged in the distribution of electric power, with a concession area comprising 31 cities in the state of Rio de Janeiro, including its capital. Light Energia S.A. - (Light Energia – 100%) – a publicly-held corporation, headquartered in the city and State of Rio de Janeiro, whose main activities are to (a) study, plan, construct, operate and explore systems of electric power generation, transmission, sales, and related services that have been legally granted or that may be granted or authorized to it or to companies in which it holds or may come to hold a controlling interest; (b) to hold interests in other companies as a partner, shareholder or quotaholder. It comprises the Pereira Passos, Nilo Peçanha, Ilha dos Pombos, Santa Branca and Fontes Novas plants, with a total installed capacity of 855 MW. Light Energia holds interest in the following subsidiaries and jointly-controlled entities:
• Central Eólica São Judas Tadeu Ltda. (São Judas Tadeu – 100%) - a company at the pre-operational stage whose main activity is the generation and sale of electric power through a wind powerplant located in the state of Ceará, with 18 MW nominal power.
• Central Eólica Fontainha Ltda. (Fontainha – 100%) – a company at the pre-operational stage whose main activity is the generation and sale of electric power through a wind powerplant located in the state of Ceará, with 16 MW nominal power.
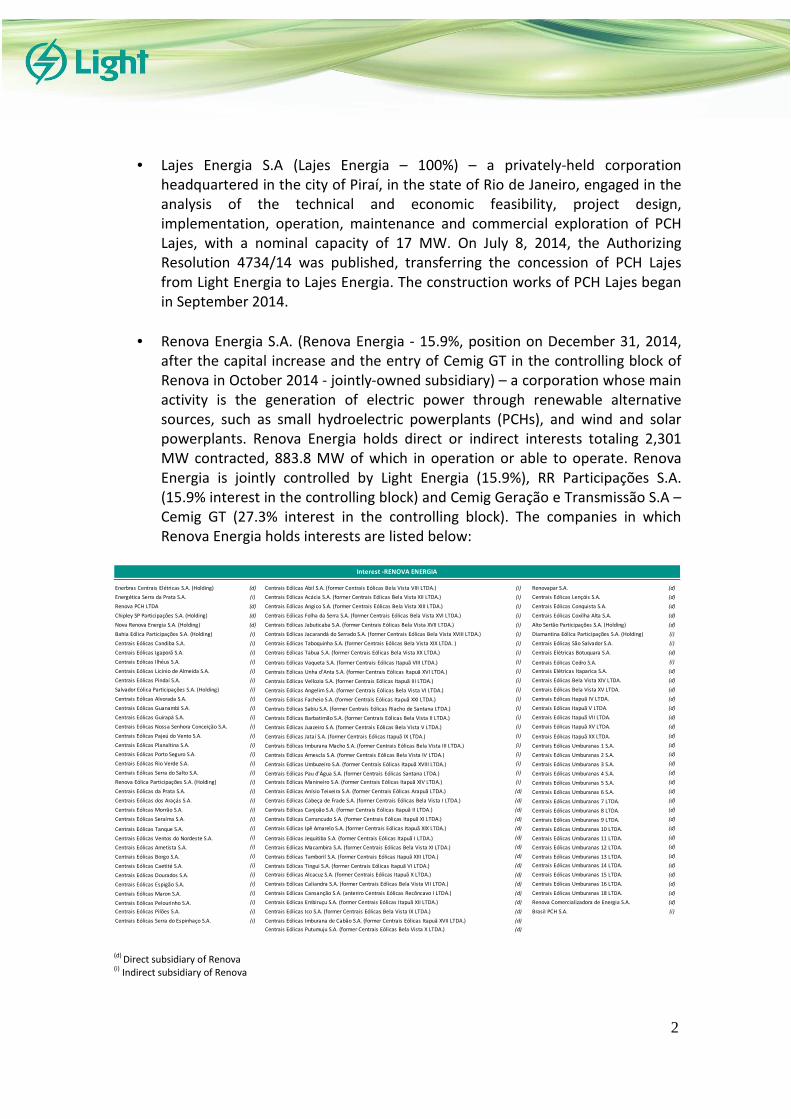
2
• Lajes Energia S.A (Lajes Energia – 100%) – a privately-held corporation headquartered in the city of Piraí, in the state of Rio de Janeiro, engaged in the analysis of the technical and economic feasibility, project design, implementation, operation, maintenance and commercial exploration of PCH Lajes, with a nominal capacity of 17 MW. On July 8, 2014, the Authorizing Resolution 4734/14 was published, transferring the concession of PCH Lajes from Light Energia to Lajes Energia. The construction works of PCH Lajes began in September 2014.
• Renova Energia S.A. (Renova Energia - 15.9%, position on December 31, 2014, after the capital increase and the entry of Cemig GT in the controlling block of Renova in October 2014 - jointly-owned subsidiary) – a corporation whose main activity is the generation of electric power through renewable alternative sources, such as small hydroelectric powerplants (PCHs), and wind and solar powerplants. Renova Energia holds direct or indirect interests totaling 2,301 MW contracted, 883.8 MW of which in operation or able to operate. Renova Energia is jointly controlled by Light Energia (15.9%), RR Participações S.A. (15.9% interest in the controlling block) and Cemig Geração e Transmissão S.A – Cemig GT (27.3% interest in the controlling block). The companies in which Renova Energia holds interests are listed below:
Enerbras Centrais Elétricas S.A. (Holding) (d) Centrais Eólicas Abil S.A. (former Centrais Eólicas Bela Vista VIII LTDA.) (i) Renovapar S.A. (d)
Energética Serra da Prata S.A. (i) Centrais Eólicas Acácia S.A. (former Centrais Eólicas Bela Vista XII LTDA.) (i) Centrais Eólicas Lençóis S.A. (d)
Renova PCH LTDA (d) Centrais Eólicas Angico S.A. (former Centrais Eólicas Bela Vista XIII LTDA.) (i) Centrais Eólicas Conquista S.A. (d)
Chipley SP Participações S.A. (Holding) (d) Centrais Eólicas Folha da Serra S.A. (former Centrais Eólicas Bela Vista XVI LTDA.) (i) Centrais Eólicas Coxilha Alta S.A. (d)
Nova Renova Energia S.A. (Holding) (d) Centrais Eólicas Jabuticaba S.A. (former Centrais Eólicas Bela Vista XVII LTDA.) (i) Alto Sertão Participações S.A. (Holding) (d)
Bahia Eólica Participações S.A. (Holding) (i) Centrais Eólicas Jacarandá do Serrado S.A. (former Centrais Eólicas Bela Vista XVIII LTDA.) (i) Diamantina Eólica Participações S.A. (Holding) (i)
Centrais Eólicas Candiba S.A. (i) Centrais Eólicas Taboquinha S.A. (former Centrais Eólicas Bela Vista XIX LTDA. ) (i) Centrais Eólicas São Salvador S.A. (i)
Centrais Eólicas Igaporã S.A. (i) Centrais Eólicas Tabua S.A. (former Centrais Eólicas Bela Vista XX LTDA.) (i) Centrais Elétricas Botuquara S.A. (d)
Centrais Eólicas Ilhéus S.A. (i) Centrais Eólicas Vaqueta S.A. (former Centrais Eólicas Itapuã VIII LTDA.) (i) Centrais Eólicas Cedro S.A. (i)
Centrais Eólicas Licínio de Almeida S.A. (i) Centrais Eólicas Unha d'Anta S.A. (former Centrais Eólicas Itapuã XVI LTDA.) (i) Centrais Elétricas Itaparica S.A. (d)
Centrais Eólicas Pindaí S.A. (i) Centrais Eólicas Vellozia S.A. (former Centrais Eólicas Itapuã III LTDA.) (i) Centrais Eólicas Bela Vista XIV LTDA. (d)
Salvador Eólica Participações S.A. (Holding) (i) Centrais Eólicas Angelim S.A. (former Centrais Eólicas Bela Vista VI LTDA.) (i) Centrais Eólicas Bela Vista XV LTDA. (d)
Centrais Eólicas Alvorada S.A. (i) Centrais Eólicas Facheio S.A. (former Centrais Eólicas Itapuã XXI LTDA.) (i) Centrais Eólicas Itapuã IV LTDA. (d)
Centrais Eólicas Guanambi S.A. (i) Centrais Eólicas Sabiu S.A. (former Centrais Eólicas Riacho de Santana LTDA.) (i) Centrais Eólicas Itapuã V LTDA. (d)
Centrais Eólicas Guirapá S.A. (i) Centrais Eólicas Barbatimão S.A. (former Centrais Eólicas Bela Vista II LTDA.) (i) Centrais Eólicas Itapuã VII LTDA. (d)
Centrais Eólicas Nossa Senhora Conceição S.A. (i) Centrais Eólicas Juazeiro S.A. (former Centrais Eólicas Bela Vista V LTDA.) (i) Centrais Eólicas Itapuã XV LTDA. (d)
Centrais Eólicas Pajeú do Vento S.A. (i) Centrais Eólicas Jataí S.A. (former Centrais Eólicas Itapuã IX LTDA.) (i) Centrais Eólicas Itapuã XX LTDA. (d)
Centrais Eólicas Planaltina S.A. (i) Centrais Eólicas Imburana Macho S.A. (former Centrais Eólicas Bela Vista III LTDA.) (i) Centrais Eólicas Umburanas 1 S.A. (d)
Centrais Eólicas Porto Seguro S.A. (i) Centrais Eólicas Amescla S.A. (former Centrais Eólicas Bela Vista IV LTDA.) (i) Centrais Eólicas Umburanas 2 S.A. (d)
Centrais Eólicas Rio Verde S.A. (i) Centrais Eólicas Umbuzeiro S.A. (former Centrais Eólicas Itapuã XVIII LTDA.) (i) Centrais Eólicas Umburanas 3 S.A. (d)
Centrais Eólicas Serra do Salto S.A. (i) Centrais Eólicas Pau d'Água S.A. (former Centrais Eólicas Santana LTDA.) (i) Centrais Eólicas Umburanas 4 S.A. (d)
Renova Eólica Participações S.A. (Holding) (i) Centrais Eólicas Manineiro S.A. (former Centrais Eólicas Itapuã XIV LTDA.) (i) Centrais Eólicas Umburanas 5 S.A. (d)
Centrais Eólicas da Prata S.A. (i) Centrais Eólicas Anísio Teixeira S.A. (former Centrais Eólicas Arapuã LTDA.) (d) Centrais Eólicas Umburanas 6 S.A. (d)
Centrais Eólicas dos Araçás S.A. (i) Centrais Eólicas Cabeça de Frade S.A. (former Centrais Eólicas Bela Vista I LTDA.) (d) Centrais Eólicas Umburanas 7 LTDA. (d)
Centrais Eólicas Morrão S.A. (i) Centrais Eólicas Canjoão S.A. (former Centrais Eólicas Itapuã II LTDA.) (d) Centrais Eólicas Umburanas 8 LTDA. (d)
Centrais Eólicas Seraíma S.A. (i) Centrais Eólicas Carrancudo S.A. (former Centrais Eólicas Itapuã XI LTDA.) (d) Centrais Eólicas Umburanas 9 LTDA. (d)
Centrais Eólicas Tanque S.A. (i) Centrais Eólicas Ipê Amarelo S.A. (former Centrais Eólicas Itapuã XIX LTDA.) (d) Centrais Eólicas Umburanas 10 LTDA. (d)
Centrais Eólicas Ventos do Nordeste S.A. (i) Centrais Eólicas Jequitiba S.A. (former Centrais Eólicas Itapuã I LTDA.) (d) Centrais Eólicas Umburanas 11 LTDA. (d)
Centrais Eólicas Ametista S.A. (i) Centrais Eólicas Macambira S.A. (former Centrais Eólicas Bela Vista XI LTDA.) (d) Centrais Eólicas Umburanas 12 LTDA. (d)
Centrais Eólicas Borgo S.A. (i) Centrais Eólicas Tamboril S.A. (former Centrais Eólicas Itapuã XIII LTDA.) (d) Centrais Eólicas Umburanas 13 LTDA. (d)
Centrais Eólicas Caetité S.A. (i) Centrais Eólicas Tingui S.A. (former Centrais Eólicas Itapuã VI LTDA.) (d) Centrais Eólicas Umburanas 14 LTDA. (d)
Centrais Eólicas Dourados S.A. (i) Centrais Eólicas Alcacuz S.A. (former Centrais Eólicas Itapuã X LTDA.) (d) Centrais Eólicas Umburanas 15 LTDA. (d)
Centrais Eólicas Espigão S.A. (i) Centrais Eólicas Caliandra S.A. (former Centrais Eólicas Bela Vista VII LTDA.) (d) Centrais Eólicas Umburanas 16 LTDA. (d)
Centrais Eólicas Maron S.A. (i) Centrais Eólicas Cansanção S.A. (anteriro Centrais Eólicas Recôncavo I LTDA.) (d) Centrais Eólicas Umburanas 18 LTDA. (d)
Centrais Eólicas Pelourinho S.A. (i) Centrais Eólicas Embiruçu S.A. (former Centrais Eólicas Itapuã XII LTDA.) (d) Renova Comercializadora de Energia S.A. (d)
Centrais Eólicas Pilões S.A. (i) Centrais Eólicas Ico S.A. (former Centrais Eólicas Bela Vista IX LTDA.) (d) Brasil PCH S.A. (i)
Centrais Eólicas Serra do Espinhaço S.A. (i) Centrais Eólicas Imburana de Cabão S.A. (former Centrais Eólicas Itapuã XVII LTDA.) (d)
Centrais Eólicas Putumuju S.A. (former Centrais Eólicas Bela Vista X LTDA.) (d)
Interest -RENOVA ENERGIA
(d) Direct subsidiary of Renova (i) Indirect subsidiary of Renova

3
On December 31st, 2014, the indirect interest held by Light Energia in Chipley is 9.5%, in Brasil PCH is 4.9%, in Renova PCH Ltda., Nova Renova Energia S.A., Centrais Elétricas Botuquara Ltda. and Centrais Elétricas Itaparica Ltda. is 15.7%, while in other companies is 15.9%.
• Guanhães Energia S.A. (Guanhães Energia - 51%, jointly-owned subsidiary) – a privately-held corporation at the pre-operational stage, headquartered in the city of Belo Horizonte – MG, was created with the purpose of implementing and exploring four small hydroelectric powerplants (PCHs) in the state of Minas Gerais, with total installed capacity of 44.0 MW. The project was affected by geological and environmental issues, postponing the estimated date for the PCHs start-up. The company is a jointly-owned subsidiary of Light Energia (51%) and Cemig GT (49%).
Light Esco Prestação de Serviços S.A. - (Light Esco – 100%) – a privately-held corporation, headquartered in the city and state of Rio de Janeiro, whose main activity is the purchase, sale, import, export of electric power, thermal power, gas and industrial utilities, and provision of advisory services in the energy sector. The company is a member of the Maracanã Solar consortium, which manages the photovoltaic plant installed on the top of the Maracanã stadium (51%). EDF Consultoria em Projetos de Geração de Energia Ltda. holds a 49% interest in this consortium. Light Esco was granted authorization from ANEEL to become an independent producer of electric power. Light Esco held interest in EBL Companhia de Eficiência Energética S.A. (EBL – 33.3%, jointly-owned subsidiary) – a company engaged in providing energy efficiency solutions and services and rental of equipment and facilities at units owned or rented by Telemar Norte Leste S.A. The dissolution of this entity was concluded in December 2014, resulting in an equity loss of R$106 in profit or loss. No liability was identified for shareholders.
Lightcom Comercializadora de Energia S.A. (Lightcom – 100%) – a privately-held corporation, headquartered in the city and state of São Paulo, engaged in the purchase, sale, import, export and provision of advisory services in the energy sector. Itaocara Energia Ltda. - (Itaocara Energia – 100%) – a company at the pre-operational stage, primarily engaged in the design, construction, installation, operation and exploration of electric power generation plants. It holds interest in the UHE Itaocara Consortium for the exploration of the Itaocara Hydroelectric Powerplant (51%). Cemig GT has a 49% interest. On November 26, 2013, the Concession Agreement 12/2001-ANEEL, which governs the implementation and exploration of the Itaocara Hydroelectric Powerplant, was terminated, as detailed in note 12. Light Soluções em Eletricidade Ltda (Light Soluções - 100%) – a limited liability company whose main activity is to provide services to low voltage clients, including the assembly, remodeling and maintenance of facilities in general.

4
Instituto Light para o Desenvolvimento Urbano e Social (Light Institute - 100%) – a non-profit private company, engaged in participating in social and cultural projects, focused on the cities’ social and economic development, affirming the Company’s ability to be socially responsible. b) Jointly-controlled entities
Lightger S.A. (Lightger) – a privately-held corporation whose purpose is to participate in auctions for concessions, authorizations and permissions for new electric power plants. The Paracambi small hydroelectric powerplant (PHC) began operating in the third quarter of 2012. The company is jointly owned by Light S.A (51%) and Cemig GT (49%). Axxiom Soluções Tecnológicas S.A. (Axxiom) – a privately-held corporation, headquartered in the city of Belo Horizonte, state of Minas Gerais, whose purpose is to offer technology solutions and systems for the operational management of public utility concessionaires, including electric power, gas, water and sewage companies. It is jointly owned by Light S.A (51%) and Companhia Energética de Minas Gerais - CEMIG (49%). Energia Olímpica S.A. (Energia Olímpica) – a privately-held corporation, headquartered in the city and state of Rio de Janeiro, whose main activity is to implement the Vila Olímpica substation and two underground lines 138 kV which will be connected to the substation. It is jointly owned by Light S.A. (50.1%) and Furnas Centrais Elétricas S.A. - Furnas (49.9%). CR Zongshen E-Power Fabricadora de Veículos S.A. (E-Power) – a privately-held corporation at the pre-operational stage whose purpose is to manufacture “Kasinski” two-wheel electric vehicles. Light S.A. and CR Zongeshen Fabricadora de Veículos S.A. (CR Zongshen), referred to as “Kasinski” were the company’s shareholders, holding 20% and 80%, respectively of E-Power’s registered common shares. On July 24, 2014, the Company sold its 100% interest in the capital social stock of E-Power to CR Zongshen, without impacts on profit or loss. Amazônia Energia Participações S.A. (Amazônia Energia) – a privately-held corporation whose purpose is to hold an interest, as a shareholder, in Norte Energia S.A. (NESA), which holds the concession for the use of public assets to explore the Belo Monte Hydroelectric Powerplant, on Xingu river, in the state of Pará. It is jointly owned by Light S.A. (25.5%) and Cemig GT (74.5%). Amazônia Energia holds a 9.8% interest in NESA, with significant influence on management, but without joint control. On August 26, 2010, NESA signed the Concession Agreement nº 001/10 with the federal government through the Ministry of Mines and Energy (MME) to explore electric

5
power generation services, with a 35-year term as of the referred agreement’s date of signature. Still according to referred agreement, 70% of the powerplant’s assured energy will be destined to the regulated market, 10% to self-producers and 20% to the free market (ACL). NESA will also rely on significant amounts of organization, development and pre-operation costs to complete the plant, which, according to estimates and projections should be absorbed by revenue from future operations. c) Light Group Consolidation The consolidated financial statements include the shareholdings of the Company, its subsidiaries, which are consolidated as follows:
Percentage of
interest (%)
Direct
Percentage of
interest (%)
Indirect
Percentage of
interest (%)
Direct
Percentage of
interest (%)
Indirect
Light Serviços de Eletricidade S.A. 100.0 - 100.0 -
Light Energia S.A. 100.0 - 100.0 -
Central Eólica Fontainha Ltda. - 100.0 - 100.0
Central Eólica São Judas Tadeu Ltda. - 100.0 - 100.0
Lajes Energia S.A - 100.0 - -
Light Esco Prestação de Serviços S.A. 100.0 - 100.0 -
Lightcom Comercializadora de Energia S.A. 100.0 - 100.0 -
Light Soluções em Eletricidade Ltda. 100.0 - 100.0 -
Instituto Light para o Desenvolvimento Urbano e Social 100.0 - 100.0 -
Itaocara Energia Ltda. 100.0 - 100.0 -
12.31.201312.31.2014
d) Light Group’s concessions and authorizations The main aspects of Light SESA’s concession agreements are listed below: On June 4, 1996, Concession Agreement No. 001/96 was entered into between the federal government (granting authority through the Brazilian Electricity Regulatory Agency, ANEEL) and the subsidiary Light SESA, regulating the exploration of electric power public utility services in the state of Rio de Janeiro, comprising the generation and distribution of electric power. Said agreement’s duration is 30 years, and it may be renewed at the concessionaire’s request and at the granting authority’s exclusive discretion. As set forth in the concession agreement, all assets and facilities related to electric power distribution services and provided by the concessionaire are deemed reversible and comprise the respective concession’s assets. These assets will automatically reverse to the granting authority at the expiration of the agreement, valuations must be conducted and the indemnity owed to the concessionaire must be determined, observing the amounts and dates of incorporation into the electric system. The concessionaire’s main obligations provided for in the concession agreement are:

6
i. To provide electric power to consumers located within its concession area,
according to the tariffs ratified by the granting authority, within the levels of quality and continuity provided for by the legislation.
ii. To conduct the works necessary to provide concession services, so as to ensure the continuity, regularity, quality and efficiency of services.
iii. To maintain records and inventory of concession-related assets and ensure their integrity. The sale, assignment or pledging as guarantee of real estate properties or essential parts of the facilities depend on the granting authority’s prior and express authorization.
iv. To comply with and ensure compliance with legal and regulatory service standards, answering before the granting authority, users and third parties for any damages caused by the exploration of services.
v. To meet all the tax, labor and social security liabilities and charges deriving from regulatory rules laid down by the granting authority.
vi. To allow the granting authority’s inspectors free access to the works, equipment and facilities used in the provision of services, as well as its accounting records, at any time.
vii. To report to the granting authority and users, according to specific legal and regulatory provisions, on the management of concession services.
viii. To maintain the electric power and water reserves required to provide the public utility service.
ix. To comply with environmental protection laws, being liable for any consequences due to non-compliances.
x. To conduct training programs, so as to permanently ensure the
improvement of quality and efficiency in the provision of concession services.
xi. To participate in planning for the sector and the drafting of the National Electric System expansion plans, implementing and ensuring compliance with technical and administrative recommendations deriving therefrom within its concession area.
xii. To adhere to the National System of Electric Power Transmission and ensure free access to its transmission and distribution systems.

7
xiii. To operate its facilities in accordance with the prevailing rules. The concessionaire shall accept and apply any new resolutions, recommendations and instructions issued by ANEEL, the National System Operator (ONS) and Energy Research Company (EPE).
xiv. To observe, pursuant to the prevailing laws, the limits of maximum and
minimum downstream flow control of its hydroelectric developments, and consider in the operational rules the allocation of downtime volume in its powerplants reservoirs, so as to minimize adverse effects from floods.
xv. When determined by the granting authority, to supply electric power to
other concessionaires and interconnections, as required, in accordance with the planning to supply the market.
Light SESA is entitled to charge from consumers the tariffs established and ratified by the granting authority for the execution of services. The tariffs will be adjusted yearly and the concessionaire’s revenue will be divided into two portions: Portion A (composed of non-manageable costs) and Portion B (efficient operating costs and costs of capital). The annual tariff adjustment aims at transferring non-manageable costs and monetarily restating manageable costs. The periodic tariff revision is carried out every five years to reestablish the concession’s economic and financial balance. The next tariff revision reference date will be November 2018. In this process, ANEEL re-calculates the tariffs, taking into account changes in the cost structure and the concessionaire’s market, stimulating efficient and reasonable tariffs. Adjustments and revisions are tariff restatement mechanisms, both provided for in the concession agreement. The concessionaire may also request an extraordinary revision whenever any event causes any relevant economic and financial imbalance at the concession. The concession may be extinguished by the expiration of the agreement, service absorption, forfeiture, termination, irregularities or bankruptcy of the concessionaire. The concessionaire’s majority controlling interest cannot be transferred without the granting authority’s prior consent. In the event shares representing the controlling interest are transferred, the new controlling shareholder shall sign an instrument of consent and submission to the clauses of the concession agreement and the concession’s legal and regulatory rules. The chart below summarizes the Light Group’s concessions and authorizations effective on December 31st, 2014:

8
Concessions / authorizations Act Date
Light SESA and Light Energia Jun/1996 Jun/2026
PCH Paracambi - Lightger Fev/2001 Fev/2031
PCH Lajes - Lajes Energia Jul/2014 Jun/2026
Usinas Eólicas - Renova Energia Aug/2010 Aug/2045
Usinas Eólicas - Renova Energia Mar/2011 to May/2011 Mar/2046 to May/2046
Usinas Eólicas - Renova Energia Mar/2012 and Apr/2012 Mar/2047 and April/2047
Centrais Eólicas São Salvador Ltda - Renova Energia May/2013 May/2048
PCH Cachoeira da Lixa - Renova Energia Dec/2003 Dec/2033
PCH Colino 2 - Renova Energia Dec/2003 Dec/2033
PCH Colino 1 - Renova Energia Dec/2003 Dec/2033
Brasil PCH S.A - Renova Energia Dec/1999 to Nov/2003 Dec/2029 to Nov/2033
Centrais Eólicas Bela Vista - Renova Energia Mar/2014 Mar/2048
Centrais Eólicas Itapuã - Renova Energia Mar/2014 Mar/2048
Centrais Eólicas Umburanas - Renova Energia Aug/2014 Aug/2048
PCH Dores de Guanhães - Guanhães Energia Nov/2002 Nov/2032
PCH Senhora do Pôrto - Guanhães Energia Oct/2002 Oct/2032
PCH Jacaré - Guanhães Energia Oct/2002 Oct/2032
PCH Fortuna II - Guanhães Energia Dec/2001 Dec/2031

9
3. APPROVAL AND SUMMARY OF THE MAIN ACCOUNTING PRACTICES ADOPTED IN
THE PREPARATION OF THE FINANCIAL STATEMENTS
The authorization for the conclusion of these financial statements was given by the Company’s Board of Directors on March 6, 2015. The Company’s financial statements comprise the individual financial statements of the Parent Company, identified as Parent Company, and the consolidated financial statements, identified as Consolidated, prepared in accordance with the accounting practices adopted in Brazil and the International Financial Reporting Standards (“IFRSs”) issued by the International Accounting Standards Board (“IASB”). The accounting practices adopted in Brazil comprise those in Brazilian Corporate Law and the pronouncements, guidelines and technical interpretations issued by the Brazilian Accounting Pronouncement Committee - CPC and approved by the Federal Accounting Council – CFC and the Brazilian Securities and Exchange Commission - CVM. As there is no difference between the consolidated equity and consolidated income attributable to the parent company’s shareholders, recorded in the consolidated financial statements prepared under IFRS and the accounting practices adopted in Brazil, and the parent company’s equity and results recorded in the individual financial statements prepared in accordance with the accounting practices adopted in Brazil, the Company has chosen to present the parent company and consolidated financial statements as a single set, side by side. These financial statements are presented in Brazilian Real, which is the functional currency of the Company, its subsidiaries, jointly-controlled entities and associated companies. All financial statements presented in Real was rounded up thousands, except when indicated otherwise. The accounting policies described in details below have been applied consistently to all fiscal years presented in these financial statements. a) Basis of consolidation
i. Investment in subsidiaries and jointly-controlled entities
Subsidiaries are all the entities (including Special Purpose Entities) in which the Company has the following attributes: (i) power over the investee; (ii) exposure to, or rights over, variable returns resulting from its involvement with the investee; (iii) capacity to use its power over the investee to affect the value of its returns. Joint venture arrangements, which involve the organization of a separate entity in which each owner holds an interest, are

10
called jointly-controlled entities. In the consolidated financial statements, interests in joint ventures are recognized as investments and accounted by the equity method. The financial statements of subsidiaries and jointly-controlled entities are included in the Company’s financial statements from the date when control or shared control begins until the date when control or shared control ceases to exist. The accounting policies adopted by the subsidiaries and jointly-controlled entities are aligned with the policies adopted by the Group.
ii. Investments in associated companies
The associated companies are those entities in which the Company’s, directly or indirectly, has relevant influence on, but not control of, financial and operating policies. Investments in associated companies are accounted for by the equity method, both in individual and consolidated financial statements, and are initially recognized at cost. The financial statements include equity variations at the associated companies, after adjustments to align their accounting policies with those of the Group, as of the date a relevant influence starts to occur until the date when it ceases to exist.
iii. Jointly-controlled operations
A jointly- controlled operation is an operation in which owners use their own assets for the purposes of the jointly- controlled operations. The consolidated financial statements include the assets the Group controls and the liabilities incurred during the course of the activities of the joint operations, the expenses incurred by the Group and its share of revenues from the joint operations.
iv. Transactions eliminated in the consolidation
Intragroup balances and transactions, and any unrealized revenues or expenses derived from intragroup transactions, are eliminated in the preparation of the consolidated financial statements. Unrealized gains in transactions with investees accounted for by the equity method are eliminated against the relevant investment in proportion to the Group’s interest in the investee.
b) Financial instruments
i. Non-derivative financial assets
The Company initially recognizes financial assets on the inception date. All

11
other financial assets (including assets designated at fair value through profit and loss) are initially recognized on the date of negotiation on which the Company becomes one of the parties to the contractual provisions.
The Company derecognizes a financial asset when the contractual rights to the asset’s cash flows expire, or when the Company transfers the rights to receive contractual cash flows over a financial asset in a transaction in which essentially all risks and benefits inherent in the ownership of the financial asset are transferred. Occasional interest created or held by the Company in financial assets is recorded as individual assets or liabilities. The Company classifies non-derivative financial assets in the following categories: financial assets measured at fair value through profit and loss, loans and receivables and available-for-sale financial assets.
Financial assets measured at fair value through profit and loss A financial asset is classified at fair value through profit and loss if it is classified as held for trading or is designated as such at the moment of its initial recognition. Financial assets are designated at fair value through profit and loss if the Company manages such investments and makes purchase and sale decisions based on their fair values, in accordance with its risk management and investment strategy. Transaction costs are recorded in the income statement when incurred. Financial assets recorded at fair value through profit and loss are measured at fair value and changes to the asset’s fair value are recognized in the income statement. Financial assets designated at fair value through profit and loss comprise marketable securities.
Loans and receivables Financial assets with fixed or determinable payments, which are not priced on the active market. These assets are initially recorded at fair value plus any attributable transaction costs. After initial recognition, loans and receivables are measured at amortized cost through the effective interest rate method, less any impairment losses. Loans and receivables comprise cash and cash equivalents, trade accounts receivable, receivables from services provided, Portion A and other financial items and other receivables. Available-for-sale financial assets

12
They are non-derivative financial assets not classified as loans and receivables, held to maturity or at fair value through profit or loss. After initial recognition, the interest calculated by the effective interest rate method and the adjustment of cash flow expectations are recognized in the income statement, while the other changes in the fair value are recognized in other comprehensive income. The result accumulated in other comprehensive income is transferred to the income statement for the fiscal year at the time the asset is realized. Available-for-sale financial assets comprise the concessions’ financial assets. This instrument is classified as available for sale because it cannot be classified in the other categories. As Management believes that indemnification will be based on the current tariff pricing model, it would not be possible to record this instrument as loans and receivables, as the indemnification will not be fixed or determinable and as its recoverable amount is not known on this date, due to reasons other than credit deterioration. This is mainly due to the risk of non-recognition of part of these assets by the regulatory agency and their respective replacement prices based on the New Replacement Value (NRV) criterion at the end of the concession. See note 10.
ii. Non derivative financial liabilities
The Company initially recognizes debt securities issued and subordinated liabilities on the inception date. All the other financial liabilities are initially recognized on the date of negotiation when the Company becomes a party to the instrument’s contractual provisions. The Company writes-off a financial liability when its contractual obligations are withdrawn or cancelled or extinguished. The Company classifies non-derivative financial liabilities under other financial liabilities. Such financial liabilities are initially recognized at fair value plus any attributable transaction costs. After initial recognition, these financial liabilities are measured at amortized cost through the effective interest rate method. The Company has the following non-derivative financial liabilities: loans and financing, debentures, suppliers, dividends and interest on equity, and other payables.
iii. Derivative financial instruments
The Company operates with derivative financial instruments to hedge against foreign exchange variation and interest rate risks.

13
Derivatives are initially recognized at fair value and attributable transaction costs are recognized in the income statement as incurred. After initial recognition, derivatives are measured at fair value and changes in the fair value are immediately accounted for in the income statement. Derivatives comprise swap transactions.
iv. Capital Stock
Common shares are classified as shareholders’ equity. Additional costs directly attributable to the issue of shares and stock options are recognized as shareholders' equity deductions, net of any tax effects. Minimum mandatory dividends are recognized as liabilities, as defined in the Company’s Bylaws.
c) Cash and cash equivalents
They include cash, bank deposits and highly liquid financial investments, originally due within three months from the contracting date or subject to immaterial risk of change in value, held to meet short-term cash commitments, and not for investment or other purposes.
d) Concessions’ financial assets
The Company recognizes a financial asset deriving from concession agreements when it has an unconditional right to receive cash or another financial asset from the granting authority or a party designated by it at the end of the concession, pursuant to the agreement, as an indemnification for the construction services performed and not received through the provision of services related to the concession. These financial assets are measured at fair value at initial recognition (NRV) and classified as available for sale. The Company adopted the bifurcated model to recognize the financial asset resulting from the indemnification by the granting authority and the right of exploration of the concession, which is classified under intangible assets.
e) Portion A and other financial items
As of the signature of amendment to the distribution concession agreement in December 2014, which ensured that balances from portion A and other financial items not recovered or refunded by tariff will be included in the calculation of indemnity at the end of concession, the Company recognized the amount of these balances which must be included in the next tariff adjustments against revenue. The

14
Portion A and other financial items are measured at fair value upon initial recognition and classified as loans and receivables. After initial recognition, the restatement of assets or liabilities related to this item is recognized in the financial income. When the amount is billed to consumers, the corresponding amount is amortized from the assets or liabilities balances against revenue.
f) Judgments and estimates The preparation of financial statements in accordance with IFRS and BR GAAP standards requires Management to make certain judgments, estimates and assumptions that affect the application of accounting policies and the reported amounts of assets, liabilities, revenues and expenses. Actual results may differ from these estimates. Estimates and assumptions are continuously reviewed. Reviews regarding accounting estimates are recognized in the fiscal year when the estimates are effectively reviewed and in any affected future years. Statements about assumptions and estimates that have a significant risk of resulting in material adjustments in the next financial year are included in the following Notes: Note 06 – Consumers, concessionaires, permissionaires and clients (allowance for doubtful accounts and revenue to be billed) Note 08 – Deferred taxes Note 09 – Portion A and other financial items Note 10 – Concessions’ financial assets Note 20 - Provisions Note 21 - Contingencies Note 22 - Post-employment benefits Note 29 – Net revenue (Unbilled revenue)
g) Consumers, concessionaries, permissionaires and clients
They include billed and unbilled electric power supply, default charges, interest on late payment and electricity traded with other concessionaries for electricity supply, according to the amounts available in the Electric Energy Commercialization Chamber (CCEE). The allowance for doubtful accounts is recorded based on the Management’s estimates in an amount sufficient to cover probable losses. The main criteria defined by the Company for consumers are: (i) for consumers with significant amounts, an analysis is conducted on the balance receivable taking into account the Company’s recovery track record, negotiations in progress and security interest; (ii)

15
for other consumers, 100% of balance is accrued for debts overdue by more than 90 days for residential consumers, more than 180 days for commercial consumers, or more than 360 days for other consumers. These criteria comply with those defined by ANEEL.
h) Inventories
Inventories are recorded at the average acquisition cost, less allowances for losses, when applicable, and do not exceed their replacement costs or realizable values. Materials in inventory are classified in Current Assets (maintenance and administration storeroom) and those allocated to investments, classified in Non-Current Assets – Property, Plant and Equipment or Intangible Assets (warehouse).
i) Investments
The financial statements of subsidiaries, jointly-controlled entities and associated companies are recognized in the individual financial statements of the parent company through the equity method. In the consolidated financial statements, investments in jointly-controlled entities and associated companies are accounted for by the equity method. The Company’s investments include the surplus value identified in the acquisition of interest, net of any accumulated impairment losses.
j) Property, plant and equipment
i. Recognition and measurement
They are measured at acquisition, formation or construction cost, less accumulated depreciation. Costs include expenses directly attributable to the acquisition of an asset. The costs of assets built by the Company itself include:
• The cost of materials and direct labor;
• Any other costs and conditions necessary to ensure that the asset is in place and prepared to operate as planned by Management;
• Costs of loans over qualifying assets.
When parts of an item of property, plant and equipment have different useful lives, these are recorded as individual items (main components) of property, plant and equipment.

16
Gains and losses on the disposal of an item of property, plant and equipment (determined by the difference between the resources deriving from its disposal and its book value) are recognized under other operating revenues/expenses in the income statement.
ii. Subsequent costs
Subsequent costs are capitalized to the extent that it is likely that future benefits associated with them will be earned by the Company. Recurring maintenance and repair costs are recorded in the income statement.
iii. Depreciation
Items of property, plant and equipment are depreciated by the straight-line method against the income statement, based on each component’s estimated economic useful life. For most property, plant and equipment items, the assets’ estimated economic useful lives are in line with those set forth by ANEEL, and land is not depreciated. For the property, plant and equipment items without indemnity guarantee, the items are depreciated under the straight-line method up to the authorization or concession limit or depreciated by the asset’s useful life, whichever is lower.
Items of property, plant and equipment are depreciated as of the date on which they are installed and become available for use, or, in the case of assets built by the Company, on the date when construction is completed and the asset becomes available for use.
The estimated useful lives for the current and comparative years are shown in Note 13. Any adjustments to the depreciation methods, useful lives or residual values are recognized as a change in accounting estimates.
k) Intangible assets
i. Concession agreements and infrastructure assets linked to the concession
The Company recognizes an intangible asset deriving from a concession agreement when it is entitled to charge for the use of the concession’s infrastructure or explore it. An intangible asset received as consideration for construction services provided in a concession agreement is measured at fair value upon initial recognition. Following initial recognition, the intangible asset is measured at cost, which includes capitalized loans, less accumulated amortization. The estimate of an intangible asset’s useful life in a concession agreement is
17
the period counted when the Company is capable of charging consumers for the use of infrastructure until the end of concession period.
ii. Research and Development
Expenditures in research activities, made with a possibility of gaining knowledge and scientific or technological understanding, are recognized in the income statement as incurred. Development activities involve a plan or project aiming at producing new or substantially enhanced products. Development expenditures are capitalized only if the development costs can be reasonably measured, if the product or process is technically and commercially viable, if future economic benefits are probable, and if the Company has the intention and enough resources to conclude the development and use or sell the asset. Capitalized expenditures include cost of materials, direct labor, manufacturing costs directly attributable to the preparation of the asset for its proposed use and cost of loans. Other development expenditures are recorded in the income statement as they are incurred. Capitalized development expenditures are measured at cost, less accumulated amortization and impairment losses, as applicable.
iii. Other intangible assets
Other intangible assets with finite useful lives are measured at cost, less accumulated amortization and losses from impairment, as applicable.
iv. Subsequent expenditures
Subsequent expenditures are capitalized only when they increase future economic benefits incorporated into the specific asset they relate to. All other expenditures are recognized in the income statement as incurred.
v. Amortization
Amortization is recognized in the income statement based on the straight-line method in view of estimated useful lives of intangible assets, from the date when they are available for use or for generation of related economic benefits. Estimated useful lives for current year are stated in Note 14. Amortization methods, useful lives and residual values are reviewed at the end of each financial year and are adjusted whenever it is adequate as change of accounting estimates.

18
l) Impairment
i. Financial assets (including receivables)
A financial asset not measured at fair value is evaluated at each reporting date to assess if there is objective evidence of loss in its recoverable value. An asset has loss in its recoverable value if objective evidence indicates that a loss event occurred after the initial recognition of the asset, and that such loss event has a negative effect on future projected cash flows, which can be reasonably estimated. The objective evidence that the financial assets have lost value might include default or late payment by the debtor, restructuring the amount due to the Company under conditions the Company usually would not consider in other transactions, indications that the debtor or issuer will face bankruptcy, or the disappearance of an active market for a security. Additionally, for an equity instrument, a significant or long decrease in its fair value below its cost is an objective evidence of impairment.
Financial assets measured at amortized cost
The Company considers evidences of impairment of assets measured at amortized cost either individually as collectively. All individually significant assets are assessed for impairment. All individually significant receivables identified as not suffering individual impairment are then collectively assessed regarding any other impairment not yet identified. Receivables that are not individually important are collectively assessed for impairment, by jointly grouping securities with similar risk characteristics. When collectively assessing impairment, the Company uses historical trends of probability of default, recovery term and incurred loss amounts, adjusted to reflect the Management’s judgment regarding assumptions, as current economic and credit conditions may be such that actual losses will be probably higher or lower than those suggested by historical trends. An impairment related to a financial asset measured at amortized cost is calculated as the difference between book value and present value of estimated future discounted cash flows at the original effective interest rate of the asset. Losses are recognized in the income statement and reflected in an account of allowance for receivables. Interest on impaired assets remains being recognized. When a subsequent event indicates reversal of the impairment, a decrease on impairment is reversed and recorded in the income statement.

19
Management has not identified any evidence that justifies the need to reduce the financial assets to their recoverable value as of December 31st, 2014 and 2013, except for the allowance for doubtful accounts and adjustment to the present value of receivables.
ii. Non-financial assets The book values of the Company’s non-financial assets, rather than inventories and deferred income tax and social contribution are reviewed every reporting date to check for impairment. If impairment occurs, then the asset’s recoverable value is estimated. In case of intangible assets with indefinite useful life, the recoverable value is estimated every year.
The impairment is recognized if the book value of an asset or cash generating unit (CGU) exceeds its recoverable value. The recoverable value of an asset or CGU is the highest amount between the value in use and fair value less selling expenses. When evaluating the value in use, estimated future cash flows are discounted at their present values through discount rate before taxes to reflect market’s current conditions as to recovery period of capital and specific risks of asset or CGU. In order to test for impairment, assets that cannot be individually tested are grouped to the smallest group of assets that generate continued use cash inflow which are mostly independent from cash flows of other assets or groups of assets (CGU). Impairment losses are recognized in the income statement. Impairment losses are only reversed when the asset’s book value does not exceed the book value calculated, net of depreciation or amortization, in case loss of value has not been recognized.
m) Benefits to employees
i. Defined contribution plans A defined contribution plan is a post-retirement benefit plan under which an entity pays fixed contributions to a separate entity (Pension Fund) and shall not have any legal or constructive obligation to pay for additional amounts. Liabilities for contributions to defined contribution pension plans are recorded as expenses with benefits to employees in the income statement in the periods during which services are rendered by employees. Contributions previously paid are recognized as assets under the condition that there is a cash reimbursement or a reduction in future payments is available.

20
ii. Defined benefit plans The net liability of the Company regarding defined benefit pension plans is individually calculated for each plan, by estimating the value of the future benefit the employees will earn in return of services rendered in current and previous years; the benefit is discounted to its present value. Any unrecognized past service costs and the fair values of any plan assets are deducted. The discount rate is the gains presented on the date of the financial statements for first line securities which due dates are close to the conditions of the liabilities of the Company and that are denominated in the same currency in which the benefits are expected to be paid. The calculation is made annually by a qualified actuary using the projected unit credit method. When the calculation results in a benefit for the Company, the asset to be recognized is limited to the total of any unrecognized past service costs and the present value of economic benefits available as future reimbursements of the plan or reduction in future contributions to the plan. To calculate the present value of the economic benefits, any minimum cost demands applicable to any plan in the Company are considered. An economic benefit is available to the Company if it is realizable throughout the life of the plan, or in the settlement of the liabilities of the plan. The liability recognized in the balance sheet is equivalent to the highest amount between the debt contracted with Fundação de Seguridade Social Braslight to amortize actuarial liabilities and the present value of net actuarial liabilities, as detailed in Note 22. The sponsorship costs of the pension plan and occasional plan deficits are immediately recognized in shareholders’ equity, in other comprehensive income. Actuarial gains and losses arising from adjustments and changes in actuarial premises of pension and retirement benefit plans are immediately recognized in shareholders’ equity, in other comprehensive income, and are not transferred to accumulated losses and retained earnings.
iii. Short term benefit to employees Short-term benefit liabilities to employees are measured on undiscounted basis and are recorded against expenses as the related service is rendered. The liability is recognized at the amount expected to be paid under the cash bonus or short-term profit sharing plans if the Company has a legal or

21
constructive obligation to pay this amount due to past services rendered by the employee and the liability can be reasonably estimated.
n) Provisions
A provision is recognized when the Company has a presumed or legal liability that can be reliably estimated as the result of a past event, and it is probable that an economic resource is required to settle the liability. Provisions are recorded based on the best estimates of risk involved and expected future cash flows. A provision for risks is recorded by evaluating and quantifying lawsuits, whose probability of loss is deemed as probable, in the opinion of the Management and its legal counsels.
o) Revenue recognition
Revenues are measured at fair value of the receivable or received counterpart, less taxes and discounts inherent to revenues.
i. Electricity sales revenues
These are recognized when there is conclusive evidence that most significant risks and benefits inherent to the assets’ ownership were transferred to the buyer, is probable that the economic benefit associated with transactions will flow to the Company and the amount of revenues can be reasonably measured. Traded electricity is monthly invoiced based on the electricity supply, according to amounts disclosed by the Electric Energy Commercialization Chamber (CCEE).
ii. Service Revenues
Revenues from services rendered are recognized in the income statement based on the stage of completion of services on the reporting date of the financial statements. The stage of completion is evaluated by referencing research of works performed.
iii. Construction Revenues
Contractual revenues comprise the initial value agreed upon in the agreement plus variations deriving from additional requests, complaints and payments of contractual incentives, subject to the condition that probably these will result in revenues and that can be reliably measured. As soon as a construction agreement can be reasonably estimated, the agreement’s revenue is recognized in the income statement to the extent of the agreement’s completion phase. Contractual expenses are recognized

22
when incurred, unless they generate an asset related to the forward agreement’s activity.
The completion phase is evaluated by referencing works conducted. When results of a construction agreement cannot be reliably measured, the agreement’s revenue is recognized until the limit of costs recognized subject to the condition that costs incurred can be recovered. Agreement’s losses are immediately recognized in the income statement. Revenue related to construction services and improvement of concession agreements is recognized based on the completion phase of work executed, compatible with the Company’s accounting policies for recognition of construction agreements’ revenues. Operation or service revenues are recognized in the year services are provided by the Company. When the Company provides more than one service in the concession agreement, the consideration received is allocated by reference to the fair value of services delivered when values are separately identifiable. For revenues and costs related to construction services or improvement of infrastructure used in electricity distribution services, the construction margin adopted is established as being equal to zero, considering that: (i) the main activity of the subsidiary is electricity distribution; (ii) every construction revenue is related to the construction of infrastructure to reach its main activity; and (iii) the Company outsources the construction of infrastructure with non-related parties. The totality of additions to intangible assets in process is monthly recorded in the income statement, as construction cost.
iv. Portion A and other financial items – Unbilled revenue
Revenue from Portion A and other financial items is recognized in the income statement when costs effectively incurred are different from those included in the energy distribution tariff. For more details, see Note 3.e.
p) Financial revenues and expenses
Financial revenues comprise interest income from financial investments, variations in the fair value of financial assets measured at fair value through profit and loss. Interest income is recognized in the income statement, through the effective interest rate method. Financial expenses comprise interest expenses over loans, present value discount adjustments and changes in the fair value of financial assets measured at fair value through profit and loss. Borrowing costs which are not directly attributable to
23
acquisition, construction or production of a qualifying asset are recorded at profit and loss through the effective interest rate method.
Exchange gains and losses are reported on a net basis. q) Income tax and social contribution
Current and deferred income tax and social contribution of the year are calculated based on 15% rates, plus 10% surcharge over the taxable income exceeding R$240 for income tax and 9% over the taxable income for social contribution on net income and consider social contribution tax loss carryforwards, restricted to 30% of taxable income. Income tax and social contribution expenses comprise current and deferred income taxes. Current and deferred taxes are recognized in the income statement unless these are related to items directly recognized in equity, in other comprehensive income.
Current tax is the tax payable on income or recoverable tax in the case of advances exceeding the taxable profit of the year, at tax rates decreed or substantially decreed on the reporting date of the financial statements and any adjustments to payable taxes related to previous years.
Deferred tax is recognized regarding temporary differences between fair value of assets and liabilities for accounting purposes and the corresponding values for taxation purposes, as well as regarding existing and recoverable balances of tax losses and social contribution tax loss carryforwards.
Deferred tax is measured by rates to be applied to temporary differences when they reverse, based on the laws that have been enacted or substantially enacted until the reporting date of the financial statements.
When calculating current and deferred income tax, the Company takes into account the impact of uncertainties related to tax positions assumed and if additional payment of income tax and interests has been made. The Company believes that the provision for income tax under liabilities is appropriate in relation to all outstanding tax periods based on its assessment of several factors, including tax laws interpretations and past experience. This evaluation is based on estimates and assumptions that may involve a series of judgments on future events. New information may be available, which would lead the Company to change its judgment as to the adequacy of current provision; these changes will impact income tax expense in the year they occur. Current and deferred tax assets and liabilities are offset if there is a legal right to offset current tax assets and liabilities, and they relate to income taxes charged by the same tax authority on the same entity subject to taxation.

24
A deferred income tax and social contribution asset is recognized by tax losses, tax credits and deductible temporary differences, not used when it is probable that future profits subject to taxation will be available and against which they shall be used.
Deferred income tax and social contribution assets are reviewed on each closing date and are reduced as their realization is no longer probable. As provided for by Law No. 11.941/09, the Company uses the Transition Tax Regime (RTT) to calculate taxable income, so that the changes in the criteria of recognition of revenues, costs and expenses comprised in the calculation of the net income for the year do not have material effects on the calculation of the taxable income of the entity subject to RTT, and for taxation purposes, the accounting methods and criteria in force on December 31st, 2007 shall be considered.
On November 11, 2013, Executive Order 627 (MP) was published revoking the Transitory Tax Regime and introducing other measures, including: (i) amendments to Decree-Law 1.598/77, which addresses the income tax of companies, and changes the legislation related to social contribution on net income; (ii) it establishes that the change to or the adoption of accounting methods and criteria, through administrative acts issued based on the authority assigned by commercial law, following the publication of this Executive Order, will not imply in the calculation of the federal taxes until the tax law regulates on such matter; (iii) it includes the specific treatment for the potential taxation of income or dividends; (iv) it includes a provision on the calculation of interest on equity; and (v) it includes considerations on investments measured by the equity method.
On May 14, 2014, the Federal Official Gazette of Brazil published the conversion of the MP into Law no. 12.973. The Law provisions enter into effect as of 2015, but said Law allows taxpayers to opt for their early adoption in 2014. The Company analyzed the possible effects of applying the provisions of Law no. 12.973 and concluded that it does neither result in relevant adjustments to the financial information as of December 31st, 2014, nor to the financial information ended December 31st, 2013. The Company decided not early adopting referred law in 2014.
r) Earnings per share
Basic earnings per share are calculated through profit or loss for the fiscal year attributable to the Company’s controlling shareholders and the weighted average number of shares in the respective fiscal year. Diluted earnings per share are
25
calculated through said average number of shares, adjusted by instruments potentially convertible into shares, with a diluting effect in the reported years.
s) Segment information
An operating segment is a component of the Company that develops business activities in which it can obtain revenues and incur in expenses, including revenues and expenses related to transactions with other components of the Company. All results from operating segments are frequently reviewed by the Management, in order to make decisions regarding the resources to be allocated to the segment and to assess their performance, and for this purpose individual financial information is available. The segment results reported to the Management include items directly attributable to the segment, as well as those that may be allocated reasonably.
t) Foreign currency
Transactions in foreign currency are converted to the functional currency of the Company at the exchange rates on the transaction dates. Monetary assets and liabilities denominated and calculated in foreign currencies are converted to the functional currency at the exchange rate of the reporting date. Gains and losses resulting from restatement of these assets and liabilities between the exchange rate in force on the transition date or at the year-beginning and year-end dates are recognized as financial revenues or expenses in the income statement.
u) Present value adjustment
The items subject to discount at present value are consumer, concessionaires, permissionaires and clients. The Company calculated the present value for balances with payment terms over 180 days. The discount rate used by Management for the discount at present value of these items is approximately 12.0% p.a., similar to the Company’s funding cost and the financial charges collected from its clients. Interest rates accumulated in a sales transaction are determined upon initial recording of transaction and are not subsequently adjusted.
v) Added value statement
The Company prepared individual and consolidated added value statements (DVA), which are presented as an integral part of the financial statements under BR GAAP applicable to publicly-held companies, whilst they represent, for IFRS, additional financial information.
w) Reclassifications in comparative balances

26
Management reassessed its criteria of stating the contractual debt amortization with the pension plan in the statement of cash flows, resulting in only one reclassification related to 2013 figures for comparison purposes.
i. Consolidated statement of cash flows for the fiscal year ended December 31st, 2013.
12.31.2013
PublishedReclassifications
12.31.2013
Restated
Net cash from operating activities 1,306,314 113,112 1,419,426
Cash generated by operations 1,874,881 - 1,874,881
Net income before income tax and social contribution 852,103 - 852,103
Allowance for doubtful accounts 157,884 - 157,884
Depreciation and amortization 390,940 - 390,940
Loss from the sale of intangible asset /property, plant and equipment 23,281 - 23,281
Foreign exchange and monetary losses from financial activities 138,622 - 138,622
Provisions for contingencies and judicial deposits /restatement 26,809 - 26,809
Adjustment to present value and prepayment of receivables 9,903 - 9,903
Interest expenses on loans and debentures 397,637 - 397,637
Charges and monetary variation of post-employment obligations 122,035 - 122,035
Swap variation (80,950) - (80,950)
Equity in the earnings (loss) of investments 5,454 - 5,454
Remuneration of the concession's financial assets (168,837) - (168,837)
(Increase)/Decrease in Assets and Liabilities (568,567) 113,112 (455,455)
Marketable securities (12,034) - (12,034)
Consumers, concessionaires and permissionaires 130,403 - 130,403
Taxes and contributions 15,285 - 15,285
Inventories 686 - 686
Receivables from services rendered 12,360 - 12,360
Prepaid expenses (13,846) - (13,846)
Escrow deposits (40,161) - (40,161)
Economic Development Account (CDE) subsidy - -
Other (72,536) - (72,536)
Suppliers 92,487 - 92,487
Estimated liabilities 19,750 - 19,750
Taxes and contributions 94,208 - 94,208
Regulatory charges (48,832) - (48,832)
Provisions (88,265) - (88,265)
Post-employment benefits (123,517) 113,112 (10,405)
Other liabilities (43,571) - (43,571)
Interests paid (389,825) - (389,825)
Income tax and social contributions paid (101,159) - (101,159)
Net cash used in investing activities (2,137,450) - (2,137,450)
Acquisition of property, plant and equipment (124,746) - (124,746)
Acquisition of intangible assets (705,423) - (705,423)
Investment acquisitions (90,581) - (90,581)
Financial investments (1,216,700) - (1,216,700)
Net cash generated by financing activities 1,147,209 (113,112) 1,034,097
Dividends and interest on equity paid (259,915) - (259,915)
Loans, financing and debentures 2,444,531 - 2,444,531
Amortization of loans, financing and debentures (1,037,407) - (1,037,407)
Amortization of contractual debt with pension plan - (113,112) (113,112)
Net increase in cash and cash equivalents 316,073 - 316,073
Cash and cash equivalents at the beginning of fiscal year 230,356 - 230,356
Cash and cash equivalents at the end of fiscal year 546,429 - 546,429

27
x) Rules and interpretations effective since January 1, 2014
Amendments to IFRS 10/CPC 36 (R3), IFRS 12/CPC 45 and IAS 27/CPC 35 (R2) – Investment entities – The amendments to IFRS 10/CPC 36 (R3) define an investment entity and require that an entity complying with the definition of Investment Entity does not consolidate its subsidiaries, but measure them at their fair value, reflected in the net income for the year in its individual and consolidated financial statements. As a result of the amendments to IFRS 10/CPC 36 (R3), IFRS 12/CPC 45 and IAS 27/CPC 35 (R2) were amended to introduce new reporting requirements for investment entities. As the Company is not an investment entity, no impact on these financial statements occurred.
IFRIC 21/ ICPC 19 – Taxes – provides guidance on when to recognize a liability for a tax established by government, both for taxes that are accounted for in accordance with IAS 37/CPC 25 - Provisions, Contingent Liabilities and Contingent Assets and those where the timing and amount of the tax is certain. This standard did not affect the Company.
IAS 36/CPC 01 – Impairment of assets – provides guidance on the disclosure of recoverable amounts of non-financial assets. These changes did not cause any relevant impact on these financial statements.
IAS 39/CPC 38 – Financial instruments: recognition and measurement – provides additional guidance by clarifying that there is no need to discontinue hedge accounting if the derivative instrument is renewed, provided that certain criteria are met. Since the Company does not adopt the hedge accounting policy, this standard has not affected these financial statements.
IAS 32/CPC 39 – Financial instruments: presentation – the amendments clarify the requirements related to the offset of financial assets with financial liabilities. This standard has not materially affected these financial statements. IAS 27/CPC 35 – Amendment to include the option of accounting for investments in subsidiaries, joint ventures and associated companies through the equity method in the individual financial statements. The amendment to IAS 27 has to be mandatorily adopted for the fiscal years beginning on or after January 1, 2016, and the early adoption is permitted. In order to reflect these amendments issued by IASB, the CPC 18, CPC 35 and CPC 37 pronouncements were reviewed by the Brazilian Accounting Pronouncements Committee, which was approved by the CVM in December 2014. It is worth noting that these amendments to referred accounting pronouncements have not affected the Company’s individual financial statements for the fiscal years ended December 31st, 2014 and 2013, as this practice has already been adopted in Brazil, as required by prevailing Brazilian corporation law.

28
y) New pronouncements issued and amendments to the standards, but not yet
effective as at December 31st, 2014, and not yet adopted IFRS 9 - Financial Instruments – A review of IFRS 9 was issued in July 2014 and mainly included impairment requirements for financial assets and limited changes to the classification and measurement requirements by introducing a measurement criterion at “fair value recognized through other comprehensive income” for certain simple debt instruments. No relevant impact is expected when this amendment becomes effective.
IFRS 15 – Revenue from Contracts with Customers – In May 2014, IFRS 15 was issued, establishing a simple and clear model for companies to adopt when accounting for revenue from contracts with customers. When IFRS 15 becomes effective, it will replace current guidelines on revenue recognition included in IAS 18/CPC 30 (R1) - Revenue, IAS 11/CPC 17 (R1) – Construction Contracts and related interpretations. The application of IFRS 15 may materially affect the financial information. However, we cannot provide a reasonable estimate without a detailed analysis. Amendments to IFRS 10/CPC 36 (R3) and IAS 28/CPC 18 (R2) – Consolidated Financial Statements and Investment in Associate Company, Subsidiary and Joint Ventures – These amendments clarify the treatment of sale or the entry of an investor’s assets to its affiliated company or joint venture, requiring full recognition in the investor’s financial information on the gains and losses resulting from the sale or entry of assets composing the business. No material impact is expected when this amendment becomes effective. Amendments to IFRS 11/CPC 19 (R2) – Joint Arrangements – The amendments to IFRS 11/CPC 19 (R2) provide instructions as to how to account for the acquisition of a joint arrangement representing a “business”, as defined by IFRS 3/CPC 15 (R1) – Business Combinations. Specifically, these amendments establish that the relevant principles to account for a business combination under IFRS 3/CPC 15 (R1) and other standards (such as IAS 36/CPC 01 (R1) - Impairment of Assets referring to the recoverability test of a cash-generating unit to which goodwill originated from the acquisition of a joint arrangement is allocated) shall apply. No material impact is expected when this amendment becomes effective. Amendments to IAS 16/CPC 27 and IAS 38/CPC 04 (R1) – Clarifications on the acceptable depreciation and amortization methods – the amendments to IAS 16/CPC 27 forbid companies to adopt the depreciation method based on revenue for property, plant and equipment items. The amendments to IAS 38/CPC 04 (R1) introduce the assumption that revenue is not an appropriate basis for calculating the amortization of an intangible asset. No material impact is expected when this amendment becomes effective.

29
Amendments to IAS 19/CPC 33 (R1) - Defined Benefit Pension Plan: Employee Contribution- The amendments to IAS 19 /CPC 33 (R1) clarify that an entity must account for contributions made by employees or third parties to defined benefit pension plans, these contributions rely on the number of years of services rendered by employee. No material impact is expected when this amendment becomes effective. Amendments to IAS 1/CPC 26 (R1) – Presentation of Financial Statements – This amendment aims at clarifying potential impediments identified when analyzing the preparation of the financial statements. This amendment clarifies that the concept of materiality should be considered for the financial statements to be disclosed, whether this is required or not, as to the numbering of the notes to the financial statements and the application of account aggregation criteria. No material impact is expected when this amendment becomes effective. Amendments to IFRS 10/CPC 36 (R3), IFRS 12/CPC 45 and IAS 28/CPC 18 (R2) – Consolidated Financial Statements and Investment in Associated Company, Subsidiary and Joint Ventures – This amendment aims at treating specific issues arisen within the context of application of consolidation exception for investment entities. No impact is expected from the application of this amendment. Annual improvements to IFRSs - 2010-2012 Cycle
• Amendments to IFRS 2/CPC 10: Amendments to the definition of vesting condition and market condition, besides adding the performance condition and service condition, which previously were included in the definition of vesting condition.
• Amendments to IFRS 3/CPC 15: Clarify that contingent considerations classified as assets or liabilities must be measured at fair value at each reporting date.
• Amendments to IFRS 8/CPC 22: It requires an entity discloses the judgments made by Management when applying the account aggregation criterion of operating segments, besides clarifying that the reconciliation between total assets of segments reported and the Company’s total assets must be made only if assets by segment are regularly used by the decision-making body.
• Amendments to the basis to conclude IFRS 13/CPC 46: Clarify that the issue of this IFRS does no exclude the possibility of measuring short-term receivables and liabilities without interest rates by the amount of trade bill, without discounts, if this discount causes immaterial effects.
• Amendments to IAS 16/CPC 27 and IAS 38/CPC 04: Remove inconsistencies seen in the accounting for accumulated depreciation and amortization
30
when an item of property, plant and equipment or intangible assets is re-measured. These amendments clarify that the gross carrying amount is adjusted consistently with the asset revaluation and the accumulated depreciation/amortization is the difference between the asset’s gross value and its value after considering accumulated impairment losses.
Material impacts are not expected from the application of any of the amendments described above. Annual improvements to IFRSs - 2011-2013 Cycle
• Amendments to IFRS 3/CPC 15: Clarify that the IFRS 3 shall not apply to the accounting for the creation of all types of joint arrangements in the joint venture’s financial statements.
• Amendments to IFRS 13/CPC 46: Clarify that the scope of exception alternatives to measure the fair value of a group of financial assets and liabilities on offset basis include all agreements within this scope or recorded pursuant to IAS 39/CPC 38 or IFRS 9, even if these agreements are not classified into the definition of financial assets or liabilities under IAS 32/CPC 39.
• Amendments to IAS 40/CPC 28: It clarifies that IAS 40/CPC 28 and IFRS 3/CPC 15 are not mutually exclusive and the application of both standards may be required.
We do not expect material impacts are not expected when the amendments described above become effective. Annual improvements to IFRSs - 2012-2014 Cycle
• Amendments to IFRS 5/CPC 31: It adds specific guidelines for the cases when an entity reclassifies an asset.
• Amendments to IFRS 7/CPC 40 (R1): Additional guidelines to clarify if a service agreement continues in a transferred asset and clarifications about the disclosures in condensed interim financial information.
• Amendments to IAS 9: It clarifies that first-tier corporate bonds used to estimate the discount rate of post-employment benefits must be denominated in the same currency of benefits to be paid.
• Amendments to IFRS 34: Clarify the meaning of "in other sections of the interim report” and require a cross-reference.

31
Material impacts are not expected when the amendments described above become effective.
4. CASH AND CASH EQUIVALENTS
12.31.2014 12.31.2013 12.31.2014 12.31.2013
Money available 287 235 21,677 50,431
Short-term financial investments
Bank deposit certificate (CDB) 14,125 26,567 379,461 495,998
TOTAL 14,412 26,802 401,138 546,429
Parent Company Consolidated
The short-term investments are highly liquid and convertible into know amounts cash and are subject to a floating rate represented by transactions purchased from financial institutions trading in the domestic financial market. These short-term investments have a daily repurchase commitment by the counterparty financial institution and the repurchase rate is previously agreed upon by the parties, and yield mostly according to the variation of the interbank deposit rate (CDI), with immaterial loss of value in case of early redemption. The average yield of the investments is 100.2% of the CDI on December 31st, 2014 (99.8% of the CDI on December 31st, 2013), The Company's exposure to interest rate risks and a sensitivity analysis of financial assets and liabilities are reported in Note 35. 5. MARKETABLE SECURITIES
These papers involve short-term bank deposit certificates (CDB) pos-fixed, in the amount of R$104,698 on December 31, 2014 (R$1,244,000 on December 31, 2013) in the consolidated financial statements. They are represented by: (i) surety bonds pledged in power auctions, (ii) proceeds from the sale of assets that were held for reinvestment in the electric grid system, (iii) funds allocated to prepayments of debts, and (iv) investments with mature longer than three months or longer with loss of value in case of early redemption. The average yield of these investments is 91.5% of the CDI on December 31, 2014 (99.8% of the CDI on December 31, 2013).

32
6. CONSUMERS, CONCESSIONAIRES, PERMISSIONAIRES AND CLIENTS
Current Non-current Total Current Non-current Total
Billed sales 1,265,411 - 1,265,411 1,097,252 - 1,097,252
Unbilled sales 421,689 - 421,689 317,007 - 317,007
Debt payment by installments 84,191 147,008 231,199 97,208 157,798 255,006
Short-term electric power - - - 19,164 - 19,164
Sales in the free market 146,404 - 146,404 138,834 - 138,834
Supply and charges related to use of electric network 16,398 - 16,398 14,299 - 14,299
Other receivables 1,730 64,539 66,269 1,210 51,616 52,826
1,935,823 211,547 2,147,370 1,684,974 209,414 1,894,388
(-) Allowance for doubtful accounts (555,144) - (555,144) (461,561) - (461,561)
TOTAL 1,380,679 211,547 1,592,226 1,223,413 209,414 1,432,827
12.31.2014 12.31.2013
Consolidated
An allowance for doubtful accounts was set up based on certain assumptions and in an amount deemed sufficient by Management to meet any asset realization losses. In 2014, bad debts were written-off in the amount of R$33,934 (R$418,228 in 2013). The write offs were realized against allowance for doubtful accounts already recorded, thus, not impacting the net income for the year. The balances of debt repayment facilities were adjusted to their present value, as applicable. The present value is determined for each relevant consumer debt renegotiation (debt repayment facilities) based on such interest rate as will reflect the term and risk associated with each individual transaction, on average 12% p.a.. Outstanding balances and receivables in connection with invoiced electric power sales and also debt repayment programs are summarized as follows:
BILLED SALES AND INSTALLMENT PAYMENTOverdue up to
90 days
Overdue over
90 days12.31.2014 12.31.2013 12.31.2014 12.31.2013
Residential 233,345 131,760 163,209 528,314 434,624 (153,396) (104,983)
Industrial 24,939 15,346 69,447 109,732 156,760 (71,594) (68,146)
Commercial 190,868 43,597 293,039 527,504 489,569 (252,410) (230,922)
Rural 1,385 492 410 2,287 1,888 (401) (519)
Public sector 87,481 45,835 113,579 246,895 208,579 (66,227) (45,031)
Public lighting 27,103 3,366 18,795 49,264 31,273 (6,204) (7,057)
Public utility 18,164 1,901 12,549 32,614 29,565 (4,912) (4,903)
TOTAL 583,285 242,297 671,028 1,496,610 1,352,258 (555,144) (461,561)
Allowance for doubtful accountsOverdue balancesMaturing
balance
TOTAL

33
Changes in consolidated Allowance for Doubtful Accounts - PCLD in the fiscal years:
BALANCE ON 01.01.2013 (721,905)
Additions/Reversals (157,884)
Write-offs 418,228
BALANCE ON 12.31.2013 (461,561)
Additions/Reversals (127,517)
Write-offs 33,934
BALANCE ON 12.31.2014 (555,144)
The Company’s exposure to credit risks related to consumers, concessionaires, permissionaires and clients is reported in Note 35. 7. RECOVERABLE TAXES
Current Non-current Total Current Non-current Total
TAXES AND CONTRIBUTIONS 89,657 89,233 178,890 105,821 88,777 194,598
ICMS to offset 66,082 88,171 154,253 70,275 88,777 159,052
PIS and COFINS to offset 4,259 - 4,259 15,782 - 15,782
Other 19,316 1,062 20,378 19,764 - 19,764 -
INCOME TAX AND SOCIAL CONTRIBUTION 30,556 - 30,556 55,140 - 55,140
Tax credits 30,147 - 30,147 28,170 - 28,170
Advances 409 - 409 26,970 - 26,970
TOTAL 120,213 89,233 209,446 160,961 88,777 249,738
Consolidated
12.31.2014 12.31.2013

34
8. DEFERRED TAXES
Deferred
assets
Deferred
liabilities
Deferred
net
Deferred
assets
Deferred
liabilities
Deferred
net
DEFERRED INCOME TAX AND SOCIAL CONTRIBUTION 751,461 (500,306) 251,155 856,258 (459,833) 396,425
Allowance for doubtful accounts 182,743 - 182,743 151,745 - 151,745
Provision for profit sharing 8,650 - 8,650 12,357 - 12,357
Provision for labor contingencies 52,525 - 52,525 54,343 - 54,343
Provision for tax contingencies 60,439 - 60,439 72,548 - 72,548
Provision for civil contingencies 50,973 - 50,973 56,486 - 56,486
Regulatory assets and liabilities not recognized under IFRS - - - 127,106 - 127,106
Pension plan complement - CVM 695/12 10,872 - 10,872 39,109 - 39,109
Other 69,083 - 69,083 17,760 - 17,760
Tax losses 230,257 - 230,257 236,601 - 236,601
Social contribution tax loss carryforwards 85,919 - 85,919 88,203 - 88,203
Remuneration of financial assets - (217,787) (217,787) - (194,536) (194,536)
Derivative financial instruments - (70,743) (70,743) - (43,386) (43,386)
Deemed cost - Light Energia - (211,776) (211,776) - (221,911) (221,911)
GROSS DEFERRED TAX ASSETS/(LIABILITIES) 751,461 (500,306) 251,155 856,258 (459,833) 396,425
Net amount (277,638) 277,638 - (233,423) 233,423 -
NET DEFERRED TAX ASSETS/(LIABILITIES) 473,823 (222,668) 251,155 622,835 (226,410) 396,425
Consolidated
12.31.2014 12.31.2013
Changes in deferred income tax for the fiscal years 2013 and 2014 are as follows:
Balance as of
01.01.2013
Recognized in
the income
statement
Recognized in
the
shareholders'
equity
Balance as of
12.31.2013
Recognized in
the income
statement
Recognized in
the
shareholders'
equity
Balance as of
12.31.2014
DEFERRED INOME TAX AND SOCIAL CONTRIBUTION - ASSETS
Allowance for doubtful accounts 238,440 (86,695) - 151,745 30,998 - 182,743
Provision for profit sharing 6,205 6,152 - 12,357 (3,707) - 8,650
Provision for labor contingencies 64,081 (9,738) - 54,343 (1,818) - 52,525
Provision for tax contingencies 69,728 2,820 - 72,548 (12,109) - 60,439
Provision for civil contingencies 62,512 (6,026) - 56,486 (5,513) - 50,973
Regulatory assets and liabilities not recognized under IFRS 143,423 (16,317) - 127,106 (127,106) - -
Pension plan complement - CVM 695/12 107,021 (13,022) (54,890) 39,109 (39,109) 10,872 10,872
Other 25,429 (10,594) 2,925 17,760 51,323 - 69,083
Tax losses 201,394 37,992 (2,785) 236,601 (6,344) - 230,257
Social contribution tax loss carryforwards 75,528 13,677 (1,002) 88,203 (2,284) - 85,919
TOTAL DEFERRED INOME TAX AND SOCIAL CONTRIBUTION - ASSETS 993,761 (81,751) (55,752) 856,258 (115,669) 10,872 751,461
DEFERRED INOME TAX AND SOCIAL CONTRIBUTION - LIABILITIES
Remuneration of financial assets (138,773) (55,763) - (194,536) (23,251) - (217,787)
Derivative financial instruments (19,585) (23,801) - (43,386) (27,357) - (70,743)
Deemed cost - Light Energia (233,275) 10,451 913 (221,911) 10,135 - (211,776)
TOTAL DEFERRED INCOME TAX AND SOCIAL CONTRIBUTION - LIABILITIES (391,633) (69,113) 913 (459,833) (40,473) - (500,306)
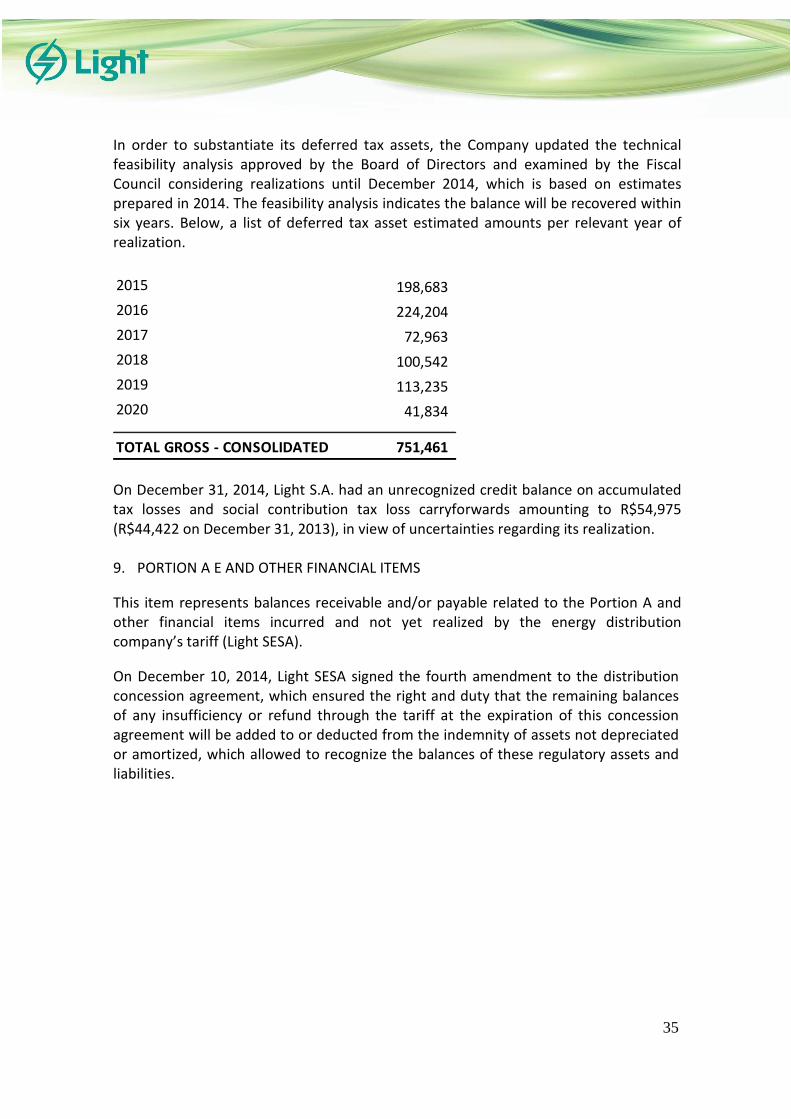
35
In order to substantiate its deferred tax assets, the Company updated the technical feasibility analysis approved by the Board of Directors and examined by the Fiscal Council considering realizations until December 2014, which is based on estimates prepared in 2014. The feasibility analysis indicates the balance will be recovered within six years. Below, a list of deferred tax asset estimated amounts per relevant year of realization.
2015 198,683
2016 224,204
2017 72,963
2018 100,542
2019 113,235
2020 41,834
TOTAL GROSS - CONSOLIDATED 751,461 On December 31, 2014, Light S.A. had an unrecognized credit balance on accumulated tax losses and social contribution tax loss carryforwards amounting to R$54,975 (R$44,422 on December 31, 2013), in view of uncertainties regarding its realization. 9. PORTION A E AND OTHER FINANCIAL ITEMS
This item represents balances receivable and/or payable related to the Portion A and other financial items incurred and not yet realized by the energy distribution company’s tariff (Light SESA).
On December 10, 2014, Light SESA signed the fourth amendment to the distribution concession agreement, which ensured the right and duty that the remaining balances of any insufficiency or refund through the tariff at the expiration of this concession agreement will be added to or deducted from the indemnity of assets not depreciated or amortized, which allowed to recognize the balances of these regulatory assets and liabilities.

36
Below, the breakdown of the balance of Portion A and other financial items recognized on December 31, 2014:
ASSETS LIABILITIES ASSETS LIABILITIES ASSETS LIABILITIES
Portion A items 549,409 (139,170) 361,585 (127,059) 910,994 (266,229)
Economic Development Account - CDE 23,033 - 9,022 - 32,055 -
Power acquisition costs 488,852 - 330,632 - 819,484 -
System Service Charges - ESS - (139,170) - (127,059) - (266,229)
Program to Electric Power Alternative Sources - PROINFA 7,729 - 147 - 7,876 -
Electric power transportation - Itaipu 681 - 766 - 1,447 -
Electric power transportation through basic network 29,114 - 21,018 - 50,132 -
Financial items 197,879 (30,660) 302,186 - 500,065 (30,660)
Other financial items 16,632 (16,140) - - 16,632 (16,140)
Involuntary exposure 132,355 - 256,743 - 389,098 -
Portion A neutrality - (14,520) - - - (14,520)
PIS/COFINS rate increase (Note 16) 48,892 - 45,443 - 94,335 -
GROSS REGULATORY ASSETS / (LIABILITIES) 747,288 (169,830) 663,771 (127,059) 1,411,059 (296,889)
Net amount (169,830) 169,830 (127,059) 127,059 (296,889) 296,889
TOTAL NET 577,458 - 536,712 - 1,114,170 -
Current Non-current Total
12.31.2014
10. CONCESSIONS’ FINANCIAL ASSETS
These represent the amounts receivable at the end of concession from the granting authority, or any of its agents, by way of compensation for investments made and not recovered through services rendered related to subsidiary Light SESA's concession. Below, the changes in the balances, net of special obligations, related to indemnifiable assets at the end of concession, in the following years:
BALANCE AS OF 01.01.2013 1,573,349
Additions (a) 195,988
New Replacement Value (NRV) 124,750
Adjustment to New Replacement Value (NRV) (b) 44,087
Write-offs (11,948)
BALANCE AS OF 12.31.2013 1,926,226
Additions (a) 453,599
Adjustment to New Replacement Value (NRV)(b) 68,385
Write-offs (1,767)
BALANCE AS OF 12.31.2014 2,446,443
(a) Transfer resulting from the bifurcation of assets after start-up, pursuant to IFRIC 12/ICPC 01 (see note 14). (b) IGPM on the indemnifiable Financial Asset approved in the last tariff revision process.
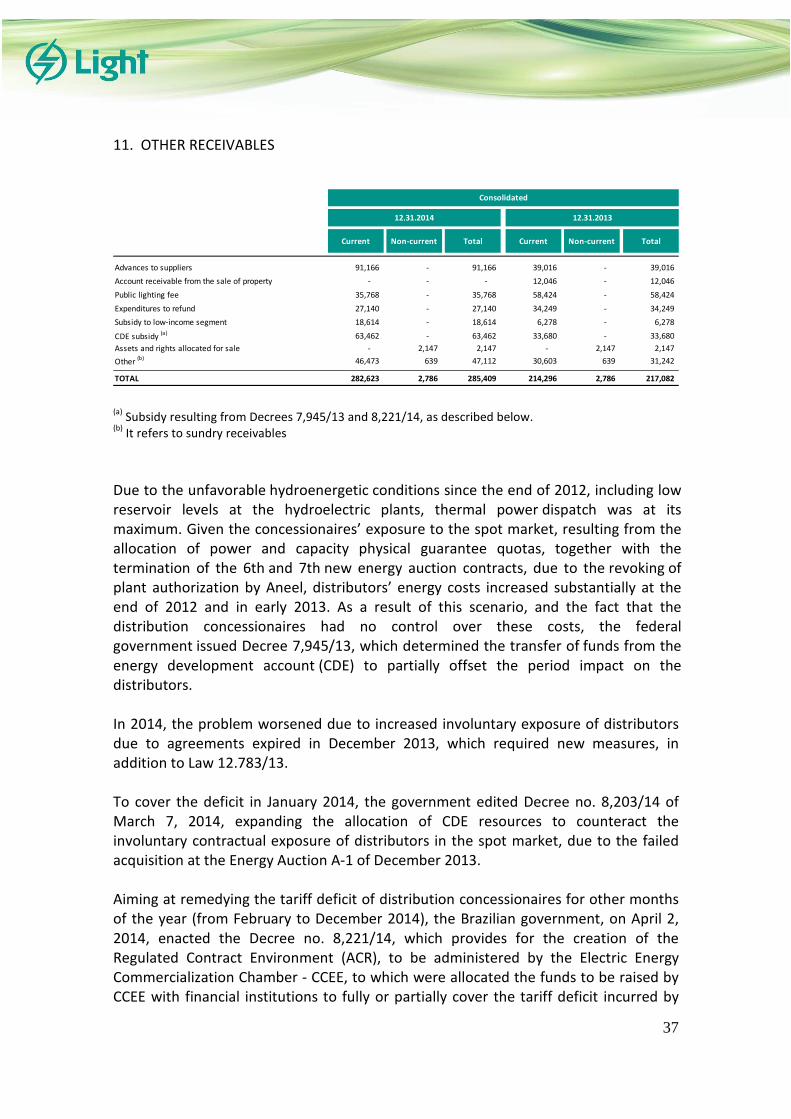
37
11. OTHER RECEIVABLES
Current Non-current Total Current Non-current Total
Advances to suppliers 91,166 - 91,166 39,016 - 39,016
Account receivable from the sale of property - - - 12,046 - 12,046
Public lighting fee 35,768 - 35,768 58,424 - 58,424
Expenditures to refund 27,140 - 27,140 34,249 - 34,249
Subsidy to low-income segment 18,614 - 18,614 6,278 - 6,278
CDE subsidy (a) 63,462 - 63,462 33,680 - 33,680
Assets and rights allocated for sale - 2,147 2,147 - 2,147 2,147
Other (b) 46,473 639 47,112 30,603 639 31,242
TOTAL 282,623 2,786 285,409 214,296 2,786 217,082
Consolidated
12.31.2014 12.31.2013
(a)
Subsidy resulting from Decrees 7,945/13 and 8,221/14, as described below. (b)
It refers to sundry receivables
Due to the unfavorable hydroenergetic conditions since the end of 2012, including low reservoir levels at the hydroelectric plants, thermal power dispatch was at its maximum. Given the concessionaires’ exposure to the spot market, resulting from the allocation of power and capacity physical guarantee quotas, together with the termination of the 6th and 7th new energy auction contracts, due to the revoking of plant authorization by Aneel, distributors’ energy costs increased substantially at the end of 2012 and in early 2013. As a result of this scenario, and the fact that the distribution concessionaires had no control over these costs, the federal government issued Decree 7,945/13, which determined the transfer of funds from the energy development account (CDE) to partially offset the period impact on the distributors. In 2014, the problem worsened due to increased involuntary exposure of distributors due to agreements expired in December 2013, which required new measures, in addition to Law 12.783/13. To cover the deficit in January 2014, the government edited Decree no. 8,203/14 of March 7, 2014, expanding the allocation of CDE resources to counteract the involuntary contractual exposure of distributors in the spot market, due to the failed acquisition at the Energy Auction A-1 of December 2013. Aiming at remedying the tariff deficit of distribution concessionaires for other months of the year (from February to December 2014), the Brazilian government, on April 2, 2014, enacted the Decree no. 8,221/14, which provides for the creation of the Regulated Contract Environment (ACR), to be administered by the Electric Energy Commercialization Chamber - CCEE, to which were allocated the funds to be raised by CCEE with financial institutions to fully or partially cover the tariff deficit incurred by

38
the energy distribution concessionaires due to: (i) involuntary exposure in the spot market; and (ii) dispatch of thermal plants linked to the Availability Agreements. In order to regulate said Decree, Aneel set up a Public Hearing (AP) no. 007/14, which disclosed, on April 16, 2014, the public hearing’s final results by means of the Technical Note 135/2014-SRE/Aneel and the approval of the Normative Resolution no. 612 of April 16, 2014. In accordance with the documents available, the proceeds deriving from CCEE loans are transferred to the distributors in their respective accounts for settlement in the spot market. In the future, the resources injected will be paid by captive consumers from 2015 tariff adjustments, incorporated into CDE, whose unit value will be consistent for all captive consumers in the country. The total amount recognized due to these regulations was R$1,669,156 in 2014 (R$801,058 in 2013). The effects of these items were recorded as energy cost reduction under electric power purchased for resale, against other receivables, in the income statement for the year, under CDE subsidy, as detailed in Note 32.

39
12. INVESTMENTS
12.31.2014 12.31.2013 12.31.2014 12.31.2013
Measured by the equity method: *
Light SESA 2,481,594 2,436,463 - -
Light Energia 777,818 707,236 - -
Renova Energia (b) - - 514,543 376,923
Guanhães Energia (a)(b) - - 86,766 86,766
Light Esco 100,826 104,339 - -
EBL Energia - - - 406
Lightcom 28,100 16,263 - -
Light Soluções 3,097 2,497 - -
Lightger 40,488 41,712 40,488 41,712
Itaocara Energia (a) 24,797 23,945 - -
Axxiom 24,598 8,207 24,598 8,207
Amazônia Energia (a) 138,631 106,380 138,631 106,380
SUBTOTAL 3,619,949 3,447,042 805,026 620,394
Goodwill from future profitability 2,034 2,034 2,034 2,034
Other permanent investments - - 19,587 19,775
SUBTOTAL 2,034 2,034 21,621 21,809
TOTAL INVESTMENTS 3,621,983 3,449,076 826,647 642,203
Parent Company Consolidated
(a)
Company at pre-operational stage (b)
Refers to investments calculated based on the adjusted shareholders’ equity for the purposes of equity in the earnings (losses) of investments. * E-Power, SPE Olímpica and Instituto Light did not record balances in the reported years.
• Capital increase and entry of Cemig GT into the controlling interest of Renova Energia
On October 27, 2014, Renova Energia’s Board of Directors’ Meeting approved the capital increase made by Cemig GT, which subscribed and fully paid 87,186,035 common shares of Renova, totaling R$1,550,071, R$810,129 of which by means of capitalization of advance for future capital increase (AFAC) made in Renova and R$739,943 fully paid through the assignment of the advance to future capital increase, made by Cemig GT in Chipley to Renova. Besides Cemig GT, other shareholders of Renova Energia exercised their preemptive right for 10,866 (including 655 unsold shares) common shares, totaling 87,196,901

40
subscribed and fully paid common shares. The subsidiary Light Energia did not exercise its preemptive right. After the approval of this new capital increase of Renova Energia, Light Energia’s interest percentage in Renova Energia declined from 21.9% to 15.9%. This operation generated in October 2014, a net gain of R$143,161 on the equity in the earnings of subsidiary Light Energia. Information on subsidiaries (consolidated) and jointly-controlled entities (equity income and proportional balances) is as follows:
12.31.2014 12.31.2013 12.31.2014 12.31.2013 12.31.2014 12.31.2013 12.31.2014 12.31.2013
Light SESA 100.0% 2,481,594 2,436,463 (82,906) - (201,005) (243,724) 349,076 386,391
Light Energia 100.0% 777,818 707,236 (66,917) (34,652) (163,752) (44,069) 267,670 199,185
Light Esco 100.0% 100,826 104,339 - (90) (1,511) (19,735) (2,091) 17,723
Lightcom 100.0% 28,100 16,263 - (1,035) (50,482) (319) 61,285 5,440
Light Soluções 100.0% 3,097 2,497 (329) (142) - (270) 787 596
Lightger 51.0% 40,488 41,712 - - (1,168) (1,584) (56) 953
Itaocara Energia 100.0% 24,797 23,945 - - - - (452) (621)
Axxiom 51.0% 24,598 8,207 - (234) - (146) (624) 987
Amazônia Energia 25.5% 138,631 106,380 - - - - (2,175) (1,192)
3,619,949 3,447,042 (150,152) (36,153) (417,918) (309,847) 673,420 609,462
12.31.2014 12.31.2013 12.31.2014 12.31.2013 12.31.2014 12.31.2013 12.31.2014 12.31.2013
Light Energia
Renova Energia 15.9% 402,137 220,123 - - - - 137,621 1,362
Guanhães Energia 51.0% 70,180 73,753 - - - 47,233 - -
Light Esco
EBL Energia 33.3% - 406 - - - - (147) 22
Lightger 51.0% 40,488 41,712 - - - - (56) 953
Axxiom 51.0% 24,598 8,207 - (234) - - (624) 987
Amazônia Energia 25.5% 138,631 106,380 - - - - (2,175) (1,192)
676,034 450,581 - (234) - 47,233 134,619 2,132
Parent Company
Consolidated
Subsidiaries and jointly-controlled
entities - Interest
Shareholders' equityDividends and interest on equity
receivable
Dividends and interest on equity
receivedIncome(loss) for the period
Jointly-controlled entities - Interest
Shareholders' equity Income(loss) for the periodFunds allocated to capital
increase
Dividends and interest on equity
receivable

41
Other information:
12.31.2014 12.31.2013 12.31.2014 12.31.2013
Light SESA 2,082,365 2,082,365 10,929,522 10,596,246
Light Energia 77,422 77,422 2,206,971 2,102,105
Light Esco 79,584 79,584 259,569 310,636
Lightcom 4,500 4,500 110,559 80,529
Light Soluções 1,350 1,350 4,331 3,629
Lightger 40,408 40,408 97,810 103,546
Itaocara Energia 30,865 29,562 27,832 27,137
Axxiom 8,772 6,987 42,697 21,273
Amazônia Energia 138,631 109,055 139,323 106,379
E-Power - 777 - 459
12.31.2014 12.31.2013 12.31.2014 12.31.2013
Light Energia
Renova Energia 407,480 214,574 885,159 810,226
Guanhães Energia 70,180 26,520 160,794 142,949
Light Esco
EBL Energia - 367 - 420
Lightger 40,408 40,408 97,810 103,546
Axxiom 8,772 6,987 42,697 21,273
Amazônia Energia 138,631 109,055 139,323 106,379
E-Power - 777 - 459
Parent Company
Subsidiaries and jointly-
controlled entities
Jointly-controlled entities
Paid-up capital
Paid-up capital Total Assets
Consolidated
Total Assets

42
Changes in subsidiaries (consolidated) and jointly- controlled entities (equity income) in the years 2014 and 2013:
12.31.2013 Capital increase
Dividends /
interest on
equity
Comprehensive
resultOther
Equity in the
earnings
(losses)
12.31.2014
Light SESA 2,436,463 - (283,911) (20,034) - 349,076 2,481,594
Light Energia 707,236 - (196,017) (1,070) (1) 267,670 777,818
Light Esco 104,339 - (1,422) - - (2,091) 100,826
Lightcom 16,263 - (49,447) - (1) 61,285 28,100
Light Soluções 2,497 - (187) - - 787 3,097
Lightger 41,712 - (1,168) - - (56) 40,488
Itaocara Energia 23,945 1,304 - - - (452) 24,797
Axxiom 8,207 16,779 236 - - (624) 24,598
Amazônia Energia 106,380 34,424 - - 2 (2,175) 138,631
TOTAL 3,447,042 52,507 (531,916) (21,104) - 673,420 3,619,949
01.01.2013 Capital increase
Dividends /
interest on
equity
Comprehensive
resultOther
Equity in the
earnings
(losses)
12.31.2013
Light SESA 2,188,815 - (230,847) 92,104 - 386,391 2,436,463
Light Energia 578,819 - (73,693) 2,925 - 199,185 707,236
Light Esco 108,904 - (18,853) 201 (3,636) 17,723 104,339
Lightcom 9,017 - (1,291) 11 3,086 5,440 16,263
Light Soluções 2,042 - (142) - 1 596 2,497
Lightger 41,909 - (1,188) - 38 953 41,712
Itaocara Energia 24,567 - - - (1) (621) 23,945
Axxiom 5,160 2,295 (234) - (1) 987 8,207
Amazônia Energia 69,576 37,996 - - - (1,192) 106,380
E-Power 132 - - - (132) - -
TOTAL 3,028,941 40,291 (326,248) 95,241 (645) 609,462 3,447,042
Parent Company
Parent Company

43
12.31.2013 Capital increase
Dividends /
interest on
equity
Gain on interest
dilutionOther
Equity in the
earnings
(losses)
12.31.2014
Light Energia
Renova Energia 376,923 - - 143,161 (3,807) (1,734) 514,543
Guanhães Energia 86,766 - - - - - 86,766
Light Esco
EBL Energia 406 - (259) - (147) - -
Lightger 41,712 - (1,168) - - (56) 40,488
Axxiom 8,207 16,779 - - 236 (624) 24,598
Amazônia Energia 106,380 34,424 - - 2 (2,175) 138,631
TOTAL 620,394 51,203 (1,427) 143,161 (3,716) (4,589) 805,026
01.01.2013 Capital increaseAcquisition of
interestOther
Equity in the
earnings
(losses)
12.31.2013
Light Energia
Renova Energia 381,383 - - (5,822) 1,362 376,923
Guanhães Energia 36,476 50,290 - - - 86,766
Light Esco
EBL Energia 712 - (201) (127) 22 406
Lightger 41,909 - (1,188) 38 953 41,712
Axxiom 5,160 2,295 (234) (1) 987 8,207
Amazônia Energia 69,576 37,996 - - (1,192) 106,380
E-Power 132 - - (132) - -
TOTAL 535,348 90,581 (1,623) (6,044) 2,132 620,394
Consolidated
Consolidated
Below, the full balances of the main jointly-controlled entities which were recorded under the equity method in the following years:
12.31.2014 AXXIOM AMAZÔNIA LIGHTGER RENOVA GUANHÃES
ASSETS
Current 72,434 593 20,575 692,655 1,159
Cash and cash equivalents 8,976 581 16,441 86,599 1,142
Other 63,458 12 4,134 606,056 17
Non-current 11,286 543,035 171,209 4,874,385 314,124
TOTAL ASSETS 83,720 543,628 191,784 5,567,040 315,283
LIABILITIES
Current 29,285 - 10,082 517,274 171,831
Loans, financing and debentures 6,103 - 7,148 356,326 170,716
Other 23,182 - 2,934 160,948 1,115
Non-current 6,205 - 102,314 2,515,436 5,844
Loans, financing and debentures 5,006 - 102,314 2,489,366 -
Other 1,199 - - 26,070 5,844
Shareholders' equity 48,230 543,628 79,388 2,534,330 137,608
TOTAL LIABILITIES AND SHAREHOLDERS' EQUITY 83,720 543,628 191,784 5,567,040 315,283

44
2014 AXXIOM AMAZÔNIA LIGHTGER RENOVA GUANHÃES
INCOME STATEMENT
Net revenue from sales 55,397 - 9,384 327,665 -
Cost of sales (46,144) - - (141,013) -
GROSS PROFIT 9,253 - 9,384 186,652 -
General and administrative expenses (6,736) (1,636) (2,108) (97,268) -
Equity in the earnings (losses) of subsidiaries - (6,919) - (24,842) -
Net financial result (920) 26 (5,664) (60,060) -
EARNINGS BEFORE INCOME TAX AND SOCIAL CONTRIBUTION 1,597 (8,529) 1,612 4,482 -
Income tax and social contribution 291 - (1,713) (15,407)
NET INCOME (LOSS) FOR THE YEAR 1,888 (8,529) (101) (10,925) -
12.31.2013 AXXIOM AMAZÔNIA LIGHTGER RENOVA GUANHÃES EBL
ASSETS
Current Assets 33,563 287 21,381 475,910 40,918 1,238
Cash and cash equivalents 10,045 275 17,703 374,047 39,283 918
Other 23,518 12 3,678 101,863 1,635 320
Non-current assets 8,149 416,890 181,651 3,230,523 239,374 34
TOTAL ASSETS 41,712 417,177 203,032 3,706,433 280,292 1,272
LIABILITUES
Current liabilities 15,040 - 11,352 1,409,536 130,368 41
Loans, financing and debentures 6,070 - 7,656 1,109,116 122,540 -
Other 8,970 - 3,696 300,420 7,828 41
Non-current liabilities 10,579 - 109,893 1,296,338 5,310 -
Loans, financing and debentures 10,012 - 109,893 1,281,140 - -
Other 567 - - 15,198 5,310 -
Shareholders' equity 16,093 417,177 81,787 1,000,559 144,614 1,231
TOTAL LIABILITIES AND SHAREHOLDERS' EQUITY 41,712 417,177 203,032 3,706,433 280,292 1,272
2013 AXXIOM AMAZÔNIA LIGHTGER RENOVA GUANHÃES EBL
STATEMENT OF INCOME
Net sales revenue 37,590 - 30,522 226,011 - 1,090
Cost of sales (27,752) - (18,810) (101,209) - (836)
GROSS PROFIT 9,838 - 11,712 124,802 - 254
General and administrative expenses (7,123) (635) (2,437) (36,341) - (202)
Equity income - (4,078) - - - -
Net financial result (2) 37 (6,371) (72,261) - 59
EARNINGS BEFORE INCOME TAX AND SOCIAL CONTRIBUTION 2,713 (4,676) 2,904 16,200 - 111
Income tax and social contribution (778) - (1,035) (9,970) - (45)
NET INCOME (LOSS) FOR THE YEAR 1,935 (4,676) 1,869 6,230 - 66
On December 31, 2014, the current liabilities of the indirect jointly-controlled entity Guanhães Energia exceeded its current assets, mainly due to delays in partial loans with the BNDES for the construction of projects. Guanhães Energia’s Management has been implementing initiatives to conclude the release of long-term financing with the BNDES and lengthening other debts.

45
a) Consortia
• Itaocara Hydroelectric Powerplant Consortium The Company, through the subsidiary Itaocara Energia, holds a 51% interest in the UHE Itaocara consortium, while Cemig Geração e Transmissão S.A. – Cemig GT holds the other 49.0%. The consortium aims to explore the Itaocara hydroelectric powerplant. Assets and liabilities balances referring to the participation in the Consortium are incorporated into the subsidiary’s balances. On December 28th, 2011, IBAMA granted the prior license and on July 29, 2013, Itaocara Hydroelectric Power Plant obtained the installation license allowing the beginning of works. On August 9, 2013, the subsidiary Itaocara Energia requested the termination of the Concession Agreement 12/2001 to ANEEL, as per Article 4 - A of Law 9.074/2005, introduced by Law 12.839/2013. The decision is based on the fact that the necessary time of revenue to obtain return on investment was jeopardized after 12 years of the concession term have elapsed before the release of the Installation Environmental License. Based on said Article, the Company understands that there will be no significant loss in the investments made in the project so far because it is entitled to the following rights: (i) the release of guarantees of compliance with obligations concerning the Concession Agreement; (ii) the non-payment for the Use of Public Asset; and (iii) the reimbursement for costs incurred in the preparation of studies or plans. The investments recorded as asset in Itaocara Energia are basically costs necessary to obtain the Previous Environmental License, the Installment Environmental License and the project’s feasibility. On November 26, 2013, the Ministry of Mines and Energy (MME) and the Itaocara Energia subsidiary entered into an instrument of termination for the Concession Agreement 12/2001-ANEEL, which governs the implementation and exploration of the Itaocara Hydroelectric Powerplant. Considering the above-mentioned return, the consortium reversed the obligation for the Use of Public Asset against the intangible assets recorded.
• Maracanã Solar Consortium The Company, through subsidiary Light Esco, holds a 51.0% interest in the Maracanã Solar consortium, whereas EDF Consultoria holds 49.0% interest. The consortium aims at the development, construction and operation of a photovoltaic plant with capacity of 391 kWp, installed on the top of the Maracanã stadium. The construction has been concluded in the second quarter of 2013. The original contract entered into with the State of Rio de Janeiro established the recovery of the invested amount through the sale of energy. In August 2013, the

46
Company signed an amendment with the state of Rio de Janeiro, changing the way the investment is to be recovered to the sale of quotas of the photovoltaic plant, through the Maracanã Solar seal. However, as the quotas are still under negotiation, Management has decided to record a provision for loss on property, plant and equipment, corresponding to the investments made by the Consortium in the amount of R$4,968 given that it did not have sufficient evidence on the recoverability of these assets on December 31, 2013.
• Água Limpa Hydroelectric Powerplant Consortium The Company, through its subsidiary Light Energia, is a party to the Água Limpa Hydroelectric Powerplant Consortium, in the state of Mato Grosso, with a 51.0% interest, and the other party is Cemig GT, with a 49.0% interest. The consortium’s purpose is to analyze participation in the project to implement, operate, maintain and commercially explore the project. There were no relevant expenses incurred until December 31s, 2014.
13. PROPERTY, PLANT AND EQUIPMENT
12.31.2013
Average
annual rateHistorical cost
Accumulated
depreciationNet value Net value
Generation 3.32 2,757,673 (1,643,710) 1,113,963 1,107,641
Transmission 3.91 57,984 (44,072) 13,912 14,588
Distribution 10.27 28,650 (26,715) 1,935 3,773
Administration 7.96 360,206 (194,425) 165,781 137,180
Sales 7.43 93,688 (11,991) 81,697 5,885
IN SERVICE 3,298,201 (1,920,913) 1,377,288 1,269,067
Generation 206,505 - 206,505 261,517
Administration 121,294 - 121,294 148,138
IN PROGRESS 327,799 - 327,799 409,655
TOTAL PROPERTY, PLANT AND EQUIPMENT 3,626,000 (1,920,913) 1,705,087 1,678,722
12.31.2014
Consolidated

47
The statement below summarizes the changes in property, plant and equipment:
Balance as of
12.31.2013Additions Write offs Transfer to Service
Balance as of
12.31.2014
PROPERTY, PLANT AND EQUIPMENT IN SERVICE
Cost
Land 104,976 - - - 104,976
Reservoir, dams and water mains 1,265,186 - - - 1,265,186
Buildings, works and improvements 268,130 - (4,288) 22,690 286,532
Machinery and equipment 1,327,711 - (1,680) 171,429 1,497,460
Vehicles 15,199 - (1,752) 606 14,053
Fixtures and furnishings 135,314 - (7,108) 1,788 129,994
TOTAL PROPERTY, PLANT AND EQUIPMENT IN SERVICE - COST 3,116,516 - (14,828) 196,513 3,298,201
(-) Depreciation
Reservoir, dams and water mains (819,640) (21,103) - - (840,743)
Buildings, works and improvements (163,967) (6,140) - - (170,107)
Machinery and equipment (733,890) (50,336) 1,281 - (782,945)
Vehicles (14,130) (423) 1,223 - (13,330)
Fixtures and furnishings (115,822) (5,041) 7,075 - (113,788)
TOTAL PROPERTY, PLANT AND EQUIPMENT IN SERVICE -
COST/DEPRECIATION(1,847,449) (83,043) 9,579 - (1,920,913)
PROPERTY, PLANT AND EQUIPMENT IN PROGRESS
Land 162 66 - - 228
Reservoir, dams and water mains 88,511 10,837 - (56,119) 43,229
Buildings, works and improvements 68,687 9,748 - (24,484) 53,951
Machinery and equipment 212,200 94,490 - (115,011) 191,679
Vehicles 183 443 - (606) 20
Fixtures and furnishings 946 741 - (293) 1,394
Studies and projects 38,966 1,295 (2,963) - 37,298
TOTAL PROPERTY, PLANT AND EQUIPMENT IN PROGRESS 409,655 117,620 (2,963) (196,513) 327,799
TOTAL PROPERTY, PLANT AND EQUIPMENT 1,678,722 34,577 (8,212) - 1,705,087
Consolidated

48
Balance as of
01.01.2013Additions Write offs Transfer to Service
Balance as of
12.31.2013
PROPERTY, PLANT AND EQUIPMENT IN SERVICE
Cost
Land 104,976 - - - 104,976
Reservoir, dams and water mains 1,254,194 - - 10,992 1,265,186
Buildings, works and improvements 261,085 - (3,627) 10,672 268,130
Machinery and equipment 1,330,508 - (41,287) 38,490 1,327,711
Vehicles 14,821 - (247) 625 15,199
Fixtures and furnishings 137,289 - (2,520) 545 135,314
TOTAL PROPERTY, PLANT AND EQUIPMENT IN SERVICE - COST 3,102,873 - (47,681) 61,324 3,116,516
(-) Depreciation
Reservoir, dams and water mains (798,588) (21,052) - - (819,640)
Buildings, works and improvements (161,883) (5,542) 3,458 - (163,967)
Machinery and equipment (729,075) (43,516) 38,701 - (733,890)
Vehicles (13,965) (412) 247 - (14,130)
Fixtures and furnishings (114,358) (3,984) 2,520 - (115,822)
TOTAL PROPERTY, PLANT AND EQUIPMENT IN SERVICE -
COST/DEPRECIATION(1,817,869) (74,506) 44,926 - (1,847,449)
PROPERTY, PLANT AND EQUIPMENT IN PROGRESS
Land 98 64 - - 162
Reservoir, dams and water mains 85,330 13,401 - (10,220) 88,511
Buildings, works and improvements 71,161 10,095 - (12,569) 68,687
Machinery and equipment 153,080 99,480 (4,018) (36,342) 212,200
Vehicles 777 163 - (757) 183
Fixtures and furnishings 2,018 364 - (1,436) 946
Studies and projects 37,787 1,179 - - 38,966
TOTAL PROPERTY, PLANT AND EQUIPMENT IN PROGRESS 350,251 124,746 (4,018) (61,324) 409,655
TOTAL PROPERTY, PLANT AND EQUIPMENT 1,635,255 50,240 (6,773) - 1,678,722
Consolidated
In 2014, R$3,686 (R$2,900 in 2013) was carried to property, plant and equipment as interest capitalization, with average capitalization rate of 8.0 % p.a.
(i) Annual depreciation rates:
The table below summarizes significant depreciation rates, based on the assets’ estimated useful lives and in line with ANEEL Resolution No. 474, of February 7, 2012:
GENERATION % SALES % ADMINISTRATION % TRANSMISSION %31.03.2
Dams 2.50 Buildings 3.33 Buildings 3.33 System conductor 2.70
Circuit breaker 3.03 General equipment 6.25 General equipment 6.25 General equipment 6.25
Buildings 3.33 Vehicles 14.29 Vehicles 14.29 System structure 2.70
Water intake equipment 3.70 Recloser 4.00
Water intake structure 2.86
Generator 3.33
Reservoirs, dams and water mains 2.00
Local communication system 6.67
Water turbine 2.50
The Company did not identify indicators of impairment of its property, plant and equipment in 2014. In 2013, the Company recognized provision for losses related to the assets of the photovoltaic plant of the Maracanã Solar Consortium. The concession agreements of the hydroelectric powerplants of subsidiary Light Energia establish that
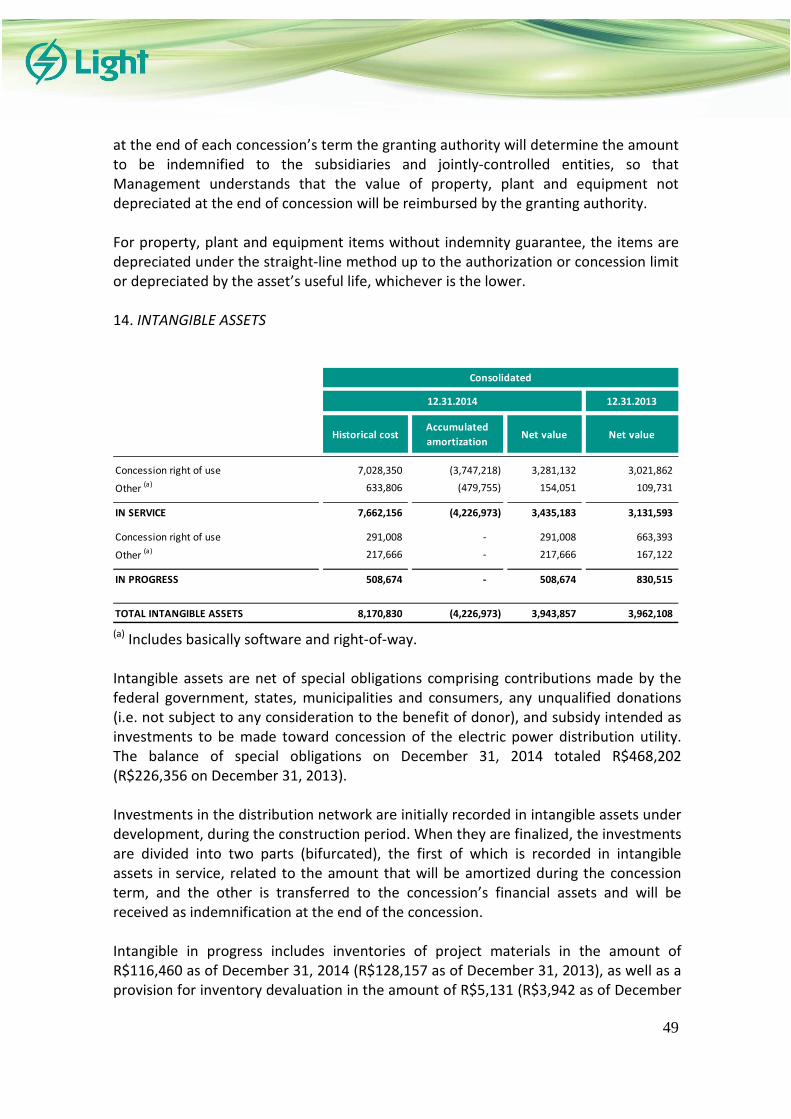
49
at the end of each concession’s term the granting authority will determine the amount to be indemnified to the subsidiaries and jointly-controlled entities, so that Management understands that the value of property, plant and equipment not depreciated at the end of concession will be reimbursed by the granting authority. For property, plant and equipment items without indemnity guarantee, the items are depreciated under the straight-line method up to the authorization or concession limit or depreciated by the asset’s useful life, whichever is the lower. 14. INTANGIBLE ASSETS
12.31.2013
Historical costAccumulated
amortizationNet value Net value
Concession right of use 7,028,350 (3,747,218) 3,281,132 3,021,862
Other (a) 633,806 (479,755) 154,051 109,731
IN SERVICE 7,662,156 (4,226,973) 3,435,183 3,131,593
Concession right of use 291,008 - 291,008 663,393
Other (a) 217,666 - 217,666 167,122
IN PROGRESS 508,674 - 508,674 830,515
TOTAL INTANGIBLE ASSETS 8,170,830 (4,226,973) 3,943,857 3,962,108
12.31.2014
Consolidated
(a) Includes basically software and right-of-way. Intangible assets are net of special obligations comprising contributions made by the federal government, states, municipalities and consumers, any unqualified donations (i.e. not subject to any consideration to the benefit of donor), and subsidy intended as investments to be made toward concession of the electric power distribution utility. The balance of special obligations on December 31, 2014 totaled R$468,202 (R$226,356 on December 31, 2013). Investments in the distribution network are initially recorded in intangible assets under development, during the construction period. When they are finalized, the investments are divided into two parts (bifurcated), the first of which is recorded in intangible assets in service, related to the amount that will be amortized during the concession term, and the other is transferred to the concession’s financial assets and will be received as indemnification at the end of the concession. Intangible in progress includes inventories of project materials in the amount of R$116,460 as of December 31, 2014 (R$128,157 as of December 31, 2013), as well as a provision for inventory devaluation in the amount of R$5,131 (R$3,942 as of December

50
31, 2013). The Company has not identified signs of impairment of its other intangible assets.
A total amount of R$28,170 (R$21,368 in the fiscal year of 2013) was carried to intangible assets in 2014 as interest capitalization, with an average capitalization rate of 8.4% p.a. The infrastructure used by subsidiary Light SESA is associated with the distribution service, and therefore cannot be removed, disposed of, assigned, conveyed, or encumbered as mortgage collateral without the prior written authorization of the granting authority, which authorization, if given, is regulated by Resolution ANEEL No. 20/99. Below is the summary of changes in the intangible assets:
Balance as of
12.31.2013Additions Write offs
Inter-account
transfers (a)
Balance as of
12.31.2014
IN SERVICE
Concession right of use 6,511,987 - (39,867) 556,230 7,028,350
Other 552,062 - (402) 82,146 633,806
TOTAL INTANGIBLE ASSETS IN SERVICE 7,064,049 - (40,269) 638,376 7,662,156
(-) Amortization
Concession right of use (3,490,125) (293,569) 36,476 - (3,747,218)
Other (442,331) (37,822) 398 - (479,755)
TOTAL INTANGIBLE ASSET IN SERVICE/AMORTIZATION (3,932,456) (331,391) 36,874 - (4,226,973)
IN PROGRESS
Concession right of use 663,393 696,294 - (1,068,679) 291,008
Other 167,122 73,840 - (23,296) 217,666
TOTAL INTANGIBLE ASSET IN PROGRESS 830,515 770,134 - (1,091,975) 508,674
TOTAL 3,962,108 438,743 (3,395) (453,599) 3,943,857
Consolidated
(a) Transfer to Concession’s Financial Asset, as a result of the split of assets upon startup, pursuant to IFRIC 12/ICPC 01, see Note 10.

51
Balance as of
01.01.2013Additions Write offs
Inter-account
transfers (a)
Balance as of
12.31.2013
IN SERVICE
Concession right of use 6,684,736 - (507,518) 334,769 6,511,987
Other 523,711 - (20,629) 48,980 552,062
TOTAL INTANGIBLE ASSETS IN SERVICE 7,208,447 - (528,147) 383,749 7,064,049
(-) Amortization
Concession right of use (3,699,954) (281,374) 491,203 - (3,490,125)
Other (428,162) (34,605) 20,436 - (442,331)
TOTAL INTANGIBLE ASSET IN SERVICE/AMORTIZATION (4,128,116) (315,979) 511,639 - (3,932,456)
IN PROGRESS
Concession right of use 465,991 733,705 - (536,303) 663,393
Other 202,316 8,240 - (43,434) 167,122
TOTAL INTANGIBLE ASSET IN PROGRESS 668,307 741,945 - (579,737) 830,515
TOTAL 3,748,638 425,966 (16,508) (195,988) 3,962,108
Consolidated
(a) Transfer to Concession’s Financial Asset, as a result of the split of assets upon startup, pursuant to IFRIC 12/ICPC 01, see Note 10.
It is the responsibility of ANEEL to determine the estimated economic useful lives of each piece of distribution infrastructure assets for pricing purposes, as well as for the purpose of calculating the amount of the relevant compensation payable upon expiration of the concession term. This estimate is revised from time to time, represents the best estimate concerning the assets' useful lives, and is used for accounting and regulatory purposes. Management understands that amortization of the concession's right of use must be consistent with the return expected on each infrastructure asset, via the applicable rates. Thus, intangible assets are amortized over the expected length of such return, limited to the term of the concession.
Below, the main amortization rates, in accordance with ANEEL Resolution No. 474, of February 7, 2012, are as follows:
DISTRIBUTION %
Capacitor bank 6.67
Switchboard 6.67
System conductor 3.57
Circuit breaker 3.03
Buildings 3.33
System structure 3.57
Meter 6.77
Voltage regulator 4.35
Recloser 4.00
Transformer 4.00

52
15. SUPPLIERS
CURRENT 12.31.2014 12.31.2013
Sales in the short-term market (1) 629,166 221,388
Electric network usage charges 40,050 24,857
System service charges 2,215 2,215
Free energy – refund to generation companies 69,360 62,541
Electric power auctions (1) 207,290 146,613
Itaipu binational 151,097 114,837
UTE Norte Fluminense 104,304 95,473
Supplies and services 356,908 239,338
TOTAL 1,560,390 907,262
Consolidated
(1) Includes the distributor’s involuntary exposure due to unfavorable hydroenergetic conditions, see Note 11.
The Company’s exposure to credit risks related to suppliers is reported in Note 35.

53
16. TAXES PAYABLE
Current Non-current Total Current Non-current Total
TAXES AND CONTRIBUTIONS 253,571 232,525 486,096 115,102 187,640 302,742
ICMS payable 114,775 - 114,775 26,261 - 26,261
Payment in installments - Law 11,941/09 19,932 187,082 207,014 22,708 187,640 210,348
PIS and COFINS payable 57,761 - 57,761 54,106 - 54,106
Deferred PIS and COFINS (1) 48,892 45,443 94,335
INSS 2,955 - 2,955 4,566 - 4,566
Other 9,256 - 9,256 7,461 - 7,461 -
INCOME TAX AND SOCIAL CONTRIBUTION 35,548 - 35,548 83,516 - 83,516
Withheld income tax payable 574 - 574 543 - 543
Provision for income tax/social contribution 34,974 - 34,974 82,973 - 82,973
TOTAL 289,119 232,525 521,644 198,618 187,640 386,258
Consolidated
12.31.2014 12.31.2013
(1) Refers to PIS and COFINS deriving from unbilled revenue of Portion A and other financial items, see Note 9.

52
17. LOANS AND FINANCING
Principal Charges Total Principal 12.31.2014 12.31.2013
TN - Par Bond - 1,335 1,335 103,378 104,713 92,351
TN - Surety - Par Bond - - - (82,815) (82,815) (65,884)
TN - Discount Bond - 214 214 72,134 72,348 63,823
TN - Surety - Discount Bond - - - (57,881) (57,881) (46,194)
TN - C. Bond - - - - - 3,941
4131 Merril Lynch 51,132 297 51,429 47,812 99,241 117,468
4131 BNP - - - - - 114,593
4131 Citibank 2012 - 531 531 265,620 266,151 234,710
4131 Citibank 2014 - 463 463 265,620 266,083 -
4131 Bank Tokyo 2013 - 189 189 159,372 159,561 140,715
4131 Bank Tokyo 2014 - 136 136 53,124 53,260 -
4131 Itaú 68,482 78 68,560 - 68,560 -
4131 Citibank - Light Energia - 974 974 212,496 213,470 188,274
4131 BNP - Light Energia - 613 613 163,335 163,948 -
4131 Itaú - Light Energia - 167 167 132,936 133,103 -
TOTAL FOREIGN CURRENCY 119,614 4,997 124,611 1,335,131 1,459,742 843,797
ELETROBRAS - LUZ PARA TODOS 207 - 207 379 586 637
ELETROBRAS - PRONI 1 - 1 - 1 1
ELETROBRAS - RELUZ 1,183 - 1,183 4,337 5,520 6,004
CCB Bradesco 75,000 5,884 80,884 150,000 230,884 306,493
CCB Santander - - - - - 82,742
CCB Banco do Brasil - 6,477 6,477 150,000 156,477 155,348
BNDES - CAPEX 2009/10 SUB A 28,193 214 28,407 37,591 65,998 110,870
BNDES - CAPEX 2009/10 SUB B 28,193 242 28,435 37,591 66,026 110,915
BNDES - CAPEX 2009/10 SUB C 11,938 111 12,049 44,769 56,818 95,449
BNDES - CAPEX 2009/10 SUB D 25 - 25 34 59 100
BNDES - CAPEX 2009/10 SUB E 25 - 25 34 59 100
BNDES - CAPEX 2009/10 SUB N 52 - 52 69 121 205
BNDES - CAPEX 2009/10 SUB O 52 - 52 69 121 205
BNDES - CAPEX 2009/10 SUB P 180 1 181 241 422 710
BNDES - CAPEX 2009/10 SUB Q 180 2 182 241 423 710
BNDES - CAPEX 2011/12 SUB 1 717 7 724 2,330 3,054 3,762
BNDES - CAPEX 2011/12 SUB 2 34,989 437 35,426 113,714 149,140 183,758
BNDES - CAPEX 2011/12 SUB 3 42,070 569 42,639 136,724 179,363 220,999
BNDES - CAPEX 2011/12 SUB 4 42,070 615 42,685 136,261 178,946 220,485
BNDES - CAPEX 2011/12 SUB 13 - - - 1 1 1
BNDES - CAPEX 2011/12 SUB 14 - - - 1 1 1
BNDES - CAPEX 2011/12 SUB 17 4 - 4 14 18 22
BNDES - CAPEX 2011/12 SUB 18 4 - 4 14 18 22
BNDES - CAPEX 2013/14 SUB A 22,323 745 23,068 156,264 179,332 -
BNDES - CAPEX 2013/14 SUB B 13,728 155 13,883 62,810 76,693 -
BNDES - CAPEX 2013/14 SUB C 7,527 302 7,829 86,978 94,807 -
BNDES - CAPEX 2013/14 SUB D 490 16 506 3,433 3,939 -
BNDES - CAPEX 2013/14 SUB E 302 3 305 1,380 1,685 -
BNDES - 2013/16 OLYMPICS SUB A 3,246 68 3,314 16,230 19,544 -
BNDES - 2013/16 OLYMPICS SUB B 3,246 77 3,323 16,230 19,553 -
BNDES - 2013/16 OLYMPICS SUB C 2,597 95 2,692 12,984 15,676 -
BNDES - 2013/16 OLYMPICS SUB D - 11 11 2,615 2,626 -
BNDES - 2013/16 OLYMPICS SUB E - 12 12 2,615 2,627 -
BNDES - 2013/16 OLYMPICS SUB F - 15 15 2,092 2,107 -
BNDES - 2013/16 OLYMPICS SUB G - 4 4 2,531 2,535 -
FINEP - Research and innovation - 246 246 141,088 141,334 -
BNDES - CAPEX 2009/10 SUB A - Light Energia 1,201 9 1,210 1,601 2,811 3,880
BNDES - CAPEX 2009/10 SUB B - Light Energia 1,201 10 1,211 1,601 2,812 3,882
BNDES - CAPEX 2009/10 SUB C - Light Energia 742 7 749 2,782 3,531 4,874
BNDES - CAPEX 2011/12 SUB 1 - Light Energia 4,365 42 4,407 9,821 14,228 19,642
BNDES - CAPEX 2011/12 SUB 2 - Light Energia 2,600 25 2,625 5,851 8,476 11,702
BNDES PROESCO 11,572 153 11,725 50,866 62,591 26,586
RGR - 246 246 - 246 246
Sundry bank guarantees - 546 546 - 546 819
TOTAL DOMESTIC CURRENCY 340,223 17,346 357,569 1,394,186 1,751,755 1,571,170
TOTAL 459,837 22,343 482,180 2,729,317 3,211,497 2,414,967
Current Non-current Total
Consolidated

53
The statement below summarizes the contractual terms and conditions applicable to our loans and financing as of December 31, 2014:
Financing EntityDate of
signatureCurrency
Interest rate
p.a.Effective rate Beginning Payment End
TN - Par Bond 4/29/1996 US$ 83.29% CDI 8.89% 2024 Lump sum 2024
TN - Surety - Par Bond 4/29/1996 US$ U$ Treasury 0.00% 2024 Lump sum 2024
TN - Discount Bond 4/29/1996 US$ 82.65% CDI 8.82% 2024 Lump sum 2024
TN - Surety - Discount Bond 4/29/1996 US$ U$ Treasury 0.00% 2024 Lump sum 2024
TN - C. Bond 4/29/1996 US$ 8.0% 8,0% 2004 Half-yearly 2014
4131 Merrill Lynch 11/7/2011 US$ CDI + 0.65% 11.49% 2014 Half-yearly 2016
4131 BNP 10/17/2011 EURO CDI + 1.3% 12.21% 2014 Lump sum 2014
4131 Citibank 2012 8/23/2012 US$ CDI + 1.0% 11.88% 2017 Half-yearly 2018
4131 Citibank 2014 2/21/2014 US$ CDI + 1.15% 12.04% 2018 Lump sum 2018
4131 Bank Tokyo 2013 3/11/2013 US$ CDI + 0.90% 11.77% 2016 Lump sum 2016
4131 Bank Tokyo 2014 11/19/2014 US$ CDI + 0.88% 11.74% 2017 Lump sum 2017
4131 Itaú 12/11/2014 US$ CDI + 1.5% 12.43% 2015 Lump sum 2015
4131 Citibank - Light Energia 10/2/2012 US$ CDI + 1.1% 11.99% 2017 Half-yearly 2018
4131 BNP - Light Energia 10/22/14 EURO CDI + 1.4% 12.32% 2016 Lump sum 2016
4131 Itaú - Light Energia 12/11/2014 US$ CDI + 1.75% 12.71% 2016 Lump sum 2016
ELETROBRAS - LUZ PARA TODOS 6/30/2008 R$ 5.0% 5.00% 2008 Monthly 2017
ELETROBRAS - PRONI 5/15/2008 R$ 8.0% 8.00% 2008 Quarterly 2015
ELETROBRAS - RELUZ 3/22/2010 R$ 5.0% 5.00% 2014 Monthly 2019
CCB Bradesco 10/18/2007 R$ CDI + 0.85% 11.71% 2012 Annual 2017
CCB Santander 9/3/2010 R$ CDI + 1.4% 12.32% 2014 Lump sum 2014
CCB Banco do Brasil 2/25/2013 R$ 109.3% of CDI 11.83% 2017 Lump sum 2017
BNDES - CAPEX 2009/10 SUB A 11/30/2009 R$ 4.5% 4,5% 2011 Monthly 2019
BNDES - CAPEX 2009/10 SUB B 11/5/2007 URTJLP TJLP + 3.08% 8,08% 2009 Monthly 2017
BNDES - CAPEX 2009/10 SUB C 11/30/2009 R$ 4.5% 4.50% 2011 Monthly 2019
BNDES - CAPEX 2009/10 SUB D 11/30/2009 URTJLP TJLP + 2.58% 7.58% 2011 Monthly 2017
BNDES - CAPEX 2009/10 SUB E 11/30/2009 URTJLP TJLP + 3.58% 8.58% 2011 Monthly 2017
BNDES - CAPEX 2009/10 SUB N 11/30/2009 URTJLP TJLP + 2.58% 7.58% 2011 Monthly 2017
BNDES - CAPEX 2009/10 SUB O 11/30/2009 URTJLP TJLP + 3.58% 8.58% 2011 Monthly 2017
BNDES - CAPEX 2009/10 SUB P 11/30/2009 URTJLP TJLP + 2.58% 7.58% 2011 Monthly 2017
BNDES - CAPEX 2009/10 SUB Q 11/30/2009 URTJLP TJLP + 3.58% 8.58% 2011 Monthly 2017
BNDES - CAPEX 2011/12 SUB 1 12/6/2011 URTJLP TJLP 5.00% 2013 Monthly 2019
BNDES - CAPEX 2011/12 SUB 2 12/6/2011 URTJLP TJLP + 1.81% 6.81% 2013 Monthly 2019
BNDES - CAPEX 2011/12 SUB 3 12/6/2011 URTJLP TJLP + 2.21% 7.21% 2013 Monthly 2019
BNDES - CAPEX 2011/12 SUB 4 12/6/2011 URTJLP TJLP + 3.21% 8.21% 2013 Monthly 2019
BNDES - CAPEX 2011/12 SUB 13 12/6/2011 URTJLP TJLP + 2.21% 7.21% 2013 Monthly 2019
BNDES - CAPEX 2011/12 SUB 14 12/6/2011 URTJLP TJLP + 3.21% 8.21% 2013 Monthly 2019
BNDES - CAPEX 2011/12 SUB 17 12/6/2011 URTJLP TJLP + 2.21% 7.21% 2013 Monthly 2019
BNDES - CAPEX 2011/12 SUB 18 12/6/2011 URTJLP TJLP + 3.21% 8.21% 2013 Monthly 2019
BNDES - CAPEX 2013/14 SUB A 11/28/2014 R$ SELIC + 2.78% 13.94% 2015 Monthly 2021
BNDES - CAPEX 2013/14 SUB B 11/28/2014 R$ 2.8% 2.78% 2015 Monthly 2021
BNDES - CAPEX 2013/14 SUB C 11/28/2014 R$ 6.0% 6.00% 2015 Monthly 2021
BNDES - CAPEX 2013/14 SUB D 11/28/2014 URTJLP TJLP + 2.78% 7.78% 2015 Monthly 2021
BNDES - CAPEX 2013/14 SUB E 11/28/2014 R$ SELIC + 2.78% 13.94% 2015 Monthly 2021
BNDES - 2013/16 OLYMPICS SUB A 12/16/2013 URTJLP TJLP + 2.58% 7.58% 2015 Monthly 2020
BNDES - 2013/16 OLYMPICS SUB B 12/16/2013 URTJLP TJLP + 3.58% 8.58% 2015 Monthly 2020
BNDES - 2013/16 OLYMPICS SUB C 12/16/2013 R$ SELIC + 2.58% 13.72% 2015 Monthly 2020
BNDES - 2013/16 OLYMPICS SUB D 12/16/2013 URTJLP TJLP + 2.58% 7.58% 2016 Monthly 2020
BNDES - 2013/16 OLYMPICS SUB E 12/16/2013 URTJLP TJLP + 3.58% 8.58% 2016 Monthly 2020
BNDES - 2013/16 OLYMPICS SUB F 12/16/2013 R$ SELIC + 2.58% 13.72% 2016 Monthly 2020
BNDES - 2013/16 OLYMPICS SUB G 12/16/2013 R$ 3.5% 3.50% 2016 Monthly 2023
FINEP - Research and innovation 4/16/2014 R$ 4.0% 4.00% 2016 Monthly 2022
BNDES - CAPEX 2009/10 SUB A - Light Energia 11/30/2009 URTJLP TJLP + 2.58% 7.58% 2011 Monthly 2017
BNDES - CAPEX 2009/10 SUB B - Light Energia 11/30/2009 URTJLP TJLP + 3.58% 8.58% 2011 Monthly 2017
BNDES - CAPEX 2009/10 SUB C - Light Energia 11/30/2009 URTJLP 4.5% 4.50% 2011 Monthly 2019
BNDES - CAPEX 2011/12 SUB 1 - Light Energia 4/10/2012 URTJLP TJLP + 1.81% 6.81% 2013 Monthly 2018
BNDES - CAPEX 2011/12 SUB 2 - Light Energia 4/10/2012 URTJLP TJLP + 1.81% 6.81% 2013 Monthly 2018
BNDES PROESCO 9/16/2008 R$/URTJLP TJLP + 0.70% 5.70% 2009 Monthly 2023
Principal amortization
Below, main funding and amortizations in 2014:
• The subsidiary Light SESA contracted debt denominated in US dollars with Citibank, including swap for CDI, totaling R$235,750.

54
• Funding of R$141,088 referring to the first installment of the loan agreement between Financiadora de Estudos e Projetos – FINEP (Funding Authority for Studies and Projects) and the subsidiary Light SESA.
• The subsidiary Light SESA settled the CCB Santander loan in the amount of R$89,361.
• The subsidiary Light SESA settled the loan agreement with Banco BNP Paribas Brasil S/A, in the amount of R$111,965.
• The subsidiary Light Energia contracted debt denominated in Euros with Banco BNP Paribas Brasil S/A, already including swap for CDI, in the amount of R$156,935 in order to reinforce its working capital.
• The subsidiary Light SESA received the amount of R$380,022, of which R$24,786 refer to part of the loan agreement with BNDES 2013/2016 and R$355,236 refer to the loan agreement with BNDES 2013/2014.
• The subsidiary Light SESA, raised loan with Banco Itaú in US dollars, already including swap for reais, in the amount of R$67,999.
• The subsidiary Light Energia, raised loan in dollars, as with real to swap in the amount of R $ 131,999, with Banco Itaú.
In addition to the collaterals indicated above, loans are guaranteed by receivables in the approximate amount of R$278,277 (R$100,070 on December 31, 2013). On December 31, 2014, Light S.A. has guarantees, sureties or corporate guarantees issued in favor of its subsidiaries, jointly-controlled entities or associated companies totaling R$6,122,586 (R$5,058,793 on December 31, 2013). The principal of consolidated loans and financing, classified in non-current liabilities, matures as follows (excluding financial charges) on December 31, 2014:

55
Local
Currency
Foreign
CurrencyTotal
2016 363,905 503,455 867,360
2017 481,460 371,868 853,328
2018 230,339 424,992 655,331
2019 133,705 - 133,705
2020 91,457 - 91,457
after 2020 93,320 34,816 128,136
TOTAL 1,394,186 1,335,131 2,729,317
Consolidated
The percentage variation of the main foreign currencies and the percentages of the main economic ratios in the period, which are used to adjust loans, financing and debentures, were as follows in the years:
12.31.2014 12.31.2013
USD 13.4% 14.6%
EUR 0.0% 19.7%
IGP-M 3.7% 5.5%
CDI 11.6% 8.4%
TJLP 5.0% 5.0%
IPCA 6.4% 5.9%
SELIC 11.7% 9.9%
Below, the consolidated loans and financing breakdown for the fiscal years:

56
Principal Charges Total
BALANCE AS OF 01.01.2013 2,247,233 16,198 2,263,431
Loans and financing 852,508 - 852,508
Exchange variation 125,655 - 125,655
Financial charges accrued - 168,349 168,349
Financial charges paid - (173,187) (173,187)
Financing amortization (833,980) - (833,980)
Funding cost amortization 255 - 255
Financial charges capitalized to the principal 498 (498) -
Charges capitalized to intangible assets/property, plant and
equipment- 11,936 11,936
BALANCE AS OF 12.31.2013 2,392,169 22,798 2,414,967
Loans and financing 1,248,619 - 1,248,619
Exchange variation 116,923 - 116,923
Financial charges accrued - 166,516 166,516
Financial charges paid - (172,519) (172,519)
Financing amortization (569,530) - (569,530)
Funding cost amortization 253 - 253
Financial charges capitalized to the principal 720 (720) -
Charges capitalized to intangible assets/property, plant and
equipment- 6,268 6,268
BALANCE AS OF 12.31.2014 3,189,154 22,343 3,211,497
Consolidated
Total principal amount is stated net of loans-related costs. These costs are broken down in the table below:
12.31.2013
ISSUEIncurred value
Value to be
recognizedTotal cost Total cost
Bndes - Capex 2009/10 Sub A 290 135 425 425
Bndes - Capex 2009/10 Sub B 290 135 425 425
Bndes - Capex 2009/10 Sub C 116 110 226 226
Bndes - Capex 2011/12 Sub 4 131 179 310 310
Bndes - Capex 2011/12 Sub 3 131 179 310 310
Bndes - Capex 2011/12 Sub 2 77 105 182 182
BNDES - CAPEX 2009/10 - SUB A - Light Energia 7 4 11 11
BNDES - CAPEX 2009/10 - SUB B - Light Energia 7 4 11 11
BNDES - CAPEX 2009/10 - SUB C - Light Energia 11 11 22 22
TOTAL 1,060 862 1,922 1,922
12.31.2014
The Company’s exposure to interest rate, foreign currency and liquidity risks related to loans and financing is reported in Note 35.
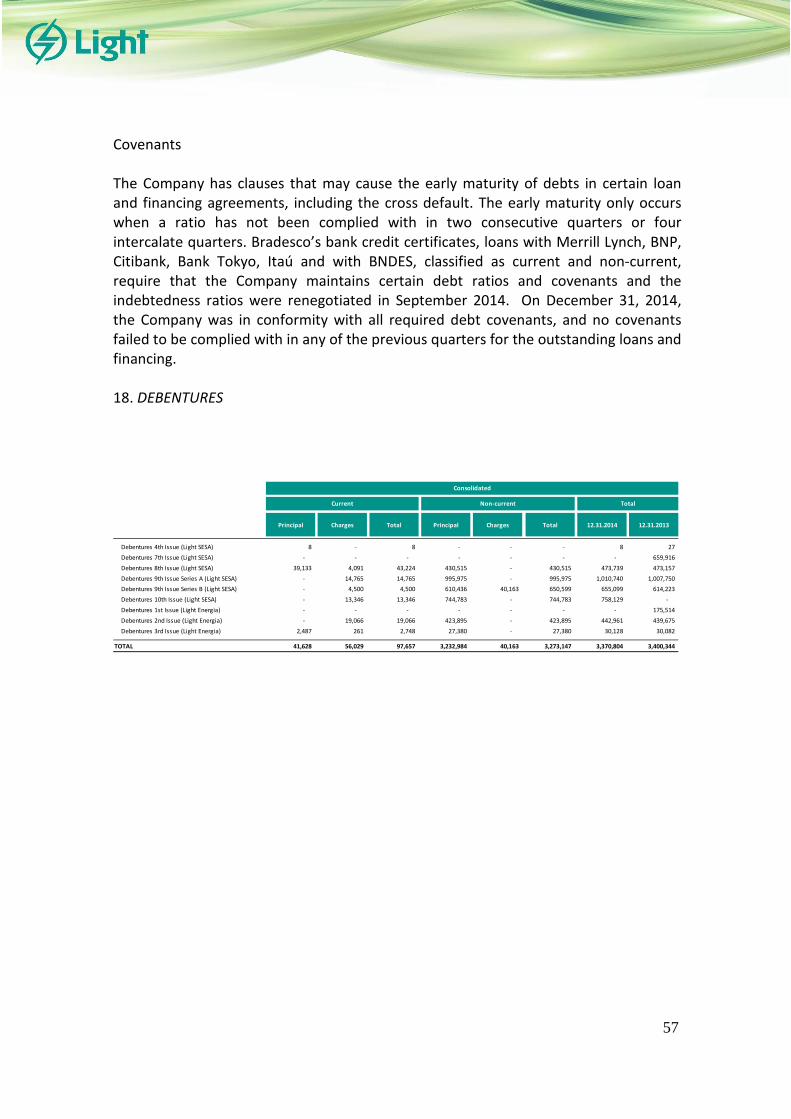
57
Covenants The Company has clauses that may cause the early maturity of debts in certain loan and financing agreements, including the cross default. The early maturity only occurs when a ratio has not been complied with in two consecutive quarters or four intercalate quarters. Bradesco’s bank credit certificates, loans with Merrill Lynch, BNP, Citibank, Bank Tokyo, Itaú and with BNDES, classified as current and non-current, require that the Company maintains certain debt ratios and covenants and the indebtedness ratios were renegotiated in September 2014. On December 31, 2014, the Company was in conformity with all required debt covenants, and no covenants failed to be complied with in any of the previous quarters for the outstanding loans and financing. 18. DEBENTURES
Principal Charges Total Principal Charges Total 12.31.2014 12.31.2013
Debentures 4th Issue (Light SESA) 8 - 8 - - - 8 27
Debentures 7th Issue (Light SESA) - - - - - - - 659,916
Debentures 8th Issue (Light SESA) 39,133 4,091 43,224 430,515 - 430,515 473,739 473,157
Debentures 9th Issue Series A (Light SESA) - 14,765 14,765 995,975 - 995,975 1,010,740 1,007,750
Debentures 9th Issue Series B (Light SESA) - 4,500 4,500 610,436 40,163 650,599 655,099 614,223
Debentures 10th Issue (Light SESA) - 13,346 13,346 744,783 - 744,783 758,129 -
Debentures 1st Issue (Light Energia) - - - - - - - 175,514
Debentures 2nd Issue (Light Energia) - 19,066 19,066 423,895 - 423,895 442,961 439,675
Debentures 3rd Issue (Light Energia) 2,487 261 2,748 27,380 - 27,380 30,128 30,082
TOTAL 41,628 56,029 97,657 3,232,984 40,163 3,273,147 3,370,804 3,400,344
Current Non-current
Consolidated
Total

58
Below, contractual conditions of debentures on a consolidated basis on December 31, 2014:
Financing Entity Date of signature Currency Interest Rate p.a. Effective Rate Beginning Payment End
Debentures 4th Issue (Light SESA) 6/30/2005 URTJLP TJLP + 4% 9.00% 2009 Monthly 2015
Debentures 7th Issue (Light SESA) 5/2/2011 R$ CDI + 1.35% 12.27% 2015 Annual 2016
Debentures 8th Issue (Light SESA) 8/24/2012 R$ CDI + 1.18% 12.08% 2015 Annual 2026
Debentures 9th Issue Series A (Light SESA) 6/15/2013 R$ CDI + 1.15% 12.04% 2018 Half-annually 2021
Debentures 9th Issue Series B (Light SESA) 6/15/2013 R$ IPCA + 5.74% 12.68% 2020 Half-annually 2023
Debentures 10th Issue (Light SESA) 4/30/2014 R$ 115% CDI 12.48% 2018 Annual 2020
Debentures 1st Issue (Light Energia) 4/10/2011 R$ CDI + 1.45% 12.38% 2015 Annual 2016
Debentures 2nd Issue (Light Energia) 12/29/2011 R$ CDI + 1.18% 12.08% 2016 Annual 2019
Debentures 3rd Issue (Light Energia) 8/24/2012 R$ CDI + 1.18% 12.08% 2015 Annual 2026
Principal Amortization
Below, the main issues and amortizations in 2014:
• The public tender offer was closed, under the terms of CVM Rule 476, Light SESA’s 10th issue of unsecured, non-convertible debentures, with personal guarantee, in a single series, totaling R$750,000.
• The subsidiary Light SESA, fully settled the 7th issue of debentures, in the amount of R$658,997.
• The subsidiary Light Energia, settled the 1st issue of debentures, in the amount of R$173,664.
Total principal amount is reported net of debentures issue costs. These costs are broken down in the table below:
12.31.2013
ISSUEIncurred
value
Value to be
recognizedTotal cost Total cost
Debentures 4th Issue (Light SESA) 7,466 2 7,468 7,468
Debentures 7th Issue (Light SESA) 3,621 - 3,621 3,621
Debentures 8th Issue (Light SESA) 71 352 423 423
Debentures 9th Issue A (Light SESA) 961 4,025 4,986 4,986
Debentures 9th Issue B (Light SESA) 461 2,530 2,991 2,991
Debentures 10th Issue (Light SESA) 613 5,217 5,830 -
Debentures 1st Issue (Light Energia) 849 - 849 849
Debentures 2nd Issue (Light Energia) 726 1,105 1,831 1,831
Debentures 3rd Issue (Light Energia) 27 132 159 159
TOTAL 14,795 13,363 28,158 22,328
12.31.2014
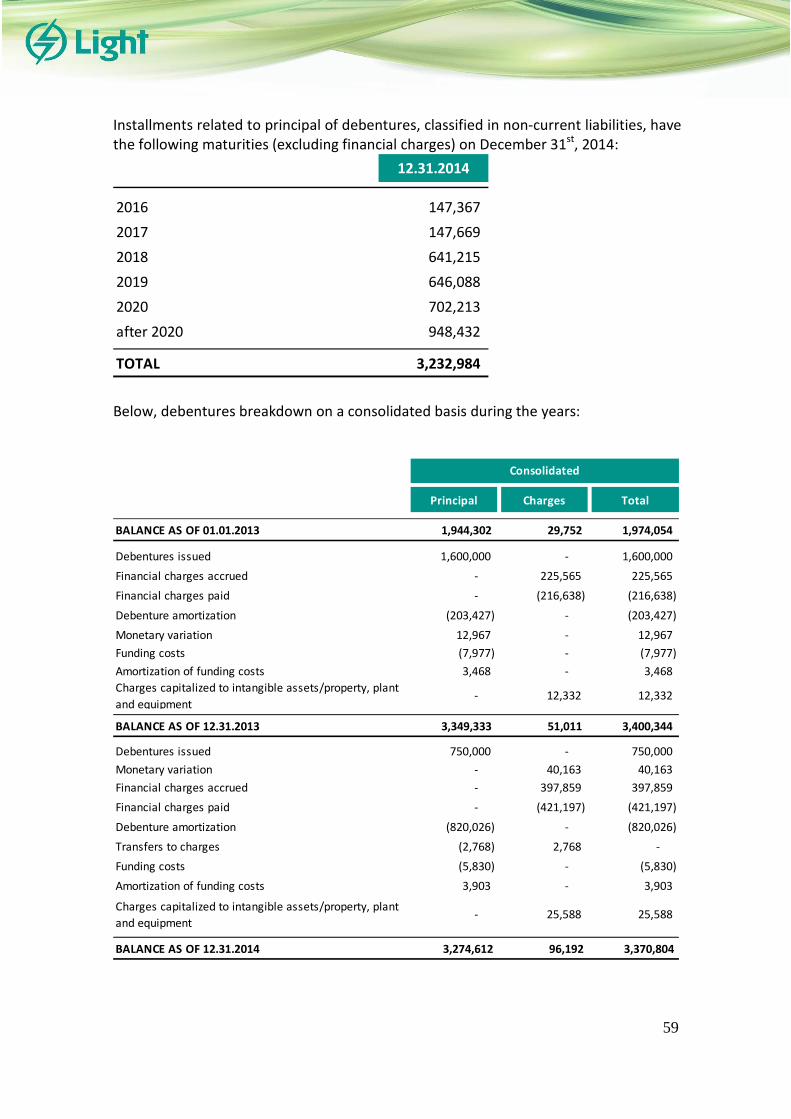
59
Installments related to principal of debentures, classified in non-current liabilities, have the following maturities (excluding financial charges) on December 31st, 2014:
12.31.2014
2016 147,367
2017 147,669
2018 641,215
2019 646,088
2020 702,213
after 2020 948,432
TOTAL 3,232,984
Below, debentures breakdown on a consolidated basis during the years:
Principal Charges Total
BALANCE AS OF 01.01.2013 1,944,302 29,752 1,974,054
Debentures issued 1,600,000 - 1,600,000
Financial charges accrued - 225,565 225,565
Financial charges paid - (216,638) (216,638)
Debenture amortization (203,427) - (203,427)
Monetary variation 12,967 - 12,967
Funding costs (7,977) - (7,977)
Amortization of funding costs 3,468 - 3,468
Charges capitalized to intangible assets/property, plant
and equipment- 12,332 12,332
BALANCE AS OF 12.31.2013 3,349,333 51,011 3,400,344
Debentures issued 750,000 - 750,000
Monetary variation - 40,163 40,163
Financial charges accrued - 397,859 397,859
Financial charges paid - (421,197) (421,197)
Debenture amortization (820,026) - (820,026)
Transfers to charges (2,768) 2,768 -
Funding costs (5,830) - (5,830)
Amortization of funding costs 3,903 - 3,903
Charges capitalized to intangible assets/property, plant
and equipment- 25,588 25,588
BALANCE AS OF 12.31.2014 3,274,612 96,192 3,370,804
Consolidated

60
The Company’s exposure to interest rate and liquidity risks related to debentures is reported in Note 35. Covenants The Company has clauses that may anticipate the maturity of debts in certain debentures agreements, including the cross default. The early maturity only occurs when a ratio has not been complied with in two consecutive quarters or four intercalate quarters. The 8th, 9th and 10th issues of debentures of the subsidiary Light SESA and the 2nd and 3rd issue of debentures of the subsidiary Light Energia require the maintenance of indebtedness ratios and coverage of interest rates, and indebtedness ratios were renegotiated in September 2014. On December 31, 2014, the Company complied with all the covenants required, and no covenants failed to be complied with in any of the previous quarters for the outstanding debentures. 19. REGULATORY CHARGES
CURRENT 12.31.2014 12.31.2013
Energy development account quota – CDE 10,168 5,909
Global reversal reserve quota – RGR 798 1,428
Charges for capacity and emergency acquisition 48,012 55,547
TOTAL 58,978 62,884
Consolidated
20. PROVISIONS
The Company and its subsidiaries are parties in tax, labor and civil lawsuits and regulatory proceedings in several courts. Management periodically assesses the risks of contingencies related to these proceedings, and based on the legal counsel’s opinion it records a provision when unfavorable decisions are probable and whose amounts are quantifiable.
Below, the balance of provisions, including provisions for risks and provisions for success fees:
TOTAL PROVISIONS Provision Success fees Total Provision Success fees Total
Labor 127,921 - 127,921 133,383 - 133,383
Civil 153,317 22,341 175,658 145,189 20,946 166,135
Tax 174,709 26,180 200,889 201,774 22,006 223,780
Other 8,318 - 8,318 20,357 - 20,357
TOTAL 464,265 48,521 512,786 500,703 42,952 543,655
12.31.2014 12.31.2013

61
Provisions for risks:
Provisions for risks and changes for the reported years are as follows:
PROVISIONS FOR PROBABLE LOSSES Labor Civil Tax Other Total
BALANCE ON 01.01.2013 179,082 183,859 197,032 23,179 583,152
Additions 11,301 50,153 1,704 1,097 64,255
Adjustments (35,000) 20,621 15,421 4,235 5,277
Write-offs/payments (5,480) (63,352) (12,383) (7,050) (88,265)
Write-offs/reversals (16,520) (46,092) - (1,104) (63,716)
BALANCE ON 12.31.2013 133,383 145,189 201,774 20,357 500,703
Additions 12,707 78,879 - 5,330 96,916
Adjustments - 14,222 3,590 2,475 20,287
Transfers - (7,589) 18,536 (10,947) -
Write-offs/payments (4,408) (71,101) (8,297) (8,897) (92,703)
Write-offs/reversals (13,761) (6,283) (40,894) - (60,938)
BALANCE ON 12.31.2014 127,921 153,317 174,709 8,318 464,265
Escrow deposits on 12.31.2014 12,587 3,129 17,354 - 33,070 a) The total amount of R$233,073 is recorded under escrow deposits on December 31, 2014 (R$263,316 on December 31, 2013), of which R$33,070 (R$91,101 on December 31, 2013) refer to claims with recorded provision. Other deposits refer to lawsuits whose likelihood of loss is possible or remote. Below, the balance of escrow deposits:
12.31.2014 12.31.2013
Labor 65,353 73,717
Civil 88,104 86,549
Tax 79,616 103,050
Total 233,073 263,316
Consolidated
Provision for labor proceedings:
12.31.2014 12.31.2013
Own employees 96,974 102,342
Outsourced employees 30,947 31,041
TOTAL 127,921 133,383
Accrued Value (Probable Loss)
These labor proceedings mainly involve the following matters: overtime, hazardous work wage premium, equal pay, pain and suffering, difference of 40% fine of FGTS

62
(Government Severance Indemnity Fund for Employees) derived from the adjustment due to understated inflation and occupational accident – civil liability. Provision for civil proceedings:
12.31.2014 12.31.2013
Civil proceedings (a)119,260 114,322
Special civil court (b)14,666 17,107
"Cruzado" Plan (c)19,391 13,760
TOTAL 153,317 145,189
Accrued Value (Probable Loss)
(a) The Provision for civil proceedings comprises lawsuits in which the Company and its subsidiaries are defendants and it is probable the claim will result in a loss in the opinion of the respective attorneys. The claims mainly involve alleged moral and property damage due to the Company’s ostensive behavior fighting irregularities in the network, as well as consumers challenging the amounts paid.
In December 2014, the subsidiary Light SESA made an addition to the provision, in the amount of R$25,076, due to court decision rendered in the lawsuit filed by a law firm against the Company, the subject-matter of which is to collect success fee for the attorney’s services rendered to which said law firm alleges it entitled to, in view of out-of-court settlement. Currently, the lawsuit is pending judgment on the appeal.
(b) Lawsuits in the Special Civil Court are mostly related to matters regarding consumer relations, such as improper collection, undue power cut, power cut due to delinquency, network problems, various irregularities, bill complaints, meter complaints and problems with ownership transfer. There is a limit of 40 minimum monthly wages for claims under procedural progress at the Special Civil Court. Accruals are based on the separation of the six main reasons for complaints for the Company and its subsidiaries – which represent 72.4% of the lawsuits filed; a block with all the reasons related to accidents; and a block for other reasons. For the six main offenders and other reasons block, an adjusted average is used – considering 95% of the sample i.e. excluding the 2.5% highest and lowest amounts - the average of the last 12 months of condemnation amount. In the case of the accident block, the average of the last 12 months of condemnation amount is considered.
(c) These are lawsuits filed against the subsidiary Light SESA referring to increase in electricity tariffs approved by Ordinances n.º 38 of February 27, 1986 and n.º 45 of March 4, 1986, published by the extinguished DNAEE – National Department of Water and Electricity, which contradicted the Decree Law n.º

63
2.283/86 (“Cruzado” Plan decree), which established that all prices would be “frozen”. The plaintiffs of these lawsuits plead the refund of amounts supposedly overpaid in the electricity bills when Light SESA’s tariffs increased in the period that prices were “frozen”.
Provision for tax proceedings:
12.31.2014 12.31.2013
INSS – tax deficiency note (b) 13,332 45,761
INSS – quarterly 539 9,367
ICMS (a) 134,073 129,782
Other 26,765 16,864
TOTAL 174,709 201,774
Accrued Value (Probable Loss)
(a) The provision recorded mainly refers to litigation on the application of State Law nº 3,188/99, which restricted the appropriation of ICMS credits incurred on the acquisition of assets destined to the property, plant and equipment, requiring that credit is deferred by installments, while this restriction was not provided for in the Supplementary Law nº 87/96.
(b) In June 2014, the subsidiary Light SESA reversed the provision of R$32,993, in
view of its legal counsels’ re-evaluation of chances of losses of lawsuit from probable to possible, taking into account current case laws. The lawsuit refers to a tax foreclosure discussing the social security contribution supposedly incurring on the payment of profit sharing by installments, currently, the motion to stay execution is pending judgment.
Other Provisions:
The Company will now discuss regulatory contingencies of its subsidiaries in connection with administrative issues pending with ANEEL:
• Deficiency Notice ANEEL No. 071/2011 - SFE – This deficiency notice was issued on November 30, 2011 under the argument that any failure to comply with Module 8 – PRODIST (Procedures for the Distribution of Electric Power at the National Electric System), more specifically referring to the process of data collection and calculation of individual and collective continuity indicators, as well as financial indemnity owed to consumers whose individual continuity indicators were infringed. ANEEL applied a fine in the relevant amount of R$17,719. Subsidiary Light SESA filed an appeal on February 6, 2012, in view of excessive penalty applied, contesting among the facts, the lack of reasoning and proportionality of dosimetry applied when calculating the fine. In view of the penalty applied and the chances of partial success of appeal filed, Light SESA accrued R$6,840 (R$6,339 on December 31, 2013), through report of its
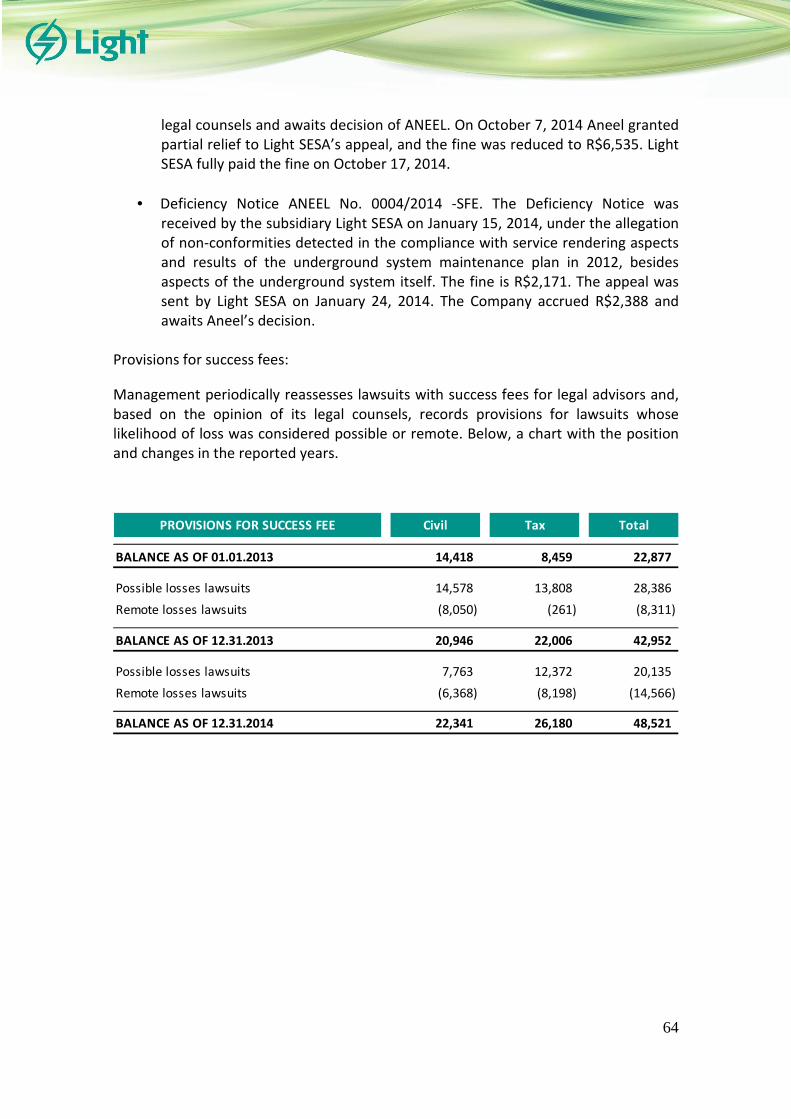
64
legal counsels and awaits decision of ANEEL. On October 7, 2014 Aneel granted partial relief to Light SESA’s appeal, and the fine was reduced to R$6,535. Light SESA fully paid the fine on October 17, 2014.
• Deficiency Notice ANEEL No. 0004/2014 -SFE. The Deficiency Notice was received by the subsidiary Light SESA on January 15, 2014, under the allegation of non-conformities detected in the compliance with service rendering aspects and results of the underground system maintenance plan in 2012, besides aspects of the underground system itself. The fine is R$2,171. The appeal was sent by Light SESA on January 24, 2014. The Company accrued R$2,388 and awaits Aneel’s decision.
Provisions for success fees:
Management periodically reassesses lawsuits with success fees for legal advisors and, based on the opinion of its legal counsels, records provisions for lawsuits whose likelihood of loss was considered possible or remote. Below, a chart with the position and changes in the reported years.
PROVISIONS FOR SUCCESS FEE Civil Tax Total
BALANCE AS OF 01.01.2013 14,418 8,459 22,877
Possible losses lawsuits 14,578 13,808 28,386
Remote losses lawsuits (8,050) (261) (8,311)
BALANCE AS OF 12.31.2013 20,946 22,006 42,952
Possible losses lawsuits 7,763 12,372 20,135
Remote losses lawsuits (6,368) (8,198) (14,566)
BALANCE AS OF 12.31.2014 22,341 26,180 48,521

65
21. CONTINGENCIES
The Company is a party to lawsuits that Management believes that risk of loss are less than probable, based on the opinion of its legal counsels. Therefore, no provision was established. Contingencies with possible loss are broken down as follows:
BalanceNumber of
ProceedingsBalance
Number of
Proceedings
Civil 231,982 14,483 336,113 14,035
Labor 273,790 956 281,071 1,033
Tax 4,314,300 494 3,609,700 439
TOTAL 4,820,072 15,933 4,226,884 15,507
12.31.2014 12.31.2013
Consolidated
The main reasons for litigations are listed below:
a) Civil
•••• Irregularities – Subsidiary Light SESA has several lawsuits where irregularities are discussed, arising from non-technical commercial losses due to meters alteration, equipment theft, irregular connections and clandestine connections, known in Portuguese as “gatos”. Most of the litigations are based on the evidence of irregularity and amounts charged by the concessionaire in view of such evidence. The amount currently assessed represented by these claims is R$33,301 (R$38,856 on December 31, 2013).
•••• Amounts charged and bills – Many litigations are currently in progress and discuss amounts charged by the subsidiary Light SESA for services provided, such as demand amounts, consumption amounts, financial charges, rates, insurances, among other. The amount currently assessed represented by these claims is R$47,394 (R$48,399 on December 31, 2013).
•••• Accidents – Subsidiary Light SESA is defendant in lawsuits filed by victims and/or their successors, regarding accidents with Light’s electric power grid and/or service provision for several causes. The amount currently assessed represented by these claims is R$27,644 (R$30,391 on December 31, 2013).
•••• Interruption and suspension – There are several lawsuits in progress to discuss service interruption, whether by fortuitous cases or events of force majeure, or for purposes of intervention in the electrical system, among other reasons, and also service suspension, whether for indebtedness, denied access or meters
66
replacement, among other facts for suspension. The amount currently assessed represented by these claims is R$27,416 (R$16,076 on December 31, 2013).
•••• Equipment and network – Subsidiary Light SESA has litigations due to electronic meters used to measure energy consumption. Litigations address several themes, such as meter functionality, approval by metrological agency, among others and, also, litigations about its network, due to its extension, removal or even financial contribution of the client to install the network. The amount currently assessed represented by these claims is R$7,522 (R$7,210 on December 31, 2013).
•••• Regarding civil litigations, we point out the lawsuit filed in the first quarter of 2012 by Companhia Siderúrgica Nacional - CSN against subsidiary Light SESA, where CSN claims approximately R$100,000 as indemnity for service discontinuance occurred at its Consumer Unit of Volta Redonda. We point out that out of amount claimed, R$88,700 only refer to the service discontinuance occurred on November 10th, 2009, affecting 40% of Brazilian territory and over 90% of Paraguay, which only evidences that causes go beyond Light SESA’s scope of operation, as electric power distribution company. Moreover, the ONS report concluded that the origin and causes of this service discontinuance was Furnas’ responsibility. Thus, the Company’s exposure to risk is R$35,531 (R$35,531 on December 31, 2013).
•••• The subsidiary Light SESA entered into an agreement with a plaintiff in a proceeding related to the Municipal Real Estate Tax (IPTU), in which the opposing party’s attorney is pleading the payment of court costs and attorneys’ fees. The Company understands that these fees are not due. The amount currently quantifiable is R$11,100 (R$13,153 on December 31, 2013).
b) Tax
•••• ICMS Commercial Losses (Tax Deficiency Notices Nos. 03326780-8, 04011949-7, 03.326.784-0, 04.028.752-6, 03.380329-7 and 03.380330-5), aimed at collecting ICMS, Government Fund to Combat Poverty (FECP) and penalty (from Jan/99 to Dec/2003 and Jan/06 to Dec/13) supposedly incurring on the amounts related to electric power losses in operations preceding its distribution, conducted between the generation companies and the subsidiary Light SESA. The subsidiary Light SESA objected these tax deficiency notices. Two tax deficiency notices are pending judgments in the lower administrative court and other four notices received unfavorable decisions in the lower administrative court, against which Light SESA filed voluntary appeals. The amount currently quantifiable represented by these claims totaled R$2,081,800 (R$1,392,200 on December 31, 2013).
•••• IRRF (withholding income tax over dividends) (Proceedings 16682.721195/2011-02 and 16682.720657/2012-47) – Tax deficiency notices

67
issued against the subsidiary Light SESA to collect the withholding income tax (IRRF) over amounts paid by the subsidiary Light SESA in 2007 and 2008 as dividends, under the allegation that these derived from no profit, originated from the regular recording of deferred tax assets in the income statement, then, characterized as payments without cause subject to tax levy. In view of regular standing of accounting, corporate and tax procedures adopted, Light SESA’s appeal was granted partial relief, related to the first tax deficiency notice, definitively cancelling the tax assessment referring to the discussion on the withholding income tax over dividends, remaining the discussion on the income tax and social contribution referring to the disallowance of expenses considered not deductible. Now, the Company awaits the lapse of time to lodge an appeal against such Treasury Department’s decision. Referring to the second deficiency notice, a Volunteer Appeal was granted relief to annul the tax assessment. Since the Treasury Department did not file an appeal against such decision, the lawsuit was dismissed favorably to the Company, so that to cancel the tax assessment. The amount currently quantifiable of the first deficiency notice is R$5,300 (R$375,300 on December 31, 2013) and in relation to the deficiency notice cancelled, the current risk is R$0 (R$ R$235,400 on December 31, 2013).
•••• LIR/LOI - IRPJ/CSLL – (Proceedings 16682.720216/2010-83, 15374-001.757/2008-13, 16682.721091/2011-90 and 16682.720203/2014-38) – The subsidiary Light SESA filed a writ of mandamus mainly discussing the taxation of profit of the subsidiaries LIR and LOI abroad, more specifically, it advocated that income tax and social contribution should be levied on profit only, not on equity in the earnings of subsidiaries (a broader concept that includes exchange variations as provided for by IN 213/02). In order to take advantage on the benefits of REFIS Program, Light SESA fully waived the writ of mandamus, thus, an unappealable court decision was unfavorably rendered to Light SESA. Accordingly, the procedure has been changed to assess results by the equity method, in accordance with the decision of the writ of mandamus. Tax authorities disagreed with this procedure and issued a deficiency notice to Light SESA for the fiscal years 2004 to 2008, requiring taxation on profit only. For 2004, a tax foreclosure case has been filed and is pending judgment of the motion to stay execution. For 2005, the Light SESA’s voluntary appeal was sustained to cancel the tax deficiency notice. The judgment on the federal government’s special appeal is pending. For the amounts relating to 2006 to 2008, the Company is awaiting the decision of the Voluntary Appeals by the Administrative Tax Appeals Council (CARF). In April 2014, Light SESA was notified in relation to 2009 and filed objection. According to the legal counsels, the claim may possibly result in a loss involving the amount of R$560,300 (R$443,100 on December 31, 2013).
•••• Normative Instruction (NI) No. 86 (Proceeding 10707000751/2007-15 - (2003 through 2005) - This deficiency notice was issued to assess a fine on the Company for alleged failure to make electronic filings as required by NI. No.

68
86/2001, for calendar years 2003 through 2005. The voluntary appeal filed by subsidiary Light SESA was dismissed, upon which a special appeal was filed and also deemed groundless. Motion for clarification of judgment is pending. The amount currently assessed represented by this claim is R$329,100 (R$309,500 on December 31, 2013).
•••• Inspection Fee for Occupancy and Permanence in Zones, Routes and Public Areas (TFOP) – The subsidiary Light SESA has several lawsuits discussing TFOP, levied by the municipality of Barra Mansa. Light SESA filed motion to dismiss the execution of these lawsuits and at the Federal Supreme Court– STF, obtained injunction sentencing the suspension of collections until judgment of Extraordinary Appeal n° 640286. The STF rendered a decision granting relief to LIGHT’s extraordinary appeal. The municipality filed an appeal against such decision, which is pending judgment. The amount currently assessed represented by this claim is R$277,300 (R$256,497on December 31, 2013).
•••• Collection of ICMS Credit Recovery - This is a dispute for collection of ICMS (State VAT), in view of subsidiary Light SESA's utilization of ICMS accumulated credits to acquire inputs and raw materials in the state of Rio de Janeiro. Administrative proceeding was dismissed unfavorably to the Company. The registration as an overdue tax liability is awaited, so that the Company may adopt the reasonable measures. The amount currently assessed represented by this claim is R$483,100 (R$145,900 as at December 31, 2013).
•••• ICMS on subsidies of the “Baixa Renda” (Low-income) federal program (Proceedings E-34/059.150/2004, E-04/054.753/2011, E-04/036.121/2014 and E - 04/036.122/2014) - Tax Deficiency Notices drawn up to charge ICMS (State VAT) on amounts of economic subsidy to low-income consumers of electric power arising from Global Reversal Reserve Funding. In the first case, Light SESA's objection was deemed groundless. An appeal was lodged by subsidiary Light SESA with the Taxpayers Council, which was partially sustained to remove taxation on consumption up to 50 kWh (exempt from tax). The Company lodged an appeal, which is pending judgment. In the second case, Light SESA filed an objection, which was deemed groundless. An appeal was lodged with the Taxpayers Council, and decision was rendered granting relief to Light SESA’s appeal to annul the deficiency notice. The Treasury Department lodged an appeal to the full session against such decision, which is pending judgment. In September 2014, the Company receiver other two deficiency notices about this matter and related objections were filed, which were deemed groundless. Voluntary appeals were lodged which are pending judgment. The amount currently represented by the first claim is R$97,300 (R$95,300 as at December 31, 2013), the second claim is R$37,500 (R$35,000 as at December, 31, 2013) and in the third and fourth claims is R$17,800 (R$0 on December 31, 2013).
•••• Decisions (71 proceedings) rendered by the Internal Revenue Service to deny approval to several petitions for indemnification filed by subsidiary Light SESA,

69
for utilization of PIS, COFINS, income tax and social contribution credits, alleging that these credits would be undue or insufficient to comprise the debts against which these were opposed. The subsidiary Light SESA filed Motion to Disagree against referred decisions. In few cases, unappealable court decisions were favorably rendered to Light SESA and in other cases, unfavorable decisions, against which we appealed. The amount currently quantified is R$192,200 (R$143,900 on December 31, 2013).
c) Labor
The main labor claims involve: equal pay and related accretions, overtime and related accretions, occupational accident, hazardous work wage premium and pay and suffering.
Each claim is detailed below:
•••• Equal pay and related accretions – the claimants intend to receive wage differences alleging that they exercise or exercised activities identical to other employees’ or former employees’ activities, with the same productivity and technical perfection, but they received different wages. The amount currently assessed represented by this claim is R$17,298 (R$18,845 on December 31, 2013).
•••• Overtime and related accretions – the claimants intend to receive overtime pay, alleging that they performed their activities beyond standard working hours and overtime has not been paid or offset. The amount currently assessed represented by this claim is R$63,458 (R$61,192 on December 31, 2013).
•••• Occupational accident – employees/former employees or service providers involved in occupational accidents attribute responsibility to Light, claiming indemnifications and life annuity. The amount currently assessed represented by this claim is R$20,659 (R$16,492 on December 31, 2013).
•••• Risk premium difference – in the past, the Company used to pay a 30% difference of base salary up to April 2012, as per 2011/2012 Collective Bargaining Agreement. The amount currently assessed represented by this claim is R$55,792 (R$57,001 on December 31, 2013).
•••• Pain and suffering – claim based on several grounds: persecution, moral harassment, lack of security (operations in risk area) and others. The amount currently assessed represented by this claim is R$36,344 (R$38,225 on December 31, 2013).
70
Below, we point out lawsuits in progress, whose chances of losses are remote, with relevant amounts under dispute, which, in case of unfavorable decision, may impact the Company, its subsidiaries and jointly-controlled entities:
a) Tax
•••• PASEP/PIS (Proceeding 15374002130/2006-18) – It refers to the Offset Disallowance made by the subsidiary Light SESA of PASEP credits with PIS debts. The Company’s objection was deemed groundless. Voluntary Appeal was filed. CARF rendered decision sentencing the case should remand to the lower court to determine the credit in dispute. The amount currently assessed represented by this claim is R$280,900 (R$272,400 on December 31, 2013).
•••• IRRF - Disallowance of tax offset - LIR/LOI (Proceeding 10768.002.435/2004-11) - There is no confirmation from Brazilian Tax Authority regarding the tax offsets related to withholding income tax credits on financial investments and withholding income tax credits on the payment of energy accounts by government bodies, offset due to outstanding balance of Corporate Income Tax in the reference year of 2002. The motion to disagree filed by Light SESA subsidiary was deemed groundless. The voluntary appeal lodged by Light SESA is pending judgment. In view of the favorable decision received in August 2012 referring to the proceeding 18471002113/2004-09, which directly impacts this case, the legal counsels changed the chances of losses to remote. The amount currently assessed represented by this claim is R$220,700 (R$211,800 as of December 31, 2013).
The Company does not consider the other proceedings to be individually significant for disclosure purposes.
22. POST-EMPLOYMENT BENEFITS
Light Group’s companies sponsor Fundação de Seguridade Social Braslight (Braslight), a nonprofit closed pension entity, whose purpose is to provide retirement benefits to the Company’s employees and pension benefits to their dependents. Braslight was incorporated in April 1974 and has four plans - A, B, C and D – established in 1975, 1984, 1998 and 2010, respectively, and plan C received migration from about 96% of the active participants of plans A and B. Current plans in effect include defined-benefit- (Plans A and B), mixed-benefit- (Plan C), and defined-contribution plans (Plan D). Below, a summary of the Company's liabilities involving pension plan benefits as stated in its balance sheet:

71
Current Non-current Total Current Non-current Total
Contractual debt with pension fund - 31,976 31,976 1,224,666 - 1,224,666
Other 123 - 123 70 - 70
TOTAL 123 31,976 32,099 1,224,736 - 1,224,736
12.31.201312.31.2014
Consolidated
On February 13, 2014, the Company settled the Private Instruments of Termination of Agreements for Resolving Technical Deficits and Refinancing Unamortized Reserves with Braslight, for R$1,228,205, including the restatement by the CDI rate.
On December 31, 2014, the Company assumed a debt of R$31,976 due to a technical deficit accumulated by plan C settled, deriving from the change in the mortality table by means of table adhesion annual test, as provided for in the agreement for the Assumption of Obligation subject to Condition and Term, signed on December 31, 2013. Below, contractual liabilities breakdown in 2013 and 2014:
Current Non-current Total
BALANCE AS OF 01.01.2013 114,835 939,863 1,054,698
Restatements in the income statement of the year 122,035 - 122,035
Amortizations in the year (117,100) - (117,100)
Restatements in the statement of comprehensive income 165,033 - 165,033
Transfer to current 939,863 (939,863) -
BALANCE AS OF 12.31.2013 1,224,666 - 1,224,666
Restatements in the income statement of the year 3,539 - 3,539
Amortizations in the year (1,228,205) - (1,228,205)
Restatements in the statement of comprehensive income - 31,976 31,976
BALANCE AS OF 12.31.2014 - 31,976 31,976
Consolidated

72
a) Plan description
Plan A/B - Benefits in these plans are 'defined benefits' and correspond to the difference between application of certain percentage, between 80% and 100%, of the average of the last 12 and the last 36 salaries, escalated as of the date the benefit began to be paid out, and the amount of the benefit paid by the INSS. Plan C - During the capitalization phase, elective benefits are 'defined-contribution' benefits not linked to INSS benefits, and contingent benefits (i.e. sickness allowance, permanent disability pension, pensions payable upon death of active, disabled, or sick participants), as well as continued income, once granted, are 'defined' benefits. The assets of the two portions are determined in shares. For a participant migrating from Plan A/B to Plan C, a settled lifetime income benefit was granted, reversible into a pension benefit, proportionate to the amount of contributions made to Braslight at migration time, as of the participant's latest enrollment in the Fundação, which is deferred until the participant has satisfied a number of qualification requirements. This portion is called the Plan C Settled Defined Benefit Subplan. Plan D - This plan was approved by the Ministry of Social Security's National Bureau of Supplementary Pension (PREVIC/MPS) on March 22nd, 2010, with the first contribution made in April 2010. In this plan, benefits are 'defined contribution' benefits before and after the relevant grant. Below, consolidated actuarial information:
12.31.2014 12.31.2013
Present value of actuarial liabilities (2,263,205) (2,097,653)
Plan assets' fair value 2,563,457 1,227,819
Effect of the maximum limit in asset recognition (300,252) -
Addition - debt with Braslight (31,976) (354,832)
NET LIABILITIES (31,976) (1,224,666)
Net liabilities, CVM 695/12 - (869,834)
Balance of agreement adjusted with Braslight (31,976) (1,224,666)

73
Changes in plan assets’ fair value are as follows: 12.31.2014 12.31.2013
Fair value of assets at the beginning of the year 1,227,819 1,316,129
Interest on the fair value of the plan's assets 202,224 105,043
Actuarial gains(losses) on the plan's assets 141,533 (86,088)
Sponsor's contributions 1,229,511 118,398
Participants' contributions 46 52
Benefit paid by the plan/company (237,676) (225,715)
FAIR VALUE OF ASSETS AT THE END OF THE YEAR 2,563,457 1,227,819
Changes in defined-benefit liabilities present value are as follows:
12.31.2014 12.31.2013
Fair value of liabilities at the beginning of the year 2,097,653 2,685,595
Cost of current service 957 979
Interest on actuarial liabilities 232,130 213,404
Participants' contributions 46 52
Recorded actuarial gains/(losses) 170,095 (576,662)
Benefits paid (237,676) (225,715)
FAIR VALUE OF LIABILITIES AT THE END OF THE YEAR 2,263,205 2,097,653
Amounts recognized in the income statement, in operating costs and expenses and financial income, are as follows:
12.31.2014 12.31.2013
Cost of current service 957 979
Interest on actuarial liabilities 232,130 213,404
Interest on the fair value of the plan's assets (202,224) (105,043)
Restatement of Braslight's debt (27,324) 12,695
ESTIMATED EXPECTED COST 3,539 122,035
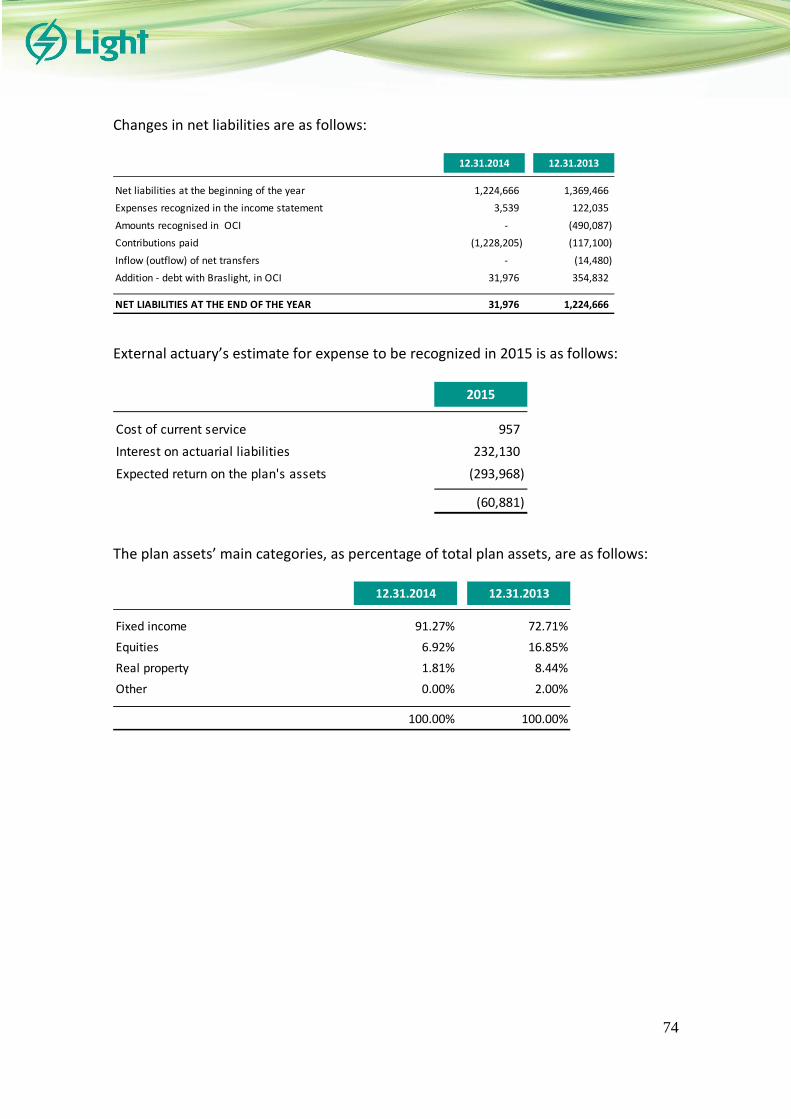
74
Changes in net liabilities are as follows:
12.31.2014 12.31.2013
Net liabilities at the beginning of the year 1,224,666 1,369,466
Expenses recognized in the income statement 3,539 122,035
Amounts recognised in OCI - (490,087)
Contributions paid (1,228,205) (117,100)
Inflow (outflow) of net transfers - (14,480)
Addition - debt with Braslight, in OCI 31,976 354,832
NET LIABILITIES AT THE END OF THE YEAR 31,976 1,224,666
External actuary’s estimate for expense to be recognized in 2015 is as follows:
2015
Cost of current service 957
Interest on actuarial liabilities 232,130
Expected return on the plan's assets (293,968)
(60,881)
The plan assets’ main categories, as percentage of total plan assets, are as follows:
12.31.2014 12.31.2013
Fixed income 91.27% 72.71%
Equities 6.92% 16.85%
Real property 1.81% 8.44%
Other 0.00% 2.00%
100.00% 100.00%
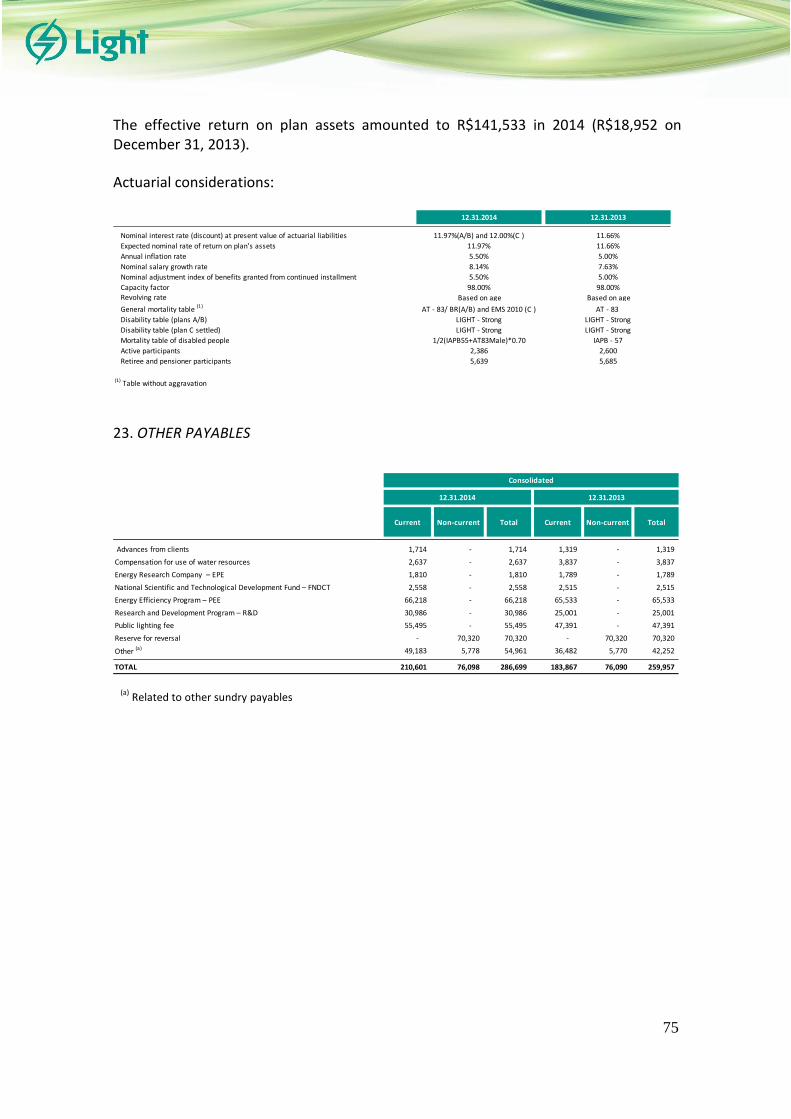
75
The effective return on plan assets amounted to R$141,533 in 2014 (R$18,952 on December 31, 2013). Actuarial considerations:
12.31.2014 12.31.2013
Nominal interest rate (discount) at present value of actuarial liabilities 11.97%(A/B) and 12.00%(C ) 11.66%
Expected nominal rate of return on plan's assets 11.97% 11.66%
Annual inflation rate 5.50% 5.00%
Nominal salary growth rate 8.14% 7.63%
Nominal adjustment index of benefits granted from continued installment 5.50% 5.00%
Capacity factor 98.00% 98.00% Revolving rate Based on age Based on age
General mortality table (1)
AT - 83/ BR(A/B) and EMS 2010 (C ) AT - 83
Disability table (plans A/B) LIGHT - Strong LIGHT - Strong
Disability table (plan C settled) LIGHT - Strong LIGHT - Strong
Mortality table of disabled people 1/2(IAPB55+AT83Male)*0.70 IAPB - 57
Active participants 2,386 2,600
Retiree and pensioner participants 5,639 5,685
(1) Table without aggravation 23. OTHER PAYABLES
Current Non-current Total Current Non-current Total
Advances from clients 1,714 - 1,714 1,319 - 1,319
Compensation for use of water resources 2,637 - 2,637 3,837 - 3,837
Energy Research Company – EPE 1,810 - 1,810 1,789 - 1,789
National Scientific and Technological Development Fund – FNDCT 2,558 - 2,558 2,515 - 2,515
Energy Efficiency Program – PEE 66,218 - 66,218 65,533 - 65,533
Research and Development Program – R&D 30,986 - 30,986 25,001 - 25,001
Public lighting fee 55,495 - 55,495 47,391 - 47,391
Reserve for reversal - 70,320 70,320 - 70,320 70,320
Other (a) 49,183 5,778 54,961 36,482 5,770 42,252
TOTAL 210,601 76,098 286,699 183,867 76,090 259,957
Consolidated
12.31.2014 12.31.2013
(a)
Related to other sundry payables
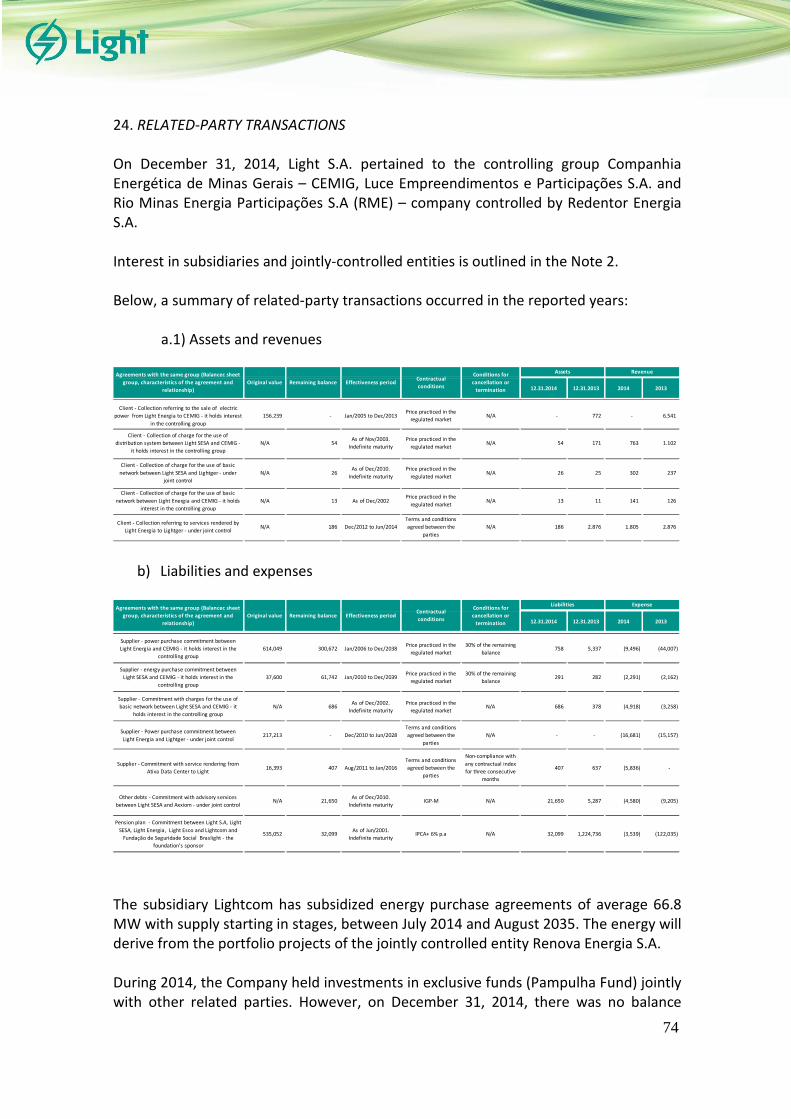
74
24. RELATED-PARTY TRANSACTIONS
On December 31, 2014, Light S.A. pertained to the controlling group Companhia Energética de Minas Gerais – CEMIG, Luce Empreendimentos e Participações S.A. and Rio Minas Energia Participações S.A (RME) – company controlled by Redentor Energia S.A.
Interest in subsidiaries and jointly-controlled entities is outlined in the Note 2.
Below, a summary of related-party transactions occurred in the reported years:
a.1) Assets and revenues
12.31.2014 12.31.2013 2014 2013
Client - Collection referring to the sale of electric
power from Light Energia to CEMIG - it holds interest
in the controlling group
156.239 - Jan/2005 to Dec/2013Price practiced in the
regulated marketN/A - 772 - 6.541
Client - Collection of charge for the use of
distribution system between Light SESA and CEMIG -
it holds interest in the controlling group
N/A 54 As of Nov/2003.
Indefinite maturity
Price practiced in the
regulated marketN/A 54 171 763 1.102
Client - Collection of charge for the use of basic
network between Light SESA and Lightger - under
joint control
N/A 26 As of Dec/2010.
Indefinite maturity
Price practiced in the
regulated marketN/A 26 25 302 237
Client - Collection of charge for the use of basic
network between Light Energia and CEMIG - it holds
interest in the controlling group
N/A 13 As of Dec/2002Price practiced in the
regulated marketN/A 13 11 141 126
Client - Collection referring to services rendered by
Light Energia to Lightger - under joint controlN/A 186 Dec/2012 to Jun/2014
Terms and conditions
agreed between the
parties
N/A 186 2.876 1.805 2.876
Assets RevenueAgreements with the same group (Balancec sheet
group, characteristics of the agreement and
relationship)
Original value Remaining balance Effectiveness periodContractual
conditions
Conditions for
cancellation or
termination
b) Liabilities and expenses
12.31.2014 12.31.2013 2014 2013
Supplier - power purchase commitment between
Light Energia and CEMIG - it holds interest in the
controlling group
614,049 300,672 Jan/2006 to Dec/2038Price practiced in the
regulated market
30% of the remaining
balance758 5,337 (9,496) (44,007)
Supplier - energy purchase commitment between
Light SESA and CEMIG - it holds interest in the
controlling group
37,600 61,742 Jan/2010 to Dec/2039Price practiced in the
regulated market
30% of the remaining
balance291 282 (2,291) (2,162)
Supplier - Commitment with charges for the use of
basic network between Light SESA and CEMIG - it
holds interest in the controlling group
N/A 686 As of Dec/2002.
Indefinite maturity
Price practiced in the
regulated marketN/A 686 378 (4,918) (3,258)
Supplier - Power purchase commitment between
Light Energia and Lightger - under joint control217,213 - Dec/2010 to Jun/2028
Terms and conditions
agreed between the
parties
N/A - - (16,681) (15,157)
Supplier - Commitment with service rendering from
Ativa Data Center to Light16,393 407 Aug/2011 to Jan/2016
Terms and conditions
agreed between the
parties
Non-compliance with
any contractual index
for three consecutive
months
407 637 (5,836) -
Other debts - Commitment with advisory services
between Light SESA and Axxiom - under joint controlN/A 21,650
As of Dec/2010.
Indefinite maturityIGP-M N/A 21,650 5,287 (4,580) (9,205)
Pension plan - Commitment between Light S.A, Light
SESA, Light Energia, Light Esco and Lightcom and
Fundação de Seguridade Social Braslight - the
foundation's sponsor
535,052 32,099 As of Jun/2001.
Indefinite maturityIPCA+ 6% p.a N/A 32,099 1,224,736 (3,539) (122,035)
Agreements with the same group (Balancec sheet
group, characteristics of the agreement and
relationship)
Original value Remaining balance Effectiveness periodContractual
conditions
Conditions for
cancellation or
termination
Liabilities Expense
The subsidiary Lightcom has subsidized energy purchase agreements of average 66.8 MW with supply starting in stages, between July 2014 and August 2035. The energy will derive from the portfolio projects of the jointly controlled entity Renova Energia S.A. During 2014, the Company held investments in exclusive funds (Pampulha Fund) jointly with other related parties. However, on December 31, 2014, there was no balance
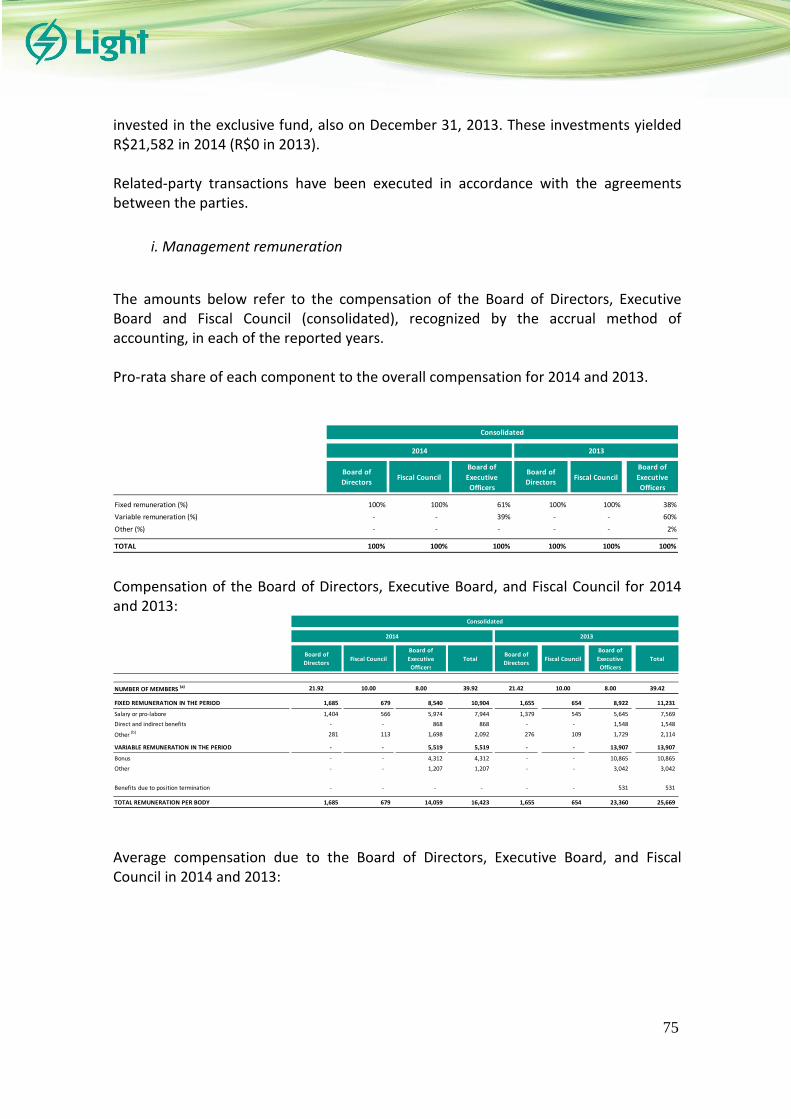
75
invested in the exclusive fund, also on December 31, 2013. These investments yielded R$21,582 in 2014 (R$0 in 2013). Related-party transactions have been executed in accordance with the agreements between the parties.
i. Management remuneration
The amounts below refer to the compensation of the Board of Directors, Executive Board and Fiscal Council (consolidated), recognized by the accrual method of accounting, in each of the reported years. Pro-rata share of each component to the overall compensation for 2014 and 2013.
Board of
DirectorsFiscal Council
Board of
Executive
Officers
Board of
DirectorsFiscal Council
Board of
Executive
Officers
Fixed remuneration (%) 100% 100% 61% 100% 100% 38%
Variable remuneration (%) - - 39% - - 60%
Other (%) - - - - - 2%
TOTAL 100% 100% 100% 100% 100% 100%
Consolidated
2014 2013
Compensation of the Board of Directors, Executive Board, and Fiscal Council for 2014 and 2013:
Board of
DirectorsFiscal Council
Board of
Executive
Officers
TotalBoard of
DirectorsFiscal Council
Board of
Executive
Officers
Total
NUMBER OF MEMBERS (a) 21.92 10.00 8.00 39.92 21.42 10.00 8.00 39.42
FIXED REMUNERATION IN THE PERIOD 1,685 679 8,540 10,904 1,655 654 8,922 11,231
Salary or pro-labore 1,404 566 5,974 7,944 1,379 545 5,645 7,569
Direct and indirect benefits - - 868 868 - - 1,548 1,548
Other (b) 281 113 1,698 2,092 276 109 1,729 2,114
VARIABLE REMUNERATION IN THE PERIOD - - 5,519 5,519 - - 13,907 13,907
Bonus - - 4,312 4,312 - - 10,865 10,865
Other - - 1,207 1,207 - - 3,042 3,042
Benefits due to position termination - - - - - - 531 531
TOTAL REMUNERATION PER BODY 1,685 679 14,059 16,423 1,655 654 23,360 25,669
2014 2013
Consolidated
Average compensation due to the Board of Directors, Executive Board, and Fiscal Council in 2014 and 2013:

76
Board of
DirectorsFiscal Council
Board of
Executive
Officers
Board of
DirectorsFiscal Council
Board of
Executive
Officers
NUMBER OF MEMBERS (a) 21.92 10.00 8.00 21.42 10.00 8.00
Highest individual compensation (b) 141 113 2,674 132 106 4,578
Lowest individual compensation (b) 71 56 1,516 66 53 2,176
Average individual compensation (b) 77 68 1,757 77 65 2,920
2014 2013
Consolidated
(a)
number of members calculated through the year’s weighted average. (b)
including Social Security and FGTS charges.
Overall management compensation of Light S.A., parent company, for the fiscal year of 2014 is R$2,446 (R$3,049 in 2013). 25. SHAREHOLDERS’ EQUITY
a) Capital Stock
Number of
Shares% Interest
Number of
Shares% Interest
CONTROLLING GROUP 106,304,597 52.12 106,304,597 52.12
RME Rio Minas Energia Participações S.A. 26,576,150 13.03 26,576,150 13.03
Companhia Energética de Minas Gerais S.A. 53,152,298 26.06 53,152,298 26.06
Luce Empreendimentos e Participações S.A. 26,576,149 13.03 26,576,149 13.03
OTHER 97,629,463 47.88 97,629,463 47.88
BNDES Participações S.A. - BNDESPAR 19,140,808 9.39 21,005,208 10.30
Public 78,488,655 38.49 76,624,255 37.58
OVERALL TOTAL 203,934,060 100.00 203,934,060 100.00
SHAREHOLDERS
12.31.2014 12.31.2013
On December 31, 2014, there are 203,934,060 non-par and book-entry common shares of Light S.A. (203,934,060 on December 31st, 2013), recorded as capital stock in the total amount of R$2,225,822 (R$2,225,822 on December 31st, 2013), as follows: Light S.A. is authorized to increase its capital up to the limit of 203,965,072 common shares through resolution of the Board of Directors, regardless of amendments to the bylaws. b) Profit reserve Light S.A. has two profit reserves, as follows: - A Statutory Reserve set at the rate of 5% of the net income for each year, pursuant to the applicable law.
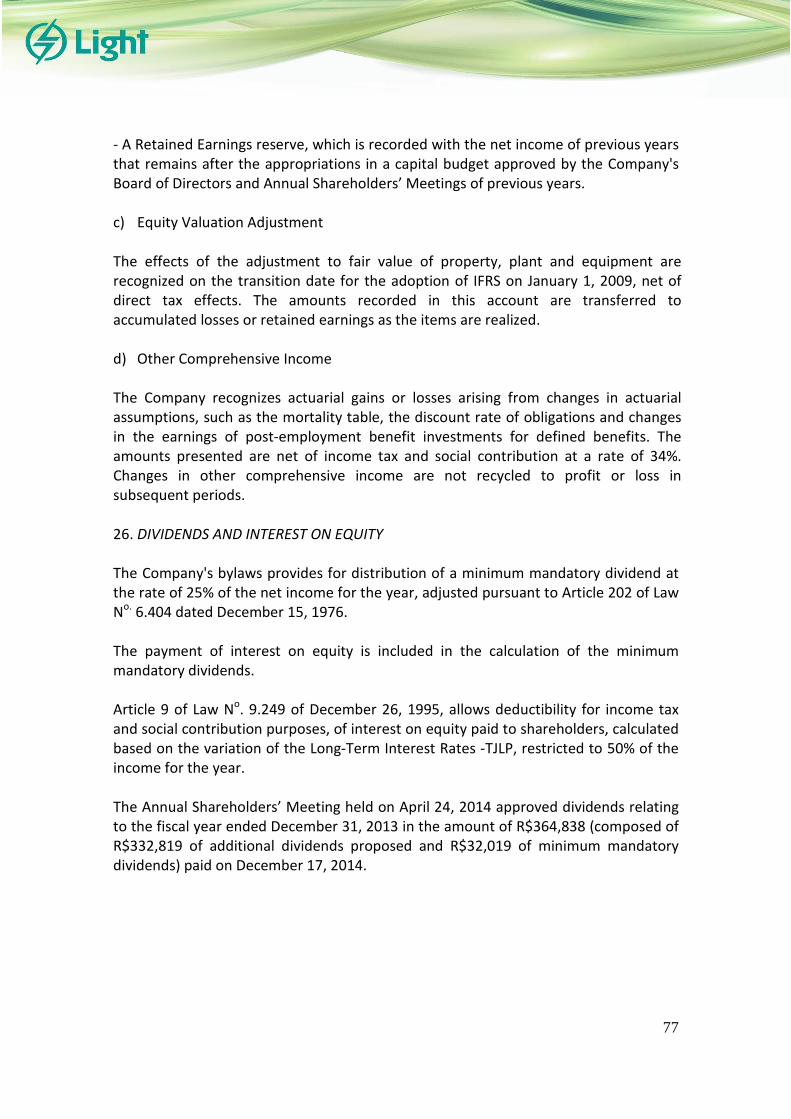
77
- A Retained Earnings reserve, which is recorded with the net income of previous years that remains after the appropriations in a capital budget approved by the Company's Board of Directors and Annual Shareholders’ Meetings of previous years. c) Equity Valuation Adjustment
The effects of the adjustment to fair value of property, plant and equipment are recognized on the transition date for the adoption of IFRS on January 1, 2009, net of direct tax effects. The amounts recorded in this account are transferred to accumulated losses or retained earnings as the items are realized. d) Other Comprehensive Income The Company recognizes actuarial gains or losses arising from changes in actuarial assumptions, such as the mortality table, the discount rate of obligations and changes in the earnings of post-employment benefit investments for defined benefits. The amounts presented are net of income tax and social contribution at a rate of 34%. Changes in other comprehensive income are not recycled to profit or loss in subsequent periods. 26. DIVIDENDS AND INTEREST ON EQUITY
The Company's bylaws provides for distribution of a minimum mandatory dividend at the rate of 25% of the net income for the year, adjusted pursuant to Article 202 of Law No. 6.404 dated December 15, 1976. The payment of interest on equity is included in the calculation of the minimum mandatory dividends. Article 9 of Law No. 9.249 of December 26, 1995, allows deductibility for income tax and social contribution purposes, of interest on equity paid to shareholders, calculated based on the variation of the Long-Term Interest Rates -TJLP, restricted to 50% of the income for the year. The Annual Shareholders’ Meeting held on April 24, 2014 approved dividends relating to the fiscal year ended December 31, 2013 in the amount of R$364,838 (composed of R$332,819 of additional dividends proposed and R$32,019 of minimum mandatory dividends) paid on December 17, 2014.

78
The dividends originally proposed at the end of each year were calculated as follows: CALCULATION OF MINIMUM MANDATORY DIVIDENDS 2014 2013
Net income for the year 662,831 587,335
Recognition of legal reserve (33,142) (29,367)
CALCULATION BASIS OF MINIMUM MANDATORY DIVIDENDS 629,689 557,968
Minimum mandatory dividends (25%) 157,422 139,492
Interest on equity declared - (107,473)
Recognition of legal reserve on net income for the year (33,142) (29,367)
Minimum mandatory dividends (25%) (157,422) -
Additional minimum mandatory dividends - 25% - (32,019)
Additional dividends proposed - (332,819)
Equity valuation adjustment 19,674 22,058
Realization of other comprehensive income - 171,997
RETAINED EARNINGS 491,941 279,712
Below, the breakdown of payable dividends and interest on equity balances:
BALANCE AS OF 01.01.2013 74,792 R$/ SHARE
Dividends and interest on equity
Resolved at the Annual Shareholders' Meeting of April 26, 2013 91,770 0.4500
Additional minimum mandatory dividends - 25% 32,019 0.1570
Interest on equity declared on December 13, 2013 107,473 0.5270
Withholding income tax - IRRF (14,120)
Paid in the year (259,915)
BALANCE AS OF 12.31.2013 32,019
Dividends and interest on equity
Resolved at the Annual Shareholders' Meeting of April 24, 2014 332,819 1.6320
Minimum mandatory dividends (25%) 157,422 0.7719
Paid in the year (364,838)
BALANCE AS OF 12.31.2014 157,422

79
27. PROFIT SHARING
The Company's Profit Sharing Plan implemented in 1997 spans the whole corporation and is essentially contingent upon consolidated net income and EBITDA results of the Company. Payment of the profit-sharing amount comprises two portions, a fixed and a variable one. The Program has evolved over the years in order to elicit increased employee commitment to improving the Company's and its subsidiaries' bottom-lines.
As of December 31, 2014 the balance of the provision for profit sharing, in estimated liabilities, was R$26,508 (R$37,619 on December 31, 2013), with payment expected to take place in April 2015. 28. EARNINGS PER SHARE
Pursuant to the requirements of CPC 41 and the IAS 33 (Earnings per Share), the statement below reconciles the net income for the year with the amounts used to calculate the basic and diluted earnings per share.
2014 2013
NUMERATOR
Net income for the year 662,831 587,335
DENOMINATOR
Weighted average number of common shares 203,934,060 203,934,060
BASIC AND DILUTED EARNINGS PER COMMON SHARE IN R$ 3.250 2.880
In 2014 and 2013 there were no differences between basic and diluted earnings per share.

80
29. NET REVENUE
2014 2013
Supply (Note 30) 10,398,758 9,069,361
Leases, rents and other 59,163 56,778
Revenue from network usage 542,330 661,762
Revenue from construction 940,503 820,284
Revenue from services rendered 75,096 94,193
CDE subsidy 95,318 76,901
Taxed service fee 3,993 4,031
Portion A and other financial items - Unbilled revneue (Note 9) 1,114,170 -
GROSS REVENUE 13,229,331 10,783,310
ICMS (2,430,534) (2,234,816)
PIS / COFINS (1,113,897) (915,580)
Other (5,716) (5,471)
REVENUE TAXES (3,550,147) (3,155,867)
Fuel Consumption Account - CCC - (890)
Energy Development Account - CDE (113,497) (70,908)
Global Reversal Reserve - RGR (7,369) (13,481)
Energy Research Company - EPE (7,263) (6,881)
National Technological Development Fund - FNDCT (14,534) (13,762)
Energy Efficiency Program - PEE (30,479) (28,530)
Research and Development -R&D (14,534) (13,762)
Special obligations (236,697) (34,707)
Other charges - Proinfa (24,441) (22,266)
CONSUMER CHARGES (448,814) (205,187)
TOTAL DEDUCTIONS (3,998,961) (3,361,054)
NET REVENUE 9,230,370 7,422,256
Consolidated
The Company’s revenue has a certain level of seasonality due to temperature variation in its concession area. Revenue increases in the periods recording highest temperatures. The special obligations refer to revenues earned with excess of demand and excessive reactive power charged from consumers, in the amount of R$50,169 and the tariff difference related to the special treatment of non-technical losses of Light SESA’s concession area, totaling R$186,528, which although billed, do not compose the

81
Company’s net revenue since the last tariff revision of subsidiary Light SESA, which took place in November 2013.
30. ELECTRIC POWER SUPPLY
2014 2013 2014 2013 2014 2013
Residential 3,864,608 3,768,989 8,950 8,312 3,190,209 2,872,042
Industrial 7,807 8,093 1,396 1,395 332,805 294,177
Commerce, services and other 322,852 315,460 7,449 7,086 2,346,167 2,109,780
Rural 11,740 11,508 72 57 3,867 3,040
Public sector 11,870 11,397 1,619 1,595 513,185 506,568
Public lighting 782 753 731 688 123,751 106,895
Public utility 1,516 1,455 1,174 1,151 239,052 228,813
Own consumption 447 465 109 107 - -
BILLED SALES 4,221,622 4,118,120 21,500 20,391 6,749,036 6,121,315
ICMS (State VAT) - - - - 2,373,263 2,194,864
Unbilled sales (net of ICMS) - - - - 104,679 (83,227)
TOTAL SUPPLY (c) 4,221,622 4,118,120 21,500 20,391 9,226,978 8,232,952
Sale of energy - - 4,556 4,672 1,007,804 746,882
Short-term energy - - 454 477 163,976 89,527
TOTAL SUPPLY - - 5,010 5,149 1,171,780 836,409
OVERALL TOTAL 4,221,622 4,118,120 26,510 25,540 10,398,758 9,069,361
Consolidated
Number of invoiced bills (a) (b) GWh (a) R$
(a) Not revised by independent auditors (b) Number of invoiced bills in December 2014, with and without consumption (c) Light SESA
31. OPERATING COSTS AND EXPENSES
2014 2013 2014 2013 2014 2013 2014 2013
Personnel and management - - (206,832) (201,625) (17,405) (18,990) (77,817) (103,161)
Material - - (24,155) (15,466) (1,042) (1,011) (1,847) (1,809)
Outsourced services - - (198,203) (206,090) (90,332) (91,127) (163,296) (158,962)
Electricity purchased for resale (Note 32) (5,447,953) (3,848,273) - - - - - -
Depreciation and amortization - - (368,963) (351,463) (1,177) (1,106) (44,695) (38,371)
Allowance for doubtful accounts - - - - (127,517) (157,884) - -
Provision for contingencies/success/judicial deposits - - - - - - (88,739) (52,568)
Cost of construction - - (940,503) (820,284) - - - -
Other - - (44,452) (41,655) (995) (1,448) (82,890) (80,965)
TOTAL (5,447,953) (3,848,273) (1,783,108) (1,636,583) (238,468) (271,566) (459,284) (435,836)
OTHER REVENUES / (EXPENSES) 2014 2013
Other operating revenues 170 124,979
Other operating expenses (41,469) (43,630)
TOTAL (41,299) 81,349
Consolidated
Electric Power Operation Selling General and Administrative
COSTS EXPENSES
Consolidated

83
32. ELECTRIC POWER PURCHASED FOR RESALE
2014 2013 2014 2013
Connection charges - - (8,697) (12,033)
Spot market energy 3,281 1,237 (2,519,189) (447,439)
Network usage charges - - (294,949) (197,890)
UTE Norte Fluminense 6,351 6,351 (1,139,856) (1,088,983)
Itaipu - binational 5,239 5,310 (711,613) (654,712)
Energy transportation - Itaipu - - (19,020) (17,247)
National Electric System Operator (O.N.S.) - - (19,706) (19,526)
PROINFA 521 523 (132,720) (124,317)
ESS - - (95,135) (320,491)
Other contracts and electric power auctions 16,181 15,989 (2,676,234) (2,091,564)
PIS/COFINS credits on purchase - - 513,290 342,629
CDE transfer (b)
Hydrological risk - - 82,801 159,171
Involuntary exposure - - 1,335,922 160,424
Availability (Thermal plants) - - 312,214 -
CONER (Reserve Energy) - - (83,446) -
ESS - - 13,433 178,047
Eletric power purchase expenses (on demand) - - - 303,416
Reserve Energy - - (5,048) (17,758)
TOTAL 31,573 29,410 (5,447,953) (3,848,273)
GWh (a) R$
Consolidated
(a)
Not revised by independent auditors (b)
See Note 11.

84
33. FINANCIAL RESULT
2014 2013
REVENUES
Interest on electricity bills and debts paid by installments 76,593 78,345
Income from investments 110,922 95,113
Swap operations 21,618 80,950
Monetary adjustment of escrow deposits 9,464 15,501
Adjustment to New Replacement Value (VNR) 68,385 44,087
Other financial income (a) 73,530 24,162
TOTAL FINANCIAL REVENUE 360,512 338,158
EXPENSES
Monetary adjustment of provision for contingencies (20,287) (1,090)
Expenses with tax liabilities (11,179) (14,490)
Debt charges (572,070) (519,672)
Exchange rate and monetary variation (157,086) (138,622)
Fines due to electric power outage (33,928) (48,555)
Other financial expenses (a) (25,712) (69,519)
TOTAL FINANCIAL EXPENSES (820,262) (791,948)
FINANCIAL RESULT (459,750) (453,790)
Consolidated
(a)
It refers to sundry revenues and expenses.

85
34. RECONCILIATION OF TAXES IN INCOME STATEMENT
Reconciliation of effective and nominal rates in the provision for income tax and social contribution:
2014 2013 2014 2013
Earnings before income tax and social contribution (LAIR) 662,831 587,335 935,127 852,103
Nominal income tax and social contribution rate 34% 34% 34% 34%
INCOME TAX AND SOCIAL CONTRIBUTION AT THE RATES ESTABLISHED BY THE CURRENT LEGISLATION (225,363) (199,694) (317,943) (289,715)
Equity income 228,963 207,043 45,770 (1,855)
Unrecognized deferred tax credits CVM nº 371/02 - Light S.A. (3,687) (3,138) (3,687) (3,138)
Interest on equity expenses - (3,782) - 36,541
Tax incentives - - 5,313 3,094
Other effects from income tax and social contribution on permanent additions and exclusions 87 (429) (1,749) (9,695)
INCOME TAX AND SOCIAL CONTRIBUTION IN THE RESULT - - (272,296) (264,768)
Current income tax and social contribution - - (116,154) (113,904)
Deferred income tax and social contribution - - (156,142) (150,864)
Effective income tax and social contribution rate N/A N/A 29.1% 31.1%
Parent Company Consolidated
35. FINANCIAL INSTRUMENTS AND RISK MANAGEMENT
The statement below states the carrying amount and fair values of assets and liabilities of our financial instruments:
ASSETS Book value Fair value Book value Fair value
Cash and cash equivalents (Note 4) 14,412 14,412 26,802 26,802
Services 140 140 143 143
Dividends and interest on equity receivable 150,152 150,152 36,153 36,153
Other receivables 4,248 4,248 6,146 6,146
TOTAL 168,952 168,952 69,244 69,244
LIABILITIES
Suppliers 1,351 1,351 295 295
Dividends and interest on equity payable (Note 26) 157,422 157,422 32,019 32,019
Other payables 3,630 3,630 3,960 3,960
TOTAL 162,403 162,403 36,274 36,274
Parent Company
12.31.2014 12.31.2013

86
ASSETS Book value Fair value Book value Fair value
Cash and cash equivalents (Note 4) 401,138 401,138 546,429 546,429
Marketable securities (Note 5) 104,698 104,698 1,244,000 1,244,000
Consumers, Concessionaires, Permissionaires and Clients (Note 6) 1,592,226 1,592,226 1,432,827 1,432,827
Services rendered receivable 38,009 38,009 29,811 29,811
Dividends and interest on equity receivable - - 234 234
Swaps 211,291 211,291 141,214 141,214
Portion A and other financial items (Note 9) 1,114,170 1,114,170 - -
Concessions's financial assets (Note 10) 2,446,443 2,446,443 1,926,226 1,926,226
Other receivables (Note 11) 285,409 285,409 217,082 217,082
TOTAL 6,193,384 6,193,384 5,537,823 5,537,823
LIABILITIES
Suppliers (Note 15) 1,560,390 1,560,390 907,262 907,262
Loans and financing (Note 17) 3,211,497 2,934,240 2,414,967 2,416,091
Debentures (Note 18) 3,370,804 3,364,127 3,400,344 3,373,235
Dividends and interest on equity payable (Note 26) 157,422 157,422 32,019 32,019
Swaps 16,770 16,770 - -
Other payables (Note 23) 286,699 286,699 259,957 259,957
TOTAL 8,603,582 8,319,648 7,014,549 6,988,564
Consolidated
12.31.2014 12.31.2013
In compliance with CVM Rule No. 475/2008 and CVM Resolution No. 604/2009, which revoked Resolution No. 566/2008, the description of accounting balances and fair values of financial instruments stated in the balance sheet as of December 31, 2014 are identified as follows:
• Cash and cash equivalents
Financial investments in bank deposit certificates are classified as “loans and receivables”.
• Marketable securities
Financial investments in bank deposit certificates are classified as “held for trading”, measured at their fair value through profit and loss.
• Consumers, concessionaries and permissionaires (clients)
These are classified as “loans and receivables”, measured at the amortized cost, being recorded at their original values and subject to a provision for losses and adjustment to present value, when applicable.
• Portion A and other financial items
These are classified as “loans and receivables”, measured at the amortized cost and recorded by their original amounts, plus related charges, monetary adjustment and subject to provision for losses, when applicable.
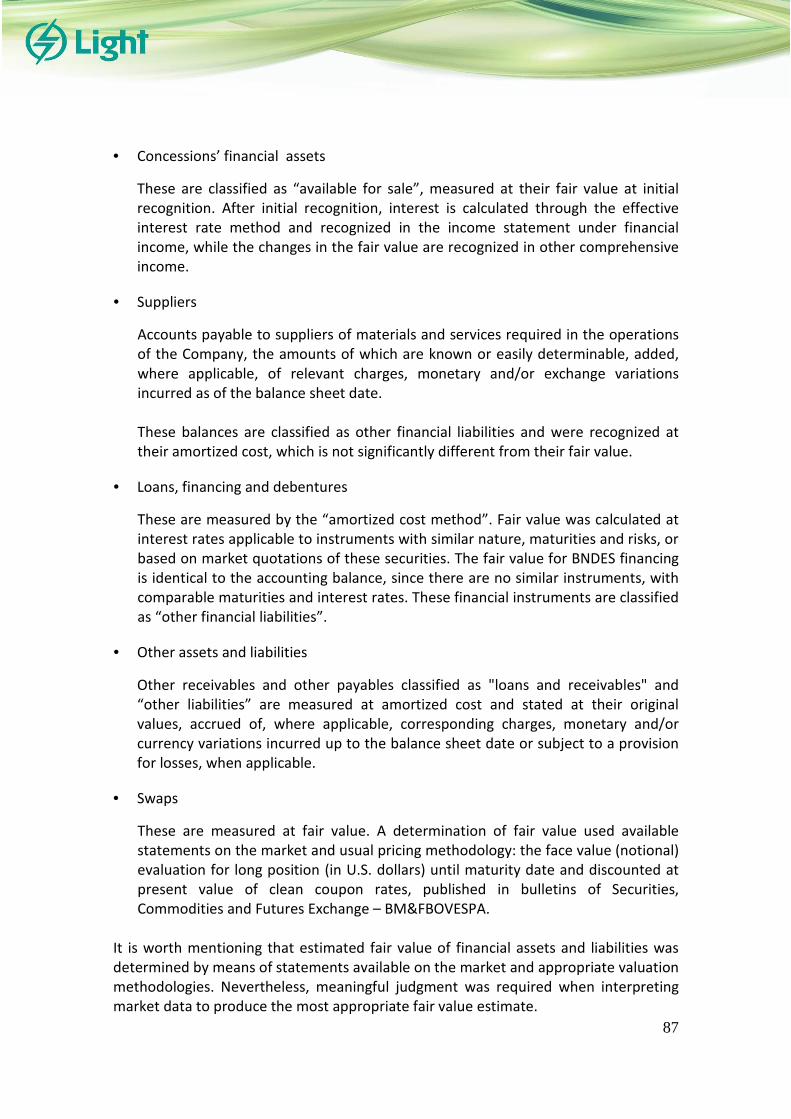
87
• Concessions’ financial assets
These are classified as “available for sale”, measured at their fair value at initial recognition. After initial recognition, interest is calculated through the effective interest rate method and recognized in the income statement under financial income, while the changes in the fair value are recognized in other comprehensive income.
• Suppliers
Accounts payable to suppliers of materials and services required in the operations of the Company, the amounts of which are known or easily determinable, added, where applicable, of relevant charges, monetary and/or exchange variations incurred as of the balance sheet date. These balances are classified as other financial liabilities and were recognized at their amortized cost, which is not significantly different from their fair value.
• Loans, financing and debentures
These are measured by the “amortized cost method”. Fair value was calculated at interest rates applicable to instruments with similar nature, maturities and risks, or based on market quotations of these securities. The fair value for BNDES financing is identical to the accounting balance, since there are no similar instruments, with comparable maturities and interest rates. These financial instruments are classified as “other financial liabilities”.
• Other assets and liabilities
Other receivables and other payables classified as "loans and receivables" and “other liabilities” are measured at amortized cost and stated at their original values, accrued of, where applicable, corresponding charges, monetary and/or currency variations incurred up to the balance sheet date or subject to a provision for losses, when applicable.
• Swaps
These are measured at fair value. A determination of fair value used available statements on the market and usual pricing methodology: the face value (notional) evaluation for long position (in U.S. dollars) until maturity date and discounted at present value of clean coupon rates, published in bulletins of Securities, Commodities and Futures Exchange – BM&FBOVESPA.
It is worth mentioning that estimated fair value of financial assets and liabilities was determined by means of statements available on the market and appropriate valuation methodologies. Nevertheless, meaningful judgment was required when interpreting market data to produce the most appropriate fair value estimate.

88
a) Financial Instruments by category:
12.31.2014
ASSETS
Loans and
receivables
Loans and
receivables
Cash and cash equivalents (Note 4) 14.412 26.802
Services rendered receivable 140 143
Dividends receivable 150.152 36.153
Other receivables 4.248 6.146
TOTAL 168.952 69.244
12.31.2014
LIABILITIES
Other liabilities Other liabilities
Suppliers 1.351 295
Dividends and interest on equity payable (Note 26) 157.422 32.019
Other payables 3.630 3.960
TOTAL 162.403 36.274
Parent Company
12.31.2013
Parent Company
12.31.2013
ASSETS
Loans and
receivables
Fair value
through profit
and loss
Available for
sale
Loans and
receivables
Fair value
through profit
and loss
Available for
sale
Cash and cash equivalents (Note 4) 401,138 - - 546,429 - -
Marketable securities (Note 5) - 104,698 - - 1,244,000 -
Consumers, Concessionaires, Permissionaires and Clients (Note 6) 1,592,226 - - 1,432,827 - -
Services rendered receivable 38,009 - - 29,811 - -
Dividends and interest on equity receivable - - - 234 - -
Swaps - 211,291 - - 141,214 -
Portion A and other financial items (Note 9) 1,114,170 - - - - -
Concessions' financial assets (Note 10) - - 2,446,443 - - 1,926,226
Other receivables (Note 11) 285,409 - - 217,082 - -
TOTAL 3,430,952 315,989 2,446,443 2,226,383 1,385,214 1,926,226
LIABILITIES
Other liabilities
Fair value
through profit
and loss
Other liabilities
Fair value
through profit
and loss
Suppliers (Note 15) 1,560,390 - 907,262 -
Loans and financing (Note 17) 3,211,497 - 2,414,967 -
Debentures (Note 18) 3,370,804 - 3,400,344 -
Dividends and interest on equity payable (Note 26) 157,422 - 32,019 -
Swaps - 16,770 - -
Other payables (Note 23) 286,699 - 259,957 -
TOTAL 8,586,812 16,770 7,014,549 -
12.31.2013
Consolidated
12.31.2014 12.31.2013
Consolidated
12.31.2014
b) Policy concerning derivative instruments The Company has a policy of using derivative instruments, which has been approved by its Board of Directors. According to this policy, the debt service (principal plus

89
interest and charges) denominated in foreign currency maturing within 24 months is to be hedged, except no speculative transaction is allowed, whether using derivatives or any other risky assets. In line with the policy standards, the Company does not have any options, swaps, callable swaps, flexible options, derivatives embedded in other products, derivative-structured transactions and so-called “exotic derivatives”. Furthermore, the statement above denotes that the Company use cashless exchange rate swaps (US$ vs. CDI), of which the Notional Contract Value is equal to the amount of the debt service denominated in foreign currency maturing in 24 months. c) Risk management and goals achieved Management of derivative instruments is achieved through operating strategies with a view to liquidity, profitability and safety. Our control policy consists of ongoing enforcement of policy standards concerning the use of derivative instruments, as well as continued monitoring of agreed upon rates versus market rates. d) Market Risk During the normal course of its businesses, the Company and its subsidiaries are exposed to the market risks related to currency variations and interest rates, as evidenced in the chart below: Debt breakdown (excluding financial charges):
R$ % R$ %
USD 1,291,410 20.0 725,941 12.6
EUR 163,335 2.5 113,701 2.0
TOTAL - FOREIGN CURRENCY 1,454,745 22.5 839,642 14.6
CDI 3,039,168 47.1 3,269,168 57.0
IPCA 610,436 9.4 610,137 10.6
TJLP 937,048 14.5 903,027 15.7
Other 422,369 6.5 119,528 2.1
TOTAL - LOCAL CURRENCY 5,009,021 77.5 4,901,860 85.4
TOTAL 6,463,766 100.0 5,741,502 100.0
Consolidated
12.31.2014 12.31.2013
On December 31, 2014, according to the chart above, the foreign currency-denominated debt is R$1,454,745, or 22.5% of total debt (R$839,642, corresponding to 14.6% on December 31, 2013). Financial derivative instruments were contracted for the amount of foreign currency-denominated debt service to expire within 24 months, in the swap modality, whose notional value on December 31, 2014 stood at US$491,407 (US$296,913 on December

90
31, 2013) and €50,000 (€34,969 on December 31, 2013), according to the policy for utilization of derivative instruments approved by the Board of Directors. Thus, including the swaps, the foreign exchange exposure represents 0.45% of total debt (1.40% on December 31, 2013). Below, we provide a few considerations and analyses on risk factors impacting on business of Light Group’s companies:
• Currency risk Considering that a portion of loans and financing is denominated in foreign currency, the company uses derivative financial instruments (swap operations) to hedge against service associated with these debts (principal plus interest and commissions) to expire within 24 months in addition to the swap of previously mentioned rates. Funds raised as per BACEN Resolution 4131 from Merrill Lynch, BNP, Citibank, Itaú and Bank Tokyo were already contracted with swap for the entire duration of the debt, duly previously approved by the Board of Directors. Derivative operations, comprising currency swaps and interest, the latter reported below, resulted in a gain of R$21,618 in 2014 (R$ 80,950 gain in 2013). The net amount of swap operations as of December 31, 2014, considering the fair value, is positive at R$194,521 (positive at R$141,214 on December 31, 2013), as shown below:
Institution Currency Light's Receivable Light's PayableStarting
Date
Maturity
Date
Notional
Value
Contracted
(US$/EURO)
Fair Value
Dec 2014
(R$) Assets
Fair Value
Dec 2014
(R$)
Liabilities
Fair Value
Dec 2014
(R$) Balance
Bank Tokyo US$ US$+2.33% 100% CDI + 0.90% 03.11.2013 03.11.2016 60,000 40,823 (508) 40,315
Itaú US$ US$+2.42% 100% CDI 04.11.2012 04.11.2014 2,715 - - -
HSBC US$ US$ 83.29% CDI 09.20.2013 04.10.2015 1,431 611 (354) 257
HSBC US$ US$ 82.65% CDI 09.20.2013 10.09.2015 1,433 601 (348) 253
Citibank US$ US$+Libor+1.66% 100% CDI + 1.00% 08.23.2012 02.23.2017 33,333 20,105 (638) 19,467
Citibank US$ US$+Libor+1.66% 100% CDI + 1.00% 08.23.2012 08.23.2017 33,333 20,254 (640) 19,614
Citibank US$ US$+Libor+1.66% 100% CDI + 1.00% 08.23.2012 02.23.2018 33,333 20,546 (642) 19,904
Citibank R$ US$+Libor+1.51% 100% CDI +1.15% 02.25.2014 02.26.2018 100,000 24,777 (2,353) 22,424
Citibank US$ US$+Libor+1.5988% 100% CDI + 1.10% 10.02.2012 04.03.2017 26,666 15,669 (1,253) 14,416
Citibank US$ US$+Libor+1.5988% 100% CDI + 1.10% 10.02.2012 10.02.2017 26,667 15,760 (1,257) 14,503
Citibank US$ US$+Libor+1.5988% 100% CDI + 1.10% 10.02.2012 04.03.2018 26,667 15,976 (1,261) 14,715
BNP EUR Eur + 2.2706% CDI+1.40% 10.22.2014 10.24.2016 50,000 908 (3,089) (2,181)
Itaú US$ US$ + 3.54000% CDI+1.75% 12.16.2014 12.12.2016 50,047 - (2,772) (2,772)
Merrill Lynch US$ Libor+2.5294% 100%CDI + 0.65% 11.10.2011 11.10.2016 50,000 33,835 (587) 33,248
Bank Tokyo US$ US$+2.85% 100% CDI+0.88% 11.24.2014 11.21.2017 20,000 1,080 (475) 605
Itaú US$ US$+3.03% 100% CDI+1.50% 12.15.2014 12.12.2016 25,782 - (593) (593)
TOTAL 541,407 210,945 (16,770) 194,175

91
Institution Currency Light's Receivable Light's PayableStarting
Date
Maturity
Date
Notional
Value
Contracted
(US$/EURO)
Fair Value
Dec 2013
(R$) Assets
Fair Value
Dec 2013
(R$)
Liabilities
Fair Value
Dec 2013
(R$) Balance
Bank Tokyo US$ US$+2.33% 100% CDI + 0.90% 03.11.2013 03.11.2016 60,000 22,917 - 22,917
Itaú US$ US$+2.42% 100% CDI 04.11.2012 04.11.2014 2,715 978 - 978
HSBC US$ US$+1.67% 100% CDI 10.09.2012 10.10.2014 1,338 214 - 214
HSBC US$ US$ 83.29% CDI 09.20.2013 04.10.2015 1,431 120 - 120
HSBC US$ US$ 82.65% CDI 09.20.2013 10.09.2015 1,432 105 - 105
Citibank US$ US$+Libor+1.66% 100% CDI + 1.00% 08.23.2012 02.23.2017 33,333 10,339 - 10,339
Citibank US$ US$+Libor+1.66% 100% CDI + 1.00% 08.23.2012 08.23.2017 33,333 10,504 - 10,504
Citibank US$ US$+Libor+1.66% 100% CDI + 1.00% 08.23.2012 02.23.2018 33,333 10,708 - 10,708
Citibank US$ US$+Libor+1.5988% 100% CDI + 1.10% 10.02.2012 04.03.2017 26,666 7,145 - 7,145
Citibank US$ US$+Libor+1.5988% 100% CDI + 1.10% 10.02.2012 10.02.2017 26,666 7,260 - 7,260
Citibank US$ US$+Libor+1.5988% 100% CDI + 1.10% 10.02.2012 04.03.2018 26,666 7,408 - 7,408
Merrill Lynch US$ Libor+2.5294% 100%CDI + 0.65% 11.10.2011 11.10.2016 50,000 31,209 - 31,209
BNP EURO Euro+4.6823% 100%CDI+1.30% 10.21.2011 10.21.2014 34,969 29,958 - 29,958
TOTAL 331,882 138,865 - 138,865 The amount recorded was measured by its fair value on December 31st, 2014. All operations with derivative financial instruments are registered in clearing houses for the custody and financial settlement of securities and there is no margin deposited in guarantee. Operations have no initial cost. Below, the sensitivity analysis for foreign exchange rates fluctuations, showing eventual impacts on financial result. These sensitivity analyses were prepared assuming that the equity balances were outstanding during entire year. The methodology used in the “Probable Scenario” considered the best estimate for the foreign exchange rate on December 31, 2015. It is worth highlighting that, as this refers to a sensitivity analysis of the impact on the financial result of the next 12 months, debt balances on December 31, 2014 were considered. It is worth mentioning that the behavior of debt and derivatives balances will observe their respective contracts, and the balance of temporary cash investments will fluctuate according to the need or available funds of the Company and its subsidiaries.

92
Exchange Rate Sensitivity Analysis, with the presentation of effects on the income statement before taxes, based on rates and projections of the following sources: BM&FBOVESPA (on January 27, 2015), BNDES (on January 1, 2015), FOCUS (on January 16, 2015) and Bloomberg (on January 28, 2015).
OPERATION Risk
Debt (USD
and EUR)
thousand
Scenario (I):
Probable
Scenario (II) +
25%
Scenario (III) +
50%
FINANCIAL LIABILITIES (41,849) 333,550 708,946
NATIONAL TREASURY PAR BOND - DEBT 1996 USD 39,422 (2,515) 24,292 51,099
NATIONAL TREASURY PAR BOND - SURETY 1996 USD (31,178) 1,989 (19,212) (40,413)
NATIONAL TREASURY DISCOUNT BOND - DEBT 1996 USD 27,237 (1,738) 16,784 35,305
NATIONAL TREASURY DISCOUNT BOND - SURETY 1996 USD (21,791) 1,390 (13,428) (28,245)
4131 BOFA OPERATION - 2011 USD 37,362 (2,384) 23,022 48,428
4131 CITI OPERATION - 2012 USD 100,200 (6,393) 61,743 129,879
4131 TOKYO OPERATION - 2013 USD 60,071 (3,833) 37,016 77,864
4131 CITI OPERATION - 2014 USD 100,174 (6,391) 61,728 129,846
4131 ITAÚ OPERATION - 2014 USD 25,812 (1,647) 15,905 33,457
4131 TOKYO OPERATION - 2014 USD 20,051 (1,279) 12,356 25,990
4131 CITI OPERATION - 2012 - ENERGY USD 80,367 (5,127) 49,522 104,171
4131 BNP OPERATION - 2014 EURO 50,805 (10,724) 32,944 76,612
4131 ITAÚ OPERATION - 2014 - ENERGY USD 50,110 (3,197) 30,878 64,953
DERIVATIVES 45,228 (366,190) (777,604)
Swaps (long position) USD 540,807 34,504 (333,246) (700,992)
Swaps (long position) EURO 50,805 10,724 (32,944) (76,612)
TOTAL GAINS (LOSSES) 3,379 (32,640) (68,658)
Reference for Financial Assets and Liabilities -25% -50%
R$/US$ exchange rate (end of the year) 2.7200 2.0400 1.3600
R$/EURO exchange rate (end of the year) 3.4381 2.5786 1.7190
R$
With the chart above, it is possible to identify that the partial hedge against foreign currency-denominated debt (only limited to debt service to expire within 24 months), as when R$/US$ quote increases, liabilities financial expense also increases but the derivatives gain also partially offsets this negative impact and vice-versa.
• Interest rate risk This risk derives from impact of interest rates fluctuation not only over financial expense associated with loans, financing and debentures of the Company, but also over financial revenues deriving from temporary cash investments. The policy for utilization of derivatives approved by the Board of Directors does not comprise the contracting of instruments against such risk. Nevertheless, the Company continuously monitors interest rates so that to evaluate eventual need of contracting derivatives to hedge
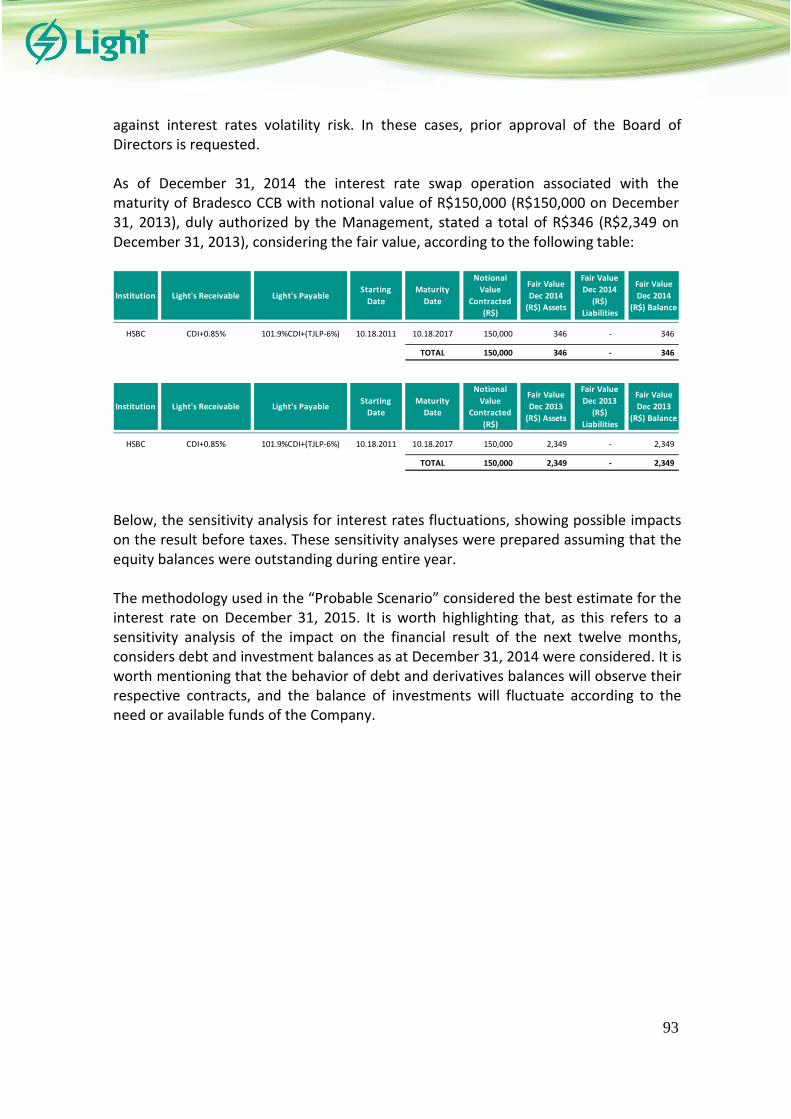
93
against interest rates volatility risk. In these cases, prior approval of the Board of Directors is requested. As of December 31, 2014 the interest rate swap operation associated with the maturity of Bradesco CCB with notional value of R$150,000 (R$150,000 on December 31, 2013), duly authorized by the Management, stated a total of R$346 (R$2,349 on December 31, 2013), considering the fair value, according to the following table:
Institution Light's Receivable Light's PayableStarting
Date
Maturity
Date
Notional
Value
Contracted
(R$)
Fair Value
Dec 2014
(R$) Assets
Fair Value
Dec 2014
(R$)
Liabilities
Fair Value
Dec 2014
(R$) Balance
HSBC CDI+0.85% 101.9%CDI+(TJLP-6%) 10.18.2011 10.18.2017 150,000 346 - 346
TOTAL 150,000 346 - 346
Institution Light's Receivable Light's PayableStarting
Date
Maturity
Date
Notional
Value
Contracted
(R$)
Fair Value
Dec 2013
(R$) Assets
Fair Value
Dec 2013
(R$)
Liabilities
Fair Value
Dec 2013
(R$) Balance
HSBC CDI+0.85% 101.9%CDI+(TJLP-6%) 10.18.2011 10.18.2017 150,000 2,349 - 2,349
TOTAL 150,000 2,349 - 2,349 Below, the sensitivity analysis for interest rates fluctuations, showing possible impacts on the result before taxes. These sensitivity analyses were prepared assuming that the equity balances were outstanding during entire year. The methodology used in the “Probable Scenario” considered the best estimate for the interest rate on December 31, 2015. It is worth highlighting that, as this refers to a sensitivity analysis of the impact on the financial result of the next twelve months, considers debt and investment balances as at December 31, 2014 were considered. It is worth mentioning that the behavior of debt and derivatives balances will observe their respective contracts, and the balance of investments will fluctuate according to the need or available funds of the Company.

94
Below is the interest rate sensitivity analysis, showing the effects on income statement before taxes, based on rates and projections of the following sources: BM&F BOVESPA (on January 27, 2015), BNDES (on January 1, 2015), FOCUS (on January 16, 2015) and Bloomberg (on January 28, 2015).
OPERATIONRisk
Scenario (I):
Probable
Scenario (II) +
25%
Scenario (III) +
50%
FINANCIAL ASSETS 5,089 19,505 33,921
Financial investments CDI 5,089 19,505 33,921
FINANCIAL LIABILITIES (44,633) (178,725) (311,816)
NATIONAL TREASURY DISCOUNT BOND - DEBT 1996 Libor6M (33) (108) (182)
CCB BRADESCO - 2007 CDI (2,608) (9,995) (17,382)
BNDES - CAPEX 2009/10 SUB A TJLP (330) (1,355) (2,285)
BNDES - CAPEX 2009/10 SUB B TJLP (330) (1,400) (2,341)
BNDES - CAPEX 2009/10 SUB D TJLP - (1) (2)
BNDES - CAPEX 2009/10 SUB E TJLP - (1) (2)
BNDES - CAPEX 2009/10 SUB N TJLP (1) (3) (4)
BNDES - CAPEX 2009/10 SUB O TJLP (1) (3) (4)
BNDES - CAPEX 2009/10 SUB P TJLP (2) (9) (15)
BNDES - CAPEX 2009/10 SUB Q TJLP (2) (9) (15)
BNDES - CAPEX 2011/12 SUB 1 TJLP (15) (57) (99)
BNDES - CAPEX 2011/12 SUB 2 TJLP (746) (2,982) (5,070)
BNDES - CAPEX 2011/12 SUB 3 TJLP (897) (3,363) (5,829)
BNDES - CAPEX 2011/12 SUB 4 TJLP (895) (3,750) (6,290)
BNDES - CAPEX 2011/12 SUB 17 TJLP - - (1)
BNDES - CAPEX 2011/12 SUB 18 TJLP - - (1)
4131 BOFA OPERATION - 2011 Libor3M (155) (259) (362)
DEBENTURES - 8th ISSUE 2012 CDI (5,368) (20,575) (35,782)
4131 CITI OPERATION - 2012 Libor3M (414) (690) (966)
BNDES - CAPEX 2013/14 SUB A TJLP (897) (3,705) (6,240)
BNDES - CAPEX 2013/14 SUB B FIXED (670) (3,133) (5,597)
BNDES - CAPEX 2013/14 SUB D TJLP (20) (81) (137)
BNDES - CAPEX 2013/14 SUB E FIXED (15) (69) (123)
BNDES - 2013/16 OLYMPICS SUB A TJLP (98) (401) (677)
BNDES - 2013/16 OLYMPICS SUB B TJLP (98) (415) (693)
BNDES - 2013/16 OLYMPICS SUB C SELIC (137) (639) (1,142)
BNDES - 2013/16 OLYMPICS SUB D TJLP (13) (54) (91)
BNDES - 2013/16 OLYMPICS SUB E TJLP (13) (56) (93)
BNDES - 2013/16 OLYMPICS SUB F SELIC (18) (86) (153)
CCB BANCO DO BRASIL - 2013 CDI (1,936) (7,429) (12,937)
DEBENTURES-9th ISSUE 2013 - 1st SERIES CDI (11,450) (43,885) (76,319)
DEBENTURES-9th ISSUE 2013 - 2nd SERIES IPCA (762) (12,313) (23,864)
DEBENTURES - 10th ISSUE 2014 CDI (9,933) (38,149) (66,481)
4131 CITI OPERATION - 2014 Libor3M (413) (689) (965)
4131 ITAÚ OPERATION - 2014 Libor3M (108) (180) (252)
BNDES - CAPEX 2009/10 SUB A - ENERGY TJLP (14) (58) (97)
BNDES - CAPEX 2009/10 SUB B - ENERGY TJLP (14) (60) (100)
BNDES - CAPEX 2011/12 SUB 1 - ENERGY TJLP (71) (284) (484)
BNDES - CAPEX 2011/12 SUB 2 - ENERGY TJLP (42) (169) (288)
DEBENTURES - 2nd ISSUE 2011 CDI (5,020) (19,238) (33,457)
DEBENTURES - 3nd ISSUE 2012 CDI (341) (1,309) (2,276)
4131 CITI OPERATION - 2012 - ENERGY Libor 3M (332) (553) (775)
4131 ITAÚ OPERATION - 2014 - ENERGY Libor 3M (211) (352) (492)
LOAN LIABILITIES - DEBENTURES 4th ISSUE TJLP (9) (37) (61)
BNDES - ABL 2010 TJLP - (2) (3)
BNDES - QUARTIER 2010 SUB A TJLP - - (1)
BNDES - IGUATEMI 2010 SUB A TJLP (2) (8) (13)
BNDES - IGUATEMI 2010 SUB C TJLP - (1) (2)
BNDES - CASTELO BRANCO 2010 SUB A TJLP (5) (20) (34)
BNDES - CASTELO BRANCO 2010 SUB C TJLP (1) (4) (7)
BNDES - SÃO BENTO 2011 TJLP (1) (5) (8)
BNDES - CENTRO MEDICO BOTAFOGO 2011 SUB A TJLP - (2) (3)
BNDES - CENTRO MEDICO BOTAFOGO 2011 SUB B TJLP - (2) (3)
BNDES - SP MARKET 2012 TJLP (19) (76) (129)
BNDES - COCA-COLA 2013 SUB A TJLP (94) (381) (645)
BNDES - COCA-COLA 2013 SUB C TJLP (27) (109) (184)
BNDES - NOVA AMÉRICA 2013 SUB A TJLP (41) (168) (285)
BNDES - NOVA AMÉRICA 2013 SUB C TJLP (11) (43) (73)
DERIVATIVES (16,090) (65,251) (114,394)
Currency swaps (short position) CDI (17,739) (67,972) (118,184)
Interest rate swaps (long position) LIBOR 6M 33 108 182
Interest rate swaps (long position) LIBOR 3M 1,648 2,742 3,836
Interest rate swaps (long position) CDI 2,609 9,995 17,382
Interest rate swaps (short position) TJLP/CDI (2,641) (10,124) (17,610)
TOTAL LOSS (55,634) (224,471) (392,289)
Reference for FINANCIAL ASSETS +25% +50%
CDI (% end of the year) 12.69% 15.86% 19.04%
Reference for FINANCIAL LIABILITIES +25% +50%
CDI (% end of the year) 12.69% 15.86% 19.04%
TJLP (% end of the year) 5.50% 6.88% 8.25%
IPCA (% end of the year) 6.67% 8.34% 10.01%
Selic (average % for the year) 12.50% 15.63% 18.75%
Libor 3M (% end of the year) 0.41% 0.51% 0.61%
Libor 6M (% end of the year) 0.41% 0.51% 0.61%
R$

95
• Credit risk
It refers to the Company eventually suffering losses deriving from default of counterparties or financial institutions depositary of funds or temporary cash investments. To mitigate these risks, the Company uses all collection tools allowed by the regulatory body, such as disconnection for delinquency, debit losses and permanent monitoring and negotiation of outstanding positions. Credit risk of receivables is diluted due to the Company´s client base. Item "a" of this note contains a summary of the financial instruments broken down by category, including the Company's maximum credit risk. Concerning financial institutions, the Company only carries out low-risk operations, classified by rating agencies. The Company has a policy of not concentrating its portfolio in certain financial institution. Therefore, the policy’s principle is to control the portfolio concentration through limits imposed to the Groups, as defined below, and monitoring financial institutions through their shareholders’ equity and ratings. Through its policy, the Company will be able to invest in fixed income products and Interbank Deposit Rate (CDI)-indexed post-fixed income and post-fixed government bonds. The definition of the groups for allocation of resources is described below, as well as the percentage of current share in the Company’s portfolio:
• Group 1 – federal banks; shareholders’ equity: not applicable; minimum rating: Not applicable; percentage in the portfolio: 24.4%.
• Group 2 – Financial Institutions with Shareholders’ Equity higher than or equal to R$7 billion; Minimum Rating: AA (S&P and Fitch) or Aaa (Moody’s). Percentage in the portfolio: 57.5%.
• Group 3 – Financial institutions with Shareholders’ Equity between R$1 billion and R$7 billion; Minimum Rating: AA (S&P and Fitch) or Aaa (Moody's). Percentage in the Portfolio: 17.9%.
• Group 4 – Financial Institutions with Shareholders’ Equity between R$500 million and R$1 billion; Minimum Rating: A (S&P and Fitch) or A2 (Moody’s). Percentage in the portfolio: 0.2%.
• Liquidity risk Liquidity risk relates to the Company's ability to settle its liabilities. In order to determine the ability to satisfactorily meet its financial liabilities, the streams of maturities for funds raised and other liabilities are reported with the Company's
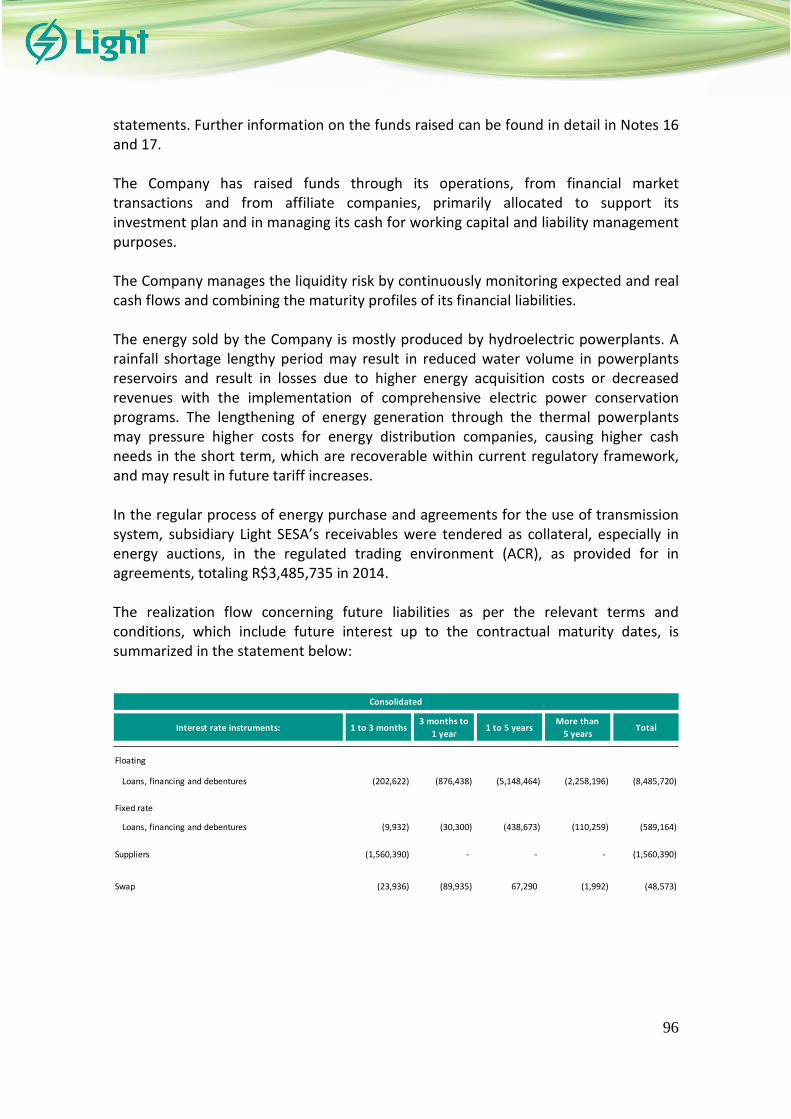
96
statements. Further information on the funds raised can be found in detail in Notes 16 and 17. The Company has raised funds through its operations, from financial market transactions and from affiliate companies, primarily allocated to support its investment plan and in managing its cash for working capital and liability management purposes. The Company manages the liquidity risk by continuously monitoring expected and real cash flows and combining the maturity profiles of its financial liabilities. The energy sold by the Company is mostly produced by hydroelectric powerplants. A rainfall shortage lengthy period may result in reduced water volume in powerplants reservoirs and result in losses due to higher energy acquisition costs or decreased revenues with the implementation of comprehensive electric power conservation programs. The lengthening of energy generation through the thermal powerplants may pressure higher costs for energy distribution companies, causing higher cash needs in the short term, which are recoverable within current regulatory framework, and may result in future tariff increases. In the regular process of energy purchase and agreements for the use of transmission system, subsidiary Light SESA’s receivables were tendered as collateral, especially in energy auctions, in the regulated trading environment (ACR), as provided for in agreements, totaling R$3,485,735 in 2014. The realization flow concerning future liabilities as per the relevant terms and conditions, which include future interest up to the contractual maturity dates, is summarized in the statement below:
Interest rate instruments: 1 to 3 months3 months to
1 year1 to 5 years
More than
5 yearsTotal
Floating
Loans, financing and debentures (202,622) (876,438) (5,148,464) (2,258,196) (8,485,720)
Fixed rate
Loans, financing and debentures (9,932) (30,300) (438,673) (110,259) (589,164)
Suppliers (1,560,390) - - - (1,560,390)
Swap (23,936) (89,935) 67,290 (1,992) (48,573)
Consolidated

97
• Social and environmental risks Good Environmental Management practices are present in the activities of different areas of the Company. Light’s Environmental Management System (SGA), based on international standard ISO 14001, was implemented in 2001 to create environmental quality standards in the distribution and generation of energy. In compliance with environmental management requirements, the system prevents fines, embargoes to projects, accidents, legal proceedings and damage to the Company’s image. In addition to ISO 14001 certification, the Company’s hydroelectric powerplants are certified according to OHSAS 18001 and ISO 9001 occupational health and safety standards and quality standards, comprising an Integrated Management System (SGI). Activities related to the operation and maintenance of energy distribution grids and generation units involve the risk of accidents involving workers. In this regard, in 2014, the Company intensified actions towards fomenting a culture of sustainable results and internalize the “value of life”, through the commitment of leadership and workforce, education, continued human development, transparency and integrity. The qualification of field teams, the development of leaders and successors, self-development actions, besides knowledge management actions. The “Programa Vida!” (Life Program) started its second phase of workforce awareness, promoting new workshops to reinforce the relevance of safe behavior and the ongoing commitment towards value of life. Former multipliers went through a recycling training and new ones have been trained. Communication actions, specific campaigns and commemorative dates guided the awareness actions throughout the year. With regard to the benefits offered by the Company to its employees, in addition to private pension plans, managed by Braslight, the Company’s social benefits include mainly food aid, Christmas food aid, daycare aid, sick pay, social and psychological assistance, periodical health exams and scholarships at Colégio 1º de Maio. Regarding social initiatives, in 2014, the Company maintained its partnership with the state government, serving areas where new Pacifying Police Units (UPPs) were installed with reform actions and expansion of low and medium voltage network, installation and replacement of transformers, installation of poles, client re-registration and registration, besides the Efficient Community actions and “Light Recicla” (Light Recycles). The Efficient Community Project promotes the replacement of electric equipment with more efficient models, the Procel Seal and the awareness on the energy efficient use. The “Light Recicla” consists of exchanging the recyclable material with electricity bill rebates, thus, reducing the environmental impacts by re-using the solid waste and offering an alternative to ensure the payment of the electricity bill. As a result, the Company establishes a new client relationship, stimulating the energy efficiency, disseminating the social tariff and contributing to improve the life quality of people living in these communities, thus, adjusting consumption to alternatives of payment. As benefit for the company, energy theft and delinquency decrease. Also in
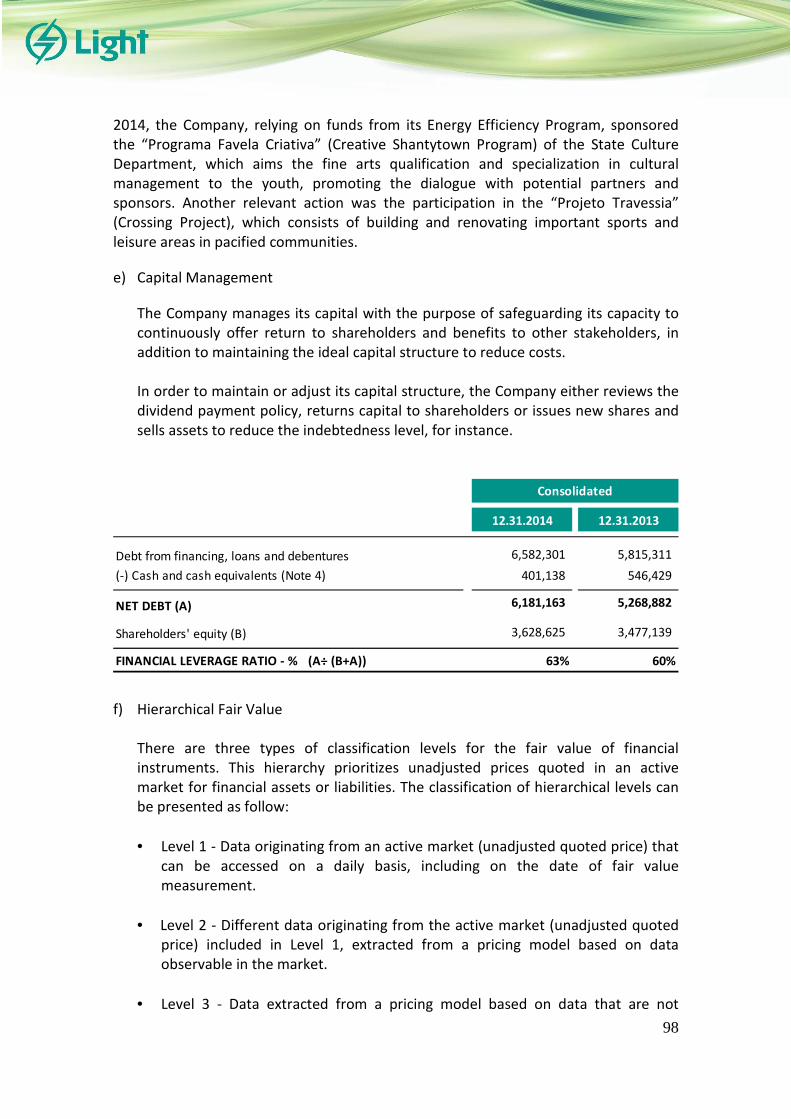
98
2014, the Company, relying on funds from its Energy Efficiency Program, sponsored the “Programa Favela Criativa” (Creative Shantytown Program) of the State Culture Department, which aims the fine arts qualification and specialization in cultural management to the youth, promoting the dialogue with potential partners and sponsors. Another relevant action was the participation in the “Projeto Travessia” (Crossing Project), which consists of building and renovating important sports and leisure areas in pacified communities.
e) Capital Management
The Company manages its capital with the purpose of safeguarding its capacity to continuously offer return to shareholders and benefits to other stakeholders, in addition to maintaining the ideal capital structure to reduce costs. In order to maintain or adjust its capital structure, the Company either reviews the dividend payment policy, returns capital to shareholders or issues new shares and sells assets to reduce the indebtedness level, for instance.
12.31.2014 12.31.2013
Debt from financing, loans and debentures 6,582,301 5,815,311
(-) Cash and cash equivalents (Note 4) 401,138 546,429
NET DEBT (A) 6,181,163 5,268,882
Shareholders' equity (B) 3,628,625 3,477,139
FINANCIAL LEVERAGE RATIO - % (A÷ (B+A)) 63% 60%
Consolidated
f) Hierarchical Fair Value
There are three types of classification levels for the fair value of financial instruments. This hierarchy prioritizes unadjusted prices quoted in an active market for financial assets or liabilities. The classification of hierarchical levels can be presented as follow:
• Level 1 - Data originating from an active market (unadjusted quoted price) that can be accessed on a daily basis, including on the date of fair value measurement.
• Level 2 - Different data originating from the active market (unadjusted quoted price) included in Level 1, extracted from a pricing model based on data observable in the market.
• Level 3 - Data extracted from a pricing model based on data that are not

99
observable in the market.
12.31.2014Identical markets
Level 1
Similar markets
Level 2
Without active
market
Level 3
ASSETS
Marketable securities (Note 5) 104,698 - 104,698 -
Concessions' financial assets (Note 10) 2,446,443 - - 2,446,443
Swaps 211,291 - 211,291 -
TOTAL 2,762,432 - 315,989 2,446,443
LIABILITIES
Swaps 16,770 - 16,770 -
TOTAL 16,770 - 16,770 -
Consolidated
Measurement of Fair Value
12.31.2013Identical markets
Level 1
Similar markets
Level 2
Without active
market
Level 3
ASSETS
Marketable securities (Note 5) 1,244,000 - 1,244,000 -
Concessions' financial assets (Note 10) 1,926,226 - - 1,926,226
Swaps 141,214 - 141,214 -
TOTAL 3,311,440 - 1,385,214 1,926,226
Measurement of Fair Value
Consolidated
The market value of a security corresponds to its maturity amount brought to present value through the discount factor obtained based on the market interest curve in reais. Regarding the concession’s financial assets, classified as available for sale, the inclusion in level 3 was due to the fact that the relevant factors for the valuation at fair value were not publicly observable. The changes between the years and the respective gains and losses in the income statement for the year are described in Note 10; there was no impact on shareholders’ equity. 36. INSURANCE
On December 31, 2014, the Light Group had insurances covering its main assets, including: Operational Risk Insurance - it covers damages caused to hydroelectric and thermoelectric powerplants, including, but not limited to its machinery, steam turbines, gas turbines, generators, boilers, transformers, channels, tunnels, dams, spillway, civil works, offices and warehouses. All assets are insured under the
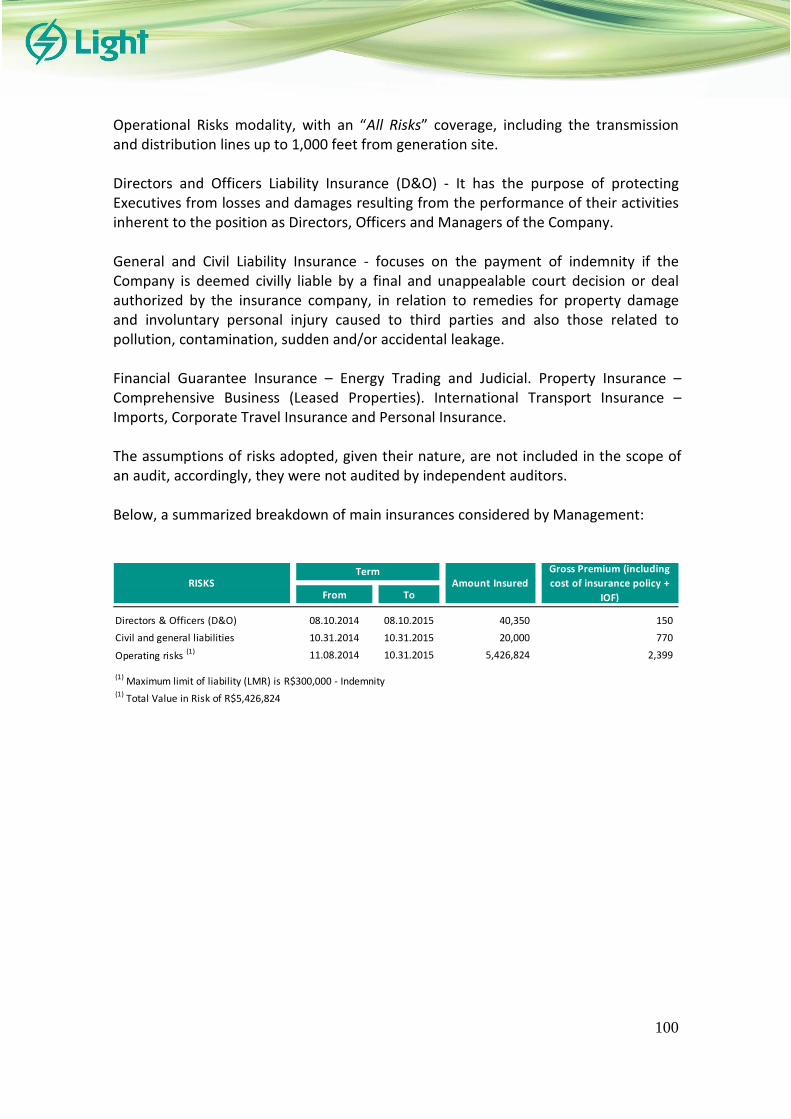
100
Operational Risks modality, with an “All Risks” coverage, including the transmission and distribution lines up to 1,000 feet from generation site. Directors and Officers Liability Insurance (D&O) - It has the purpose of protecting Executives from losses and damages resulting from the performance of their activities inherent to the position as Directors, Officers and Managers of the Company. General and Civil Liability Insurance - focuses on the payment of indemnity if the Company is deemed civilly liable by a final and unappealable court decision or deal authorized by the insurance company, in relation to remedies for property damage and involuntary personal injury caused to third parties and also those related to pollution, contamination, sudden and/or accidental leakage. Financial Guarantee Insurance – Energy Trading and Judicial. Property Insurance – Comprehensive Business (Leased Properties). International Transport Insurance – Imports, Corporate Travel Insurance and Personal Insurance. The assumptions of risks adopted, given their nature, are not included in the scope of an audit, accordingly, they were not audited by independent auditors. Below, a summarized breakdown of main insurances considered by Management:
From To
Directors & Officers (D&O) 08.10.2014 08.10.2015 40,350 150
Civil and general liabilities 10.31.2014 10.31.2015 20,000 770
Operating risks (1) 11.08.2014 10.31.2015 5,426,824 2,399
(1) Total Value in Risk of R$5,426,824
(1) Maximum limit of liability (LMR) is R$300,000 - Indemnity
TermAmount Insured
Gross Premium (including
cost of insurance policy +
IOF)
RISKS

101
37. SEGMENT REPORTING
Segment reporting was prepared according to CPC 22 (operating segments), equivalent to IFRS 8, and is reported in relation to the business of the Company, identified based on their management structure and internal management information.
The Company's Management considers the following segments: power distribution, power generation, power trading and others (including the holding company). The eliminations comprise intersegment balances, transactions and interests. The Company is segmented according to its operation, which has different risks and compensation. No Company’s client accounts represents more than 10% of revenue or receivables. Segment information for the years ended December 31, 2014 and 2013 is presented below:
Distribution Generation Trading Other EliminationsConsolidated
12.31.2014
Assets:
Current assets 2,628,993 238,221 186,749 173,510 (272,221) 2,955,252
Other non-current assets 4,074,284 49,602 79,153 312 - 4,203,351
Investments 19,424 601,473 - 3,621,983 (3,416,233) 826,647
Property, plant and equipment 266,263 1,343,259 94,774 791 - 1,705,087
Intangible assets 3,940,558 2,248 906 145 - 3,943,857
TOTAL ASSETS 10,929,522 2,234,803 361,582 3,796,741 (3,688,454) 13,634,194
Liabilities and shareholders' equity:
Current liabilities 2,640,571 210,518 181,502 164,402 (272,221) 2,924,772
Non-current liabilities 5,807,357 1,221,670 50,869 901 - 7,080,797
Shareholders' equity 2,481,594 802,615 129,211 3,631,438 (3,416,233) 3,628,625
TOTAL LIABILITIES AND SHAREHOLDERS' EQUITY 10,929,522 2,234,803 361,582 3,796,741 (3,688,454) 13,634,194
Distribution Generation Trading Other EliminationsConsolidated
12.31.2013
Assets:
Current assets 3,177,397 293,818 206,726 79,228 (261,413) 3,495,756
Other non-current assets 3,199,383 23,473 59,787 305 (59,530) 3,223,418
Investments 19,584 463,838 406 3,449,075 (3,290,700) 642,203
Property, plant and equipment 240,205 1,347,169 90,535 813 - 1,678,722
Intangible assets 3,959,677 1,385 825 221 - 3,962,108
TOTAL ASSETS 10,596,246 2,129,683 358,279 3,529,642 (3,611,643) 13,002,207
Liabilities and shareholders' equity:
Current liabilities 3,058,995 255,490 216,244 49,146 (261,413) 3,318,462
Non-current liabilities 5,100,790 1,143,012 21,434 900 (59,530) 6,206,606
Shareholders' equity 2,436,461 731,181 120,601 3,479,596 (3,290,700) 3,477,139
TOTAL LIABILITIES AND SHAREHOLDERS' EQUITY 10,596,246 2,129,683 358,279 3,529,642 (3,611,643) 13,002,207

102
Income segment reporting:
2014 Distribution Generation Trading Other EliminationsConsolidated
2014
NET REVENUE 8,258,314 601,557 899,199 5,320 (534,020) 9,230,370
OPERATING COSTS AND EXPENSES (7,364,684) (302,529) (820,965) (15,954) 534,020 (7,970,112)
Equity in the earnings of investments - 137,565 (147) 670,621 (673,420) 134,619
FINANCIAL RESULT (367,406) (105,349) 11,964 1,041 - (459,750)
Financial income 332,694 20,872 15,803 1,181 (10,038) 360,512
Financial expense (700,100) (126,221) (3,839) (140) 10,038 (820,262)
EARNINGS BEFORE TAXES 526,224 331,244 90,051 661,028 (673,420) 935,127
Social contribution (48,303) (17,762) (8,495) (130) - (74,690)
Income tax (128,845) (46,319) (22,363) (79) - (197,606)
NET RESULT 349,076 267,163 59,193 660,819 (673,420) 662,831
2013 Distribution Generation Trading Other EliminationsConsolidated
2013
NET REVENUE 6,716,762 558,660 601,652 8,790 (463,608) 7,422,256
OPERATING COSTS AND EXPENSES (5,814,336) (165,104) (575,418) (19,658) 463,607 (6,110,909)
Equity in the earnings of investments - (4,592) (105) 608,742 (609,499) (5,454)
FINANCIAL RESULT (361,469) (88,851) 6,380 (9,850) - (453,790)
Financial income 321,627 18,961 8,346 1,353 (12,129) 338,158
Financial expense (683,096) (107,812) (1,966) (11,203) 12,129 (791,948)
EARNINGS BEFORE TAXES 540,957 300,113 32,508 588,024 (609,499) 852,103
Social contribution (40,882) (27,374) (2,555) (147) - (70,958)
Income tax (113,684) (73,183) (6,790) (153) - (193,810)
NET RESULT 386,391 199,556 23,163 587,724 (609,499) 587,335 38. TARIFF REVISION
On November 4, 2014, Aneel approved the tariff adjustment process of the subsidiary Light SESA. The approved result represents an average tariff adjustment of 19.23% for the period beginning on as of November 7, 2014, encompassing all the consumer classes (residential, industrial, commercial, rural and others). The adjustment index is comprised by two components: (i) the structural component of 14.54%, composed of non-manageable costs (Portion A) and manageable costs (Portion B); and (ii) the financial component of 8.64%, which will be effective for the next 12 months, taking into account the removal of the financial component included in Light’s tariffs effective up to date of 3.95%.

105
39. LONG-TERM INCENTIVE PLAN
Incentive Plan in “Phantom Options” The “Phantom Options” modality was offered to eligible executives appointed by the Board of Directors and is directly linked to Light's value creation, measured by the variation in Light's Value Unit (LVU). The calculation of LVU is based on the weighing of the following factors:
1. Market value of shares issued by Light S.A; 2. Economic value (a multiple of EBITDA); 3. Amount of dividends distributed.
The difference between the LVU provided in the Program for the grant year and the LVU verified in the exercise year multiplied by the amount of shares exercised by the participant will amount to the total long-term bonus to be paid to each participant. No obligation was recorded for December 31, 2014, as the calculations made by the Company referring to the LVU on December 31, 2014 was lower than LVU on the grant year. 40. LONG-TERM CONTRACTS
a) Electric power sale agreements
On December 31, 2014, the Company had power sale commitments positioned in average MW, as shown in the chart below:
Year
Total conventional
energy contracted
(average MW)
Total contracted
incentivized energy
(average MW)
2015 479.90 9.95
2016 492.90 9.95
2017 505.90 -
2018 509.90 -
2019 494.90 -
2020 449.64 -
2021 449.64 -
2022 449.64 -
2023 449.64 -
2024 449.64 -
2025 449.64 -
2026 449.64 -

106
b) Electric power purchase agreements
On December 31, 2014, the Company had power purchase commitments, as follows:
Year
Average Mw
Bilateral
agreement
Average Mw
Itaipu
Average Mw
PROINFA
Average Mw
Energy auctions
Averate Mw
Total
agreements
2015 725 585 60 1,914 3,284
2016 725 593 60 2,127 3,505
2017 725 590 60 2,275 3,650
2018 725 586 60 2,375 3,746
2019 725 582 60 2,401 3,768
2020 725 582 60 2,401 3,768
2021 725 582 60 2,401 3,768
2022 725 582 60 2,401 3,768
2023 725 582 60 2,401 3,768
2024 725 582 60 2,401 3,768
2025 - 582 60 2,401 3,043
2026 - - - 2,401 2,401 c) Relevant commitments assumed
In September 2014, the subsidiary Light SESA signed an agreement with Landis+Gyr Equipamentos de Medição Ltda (“Landis+Gyr”) to supply equipment and render aerial and underground network automation services through an Integrated System, using Networks and Intelligent Devices in Distribution (“Smart Grid Project”). The agreement provides for the supply of approximately one million meters for the next five years for the approximate amount of R$750,000.
41. NON-CASH TRANSACTIONS
In 2014 and 2013, the Company carried out the following non-cash investment and financing activities, which are not reflected in the statements of cash flows:
2014 2013
Capitalized financial charges (property, plant and equipment and intangible assets) 31,856 24,268
Acquisition of intangible assets against suppliers 83,717 62,071
Construction revenue (Statement of Value Added) 989,381 820,284
Consolidated

107
42. SUBSEQUENT EVENTS
a) Extraordinary tariff revision In a public meeting held on February 27, 2015, the Brazilian Electricity Regulatory Agency (Aneel) approved an extraordinary tariff adjustment average index of 22.48% of subsidiary Light SESA, effective as of March 2, 2015, and the residential consumers will receive an increase lower than average, of 21.06%. The Extraordinary Tariff Revision (“RTE”) is foreseen in the distributors’ concession agreements and Aneel has powers to revise its tariffs in the event of economic and financial imbalance in the agreements resulting from changes in the concessionaires' non-manageable costs, such as energy purchase costs and charges. The items that affected the extraordinary tariff adjustment of Light SESA of 22.48% were (i) the new CDE quotas (impact of 18.19%) and (ii) the Itaipu tariff and other energy agreements (impact of 4.29%).
SITTING MEMBERS ALTERNATE MEMBERS
Nelson José Hubner Moreira Samy Kopit Moscovitch
Oscar Rodríguez Herrero César Vaz de Melo Fernandes
Giles Carriconde Azevedo Fabiano Maia Pereira
Fernando Henrique Schüffner Neto Eduardo Lima Andrade Ferreira
Marcello Lignani Siqueira Rogério Sobreira Bezerra
Marco Antônio de Rezende Teixeira José Augusto Gomes Campos
Ana Marta Horta Veloso Carlos Antonio Decezaro
Fabiano Macanhan Fontes Marcelo Pedreira de Oliveira
Guilherme N. de Lacerda Jalisson Lage Maciel
Silvio Artur Meira Starling Eduardo Maculan Vicentini
Carlos Alberto da Cruz Magno dos Santos Filho
BOARD OF DIRECTORS
SITTING MEMBERS ALTERNATE MEMBERS
Aristóteles Luiz Menezes Vasconcellos Drummond Ari Barcelos da Silva
Francisco Luiz Moreira Penna Aliomar Silva Lima
Raphael Manhães Martins Ronald Gastão Andrade Reis
Rogério Fernando Lot Francisco Vicente Santana Silva Telles
Ernesto Costa Pierobon Alexsandro Pinheiro Cardoso
FISCAL COUNCIL

109
BOARD OF EXECUTIVE OFFICERS
Paulo Roberto Ribeiro Pinto
Chief Executive Officer
João Batista Zolini Carneiro
Chief Financial and Investor Relations Officer
Andreia Ribeiro Junqueira e Souza
Human Resources Officer
Ailton Fernandes Dias
Corporate Management Officer
Ricardo Cesar Costa Rocha
Distribution Officer
Fernando Antônio Fagundes Reis
Legal Officer
Luis Fernando de Almeida Guimarães
Energy Officer
Roberto Caixeta Barroso Simone da Silva Cerutti de Azevedo
Controllership Superintendent Accountant - Accounting Manager
CPF 013.011.556-83 CPF 094.894.347-52
CRC-MG 078086/O-8 CRC-RJ 103826/O-9
CONTROLLERSHIP SUPERINTENDENCE

Deloitte Touche Tohmatsu Av. Presidente Wilson, 231 – 22º 25º e 26º andares Rio de Janeiro – RJ – 20030-905 Brasil Tel: + 55 (21) 3981-0500 Fax:+ 55 (21) 3981-0600 www.deloitte.com.br
(Convenience Translation into English from the Original Previously Issued in Portuguese) INDEPENDENT AUDITOR’S REPORT To the Shareholders, Directors and Officers of Light S.A. Rio de Janeiro - RJ We have audited the accompanying individual and consolidated financial statements of Light S.A. (“Company”), identified as Parent and Consolidated, respectively, which comprise the balance sheet as at December 31, 2014, and the income statement, statement of comprehensive income, statement of changes in equity and statement of cash flows for the year then ended, and a summary of significant accounting policies and other explanatory information. Management’s Responsibility for the Financial Statements Management is responsible for the preparation and fair presentation of these individual and consolidated financial statements in accordance with accounting practices adopted in Brazil and International Financial Reporting Standards (IFRS), issued by the International Accounting Standards Board (IASB), and for such internal control as Management determines is necessary to enable the preparation of these financial statements that are free from material misstatement, whether due to fraud or error. Auditor’s Responsibility Our responsibility is to express an opinion on these financial statements based on our audit. We conducted our audit in accordance with Brazilian and International Standards on Auditing. Those standards require that we comply with ethical requirements and plan and perform the audit to obtain reasonable assurance about whether the financial statements are free from material misstatement. An audit involves performing selected procedures to obtain audit evidence about the amounts and disclosures in the financial statements. The procedures selected depend on the auditor’s judgment, including the assessment of the risks of material misstatements of the financial statements, whether due to fraud or error. In making those risk assessments, the auditor considers internal control relevant to the Company’s preparation and fair presentation of the financial statements in order to design audit procedures that are appropriate in the circumstances, but not for the purpose of expressing an opinion on the effectiveness of the Company’s internal control. An audit also includes evaluating the appropriateness of accounting policies used and the reasonableness of accounting estimates made by Management, as well as evaluating the overall presentation of the financial statements. We believe that the audit evidence we have obtained is sufficient and appropriate to provide a basis for our audit opinion.

111
Opinion In our opinion, the individual and consolidated financial statements present fairly, in all material respects, the individual and consolidated financial position of Light S.A. as of December 31, 2014, and its individual and consolidated financial performance and cash flows for the year then ended, in accordance with accounting practices adopted in Brazil and International Financial Reporting Standards (IFRS) issued by the International Accounting Standards Board (IASB). Emphases of Matter Restatement of Corresponding Figures for the Year Ended December 31, 2013 As mentioned in Note 3, as a result of the reclassifications described in the aforesaid note, the corresponding figures relating to the consolidated statement of cash flows for the year ended December 31, 2013, presented for purposes of comparison, were adjusted and are being restated as set forth in CPC 23 and IAS 8 - Accounting Policies, Changes in Accounting Estimates and Errors and CPC 26 (R1) and IAS 1 - Presentation of Financial Statements. Our opinion does not have any modification regarding this matter.
Transfers of Funds from the Energy Development Account (CDE) Without modifying our opinion on the individual and consolidated financial statements for the year ended December 31, 2014, we draw attention to the matter described in note 11 regarding the recording by subsidiary Light Serviços de Eletricidade S.A., as reduction in the cost of the power purchased for resale, of transfers of funds from the Energy Development Account (CDE), already approved by the Brazilian Electricity Regulatory Agency (ANEEL), established by Decree 7,945/13. Other Matters Statements of value added We have also audited the individual and consolidated statements of value added (“DVA”), for the year ended December 31, 2014, prepared under the responsibility of the Company’s management, which presentation is required by the Brazilian Corporate Law for publicly-traded companies and as supplemental information for IFRS, which does not require the presentation of a DVA. These statements were subject to the same auditing procedures described above and, in our opinion, are fairly presented, in all material respects, in relation to the financial statements taken as a whole. The accompanying financial statements have been translated into English for the convenience of readers outside Brazil. Rio de Janeiro, March 06, 2015 DELOITTE TOUCHE TOHMATSU Marcelo Salvador Auditores Independentes Engagement Partner

112


![Michael McKitrick BIOL 482L - Parasitologybiology.unm.edu/cmadema/4582/MM.pdf · • “Mobius coil” [function not stated]](https://img.pdfslide.net/doc/110x75/5acb86017f8b9a73128bb7b7/michael-mckitrick-biol-482l-mobius-coil-function-not-stated.jpg)