Embed Size (px)
Citation preview

ifoma
International Fishmeal & Oil
Manufacturers Association
RING TEST FOR
DETERMINATION OF BIOGENIC
AMINES IN FISH MEAL
RESEARCH REPORT NUMBER: 2000-3
September 2000
STRICTLY CONFIDENTIAL

2
RING TEST FOR DETERMINATION OF BIOGENIC
AMINES IN FISH MEAL
Purpose
The purpose of the ring test is to establish a recommended IFOMA method for measuring
biogenic amines in fish meal.
Introduction
Differences in results of biogenic amine analysis on the same sample of fish meal, are thought
to be due principally (a) to different methods of extraction of the biogenic amines from the
meal and/or (b) to the use of different post-extraction procedures.
Thus, the ring test proposal was written in two parts. The first part was designed to establish
the variability that existed between different laboratories using their own methods and to
determine whether part of this variation was due to extraction or post-extraction procedures.
The second part was a ring test of a draft recommend analytical procedure which was based
on the results of the first part.
PART 1
Method
Part 1a
IFOMA collected six fish meal samples, two from each of Peru, Chile and Denmark. From
each origin, one sample of the meal was prepared from medium fresh raw material and the
other from fresh raw material. Each sample was about 2 kilograms. The samples were sent
directly to Laboratory A.
Laboratory A made extracts of each meal using their own method, and in addition, prepared
sub-samples of the six meals.
All participating laboratories (Appendix I) received from lab A the following:-
Six extracts of the six fish meals coded M, A, C, F, P, J.
One duplicate extract of J spiked with a known quantity of Histamine, coded S.
One standard (Tyramine, Putrescine, Cadaverine, Histamine, Agmatine) coded ST
containing 238, 391, 298, 298, 151µmoles/l respectively.
Each laboratory analysed the extracts for as many biogenic amines as they were able using the
post-extraction procedure usual in their laboratory. Not all laboratories have reported the
methods used.

Aminerev.doc E.L. Miller 21/09/00
All analyses were conducted and reported in duplicate.
Part 1b
Three laboratories, L, C and A received sub-samples of the six meals (50g).
Each laboratory undertook the extraction procedure (in duplicate) usual in their own
laboratory and sent a volume of each extract to Lab A equivalent to 1g of fish meal. The
extraction procedures were 5g meal extracted with 150 ml water (lab L), 1g meal extracted
with 10 ml 10% TCA (lab C) or 10 g meal extracted with 90 ml 10% TCA (lab A). Lab A
analysed the content of biogenic amines in all the extracts by its usual procedure of
fluorescence detection of post-column OPA derivatives using an external standard for
calibration. In addition labs L and C analysed their own extracts by their own normal
procedure. For Lab L this was measuring dansyl derivatives in the UV at 254 nm in
conjunction with an internal standard. Lab C also used dansyl derivatives measured in the UV
at 254 nm but calibrated against an external standard.
Results
Data Set 1a
Eleven laboratories returned data. A preliminary analysis revealed that results from four
laboratories (E, G, J, K) were clearly different from the rest. Their data were discarded as
outliers.
The data (Appendix Tables 1-5) were derived from a maximum of seven laboratories which
provided determinations of five amines from eight samples. For the deviations from the
sample mean, the consistency of the signs (+ or -) in any line (lab) give an indication of bias
for that laboratories performance. The magnitude of the deviations indicate the size of the
bias or large inconsistency. Only 3 laboratories returned results for agmatine. Consistent low
bias is seen for Histamine (Lab B), Cadaverine (Lab H), Putrescine (Lab B, H). Consistent
high bias is seen for Cadaverine (Lab C, D), Putrescine (Lab C, D). In addition several very
large deviations can be seen indicating inconsistency.
The analysis is summarised in Table 1.
The first line of each set (amine) displays the mean determination for each of the eight
samples, as derived from the first reported value 'A' of the open duplicates. The second line
contains the ‘Between Laboratory’ standard deviation. The third line expresses the previous
figure (standard deviation) as a percentage of the mean value. This statistic is often referred
to as the coefficient of variation. The fourth line displays the standard deviation as derived
from the open duplicates - the so-called “within laboratory” variations.
Since sample S was the same as sample J but with an additional concentration of Histamine,
these samples provided an estimate of the hidden duplicate variation for amines other than
Histamine. The line labelled Hidden Dup. provides the relevant figures, pooled over
laboratory and is probably a more realistic assessment of “within laboratory variations”.

Aminerev.doc E.L. Miller 21/09/00
Sample ST contained a specified concentration of the five amines, so that the analysis
provided an estimate of bias, and this figure is shown as the last line of each group.
The very large coefficients of variation for the ‘Between Laboratory’ error were usually from
samples of low concentrations, and where there was, of course, substantial error of
determination.
The little information that was available on ‘Hidden Duplicates’ confirmed the customary
result that the standard deviation was greater than the corresponding open duplicate figure.
The unreliability of within laboratory standard deviation (repeatability) based on open
duplicates has been emphasised in the reports of previous ring tests conducted by IFOMA on
a variety of measurements.
Although the estimate of bias did not attain statistical significance for any of the amines, it
was in fact very close to the significance level for the Tyramine data. Also, it may be noted
that for Cadaverine, Tyramine and Putrescine, six out of the seven laboratories returned a
determination which was greater than the correct figure.
Figures 1 - 4 show the Principal Components Analysis for each biogenic amine. For
Histamine laboratories B and I appear to be different from the other laboratories. For
Cadaverine and Tyramine, laboratories B, C and D seem to differ from A, F, H and I. For
Putrescine laboratories D and I seem to be the most divergent.
Data Set 1b
The intention here was to assess the degree of variation due to the use of different extraction
procedures, and that due to the analysis. However, since there were only five independent
observations for each sample in an unbalanced design, the relevant statistics were based on
quite small amounts of information. Ideally, there should be a balanced arrangement over
numerous laboratories. The present design is illustrated below, a, b, c, d, e indicating a data
point.
Lab
A
Extraction
C
L
A a b c
Analysis C d
L e
The four degrees of freedom (df) among five observations can provide estimates of the
‘Extraction’ standard deviation, and the ‘Analysis’ standard deviation. The extraction error
term is estimated with 2 degrees of freedom for each sample from analysis at Lab A only i.e.
comparing values a, b, c. The 'Analysis' standard deviation with 2 df is based on the
comparison of the analysis in Lab C with that in Lab A and Lab L of the same extract i.e.
(b-d) + (c-e). In effect, the 'Analysis' variation is also a reflection of the difference between
using OPA (with fluorescence detection) and dansyl (with UV detection) derivatives of the
amines. Table 2 summarises the result of this exercise.
The standard deviations displayed in Table 2 suggest that the errors of analysis are rather
greater than those of extraction. This was not invariably the case; however, it should be noted

Aminerev.doc E.L. Miller 21/09/00
how frequently the entry on the third line is greater than that on the second line. The data was
too sparse to provide the ‘Analysis’ errors for Agmatine and Tyramine.

Aminerev.doc E.L. Miller 21/09/00
Discussion
Part 1a indicated considerable variation between laboratories in their ability to determine
biogenic amines and especially histamine in circulated extracts of fish meals. Even when 4
out of 11 laboratories were discarded as outliers the coefficient of variations were very high.
Table 3a gives the average CV for determinations within ranges <20, >20<200, and >200
umole/litre. Within the range 20-200 the CV averaged 25-26% for histamine and tyramine,
and was even worse for cadaverine (36%) and putrescine (45%). Agmatine, an amine that
decreases with deterioration of raw fish and therefore is of little use as a screen for freshness,
was the only one approaching reasonable reproducibility at 12% CV. The above ranges
correspond approximately to <40, 40-400, and 400-4000 ppm of fish meal. However, the
different methods had different sensitivities depending on whether UV or fluorescence was
used and the extracts presumably were diluted differently according to the method. If not,
part of the variation may be due to inappropriate concentration, either very low or very high,
in the different methods.
Similar values for the variation in analysis of the same extract were obtained in Part 1b (Table
3b). As noted previously, this variation could be due to comparison of essentially two very
different methods with different reagents, sensitivity and method of detection. In contrast, the
methods of extraction did not differ so greatly. Consequently, it seems reasonable that the
variation due to method of analysis was generally greater than that due to extraction.
However, even the different extracts analysed in the same laboratory had a high variability,
the mean coefficiant of variations in the range 10-20% for moderate or high samples and even
greater for samples with low values (Table 3c). This variation includes the within laboratory
variation. The experimental design did not permit separation of the components of within
laboratory variation and that due to extraction per se.
Conclusions
1. There is an unacceptably large variation between laboratories in analysis of the same
extract of fish meal or of a standard solution of biogenic amines.
2. The results suggest that the errors of analysis are rather greater than those of extraction.
This may be due to the use of very disparate methods of analysis.
3. Variation due to extraction method is also appreciable.
4. A single well defined method, defining both extraction and analysis, is needed for
commercial contracts.
5. IFOMA should test and recommend such a method.
It was therefore decided to adopt the Torry method as the draft recommended analytical
method to be tested in Part 2.

Aminerev.doc E.L. Miller 21/09/00
Table 1. Table summarising the analyses of Data Set 1a. (µmoles/litres)
Sample Code
M A C F P J S ST
Histamine
Mean Value 37.17 482.81 76.16 1006.69 12.86 16.4 311.93 298.73
St. Dev. 8.83 149.98 18.74 125.67 21.81 19.89 44.05 30.71
Coeff. Var. 23.74 31.06 24.61 12.48 169.66 121.28 14.12 10.28
Open Dup. 4.44 18.74 8.18 19.79 7.35 2.89 13.31 26.73
Bias 0.73 ±11.6
Cadaverine
Mean Value 33.07 180.89 83.3 452.44 1203.87 130.13 128.82 337.41
St. Dev. 27.96 75.37 30.42 92.47 362.24 46.31 37.57 54.62
Coeff. Var. 84.54 41.67 36.52 20.44 30.09 35.58 29.16 16.19
Open Dup. 1.7 5.1 8.64 18.64 45.6 5.39 6.99 33.93
Hidden Dup. 17.91
Bias 39.4 ±20.6
Tyramine
Mean Value 8.86 48.31 17.63 121.1 366.36 27.89 27.47 255.87
St. Dev. 14.9 17.32 6.29 28.22 49.11 5.42 7.36 18.65
Coeff. Var. 168.28 35.85 35.67 23.3 13.4 19.43 26.8 7.29
Open Dup. 2.1 4.53 1.54 9.1 27.82 1.84 2.05 18.1
Hidden Dup. 5.03
Bias 17.9 ±7.1
Putrescine
Mean Value 21.51 71.16 74.8 309.36 814.27 57.46 60.98 466.31
St. Dev. 15.45 50.26 36.2 117.26 327.08 25.87 25.46 108.71
Coeff. Var. 71.81 70.63 48.4 37.9 40.17 45.02 41.75 23.31
Open Dup. 3.24 6.96 1.66 10.35 19.87 2.67 3.91 35.68
Hidden Dup. 6.3
Bias 75.3 ±41.1
Agmatine
Mean Value 21.67 93.67 22.33 55.33 80.67 41.33 39.33 150
St. Dev. 4.04 13.05 3.21 4.73 13.43 1.53 5.86 17.78
Coeff. Var. 18.65 13.93 14.39 8.54 16.65 3.7 14.9 11.85
Open Dup. 4.08 2.42 0 2.08 0.41 3.29 2.12 2.86
Hidden Dup. 3.79
Bias -1.0 ±10.3

Aminerev.doc E.L. Miller 21/09/00
Table 2. Table summarising the analyses of Data Set 1b. The row headed Est. is the
determination from Lab A. The rows headed Extr. and Anal. display the Standard Deviations
of 'Extraction' and 'Analysis'. The figures in brackets express the standard deviations as
percentages of the determination in Lab A. (Measurements in mg / kg fish meal)
Sample Code
M A C F J P
Histamine
Est. 78 1189 144 2212 44 22
Extr. 12.7 (16.2) 141.8 (11.9) 33.5 (23.3) 205.3 (9.3) 3.1 (6.9) 8.2 (37.2)
Anal. 24.8 (31.8) 165.3 (13.9) 15.8 (11.0) 161.3 (7.3) 28.9 (65.7) 47.6 (217)
Cadaverine
Est. 51 399 133 920 225 2626
Extr. 7.6 (15.0) 45.0 (11.3) 38.6 (29.0) 84.4 (9.2) 37.0 (16.4) 258.5 ( 9.8)
Anal. 32.9 (64.4) 91.6 (23.0) 11.3 ( 8.5) 90.4 (9.8) 25.6 (11.4) 274.6 (10.5)
Agmatine
Est. 52 273 65 156 104 234
Extr. 11.8 (22.7) 49.5 (18.1) 14.9 (22.9) 21.8 (14.0) 37.5 (36.1) 35.9 (15.3)
Tyramine
Est. 14 165 41 384 82 1043
Extr. 11.8 (84.2) 19.2 (11.6) 50.3 (12.3) 29.0 ( 7.6) 15.5 (18.9) 92.5 (8.87)
Putrescine
Est. 26 115 97 494 79 1305
Extr. 4.0 (15.5) 16.5 (14.4) 10.6 (10.9) 48.7 ( 9.9) 24.4 (30.9) 132.0 (10.1)
Anal. 41.3 (159) 24.8 (21.6) 17.4 (17.9) 73.8 (14.9) 34.8 (44.1) 133.9 (10.3)

Aminerev.doc E.L. Miller 21/09/00
Table 3. Summary of Coefficient of Variation according to concentration of amines
Table 3a. Data from Data Set 1a. Average of CV values of 8 extracts or standards
analysed in 7 laboratories using different methods
Histamine Cadaverine Tyramine Putrescine Agmatine
Values <20 uM 145 No values 36 No values No values
Values >20<200 uM 25 36 26 45 12
Values >200<2000 uM 17 22 10 43 No values
Table 3b. Data from Data Set 1b. Average values of CV of 6 meals extracted in duplicate in
three laboratories and analysed by one laboratory (Extraction)
Histamine Cadaverine Tyramine Putrescine Agmatine
Values <40 ppm 37 No values 84 16 No values
Values >40<400 ppm 15 18 13 19 22
Values >400<4000 ppm 11 10 9 10 No values
Table 3c. Data from Data Set 1b. Average of CV values of 12 extracts analysed in three
laboratories (Analysis)
Histamine Cadaverine Tyramine Putrescine Agmatine
Values <40 ppm 217 No values No data 159 No data
Values >40<400 ppm 36 27 No data 28 No data
Values >400<4000 ppm 11 10 No data 13 No data

Aminerev.doc E.L. Miller 21/09/00
PART 2
Method (Part 2)
The draft recommended analytical method (Torry method - Appendix 2) was sent to
participating laboratories for comment.
Ten laboratories agreed to participate in Part 2. A list of those laboratories is given in
Appendix 3. Each participating laboratory received twelve samples of fish meal for
determination of biogenic amines in duplicate according to the method in Appendix 2. The
samples were prepared and distributed by Fish Industries from original samples obtained
from: Denmark, Norway, Chile and Peru
The same samples were used in the ring test on pepsin digestibility (see Research Report
2000-1). Samples one and five were hidden duplicates. Samples three and ten were a
different set of hidden duplicates.
All analysis were conducted and reported in duplicate.
Not all participating laboratories used the proposed method as shown in Appendix 2. The key
features of the proposed method are extraction of 15 g sample with 150 ml 0.6M
perchloracetic acid, addition of an internal standard of 1,6-diamino hexane, separation on a
HPLC 150 x 4.6 mm column of ODS, post-column derivitisation with OPA and measurement
of fluorescence with excitation at 365 nm and emission at 418 nm. Some laboratories
introduced variations which are listed below.
Laboratory 9 used their ususal method which differed completely, using 10% TCA for
extraction, precolumn derivitisation with dansyl chloride and detection in UV at 254 nm.
Laboratory 2 also used their usual method with extraction with 10% trichloracetic acid and
precolumn instead of post column derivatisation with OPA. A further difference was the
extraction of 5 g samples in 50 ml extraction media. Laboratory 2 used a 5 µm Hypersil BDS
C18 column 250mm x 4mm and eluted with disodium phosphate-acetonitrile instead of
acetate- acetonitrile-methanol solvents. Laboratory 2 used excitation 350 nm and emission
450 nm.
Laboratory 4 also used precolumn instead of post column derivatisation with OPA.
Laboratory 7 homogenised 5 g samples in 50 ml extraction media instead of 15 g in 150 ml.
Also it used excitation 345 nm and emission 455 nm.
The above differences were considered to be sufficiently great to warrant exclusion of
Laboratories 2, 4 and 9 from the results for the final analysis of the repeatability and
reproducibility of the circulated method. This reduced the number of accepted laboratories to
7 even before scrutiny of the results. ISO 5725-1 refers to the use of 8 to 15 laboratories and

Aminerev.doc E.L. Miller 21/09/00
IUPAC gives a minimum of 8 laboratories. Consequently, there were insufficient laboratories
following the prescribed method to give an acceptable collaborative study.
Results (Part 2)
Appendices tables 6 - 10 give for each laboratory and sample the deviations from the meal
mean value. In this tabulation the first reported or 'a' value only is used. The consistency of
the signs (+ or -) give an indication of bias for that laboratories performance. The magnitude
of the deviations indicate the size of the bias or large inconsistency. The final column of each
appendix table gives the arithmetic mean value over all laboratories. Only 5 laboratories
returned results for agmatine.
The consistent negative signs for Histamine (Lab 10), Tyramine (Labs 4, 9), Putrescine (Labs
8, 10), Cadaverine (Labs 8, 10) and Agmatine (Lab 8) ) indicate labs with consistently low
values. The consistent positive signs for Tyramine (Lab 6) Cadaverine (Labs 3, 5) and
Agmatine, (Lab 4) indicate labs with consistently high values. There are often large
deviations e.g. Lab 4 for all amines. These may be in the same direction as the general bias
(e.g. Tyramine, Labs 4, 9; Putrescine, Lab 10; Cadaverine, Lab 10; Agmatine, Lab 4) or in the
opposite direction (e.g. Histamine, Labs 1, 6, 9) indicating great variability.
Table 4 gives the laboratory mean values over all twenty-four observations on the twelve
samples of fish meal. The standard deviation (SD reps) between open replicates ('a' and 'b'
values) and this value expressed as a % of the mean (CV %) are also given. Using the 'a'
values only, the standard deviation between hidden duplicate samples (SD dups) and this
value expressed as a % of the mean of the four samples is given.
The first point of note is the low mean value averaged over all samples and laboratories for
the biogenic amines and especially histamine. This reflects that many of the meals were of
high quality, presumably prepared from fresh raw material, in which the amount of histamine
was very low and in several cases below the detection limit of the laboratories. (See Table 5
for the meal mean values for histamine.) For such samples the estimate of variability is a
false zero. This is particularly important with respect to the hidden duplicate pair of meals 1
and 5 which six labs reported as having histamine below the limit of detection. With samples
varying from virtually zero to a few with moderately high contents it is not possible to
combine the estimates to give pooled estimates of within and between laboratory variability.
Secondly, the SD and CV based on the hidden duplicates is on average 2 to 5 times greater
than that based on the open replicates and in several individual cases many times greater. In
the case of histidine the between hidden duplicate variability is also severely underestimated
because of the 6 zero values for variability of the pair meals 1 and 5 reported as below
detection limits. As in earlier collaborative studies the use of open duplicates greatly
underestimates the true within laboratory variability.
Thirdly, there are some very large values for SD dups, indicating poor consistency of
determination between the hidden duplicates, particularly for laboratory four. Using Cochran
test of homogeneity of within laboratory variances based on the hidden duplicates, laboratory
4 is identified as an outlier for histamine, putrescine and cadaverine (compare values for SD
dups between Laboratories). It also has the highest SD (dups) for tyramine although this did
not reach the critical significance level. Lab 4 also had high variability between the open
Aminerev.doc E.L. Miller 21/09/00
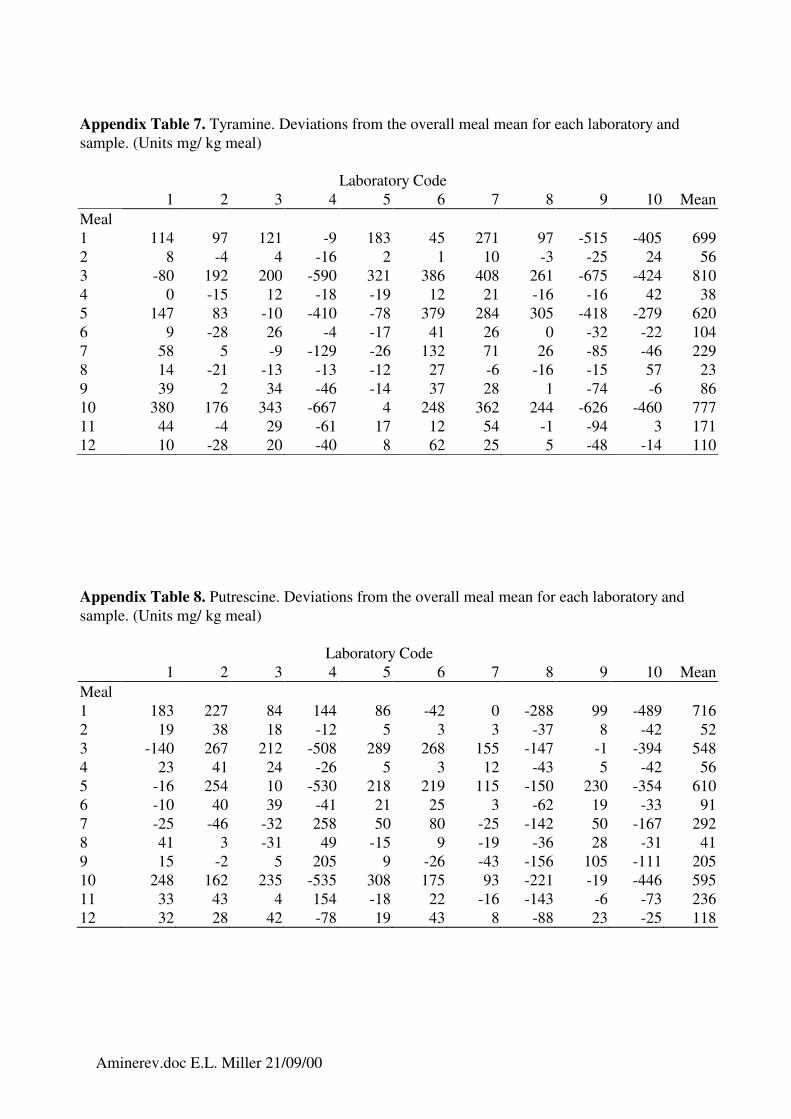
duplicates, particularly for histamine and cadaverine where the SD reps was far greater than
any other laboratory. In addition, Lab 4 had the highest value for histamine and agmatine and
was an outlier by the Grubbs test for both amines. After eliminating Lab 4, Lab 1 was also an
outlier by the Cochran test for histamine, putrescine and cadaverine (second highest SD
dups).
Tests for outlier labs were also carried out starting with labs which apparently followed the
circulated procedure (i.e. omitting labs 2, 4, 9). Again Lab 1 was identified as an outlier by
the Cochran test for histamine, putrescine and cadaverine. Although determinations by Lab 1
were close to the overall mean the hidden duplicate results differed markedly, except for the
pair 1 and 5 for histamine where both were recorded as <0.5 mg/kg. For example, for
histamine the other hidden pair 3 and 10 were reported as 579 and <0.5 mg/kg. No other
laboratory reported such extreme values for either meal 3 or 10, with the mean values of 108
and 123 mg / kg respectively over the remaining laboratories (excluding Lab 4). Indeed the
high value for meal 3 was identified as an outlier by the Grubbs test but the low value was
not. Laboratory 1 also reported values of <0.5 mg /kg for histamine in meals 6, 8 and 9
whereas the means of the remaining labs were 20, 171 and 11 for these meals respectively.
Such complete absence of a discernible peak suggest either the wrong sample or
misidentification of the histamine peak on the chromatogram.
Tables 5-10 give the meal mean values together with the standard deviation (SD) between
laboratories and this value expressed as the Coefficient of Variation (CV). The values are
calculated both for all the laboratories and also after omitting labs 1, 2, 4 and 9 either as
outliers or because they did not use the prescribed method. Omitting the selected
laboratories produced an average decrease of 53% in CV for histamine, 28% for tyramine but
had very little effect for putrescine (3% less) or cadaverine (5% less). Omitting Lab 4 from
the limited agmatine data reduced average CV by 67%. Even so the CV remained
unacceptably high with values in the range 20 - 40 % for meals with 40 to 400 ppm amine.
For values <40 ppm the CV was even greater but for values >400 ppm there was no apparent
improvement.
Histamine Tyramine Putrescine Cadaverine Agmatine
<40 ppm 72 92 74 No values 54
40<400 ppm 37 22 41 34 29
>400 ppm 15 31 38 35 40
Conclusions
1. Insufficient laboratories followed the prescribed analytical method to give a valid test of
method reproducibility.
2. The meals distributed were inappropriate for the measurement of biogenic amines,
especially for histamine, as the majority had very low values indicating freshness of raw
material.
3. The estimate of within laboratory variation from hidden duplicates was much greater than
that estimated from the open replicates. This was so despite the under-estimate of the hidden

Aminerev.doc E.L. Miller 21/09/00
duplicate variation because one pair of meals had histamine levels below the detection limit
for many laboratories.
4. The variation between laboratories analysing the same samples is extremely great. Part of
this difference may be due to the use of different methods. Even when only data from
laboratories using the same method and after the removal of outliers, the variation is
unacceptably great. This has implications for contracts specifying levels of biogenic amines.
5. Laboratories identified as outliers must examine their technique to establish the cause of
variation prior to participating in further ring tests.
6. The best method for extraction and analysis should be reviewed in the light of other recent
work and collaborative studies. The collaborative study with fish meal should be repeated
using samples covering the full range of expected values and with laboratories restricted to
those who can under take the prescribed method and are routinely using the method for
quality control work related to the fish meal industry.

Aminerev.doc E.L. Miller 21/09/00
Table 4. Laboratory means and within laboratory standard deviation (SD) and coefficient of
variation (CV) measured from open replicates and hidden duplicates.
(Units mg / kg fish meal)
Laboratory Code
1 2 3 4 5 6 7 8 9 10 Mean
Histamine
All samples
Mean 144 119 146 355 117 169 142 90 136 104 152
SD reps 29.8 9.5 5.4 76.6 3.6 27.6 8.0 16.0 5.2 6.0
CV (%) 20.7 8.0 3.7 21.6 3.1 16.4 5.6 17.6 3.9 5.8 11
Between hidden duplicates (using 'a' values only)
Mean 145 62 78 308 64 122 73 58 66 41 102
SD dups 289.5 3.5 5.0 390.0 34.8 83.5 3.0 1.1 8.5 6.0
CV (%) 199.3 5.6 6.5 126.8 54.5 68.6 4.2 1.9 13.0 14.8 50
Tyramine
All samples
Mean 377 340 378 135 338 423 439 387 92 186 309
SD reps 31.1 25.2 22.4 37.6 18.9 71.7 9.8 25.2 14.0 11.6
CV (%) 8.2 7.4 5.9 27.9 5.6 17.0 2.2 6.5 15.3 6.2 10
Between hidden duplicates (using 'a' values only)
Mean 867 864 890 308 834 991 1058 953 168 335 727
SD dups 215.2 52.6 118.5 246.2 244.0 153.5 51.5 69.1 12.1 41.7
CV (%) 24.8 6.1 13.3 80.1 29.3 15.5 4.9 7.2 7.2 12.5 20
Putrescine
All samples
Mean 335 382 350 214 378 365 322 167 335 116 296
SD reps 92.7 20.8 15.8 82.4 7.2 33.8 16.0 23.4 23.9 11.5
CV (%) 27.7 5.4 4.5 38.5 1.9 9.2 5.0 14.1 7.1 9.9 12
Between hidden duplicates (using 'a' values only)
Mean 686 845 753 260 843 772 708 416 695 197 617
SD dups 265.8 49.0 96.6 390.1 35.5 80.8 8.7 20.7 19.1 14.7
CV (%) 38.7 5.8 12.8 150.0 4.2 10.5 1.2 5.0 2.8 7.5 24
Cadaverine
All samples
Mean 729 939 1028 452 1204 948 977 565 955 320 812
SD reps 77.2 60.1 44.2 207.9 170.2 64.5 33.9 58.9 43.6 18.7
CV (%) 10.6 6.4 4.3 46.0 14.1 6.8 3.5 10.4 4.6 5.8 11
Between hidden duplicates (using 'a' values only)
Mean 1329 2076 2268 713 2607 1990 2157 1200 2089 535 1696
SD dups 452.6 169.0 277.4 1058.8 96.0 182.5 106.8 51.2 45.5 30.7
CV (%) 34.0 8.1 12.2 148.6 3.7 9.2 5.0 4.3 2.2 5.7 23
Agmatine
All samples
Mean * * 224 1031 197 * 267 180 * * 380
SD reps * * 16.1 226.0 7.4 * 8.6 28.0 * *
CV (%) * * 7.2 21.9 3.8 * 3.2 15.6 * * 10
Between hidden duplicates (using 'a' values only)
Mean * * 328 1313 383 * 483 361 * * 573

Aminerev.doc E.L. Miller 21/09/00
SD dups * * 376.2 276.8 155.3 * 39.0 44.4 * *
CV (%) * * 114.9 21.1 40.6 * 8.1 12.3 * * 39
Table 5. Histamine. Mean values for each meal with between laboratory standard
deviation (SD) and coefficient of variation (CV) for data from all laboratories and
after exclusion of labs 1, 2, 4, 9. (Units mg/ kg meal; based on 'a' values only.)
All labs Excluding labs 1, 2, 4, 9
Meal Mean SD CV Mean SD CV
1 113 269.7 238.8 30 19.1 64.2
2 662 91.9 13.9 647 101.9 15.8
3 154 143.5 93.4 108 24.9 23.2
4 167 45.3 27.2 148 38.4 25.9
5 33 39.9 120.0 27 19.1 70.6
6 80 187.4 233.7 26 17.3 65.7
7 44 34.7 78.9 34 15.1 45.0
8 155 61.2 39.4 167 41.3 24.8
9 103 279.3 270.6 15 16.9 112.8
10 106 69.1 65.0 125 74.7 59.6
11 109 31.7 29.1 118 29.9 25.4
12 89 47.9 54.0 96 59.1 61.7
Table 6. Tyramine. Mean values for each meal with between laboratory standard
deviation (SD) and coefficient of variation (CV) for data from all laboratories and
after exclusion of labs 1, 2, 4, 9. (Units mg/ kg meal; based on 'a' values only.)
All labs Excluding labs 1, 2, 4, 9
Meal Mean SD CV Mean SD CV
1 699 241.8 34.6 751 216.3 28.8
2 56 12.9 23.0 63 8.7 13.9
3 810 394.1 48.7 1002 284.4 28.4
4 38 19.8 51.4 47 21.0 44.9
5 620 278.0 44.8 720 238.4 33.1
6 104 23.9 23.0 113 23.5 20.8
7 229 73.0 31.9 254 61.1 24.1
8 23 23.7 101.9 29 26.9 92.2
9 86 35.7 41.4 99 20.3 20.5
10 777 399.2 51.4 901 285.7 31.7
11 171 43.3 25.3 190 18.4 9.7
12 110 31.5 28.7 128 23.4 18.3

Aminerev.doc E.L. Miller 21/09/00
Table 7. Putrescine. Mean values for each meal with between laboratory standard
deviation (SD) and coefficient of variation (CV) for data from all laboratories and
after exclusion of labs 1, 2, 4, 9. (Units mg/ kg meal; based on 'a' values only.)
All labs Excluding labs 1, 2, 4, 9
Meal Mean SD CV Mean SD CV
1 716 213.0 29.7 608 211.3 34.8
2 52 23.5 44.8 44 22.6 51.6
3 548 273.9 50.0 612 250.6 41.0
4 56 26.9 47.7 49 26.0 52.6
5 610 256.0 42.0 620 206.6 33.3
6 91 33.4 36.7 90 35.2 39.2
7 292 114.2 39.1 253 90.7 35.9
8 41 29.7 72.7 20 15.1 74.0
9 205 96.2 46.9 151 60.6 40.0
10 595 284.8 47.9 619 268.8 43.4
11 236 73.3 31.1 199 55.7 28.0
12 118 45.7 38.6 118 45.5 38.6
Table 8. Cadaverine. Mean values for each meal with between laboratory standard
deviation (SD) and coefficient of variation (CV) for data from all laboratories and
after exclusion of labs 1, 2, 4, 9. (Units mg/ kg meal; based on 'a' values only.)
All labs Excluding labs 1, 2, 4, 9
Meal Mean SD CV Mean SD CV
1 1684 558.7 33.2 1546 608.0 39.3
2 212 58.5 27.6 196 64.3 32.7
3 1782 925.7 51.9 2047 858.8 42.0
4 250 72.2 28.9 239 77.3 32.3
5 1418 632.0 44.6 1475 512.0 34.7
6 319 86.6 27.1 317 97.3 30.7
7 779 219.3 28.1 736 232.0 31.5
8 70 30.0 43.1 68 32.1 47.5
9 386 205.7 53.4 341 125.2 36.7
10 1901 868.7 45.7 2104 888.3 42.2
11 512 111.6 21.8 505 91.5 18.1
12 380 94.2 24.8 383 83.9 21.9

Aminerev.doc E.L. Miller 21/09/00
Table 9. Agmatine. Mean values for each meal with between laboratory standard
deviation (SD) and coefficient of variation (CV) for data from all laboratories and
after exclusion of labs 1, 2, 4, 9. (Units mg/ kg meal; based on 'a' values only.)
All labs Excluding labs 1, 2, 4, 9
Meal Mean SD CV Mean SD CV
1 462 424.1 91.8 250 11.6 4.6
2 121 175.0 144.6 34 15.9 47.1
3 633 348.7 55.0 509 273.6 53.7
4 305 349.9 114.6 132 47.9 36.4
5 514 663.3 129.0 183 27.0 14.8
6 213 249.1 117.0 89 18.7 21.0
7 626 490.6 78.4 382 66.2 17.3
8 344 623.2 181.1 33 19.6 59.9
9 516 629.1 122.0 202 55.7 27.6
10 684 200.1 29.2 613 156.6 25.6
11 173 197.1 113.7 77 42.9 56.0
12 230 246.2 106.9 110 62.0 56.2

Aminerev.doc E.L. Miller 21/09/00
Part 1. Appendix Tables 1-5
Tables giving 'A' determinations, and deviations from the sample means.
(Units µmoles/litre)
Appendix Table 1. Histamine
Sample
Lab. M A C F P J S ST
A 36.00 540.00 67.00 974.00 11.00 21.00 327.00 305.00
B 28.00 358.00 64.00 785.00 0.00 10.00 * 291.00
C 40.50 620.80 81.00 1199.30 0.00 0.00 353.60 351.80
D 38.00 529.00 62.00 959.00 11.00 0.00 294.00 285.00
F 51.00 589.00 74.00 1027.00 7.00 0.00 342.00 252.00
H 42.00 543.00 69.00 1071.00 61.00 52.00 323.00 316.00
I 24.70 199.90 116.10 1031.50 0.00 31.80 232.00 290.30
Mean Values 37.17 482.81 76.16 1006.69 12.86 16.40 311.93 298.73
Deviations from the Mean Values
A -1.17 57.19 -9.16 -32.69 -1.86 4.6 15.07 6.27
B -9.17 -124.81 -12.16 -221.69 -12.86 -6.4 * -7.73
C 3.33 137.99 4.84 192.61 -12.86 -16.4 41.67 53.07
D 0.83 46.19 -14.16 -47.69 -1.86 -16.4 -17.93 -13.73
F 13.83 106.19 -2.16 20.31 -5.86 -16.4 30.07 -46.73
H 4.83 60.19 -7.16 64.31 48.14 35.6 11.07 17.27
I -12.47 -282.91 39.94 24.81 -12.86 15.4 -79.93 -8.43
Appendix Table 2. Cadaverine
Sample
Lab. M A C F P J S ST
A 26.00 197.00 67.00 441.00 1366.00 114.00 112.00 305.00
B 13.00 100.00 42.00 287.00 700.00 57.00 * 371.00
C 39.10 261.30 98.80 579.30 1783.80 151.70 153.60 443.20
D 93.00 260.00 120.00 531.00 1433.00 212.00 184.00 341.00
F 27.00 206.00 70.00 472.00 881.00 124.00 137.00 313.00
H 21.00 179.00 64.00 429.00 1089.00 123.00 109.00 284.00
I 12.40 62.90 121.30 427.80 1174.30 129.20 77.30 304.70
Mean Values 33.07 180.89 83.30 452.44 1203.87 130.13 128.82 337.41
Deviations from the Mean Values
A -7.07 16.11 -16.3 -11.44 162.13 -16.13 -16.82 -32.41
B -20.07 -80.89 -41.3 -165.44 -503.87 -73.13 * 33.59
C 6.03 80.41 15.5 126.86 579.93 21.57 24.78 105.79
D 59.93 79.11 36.7 78.56 229.13 81.87 55.18 3.59
F -6.07 25.11 -13.3 19.56 -322.87 -6.13 8.18 -24.41
H -12.07 -1.89 -19.3 -23.44 -114.87 -7.13 -19.82 -53.41
I -20.67 -117.99 38 -24.64 -29.57 -0.93 -51.52 -32.71

Aminerev.doc E.L. Miller 21/09/00

Aminerev.doc E.L. Miller 21/09/00
Appendix Table 3. Tyramine
Samples
Lab. M A C F P J S ST
A 5.00 61.00 16.00 137.00 404.00 31.00 31.00 256.00
B 2.00 29.00 9.00 62.70 402.00 16.00 * 243.00
C 0.00 66.30 22.50 142.90 375.40 31.30 36.40 287.20
D 42.00 56.00 26.00 123.00 274.00 28.00 21.00 252.00
F 8.00 57.00 15.00 14.00 391.00 28.00 34.00 270.00
H 5.00 49.00 12.00 126.20 324.00 30.00 24.00 229.00
I 0.00 19.90 22.90 111.90 394.00 30.90 18.40 253.90
Mean Values 8.86 48.31 17.63 102.53 366.34 27.89 27.47 255.87
Deviations from the Mean Values
A -3.86 12.69 -1.63 15.9 37.64 3.11 3.53 0.13
B -6.86 -19.31 -8.63 -58.4 35.64 -11.89 * -12.87
C -8.86 17.99 4.87 21.8 9.04 3.41 8.93 31.33
D 33.14 7.69 8.37 1.9 -92.36 0.11 -6.47 -3.87
F -0.86 8.69 -2.63 22.9 24.64 0.11 6.53 14.13
H -3.86 0.69 -5.63 5.1 -42.36 2.11 -3.47 -26.87
I -8.86 -28.41 5.27 -9.2 27.74 3.01 -9.07 -1.97
Appendix Table 4. Putrescine
Samples
Lab. M A C F P J S ST
A 15.00 66.00 57.00 274.00 787.00 46.00 46.00 405.00
B 7.00 29.00 29.00 151.00 333.00 21.00 * 401.00
C 24.90 86.20 82.80 375.40 1153.30 68.00 69.20 590.80
D 52.00 173.00 128.00 530.00 1319.00 106.00 108.00 653.00
F 28.00 66.00 57.00 287.00 719.00 51.00 59.00 408.00
H 14.00 57.00 53.00 266.00 663.00 51.00 43.00 379.00
I 9.70 20.90 116.80 282.10 725.60 59.20 40.70 427.40
Mean Values 21.51 71.16 74.80 309.36 814.27 57.46 60.98 466.31
Deviations from the Mean Values
A -6.51 -5.16 -17.80 -35.36 -27.27 -11.46 -14.98 -61.31
B -14.51 -42.16 -45.80 -158.36 -481.27 -36.46 * -65.31
C 3.39 15.04 8.00 66.04 339.03 10.54 8.22 124.49
D 30.49 101.84 53.20 220.64 504.73 48.54 47.02 186.69
F 6.49 -5.16 -17.80 -22.36 -95.27 -6.46 -1.98 -58.31
H -7.51 -14.16 -21.80 -43.36 -151.27 -6.46 -17.98 -87.31
I -11.81 -50.26 42.00 -27.26 -88.67 1.74 -20.28 -38.91

Aminerev.doc E.L. Miller 21/09/00
Appendix Table 5. Agmatine
Samples
Lab. M A C F P J S ST
A 21.00 106.00 26.00 59.00 96.00 41.00 46.00 170.00
B * * * * * * * *
C * * * * * * * *
D * * * * * * * *
F 26.00 95.00 20.00 57.00 75.00 43.00 37.00 144.00
H 18.00 80.00 21.00 50.00 71.00 40.00 35.00 136.00
I * * * * * * * *
Mean 21.67 93.67 22.33 55.33 80.67 41.33 39.33 150.00
Deviations from Mean Values
A 0.67 -12.33 -3.67 -3.67 -15.33 0.33 -6.67 -20.00
B * * * * * * * *
C * * * * * * * *
D * * * * * * * *
F -4.33 -1.33 2.33 -1.67 5.67 -1.67 2.33 6.00
H 3.67 13.67 1.33 5.33 9.67 1.33 4.33 14.00
I * * * * * * * *
Part 2.
Appendix Table 6. Histamine. Deviations from the overall meal mean for each laboratory and
meal. (Units mg/ kg meal)
Laboratory Code
1 2 3 4 5 6 7 8 9 10 Mean
Meal
1 -112 -111 -103 807 -75 -63 -58 -107 -85 -93 113
2 -41 29 48 -32 70 -26 101 -194 131 -89 662
3 426 -28 -14 -64 -22 -44 -67 -44 -59 -87 154
4 9 -18 43 93 -80 -28 11 -22 23 -35 167
5 -33 -31 -23 107 -12 17 23 -28 -6 -13 33
6 -80 -78 -40 560 -75 -30 -43 -75 -78 -60 80
7 -29 -2 6 96 -17 6 -11 -39 -3 -8 44
8 -155 31 55 25 -43 65 32 -29 30 -11 155
9 -103 -101 -93 837 -99 -53 -103 -98 -103 -83 103
10 -106 13 44 -26 -42 171 -13 6 6 -51 106
11 32 -26 11 -49 -11 70 15 -14 -10 -17 109
12 10 -38 1 1 -16 136 -16 -26 -15 -39 89
Aminerev.doc E.L. Miller 21/09/00
Appendix Table 7. Tyramine. Deviations from the overall meal mean for each laboratory and
sample. (Units mg/ kg meal)
Laboratory Code
1 2 3 4 5 6 7 8 9 10 Mean
Meal
1 114 97 121 -9 183 45 271 97 -515 -405 699
2 8 -4 4 -16 2 1 10 -3 -25 24 56
3 -80 192 200 -590 321 386 408 261 -675 -424 810
4 0 -15 12 -18 -19 12 21 -16 -16 42 38
5 147 83 -10 -410 -78 379 284 305 -418 -279 620
6 9 -28 26 -4 -17 41 26 0 -32 -22 104
7 58 5 -9 -129 -26 132 71 26 -85 -46 229
8 14 -21 -13 -13 -12 27 -6 -16 -15 57 23
9 39 2 34 -46 -14 37 28 1 -74 -6 86
10 380 176 343 -667 4 248 362 244 -626 -460 777
11 44 -4 29 -61 17 12 54 -1 -94 3 171
12 10 -28 20 -40 8 62 25 5 -48 -14 110
Appendix Table 8. Putrescine. Deviations from the overall meal mean for each laboratory and
sample. (Units mg/ kg meal)
Laboratory Code
1 2 3 4 5 6 7 8 9 10 Mean
Meal
1 183 227 84 144 86 -42 0 -288 99 -489 716
2 19 38 18 -12 5 3 3 -37 8 -42 52
3 -140 267 212 -508 289 268 155 -147 -1 -394 548
4 23 41 24 -26 5 3 12 -43 5 -42 56
5 -16 254 10 -530 218 219 115 -150 230 -354 610
6 -10 40 39 -41 21 25 3 -62 19 -33 91
7 -25 -46 -32 258 50 80 -25 -142 50 -167 292
8 41 3 -31 49 -15 9 -19 -36 28 -31 41
9 15 -2 5 205 9 -26 -43 -156 105 -111 205
10 248 162 235 -535 308 175 93 -221 -19 -446 595
11 33 43 4 154 -18 22 -16 -143 -6 -73 236
12 32 28 42 -78 19 43 8 -88 23 -25 118

Aminerev.doc E.L. Miller 21/09/00
Appendix Table 9. Cadaverine. Deviations from the overall meal mean for each laboratory and
sample. (Units mg/ kg meal)
Laboratory Code
1 2 3 4 5 6 7 8 9 10 Mean
Meal
1 -455 333 536 566 565 -289 84 -594 387 -1133 1684
2 9 66 28 -32 62 3 19 -96 50 -110 212
3 -788 582 648 -1642 1258 548 878 -519 262 -1226 1782
4 17 45 50 -80 48 18 56 -111 83 -126 250
5 -223 434 312 -1278 643 272 334 -338 729 -884 1418
6 0 25 61 -99 100 80 18 -130 88 -140 319
7 48 -214 11 161 262 115 50 -293 269 -405 779
8 31 4 30 -40 23 20 4 -55 16 -36 70
9 62 -1 124 484 60 10 -53 -190 -281 -219 386
10 -2 169 790 -1581 1179 645 547 -535 194 -1404 1901
11 64 119 18 -222 77 81 39 -171 81 -84 512
12 60 35 50 -190 96 75 13 -77 75 -137 380
Appendix Table 10. Agmatine. Deviations from the overall meal mean for each laboratory and
sample. (Units mg/ kg meal)
Laboratory Code
1 2 3 4 5 6 7 8 9 10 Mean
Meal
1 * * -222 848 -196 * -224 -206 * * 462
2 * * -81 349 -78 * -75 -115 * * 121
3 * * -563 497 68 * 140 -140 * * 633
4 * * -125 695 -216 * -126 -227 * * 305
5 * * -334 1326 -362 * -288 -341 * * 514
6 * * -103 497 -149 * -110 -135 * * 213
7 * * -186 974 -352 * -194 -242 * * 626
8 * * -284 1246 -319 * -305 -338 * * 344
9 * * -246 1254 -370 * -272 -367 * * 516
10 * * 136 286 -272 * 12 -161 * * 684
11 * * -53 387 -93 * -73 -167 * * 173
12 * * -60 480 -102 * -93 -224 * * 230

Aminerev.doc E.L. Miller 21/09/00
APPENDIX 1
Mr Conrad Gardham Dr Lloyd W Bennett
FIRI Mississippi State University
Lower Hope Street Colege of Veterinary medicine
Rosebank 7700 Lab Service, Box 9825
Cape Province Mississippi State
S Africa Mississippi, USA 39762
Tel: +27 21 6869341 Tel: +601 325 6432
Fax: + 27 21 6866116 Fax: +601 325 4548
Mr Javier Zaldivar Mr Jose Luis Valdes
Corpesca S.A. Inspectorate Griffith SA
Huerfanos 863 Av. Los Leones 1871
Piso 9 Providencia
Santiago Santiago
Chile Chile
Tel: + 56 2 639 5244 Tel: + 56 2 2514114
Fax: + 56 2 639 1618 Fax: + 56 2 209 4627
Mr Hans Otto Sorensen Mr Blaabjerg
Esbjerg Fiskeindustri AmbA Bioteknologist Institut
Fiskerihavnsgade 35 Holbergsvej 10
PO Box 1049 PO Box 818
DK-6701 DK-6000 Kolding
Denmark Denmark
Tel: +45 79 120999 Tel: + 45 75 520433
Fax::+45 79 120888 Fax::+ 45 75 529989
Mr Bjorn Brekken Dr J Luten
SSF RIVO-DLO
Kjerreidviken 16 Haringkade 1
5033 Fyllingsdalen PO Box 68
Bergen N-5033 1970 Ijmuiden
Norway The Netherlands
Tel:+47 55 501200 Tel:+31 255 064646
Fax:+47 55 501299 Fax:+ 31 255 064644
Ms Carmen Catter de Bueno Mr Ian M Mackie
INASSA Rowett Research Services Limited
Av.La marina 3035 Greenburn Road
San Miguel Bucksburn, Aberdeen
Lima 32, Peru AB2 9SB, UK
Tel: +51 14 516680 Tel: +44 1224 716226
Fax:+51 14 641964 Fax: +44 1224 716 225
Mr Stephen Revett Ms Berni Sheridan
Aspland & James Limited IAWS Fish Industries
118 Bridge Street Fishmeal Factory
Chatteris Killybegs
Cambridge, PE16 6QZ, UK Co. Donegal, Ireland
Tel: +44 1354 695858 Tel: +353 7331053
Fax: +44 1354 692215 Fax: +353 7331494

Aminerev.doc E.L. Miller 21/09/00
APPENDIX 3
Dr Lloyd W Bennett
Mississippi State University
College of Veterinary Medicine
Lab Service, Box 9825
Mississippi State
Mississippi, USA 39762
Tel: +601 325 6432
Fax: +601 325 4548
Mr Javier Zaldivar
Corpesca SA
Huerfanos 863
Piso 9
Santiago
Chile
Tel: +56 2 6395244
Fax: +562 6392628
Mr Hans Otto Sorensen
Esbjerg Fiskeindustri AmbA
Fiskerihavnsgade 35
PO Box 1049
DK-6701 Esbjerg
Denmark
Tel: +45 79 120999
Fax: +45 79 120888
Mr Blaabjerg
Bioteknologisk Institut
Holbergsvej 10
PO Box 818
DK-6000 Kolding
Denmark
Tel: +45 75 520433
Fax: +45 75 529989
Mr Bjorn Brekken
SSF
Kjerreidviken 16
5033 Fyllingsdalen
Bergen N-5033
Norway
Tel: +47 55 501200
Fax: +47 55 501299
Mr Ian M Mackie
Rowett Research Services Ltd
Greenburn Road
Bucksburn
Aberdeen, UK
AB2 9SB
Tel: +44 1224 716226
Fax: +44 1224 716225
Mr Stephen Revett
Aspland & James Limited
118 Bridge Street
Chatteris
Cambridge, ,UK
PE16 6QZ
Tel: +44 1354 695858
Fax: +44 1354 692215
Ms Berni Sheridan
IAWS - Fish Industries
Fishmeal Factory
Killybegs
Co. Donegal, Ireland
Tel: +353 73 31053
Fax: +353 73 31494
Ingibjorg R Porvaldsdottir
Icelandic Fisheries Laboratories
PO Box 1405
Skulagata 4
121 Reykjavik
Iceland
Tel: +354 562 0240
Fax: +354 562 0740
Alejandro Gomez de la Torre
SGS del Peru S.A.
Av. Republica de Panama #3050
P.O. Box 27-0125
Lima 27
Peru
Tel:+51 14 223 809
Fax:+51 12 216019

Aminerev.doc E.L. Miller 21/09/00
lpritcha/misc/resrep.doc