Embed Size (px)
Citation preview
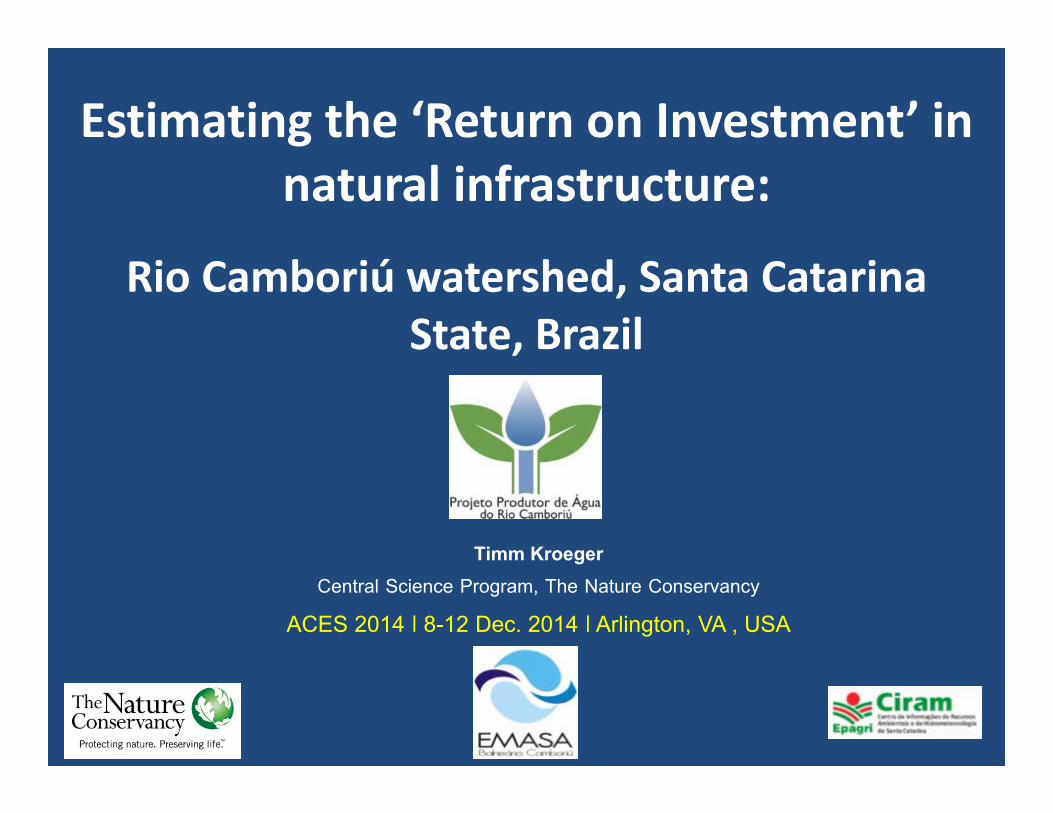
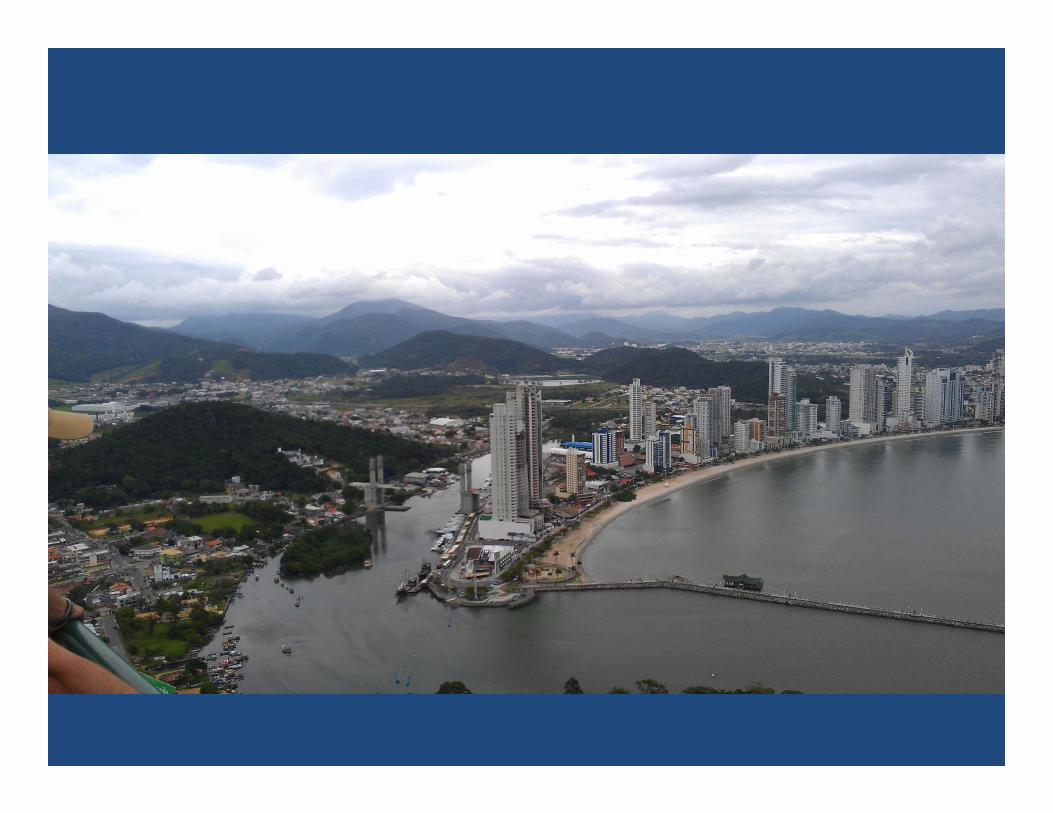
Estimating the ‘Return on Investment’ in natural infrastructure:
Rio Camboriú watershed, Santa Catarina State, Brazil
Timm Kroeger Central Science Program, The Nature Conservancy
ACES 2014 ǀ 8-12 Dec. 2014 ǀ Arlington, VA , USA
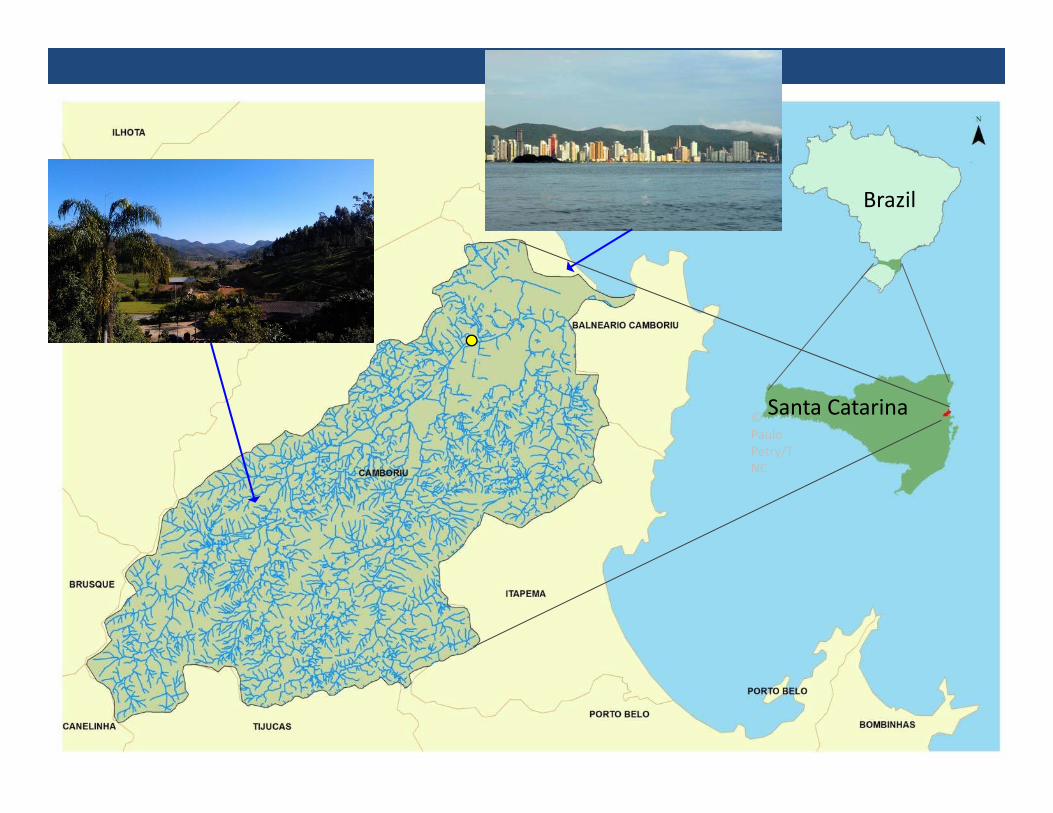
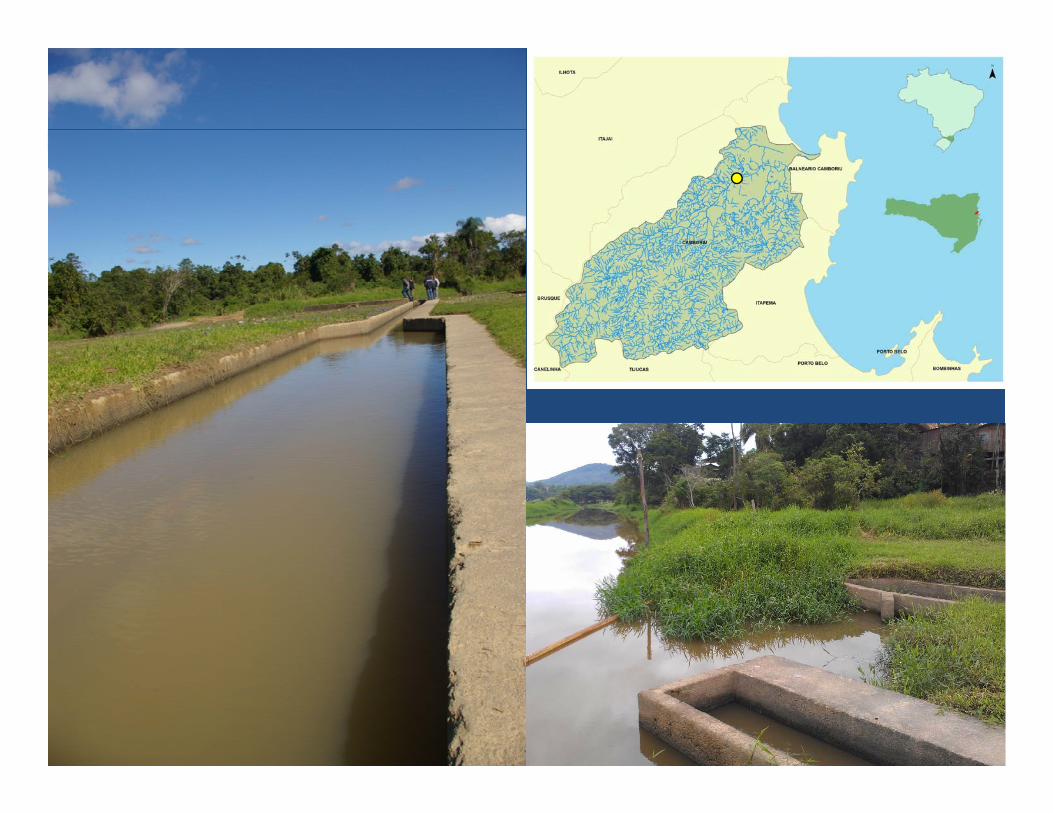
Brazil
Santa Catarina© Paulo Petry/TNC
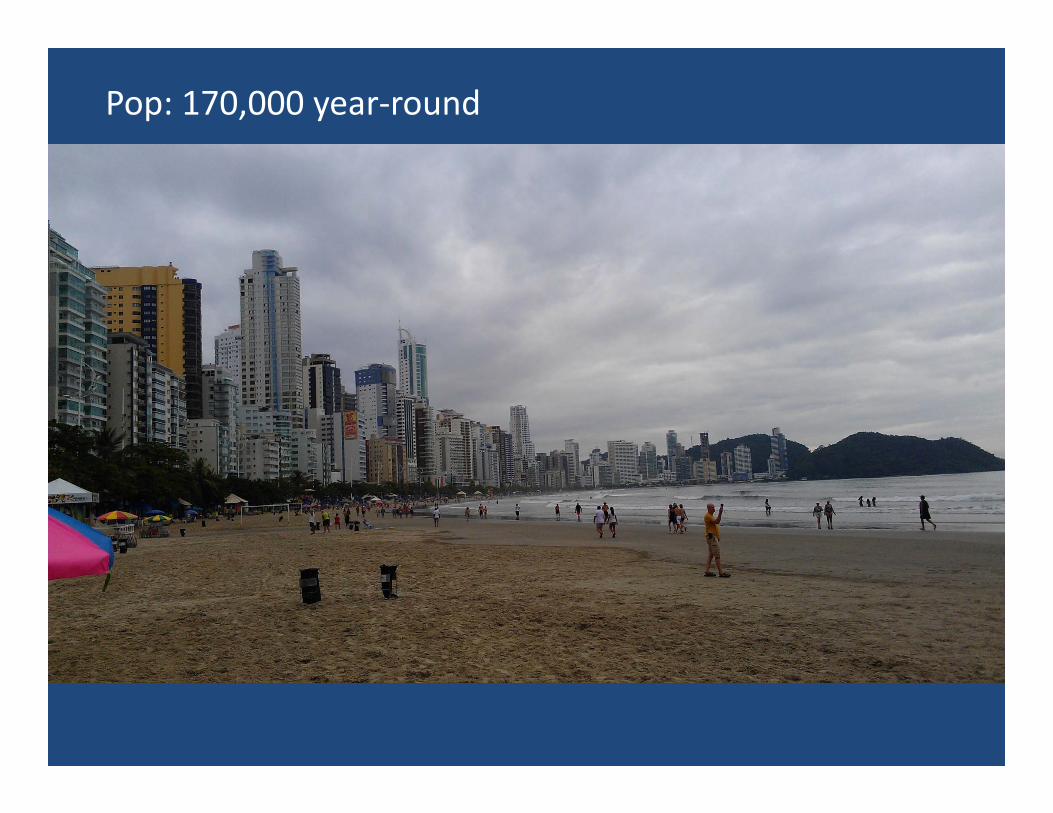
Pop: 170,000 year‐round
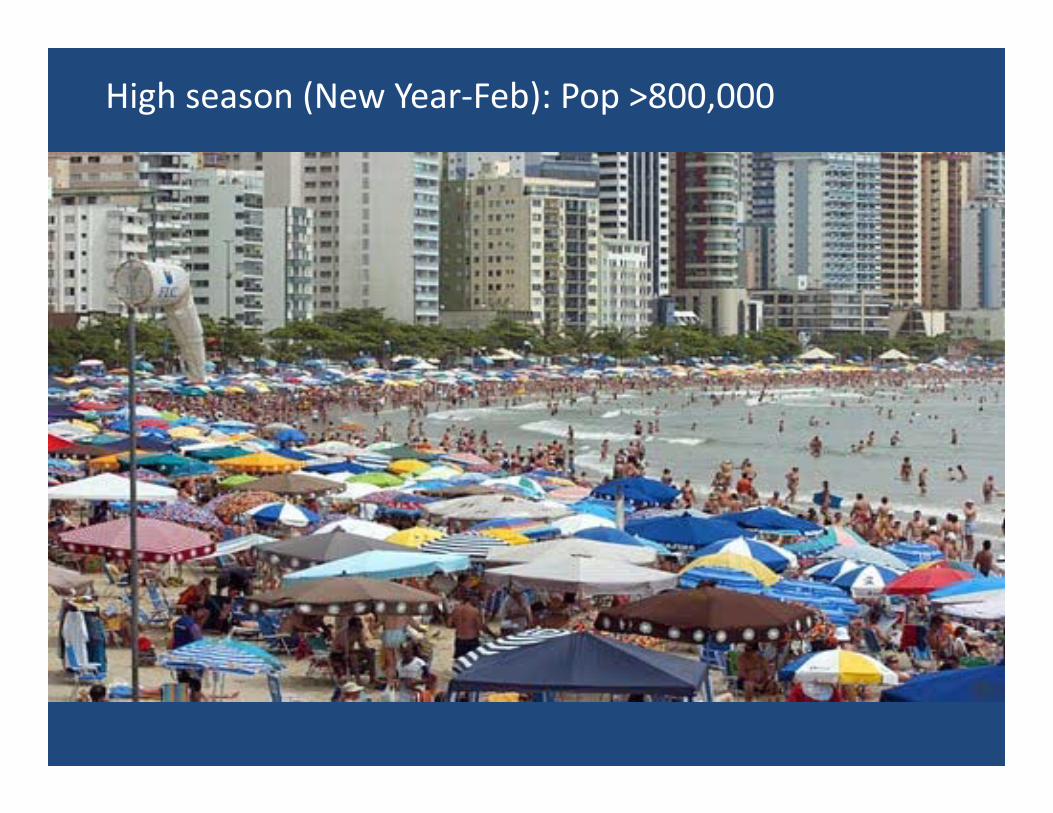
High season (New Year‐Feb): Pop >800,000
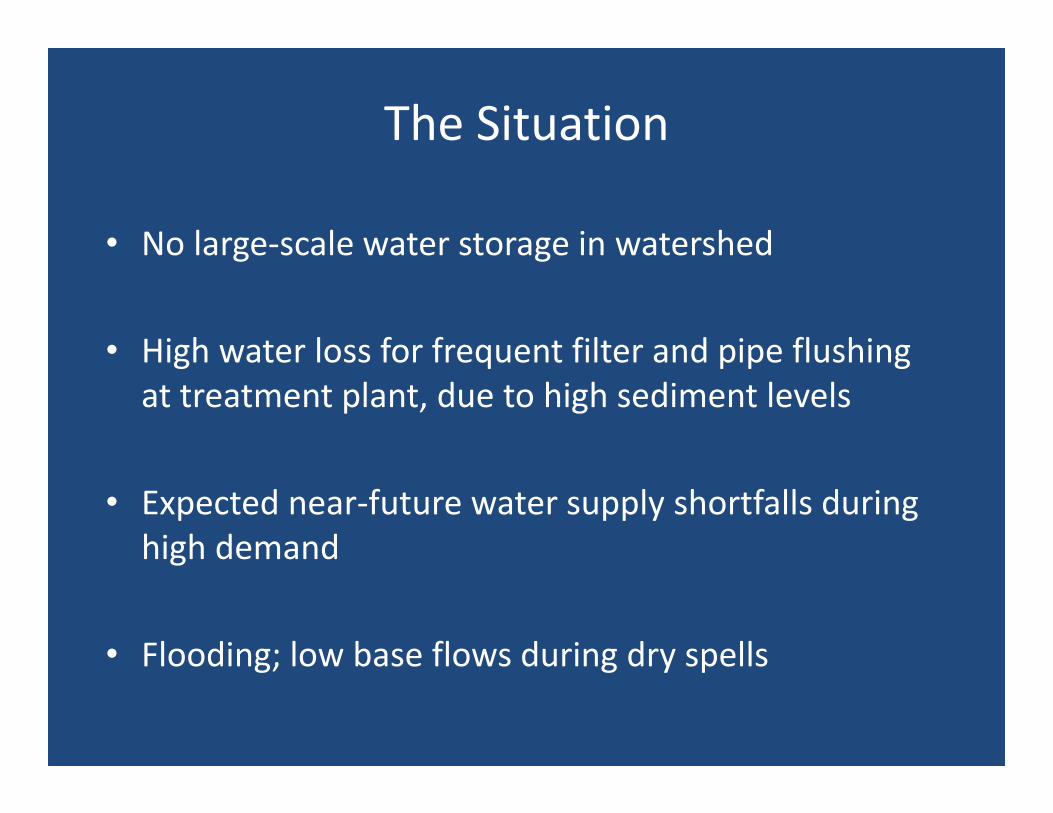
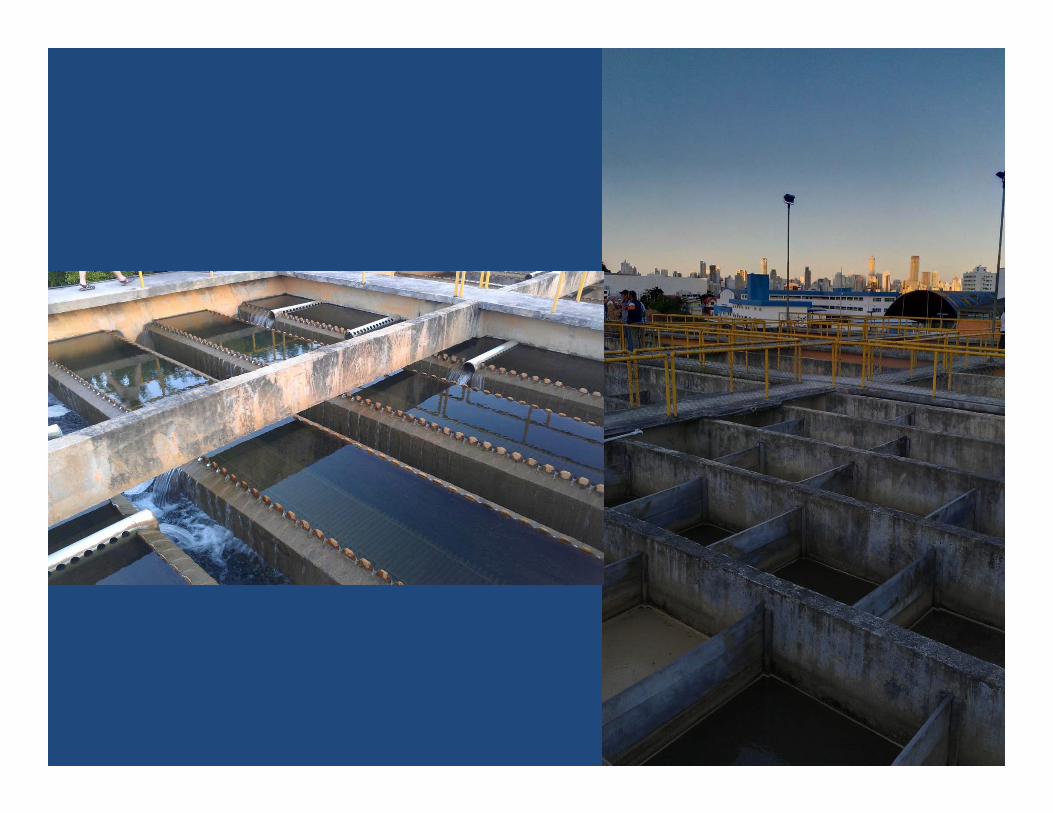
The Situation
• No large‐scale water storage in watershed
• High water loss for frequent filter and pipe flushing at treatment plant, due to high sediment levels
• Expected near‐future water supply shortfalls during high demand
• Flooding; low base flows during dry spells
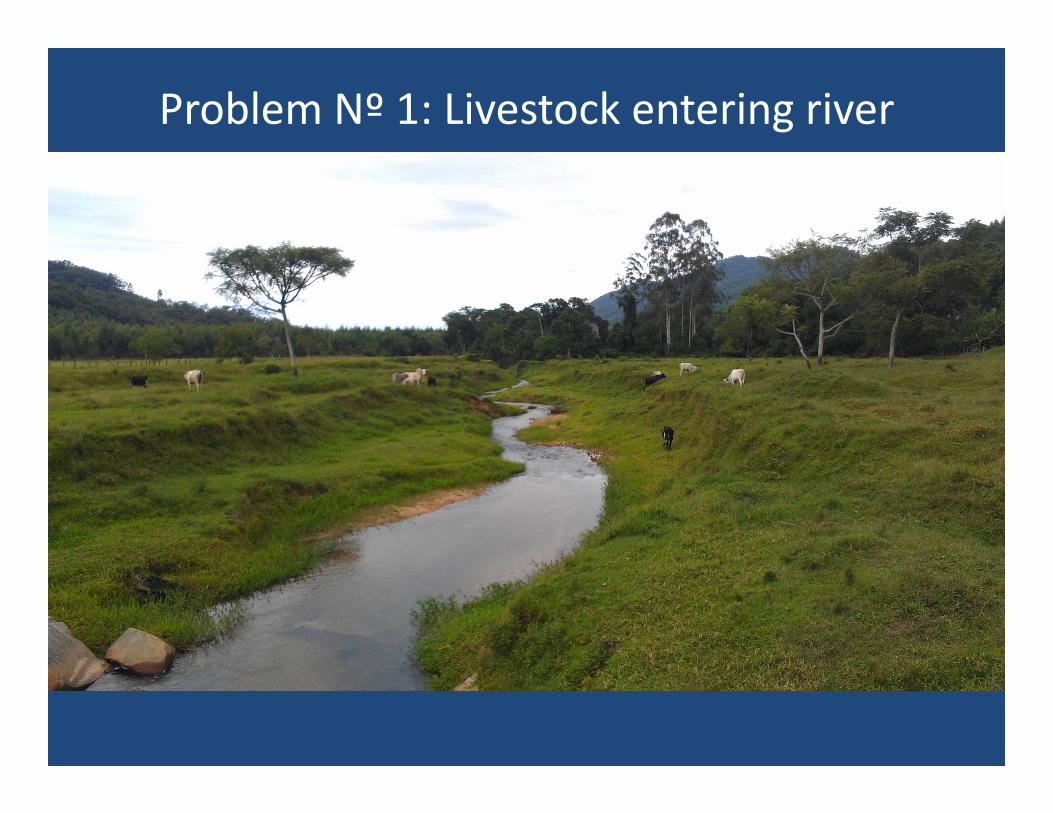
Problem Nº 1: Livestock entering river
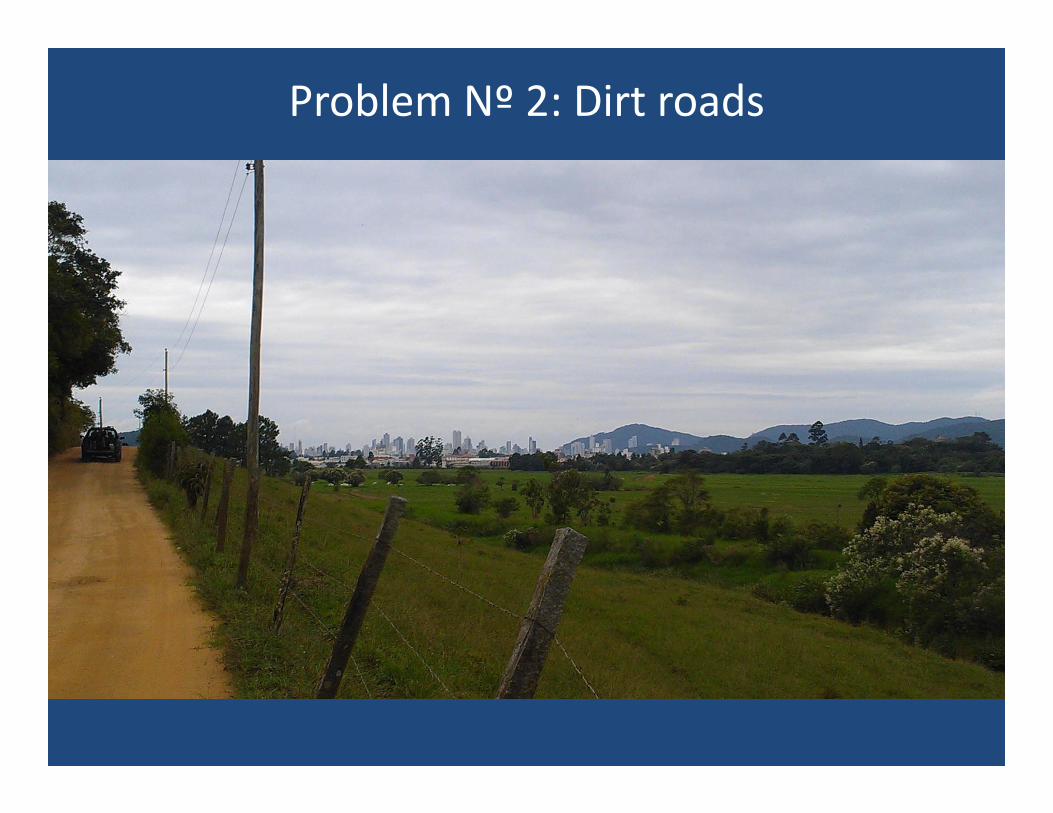
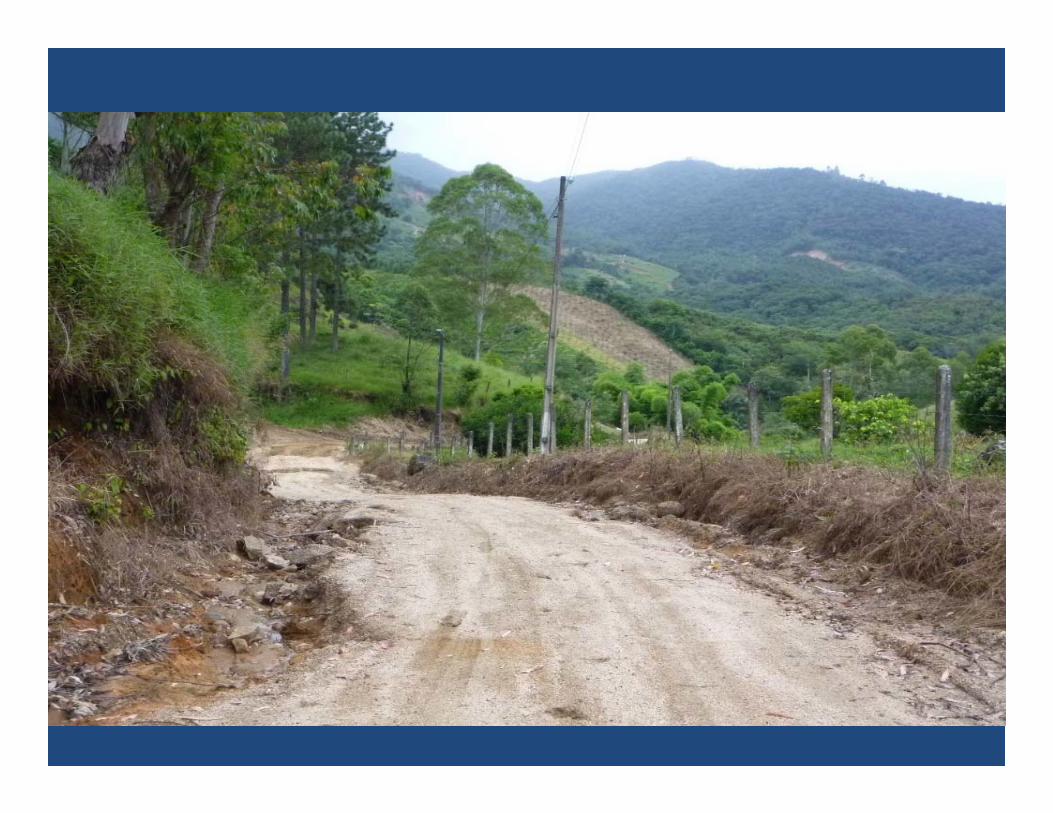
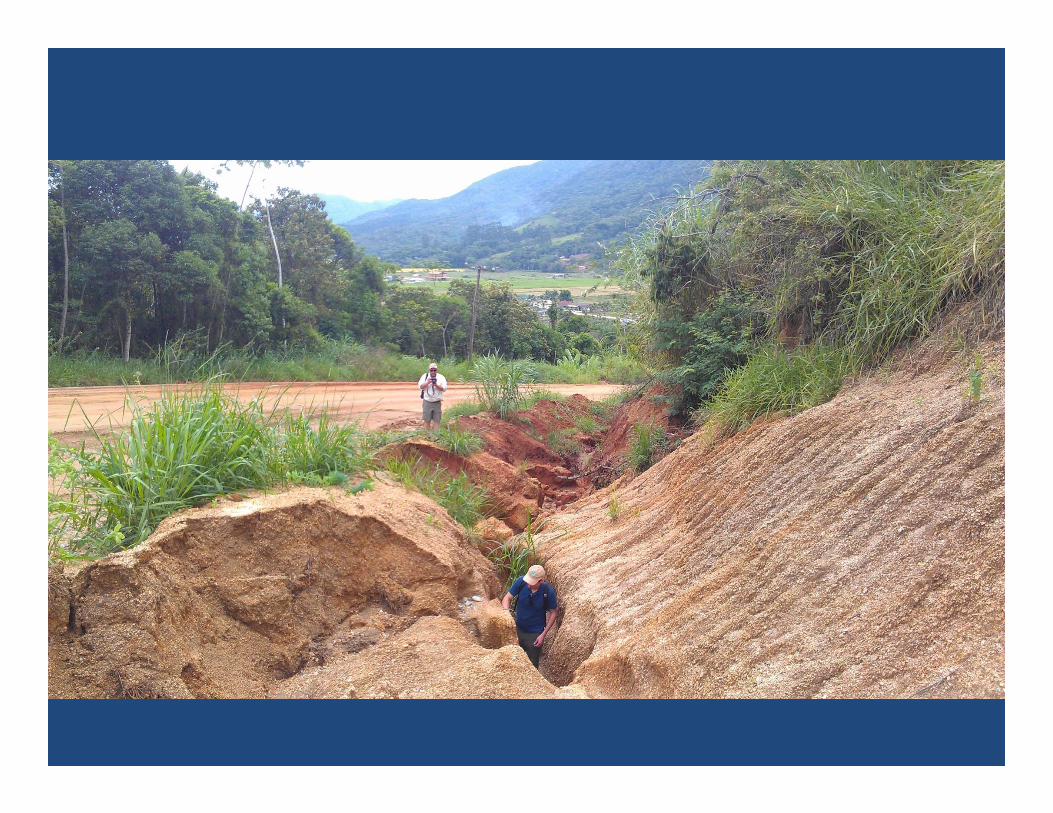
Problem Nº 2: Dirt roads
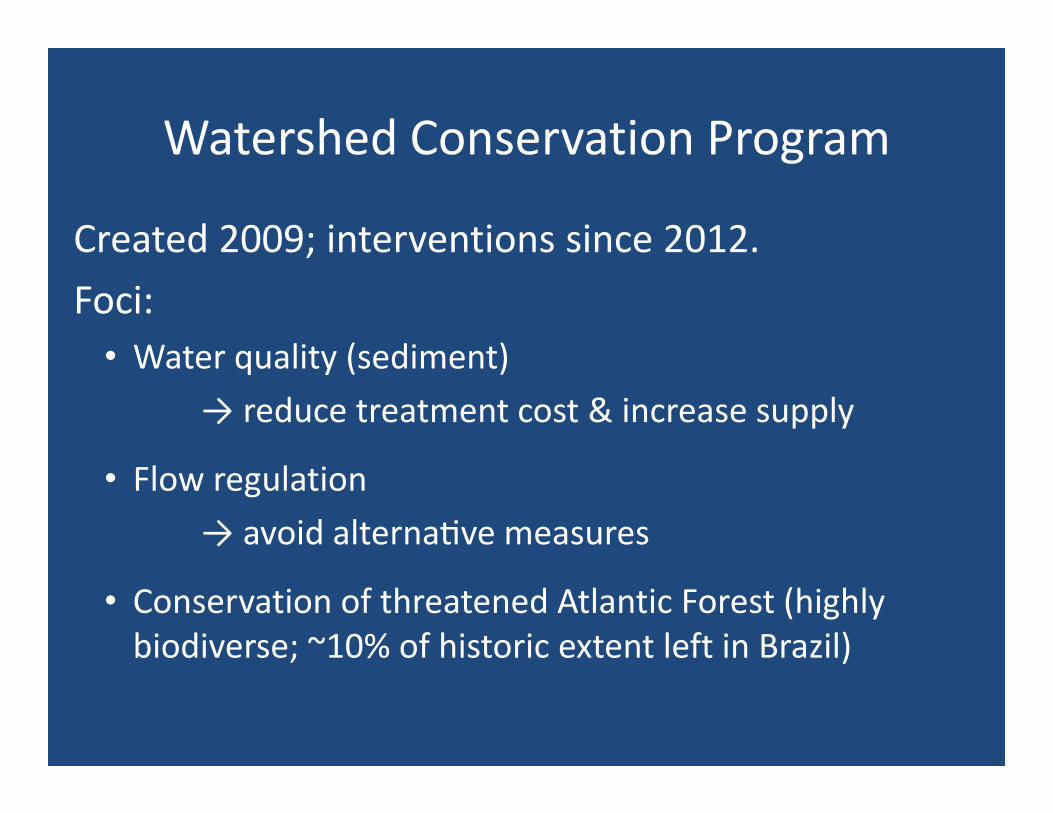
Watershed Conservation Program
Created 2009; interventions since 2012.Foci:
• Water quality (sediment) → reduce treatment cost & increase supply
• Flow regulation→ avoid alterna ve measures
• Conservation of threatened Atlantic Forest (highly biodiverse; ~10% of historic extent left in Brazil)
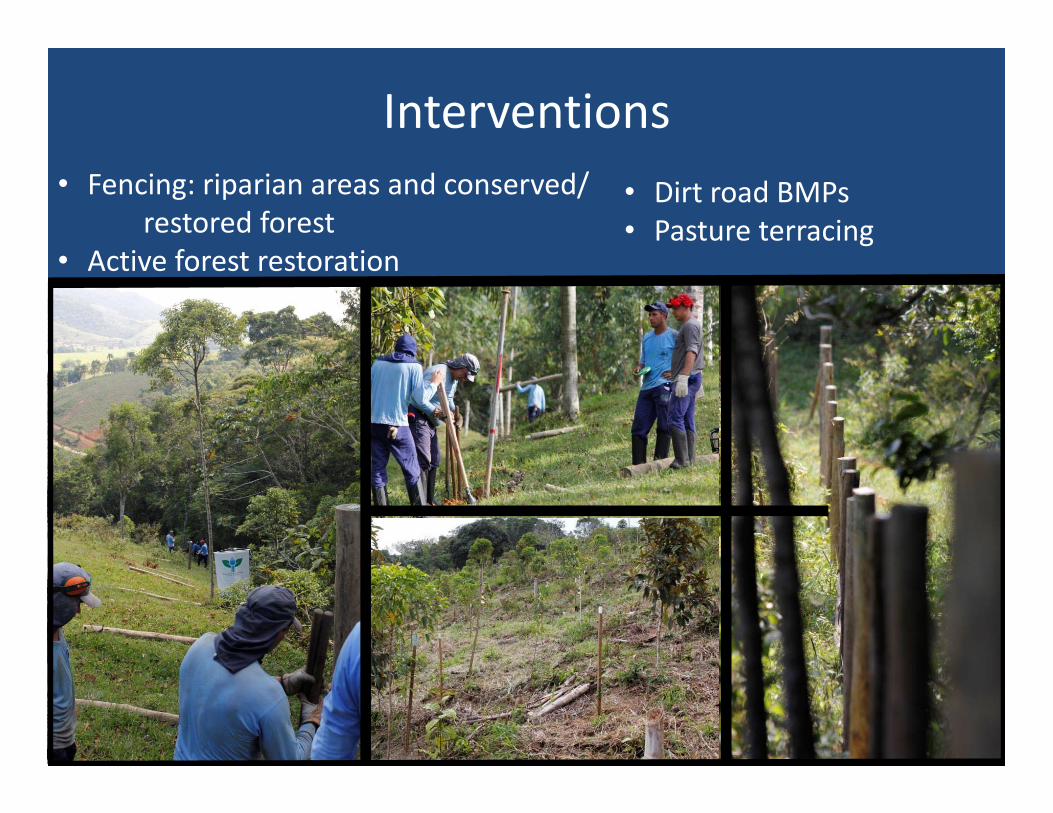
Interventions• Fencing: riparian areas and conserved/
restored forest• Active forest restoration
• Dirt road BMPs• Pasture terracing
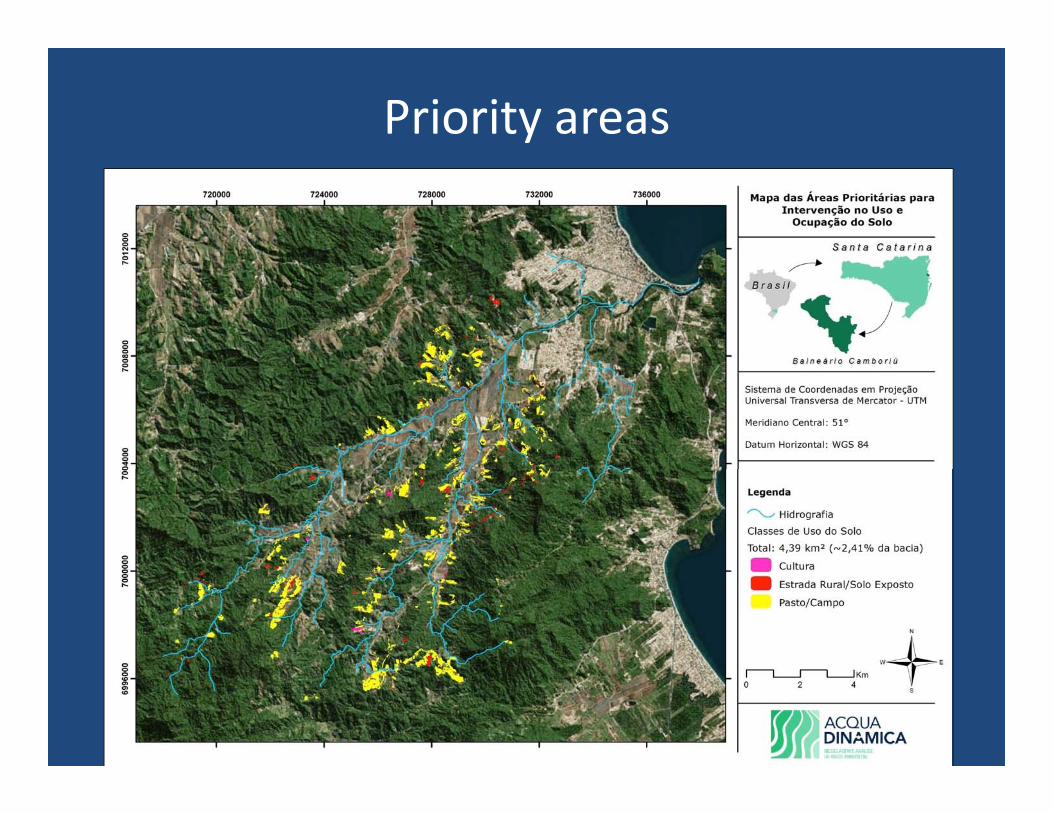
Priority areas
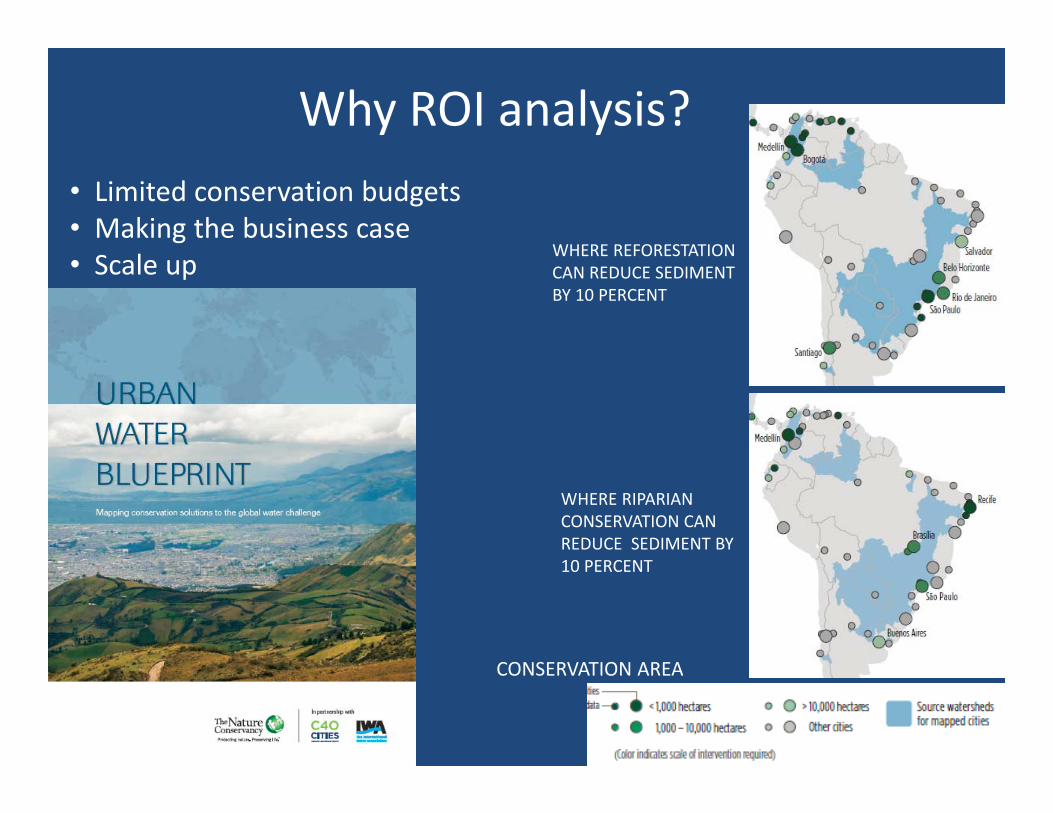
Why ROI analysis?
WHERE REFORESTATION CAN REDUCE SEDIMENT BY 10 PERCENT
WHERE RIPARIAN CONSERVATION CAN REDUCE SEDIMENT BY 10 PERCENT
CONSERVATION AREA
• Limited conservation budgets• Making the business case • Scale up
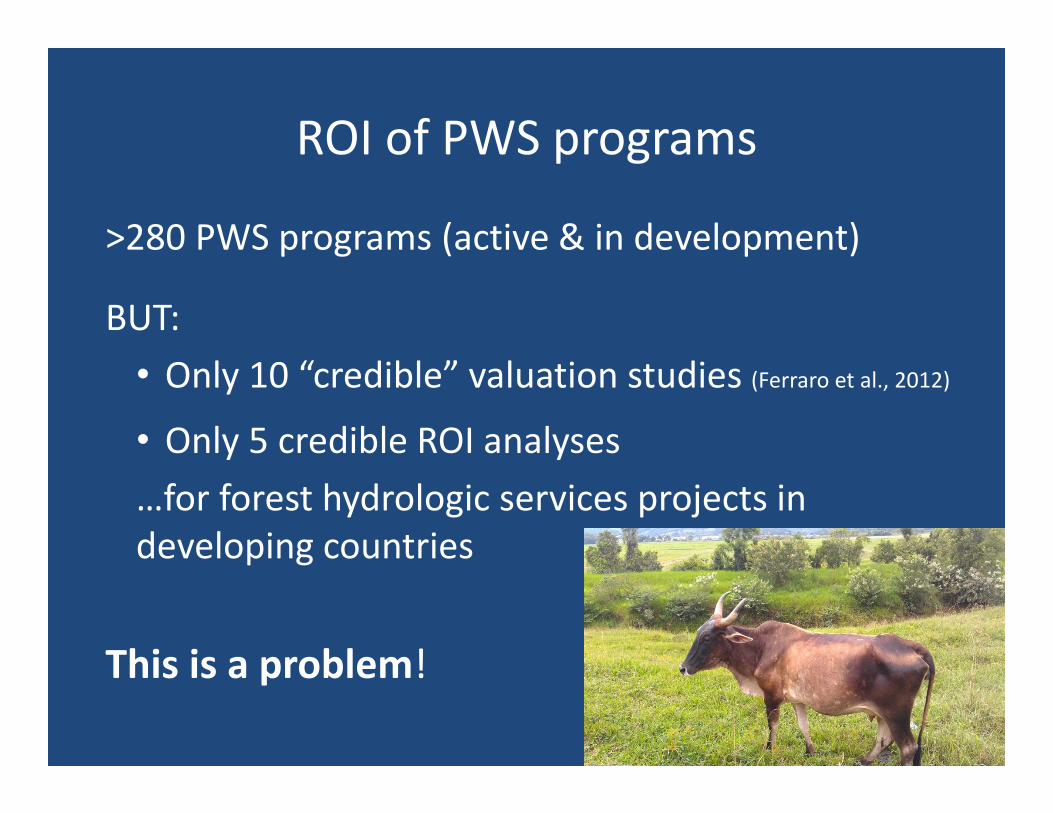
ROI of PWS programs
>280 PWS programs (active & in development)
BUT: • Only 10 “credible” valuation studies (Ferraro et al., 2012)
• Only 5 credible ROI analyses …for forest hydrologic services projects in developing countries
This is a problem!
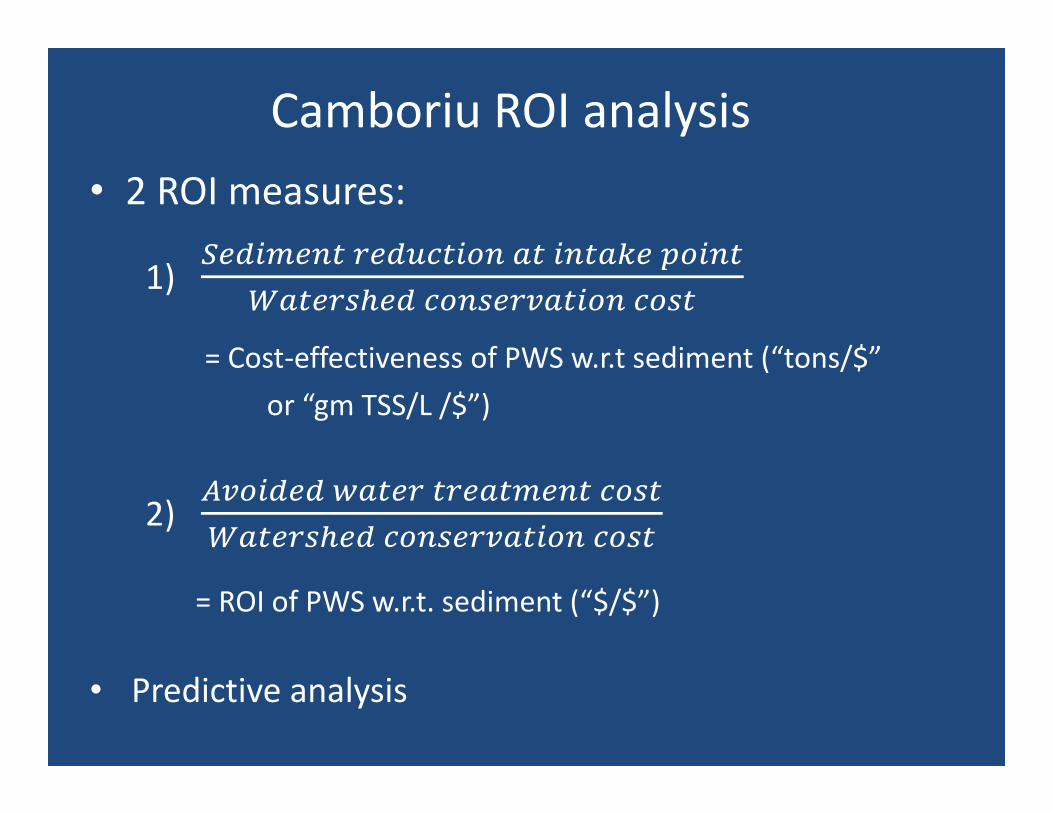
1)
= Cost‐effectiveness of PWS w.r.t sediment (“tons/$” or “gm TSS/L /$”)
2)
= ROI of PWS w.r.t. sediment (“$/$”)
Camboriu ROI analysis• 2 ROI measures:
• Predictive analysis
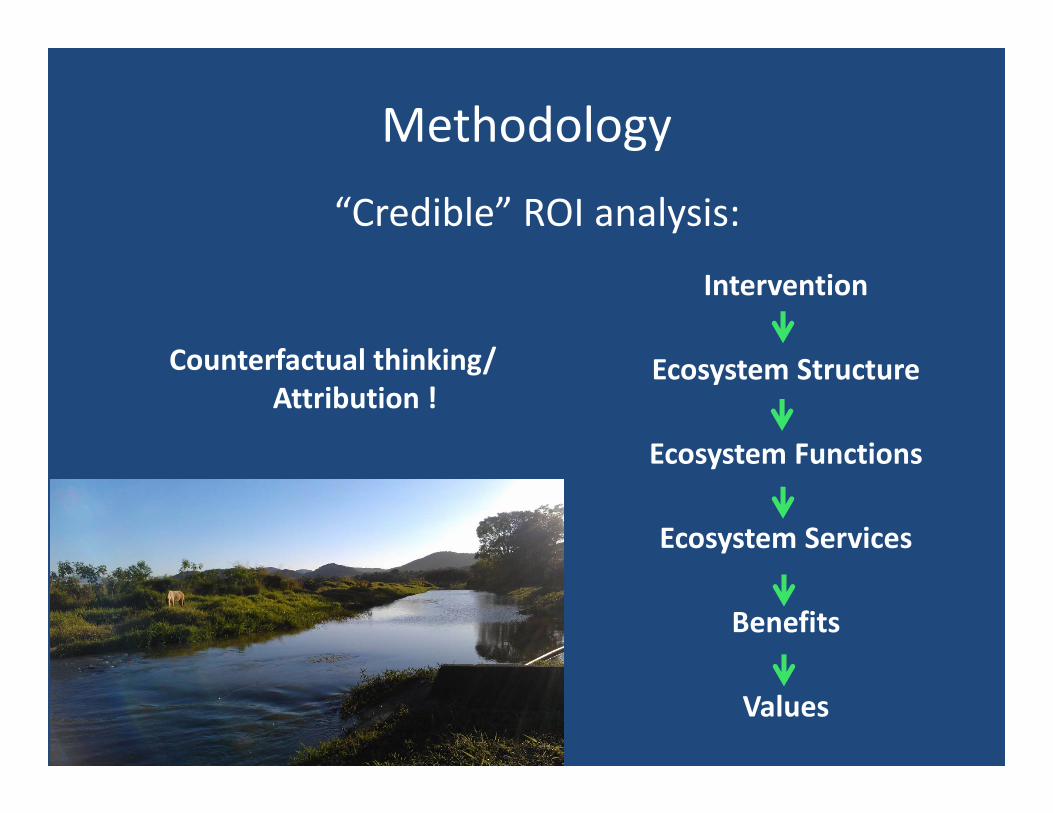
Methodology
Intervention
Ecosystem Structure
Ecosystem Functions
Ecosystem Services
Benefits
Values
“Credible” ROI analysis:
Counterfactual thinking/Attribution !
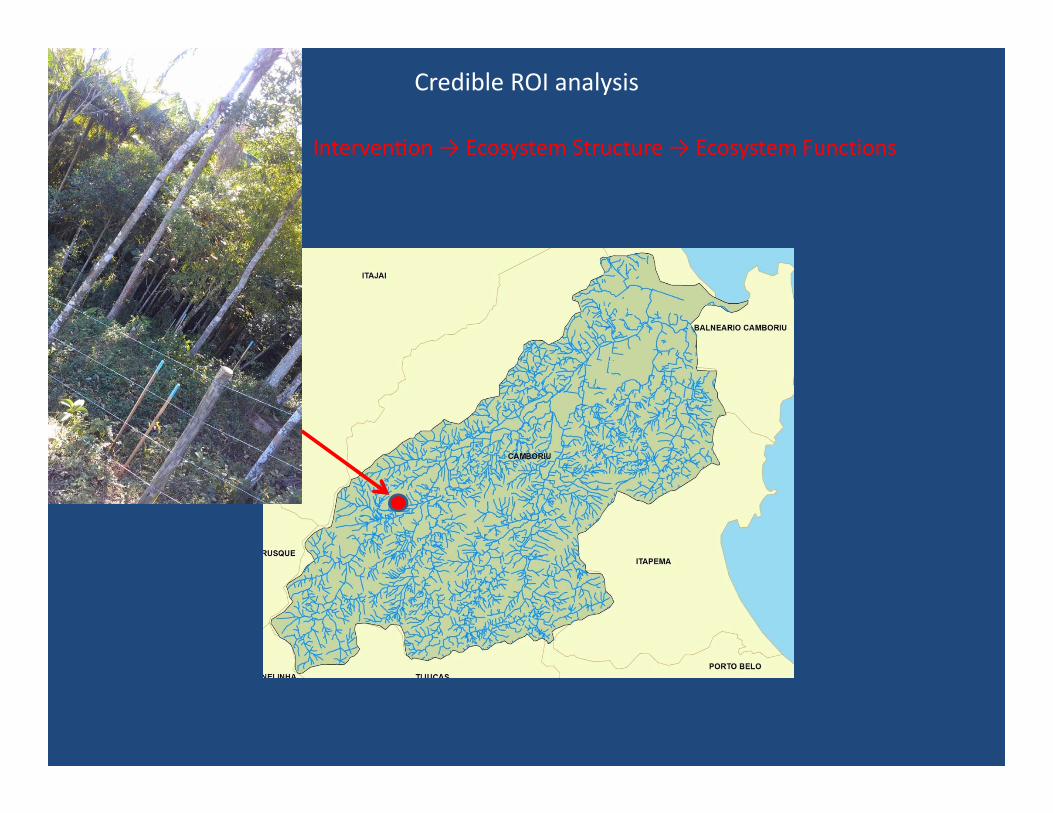
Interven on → Ecosystem Structure → Ecosystem Functions
Credible ROI analysis
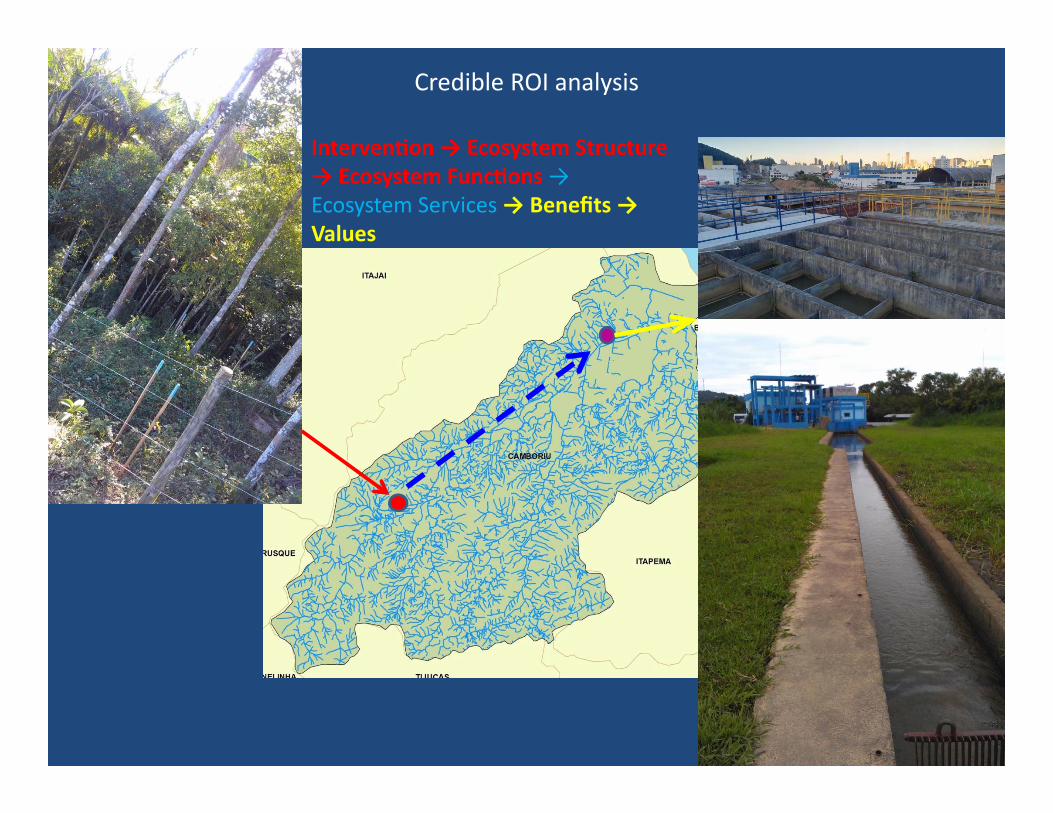
Interven on → Ecosystem Structure → Ecosystem Func ons → Ecosystem Services → Benefits → Values
Credible ROI analysis
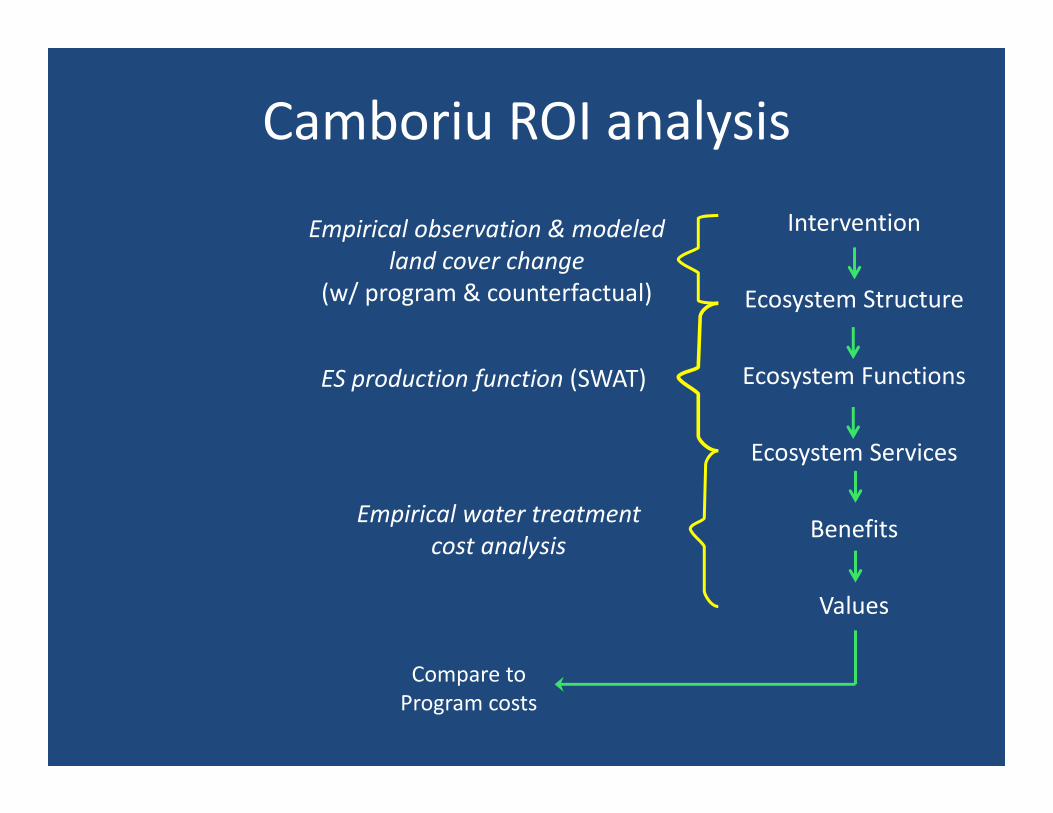
Camboriu ROI analysis
Intervention
Ecosystem Structure
Ecosystem Functions
Ecosystem Services
Benefits
Values
Empirical observation & modeled land cover change
(w/ program & counterfactual)
Empirical water treatment cost analysis
ES production function (SWAT)
Compare to Program costs
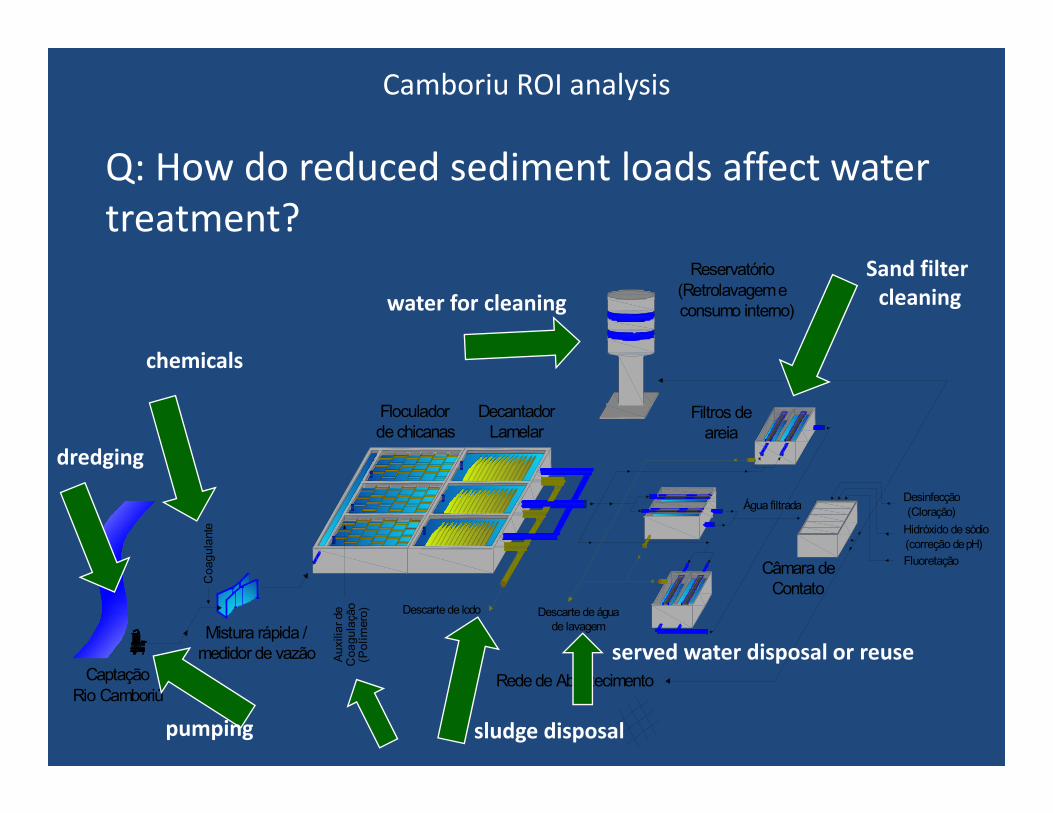
Q: How do reduced sediment loads affect water treatment?
Floculadorde chicanas
DecantadorLamelar
Filtros deareia
Mistura rápida /medidor de vazão
CaptaçãoRio Camboriú
Aux
iliar
de
Coa
gula
ção
(Pol
ímer
o)
Coa
gula
nte
Descarte de lodo
Reservatório(Retrolavagem econsumo interno)
Rede de Abastecimento
Desinfecção(Cloração)Água filtrada
Hidróxido de sódio(correção de pH)FluoretaçãoCâmara de
ContatoDescarte de água
de lavagem
chemicals
Sand filter cleaningwater for cleaning
sludge disposal
served water disposal or reuse
pumping
dredging
Camboriu ROI analysis
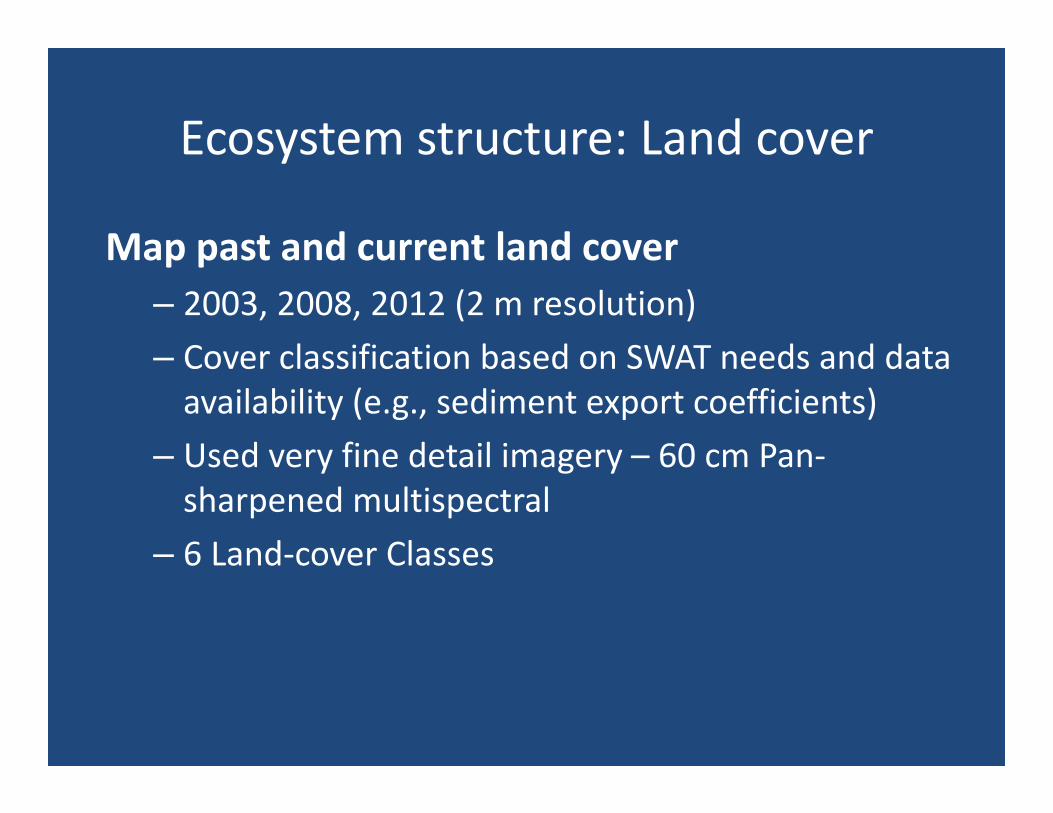
Ecosystem structure: Land cover
Map past and current land cover– 2003, 2008, 2012 (2 m resolution)– Cover classification based on SWAT needs and data availability (e.g., sediment export coefficients)
– Used very fine detail imagery – 60 cm Pan‐sharpened multispectral
– 6 Land‐cover Classes
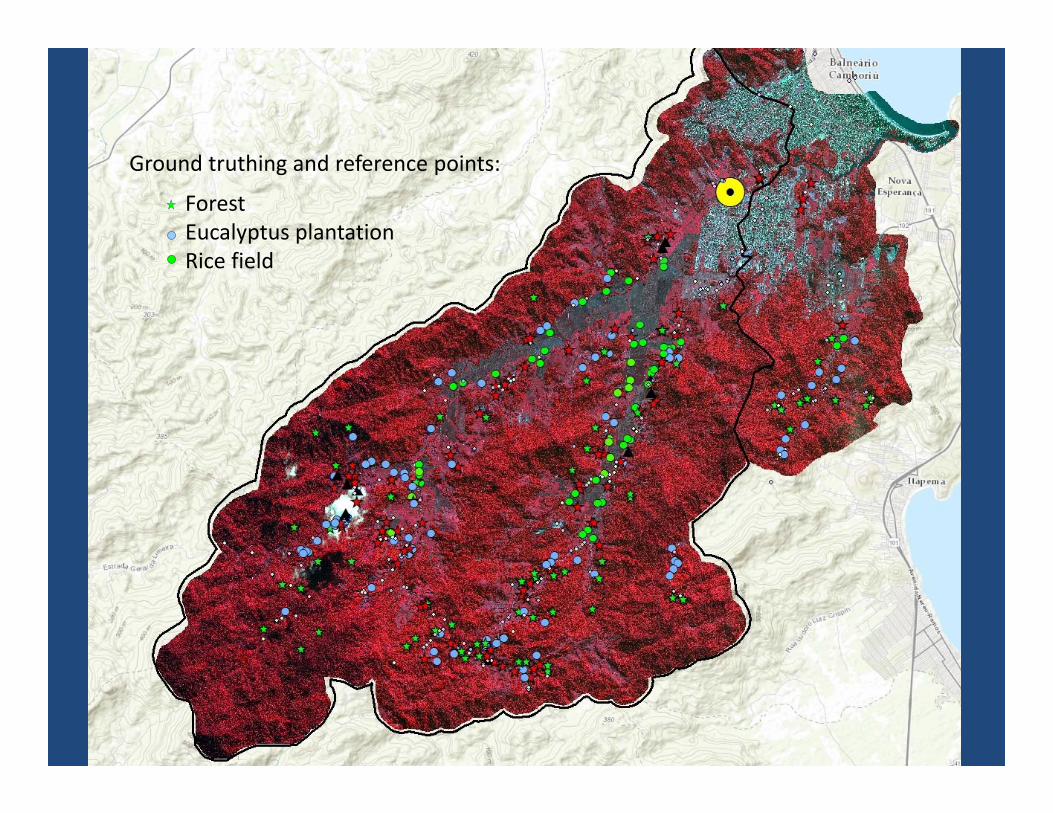
Land cover changeGround truthing and reference points:
ForestEucalyptus plantationRice field
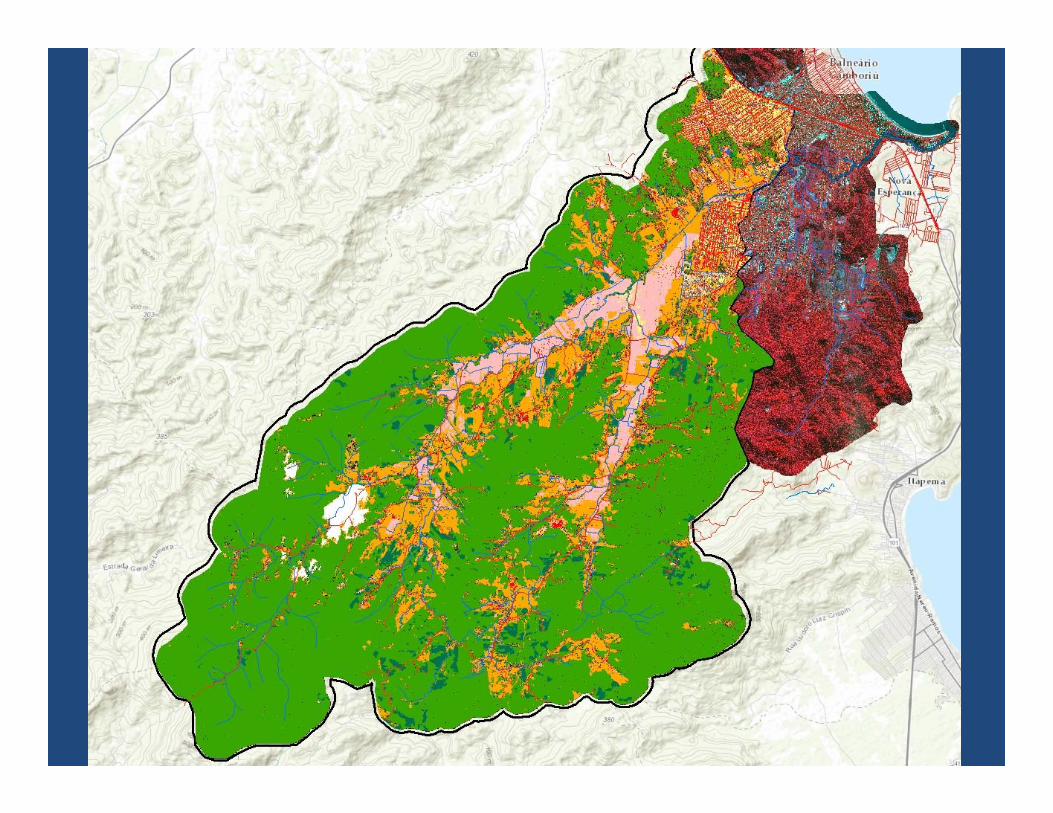
Land cover change
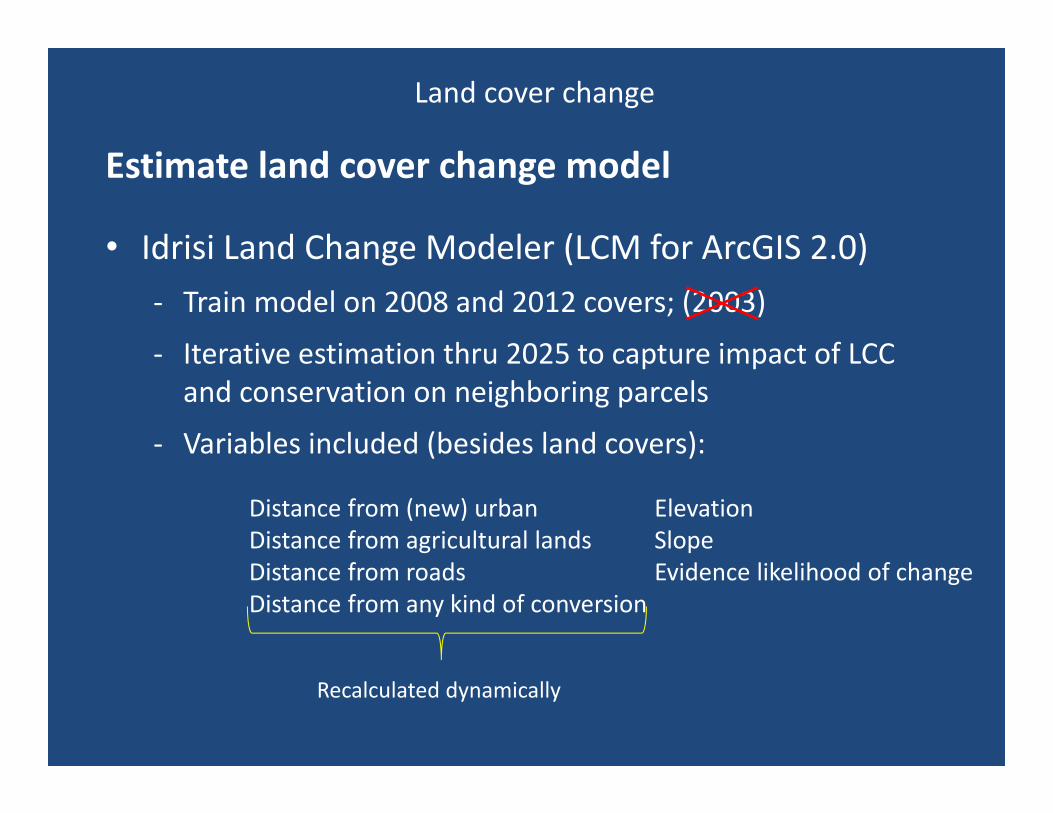
Estimate land cover change model
• Idrisi Land Change Modeler (LCM for ArcGIS 2.0)‐ Train model on 2008 and 2012 covers; (2003)
‐ Iterative estimation thru 2025 to capture impact of LCC and conservation on neighboring parcels
‐ Variables included (besides land covers):
Land cover change
Distance from (new) urbanDistance from agricultural landsDistance from roads Distance from any kind of conversion
ElevationSlope Evidence likelihood of change
Recalculated dynamically
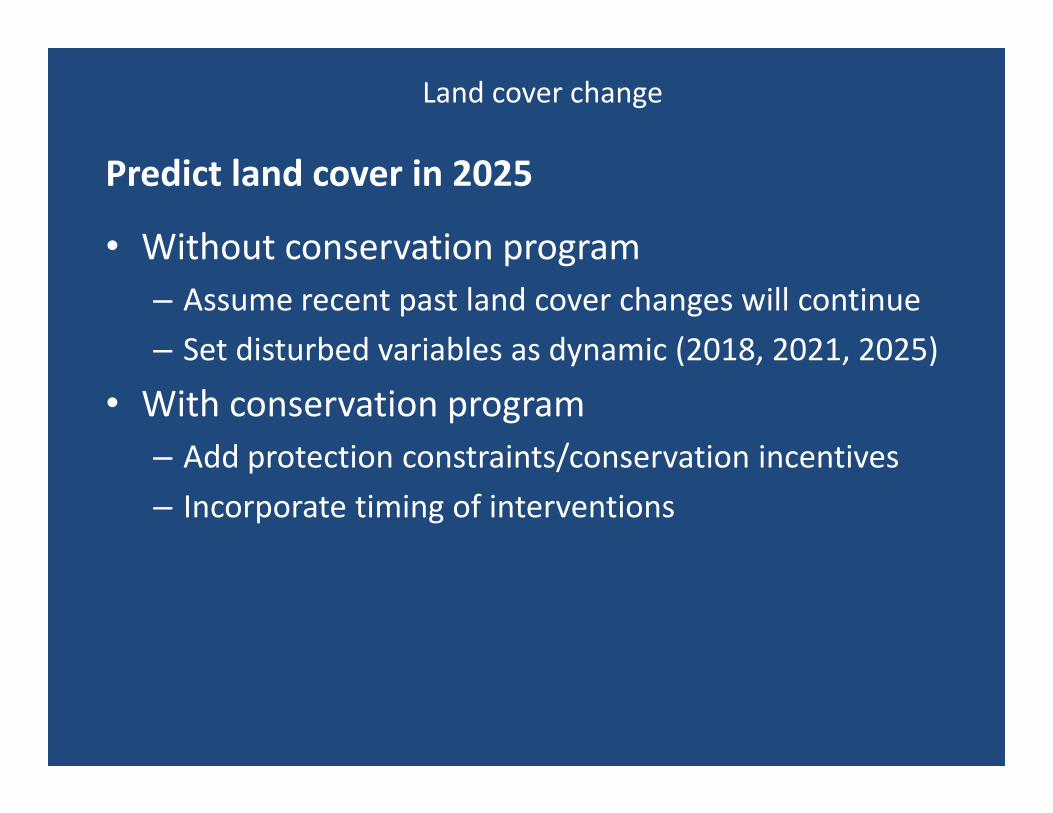
Predict land cover in 2025
• Without conservation program– Assume recent past land cover changes will continue– Set disturbed variables as dynamic (2018, 2021, 2025)
• With conservation program– Add protection constraints/conservation incentives – Incorporate timing of interventions
Land cover change
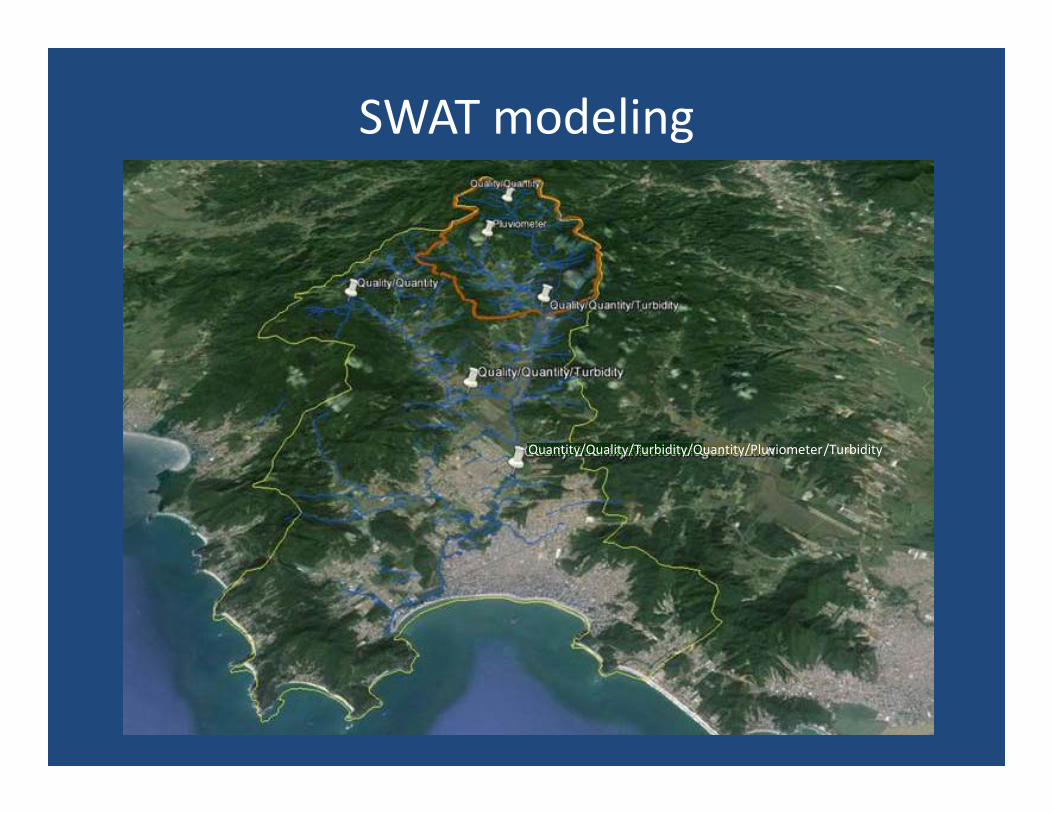
SWAT modeling
/TurbidityQuantity/Quality/Turbidity/Quantity/Pluviometer
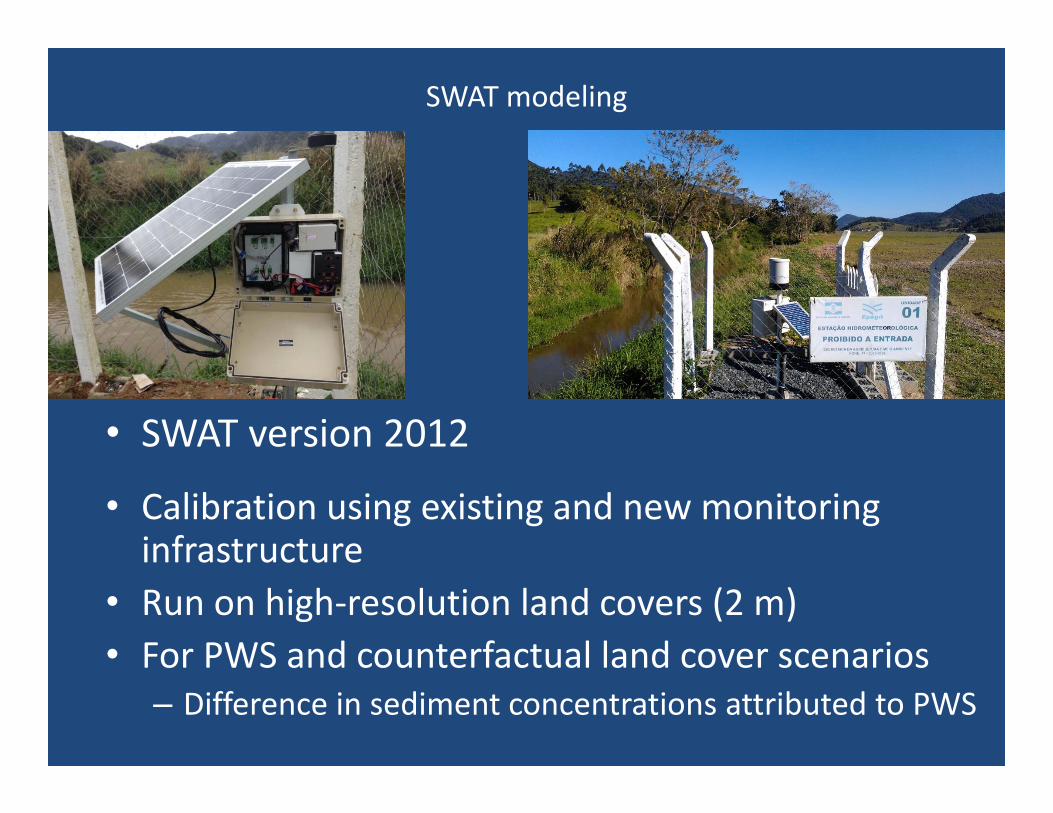
• SWAT version 2012
• Calibration using existing and new monitoring infrastructure
• Run on high‐resolution land covers (2 m)• For PWS and counterfactual land cover scenarios
– Difference in sediment concentrations attributed to PWS
SWAT modeling
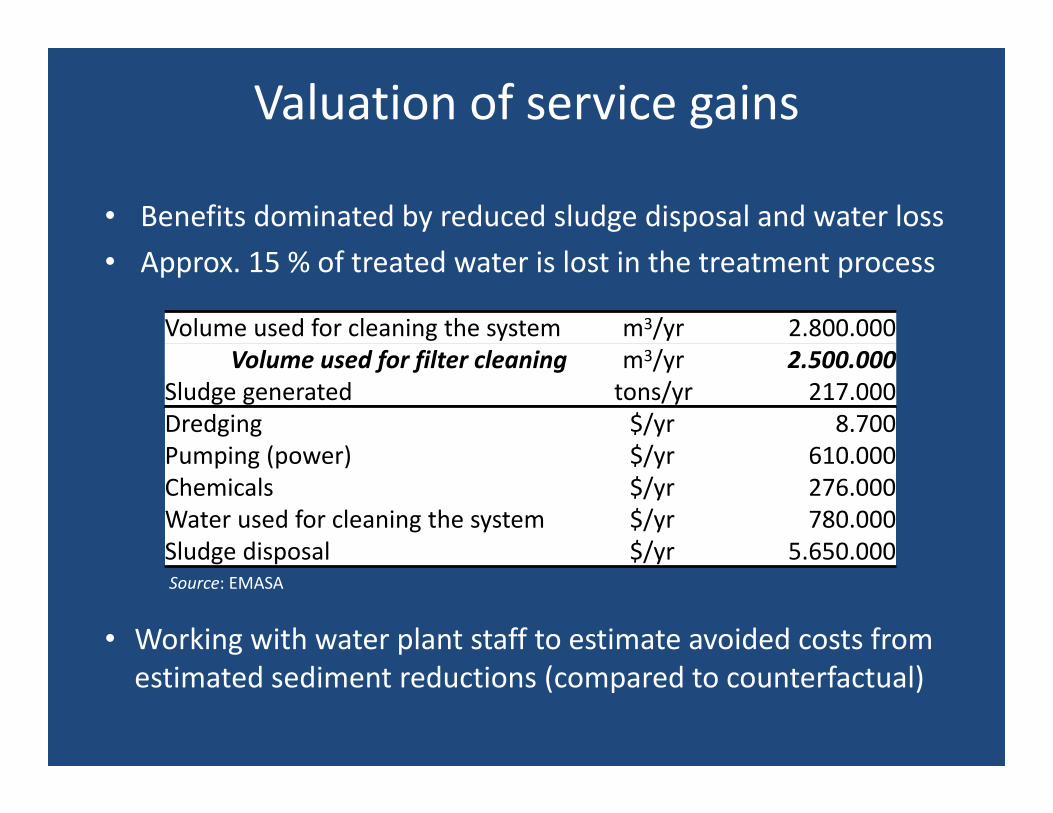
Valuation of service gains
• Benefits dominated by reduced sludge disposal and water loss• Approx. 15 % of treated water is lost in the treatment process
Volume used for cleaning the system m3/yr 2.800.000Volume used for filter cleaning m3/yr 2.500.000
Sludge generated tons/yr 217.000Dredging $/yr 8.700Pumping (power) $/yr 610.000Chemicals $/yr 276.000Water used for cleaning the system $/yr 780.000Sludge disposal $/yr 5.650.000Source: EMASA
• Working with water plant staff to estimate avoided costs from estimated sediment reductions (compared to counterfactual)
The TeamTimothy Boucher & Jonathan Fisher The Nature Conservancy Central Science Program
Claudio Klemz & Eileen Acosta The Nature Conservancy Atlantic Forest and Central Savannas Program
Paulo Petry The Nature Conservancy Latin America Region Science Program
Everton Blainski & Luis Garbossa Centro de Informações de Recursos Ambientais e de Hidrometeorologia, Florianopolis, Santa Catarina, Brasil
Andre Targa Cavassani The Nature Conservancy Latin America Region Ecosystem Services Program
Rafaela Comparim Santos & Kelli Dacol Empresa Municipal de Água e Saneamento, Balneário Camboriú, Santa Catarina, Brasil
Daniel Shemie The Nature Conservancy Freshwater Focal Area Program
P. James Dennedy‐Frank Stanford University Department of Environmental Earth System Science
THANK [email protected]