Embed Size (px)
Citation preview

RIO Country Report 2016
Belgium
Research and
Innovation Observatory
country reports series
Kelchtermans S
Robledo Boumlttcher N
2017
EUR 28498 EN
This publication is a Science for Policy report by the Joint Research Centre (JRC) the European Commissionrsquos
science and knowledge service It aims to provide evidence-based scientific support to the European
policymaking process The scientific output expressed does not imply nor prejudge policy positions of the
European Commission Neither the European Commission nor any person acting on behalf of the Commission is
responsible for the use that might be made of this publication
Contact information
Email JRC-B7-NETWORKeceuropaeu
JRC Science Hub
httpseceuropaeujrc
JRC105859
EUR 28498 EN
PDF ISBN 978-92-79-66212-6 ISSN 1831-9424 doi102760273083
Luxembourg Publications Office of the European Union 2017
copy European Union 2017
The reuse of the document is authorised provided the source is acknowledged and the original meaning or
message of the texts are not distorted The European Commission shall not be held liable for any consequences
stemming from the reuse
How to cite this report Kelchtermans S Robledo Boumlttcher N RIO Country Report 2016 Belgium
EUR 28498 EN doi102760273083
All images copy European Union 2017 except for the ERA Dashboard image on the first page by Niels Meyer
licensed under CC BY 20
Research and Innovation Observatory Country Report 2016 Belgium
The 2016 series of the RIO Country Report analyses and assesses the development and performance of the
national research and innovation system of the EU-28 Member States and related policies
It aims at monitoring and evaluating the EU policy implementation as well as facilitating policy learning in the Member States
Print ISBN 978-92-79-69856-9 ISSN 1018-5593 doi102760154917
Contents
Foreword 4
Acknowledgements 5
1 Main RampI policy developments in 2016 7
11 Focus on National and Regional Smart Specialisation Strategies 8
2 Economic Context 9
21 Structure of the economy 10
22 Business environment 10
23 Supply of human resources 10
3 Main RampI actors 10
4 RampI trends 12
41 Public allocation of RampD and RampD expenditure 12
42 Private RampD expenditure 12
43 Public sector innovation and civil society engagement 13
5 Innovation challenges 14
51 Challenge 1 Promote fast growing enterprises in innovative sectors 14
Description 14
Policy response 15
Policy Assessment 16
52 Challenge 2 Addressing the expected shortage of human resources for RampI 16
Description 16
Policy response 17
Policy Assessment 18
6 Focus on creating and stimulating markets 18
References 20
Abbreviations 22
Factsheet 24
List of Figures 25
Foreword
This report offers an analysis of the RampI system in Belgium for 2016 including relevant
policies and funding with a particular focus on topics of critical importance for EU
policies The report identifies the main challenges of the Belgian research and innovation
system and assesses the policy responses implemented It was prepared according to a
set of guidelines for collecting and analysing a range of materials including policy
documents statistics evaluation reports and online publications The quantitative data
are whenever possible comparable across all EU Member State reports Unless
specifically referenced all data used in this report are based on Eurostat statistics
available in January 2017 The report contents are partly based on the RIO Country
Report 2015 (Kelchtermans and Zacharewicz 2016)
The analysis does not take into account the full set of CIS 2014 data that was released
mid-January 2017 The factsheet in Annex include however the most recent data
including one indicator from the last wave of the Community Innovation Survey
Acknowledgements
This report has benefited from the comments and suggestions of Koen Jonkers and
Thomas Zacharewicz of Unit B7-JRC EC
Comments from DG Regional and Urban Policy and DG Research and Innovation as well
as from the Belgian authorities through the coordination of the Belgian Science Policy
Office are also gratefully acknowledged
Authors
Stijn Kelchtermans KU Leuven (Leuven Belgium)
Nicolas Robledo Boumlttcher European Commission Directorate-General Joint Research
Centre Directorate B ndash Growth amp Innovation Knowledge for Growth Finance amp
Innovation unit (Brussels Belgium)
HIGHLIGHTS
Total gross domestic product (GDP) was
euro410351b (at market prices) in 2015
(28 of EU28) Per capita GDP in 2015
was euro36600 This is 2664 above the
EU28 average (ie euro28900)
The business and innovation environment
subindex of the WEF Networked Readiness
Index 2016 ranks Belgium 22nd (out of
138) for its business and innovation
environment
The Digital Economy and Society Index
places Belgium 5th out of 28 EU Member
States in 2016 maintaining its 2015
position
Industry succeeds in attracting a large
pool of the outflow of doctorate holders
from Belgian universities nevertheless a
number of challenges in attracting
research talent remain such as the
relatively low salary of researches
compared to the private sector or a
mismatch in the supply and demand for
high-skilled researchers and engineers
GERD has remained essentially constant at
245 of GDP in 2015 compared to 246
in 2014
MAIN RampI POLICY CHALLENGES
Promote fast growing enterprises in
innovative sectors Despite Belgiums
scientific strength and the substantial
science-industry collaboration the
economic impact of these efforts remains
a concern In particular the number of
fast-growing firms active in innovation-
performing sectors is low and
consequently also their share of
employment High-growth enterprises
account for only 59 of all employment
compared to the EU average of 91
Addressing the expected shortage of
human resources for RampI While the
labour force in Belgium is generally well-
qualified the share of science technology
engineering and mathematics (STEM)
graduates is comparatively low at 1574
(EU28 2544) Demand has also
exceeded the number of graduates for the
last years Shortages in these fields are
considered as a potential major barrier for
future innovation and economic growth It
is thus paramount to increase the number
of STEM-qualified people in every region
as this high-skilled labour force is
necessary for further improving RampI
performance
MAIN RampI POLICY DEVELOPMENTS IN 2016 Federal Royal Decree allowing night shifts for executing e-commerce activities
Federal Programme Law for the sharing economy
Federal Open Data Strategy
Decision of the Flemish Government for regulating the support of innovation clusters
Flemish Plan for Government Procurement and Action Plan for Innovative
Procurement(incl innovative procurement)
SME growth subsidy (VLAIO Flanders)
Reorganisation of the Flemish public RampDampI landscape
Wallonia Small Business Act (Wallonia)
Legislative proposal for refinancing higher education (Wallonia-Brussels Federation)
WING (Wallonia Innovation amp Growth)
Small Business Act (Brussels-Capital Region)
PREC (Brussels-Capital Region)
PRI (Brussels-Capital Region)
7
1 Main RampI policy developments in 2016
Federal Royal Decree
allowing night shifts for
executing e-commerce
activities
Regulation of night shifts for executing e-commerce
activities
Federal Programme Law
for the sharing economy
Provides a legal framework for the sharing economy
Federal Open Data
Strategy
Besides implementing the 2013 PSI Directive on the re-
use of government data the strategy outlines Belgiumrsquos
open data strategy
Decision of the Flemish
Government for
regulating the support of
innovation clusters
Outlines the conditions for support for 2 types of
innovation clusters After a call 13 innovative business
networks (small-scaled clusters) are being supported and
4 spearhead clusters (large-scaled clusters) receive
support to take-off as of 2017
Flemish Plan for
Government
Procurement
Action Plan for
Innovative procurement
(Flanders)
Implementation of a procurement policy for the Flemish
Government incl innovative procurement
New Flemish action plan for innovative procurement for
July 2016 - end 2019
SME growth subsidy
(VLAIO Flanders)
Reorganisation of the
public Flemish RampDampI
landscape (Flanders)
50 co-financing of external advice or the hiring of a
strategic manager to support a growth strategy
Establishment of Flanders Innovation and
Entrepreneurship AIO now the one-stop-shop for
companies in Flanders and incorporation of the Hercules
Foundation into Research Foundation Flanders FWO now
the one-stop-shop for researchers
Wallonia Small Business
Act (Wallonia)
Aims (among other things) at making the administrative
procedures between SMEs and the Walloon authorities
smoother by streamlining the interaction process
Legislative proposal for
refinancing higher
education (Wallonia)
Legislative proposal for refinancing higher education for an
amount of euro1075 million in 2016-2019
8
WING (Wallonia
Innovation amp Growth)
Regional Innovation Plan
(Brussels-Capital
Region)
Small Business Act
(Brussels-Capital
Region)
Regional Circular
Economy Programme
(PREC) (Brussels-Capital
Region)
Participation in ESA
Federal Science Policy
Office (Belspo)
Institutional changes
regarding the federal
science policy office
Federal Science Policy
Office (Belspo)
Equity platform for financing the growth of digital start-
ups as part of the digital Wallonia strategy
Full-scale update of the BCRrsquos RampDampI policy framework
including many new funding schemes and an enlarged
scope in terms of actors and forms of innovation
Sets out the BCRrsquos guidelines regarding an inclusive SME
and entrepreneurship policy including fostering innovation
among these companies
Promotes an innovative regional economy by mobilising
resources and minimising waste
Participation in the space summit (ESA) - Lucerne Suisse
1st and 2nd of December 2016 Towards Space 40 for a
United Space in Europe
Decision of the council of ministers (25th of November
2016) to create a space agency and integrate the Federal
Science Policy Office (Belspo) into the Federal Department
of Economics
11 Focus on National and Regional Smart Specialisation Strategies
Description and timing Belgiums Research for Smart Specialisation (RIS3) is performed
at the regional level and every region has its competence in the matter Flanders and
Wallonia implement a cluster policy addressing various thematic areas whereas the
Brussels-Capital region primarily focuses on ICT life sciences and environment
New Developments In Flanders the phased plan of the concept note (A smart
specialisation strategy for a targeted cluster policy) included a pre-roadmap for a policy
of advanced clusters during the legislative period 2014-2019 Since November 2013
pilot trajectories have been started in the fields of sustainable chemistry additive
manufacturing and materials to develop a partnership for designing a cluster roadmap
The policy note Work Economy Science and Innovation 2014-2019 from the new
minister announces the elaboration of a new targeted cluster policy with 2 types of
clusters For both the innovative business networks (IBN) and spearhead clusters several
initiatives were approved in 2016 In October 2016 iMinds was integrated as an
additional business unit within imec resulting in a new research centre that fuses the
9
technology and systems expertise of more than 2500 imec researchers worldwide with
the digital competencies of some 1000 iMinds researchers
These pilots for developing new cluster policies explored the conditions for strategic
cooperation between government services and cluster organisations on a wide range of
policies (eg innovation training trade regulation) that are needed to accomplish the
transformation objectives with roadmaps for concrete cases
In Wallonia the latest extension of the multi-year strategy the Marshall Plan 40
(2014-2019) announced the intention to renew the strategy of the competitiveness
poles and to recast the RampDampI Decree to buttress the smart specialization strategy With
respect to the latter the Walloon Parliament has adopted a new RampDampI Decree in May
2015 revising the previous law of 2008 A first key principle behind the reform is to
apply the excellence criterion already used for deciding on support to the
competitiveness poles also more manifestly to research projects Second the decree
foresees in administrative simplification by reducing the types of projects from 10 to 3
Finally closer alignment of priority research domains with 6 competitiveness poles is
expected to strengthen industry-science links Up to now 6 competitiveness poles have
been created in the areas of logistics aerospace health agro-food mechatronics and
green technologies For their specific support the Government has developed a policy
mix for investment (typically co-financing) RampI exportation and FDI training and
networking The competitiveness poles are complemented by 7 clusters of firms (mostly
SMEs) that were defined in a bottom-up fashion
The Brussels Capital Region identified its priorities to be in the domains of ICT life
sciences and environment The Bridge programme formerly known under the name
strategic platforms was launched for the first time in 2010 It was inspired by the
Regional Plan for Innovation (PRI) and aims to reinforce measures taken since 2006 in
the frame of so-called impulse programmes In addition Strategy 2025 (approved in
June 2015) puts forward support for research and innovation as one of its 18 objectives
One of the operational targets within this objective is to make the transition to a ldquoSmart
Cityrdquo whereby the precise needs will be determined in conjunction with the smart
specialisation strategy that will has been detailed in the new Regional Innovation Plan
(2015-2020 under construction which has been adopted by the Government of the BCR
Outstanding issues the development of smart specialization strategies is an ongoing
exercise For example the roadmaps for Key Enabling Technologies (KETs) that were
developed in Flanders in 2015 need further refining and updating to guide further system
innovation exploiting the regional strengths and identify cross-KET synergies Further
in November 2016 the Vanguard Initiative on smart specialization of which both the
Flemish and Walloon Region are members adopted a position paper on the post-2020
European smart specialization policies Amongst others it advocates a more innovation
oriented and demand driven bottom-up approach for the identification of commercial
opportunities towards industry-led modernizations
2 Economic Context
Belgiums total gross domestic product (GDP) was euro410351b (at market prices) in 2015
(28 of EU28) Per capita GDP in 2015 was euro36600 This is 2664 above the EU28
average (ie euro28900) There are significant regional differences in the GDP per capita
Wallonia lies just below the EU28 average (983 in 2010) Flanders lies well above
(1327) and Brussels-Capital lies extremely high above (2502)
Labour productivity growth in Belgium was 08 in 2014 compared to 02 for the
EU281 Multifactor productivity growth ndash the part of GDP growth that cannot be
explained by changes in labour and capital inputs - equalled 048 in in 2014 just
below Germany (050) and the Netherlands (054) Within the EU28 only Sweden
(061) performed better in 2014
1See httpsdataoecdorglprdtylabour-productivity-and-utilisationhtm (last consulted 082016)
10
21 Structure of the economy
In terms of the economic structure the share of industry in value added has steadily
declined from 199 in 2003 to 143 in 2015 In terms of employment the services
sector is the most important with 804 of total employment in 2014 (versus 732 for
the EU-28) Conversely 113 of the labour force in 2014 was active in the
manufacturing sector compared to 140 for EU-28 High-tech and medium high-tech
manufacturing accounted for respectively 37 of employment in 2014
22 Business environment
The business and innovation environment subindex of the WEF Networked Readiness
Index 2016 shows reasonable but not leading scores for Belgium for its business and
innovation environment (ranked 17th out of 138) As far as access to finance is
concerned measures to encourage venture capital and tax deductions for reinvested
profits and to facilitate SMEs access to Structural funds could still be further developed
(SBA Factsheet 2015) Nevertheless Belgium performs relatively well with respect to
SMEsrsquo access to finance showing above-average scores compared to other EU countries
(SBA Factsheet 2015)
Regarding digital infrastructure and services the Digital Economy and Society Index
places Belgium 5th out of 28 EU Member States in 2016 maintaining its 2015 position
Nevertheless the shortage of ICT specialists is a well-known weakness2
23 Supply of human resources
Industry succeeds in attracting a large pool of the outflow of doctorate holders from
Belgian universities and this group has been continuously increasing over recent years
in a period of ten years 6 more doctorate holders have made a career turn from
academics to industry (CDH survey 2010) The third most important employer of
doctorate graduates is government Government employs on average 10 of all
doctorate holders and this percentage does not fluctuate much
Nevertheless a number of challenges in attracting research talent remain First the
remuneration of researchers is relatively low compared to the private sector even
though (early-stage) Belgian researchers are relatively well-paid compared to their
counterparts in other countries Second participation of women in research remains low
although improving Third a mismatch exists in the supply and demand for high-skilled
researchers and engineers with a shortage in the fields of physics chemistry and IT
Finally in an EU perspective community regulations prescribe the use of the official
language at Higher Education Institutions (HEIs) which can be a barrier to foreign
researchers
3 Main RampI actors
The Belgian regions have authority on research policy for economic development
purposes thus encompassing technological development and applied research and all
valorisation purposes including strategic research centres and other knowledge centres
The communities (French Community Flemish Community and German-speaking
Community) are responsible for education and fundamental research (including strategic
basic research) at universities and higher education establishments including the
Community scientific institutes Access to finance is also a regional competency The
Federal Government is in charge of the federal scientific institutes intellectual property
(IP) law standardisation fundamental metrology nuclear energy research polar
research defence research public health research corporate taxation employment
legislation and social security The RampD tax credit a major policy instrument in Belgium
2 In 2015 461 of enterprises with job vacancies requiring specialized ICT skills reported problems in filling
these positions For the ICT workforce alone the shortfall is estimated to rise from about 8000 persons in 2012 to 30000 in 2020 (DESI Index 2016 Country profile for Belgium) The lack of ICT-related human capital ties into the broader debate on (low) number of STEM graduates in Belgium
11
is a competence of the federal state It also acts on behalf of all entities regarding
research that is part of international agreements such as space research for which end
November 2016 a new agency has been established in which the regions are part of the
management
The Belgian research system is highly ldquodevolvedrdquo due to the federalisation process of the
last 28 years that has gradually split competencies and transferred them from the
federal level to the regions and communities Belgium has seventeen federal scientific
institutes which are of diverse types and cover a wide variety of research activities and
collections At the administrative level they are managed by various policy fields and10
of these institutes are under the overall responsibility of the federal Minister for Science
as part of the Programmatory Public Service (PPS) for Science Policy Belspo These
scientific establishments have a two-fold mission a scientific public service mission (the
development maintenance and dissemination of scientific technical and cultural
information and documentation collection conservation etc) and a research mission
(through research often conducted in partnership with the universities of the Flemish
andor French Community) The Federal Government also has responsibility for two
other research organizations the National Institute for Radio-elements and the
renowned Nuclear Energy Centre (SCK or CEN)
The main sectors that conduct research are life sciences and chemistry ICT and
communications and the electrical machinery and apparatus industry
In Flanders there are five Scientific institutes and 4 strategic research centres and a
set of other knowledge centres in various domains (marine sciences tropical medicine
etc) In Flanders the universities represent the first pillar of the higher education
system and represent the major part of the scientific output in the Flemish RampD
ecosystem the universities generate almost 90 of all public scientific output in
Flanders (Geerts et al 2014) The five universities of the Flemish Community are the
Katholieke Universiteit Leuven (KU Leuven) Universiteit Gent (UGent)
Universiteit Antwerpen (UA) Vrije Universiteit Brussel (VUB) and Universiteit
Hasselt (UHasselt) At the public authority level the policy domain of economics science
and innovation was reorganized involving major changes in 2016 The new Agentschap
voor Innoveren en Ondernemen AIO (Flanders Innovation and Entrepreneurship) has
started as of 2016 and acts as the one-stop-shop for support for companies Three IWT
programmes focusing on strategic research have been transferred to the Research
Foundation Flanders (FWO) FWO as of 2016 also incorporates the activities of the
Hercules Foundation (support for research infrastructure) and now acts as the one-stop-
shop for researchers in Flanders
In the Wallonia-Brussels Federation universities also play a key role as research
performers The 6 universities are the Catholic University of Louvain (UCL) Saint-
Louis University Brussels (USL-B) the University of Namur (UNamur) the Free
University of Brussels (ULB) the University of Mons (UMons) and the University of
Liegravege (ULg) The (KMS-ERM) a federal institution completes the higher education RampD
ecosystem
The Belgian business enterprise sector is very heterogeneous in terms of RampD and
innovation with a strong presence of sectors like pharmaceuticals and chemicals which
are characterized by high RampD intensities Most large companies are clearly innovation-
active (CIS survey 2013) Most of these large enterprises belong to multinational
groups so that their research and innovation policy is not exclusively determined in
Belgium In 2015 the RampD intensity in the business sector was 177 Belgium
therefore ranks higher than the EU-28 average and the Netherlands but distinctly lower
than the Scandinavian countries Germany the USA and Japan
Even though the large majority of SMEs do not conduct research directly many of them
outsource research to some extent buy innovation elsewhere or are active in networks
so that they can also be regarded as innovation-oriented The CIS survey results for
12
Belgium confirm the high proportion of innovative companies overall Nevertheless
innovation continues to be largely concentrated in industry and large companies
In addition to the higher education and business sectors Belgium has an additional type
of RampD actor the collective research centres These fourteen sector-specific centres are
established as public-sector entities but in close cooperation with the relevant sectorrsquos
business federation They perform research on behalf of and provide technical and
scientific services to businesses in these sectors
4 RampI trends
41 Public allocation of RampD and RampD expenditure
Total GERD in Belgium was euro100724m in 2015 The breakdown by funding source
(using the most recently available data of 2013) shows the following distribution the
business sector (euro5435m) the government (euro2717m) and foreign funding
(euro1257m)3 Direct funding from the government goes to business enterprises (euro827m)
the government (euro431m) and the higher education sector (euro1448m)
Figure 1 Trend of GERD by source of funding
Data source Eurostat November 2016
The total GERD increased almost linearly in the period 2005-2013 with a flattening in
2009 as a consequence of the decrease in funding from the private sector that year
The private sector is the main funder of the Belgian GERD The gap with the contribution
from the government appears to be growing after 2009 due to the faster growth of the
RampD funding from the private sector The funding from the European Commission
remains roughly constant in the period under scrutiny amounting to roughly 12 of the
GERD funded by the government (see Figure 1)4
42 Private RampD expenditure
The economic sector that was mainly responsible for the increase in BERD is
pharmaceuticals (NACE C21) There are more than 200 pharmaceutical companies in
3 2013 data 4 A regional breakdown for 2013 can be found here on sheet R5
13
Belgium5 The largest Belgian based RampD performer is UCB spending over 786 million
euro in RampD in 2014 and ranking 50th on the 2015 Industrial RampD scoreboard of top RampD
spenders in the EU In 2012 it received a euro200+ million loan from the EIB for investing in
the development of new drugs Other pharmaceutical firms with RampD activities include
the former Solvay Pharmaceuticals (now Abbott) and RampD labs of other large
pharmaceutical companies such as Janssen (part of Johnson and Johnson) In addition
there are a number of smaller pharmaceutical biotech firms active in Belgium including
Thrombogenics (707th in the 2015 scoreboard) and Ablynx (989th) The
biopharmaceutical research industry in Belgium is RampD intensive and invests a
comparatively large share of its turnover in RampD in Belgium to almost euro26 billion in
20156
The top sectors in terms of business RampD are pharmaceuticals (sector CF 288 of total
business RampD expenditure in 2013) scientific RampD (MB 104) Manufacture of
computer electronic and optical products (CI 71) and IT amp information services (JC
63) In terms of recent evolutions the BERD in the Manufacture of computer
electronic and optical products (NACE C26) in 2010 and 2011 was lower than the 2008
values but regained its 2008 levels in 2013 There is a decrease in RampD expenditure by
Agfa-Gevaert (171th in the 2015 ranking) in 2012 and 2013 but this doesnt fully explain
the drop in C26 BERD The chemical sector (NACE C20) with one of Belgiums leading
Scoreboard companies Solvay (95th) declines after a peak in 2011 but remains also in
2013 above 2008 levels of BERD7
Figure 2 Top sectors in manufacturing (C20 Manufacture of chemicals and chemical
products C21 manufacture of basic pharmaceutical products and pharmaceutical
preparations C26 Manufacture of computer electronic and optical products) Top
service sectors (G=wholesale and retail trade repair of motor vehicles and motorcycles
J=information and communication M=professional scientific and technical activities)
The most important contribution to the BERD increase comes from the combined
services sectors especially professional scientific and technical activities (NACE M) and
Information and Communication (NACE J) In the former (M) which is the service sector
with the highest levels of BERD BERD increased by over 50 between 2009 and 2013
While part of this increase may be due to the outsourcing of RampD activities by Belgian
SMEs internal RampD expenditures also show an increasing trend The increase in RampD tax
incentives may have contributed to this development as well The information and
communication sector also experienced a growth in BERD between 2009 and 2011 after
which it flattened out Wholesale and retail trade witnessed a considerable BERD
increase between 2011 and 2012 While BERD remained stable in 2008-2009 all the
service sectors studied increased in the post-crisis period The share of the sectors G-N
in total BERD increased from 33 to 37 between 2008 and 2013
43 Public sector innovation and civil society engagement
5 httppharmabenlfocuseconomische-footprintfarmasector-belgiehtml 6 httppharmabenlfocuseconomische-footprintfarmasector-belgiehtml 7 httpwwwinnovationdatabeiRD_03Business-enterprise-RD-expenditure-top-four-economic-activities
14
The rising trend in the online availability of public services (and their use) is
demonstrated by the fact that in 2015 more than half of citizens (52) interacted with
public authorities via the Internet up from 41 in 2009 This increasing take-up of
information and communication technologies to deliver government services is also
reflected in Belgiumrsquos ranking based on the UN E-Government Survey (from 25th
worldwide in 2014 to 19th in 2016) There is also an increasing trend in the share of
businesses who won at least one public procurement contract (28 in 2015 an increase
of 7 percentage points) or who participated in a tender for a public procurement
contract but without success (24 in 2015 + 5pp)8
A number of Citizen Science initiatives have recently been launched in Belgium In
Flanders the web site lsquoIedereen Wetenschapperrsquo (lsquoEveryone a Scientistrsquo) was launched
in 2015 It is an initiative of the science magazine EOS supported by Scientific American
and the association of young academics (lsquoJonge Academie Vlaanderenrsquo) It is part of the
international Citizen Science Association and the European Citizen Science Association
(ECSA) Public research organizations have also taken action to engage citizens for
example to collect data At all levels the phenomenon of hackathons open events
where people can join a collaborative effort on software projects is also becoming more
prevalent A recent example is the lsquoCitizens of Walloniarsquo hackathon in March 2016
dedicated to the development of new service applications targeting well-being
employment and education (lsquouniversity 20rsquo) The event joined different types of
partners technological (eg IB) educational (University of Mons) and governmental
(eg the Digital Wallonia agency) In Brussels the Urban Bee Lab brings together
artists scientists beekeepers technicians and creative people to study the interaction
between city honeybees and urban ecosystems It supported by the Free University of
Vrije Universiteit Brussel (VUB)Sony Corporation the DG Culture of the European
Commission and the Flemish Community Innoviris the Brussels institute for research
and innovation also supports a wide range of sensibilisation and citizen science
activities as well as the new ldquoCo-Createrdquo funding scheme for collaborative science
projects
5 Innovation challenges
51 Challenge 1 Promote fast growing enterprises in innovative sectors
Description
Belgium has a strong science performance (around 175 BERD intensity compared to
13 EU28 and around 0073 of GDP is spent by the public sector but financed by
business enterprises compared to 005 at EU28 level) However the strong science
base and its interactions with business do not seem to translate sufficiently into
innovation output and economic performance This is illustrated by the European
Innovation Scoreboard 2016 which shows that Belgium performs slightly worse than the
EU average with respect to indicators capturing economic effects of research and
innovation (eg Medium and High Tech product exports Sales of new to market and
new to firm innovation) There is thus still margin for improvement regarding the
transfer of its scientific and innovative capabilities into clear economic benefits
One particular economic performance measure that raises concern is the lack of fast-
growing firms in innovative sectors since these firms make a significant contribution to
job creation (Commission Staff Working Document Country Report Belgium 2016) With
a share of employment in high-growth enterprises of only 59 Belgium is well under
the EU average of 91 (Belgium ranks 23rd in the EU for this indicator) In addition
many fast-growing Belgian firms operate in sectors which are traditionally non
innovative such as construction and transport (Commission Staff Working Document
8 Innobarometer 2015 httpeceuropaeugrowthindustryinnovationfacts-figuresinnobarometer_en (last consulted 082016)
15
Country Report Belgium 2016) Efforts have nevertheless been made to promote
innovation inside these traditionally non-innovative sectors such as the Brussels-Capital
Regionrsquos Retrofit Living Lab in the construction sector It should be noted that the
indicator base to support this challenge is rather limited since few indicators directly and
jointly capture innovativeness size and growth at the company level There is also a
clear lack of lsquoflowrsquo indicators that allow assessing for example the extent to which high-
growth innovative enterprises in Belgium tap into the countryrsquos strong science base
through the systematic linkage of references in patent documents to scientific
publications
Economic growth depends critically upon innovative fast-growing firms which also
generate a disproportionally large share of jobs (European Semester Thematic Fiche
Research and Innovation 2016) Given the growth challenge facing Belgium ndash and
Europe as a whole ndash and the pivotal role of high-growth innovative SMEs increasing
their prevalence is a key policy challenge Enabling such enterprises to emerge and
develop will support structural change and provide an important impetus to the country
on its path towards a more knowledge-oriented and innovation-driven economy
Policy response
In Wallonia the main strategic agenda is given by the Marshall Plan 40 (approved in
May 2015) which aims at making the region more competitive and which provides the
framework for many initiatives such as the Walloon Small Business Act The Marshall
Plan 40 envisages fomenting the creation of enterprises by making the workforce more
entrepreneurial via the entrepreneurial generations 2015-2020 project This project
encourages the creation of enterprises by making study programs more
entrepreneurially oriented boosting investment in future entrepreneurs and encouraging
female entrepreneurism The Marshall Plan 40 also develops competitive clusters based
on the rationale of smart specialisation New instruments that foster the creation of
innovative enterprises include WING an equity platform for financing the growth of
digital startups and the charte bancaire a charter between the Walloon Government
and Febelfin (the Belgian federation of the financial sector) to improve access to finance
for SMEs The latter measure is also part of the more comprehensive Walloon Small
Business Act which is a comprehensive plan to stimulate the creation and growth of
SMEs
In Flanders the overarching strategic policy framework is Vision 2050 which
formulates long-term objectives for society ndash most of which have direct implications for
RampI With respect to initiatives that have an impact on creating and scaling up SMEs one
of the noteworthy new measures is the ldquoSME growth subsidyrdquo adopted in May 2016 The
new instrument is directed at companies with growth plans (by innovating expanding
international activities or transforming the business with new activities) and reshuffles
the former IWT startersrsquo subsidy
This programme is directed at companies with growth ambitions through innovation
international expansion or transformation of their business with new activities In the
same spirit a key role in directly affecting the birth rate of high-tech firms is played by
the strategic research centres such as the business incubation programs of iMinds (now
a part of Imec) which are supported by accompanying financing instruments such as the
Spin-off Financing (SOFI) funds Also in 2015 the Government of Flanders adopted a
concept paper on entrepreneurship with the promotion of ambitious entrepreneurship as
guiding principle It concerns the provision of services to companies regarding (1)
awareness raising public perception of entrepreneurship (2) guidance across the
various life stages with focus on (pre)start and access to funding financial literacy
support for businesses in difficulty relaunchrestart after bankruptcy monitoring amp take-
over and (3) networking targeted to (high) growth companies Finally Flanders wants to
continue stimulating the spirit of enterprise and entrepreneurship through education
through the ldquoEntrepreneurial Education 2015-2019rdquo plan which was updated in late
2015
16
In the Brussels-Capital Region the long term strategic framework ldquoStrategy 2025rdquo
foresees financial help for innovative firms that develop economic activities fostering
employment and value added
In order to transfer scientific and technological knowledge from the scientific to the
business non-profit and government sector ndash with the explicit aim of economic
valorization in the short to medium term - the Brussels-Capital Region has adopted since
2010 the ldquoBridge Programmerdquo In addition to these specific support schemes the
ldquoRegional Innovation Planrdquo addresses the financing of innovative companies directly as
well as through the Brussels Regional Investment Company (SRIB(GIMB and its
ldquoBrustartrdquo product Citydev has set up hosting and incubation structures the Brussels
Enterprise Agency (Impulse) coordinates several sectoral centers and helps companies
to participate in European programmes The new Regional Innovation Plan and its
associated new RampDampI Ordinances (which are currently being adopted) also includes
many new actions including support to knowledge transfer an incubatorsrsquo platform co-
creation proofs of concept living labs and collaborative prototyping and innovative
services projects
At federal level various tax incentives for RampD are in place to encourage firms to
strengthen their RampD base The main measure is the partial exemption of the wage
withholding for researchers which is a measure with spillovers to other RampD policy
domains as it strengthens the demand for highly qualified staff (see also challenge 2)
Policy Assessment
It is well-known that the very strong science base in Belgium is not translated into
equally strong innovation performance as indicated by for example its position on the
IUS scoreboard Despite the efforts aimed at fostering spillovers between the realms of
science and innovation there seems to be untapped potential when it comes to the
creation of innovative firms and especially the scaling-up of such companies
Various policy initiatives by the different governments do address this challenge For
example there is growing attention for demand-side policies such as proof of concept
funding and living labs Such schemes could be strengthened further based on the
rationale that they generate feedback from the market to research ensuring that RampD is
directed to those issues seen as most pressing by users In addition support measures
could provide more incentives to steer innovative efforts to domains with a large growth
potential
Another promising prospect to capitalize further on Belgiumrsquos excellent science base is to
make universities and public research organizations more entrepreneurial While some
universities already display strong performance in this respect with for example the KU
Leuven topping Reuterrsquos ldquomost innovative European universityrdquo-ranking9 in 2016
entrepreneurial universities and PROs could take up an even stronger role as catalysts of
Triple Helix interactions
52 Challenge 2 Addressing the expected shortage of human resources for RampI
Description
While the labour force in Belgium is generally well-qualified the share of science
technology engineering and mathematics (STEM) graduates is low at 1574 compared
to the EU28 average of 2544 While the share of STEM students in total inflow in
higher education has shown an increasing trend in recent years demand exceeds the
number of graduates Shortages in these fields are considered as a potential major
barrier for future innovation and economic growth and are already emerging for certain
functions such as ICT experts More generally a skill mismatch is observable -
particularly acute in the Brussels-Capital due to various demographic factors - and is
9 See httpwwwreuterscomarticleus-innovative-stories-europe-idUSKCN0Z00CT (last consulted 082016)
17
mainly related to an undersupply of highly-skilled job-seekers and to an over-
representation of low-skilled job seekers (RIO CR 2015 Belgium)
The Country Specific Recommendations for Belgium of June 2016 highlight the continued
importance of human capital policy to boost the capacity to innovate Note that this
challenge is closely intertwined with the first one since the presence of fast-growing
firms in innovative sectors crucially depends on highly qualified human capital in the
domains of IT biotech material science etc
Policy response
Several policy measures have been adopted at all levels to tackle the issue of human
resources for innovation The federal governments influence over this policy domain
is only indirect but nonetheless important Through fiscal measures it exerts a
substantial influence on the demand for highly skilled workers in particular through the
policy of a reduced wage withholding tax for researchers which will be continued in the
coming years (Federal Government Agreement October 2014)
The Marshall Plan 40 in Wallonia (in particular its Axis 1) aims to better align the
supply of graduates in Wallonia to business needs (Commission Staff Working
Document Country Report Belgium 2016) amongst others through the set-up of an
inventory of professions of the future In order to attract external talent the region
has also introduced the Beware Fellowships which are funding schemes to attract
researchers10 in Wallonia Wallonia-Brussels Federation The Beware Fellowships
(BElgium WAllonia REsearch) programs are co-financed by the COFUND program of the
European Union (FP7 - Marie Curie Actions)
In Flanders joint efforts involving the policy domains of science and innovation on the
one hand and education and training on the other have been launched to increase the
number of secondary students in science technology engineering and mathematics
(STEM subjects) and encourage them to opt for a career in exact sciences or technology
(Commission Staff Working Document Country Report Belgium 2016)
The STEM Action Plan 2012-2020 is at its halfway point and has among others
resulted in the STEM Monitor an indicator dashboard that systematically tracks inflow
into and successful completion of STEM studies at various levels of education11 From
2016 onwards the emphasis will be on target group policy (girls technical and vocational
secondary education and young people with a disadvantaged socio-economic
background) as well as on the relevance of STEM to society
The STEM Charter is rolled out on a large scale and already brings together more than
50 companies and organisations which have indicated that they lend their full support to
the STEM initiative
The Brussels-Capital region funds PhD studies involved in public-private collaborative
projects through the DOCTIRIS programme The Region also actively promotes STEM
subjects at secondary schools particularly among young people from disadvantaged
backgrounds
Policy attention in all regions has also increasingly turned towards attracting foreign
researchers or researchers from the own Community that are active abroad in Flanders
(Odysseus Pegasus 2) Wallonia-Brussels Federation (Ulysse) and the Brussels Capital
Region (Attract) (Commission Staff Working Document Country Report Belgium 2016)
10 From all nationalities including Belgian under the condition to have spent less than 12 months over the last three years in Belgium 11 httponderwijsvlaanderenbesitesdefaultfilesatomsfilesSTEM_monitor_indicatoren_20160630_0pdf (last consulted 082016)
18
Another noteworthy initiative in this regard is the plan of several universities to increase
the number of Master programs offered entirely in English
In the context of internationalisation Flanders has prepared its own ERA roadmap
regarding the completion of the European Research Area This road map was submitted
to the EC in 2016 just like the Belgian ERA road map Within the framework of research
infrastructure a Flemish ESFRI (European Strategy Forum on Research Infrastructures)
road map was further prepared in 2016
Policy Assessment
The European Semester report 2016 highlights various framework conditions that are of
relevance for Belgium eg accessibility and efficiency of direct support a well-
considered policy mix etc The report also emphasizes the importance of the availability
of a workforce with adequate skills as part of creating an investor-friendly environment
(European Semester 2016 thematic fiche on RampI p9) While recent policy initiatives
address several framework conditions including education it is important that the
attention for human capital in RampI policy is sustained in the coming years Addressing
the HR challenge is complex as it involves a very diverse set of issues such as reducing
early school leaving increasing the supply of STEM-educated people through the own
education system and attracting foreign talent balancing the supply-demand skill
mismatch over a broad set of domains etc Moreover a particular challenge of human
capital policy is that it typically takes a long time for effects of interventions in the
education system to materialize Various policy initiatives have been taken over the
years and progress is being observed towards addressing skill mismatches and early
school leaving (EC 2015) Particularly commendable are the efforts to increase inward
mobility of human capital and the introduction of more flexible higher education
trajectories to mitigate the strict separation of education and work
The measures that have been taken in the last year denote a clear awareness of the
human resource challenge at all government levels New initiatives should be informed
by supranational coordination efforts and international best practices Supranational
coordination efforts and international best practices may provide useful benchmarks ndash as
should become clear from policy evaluations - for developing new initiatives
Finally with respect to strengthening STEM education further structural steps could be
made This includes the orientation of STEM curricula towards societal challenges and
the creation of more structural collaboration between STEM teachers and scientists such
as through training opportunities for science teachers12
6 Focus on creating and stimulating markets
This section aims at describing and assessing national level efforts to introduce demand-
side innovation policies to stimulate the uptake of innovation or act on their diffusion
including public procurement and regulations supporting innovation It also analyses
policy measures aimed at internationalisation of companies with the aim of increasing
the innovativeness of the economy
Although the Belgian authorities (collectively) have sought to use investment in space
research (through the European Space Agency) as a form of pre-commercial public
procurement the use of public procurement to stimulate research and innovation is not
yet widespread Innovation-driven public procurement initiatives in Belgium have been
mostly implemented in Flanders and managed by the Agency for Innovation by Science
and Technology (IWT) but also Brussels and Wallonia have adopted public
12 httpwwwewi-vlaanderenbesitesdefaultfilesrri_sep2016_aertspdf (last consulted 082016)
19
procurement initiatives The new federal legal framework regarding public procurement
will allow these initiatives to be expanded
The IWT (as of 2016 AIO Flanders Innovation and Entrepreneurship) developed a
methodology which made a distinction between the procurement of existing innovations
which were new to the procuring government service and purchases of solutions which
required further research and development work According to the Rekenhof (Court of
Auditors) which carried out an evaluation of the programme in 2015 (Rekenhof 2015)
these results are insufficient as it considered that the programme often did not select
the most appropriate projects with the greatest need for innovation fitting within the
overarching innovation policy
The Flemish Government developed the Government Procurement Plan of Flandersrsquo
government (Plan overheidsopdrachten) in follow-up of the original plan and informed
by the Rekenhof evaluation which was approved in January 2016 and aims among other
to implement an innovation-oriented procurement policy within the Flemish
Government13 As a part of this overall plan a new Flemish action plan for innovation
procurement specifically was adopted in October 2016 The new action plan sets a target
to dedicate at least 3 of Flemish public procurement expenditure to innovation
procurement In a first phase the action plan aims to actively engage primarily public
procurers in the priority domains highlighted in the Flanders Vision Nota 2050 (Energy
Healthcare Industry 40 Circular economy Housinghellip) and in a second phase the
action plan will be expanded across all areas of public interest
a project titled Innovation for a future-oriented transversal policy (2016-2019) is being
launched with developing transversal innovation instruments as its main objective in
particular innovative procurement The initiative of the Flemish Government in response
to the evaluation carried out by Rekenhof is yet too early to assess as it has been
adopted very recently
As far as the internationalization of companies in Belgium is concerned several policy
measures are in place at all regions and also at federal level
They fall into various categories mainly policies concerning the various forms of public-
private partnerships14 (eg the innovation platforms (now innovative business networks
and from 2017 also the spearhead clusters)) in Flanders the competitiveness poles in
Wallonia the strategic platforms in Brussels) or the joint economic missions of the
Belgian Foreign Trade Agency and the wide range of support offered by the regional
agencies15 Work in progress More information in the next version of the report
The high number of policies concerning firm internationalisation shows that Belgium
attaches great importance to the openness of its economy In terms of the costs for
exporting and importing Belgium performs in line with the EU average (SBA Factsheet
2015)
13 httpsoverheidvlaanderenbesitesdefaultfilesdocumentenoverheidsopdrachten20160129_plan20overheidsopdrachtenpdf (last consulted 082016) 14 These structures provide connection points for foreign companies to tap into the strong science and research
base in Belgium in order to strengthen their innovation activities See for example the ongoing projects of the FISCH the Innovation Platform competence pool for sustainable chemistry now part of a spearhead cluster httpwwwfi-schbeenoverview-projects (last consulted 082016) 15 For example the agency Flanders Investment amp Trade (FIT) has 90 offices worldwide to answer questions of exporting Flemish companies on their target markets In Wallonia the Agence Wallonne agrave lExportation et aux Investissements eacutetrangers (AWEX) plays the same role offering support with respect to a wide range of issues (legal logistical financialhellip)
20
References
Belspo (2010) Careers of Doctorate Holders Survey
httpswwwbelspobebelspoScienceConnection012CareersDoctorateHolderspdf
ECOOM (2013) Community Innovation Survey
httpswwwecoombesitesecoombefilesdownloadsCIS2013_Rapport_Finaal_update
_tabel_8docxpdf
European Commission (2016) RIO Country Report Belgium 2015 JRC Science and
Policy Report Joint Research Centre Directorate B Growth amp Innovation Report
prepared by Stijn Kelchtermans and Thomas Zacharewicz
httpsriojrceceuropaeuencountry-analysisBelgiumcountry-report
European Council (2014) Communication from the Commission to the European
Parliament the Council the European Economic and Social Committee and the
Committee of the Regions httpseceuropaeuresearchinnovation-unionpdfstate-of-
the-union2013research-and-innovation-as-sources-of-renewed-growth-com-2014-339-
finalpdf
European Council (2016) Country Specific Recommendation Belgium 2016
httpdataconsiliumeuropaeudocdocumentST-9190-2016-INITenpdf
European Commission (2016) Country Report 2016 Belgium DG RTD
httpsriojrceceuropaeuenlibraryresearch-innovation-2016-european-semester-
country-reports
European Commission (2016) Commission Staff Working Document Country Report
Belgium 2016 httpeceuropaeueurope2020pdfcsr2016cr2016_belgium_enpdf
European Commission (2016) European Semester Thematic Fiche Research and
Innovation
httpeceuropaeueurope2020pdfthemes2016research_innovation_201605pdf
Government of Flanders Flemish Reform Programme 2016
httpswwwvlaanderenbenlpublicatiesdetailflemish-reform-programme-2016-1
Government of Flanders STI in Flanders Science Technology amp Innovation Policy amp
Key Figures ndash 2015 httpwwwvlaanderenbenlpublicatiesdetailsti-in-flanders-
science-technology-and-innovation-policy-and-key-figures-2015-1
European Commission (2016) National Reform Programme Belgium 2016
httpeceuropaeueurope2020pdfcsr2016nrp2016_belgium_enpdf
European Commission (2016) European Semester Thematic Fiche Research and
Innovation httpsriojrceceuropaeuenlibraryeuropean-semester-thematic-fiche-
research-and-innovation
Conseil Eacuteconomique et Social de Bruxelles Strateacutegie 2025 pour Bruxelles
httpwwwcesirisnetbefrpublicationsautres-publications-1autres-publications-du-
conseil16-juin-2015-1
Government of Wallonia Marshall Plan 40
httpwwwwalloniebesiteswalloniefilespagesfichierssynthese_plan_marshall_40p
df
21
European Commission (2016) DG Employment and Social Affairs Youth Guarantee
Country by Country Belgium 2016
httpeceuropaeusocialmainjspcatId=1161ampintPageId=3324amplangId=en
OECD (2016) OCED Science Technology and Innovation Outlook 2016 STI Belgium
httpwwwoecdorgstiBelgiumpdf
SBA Factsheet 2015 Belgium
httpeceuropaeuDocsRoomdocuments16344attachments3translationsenrenditi
onsnative
22
Abbreviations
AEI Agency for Enterprise and Innovation (Wallonia)
AIO Agentschap Innoveren en Ondernemen (Flanders)
BERD Business Expenditures for Research and Development
BELSPO Programmatory Public Service for Science Policy
CEN Nuclear Energy Centre
CIS International Co-operation Commission
EC European Commission
ESA European Space Agency
EU European Union
EU-28 European Union including 28 Member States
EWI Department of Economy Science amp Innovation of the Flemish Government
DG06 Operational Directorate of Economy Employment and Research (Wallonia)
FP7 7th Framework Programme
FWO Research Foundation Flanders Fund for Scientific Research (Flemish
Community)
GDP Gross Domestic Product
GERD Gross Domestic Expenditure on RampD
H2020 Horizon 2020
HEI Higher Education Institution
ICT Information amp Communication Technologies
IP Intellectual Property
INNOVIRIS Brussels Institute for Research and Innovation
IWT Agency for Innovation by Science and Technology (Flanders)
PPS Programmatory Public Service
PREC Regional Circular Economy Programme
RampD Research and Development
RampDampI Research Development and Innovation
23
RampI Research and innovation
S3 Smart Specialisation Strategy
SCK National Institute for Radio-elements
SME Small and Medium-sized Enterprise
SRIB
GIMB
Brussels Regional Investment Company
24
Factsheet
2009 2010 2011 2012 2013 2014 2015 2016
GDP per capita (euro per capita) 3230
0 3350
0 3450
0 3510
0 3540
0 3590
0 3650
0
Value added of services as share of the total value added ( of total) 7639 7597 7627 7667 7698 773 7707
Value added of manufacturing as share of the total value added () 1428 1472 1425 1408 14 1399 1427
Employment in manufacturing as share of total employment () 126 1211 1197 1175 1152 1118 1091
Employment in services as share of total employment () 787 7927 7943 7967 7998 8045 8086
Share of Foreign controlled enterprises in the total nb of enterprises () 028 027 026 024
Labour productivity per hour worked (Index 2010=100) 979 100 995 992 996 101 1019
New doctorate graduates (ISCED 6) per 1000 population aged 25-34 104 118 077 127 131 136
Summary Innovation Index (rank) 11 10 9 10 11 9 8
Innovative enterprises as a share of total number of enterprises (CIS data 2012) () 556 642
Innovation output indicator (Rank Intra-EU Comparison) 10 10 11 12
Turnover from innovation as of total turnover (Eurostat) 124 112
Country position in Doing Business (Ease of doing business index WB)(1=most business-friendly regulations) 41 43 42
Ease of getting credit (WB GII) (Rank) 80 81
Venture capital investment as of GDP (seed start-up and later stage) 0053 0025 003 0033 0026 0032 0015
EC Digital Economy amp Society Index (DESI) (Rank) 5 5 5
E-Government Development Index Rank 16 25 19
Online availability of public services ndash Percentage of individuals having interactions with public authorities via Internet (last 12 months) 41 45 47 50 50 55 52 55
GERD (as of GDP) 199 205 216 236 244 246 245
GBAORD (as of GDP) 066 065 063 064 064 068 063
RampD funded by GOV ( of GDP) 05 052 05 068 069
BERD ( of GDP) 131 138 148 168 172 175 177
Research excellence composite indicator (Rank) 6
Number of scientific publications among the top 10 most cited publications worldwide as of total scientific publications of the country 1241 1248 127 1288
Public-private co-publications per million population 6398 6817 7563 6904 7248 6846
World Share of PCT applications 073 072 069 067 057 065
25
List of Figures
Figure 1 Development of government funding of the total GERD 12
Figure 2 Top sectors in manufacturing (C20 Manufacture of chemicals and chemical products C21 manufacture of basic pharmaceutical products and pharmaceutical preparations C26 Manufacture of computer electronic and optical products) Top service sectors (G=wholesale and retail trade repair of motor vehicles and motorcycles J=information and communication M=professional scientific and technical activities) 13
Europe Direct is a service to help you find answers
to your questions about the European Union
Freephone number ()
00 800 6 7 8 9 10 11 () The information given is free as are most calls (though some operators phone boxes or hotels may
charge you)
More information on the European Union is available on the internet (httpeuropaeu)
HOW TO OBTAIN EU PUBLICATIONS
Free publications
bull one copy
via EU Bookshop (httpbookshopeuropaeu)
bull more than one copy or postersmaps
from the European Unionrsquos representations (httpeceuropaeurepresent_enhtm)from the delegations in non-EU countries (httpeeaseuropaeudelegationsindex_enhtm)by contacting the Europe Direct service (httpeuropaeueuropedirectindex_enhtm) orcalling 00 800 6 7 8 9 10 11 (freephone number from anywhere in the EU) ()
() The information given is free as are most calls (though some operators phone boxes or hotels may charge you)
Priced publications
bull via EU Bookshop (httpbookshopeuropaeu)
KJ-N
A-2
8498-E
N-N
doi102760273083
ISBN 978-92-79-66212-6
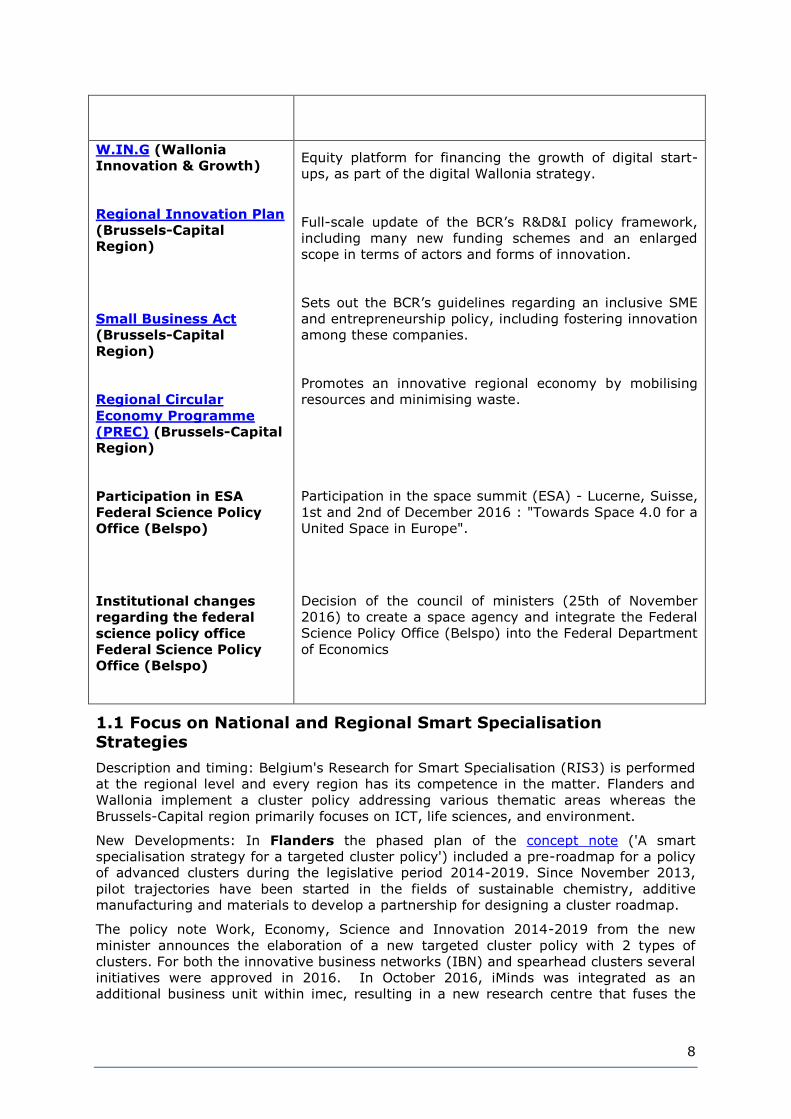
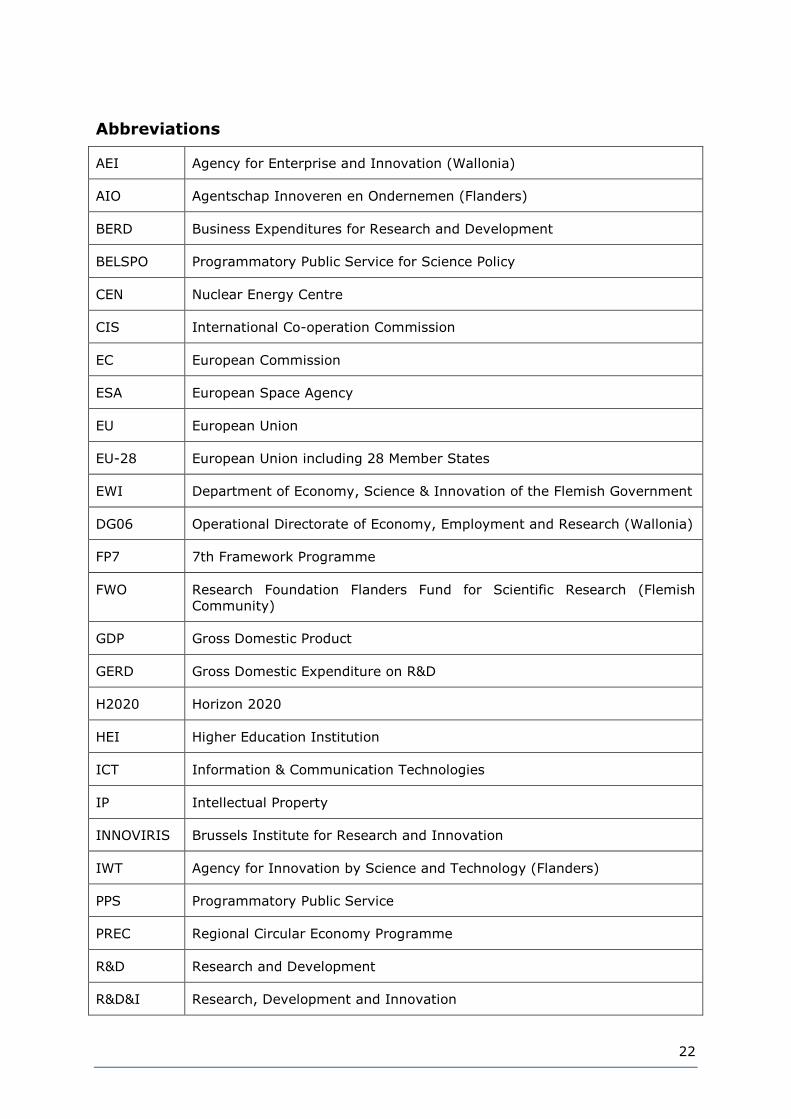

KJ-N
A-2
8498-E
N-N
doi102760273083
ISBN 978-92-79-66212-6