Embed Size (px)
Citation preview

REPORT NO. 2587
RIPARIAN AND TUNA HABITAT QUALITY IN THE TRIBUTARIES OF WAITUNA LAGOON, SOUTHLAND

CAWTHRON INSTITUTE | REPORT NO. 2587 MAY 2015
RIPARIAN AND TUNA HABITAT QUALITY IN THE TRIBUTARIES OF WAITUNA LAGOON, SOUTHLAND
ROBIN HOLMES, ERIC GOODWIN, CRAIG ALLEN
Prepared for Department of Conservation/ Fonterra partnership: Living Water programme
CAWTHRON INSTITUTE 98 Halifax Street East, Nelson 7010 | Private Bag 2, Nelson 7042 | New Zealand Ph. +64 3 548 2319 | Fax. +64 3 546 9464 www.cawthron.org.nz
REVIEWED BY: Karen Shearer
APPROVED FOR RELEASE BY: Roger Young
ISSUE DATE: 28 May 2015
RECOMMENDED CITATION: Holmes R, Goodwin E, Allen C 2015. Riparian and tuna habitat quality in the tributaries of Waituna Lagoon, Southland. Prepared for Department of Conservation/ Fonterra partnership: Living Water programme. Cawthron Report No. 2587. 44 p. plus appendices. © COPYRIGHT: Apart from any fair dealing for the purpose of study, research, criticism, or review, as permitted under the Copyright Act, this publication must not be reproduced in whole or in part without the written permission of the Copyright Holder, who, unless other authorship is cited in the text or acknowledgements, is the commissioner of the report.


CAWTHRON INSTITUTE | REPORT NO. 2587 MAY 2015
i
EXECUTIVE SUMMARY
As part of the Living Water programme, a partnership between Department of Conservation (DOC) and Fonterra to improve sensitive water catchments, we applied a broad-scale stream habitat-mapping protocol (BSHMP) to the tributaries of Waituna Lagoon. Riparian and in-stream habitat information was interpreted using a riparian habitat quality index (RHQI) and a longfin eel (tuna) habitat quality index (tunaHQI). Habitat quality index results are displayed as geo-referenced traffic-light scores on catchment maps. We used the survey results to:
inventory stream segments with high and low tuna habitat quality values.
identify opportunities to rehabilitate stream habitat within the catchment.
assess the impact of ongoing bank reconstruction (re-battering) works.
1. Overall, riparian habitat in most of the catchment can be considered to be in average–
good condition. However, isolated segments of riparian habitat of the mid–lower Waituna Creek were in poor condition. The poor condition of some reaches and segments was due primarily to excessive bank slumping.
2. In general, in-stream habitat condition for tuna in the catchment can be considered
poor–average. Isolated areas of high quality tuna habitat exist in the upper Waituna Creek tributaries and in the lower end of Carran Creek. Poor habitat in the Waituna mainstem was characterised by excessive fine sediments on and within the stream bed, uniform shallow (0–0.5 m deep) run habitat and little stream edge cover. High quality habitat was characterised by deep, sinuous run and pool habitat with extensive emergent grasses and overhanging vegetation.
3. We show that the banks in reaches where stock have access to the stream edge are
significantly less stable than reaches that have full stock-exclusion fencing. Thirty-eight percent of the recorded active bank slumping occurred in reaches where stock could access the stream edge; yet these reaches comprised just 18% of the total surveyed area. Bank slumping in Waituna Creek is recognised as a significant source of the catchment’s sediment load. Completing the network of stock-exclusion fencing represents an opportunity to substantially reduce this.
Recent re-battering works had a significant negative effect on in-stream habitat quality, as defined by the tunaHQI. However, a reduction in habitat quality will not necessarily translate to an effect on the tuna population because we do not know if the population is limited by habitat quality or quantity in this catchment.

CAWTHRON INSTITUTE | REPORT NO. 2587 MAY 2015
iii
TABLE OF CONTENTS
1. INTRODUCTION .............................................................................................................. 1 1.1. Purpose of this report ..................................................................................................................................... 1
1.2. New Zealand eels/tuna—a brief overview ...................................................................................................... 2
1.3. Waituna Lagoon catchment—a brief overview ............................................................................................... 4
2. METHODS ........................................................................................................................ 6 2.1. Broad-scale stream habitat mapping survey .................................................................................................. 6
2.2. Riparian survey component ............................................................................................................................ 7
2.3. In-stream survey component .......................................................................................................................... 8
2.4. Riparian habitat quality index.......................................................................................................................... 8
2.5. Tuna habitat quality index ............................................................................................................................... 9 2.5.1. Tuna habitat quality index conceptual models ........................................................................................... 9 2.5.2. Tuna habitat quality index calculation steps ............................................................................................ 14 2.5.3. Example application of the longfin tuna habitat quality index to a hypothetical 20 m stream reach ........ 15
2.6. Riparian and in-stream habitat comparisons ................................................................................................ 16
2.7. In-stream intra-observer variation and index validation ................................................................................ 16
3. RESULTS AND DISCUSSION ....................................................................................... 18 3.1. Riparian habitat ............................................................................................................................................ 18 3.1.1. Riparian habitat quality index .................................................................................................................. 18 3.1.2. Bank slumping and riparian management ............................................................................................... 24
3.2. In-stream habitat ........................................................................................................................................... 26 3.2.1. Longfin tuna habitat quality index ............................................................................................................ 27
3.3. Riparian and in-stream habitat quality comparison ....................................................................................... 31
3.4. Intra-observer variation and expert assessment validation ........................................................................... 32 3.4.1. Intra-observer variation ........................................................................................................................... 32 3.4.2. Tuna habitat quality index and expert assessment comparison .............................................................. 33
4. CONCLUSIONS AND RECOMMENDATIONS ............................................................... 35 4.1. Concurrent work ........................................................................................................................................... 36
4.2. Future work................................................................................................................................................... 36
5. ACKNOWLEDGEMENTS ............................................................................................... 38
6. REFERENCES ............................................................................................................... 39
7. APPENDICES ................................................................................................................. 45

MAY 2015 REPORT NO. 2587 | CAWTHRON INSTITUTE
iv
LIST OF FIGURES
Figure 1. One kilometre riparian survey segments within the Waituna lagoon tributaries: Waituna Creek, Moffat Creek and Carran Creek. ............................................................... 7
Figure 2. Conceptual models showing habitat quality for: a) longfin, and b) shortfin eels against the percentage area that is riffle compared to deeper, slower meso-habitat types—pools, slow runs and fast runs. ......................................................................................... 11
Figure 3. Conceptual model showing habitat quality for longfin and shortfin tuna against substrate particle size categories based on a modified Wentworth substrate classification system. ........................................................................................................ 12
Figure 4. Conceptual models showing habitat quality for: a) longfin and b) shortfin eels against broad-scale stream habitat-mapping protocol water depth categories: 0–0.3 m, 0.3–0.5 m, and 0.5–1 m+. ........................................................................................................ 13
Figure 5. Conceptual model showing habitat quality for longfin and shortfin tuna against structural fish cover features. ............................................................................................ 14
Figure 6. A hypothetical 20 m stream reach that would receive high tunaHQI score. ..................... 16 Figure 7. a) Reach within Site 3C with a high riparian habitat quality index score. b) Recently re-
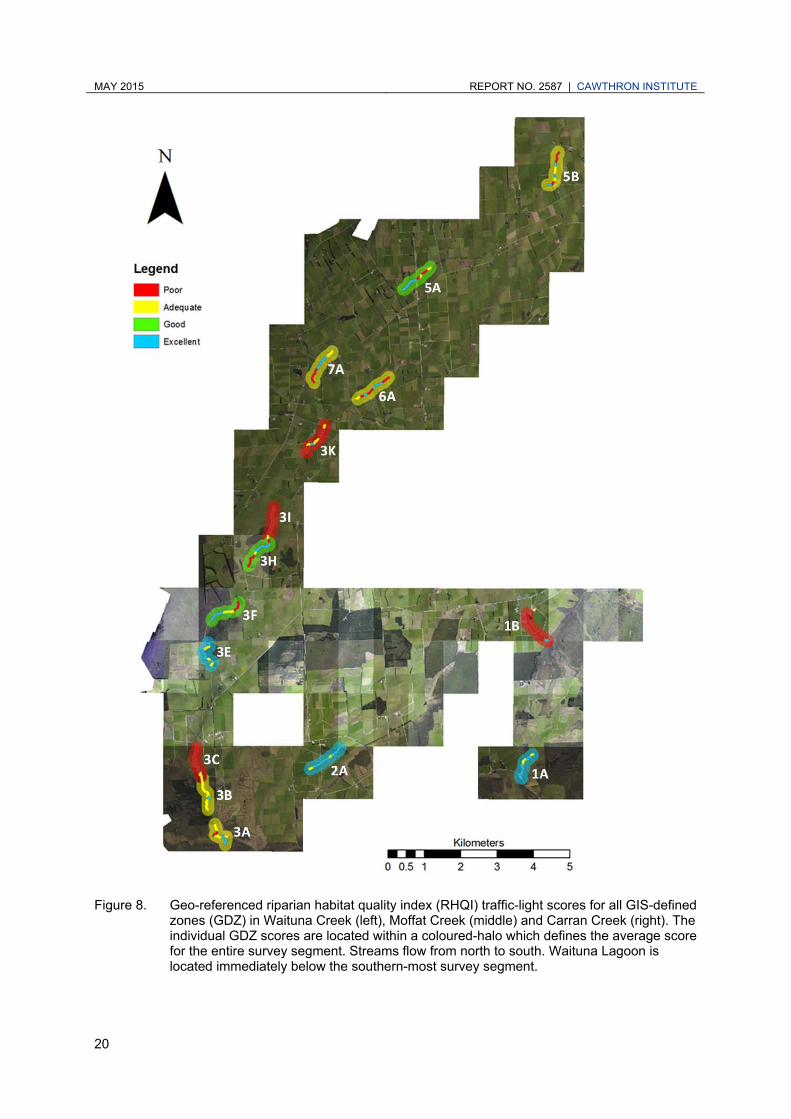
battered reach within Site 3A with a low RHQI score. ...................................................... 19 Figure 8. Geo-referenced riparian habitat quality index traffic-light scores for all GIS-defined
zones in Waituna Creek, Moffat Creek and Carran Creek. .............................................. 20 Figure 9. Geo-referenced riparian habitat quality index scores for the 10 GIS-defined zones
within the Site 3E survey segment. ................................................................................... 21 Figure 10. Geo-referenced riparian habitat quality index scores for the 10 GIS-defined zones
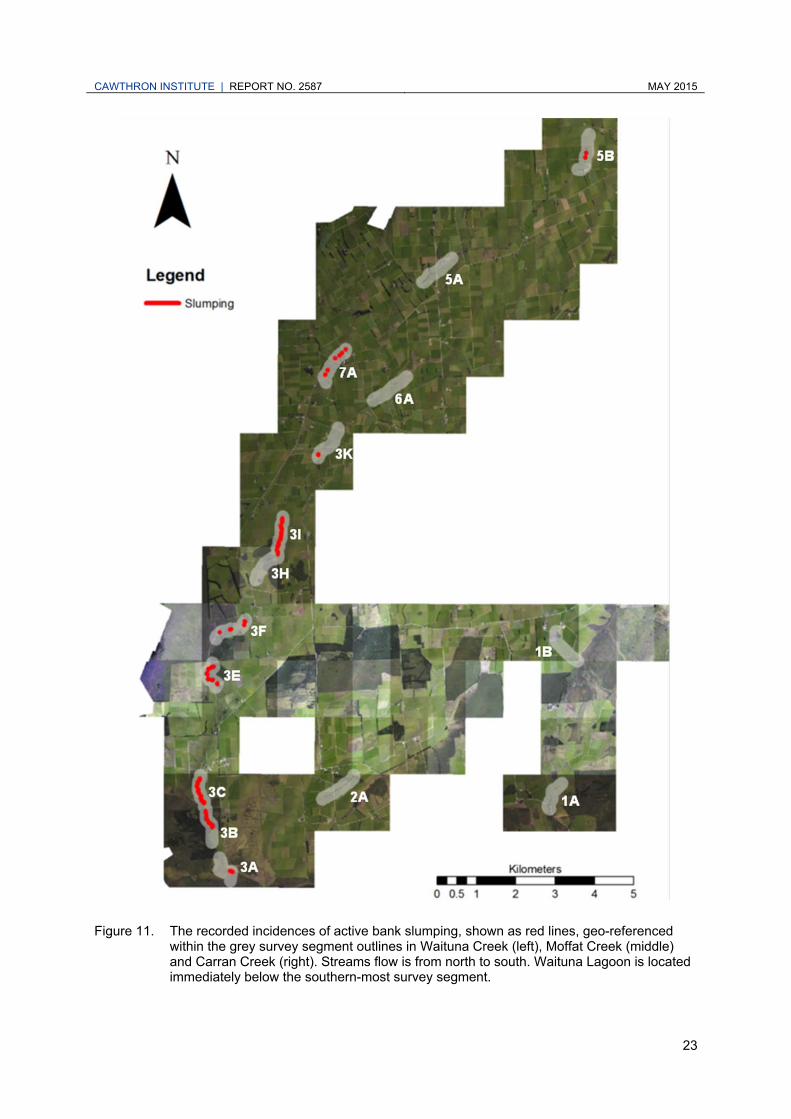
within the Site 3C survey segment in the lower Waituna Creek. ...................................... 22 Figure 11. The recorded incidences of active bank slumping, shown as red lines, geo-referenced
within the grey survey segment outlines in Waituna Creek, Moffat Creek and Carran Creek. ................................................................................................................................ 23
Figure 12. Site 3I looking downstream from the top end of the survey segment. .............................. 24 Figure 13. a) Box and whisker plot comparison between the average recorded length of active
bank slumping per GIS-defined zones located within the dairy and sheep/beef land-use types. b) Box and whisker plot comparison between the average recorded lengths (m) of active bank slumping in GDZ where stock could access the stream edge and GDZ that had full stock-exclusion fencing in all land-use types in the catchment. ........... 25
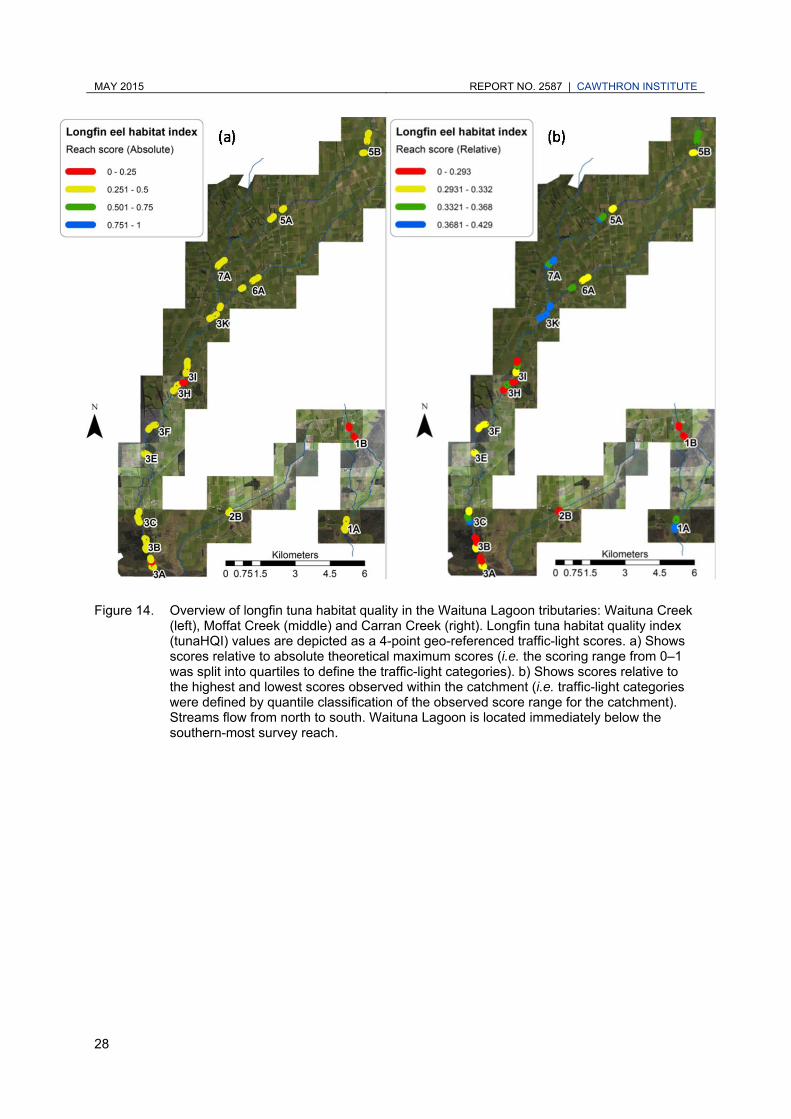
Figure 14. Overview of longfin tuna habitat quality in the Waituna Lagoon tributaries: Waituna Creek, Moffat Creek and Carran Creek. ........................................................................... 28
Figure 15. Close-up of the geo-referenced traffic-light longfin tuna habitat quality index scores for the five individual 20 m sub-reaches that make the three 100 m survey reaches in Site 1A. ..................................................................................................................................... 29
Figure 16. Close-up of the geo-referenced traffic-light longfin tuna habitat quality index scores for the five individual 20 m sub-reaches that make the three 100 m survey reaches in survey Sites 3F and 3E. .................................................................................................... 30
Figure 17. Example of the bank reconstruction works in progress in Waituna Creek. ...................... 31 Figure 18. Relationship between the average riparian habitat quality index segment scores and
the averaged longfin tuna habitat quality index segments scores in the Carran and upper Waituna Creek survey segments. t ......................................................................... 32
Figure 19. Average longfin tuna habitat quality index scores calculated from in-stream survey data collected by six different survey teams from the same two continuous 20 m sub-reaches. ............................................................................................................................ 33
Figure 20. Relationship between the longfin tuna habitat quality index scores and a qualitative expert assessment of longfin tuna habitat in the same nine 100 m survey reaches. ....... 34

CAWTHRON INSTITUTE | REPORT NO. 2587 MAY 2015
v
LIST OF TABLES
Table 1. Broad-scale stream habitat-mapping protocol habitat feature measurement categories alongside their corresponding functional value for tuna in streams. ................................... 9
Table 2. Shuffle test score coefficients for the substrate particle size weighing factors. ................ 13 Table 3. Descriptive statistics of the occurrence of different land-use types, active bank
slumping and effective stock-exclusion fencing within all GIS-defined zones in the catchment. ......................................................................................................................... 25
Table 4. Percentage cover of meso-habitat types for the Waituna Lagoon tributaries expressed as an average percentage of the wetted width of all 20 m sub-reaches. ......................... 26
Table 5. Depth category percentages for Waituna Lagoon tributaries expressed as an average percentage of the wetted width of all 20 m sub-reaches. ................................................. 26
Table 6. Percentage stream-bed cover of the various substrate categories and aquatic macrophyte beds in Waituna Lagoon tributaries expressed as an average percentage of the wetted width of all 20 m sub-reaches. .................................................................... 26
Table 7. Percentage cover of the in-stream fish cover types for all survey sub-reaches combined. .......................................................................................................................... 26
LIST OF APPENDICES
Appendix 1. Riparian survey field instructions including quick step list and an example of a completed section of the riparian survey. ......................................................................... 45
Appendix 2. An in-stream survey sheet used to complete a 20 m sub-reach survey. .......................... 47 Appendix 3. In-stream survey field instruction sheet. ........................................................................... 48


CAWTHRON INSTITUTE | REPORT NO. 2587 MAY 2015
1
1. INTRODUCTION
1.1. Purpose of this report
This report describes the application of a broad-scale stream habitat-mapping protocol (BSHMP) to the tributaries of Waituna Lagoon (Southland). The BSHMP is designed to support stream habitat rehabilitation—habitat inventory being the first step in understanding the need and scope for rehabilitation to benefit fish populations. With the tools presented in this report we aim to enable resource managers and landowners to:
inventory the quality of riparian and eel (tuna) habitat within a catchment
identify targeted (and cost-effective) stream rehabilitation opportunities
monitor structural stream habitat change at the catchment-scale.
In this report we also detail the development of longfin and shortfin tuna habitat quality indices (tunaHQI). We use the longfin tunaHQI to interpret the BSHMP in-stream survey data from the Waituna Lagoon tributaries. Riparian habitat data from the survey were interpreted using the previously developed GIS-based riparian habitat quality index (RHQI) (Holmes et al. 2013). Habitat quality index results are displayed as geo-referenced traffic-light scores on catchment maps to provide a catchment-scale snapshot of habitat condition in the tributaries of Waituna Lagoon. We have chosen tuna habitat as the focus of the study for two reasons.
1. To develop a catchment-scale tool to help Department of Conservation (DOC) and other resource managers in the conservation and sustainable management of tuna populations in lowland wadeable streams throughout New Zealand.
2. To align with nation-wide aspirations of maintaining a productive customary/recreational and commercial fisheries.
Our wider goal is to create a community-driven catchment-scale stream habitat management and rehabilitation planning model that is transferable to other catchments. To this end, 20 representatives from the following nine catchment community groups were included in the habitat survey: Department of Conservation (DOC), DairyNZ, Environment Southland (ES), farmers in the Waituna catchment, iwi representatives—Te Ao Marama Incorporated, South Island Eel Industry Association (SIEIA), Waituna Land Care Group, Fish & Game New Zealand (Fish & Game NZ) and Fonterra. It is hoped that involving community members in the provision of scientific data will increase awareness of issues facing a catchment and better facilitate collaborative management.

MAY 2015 REPORT NO. 2587 | CAWTHRON INSTITUTE
2
1.2. New Zealand eels/tuna—a brief overview
The iconic New Zealand freshwater tuna fishery is predominantly comprised of two species—the Australasian shortfin eel (Anguilla australis) and the endemic longfin eel (Anguilla dieffenbachii). Tuna are a taonga (treasured species) and are vital to the sustainability of Māori customary and commercial fisheries (e.g. McDowall 2011, Jellyman 2003, Jellyman 2012). The commercial tuna fishery is managed under the quota management system (QMS) and is worth approximately NZ$6M in export revenue per annum (Jellyman 2012). Tuna (i.e. both longfin and shortfin eels) start their life cycle in spawning grounds deep in the tropical Pacific Ocean. The leaf-shaped larvae passively migrate 5,000 kilometres along surface currents to New Zealand. When they reach the coast, they morph into glass eels and as elvers (juveniles) spend several years penetrating New Zealand’s estuaries, wetlands, rivers and lakes. They can take decades to reach sexual maturity before migrating back to the tropics (along the deep ocean currents) to spawn and die (McDowall 1990, Jellyman & Tsukamoto 2005). Tuna are habitat ‘generalists’. Providing there are no barriers to their upstream passage from the sea, they are the common denominator in freshwater fish assemblages throughout New Zealand (Jowett & Richardson 1995). Shortfins are generally more abundant in low elevation waterways, wetlands and lakes. Longfins can penetrate further inland and take up residency in high-country lakes and headwaters, although they are also abundant in lowland waterways (Jellyman 2003). The structural habitat requirements of tuna, in regards to feeding and daytime hiding habitat, are discussed in detail in Section 2.5.1—where a set of structural habitat quality weighting factors are presented for meso-habitat ratios, stream depths, substrate composition and in-stream fish cover. Broadly, during daylight, stream dwelling tuna are found in association with in-stream cover (such as water > 1 m deep, undercut banks or vegetative debris). At night, they undertake reach to segment-scale movements to preferentially feed in shallow riffles, which are the most productive areas of a stream (McDowall 1990). Tuna are the largest fish in New Zealand freshwaters and often constitute the majority of the fish biomass in rivers and lakes (Hicks & McCaughan 1997). They are apex predators and play a key role in shaping the dynamics of freshwater ecosystems (Jellyman 2003). They consume a wide variety of different prey including aquatic and terrestrial invertebrates, fish and occasionally carrion and small birds (Burnett 1951, McDowall 1990, Sagar & Glover 1998, Jellyman 2010). Globally, anguillid eel stocks are declining (Dekker et al. 2003, Walker 2014) and, although New Zealand data sets are not as long as those in other countries, there is a mounting body of evidence that suggests that longfin populations in New Zealand are

CAWTHRON INSTITUTE | REPORT NO. 2587 MAY 2015
3
no exception (Goodman et al. 2013, Jellyman 2007, PCE 2014). During their complex and relatively long freshwater life history phase, tuna are exposed to a wide variety of pressures (e.g. Beentjes et al. 2005, Graynoth 1979, Broad et al. 2002, Jellyman et al. 2000, Graynoth & Niven 2004, Jellyman 2007, Jellyman 2009, Jellyman 2012). These pressures fall into three broad categories:
1. Habitat degradation: e.g. wetland drainage and stream channelisation
2. Passage barriers: e.g. culverts, weirs and dams
3. Exploitation: e.g. historic removal campaigns and fishing.
Concerns over the sustainability of longfin populations have led to appeals for more conservative management of the fishery through the establishment of ‘no-take’ areas (Hoyle & Jellyman 2002, Graynoth et al. 2008) and a moratorium on commercial take (PCE 2014). Meanwhile, significant conservation initiatives are underway. For example, Waikato Tainui, in co-management with the Crown, has recently implemented a range of protective measures for downstream migrant tuna in the lower Waikato River (Manukau 2014). Furthermore, efforts to improve passage past barriers such as hydro-electric dams are ongoing (e.g. Boubée et al. 2001; Boubée et al. 2003; Watene & Boubée 2005). Alongside these conservation measures, improving the quality of existing and accessible tuna habitat should also form a component of the conservation strategy for the fishery. Approximately 90% of wetland habitat in New Zealand has been lost as a result of anthropogenic activities (Ausseil et al. 2011). Moreover, the vast majority of wetland loss and/or modification are a consequence of the development of low elevation land for agriculture. Flood protection and drainage works substantially alter the structural habitat template of streams. This results in reduced meso-habitat diversity (i.e. reach-scale hydraulic habitat features: runs, riffles and pools) and connectivity with flood-plain ecosystem resources (Quinn et al. 1992; Tockner & Stanford 2002). Wetland drainage and stream channelisation has a substantial but unquantified detrimental impact on tuna populations. This is particularly the case for shortfins, which prefer low elevation habitats (Beentjes et al. 2005). Run-off from agricultural land and livestock activity within the stream network can increase inputs of fine sediment (Lyons et al. 2000; Trimble & Mendel 1995). Deposited fine sediment homogenises stream habitat by reducing residual pool depth (i.e. the depth of a pool when discharge is zero) and smothering the stream bed. This results in a reduction of low flow fish refugia and invertebrate (fish food) production (Duncan & Ward 1985; Wood & Armitage 1997; Allouche 2002; Sutherland et al. 2002) and can ultimately reduce the carrying capacity of a stream for predatory fish (Waters 1995, Bjornn et al. 1977).
MAY 2015 REPORT NO. 2587 | CAWTHRON INSTITUTE
4
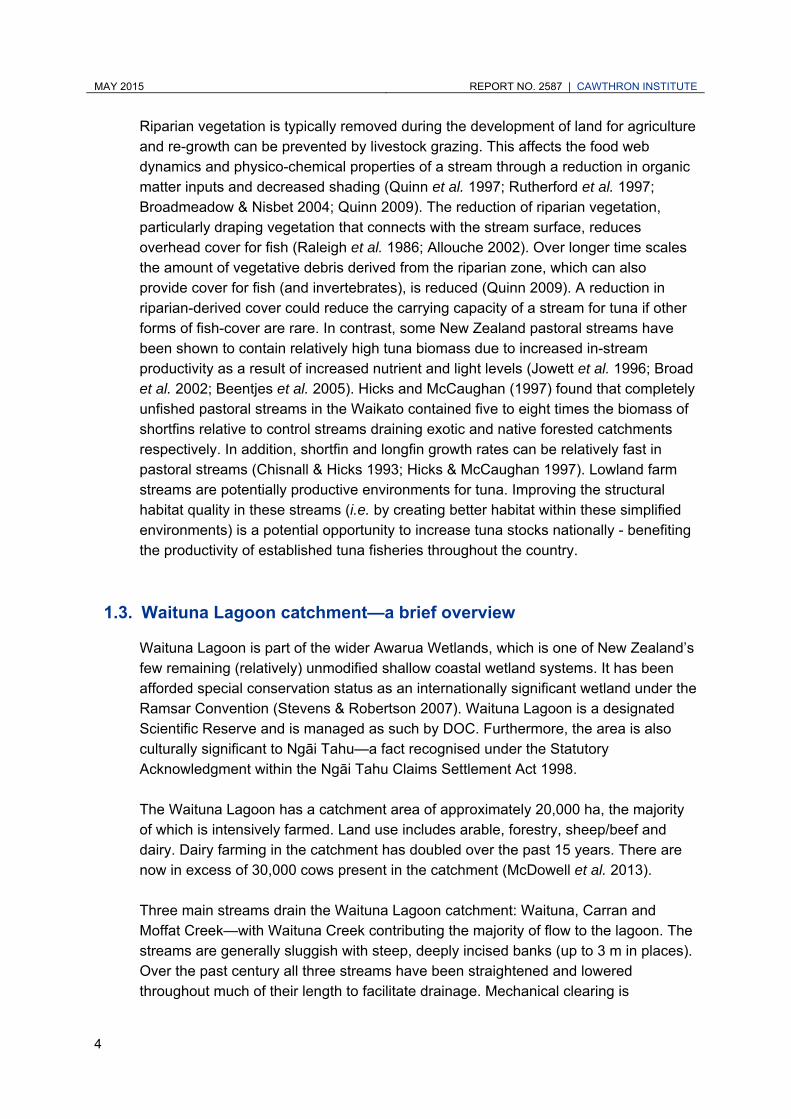
Riparian vegetation is typically removed during the development of land for agriculture and re-growth can be prevented by livestock grazing. This affects the food web dynamics and physico-chemical properties of a stream through a reduction in organic matter inputs and decreased shading (Quinn et al. 1997; Rutherford et al. 1997; Broadmeadow & Nisbet 2004; Quinn 2009). The reduction of riparian vegetation, particularly draping vegetation that connects with the stream surface, reduces overhead cover for fish (Raleigh et al. 1986; Allouche 2002). Over longer time scales the amount of vegetative debris derived from the riparian zone, which can also provide cover for fish (and invertebrates), is reduced (Quinn 2009). A reduction in riparian-derived cover could reduce the carrying capacity of a stream for tuna if other forms of fish-cover are rare. In contrast, some New Zealand pastoral streams have been shown to contain relatively high tuna biomass due to increased in-stream productivity as a result of increased nutrient and light levels (Jowett et al. 1996; Broad et al. 2002; Beentjes et al. 2005). Hicks and McCaughan (1997) found that completely unfished pastoral streams in the Waikato contained five to eight times the biomass of shortfins relative to control streams draining exotic and native forested catchments respectively. In addition, shortfin and longfin growth rates can be relatively fast in pastoral streams (Chisnall & Hicks 1993; Hicks & McCaughan 1997). Lowland farm streams are potentially productive environments for tuna. Improving the structural habitat quality in these streams (i.e. by creating better habitat within these simplified environments) is a potential opportunity to increase tuna stocks nationally - benefiting the productivity of established tuna fisheries throughout the country.
1.3. Waituna Lagoon catchment—a brief overview
Waituna Lagoon is part of the wider Awarua Wetlands, which is one of New Zealand’s few remaining (relatively) unmodified shallow coastal wetland systems. It has been afforded special conservation status as an internationally significant wetland under the Ramsar Convention (Stevens & Robertson 2007). Waituna Lagoon is a designated Scientific Reserve and is managed as such by DOC. Furthermore, the area is also culturally significant to Ngāi Tahu—a fact recognised under the Statutory Acknowledgment within the Ngāi Tahu Claims Settlement Act 1998. The Waituna Lagoon has a catchment area of approximately 20,000 ha, the majority of which is intensively farmed. Land use includes arable, forestry, sheep/beef and dairy. Dairy farming in the catchment has doubled over the past 15 years. There are now in excess of 30,000 cows present in the catchment (McDowell et al. 2013). Three main streams drain the Waituna Lagoon catchment: Waituna, Carran and Moffat Creek—with Waituna Creek contributing the majority of flow to the lagoon. The streams are generally sluggish with steep, deeply incised banks (up to 3 m in places). Over the past century all three streams have been straightened and lowered throughout much of their length to facilitate drainage. Mechanical clearing is

CAWTHRON INSTITUTE | REPORT NO. 2587 MAY 2015
5
undertaken routinely to remove macrophytes and deposited sediment to maintain the efficiency of mole and tile farm drainage systems (Riddell et al. 1988). The Waituna Lagoon tributaries contain a relatively diverse fish assemblage (12 species), with notable populations of tuna and giant kōkopu (Galaxias argenteus). Shortfins are dominant in the lagoon, whereas, longfins are dominant in the tributaries. Commercial tuna fishing is not permitted in the Waituna Lagoon because the area is a designated scientific reserve. However, commercial fishing does occur in the tributaries, primarily in the mainstem of Waituna Creek (pers. comm. Victor Thompson, SIEIA). The Waituna Creek headwaters are also a significant brown trout spawning area, which provides recruits to a recreational fishery at the lagoon outlet (Riddell et al. 1988). Concerns over maintaining the biodiversity values of Waituna Lagoon in the face of increasing land-use intensification have been highlighted in recent reports (e.g. Thompson & Ryder 2003; Stevens & Robertson 2007; Robertson et al. 2011). Various initiatives that aim to protect the health of Waituna Lagoon are currently underway. In 2011, a Lagoon Technical Group was formed as part of an ongoing collaborative process to maintain the lagoon’s current trophic status. In addition, the DOC Arawai Kākāriki Wetland Restoration Programme (initiated in 2007) and the DOC/Fonterra partnership: Living Water programme (initiated in 2013) both include Awarua/Waituna as a focus catchment for restoration. Extensive wetlands surround much of Waituna Lagoon. The main pathways for contaminants entering the lagoon are through the intensively-farmed tributaries where there are often little or no vegetative buffers. A recent sediment source-tracking study in the lagoon’s tributaries determined that the majority of the sediment budget in the catchment originates from collapsing banks in Waituna Creek (McDowell et al. 2013). Reducing sediment and sediment-bound contaminant loading in the Waituna Lagoon catchment is recognised as a key strategy to improve the state of the Waituna Lagoon (Robertson et al. 2011). To address this issue, Environment Southland (ES) is undertaking large-scale bank reconstruction works (re-battering) in Waituna Creek. Re-battering reduces the angle of the stream bank to decrease the occurrence of bank slumping and scour erosion. This ongoing work is scheduled to occur along approximately 10 kilometres of Waituna Creek over the following two years. Some of the re-battering work in the mid–lower Waituna Creek was recently completed prior to undertaking this survey. Our survey results must be considered in context with the ongoing re-battering works because of its conspicuous effect on riparian habitat and stream-edge fish cover.
MAY 2015 REPORT NO. 2587 | CAWTHRON INSTITUTE
6
2. METHODS
2.1. Broad-scale stream habitat mapping survey
The broad-scale stream habitat-mapping protocol (BHSMP) methodology (Holmes & Hayes 2011) was used to collect catchment-scale in-stream and riparian habitat data from the Waituna Lagoon tributaries: Waituna, Moffat and Carran Creek. The survey was undertaken between the 26 and 30 March 2014 during base flow conditions. All field workers received a day of training in the data collection methods before being sent (in pairs) to map riparian and in-stream habitat in 1,000 m segments of the catchment. For a background on the BSHMP methodology see proof-of-concept reports: Holmes and Hayes 2011, Holmes et al. 2012 and Holmes et al. 2013. In short, this methodology involves a desktop analysis of existing catchment knowledge (as described in Harding et al. 2009) followed by ‘ground-truthing’ riparian habitat features on aerial photographs and recording in-stream habitat information on pre-prepared survey sheets. The survey focuses solely on gathering structural stream habitat information (e.g. areas of bank slumping, riparian vegetation categories, depths and fish cover features) and should complement analyses of stream physico-chemical information from a catchment (e.g. flow, temperature and nutrient concentrations). The representative survey segments (1,000 m long) shown in Figure 1 were selected at random from catchment strata identified during the desktop analysis. Data collection is split into two stages at each survey segment:
Stage 1: Riparian features and potential contaminant sources are surveyed over the entire 1,000 m segment
Stage 2: In-stream habitat features are surveyed in three 100 m reaches nested within each 1,000 m segment, and each 100 m reach is split into five continuous 20 m sub-reaches.

CAWTHRON INSTITUTE | REPORT NO. 2587 MAY 2015
7
Figure 1. One kilometre riparian survey segments (shown as thick red bands) within the Waituna lagoon tributaries: Waituna Creek (left), Moffat Creek (middle) and Carran Creek (right). Streams flow from north to south. Waituna Lagoon is located immediately below the southern-most survey segment.
2.2. Riparian survey component
Riparian habitat was surveyed by using permanent markers to annotate various habitat features directly onto hard copy aerial photographs. Information recorded in the riparian survey included:
extent of the fenced riparian management area
degree of stock access to the stream edge
category types of riparian vegetation

MAY 2015 REPORT NO. 2587 | CAWTHRON INSTITUTE
8
locations/areas of trees
land-use management features (such as drains and stock-exclusion fences)
potential contaminant sources (e.g. lengths of active bank slumping and stock pugging).
An example of the riparian survey field instructions and a complete ground-truthed section of riparian habitat are shown in Appendix 1.
2.3. In-stream survey component
In-stream habitat features were measured and visually estimated either as a percentage of the wetted area of a 20 m survey sub-reach or as areas (m2). Information recorded in the in-stream survey included:
percentage cover of meso-habitat types (e.g. riffle, run, pool)—data obtained by a bankside visual estimate
percentage cover of depth categories (0–0.3 m, 0.3–0.5 m, 0.5–1 m and > 1 m)—data obtained by multiple depth measurements
percentage cover of sediment particle size categories (according to the Wentworth sediment classification scale) and nuisance algae (> 3 mm thick)—data obtained by a bankside visual estimate
area (m2) of fish cover features—data obtained by a combination of measurements and bankside visual estimates
The BHSMP methodology was modified during the present survey and included the addition of the ‘shuffle test’ (i.e. for assessing the degree of deposited fine sediment infilling, Clapcott et al. 2011) and residual pool depth (Harding et al. 2009) measurement protocols. These protocols were undertaken at each 20 m survey sub-reach. An example of the pre-prepared field sheets and in-stream survey field instructions that were supplied to the field teams are shown in Appendices 2 and 3.
2.4. Riparian habitat quality index
The RHQI rates the functional ability of 100 m reaches of riparian area to support in-stream habitat for fish and mitigate the loss of sediment and sediment-bound contaminants from the adjacent farmland. This index does not provide an indication of the ability of the riparian zone to intercept dissolved nutrients. The conceptual basis and calculation procedures of the RHQI are described in detail in Holmes et al. (2013). In short, the RHQI was applied to the survey data using the following steps:

CAWTHRON INSTITUTE | REPORT NO. 2587 MAY 2015
9
1. Riparian survey data, recorded on hardcopy aerial photographs, were digitised by scanning and ortho-rectifying the images within ArcView GIS version 10.1.
2. Habitat information was transferred to GIS by creating shape-files of the hand-drawn information.
3. The 1,000 m survey segments were assigned ~100 m longitudinal ‘GIS-defined zones’ (GDZ), each with a 30 m wide area either side of the streams wetted edge.
4. Within each GDZ, information on the degree of stock access, the size of the stock-exclusion area, riparian vegetation category types, the presence of bank damage, the proportion of vegetation overhanging the stream and the presence of trees were used to calculate RHQI component scores. RHQI component scores were summed (i.e. weighted equality) to give an overall RHQI score.
2.5. Tuna habitat quality index
In this section we detail the development of habitat quality indices for longfin and shortfin tuna > 400 mm. These indices can be used to interpret BSHMP survey data. Firstly, we present a series of conceptual models that rate various structural habitat features of a stream in terms of their quality for tuna (> 400 mm). These conceptual models underpin the tunaHQI score calculations. Secondly, we detail the steps required to calculate the longfin tunaHQI and provide an example of its application to a hypothetical 20 m stream reach. The indices presented in this report focus on tuna > 400 mm because they require more complex habitat than smaller tuna. More detailed reach- and patch-scale assessments may be needed to adequately survey small tuna habitat.
2.5.1. Tuna habitat quality index conceptual models
Essentially, tuna require two structural habitat types in a stream; night-time feeding habitat and day-time hiding habitat. The following section details the structural habitat requirements for tuna (listed in Table 1).
Table 1. Broad-scale stream habitat-mapping protocol (BSHMP) habitat feature measurement categories alongside their corresponding functional value for tuna (> 400 mm) in streams.
BSHMP in-stream habitat feature categories Corresponding function for tuna
1 Meso-habitat type Feeding habitat, cover habitat
2 Stream substrate partial size and degree of fine sediment infilling)
Feeding habitat
3 Water depths Cover habitat
4 Fish cover Cover habitat

MAY 2015 REPORT NO. 2587 | CAWTHRON INSTITUTE
10
The tunaHQI score is a combination of four ‘component scores’ for the in-stream habitat feature categories listed in Table 1. To derive tunaHQI component scores, the percentage of cover of a habitat feature within a 20 m stream reach, is multiplied by a habitat quality weighting factor. Habitat quality weighting factors are derived from the conceptual models presented below. These models show the theoretical response of tuna habitat quality to occurrence of the food-producing and fish cover habitat features within a stream reach. The models are based on our assessment of information gathered from a review of relevant published papers, technical reports and grey literature. Feeding habitat—meso-habitat ratios
Both shallow (e.g. riffle) and deep (e.g. pool) areas of streams are used by tuna (McDowall 1990). Medium to large longfins and shortfins prefer deep and slow flowing water during the day. However, at night (under base-flow conditions) stream resident tuna undertake reach-scale movements (i.e. hundreds of metres) to preferentially feed in shallow riffle habitat, where invertebrate and forage fish biomasses are highest (Chisnall & Kalish 1993, Jowett & Richardson 2008). Where longfins and shortfins co-occur, small and medium-sized shortfins have been observed feeding in fine sediments along the shallow margins of pools (Glova et al. 1998). In theory, there should be an optimum meso-habitat ratio of feeding (riffle) to resting (runs and pools) habitat for stream resident tuna. To the best of our knowledge there is no data available to indicate this optimum ratio. Therefore, a riffle to pool/run ratio of 1:1 has been used in this study based on the United States Environmental Protection Agency (USEPA) habitat assessment protocol for salmonids (Barbour et al. 1999). We acknowledge that tuna may require less food-producing habitat (i.e. riffles) in streams compared to salmonids, as tuna are a more energy-conservative species and potentially better at obtaining terrestrial food resources from the flood-plain (where accessible). Nevertheless, we have used a 1:1 riffle to pool/run ratio (i.e. equal feeding and holding habitat) as a starting point to define the optimum habitat quality weighting value. From this assumed optimum we suggest that habitat quality declines linearly in proportion to the ratio of increasing riffle habitat (Figure 2). As shortfins are known to feed along pool (and lake) margins (Glova et al. 1998), we have weighted reaches that are prominently pool or run, more highly for this species (Figure 2b).

CAWTHRON INSTITUTE | REPORT NO. 2587 MAY 2015
11
Figure 2. Conceptual models showing habitat quality (0 = poor, 1 = optimum) for: a) longfin, and b)
shortfin eels against the percentage area that is riffle compared to deeper, slower meso-habitat types—pools, slow runs and fast runs. A value of 50% riffle (i.e. a riffle to pool/run ratio of 1:1) was chosen as the optimum habitat quality value.
Feeding habitat—substrate particle size structure and degree of fine sediment infilling
Neither shortfins or longfins (> 400 mm) have been shown to have a strong preference for a particular substrate particle size (Jowett & Richardson 2008). Therefore, habitat quality weighting scores for the substrate size categories are based on the habitat preferences of key species that comprise the diet of tuna. During periods of increased flows, shortfins, and to a lesser degree longfins, undertake medium-scale feeding movements (e.g. kilometres) to newly inundated areas of the flood-plain (pers. comm. Vic Thomson, SIEIA). Jellyman (2010) observed high percentages of worms and porina grubs in the gut of shortfins and longfins after floods. Furthermore, diurnal feeding was observed in the flooded margins of a lake. This suggests that, at least in some catchments, tuna may derive a significant proportion of their energy from terrestrial resources available in the flood-plain (if accessible). The BSHMP does not include assessments of flood-plain connectivity or its productivity (in terms of tuna food). Therefore, when deriving weighting factors for the tunaHQI (which includes the provision of food-producing habitat) we can only account for in-stream food production. The freshwater snail Potamopyrgus antipodarum features prominently in the diet of tuna (< 400 mm). However snails have a low calorific value, and small to large tuna show a preference for soft-bodied invertebrate taxa such as free-living caddis (e.g. Psilochorema sp.) if available (Sager & Glova 1998, Jellyman 2010). As tuna of both species become larger, fish such as common bullies and juvenile trout, comprise a greater proportion of their diet—with longfins tending to be more piscivorous than shortfins (Sager & Glova 1998, McDowall 1990, Jellyman 2010).

MAY 2015 REPORT NO. 2587 | CAWTHRON INSTITUTE
12
Because of the varied diet of tuna, our index must contain provision for both invertebrate and forage fish producing habitat. Coarse substrate (i.e. cobbles) is the most productive habitat for forage fish and macroinvertebrates. This is primarily because it provides a greater surface area and a more stable substrate for algal and invertebrate production and interstitial spaces for small fish cover (Wood & Armitage 1997; Wood & Armitage 1999; Matthaei et al. 2006). We used the invertebrate and forage fish habitat suitability curves, developed by Jowett and Richardson (2008) for use in in-stream habitat modelling (e.g. RHYHABSIM), as a basis to create the substrate particle size habitat quality weighting factors for food-producing habitat for both tuna species (Figure 3).
Figure 3. Conceptual model showing habitat quality (0 = poor, 1 = optimum) for longfin and shortfin
tuna against substrate particle size categories based on a modified Wentworth substrate classification system (Wentworth 1922). 1 = clay/mud/silt/sand, 2 = fine gravel, 3 = coarse gravel, 4 = small cobble, 5 = large cobble, 6 = boulders, 7 = bedrock.
The functional benefits of coarse substrate (i.e. food production) are reduced by deposited fine sediment which clogs interstitial spaces (Wood & Armitage 1997). We account for this by negatively weighting the substrate particle size score by a ‘shuffle index’ score coefficient. Shuffle index scores and coefficients are shown in Table 2.
0
0.1
0.2
0.3
0.4
0.5
0.6
0.7
0.8
0.9
1
1 2 3 4 5 6 7
Hab
itat Quality
Substrate particle size index
CAWTHRON INSTITUTE | REPORT NO. 2587 MAY 2015
13
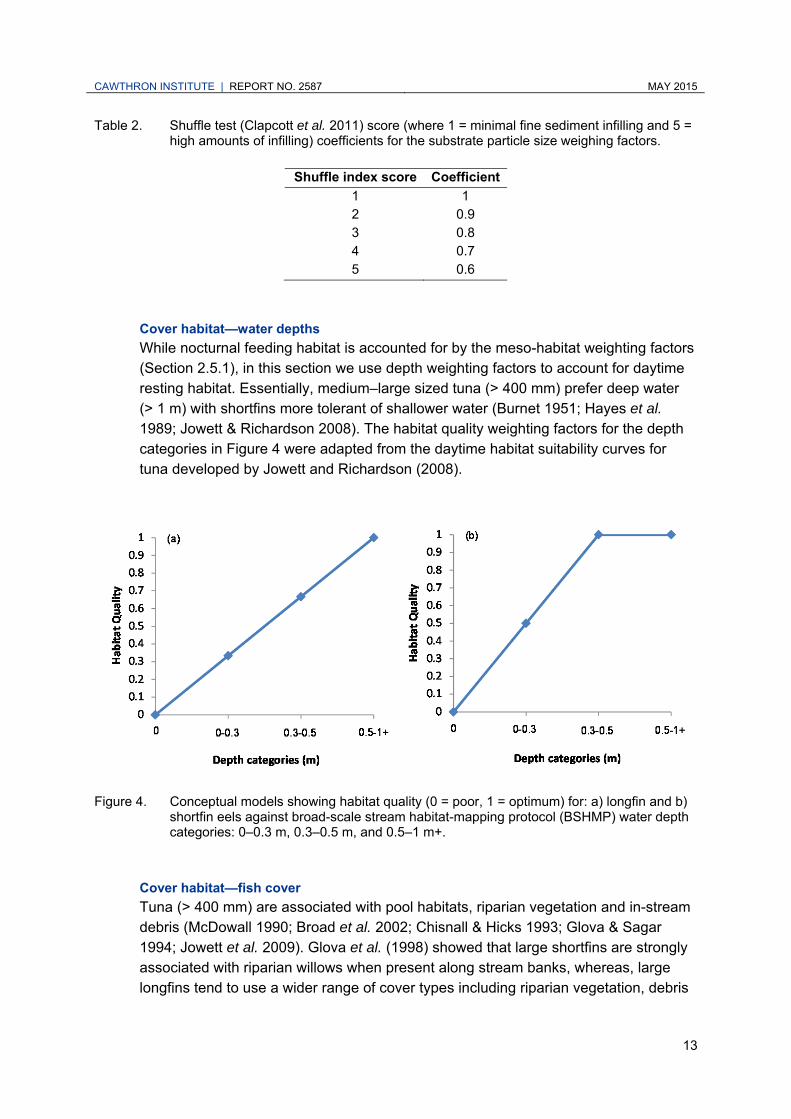
Table 2. Shuffle test (Clapcott et al. 2011) score (where 1 = minimal fine sediment infilling and 5 = high amounts of infilling) coefficients for the substrate particle size weighing factors.
Shuffle index score Coefficient
1 1 2 0.9 3 0.8 4 0.7 5 0.6
Cover habitat—water depths
While nocturnal feeding habitat is accounted for by the meso-habitat weighting factors (Section 2.5.1), in this section we use depth weighting factors to account for daytime resting habitat. Essentially, medium–large sized tuna (> 400 mm) prefer deep water (> 1 m) with shortfins more tolerant of shallower water (Burnet 1951; Hayes et al. 1989; Jowett & Richardson 2008). The habitat quality weighting factors for the depth categories in Figure 4 were adapted from the daytime habitat suitability curves for tuna developed by Jowett and Richardson (2008).
Figure 4. Conceptual models showing habitat quality (0 = poor, 1 = optimum) for: a) longfin and b)
shortfin eels against broad-scale stream habitat-mapping protocol (BSHMP) water depth categories: 0–0.3 m, 0.3–0.5 m, and 0.5–1 m+.
Cover habitat—fish cover
Tuna (> 400 mm) are associated with pool habitats, riparian vegetation and in-stream debris (McDowall 1990; Broad et al. 2002; Chisnall & Hicks 1993; Glova & Sagar 1994; Jowett et al. 2009). Glova et al. (1998) showed that large shortfins are strongly associated with riparian willows when present along stream banks, whereas, large longfins tend to use a wider range of cover types including riparian vegetation, debris

MAY 2015 REPORT NO. 2587 | CAWTHRON INSTITUTE
14
and undercut banks. However, there is likely to be considerable overlap in the structural fish cover requirements of longfin and shortfin tuna (McDowall 1990; Chisnall & Hicks 1993). Because of the overlap in cover preferences of the two species, a single set of structural fish cover weighting factors were developed. Cover types are rated according to their persistence in a stream environment. For example, undercut banks are more permanent than macrophytes or overhanging vegetation, therefore, these cover types were afforded a higher weighting (Figure 5).
Figure 5. Conceptual model showing habitat quality for longfin and shortfin tuna against structural fish cover features, where: 1 = macrophytes, 2 = submerged branches, 3 = overhanging vegetation 0–0.3 m, 4 = overhanging vegetation 0.3–0.5 m, 5 = overhanging vegetation 0.5–0.1 m, 6 = overhanging vegetation > 1 m, 7 = undercut banks 0–0.3 m, 8 = undercut banks 0.3–0.5 m, 9 = undercut banks 0.5–1 m, 10 = undercut banks > 1 m, 11 = woody debris, 12 = turbulence, 13 = other (e.g. boulder rip-rap).
2.5.2. Tuna habitat quality index calculation steps
In-stream BSHMP habitat data was entered into an Excel spread-sheet and converted to a percentage of wetted area for each 20 m sub-reach before informing the tunaHQI calculations. Scores for each of the four habitat feature categories (meso-habitat ratios, depth, substrate particle size and structural fish cover) were calculated by multiplying the percentage wetted area of a habitat feature by its corresponding habitat quality weighting factor derived from the conceptual models presented in Section 2. The product of each of these calculations was then summed to give a category score. For example: the longfin tunaHQI suitability weightings for water depth categories ‘0–0.3 m’, ‘0.3–0.5 m’ and ‘0.5–1 m+’ are 0.333, 0.666 and 1 respectively (Figure 4). If a 20 m sub-reach was recorded as 40% ‘0–0.3 m’ deep, 30% ‘0.3–0.5 m’ deep and 30%
0
0.1
0.2
0.3
0.4
0.5
0.6
0.7
0.8
0.9
1
1 2 3 4 5 6 7 8 9 10 11 12 13
Hab
itat Quality
Structural cover feature index
CAWTHRON INSTITUTE | REPORT NO. 2587 MAY 2015
15
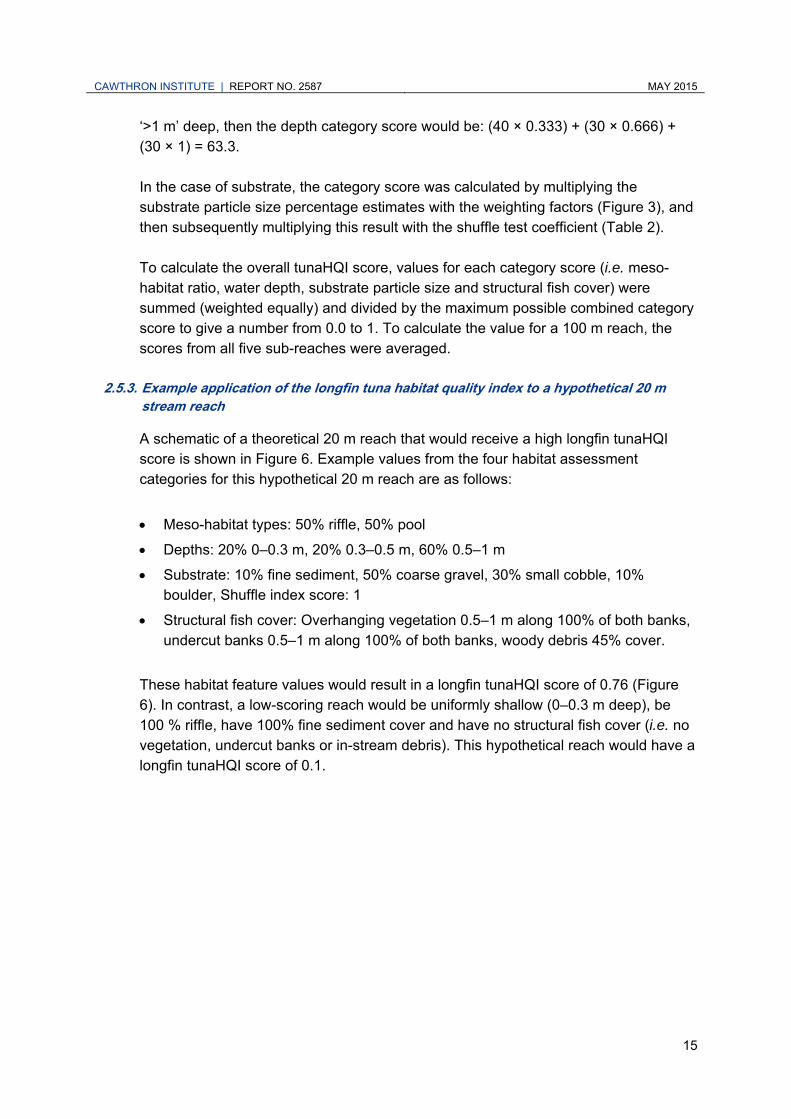
‘>1 m’ deep, then the depth category score would be: (40 × 0.333) + (30 × 0.666) + (30 × 1) = 63.3. In the case of substrate, the category score was calculated by multiplying the substrate particle size percentage estimates with the weighting factors (Figure 3), and then subsequently multiplying this result with the shuffle test coefficient (Table 2). To calculate the overall tunaHQI score, values for each category score (i.e. meso-habitat ratio, water depth, substrate particle size and structural fish cover) were summed (weighted equally) and divided by the maximum possible combined category score to give a number from 0.0 to 1. To calculate the value for a 100 m reach, the scores from all five sub-reaches were averaged.
2.5.3. Example application of the longfin tuna habitat quality index to a hypothetical 20 m stream reach
A schematic of a theoretical 20 m reach that would receive a high longfin tunaHQI score is shown in Figure 6. Example values from the four habitat assessment categories for this hypothetical 20 m reach are as follows:
Meso-habitat types: 50% riffle, 50% pool
Depths: 20% 0–0.3 m, 20% 0.3–0.5 m, 60% 0.5–1 m
Substrate: 10% fine sediment, 50% coarse gravel, 30% small cobble, 10% boulder, Shuffle index score: 1
Structural fish cover: Overhanging vegetation 0.5–1 m along 100% of both banks, undercut banks 0.5–1 m along 100% of both banks, woody debris 45% cover.
These habitat feature values would result in a longfin tunaHQI score of 0.76 (Figure 6). In contrast, a low-scoring reach would be uniformly shallow (0–0.3 m deep), be 100 % riffle, have 100% fine sediment cover and have no structural fish cover (i.e. no vegetation, undercut banks or in-stream debris). This hypothetical reach would have a longfin tunaHQI score of 0.1.
MAY 2015 REPORT NO. 2587 | CAWTHRON INSTITUTE
16
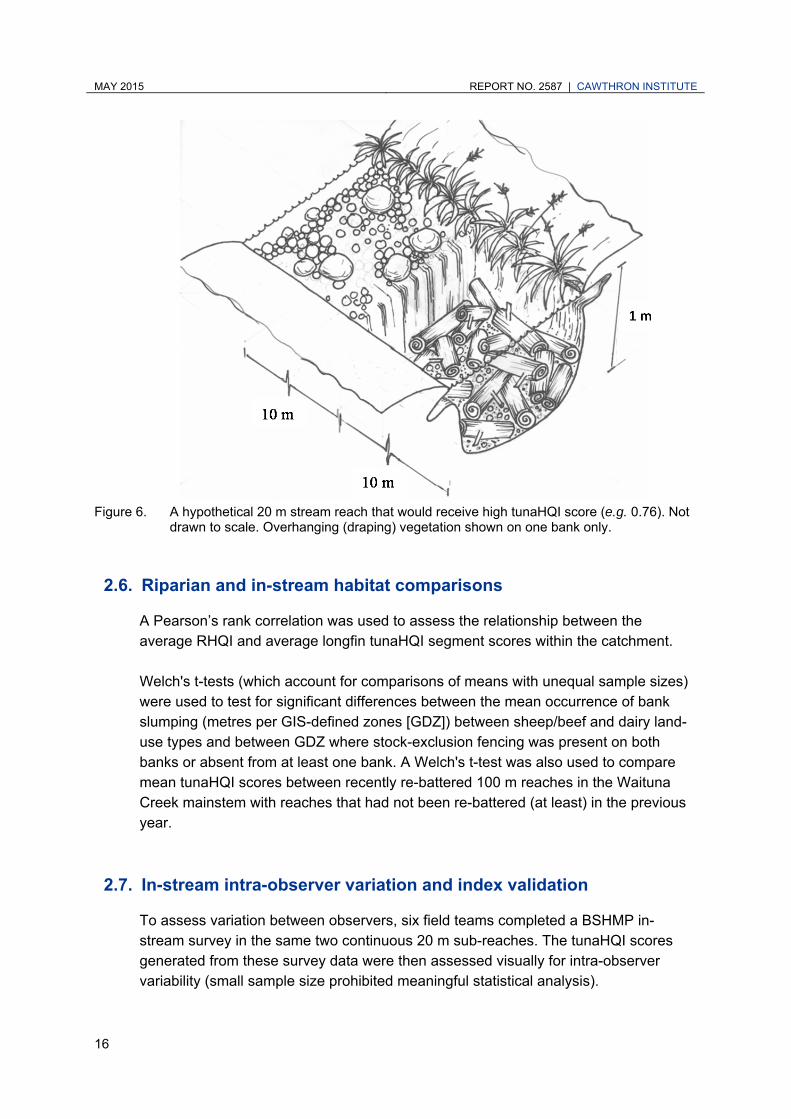
Figure 6. A hypothetical 20 m stream reach that would receive high tunaHQI score (e.g. 0.76). Not
drawn to scale. Overhanging (draping) vegetation shown on one bank only.
2.6. Riparian and in-stream habitat comparisons
A Pearson’s rank correlation was used to assess the relationship between the average RHQI and average longfin tunaHQI segment scores within the catchment. Welch's t-tests (which account for comparisons of means with unequal sample sizes) were used to test for significant differences between the mean occurrence of bank slumping (metres per GIS-defined zones [GDZ]) between sheep/beef and dairy land-use types and between GDZ where stock-exclusion fencing was present on both banks or absent from at least one bank. A Welch's t-test was also used to compare mean tunaHQI scores between recently re-battered 100 m reaches in the Waituna Creek mainstem with reaches that had not been re-battered (at least) in the previous year.
2.7. In-stream intra-observer variation and index validation
To assess variation between observers, six field teams completed a BSHMP in-stream survey in the same two continuous 20 m sub-reaches. The tunaHQI scores generated from these survey data were then assessed visually for intra-observer variability (small sample size prohibited meaningful statistical analysis).

CAWTHRON INSTITUTE | REPORT NO. 2587 MAY 2015
17
Victor Thompson (a representative from the SIEIA) and two representatives from Te Ao Mārama Inc., who have all fished extensively for tuna in the Southland region, were asked to provide qualitative expert assessments of tuna habitat (on a 1–10 Likert scale) in 100 m reaches that were recently surveyed using the BSHMP. A Spearman’s rank correlation was used to assess the relationship between tunaHQI scores and expert qualitative assessment scores obtained for the same 100 m reaches.
MAY 2015 REPORT NO. 2587 | CAWTHRON INSTITUTE
18
3. RESULTS AND DISCUSSION
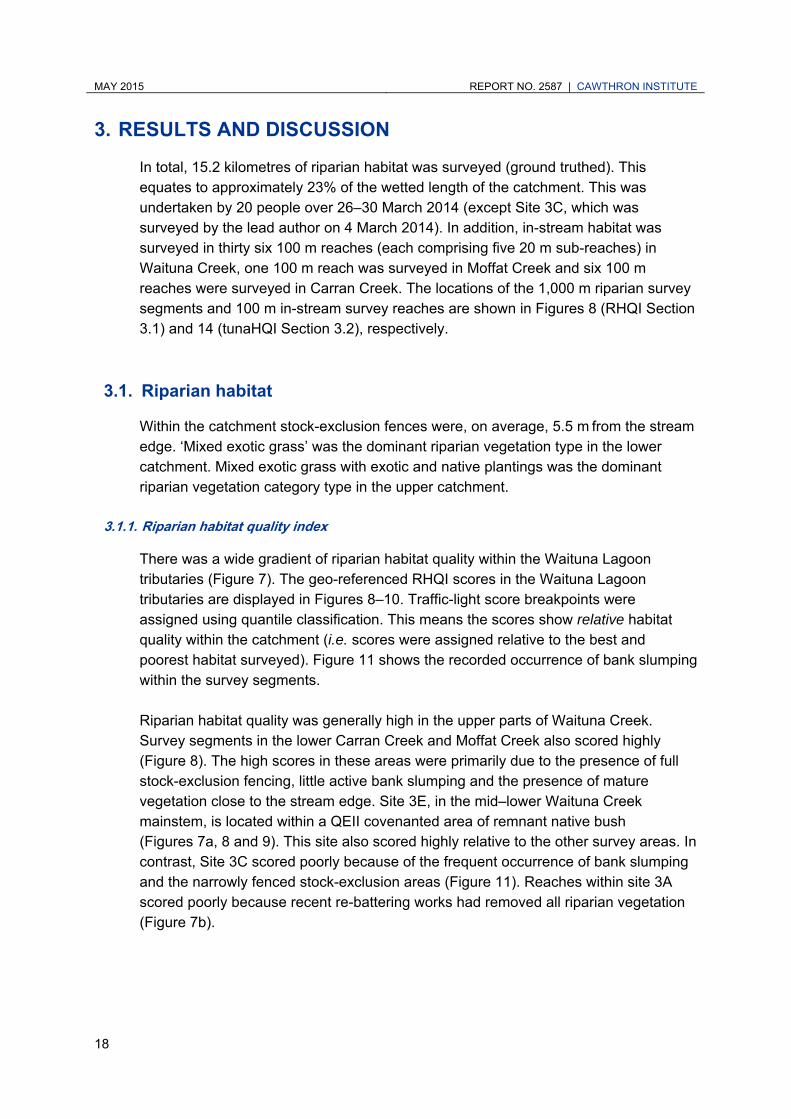
In total, 15.2 kilometres of riparian habitat was surveyed (ground truthed). This equates to approximately 23% of the wetted length of the catchment. This was undertaken by 20 people over 26–30 March 2014 (except Site 3C, which was surveyed by the lead author on 4 March 2014). In addition, in-stream habitat was surveyed in thirty six 100 m reaches (each comprising five 20 m sub-reaches) in Waituna Creek, one 100 m reach was surveyed in Moffat Creek and six 100 m reaches were surveyed in Carran Creek. The locations of the 1,000 m riparian survey segments and 100 m in-stream survey reaches are shown in Figures 8 (RHQI Section 3.1) and 14 (tunaHQI Section 3.2), respectively.
3.1. Riparian habitat
Within the catchment stock-exclusion fences were, on average, 5.5 m from the stream edge. ‘Mixed exotic grass’ was the dominant riparian vegetation type in the lower catchment. Mixed exotic grass with exotic and native plantings was the dominant riparian vegetation category type in the upper catchment.
3.1.1. Riparian habitat quality index
There was a wide gradient of riparian habitat quality within the Waituna Lagoon tributaries (Figure 7). The geo-referenced RHQI scores in the Waituna Lagoon tributaries are displayed in Figures 8–10. Traffic-light score breakpoints were assigned using quantile classification. This means the scores show relative habitat quality within the catchment (i.e. scores were assigned relative to the best and poorest habitat surveyed). Figure 11 shows the recorded occurrence of bank slumping within the survey segments. Riparian habitat quality was generally high in the upper parts of Waituna Creek. Survey segments in the lower Carran Creek and Moffat Creek also scored highly (Figure 8). The high scores in these areas were primarily due to the presence of full stock-exclusion fencing, little active bank slumping and the presence of mature vegetation close to the stream edge. Site 3E, in the mid–lower Waituna Creek mainstem, is located within a QEII covenanted area of remnant native bush (Figures 7a, 8 and 9). This site also scored highly relative to the other survey areas. In contrast, Site 3C scored poorly because of the frequent occurrence of bank slumping and the narrowly fenced stock-exclusion areas (Figure 11). Reaches within site 3A scored poorly because recent re-battering works had removed all riparian vegetation (Figure 7b).

CAWTHRON INSTITUTE | REPORT NO. 2587 MAY 2015
19
Figure 7. a) Reach within Site 3C with a high riparian habitat quality index (RHQI) score.
b) Recently re-battered reach within Site 3A with a low RHQI score.
MAY 2015 REPORT NO. 2587 | CAWTHRON INSTITUTE
20
Figure 8. Geo-referenced riparian habitat quality index (RHQI) traffic-light scores for all GIS-defined zones (GDZ) in Waituna Creek (left), Moffat Creek (middle) and Carran Creek (right). The individual GDZ scores are located within a coloured-halo which defines the average score for the entire survey segment. Streams flow from north to south. Waituna Lagoon is located immediately below the southern-most survey segment.

CAWTHRON INSTITUTE | REPORT NO. 2587 MAY 2015
21
Figure 9. Geo-referenced riparian habitat quality index (RHQI) scores for the 10 GIS-defined zones (GDZ) within the Site 3E survey segment (in the mid–lower Waituna Creek mainstem). Stream flows from north to south.

MAY 2015 REPORT NO. 2587 | CAWTHRON INSTITUTE
22
Figure 10. Geo-referenced riparian habitat quality index (RHQI) scores for the 10 GIS-defined zones (GDZ) within the Site 3C survey segment in the lower Waituna Creek. Stream flows from north to south.
CAWTHRON INSTITUTE | REPORT NO. 2587 MAY 2015
23
Figure 11. The recorded incidences of active bank slumping, shown as red lines, geo-referenced within the grey survey segment outlines in Waituna Creek (left), Moffat Creek (middle) and Carran Creek (right). Streams flow is from north to south. Waituna Lagoon is located immediately below the southern-most survey segment.

MAY 2015 REPORT NO. 2587 | CAWTHRON INSTITUTE
24
3.1.2. Bank slumping and riparian management
During the survey it was noted that active bank slumping tended to occur in areas where stock-exclusion fencing was absent (pers. obs. by the lead author). For example, the photograph shown in Figure 12 was taken from the top of Site 3I. In this segment, bank slumping was recorded along 5% of the true right bank, which had stock-exclusion fencing. In comparison, bank slumping was recorded along 60% of the true left bank where there was no stock-exclusion fencing.
Figure 12. Site 3I looking downstream from the top end of the survey segment. This segment had the highest recorded incidences of active bank slumping (m) out of any survey segment in the catchment.
Over all the survey data, 1,565 m of bank slumping was recorded. In total, 38% of the recorded bank slumping occurred in GDZ where there was an absence of stock-exclusion fencing on at least one bank. These GDZ represented 18% of the total surveyed area. All GDZ that lacked stock-exclusion fencing occurred on sheep/beef farms (Table 3). The mean recorded length (m) of bank slumping was significantly higher in sheep/beef GDZ than in dairy GDZ (t = -2.8, P = 0.01) (Figure 13a). Furthermore, irrespective of land-use type, bank slumping was significantly higher in GDZ where stock could access the stream edge (t = 3.9, P = 0.01) (Figure 13b). A significant proportion of bank-derived sediment in Waituna Creek appears to be from unfenced sections of stream—despite unfenced sections comprising a relatively small percentage of the catchment.

CAWTHRON INSTITUTE | REPORT NO. 2587 MAY 2015
25
Table 3. Descriptive statistics of the occurrence of different land-use types, active bank slumping and effective stock-exclusion fencing within all GIS-defined zones (GDZ) in the catchment.
Dairy Sheep/beef Retired
pasture/forestry/DOC reserve
Percent land use 57 21 22
Percentage of total recorded bank slumping
30 38 32
Percentage of GDZ with full stock-exclusion fencing
100 32 100
Figure 13. a) Box and whisker plot comparison between the average recorded length (m) of active bank slumping per GIS-defined zones (GDZ) located within the dairy and sheep/beef land-use types. b) Box and whisker plot comparison between the average recorded lengths (m) of active bank slumping in GDZ where stock could access the stream edge and GDZ that had full stock-exclusion fencing in all land-use types in the catchment. Solid black lines are median values. Averages values are shown by the red dotted lines. Data in both plots are spread horizontally to highlight the number of zero values.
We noted that many reaches of Waituna Creek had stock-exclusion fencing on one bank only (pers. obs. by the lead author). Through discussions with farmers, it is our understanding that historically, the riparian area was purposefully managed in this way to facilitate the mechanical clearing of macrophytes and deposited sediments. Mechanical clearing is undertaken to maintain the efficiency of mole and tile farm drainage systems. The observed relationship between unfenced segments of streams and active bank slumping suggests that the cause of sedimentation in the Waituna Creek is, in part, the result of maintaining access for sediment and macrophyte removal machinery.

MAY 2015 REPORT NO. 2587 | CAWTHRON INSTITUTE
26
3.2. In-stream habitat
Overall, surveyed stream reaches averaged 4.5 m wide. ‘Slow run’ was the dominant meso-habitat type averaging 80% of the surveyed stream area (Table 4). Deep habitat was rare with water deeper than 1 m making up only 1% of the streams wetted area, 78% of the stream was < 0.5 m deep (Table 5). Macrophyte beds were a dominant feature of the streams with a mean cover of 57%. Fine sediment (clay/mud/silt/sand) was the most common substrate category type comprising 57% of the stream bed (Table 6). Sediment shuffle test scores were generally high (mean score of 3.6), indicating that most areas of coarse substrate were imbedded within fine sediments. In-stream fish cover was predominantly aquatic macrophytes (Table 7) followed by overhanging (draping) vegetation (12.5% cover) and undercut banks (4.4% cover). Minor amounts of woody debris, submerged branches and artificial fish cover objects were also present (Table 7).
Table 4. Percentage cover of meso-habitat types for the Waituna Lagoon tributaries expressed as an average percentage of the wetted width of all 20 m sub-reaches.
Meso-habitat type Pool Riffle Slow run Fast run Backwater
Mean % 8 0.7 80 11 0.3
Table 5. Depth category percentages for Waituna Lagoon tributaries expressed as an average percentage of the wetted width of all 20 m sub-reaches.
Depth category 0–0.3 m 0.3–0.5 m 0.5–1.0 m > 1 m Mean % 37 41 21 1
Table 6. Percentage stream-bed cover of the various substrate categories (Wentworth classification system) and aquatic macrophyte beds in Waituna Lagoon tributaries expressed as an average percentage of the wetted width of all 20 m sub-reaches.
Substrate category Weed
beds Clay/mud/silt/sand Fine
gravel Coarse gravel
Small cobble
Large cobble
Boulder Bedrock
Mean % 57 57 27 13 2.7 0.1 0.1 0.1
Table 7. Percentage cover of the in-stream fish cover types for all survey sub-reaches combined. Cover types are expressed as an average percentage of the wetted area of all 20 m sub-reaches.
Cover category Undercut bank Over hanging
vegetation Woody debris Submerged
Branches Man-made
cover
Mean % 4.4 12.5 0.3 0.1 0.03

CAWTHRON INSTITUTE | REPORT NO. 2587 MAY 2015
27
3.2.1. Longfin tuna habitat quality index
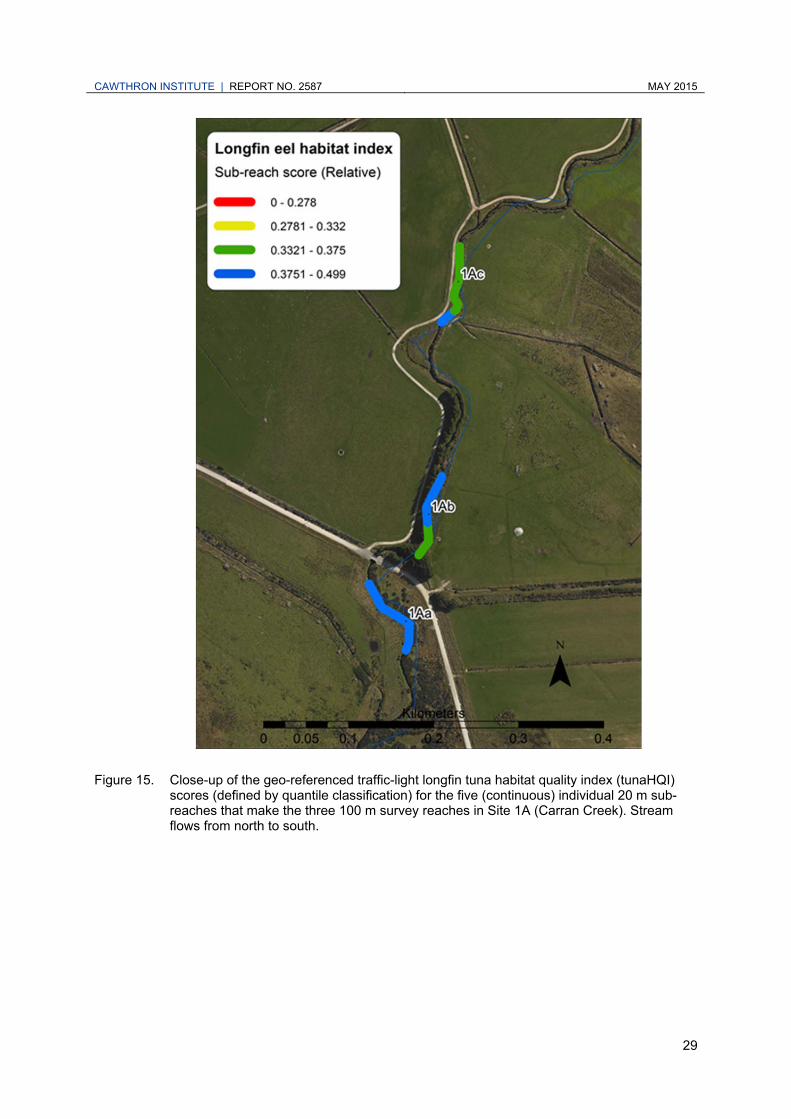
We used the longfin tunaHQI to interpret the BTHMP survey data from the Waituna Lagoon tributaries. We chose not to display the shortfin tunaHQI scores because they are similar to the longfin tunaHQI scores. In general, the longfin tunaHQI can be seen as a more sensitive indicator of habitat quality because deeper water is scored more highly. Figure 14–16 show the longfin tunaHQI displayed as geo-referenced traffic-light scores. The lower end of Carran Creek (Site 1A) contained the best tuna habitat in the catchment (Figure 14 and 15). This is primarily due to the presence of extensive mature riparian vegetation, much of which overhangs and drapes into the stream, providing cover for fish. The lower end of Carran Creek also has a greater average depth relative to the rest of the catchment. Within Waituna Creek, the best tuna habitat occurs in the upper catchment where there has been extensive fencing and riparian planting (e.g. the upper 500 m of Sites 7A and 5B). The lower and mid-segments of Waituna Creek have the lowest tuna habitat value, primarily because the stream bed has a relatively high percent cover of fine sediments (Figure 14). Furthermore, the impact of ongoing bank re-battering works has reduced the occurrence of stream edge fish cover.
MAY 2015 REPORT NO. 2587 | CAWTHRON INSTITUTE
28
Figure 14. Overview of longfin tuna habitat quality in the Waituna Lagoon tributaries: Waituna Creek (left), Moffat Creek (middle) and Carran Creek (right). Longfin tuna habitat quality index (tunaHQI) values are depicted as a 4-point geo-referenced traffic-light scores. a) Shows scores relative to absolute theoretical maximum scores (i.e. the scoring range from 0–1 was split into quartiles to define the traffic-light categories). b) Shows scores relative to the highest and lowest scores observed within the catchment (i.e. traffic-light categories were defined by quantile classification of the observed score range for the catchment). Streams flow from north to south. Waituna Lagoon is located immediately below the southern-most survey reach.
CAWTHRON INSTITUTE | REPORT NO. 2587 MAY 2015
29
Figure 15. Close-up of the geo-referenced traffic-light longfin tuna habitat quality index (tunaHQI) scores (defined by quantile classification) for the five (continuous) individual 20 m sub-reaches that make the three 100 m survey reaches in Site 1A (Carran Creek). Stream flows from north to south.
MAY 2015 REPORT NO. 2587 | CAWTHRON INSTITUTE
30
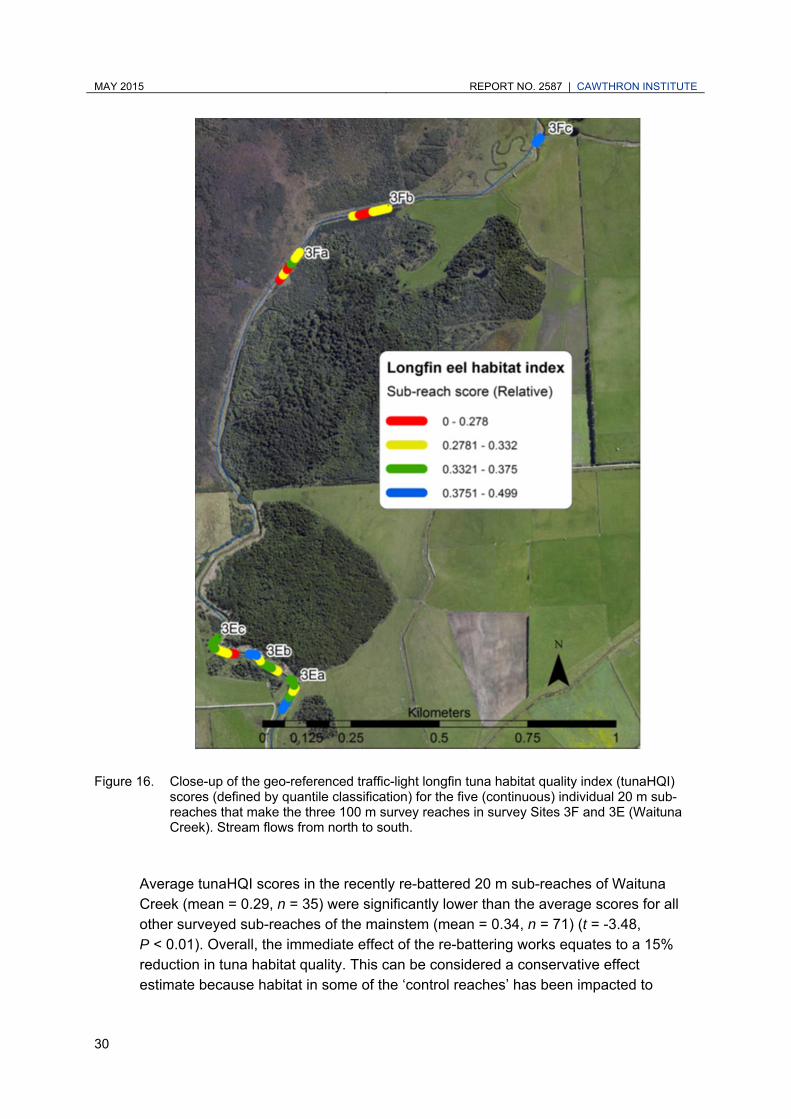
Figure 16. Close-up of the geo-referenced traffic-light longfin tuna habitat quality index (tunaHQI) scores (defined by quantile classification) for the five (continuous) individual 20 m sub-reaches that make the three 100 m survey reaches in survey Sites 3F and 3E (Waituna Creek). Stream flows from north to south.
Average tunaHQI scores in the recently re-battered 20 m sub-reaches of Waituna Creek (mean = 0.29, n = 35) were significantly lower than the average scores for all other surveyed sub-reaches of the mainstem (mean = 0.34, n = 71) (t = -3.48, P < 0.01). Overall, the immediate effect of the re-battering works equates to a 15% reduction in tuna habitat quality. This can be considered a conservative effect estimate because habitat in some of the ‘control reaches’ has been impacted to

CAWTHRON INSTITUTE | REPORT NO. 2587 MAY 2015
31
varying degrees by channel engineering in the past (pers. obs. by the lead author). Therefore, these reaches do not represent a true control. We present this analysis with the caution that the tunaHQI is theoretical and yet to be tested against quantitative fish population data. Moreover, a reduction in habitat quality will not necessarily translate to an effect on the tuna population because we do not know if the population is limited by habitat quality or quantity in this catchment. Recruitment past the intermittently closed Lagoon outlet, or commercial fishing within the tributaries, could potentially maintain this population well below carrying capacity. The re-battering works do not disturb the stream bed. Therefore, the observed differences in tunaHQI scores are the result of the removal of stream edge fish cover (i.e. undercut banks and overhanging vegetation) (Figure 17). Macrophyte beds, which were present throughout the catchment, remain intact within the re-battered sections. These macrophyte beds may provide adequate cover for tuna in most of the re-battered stretches of stream over summer and autumn. However, die-back of macrophytes during winter could reduce the habitat quality of the re-battered reaches further (in comparison to reaches where stream edge cover remains intact).
Figure 17. Example of the bank reconstruction (re-battering) works in progress in Waituna Creek (photograph taken from the middle of Site 3F looking upstream).
3.3. Riparian and in-stream habitat quality comparison
In Carran Creek and the upper Waituna Creek tributaries (i.e. sites 7A, 5A, 5B, 6A, 1A and 1B) there was a close to significant positive correlation between the average RHQI and average longfin tunaHQI segment scores (R2 = 0.62, P = 0.06, n = 6, Figure 18). This indicates that the quality of the riparian habitat directly influences the

MAY 2015 REPORT NO. 2587 | CAWTHRON INSTITUTE
32
quality of local in-stream habitat in these areas1. However, there was no correlation between the riparian and in-stream habitat index scores in the mainstem Waituna Creek survey segments. The mainstem of Waituna Creek has increased flood power relative to the rest of the catchment. Therefore, processes related to the catchment-scale disturbance regime (such as downstream sediment transport) may be obscuring any effects of the riparian management area on local in-stream habitat quality at the segment and reach-scale in this part of the catchment.
Figure 18. Relationship between the average riparian habitat quality index (RHQI) segment scores
and the averaged longfin tuna habitat quality index (tunaHQI) segments scores in the Carran and upper Waituna Creek survey segments. tunaHQI segment scores were derived by averaging the three 100 m reaches scores within each riparian survey segment, n = 6. Analysis excludes the Waituna Creek mainstem sites.
3.4. Intra-observer variation and expert assessment validation
3.4.1. Intra-observer variation
Average tunaHQI scores calculated for the same two continuous 20 m in-stream sub-reaches were similar between the six survey teams. The greatest difference in the tunaHQI scores was 0.07 points between survey teams 2 and 4. Index scores differed by less than 0.02 points between the other survey teams (Figure 19).
1 Site 2B in Moffat Creek was removed from this comparison because sections of the stream bed were dry at the
time of the survey.

CAWTHRON INSTITUTE | REPORT NO. 2587 MAY 2015
33
Figure 19. Average longfin tuna habitat quality index (tunaHQI) scores calculated from in-stream
survey data collected by six different survey teams (pairs) from the same two continuous 20 m sub-reaches.
3.4.2. Tuna habitat quality index and expert assessment comparison
A total of nine 100 m reaches in the lower Waituna Creek were assessed by Victor Thompson (SIEIA) and rated for their ability to support both longfin and shortfin tuna populations. Victor’s longfin tuna expert assessment scores were significantly positively correlated with the longfin tunaHQI scores calculated for the same 100 m reaches (Figure 20). Of note are the differences in the range between high and low scoring habitat for the expert assessment scores and tunaHQI (0.9 and 0.4 respectively for the normalised data). The tunaHQI rates ‘poor quality’ tuna habitat relatively highly when compared with the expert assessment.

MAY 2015 REPORT NO. 2587 | CAWTHRON INSTITUTE
34
Figure 20. Relationship between the longfin tuna habitat quality index (tunaHQI) scores and a
qualitative expert assessment of longfin tuna habitat (1–10 Likert scale) in the same nine 100 m survey reaches. Data from both assessments have been normalised (by dividing all values by the maximum values in each assessment) to allow comparison on the same scale.
In an attempt to gain a perspective of tuna habitat quality from local runanga members, Terry Ryan and Keith Bradshaw, who are both experienced tuna fishers, were also asked to give an assessment of tuna habitat quality in some of the surveyed 100 m in-stream reaches. However, they were both uncomfortable with participating for the following reasons:
1. They did not wish to confine the assessment of tuna habitat to 100 m of stream and would have preferred to consider the entire stream within view when ranking tuna habitat.
2. They were happy to consider tuna habitat in terms of its relative value within the catchment—but felt uncomfortable scoring habitat in terms of its potential value when compared with tuna habitat on a national scale.
These reasons highlight valid issues relating to the influence of scale when assessing fish habitat. If more time was available for Terry and Keith to consider habitat within entire segments of the Waituna Creek (or the entire catchment), then they may have felt more comfortable providing an assessment.

CAWTHRON INSTITUTE | REPORT NO. 2587 MAY 2015
35
4. CONCLUSIONS AND RECOMMENDATIONS
Using a randomised representative sample approach we gathered riparian and in-stream habitat information from throughout the major tributaries of Waituna Lagoon. In general, riparian habitat in the Waituna Lagoon tributaries can be considered to be in average–good condition. Furthermore, the majority of the riparian area is managed according to good practice. However, some isolated reaches and segments, with little or no stock-exclusion fencing and extensive bank slumping, were in very poor condition. Survey segments 3C and 3I had the lowest RHQI scores in the catchment. These segments may benefit from targeted rehabilitation efforts to reduce bank erosion. All surveyed areas that lacked stock-exclusion fencing were associated with sheep/beef farms. Discussions with individual farmers revealed that, historically, areas of Waituna Creek were not fenced on one bank to facilitate the mechanical clearing of macrophytes and built-up sediments by Environment Southland. However, we demonstrate that a disproportionality high amount of bank slumping (38% of the total amount of bank slumping) occurs in the relatively few reaches and segments where stock can access the stream (18% of the surveyed area). Reducing bank-derived sediment loading is recognised as a key environmental goal for the catchment (McDowell et al. 2013; Robertson et al. 2011). Completing the network of stock fencing represents a potentially cost effective method to achieve this goal. Methods (if available) for maintaining the efficiency of farm drainage systems that enable stock-exclusion fencing on both stream banks of Waituna Creek should be employed. When considered at the catchment-scale, in-stream habitat is relatively homogeneous and of poor to average quality for tuna. However, isolated areas, in particular the lower end of Carran Creek, provide excellent tuna habitat. The poorest quality habitat occurs in the mid and lower Waituna Creek mainstem. The recently completed bank re-battering works had a small, but significant impact, on tuna habitat. The tunaHQI scores for in-stream habitat in the re-battered sections were, on average, 15% lower than scores for mainstem habitat that were not re-battered (at least in the previous year). The impact of the removal of bank-edge fish cover by the re-battering works is moderated by presence of extensive macrophyte beds. Macrophyte beds that remain in the re-battered sections of stream may provide adequate cover for tuna during summer. However, these cover structures are temporary and can be removed by floods, low winter light levels and mechanical clearing. At a reach scale, tunaHQI component scores can be interrogated to identify local deficiencies in tuna habitat quality. This information can be used to inform targeted rehabilitation interventions. Within the wider catchment, information from this survey suggests that the quality of tuna habitat will be enhanced by:

MAY 2015 REPORT NO. 2587 | CAWTHRON INSTITUTE
36
1. Completing the network of stream fencing—this will allow rank grass and emergent vegetation to form along the stream edges, providing cover for tuna. In addition, completing the network of stream fencing will reduce fine sediment loading. This may ultimately maintain pool depths downstream and increase invertebrate (food) production though improving the quality of the substrate.
2. Establish stream edge vegetative fish cover—swamp sedges (e.g. Carex virgate and Carex secta) provide overhanging (draping) cover along the stream edge. Stream-edge plantings would be most beneficial in segments where re-battering has removed stream edge vegetation
3. Provide permanent fish cover in re-battered sections (in conjunction with, or as an alternative to, recommendation 2 above). Permanent fish cover will buffer habitat quality against the removal or winter die-back of macrophyte beds. Fish cover could be instated by anchoring wood structures near nocturnal feeding areas (riffles), or, by adding rip-rap rock of a sufficient size (e.g. > 400 mm diameter) to provide interstitial spaces for large tuna.
These recommendations are provided with the caution that consideration needs to be given to how these actions could conflict with drainage and flood protection in the catchment.
4.1. Concurrent work
The tunaHQI is part of a larger on-going work-stream to develop a cost-effective catchment-scale survey system to inventory stream habitat and assess fishery values:
As part of the Ministry of Business, Innovation and Employment (MBIE) Cumulative Effects Programme (C01X1005), validation work is currently underway to determine if consistent BTHMP survey results (for the in-stream component) can be generated by independent survey teams.
Validation work is currently underway as part of the MBIE Aquatic Rehabilitation Programme (C01X1002) to determine if fish densities correlate with fish habitat quality index scores (e.g. the tunaHQI). Tuna and trout population density data are being gathered from stream reaches that span a gradient of structural habitat quality using depletion count electric-fishing.
4.2. Future work
Ultimately, the tunaHQI is intended to be a robust synthesis of anecdotal and scientific knowledge. The habitat quality weighting factors presented in this report can be revisited in response to new information about tuna habitat preferences in lowland streams. Furthermore, changes to the tunaHQI can be retro-fitted to previously collected BSHMP survey data. Therefore, any previous stream habitat data gathered

CAWTHRON INSTITUTE | REPORT NO. 2587 MAY 2015
37
using the BSHMP (in this case from the Waituna Lagoon tributaries) can remain a valid baseline assessment even if the tunaHQI weighting factors are altered (for instance, in response to newly-available scientific information). We intend to continue to involve expert tuna fishers in subsequent BSHMP surveys so that a comprehensive database of qualitative tuna habitat assessments can be developed. This will be used to validate the tunaHQI. A similar approach was used when developing the adult brown trout habitat quality index (THQI) that can be applied to BSHMP survey data. This index was positively correlated with parallel qualitative expert trout habitat quality assessments (Holmes et al. 2012). We see potential to develop customised software to run the BSHMP, tunaHQI and other indices (e.g. RHQI and THQI) on tablet-style field computers. Furthermore the RQHI could be used to model cost-efficient riparian habitat enhancement scenarios. These initiatives could increase the cost-efficiency and accuracy of the BSHMP allowing more communities to apply this methodology to their catchment. A promising area for further investigation is the use of unmanned aerial vehicles (UAV’s) and/or high-resolution cloud satellites (see: Planet Labs ‘Doves’ https://www.planet.com/) to obtain aerial imagery for use in a BSHMP survey. These tools, in combination with image recognition software, could increase accuracy of data, reduce survey costs and increase the area of riparian habitat surveyed within a catchment.

MAY 2015 REPORT NO. 2587 | CAWTHRON INSTITUTE
38
5. ACKNOWLEDGEMENTS
Thank you to Dr Erica Williams (NIWA) for your comments on the draft. Funding for the Waituna tributary broad-scale stream habitat-mapping protocol (BSHMP) survey and the development of the tuna habitat quality index (tunaHQI) was provided by the Department of Conservation/Fonterra partnership: Living Water programme (DOCDM-1316259). Funding for the development of the riparian habitat quality index (RHQI) was provided by DairyNZ. This project is a continuation of work funded by the Ministry of Business, Innovation and Employment—Maintenance and Rehabilitation of Aquatic Ecosystems Programme (C01X1002). Significant in-kind support for this project was provided by the following organisations and people.
DOC: Mary Beech, James Haggertty, Julie Eason
DairyNZ: Julia Christie, Justin Kitto
Environment Southland: Roger Hodgson, Casie Heron
Waituna Farmers: Derek Ballantine, Nikki White
Te Ao Mārama Incorporated: Dean Whaanga, Stevie Blair, Terry Ryan, Keith Bradshaw
South Island Eel Industry Association: Vic Thompson
Waituna Land Care Group: Gay Munro
Fish & Game (Southland Council): Zane Moss, Jacob Smyth
Fonterra: Chris Wright
Thanks to the Waituna Lagoon catchment farmers for supporting this study by allowing access for the field workers throughout the catchment.
CAWTHRON INSTITUTE | REPORT NO. 2587 MAY 2015
39
6. REFERENCES
Allouche S 2002. Nature and functions of cover for riverine fish. Bulletin Francais De La Peche Et De La Pisciculture. 365-66: 297-324.
Ausseil A-GE, Dymond JR, Weeks ES 2011. Provision of natural habitat for biodiversity: quantifying recent trends in New Zealand. In: Grillo O ed. Biodiversity loss in a changing planet. In:Tech Open Access. ISBN: 978-953-307-707-9. Available at: http://cdn.intechopen.com/ pdfs/23610/In: Tec-Provision_of_natural_habitat_for_biodiversity_quantifying_recent_trends_in_new_zealand.pdf.
Barbour MT, Gerritsen J, Snyder BD, Stribling JB 1999. Rapid Bioassessment Protocols for Use in Streams and Wadeable Rivers: Periphyton, Benthic Macroinvertebrates and Fish, Second Edition. EPA 841-B-99-002. U.S. Environmental Protection Agency; Office of Water; Washington, D.C.
Beentjes MP, Boubée JAT, Jellyman DJ, Graynoth E 2005. Non-fishing mortality of freshwater eels (Anguilla spp.). New Zealand Fisheries Assessment Report 2005/34 . Ministry of Fisheries, Wellington. 38 p.
Bjornn TC, Brusven MA, Molnau MP, Milligan JH, Klamt RA, Chacho E, Schaye C 1977. Transport of granitic sediment in streams and its effects on insects and fish. Forest, Wildlife and Range Experiment Station bulletin. Prepared for University of Idaho. 43 p.
Boubée JAT, Chisnall B, Watene E, Williams E, Roper D, Haro A 2003. Enhancement and Management of Eel Fisheries Affected by Hydroelectric Dams in New Zealand. In: D. A. Dixon (Ed). Biology Management and Protection of Catadromous Eels. p. 191-205.
Boubée JAT, Mitchell CP, Chisnall BL, West DW, Bowman EJ 2001. Factors regulating the downstream migration of mature eels (Anguilla spp.) at Aniwhenua Dam, Bay of Plenty, New Zealand. New Zealand Journal of Marine and Freshwater Research. 35: p 121-134.
Broad TL, Townsend CR, Closs GP, Jellyman DJ 2002. Riparian land use and accessibility to fishers influence size class composition and habitat use by longfin eels in a New Zealand river. Journal of Fish Biology. 61: 1489–1503.
Broadmeadow S, Nisbet TR 2004. The effects of riparian forest management on the freshwater environment: a literature review of best management practice. Hydrology and Earth System Sciences 8: 286-305
Burnet AMR 1951. Studies on the ecology of the New Zealand Longfin eel (Anguilla dieffenbachii) gray. Fisheries Technical Report. 63 p.
Chisnall BL, Hicks BJ 1993. Age and growth of longfin eels in pastoral and forested streams in the Waikato River basin and in two hydro-lakes in the North Island,
MAY 2015 REPORT NO. 2587 | CAWTHRON INSTITUTE
40
New Zealand. New Zealand Journal of Marine and Freshwater Research. 27: p 317–332.
Chisnall BL, Kalish JM 1993. Age validation and movement of freshwater eels (Anguilla dieffenbachii and A. australis) in a New Zealand pastoral stream. New Zealand Journal of Marine and Freshwater Research. 27: p 333–338.
Clapcott JE, Young RG, Harding JS, Matthaei CD, Quinn JM, Death RG 2011. Sediment Assessment Methods: Protocols and guidelines for assessing the effects of deposited fine-sediment on in-stream values. Cawthron Institute, Nelson, New Zealand.
Dekker W, Casselman JM, Cairns DK, Tsukamoto K, Jellyman D, Lickers H 2003. Worldwide decline of eel resources necessitates immediate action: Que´bec declaration of concern. Fisheries. 28: 28–30.
Duncan SH, Ward JW 1985. The influence of watershed geology and forest roads on the composition of salmon spawning gravel. Northwest Science 59: 204-212.
Glova GJ, Jellyman DJ, Bonnett ML 1998. Factors associated with the distribution of habitat of eel (Anguilla spp.) in three New Zealand lowland streams. New Zealand Journal of Marine and Freshwater Research. 32: p 255–269.
Glova GJ, Sagar PM 1994. Comparison of fish and macroinvertebrate standing stocks in relation to riparian willows (Salix spp.) in three New Zealand streams. New Zealand Journal of Marine and Freshwater Research. 28: 255-266.
Goodman JM, Dunn NR, Ravenscroft PJ, Allibone RM, Boubee JAT, David BO, Griffiths M, Ling N, Hitchmough RA, Rolfe JR 2013. Conservation status of New Zealand freshwater fish, 2013. Department of Conservation report, New Zealand Threat Classification Series. p 16.
Graynoth E 1979. Effect of logging on stream environments and faunas in Nelson. New Zealand Journal of Marine and Freshwater Research 13: 79-109.
Graynoth E, Jellyman DJ, Bonnett M 2008. Spawning escapement of female longfin eels. New Zealand Fisheries Assessment Report. p 57.
Graynoth E, Niven K 2004. Habitat for female longfin eels in the West Coast and Southland, New Zealand. Department of Conservation, Science for Conservation report 238. p 33.
Hayes JW, Leathwick JR, Hanchet SM 1989. Fish distributions and their association with environmental factors in the Mokau River catchment, New Zealand. New Zealand Journal of Marine and Freshwater Research. 23: p 171–180.
Harding JS, Clapcott JE, Quinn JM, Hayes JW, Joy MK, Greig HS, James T, Beech M, Ozane R, Hay J, Meredith A, Boothroyd IKG 2009. Stream habitat assessment protocols for wadeable rivers and streams of New Zealand. University of Canterbury Press, Christchurch. 133 p.

CAWTHRON INSTITUTE | REPORT NO. 2587 MAY 2015
41
Hicks BJ, McCaughan HMC 1997. Land use, associated eel production, and abundance of fish and crayfish in streams in Waikato. New Zealand Journal of Marine and Freshwater Research 31: 635-650.
Holmes R, Goodwin E, Hayes JW 2013. Development of a GIS-based index to assess riparian habitat quality in a dairy best practice catchment. Cawthron Report No. 2350. 32 p. plus appendices.
Holmes R, Hayes JW 2011. Broad-scale Trout Habitat Mapping for Streams (Using Aerial Photography and GIS). Cawthron Report. No. 1979. 40 p.
Holmes R, Megan W, Hayes JW 2012 Broad-scale Trout Habitat Mapping in a Best Practice Dairy Catchment. Cawthron Report. No 1979. 40 p.
Hoyle SD, Jellyman DJ 2002. Longfin eels need reserves: modelling the effects of commercial harvest on stocks of New Zealand eels. New Zealand Journal of Marine and Freshwater Research 53:887-895
Jellyman DJ 2003. The distribution and biology of the South Pacific species of Anguilla. In: Eel Biology, p 275 – 292. Eds K. Aida, K. Tsukamoto, K. Yamauchi. Springer, Tokyo. p 497.
Jellyman DJ 2007. Status of New Zealand fresh-water eel stocks and management initiatives. – ICES Journal of Marine Science, 64: 1379–1386
Jellyman DJ 2009. Forty years on – the impact of commercial fishing on stocks of New Zealand freshwater eels. In: Casselman, J. M., Cairns, D. K (Eds). Eels at the Edge: Science, Status, and Conservation Concerns. American Fisheries Society Symposium 58. pp. 37-56.
Jellyman DJ 2010. Diet of two New Zealand species of freshwater eel (Anguilla spp.) in Lake Pounui, New Zealand. New Zealand Journal of Marine and Freshwater Research. 23: p 1-10.
Jellyman DJ 2012. The status of longfin eels in New Zealand—an overview of stocks and harvest. NIWA client report (CHC2012-006), prepared for the Parliamentary Commissioner for the Environment. p 73.
Jellyman DJ, Tsukamoto K 2005. Swimming depths of offshore migrating longfin eels Anguilla dieffenbachii. Marine Ecology Progress Series 286: 261-267.
Jellyman DJ, Graynoth E, Francis RICC, Chisnall BL, Beentjes MP 2000. A review of evidence for a decline in the abundance of longfin eels (Anguilla Dieffenbachii). . NIWA client report (EEL9802), prepared for the Ministry of Fisheries. p 8.
Jowett IG, Richardson J, Boubée JAT 2009. Effects of riparian manipulation on stream communities in small streams: Two case studies. New Zealand Journal of Marine and Freshwater Research. 43: p 763-774.

MAY 2015 REPORT NO. 2587 | CAWTHRON INSTITUTE
42
Jowett IG, Richardson J 1995. Habitat preferences of common, riverine New Zealand native fishes and implications for flow management. New Zealand Journal of Marine and Freshwater Research. 29: p 13–23.
Jowett IG, Richardson J 2008.Habitat use by New Zealand fish and habitat suitability models. NIWA science and technology series No. 55. p 148.
Jowett IG, Richardson J, McDowall RM 1996. Relative effects of in-stream habitat and land use on fish distribution in the tributaries of the Grey River, New Zealand. New Zealand Journal of Marine and Freshwater Research. 30: 463–475.
Lyons J, Weigel BM, Paine LK, Undersander DJ 2000. Influence of intensive rotational grazing on bank erosion, fish habitat quality, and fish communities in south-western Wisconsin trout streams. Journal of Soil and Water Conservation. 55: 271-276.
Matthaei CD, Weller F, Kelly DW, Townsend CR 2006. Impacts of fine sediment addition to tussock, pasture, dairy and deer farming streams in New Zealand. Freshwater Biology 51: 2154–2172.
McDowall RM 1990. New Zealand freshwater fishes: a natural history and guide. Heinemann-Reed, Auckland. p 553.
McDowall RM 2011. Ikawai. Freshwater fishes in Māori culture and economy. Canterbury University Press, Christchurch, New Zealand. 832p.
McDowell RW, Norris M, Cox N 2013. Waituna sediment fingerprinting study. Agresearch Report No. RE500/2013/136. 30 p. plus appendices.
Manukau N 2014. Waikato river fisheries bylaws for the Waikato Tainui fisheries area. Waikato Raupatu River Trust report prepared on behalf of Waikato Tainui Te Kauhanganui Incorporated. 18 p.
Parliamentary Commissioner for the Environment (PCE) 2013. On a pathway to extinction? An investigation into the status and management of the longfin eel. Parliamentary Commissioner for the Environment, Wellington.
Quinn JM, Cooper AB, Stroud MJ, Burrell GP 1997. Shade effects on stream periphyton and invertebrates: an experiment in stream channels. New Zealand Journal of Marine and Freshwater Research 31 (5): 665-683.
Quinn JM 2009. Riparian Management Classification Reference Manual. NIWA client report prepared for Environment Canterbury. no HAM2009-072. 60 p.
Quinn JM, Williamson RB, Smith RK, Vickers ML 1992. Effects of riparian grazing and channelisation on streams in Southland, New Zealand. 2. Benthic invertebrates. New Zealand Journal of Marine and Freshwater Research. 26: 259-273.
Raleigh RF, Zuckerman LD, Nelson PC. 1986. Habitat suitability index models and in-stream flow suitability curves: brown trout, revised (Modified in RYHABSIM). Prepared for U.S. Fish and Wildlife Service.
CAWTHRON INSTITUTE | REPORT NO. 2587 MAY 2015
43
Riddell JM, Watson NRN, Davis SF 1988. Fisheries investigations of the Ashers-Waituna, Benhar and Hawkdun lignite deposit areas. New Zealand Freshwater Fisheries Report. No. 94. 207 p. plus appendices.
Robertson B, Stevens L, Schallenberg M, Robertson H, Hamill K, Hicks A, Hayward S, Kitson J, Larkin G, Meijer K, Jenkins C, Whaanga D. 2011. Interim recommendations to reduce the risk of the Waituna Lagoon flipping to an algal dominated state. Report prepared for Environment Southland by the Lagoon Technical Group (LTG). 19 p. plus appendices.
Rutherford JC, Blackett C, Saito L, Davies-Colley RJ 1997. Predicting the effects of shade on water temperature in small streams. New Zealand Journal of Marine and Freshwater Research 31 (5): 707-721.
Sagar PM, Glover GJ 1998. Diel feeding and pray selection of three size classes of shortfin eel (Anguilla australis) in New Zealand. Marine and Freshwater Research. 49: 421–428.
Stevens L, Robertson B 2007. Waituna Lagoon 2007 Ecological vulnerability assessment and monitoring recommendations. Wriggle Limited Report, prepared for Environment Southland. 25 p. plus appendices.
Sutherland AB, Meyer JL, Gardiner EP 2002. Effects of land cover on sediment regime and fish assemblage structure in four southern Appalachian streams. Freshwater Biology 47 (9): 1791-1805.
Thompson RM, Rider GR 2003. Waituna Lagoon: summary of existing knowledge and identification of knowledge gaps. Science for Conservation 215. Wellington: Department of Conservation. 30p. plus appendices.
Tockner K, Stanford JA. 2002. Riverine flood plains: present state and future
trends. Environmental Conservation. 29: 308-330.
Trimble SW, Mendel AC 1995. The cow as a geomorphic agent—A critical review. Geomorphology. 13: 233-253.
Walker AM 2014. EU eeliad: anguillid eels: conserving a global fishery. Ecology of Freshwater Fish. 23: 1-1.
Watene EM, Boubee JAT 2005. Selective opening of hydroelectric dam spillway gates for downstream migrant eels in New Zealand. Fisheries Management and Ecology. 12: 69-75.
Waters TF 1995. Sediment in streams: sources, biological effects and control.
American Fisheries Society: Monograph 7. 251 p.
Wentworth CK 1922. A scale of grade and class terms for clastic sediments. Journal of Geology 30: 377-392.
Wood PJ, Armitage PD 1997. Biological effects of fine sediment in the lotic environment. Environmental Management 21: 203–217.
MAY 2015 REPORT NO. 2587 | CAWTHRON INSTITUTE
44
Wood PJ, Armitage PD 1999. Sediment deposition in a small lowland stream – Management implications. Regulated Rivers-Research and Management 15: 199–210.

CAWTHRON INSTITUTE | REPORT NO. 2587 MAY 2015
45
7. APPENDICES
Appendix 1. Riparian survey field instructions including quick step list and an example of a completed section of the riparian survey. Contact the lead author for a full set of instructions and protocol sheets.
Stage one: riparian, land-use and contaminant source assessment field guide.
For hardcopy photographs, when possible trace around the habitat feature if it can be seen on the photo and attach the relevant code (see Tables 1 and 2 of the field guide). If the feature is too small to be seen on the photo, then place a point at its location and estimate its size (m2) and/or length (m). Note the land-use type: crop, sheep/beef cattle, dairy or other (specify)—record land-use type only at the start of the assessment or when it changes. Follow steps 1–7.
1. Trace along the wetted edge of the stream 2. Trace around and/or estimate the average width of the (fenced) riparian management
zone. Record the level of stock access within the riparian zone—no access, fenced with periodic/partial access, open access
3. Record the vegetation types within the riparian management zone (see veg. codes in Table 1)
4. Trace around or estimate the area (m2) of vegetation within 30 m of the stream edge—record vegetation type (see veg. codes in Table 1) estimate height of any trees to the nearest 5 m.
5. Note, trace around or estimate the area (m2) of any vegetation overhanging the stream edge (see Table 1)
6. Trace along the length, or estimate the area (if it is too small to be seen on the aerial photograph) of any significant potential sources of sediment (i.e. bank slumping or stock pugging (see Table 2)
7. Note any drains or tributaries and label type (e.g : small tributary, open drain, mole/tile). Record if the tributary/drain is fenced or not. Record other land-use features described in Table 2.
See Figure A1.1 below for an example of a completed section of mapped riparian habitat.

MAY 2015 REPORT NO. 2587 | CAWTHRON INSTITUTE
46
Figure A1.1. An example of a completed section of riparian habitat in Carran Creek (segment 1A). One of five aerial photographs at the 1:700 scale.

CAWTHRON INSTITUTE | REPORT NO. 2587 MAY 2015
47
Appendix 2. An in-stream survey sheet used to complete a 20 m sub-reach survey. Five continuous sub-reached are completed at each 100 m reach.
Stream: Site (20m sub-reach) number:
Date: Assessor team:
D/S Width (m):
D/S gps (true right): e n
Midpoint width (m)
U/S, Width (m):
U/S gps (true right):e n
% Mesohabitat types for 20m sub-reach:Riffle
Slow run Fast run Pool
% Area depths for 0m to 10m mark:0 – 0.3 m deep
0.3 – 0.5 m deep 0.5 – 1 m deep 1 m + deep
% Area depths for 10m to 20m mark: 0 – 0.3 m deep
0.3 – 0.5 m deep 0.5 – 1 m deep 1 m + deep
% Substrate Type for 20m sub-reach:Fine sed (<2mm)
Gravel (2 – 32mm)
Large gravel (32-64mm)
Small cobble (64-128mm)
Large cobble (128-256mm)
Boulder (>256mm)
Bed rock (continuous)
% Weed/macrophyte cover % Algal cover (include only filamentous or thick algal mat cover >3mm)
Shuffle test score (1-5scale):(in run or pool-tail/glide only)
Fish cover: Undercut bank - True Right bank (linear m of bank edge length – i.e. maximum of 20m) 0 – 0.3 m deep
0.3 – 0.5 m deep
0.5 – 1 m deep
1 m + deep
Undercut bank - True Left bank (linear m of bank edge length – i.e. maximum of 20m) 0 – 0.3 m deep
0.3 – 0.5 m deep
0.5 – 1 m deep
1 m + deep
Overhanging veg - True Right bank (linear m of bank edge – i.e. maximum of 20m) 0 – 0.3 m
0.3 – 0.5 m
0.5 – 1 m 1 m +
Overhanging veg - True Left bank (linear m of bank edge – i.e. maximum of 20m) 0 – 0.3 m
0.3 – 0.5 m
0.5 – 1 m 1 m +
Woody debris (m2) (include items >0.5m*0.3m)
Submerged branches (m2)
include items (>1m*0.3m)
Turbulence (m2)(Include if the stream bed is obscured and depth is >0.3m.)
Manmade cover (m2) (e.g. rip-rap, bridges, old tires)
Residual Pool depth (m): Comments Photo taken?
Deepest point depth
D/S Hydraulic control depth All sheet
fields completed?

MAY 2015 REPORT NO. 2587 | CAWTHRON INSTITUTE
48
Appendix 3. In-stream survey field instruction sheet. Contact the lead author for a full set of instructions and protocol sheets.
Stage two: in-stream assessment field guide
At downstream end of each 100 m reach, peg out a 20 m sub-reach at the start (0 m), midpoint (10 m) and endpoint (20 m). Work from downstream to upstream. Measure the wetted width at the start and end of each 20 m sub-reach (if the width changes by more than half of one of these measurements then take a midpoint width measurement as well). Record the GPS position (NZ map grid) on the true right bank (right-hand side looking downstream) at the start and end of each 20 m sub-reach. Fill out one in-stream field form for each 20 m sub-reach. Repeat 5 times to make up the 100 m reach. Follow steps 1–7 to fill out the in-stream field form:
1. Record the percent area cover of the meso-habitat type(s) present in the sub-reach - fast
run, slow run, riffle and pool. 2. Record the percent area of the following depth classes < 0.3 m, 0.3 m–0.5 m, 0.5 m–1 m
and > 1 m deep—split the percent area estimates of these depth categories into 10 m sections of the sub-reach as indicated on the field sheet.
3. Record the percent cover of the dominant substrate size classes within the areas of visible stream bed (i.e. stream bed that is not obscured by weed), see Table 2 for sediment codes, or ‘Sediment assessment method 1’ in the sediment assessment methods protocol. Estimate the percent cover of any macrophyte/weed beds. Estimate the percent cover of any thick (> 3 mm) algal mats or green filamentous algal mats greater than 2 mm long.
4. Estimate the percent cover, or area in m2 (depending in cover type), of any in-stream fish cover.
5. If a shallow run (< 1 m deep) or pool-tailout is present in the 20 m sub-reach then undertake a shuffle test assessment. See Sediment assessment method 5 in the Sediment Assessment Methods protocol.
6. Record the residual pool depth—measure the deepest point and shallowest point at the riffle crest downstream (see additional residual pool depth protocol sheet).
7. Check that you have completed all the fields in the field sheet.


![Coldwater fish in wadeable streams [chapter 8] - USDA Forest Service](https://img.pdfslide.net/doc/110x75/62039a9cda24ad121e4b556c/coldwater-fish-in-wadeable-streams-chapter-8-usda-forest-service.jpg)