Embed Size (px)
Citation preview
Rise of the Real-Time Traveler An exploration of trends and innovation in urban mobility
September 2015

Rise of the Real-time Traveler: An exploration of trends and innovation in urban mobility 1
Table of Contents
1 Executive Summary ............................................................................................................... 1
2 Rise of the Real-time Traveler: An Introduction ................................................................ 4
3 Driving Change ...................................................................................................................... 5 3.1 The Status Quo: Tallying Transportation’s Costs.................................................................... 5 3.2 A Demographic Divide? .............................................................................................................. 6
3.2.1 Changing Travel Trends ............................................................................................................. 6 3.2.2 Changing Preferences ................................................................................................................. 7
3.3 Enabling Technologies ............................................................................................................... 8
4 Emerging Markets ................................................................................................................. 9 4.1 From Ownership to Access: Shared-use Mobility .................................................................. 10 4.2 Carsharing .................................................................................................................................. 10
4.2.1 Environmental Impact of Carsharing ....................................................................................... 11 4.3 On-demand Ride Sourcing & Ridesharing ............................................................................. 12
4.3.1 Environmental Impact of On-demand Ride Sourcing and Ridesharing ..................................... 12 4.4 Growth Outlook and Implications for the Automotive Industry ........................................... 13 4.5 Designing the Traveler’s Trip .................................................................................................. 14
4.5.1 Real-time Information .............................................................................................................. 14 4.5.2 Integrated Trip Planning and Payment ..................................................................................... 15
4.6 Influencing Behavior and Outcomes: Considerations in Designing the Traveler’s Trip ... 15
5 Real-time Travelers: Rob, Terri, and Maria ....................................................................... 16 5.1 Rob: “The career-driven commuter” ....................................................................................... 16 5.2 Terri: “The Bohemian Boomer” .............................................................................................. 18 5.3 Maria: “The Cosmopolitan Youth” .......................................................................................... 20
6 Conclusions .......................................................................................................................... 22
7 Authors and Acknowledgements ........................................................................................ 24
8 About the Intelligent Transportation Society of America (ITS America) ....................... 24
9 Appendix ............................................................................................................................... 25 9.1.1 Appendix 1: Definitions of common shared-use mobility models ............................................ 25 9.1.2 Appendix 2: Framework for cost-benefit analysis of different mobility modes ......................... 26

A Note from AT&T At AT&T, we’ve been working with auto manufacturers for years to help improve vehicle safety and performance by integrating wireless connectivity. These efforts have resulted in exciting next-generation voice solutions, enhanced diagnostics and maintenance capabilities, on-board infotainment and more. Still, we recognize that larger trends are fundamentally changing how people get from Point A to Point B. As part of our ongoing commitment to create a more mobilized world, we want to understand these trends and maximize the opportunities they create. This report, Rise of the Real-Time Traveler, starts by exploring developments such as changing demographics, urbanization and the continuing integration of technology in our daily lives. The report shines a light on how these shifts impact travelers, from ridesharing and trip planning to automotive design. We embarked on this study to better understand the social and environmental effects wireless technology has on transportation. While the full impacts are still unfolding, this research will guide our continuing efforts. We are excited to use the power of our network to build a better tomorrow, and we will continue to work with automobile and technology leaders to create and support more efficient transportation services.
Sincerely,
Chris Penrose Senior Vice President, Internet of Things (IoT) Solutions, AT&T
Charlene Lake Senior Vice President, Public Affairs & Chief Sustainability Officer, AT&T
Rise of the Real-time Traveler: An exploration of trends and innovation in urban mobility 1
1 Executive Summary Each day brings new headlines heralding the arrival of a new era in transportation, one in which the individual is moving beyond the 20th century paradigm of car ownership and into a marketplace for mobility as an on-demand service. This means the individual can now access transportation modes – automobile, bicycle, shuttle, or other mode – on an “as needed” basis, forgoing ownership in favor of collaborative consumption. Connected consumers, connected cars, and the platforms that power them mean individual travelers have new levels of transportation choice, greater insight into the real-time benefits and costs associated with these choices, and an enhanced engagement with their decision making that can provide new levers for improving individual outcomes and overall system performance. This paper looks behind the headlines to understand what is driving this new era in transportation and how it is unfolding. It scans and assesses select mobility trends and offerings, before examining the transformation in transportation through the lens of three fictional individuals. These “real-time travelers” are stock characters representative of real travelers who live in different cities with different transportation options, and who have different preferences and needs. This approach delivers a snapshot of how an increasingly information- and choice-rich transportation system can affect daily lives and transportation decision making. It also serves to illuminate how current and future mobility innovations can be integrated and leveraged for a more inclusive, sustainable and resilient transportation system. The paper first examines the forces of change in transportation, the growth in shared-use mobility, and the progress toward designing the traveler’s entire trip such that it integrates trip planning and payment. It then discusses its “real-time travelers” to surface insight and ideas as further input to the ongoing transformation in transportation. Driving Change
Converging economic, demographic and technological forces are creating the need for an on-demand mobility market as well as the feasibility of offering and participating in it. The transportation status quo is untenable. By the numbers – whether the annual economic cost of congestion ($121 billion),1 the health cost of air pollution (200,000 early deaths per year),2 or the strain on public and personal finances – it is not surprising that both consumers and providers of transportation are ready to embrace change. Is there a demographic divide? Changes in the travel patterns and preferences of various demographic groups are feeding and reinforcing the inevitability of change. Americans of all ages are driving less, but the drop in per capita vehicle miles traveled is especially pronounced among the 73 million young adults aged 18 to 34, who are known as “millennials.” Surveys of millennials reveal a preference for a less auto dependent lifestyle, and there is evidence to suggest that this preference will persist even as millennials enter new financial and life circumstances. However, the focus on millennials tends to obscure the values and preferences they share with other demographic groups, which are not insignificant. The democratization of the enabling technologies is key. The transformation in transportation coincides with the speed and ubiquity with which the wireless Internet, social networking sites, smartphones, consumer
1 “Beyond Traffic: Trends and Choices 2045,” U.S. Department of Transportation, 2015, http://www.dot.gov/sites/dot.gov/files/docs/Draft_Beyond_Traffic_Framework.pdf. 2 Fabio Caiazzo et al., “Air pollution and early deaths in the United States. Part I: Quantifying the impact of major sectors in 2005,” Atmosphere Environment 79 (2013): 198-208, http://dx.doi.org/10.1016/j.atmosenv.2013.05.081.

Rise of the Real-time Traveler: An exploration of trends and innovation in urban mobility 2
GPS and mobile applications have penetrated consumers’ daily lives. The immediacy, trust and peer review that are the hallmarks of social media and social networking are now fundamental to many digital interactions across industries. They also play an increasingly central role in new transportation offerings. From Ownership to Access: Shared-use Mobility
The shared-use mobility market is one of the highest-profile and most dynamic sectors of the sharing economy, which seeks more efficient utilization and monetization of assets. Cars, which sit idle 95 percent of the time and cost owners an average of $8,876 a year, are an obvious choice. To examine the scope and impact of the growth in shared-use mobility, this paper focuses on carsharing and on-demand ride sourcing. Carsharing underwent a digital makeover. Carsharing is not a new concept, but its exponential growth in the last five years suggests that advances in technology have helped serve and expand the market. Digital technology has made the process of reserving, paying for, and locating cars easier, while digital unlocking and verification services have eliminated the hassle of keys. Customer experience has improved, the system has gained in efficiency, and membership has grown to over 1.3 million members in the United States. The one-way carsharing model could further accelerate growth and the peer-to-peer carsharing model is also taking hold in select markets. Can the on-demand ride sourcing providers remake ridesharing? The closest the shared-use mobility market comes to capturing the excess capacity of already owned and underused assets is in the on-demand ride sourcing market, which is dominated by Uber and Lyft. The backbone of this model is the car owners’ economic incentive to participate, and the services’ growth has been swift, expansive and not without controversy. Whether or not they can grow and scale their on-demand ride sharing offerings merits close observation since ridesharing can offer profound environmental and congestion benefits. More research on the environmental impacts of shared-use mobility is needed. Traditional carsharing programs are believed to result in net benefits to the environment, reducing overall emissions and removing vehicles from the road. Research into the environmental impacts of other models of carsharing and on-demand ride sourcing is more limited at present. A greater understanding of any induced travel effects and how these services impact transit would be valuable to integrating and improving the transportation system. Designing the Traveler’s Trip
The growth in shared-use mobility means more choice for travelers. But more choice means more variables and more potential decisions to make. Realizing the ability of individuals to take a trip that meets their time, cost or experience parameters, and the ability of the system to dynamically manage those trips is contingent upon progress in two important areas: the availability and use of real-time information, and the options for integrated trip planning and payment. Taking transit and driving is more personalized and participatory than ever before. Studies show that real-time information improves the entire transit experience, while traffic and navigation applications are now integral to the driving experience. Applications increasingly incorporate crowdsourced data in addition to official data. The result is a dynamic, collaborative environment of real-time information flow between travelers. A seamless integrated trip planning and payment experience is not yet available for most travelers. Progress on this front is important as it could provide new inflection points for individuals to optimize their own behavior and for the system to influence or respond to their trip making decisions. Real-time Travelers

Rise of the Real-time Traveler: An exploration of trends and innovation in urban mobility 3
A traveler’s individual choices are at the heart of the transportation system. Whether an individual drives to work alone, joins a carsharing program and sheds a vehicle, or is a multimodal millennial in a dense, urban environment, the ability to make informed transportation decisions and access expanding options is at their fingertips. In this scan of the “real-time” travelers’ needs and options, several themes emerge that merit further discussion, research and collaboration: Daily commuting behavior is predictable and offers opportunities for greater optimization,
such as incentivizing peak shifting and mode shifting by applying concepts from behavioral economics and gamification.
Much more collaboration is needed between the public and private sectors to deliver the reliability, integration, and quality of service needed for more households to view mobility on-demand services as an alternative to car ownership.
Stakeholders from outside the transportation industry have an important role to play in facilitating better system outcomes. For example, large employers could focus on transportation demand management strategies or policies that improve employees’ transportation choices. The technology now available can make this more effective, and easier to implement and measure than ever before.
What nudges people into different transportation modes or changes their transportation patterns is under researched. With the new tools to capture travelers’ data, this should be an area of increasing experimentation and focus.
Looking Forward
The redefinition of car ownership may remake the car itself. If car sharing fleets continue to grow globally, the annual demand for vehicles could decline, perhaps by a significant percentage. Dense, urban markets with congested roads and valuable real estate that is presently commandeered for parking would be better served by smaller, lighter vehicles. Since the cars would be in use more often, these fleets would turn over more quickly. This presents a recurring opportunity to incorporate more advanced, sustainable technology. It also makes it more financially feasible since the cost of ownership is either spread over many owners or recouped through the owner’s participation in a shared-use model, like on-demand ride sourcing. Technology has enabled shared-use mobility to flourish and fulfill various market needs. In light of certain transportation and demographic trends, as well as the preferences of key market segments, the demand for mobility as a service is not likely to dissipate. Physical and virtual integration of these new shared-use mobility modes and existing transportation options is the next step. Encouraging this – through policy, technology and business model innovation, as well as the individual exercise of choice – is essential to harnessing this transformation, and using it to build a more inclusive and sustainable transportation system.

Rise of the Real-time Traveler: An exploration of trends and innovation in urban mobility 4
2 Rise of the Real-time Traveler: An Introduction It’s Rob’s lunch break and he’s thinking about what time he should leave work that evening. He pulls out his smartphone, brings up a mobile application and decides he’ll stay 15 minutes later than usual to avoid traffic. The application also recommends an alternative route and predicts that he’ll save about 10 minutes of travel time on his commute home. Rob’s pleased, reserves the route and, in return for shifting his commute time, collects points toward a gift card at his local coffee shop. Terri is about to leave her job at a university to meet a friend for dinner. She pulls out her smartphone, brings up a mobile application, and evaluates her options for getting to the restaurant. It’s raining so she’s not too excited about picking up a bike from the nearest bikeshare station to get to the bus stop. She opts instead to use a one-way carshare vehicle that’s also nearby. Since she and her husband got rid of their second car, they use a carsharing program and other mobility-on-demand services. She drives to the restaurant, enjoys dinner and a glass of wine, and heads home via an on-demand rideshare later that evening. Maria is standing on a crowded bus on her way home from work. She decides to get off one stop early and walk the rest of the way. She knows this decision will give her enough points to put her ahead of her friends in a city-wide virtual game they are playing that rewards and incentivizes users for travel behavior that relieves network congestion. Maria checks the leaderboard on her phone and sees she’s also accrued extra points for “healthy behavior.” Tomorrow, Maria will visit a friend that moved to a nearby suburb, and even though Maria’s not an avid driver, she will find and choose an available car in her neighborhood, unlock it and head out when she is ready to hit the road. These three fictional individuals are not a fantastical foray into the future of transportation. Rather, the information they have at their disposal and the decisions they can make reflect a transformation in transportation that is already underway. This transformation provides travelers like Rob, Terri, and Maria with new levels of choice for how they can make their trips, greater insight into the real-time benefits and costs associated with various trips, and an enhanced engagement with their trip making that can provide new levers for improving individual outcomes and overall system performance. Each day brings new headlines heralding the arrival of a new era in transportation, one in which the individual can move beyond the 20th century paradigm of car ownership and into a marketplace for mobility as an on-demand service. Even the automakers are redefining themselves – and not just rhetorically – for this transformation. Daimler AG and BMW’s carsharing programs have approximately one-quarter of the North American carsharing membership and vehicle fleet.3 On-demand ride sourcing companies like Uber say they complete one million trips worldwide every day.4 And transit ridership in the US is at an all-time high.5 This paper will look behind the headlines to understand what’s driving this new era in transportation and how this transformation is unfolding. It will examine what this means for individuals like Rob, Terri, and Maria – stock characters representative of real travelers who live in different cities with different transportation options, and have different preferences and needs. From there, the paper will review the challenges and opportunities in further enabling or expanding the existing choice set of travelers to make real-time transportation decisions. The intent is to provide a scan and assessment of mobility trends and offerings, but also look forward to an integrated transportation system in which these new services can be leveraged for more inclusive, sustainable and resilient outcomes.
3 Adam Cohen and Susan Shaheen. “Innovative Mobility Carsharing Outlook: Carsharing Market Overview, Analysis and Trends,” Transportation Sustainability Research Center, UC-Berkeley, Volume 3, Issue 2, (Fall 2014). 4 “Our commitment to safety,” Uber, December 17, 2014, http://blog.uber.com/safety. 5 “Record 10.8 Billion Trips Taken On U.S. Public Transportation In 2014,” American Public Transportation Association, March 9, 2015, http://www.apta.com/mediacenter/pressreleases/2015/Pages/150309_Ridership.aspx.

Rise of the Real-time Traveler: An exploration of trends and innovation in urban mobility 5
3 Driving Change A convergence of economic, demographic, and technological forces has created both the need for an on-demand mobility market as well as the feasibility of offering and participating in it. To understand the recent exponential growth in shared-use mobility modes as well as progress on other transportation innovations, like integrated trip planning and payment, it is first useful to examine today’s transportation status quo, demographic preferences, and the democratization of the enabling technologies.
3.1 The Status Quo: Tallying Transportation’s Costs From gridlock on the highway to the impact on household pocketbooks, the challenges and stresses on the American transportation system continue to mount. Each year, the average American spends over 40 hours sitting in traffic. The U.S. Department of Transportation estimates the annual financial cost of this congestion at $121 billion.6 The average commute is nearly 30 minutes long, and for more than two million people it takes almost an hour to get to work.7 In large- and medium-sized urban areas, the yearly hours of delay per auto commuter tripled between 1982 and 2010. People in major metropolitan areas also live farther from their jobs. The Brookings Institution found that between 2000 and 2012, the number of jobs within a normal commuting distance of people living in metro areas dropped by 7 percent. This problem is especially acute for minorities and the poor, who are hit hardest by commuting and housing costs.8 Air pollution is also a serious public health and environmental problem. Researchers at MIT found that air pollution causes about 200,000 early deaths each year and that emissions from road transportation are the most significant contributor.9 Public revenues are in short supply for maintenance and capacity expansion that is sorely needed. Sixty-five percent of US roads are rated in less than good condition, 25 percent of bridges need serious repair, and 45 percent of Americans lack access to transit.10 At the household level, Americans spend almost 17 percent of their budgets on transportation – the second largest expense after housing.11 For Americans in the lowest 20 percent of income earners, the burden is even greater. Transportation costs account for approximately 32 percent of their after-tax income. For most Americans, the car is the dominant mode of transportation and owning one is a necessity for access to jobs, housing, and recreational activities. Figure 1 provides a snapshot of the breakdown by mode for commute trips in three metropolitan statistical areas in the United States.12
6 “Beyond Traffic: Trends and Choices 2045,” U.S. Department of Transportation, 2015, http://www.dot.gov/sites/dot.gov/files/docs/Draft_Beyond_Traffic_Framework.pdf. 7 Melanie A. Rapino and Alison K. Fields, “Mega Commuting in the U.S.: Time and Distance in Defining Long Commutes Using the 2006-2010 American Community Survey,” as cited in Lindsey Hallock and Jeff Inglis, “The Innovative Transportation Index,” Frontier Group and U.S. PIRG Education Fund, February 2015. 8 “The growing distance between people and jobs in metropolitan America,” Brookings Institution, 2015, http://www.brookings.edu/research/reports2/2015/03/24-people-jobs-distance-metropolitan-areas-kneebone-holmes. 9 Fabio Caiazzo et al., “Air pollution and early deaths in the United States. Part I: Quantifying the impact of major sectors in 2005,” Atmosphere Environment 79 (2013): 198-208, http://dx.doi.org/10.1016/j.atmosenv.2013.05.081. 10 Beyond Traffic. 11 “Table 1110. Deciles of income before taxes: Annual expenditure means, shares, standard errors, and coefficient of variation, Consumer Expenditure Survey, 3rd quarter 2013 through 2nd quarter 2014”, Bureau of Labor Statistics, accessed April 21, 2015, http://www.bls.gov/cex/22014/midyear/decile.pdf. 12 “B08301: MEANS OF TRANSPORTATION TO WORK - Universe: Workers 16 years and over,” 2009-2013 American Community Survey, U.S. Census Bureau.

Rise of the Real-time Traveler: An exploration of trends and innovation in urban mobility 6
Figure 1: Commute by Modal Share for Three U.S. Cities
Car ownership is estimated to cost an average of $8,876 a year and this estimate captures only those costs directly borne by the owner, such as maintenance or fuel purchases.13 It does not account for the external costs associated with cars, such as greenhouse gas (GHG) emissions or congestion costs imposed on other road users. Whether the accounting captures direct or indirect costs, the price tag for cars is steep – especially when it is estimated that cars sit idle 95 percent of the time and only 17 percent of household vehicles in the US are in use at any given time. By the numbers – whether the economic cost of congestion, the health cost of air pollution, or the strain on public and personal finances – it is not surprising that both consumers and providers of transportation are embracing change.
3.2 A Demographic Divide? Not only does the cost trajectory of today’s transportation status quo pose formidable challenges, but changes in the travel patterns and preferences of various demographics also feed and reinforce the inevitability of change.
3.2.1 Changing Travel Trends For decades, the automobile occupied a prominent position in the American psyche. Obtaining a driver’s license was a rite of passage into adulthood, while car ownership meant the American family could decamp from crowded cities to the space and promise of the American suburbs. Owning a car was a ticket to freedom and prosperity, and the number of vehicles and miles driven on American roads grew steadily – until the turn of the century. Starting in 2000, the growth in per capita vehicle miles traveled, a measure of how much people drive, began to flatten. After peaking in 2004 it began to drop. By 2011, the average American was driving six percent fewer miles per year than in 2004. Americans’ total vehicle miles traveled peaked in 2007 and has since fallen 2.3 percent.14 This trend is even more pronounced among the 73 million young adults between 18 and 34 years old, who are also known as the millennial generation. Data from the National Household Travel Survey shows that 13 “Owning and operating your vehicle just got a little cheaper according to AAA’s 2014 ‘Your Driving Costs’ Study,” AAA, accessed April 21, 2015, http://newsroom.aaa.com/2014/05/owning-and-operating-your-vehicle-just-got-a-little-cheaper-aaas-2014-your-driving-costs-study/. 14 Phineas Baxandall, Benjamin Davis, and Tony Dutzik, “Transportation and the New Generation: Why Young People are Driving Less and What it Means for Transportation Policy,” Frontier Group and U.S. PIRG Education Fund, (April 2012): 8.

Rise of the Real-time Traveler: An exploration of trends and innovation in urban mobility 7
younger drivers take both fewer and shorter trips: from 2001 to 2009, the average number of per capita miles traveled dropped by 23 percent.15 Furthermore, fewer young people are learning how to drive. The percentage of 14 to 34 year olds without drivers’ licenses increased from 21 percent in 2000 to 26 percent in 2010. This drop is not unique to the United States. A 2011 study found that seven other developed countries in Europe, Asia, and North America also saw significant decreases in the percentage of young people obtaining driver’s licenses.16 The picture of statistical decline or stagnation is almost completely reversed when examining transportation modes other than the automobile. Data from the Bureau of Transportation Statistics shows that heavy rail (subway) and light rail ridership has steadily increased across the US in the last decade, while bus ridership rates have remained constant over the same time frame.17 The 10.8 billion transit rides in 2014 was an all-time US record. A closer look at the data reveals that young people play an important role in the increase in transit usage. Sixty percent of the increase in annual passenger miles traveled on transit between 2001 and 2009 came from the 16- to 34-year-old demographic. The shift is not confined to transit. Compared to their peers a decade earlier, 16 to 34 years olds in 2009 took 24 percent more bike trips and walked to destinations 16 percent more frequently.18
3.2.2 Changing Preferences The data underscores the stated preferences of this generation as captured in surveys exploring their attitudes toward mobility. A 2014 survey by The Rockefeller Foundation and Transportation for America found that 66 percent of millennials ranked high quality transportation as one of the top three criteria they would weigh in deciding where to live. Forty-seven percent of Millennials said they would seriously consider giving up their car if they could rely on a range of transportation options. More than half would even consider moving to a different city if it offered access to a broader set of transportation options.19 This has not gone unnoticed by real estate developers and investors – the market now speaks of the rise of 18-hour cities (Charlotte, Austin, or Houston) that are replicating the walkability and transit oriented development of their 24-hour counterparts (New York City, San Francisco, and Washington, DC).20 Although each successive survey appears to confirm a desire among millennials to live in communities that provide access to a range of transportation options, there is discussion as to why this preference appears so strong and speculation as to whether or not it reflects a fundamental, permanent change. Certainly, millennials face financial challenges that can put owning and operating a car out of immediate reach. According to the Project on Student Loan Debt, seven out of ten college seniors who graduated in 2013 had student loan debt averaging $28,400.21 A Wells Fargo survey found that 47 percent of millennials surveyed reported allocating 50 percent or more of their paychecks to paying down debt.22 Not surprisingly, 80 percent of millennials in Zipcar’s annual survey reported that the high cost of gasoline, parking, and maintenance made owning a car difficult.23 But while economic pragmatism may rule the calculus of some 15 Baxandall, 1. 16 Baxandall, 9. 17 Baxandall, 10. 18 Baxandall, 9. 19 “Public Transportation Shapes Where Millennials Decide to Live,” The Rockefeller Foundation, April 23, 2014, https://www.rockefellerfoundation.org/blog/public-transportation-shapes-where/. 20 “Real-Estate Investors: Pay Attention to 18-Hour Cities, Millennials, and Infrastructure in 2015,” Mobility Lab, December 9, 2014 http://mobilitylab.org/2014/12/09/real-estate-investors-pay-attention-to-18-hour-cities-millennials-and-infrastructure-in-2015/#sthash.nHqM95xj.dpuf. 21 Project on Student Loan Debt, accessed April 21, 2015, http://ticas.org/posd/map-state-data-2014. 22 “Eight in Ten Millennials Say Great Recession Taught Them to Save ‘Now,’ Wells Fargo Survey Finds,” June 10, 2014, https://www.wellsfargo.com/press/2014/20140610_millennials. 23“Millennials and Driving: A Survey Commissioned by Zipcar,” February 2013, http://www.slideshare.net/Zipcar_Inc/millennial-slide-share-final-16812323.

Rise of the Real-time Traveler: An exploration of trends and innovation in urban mobility 8
millennials, it alone does not explain the stated appeal of alternative transportation modes, the rise in their usage and the decline in driving. For example, young people who lived in households with annual incomes above $70,000 increased their use of public transit by 100 percent, biking by 122 percent, and walking by 37 percent from 2001 to 2009.24 It is also suggested that millennials may age out of their preference for alternative transportation modes and that changing life circumstances, like having children, will engender a shift in their transportation habits. A 2014 nationwide survey examined transit usage among parents of school-aged children to determine whether people in similar life circumstances but of different generations exhibit different travel behavior. The results revealed that millennial parents were far more likely to use transit than their older counterparts and this was true at all income levels.25 This indicates that differences in travel habits and preferences between millennials and previous generations are likely to persist. Results of the 2015 Zipcar survey show that millennials are deeply attached to their mobile phones. Millennials believe losing their mobile phone would have a greater negative impact on their lives than losing their car, and they also rank losing their computer/tablet as more disruptive than losing their car.26 They like to “socialize” via mobile technology while making a trip and prefer transportation options that let them do so. Concern for the environment plays a less important role in millennials’ transportation choices. An American Public Transportation Association Survey found that millennials ranked financial, convenience, and exercise reasons ahead of environmental concerns as motivating factors in their transportation decisions.27 The differences between the travel behavior and preferences of millennials and those of other generations are significant. But training the spotlight on millennials has obscured the values and preferences they share with other demographic groups. A survey by the American Planning Association found that fewer than 10 percent of members of the millennial, generation X, or baby boomer generations want to live in an auto-dependent suburb in the future and all prefer greater mobility options, especially walkability.28 All generations also use social networking technology as a substitute for a physical trip. The Zipcar 2013 annual survey reported that 43 percent of 18-34 year olds agreed they “sometimes choose to spend time with friends online instead of driving to see them.” Forty-six percent of the 35-44 year olds also agreed with the statement. For its 2015 survey, Zipcar segmented respondents by geographic location – urban, suburban, or rural. This revealed that “urbanites” of all ages have very similar preferences, habits, and attitudes to millennials on technology, transportation, and lifestyle.
3.3 Enabling Technologies The transformation in transportation that provides consumers with new options and information for making their daily trips coincides with the speed and ubiquity with which the wireless Internet, social networking sites, smartphones, consumer GPS and mobile applications have penetrated consumers’ daily lives. As of January 2014, 87 percent of American adults reported using the Internet regularly, up from 66 percent in 2005.29 Social media and social networking sites like Twitter and Facebook that barely existed a decade ago
24 Baxandall, 26. 25 “Who’s on Board 2014: Mobility Attitudes Survey,” TransitCenter, September 2014, http://transitcenter.org/ourwork/mobility-attitudes-survey/. 26 “Millennial is a state of mind: Zipcar 2015 Millennial Survey Results,” Zipcar, http://www.slideshare.net/Zipcar_PR/zipcar2015-millennialmind-slideshare/1. 27 “Millennials and Mobility: Understanding the Millennial Mindset, “ American Public Transportation Association, http://www.apta.com/resources/reportsandpublications/Documents/APTA-Millennials-and-Mobility.pdf. 28 “Investing in place for economic growth and competitiveness a research summary,” American Planning Association, May 2014, https://www.planning.org/policy/polls/investing/pdf/pollinvestingreport.pdf. 29 “Internet use over time,” Pew Research Center, accessed April 2, 2015, http://www.pewinternet.org/data-trend/internet-use/internet-use-over-time/.

Rise of the Real-time Traveler: An exploration of trends and innovation in urban mobility 9
have grown exponentially – 74 percent of all Americans and 90 percent of the 18- to 29-year-old age group report using at least one platform.30 The implications for transportation are even more evident when smartphone penetration and mobile application usage are considered. According to the Pew Research Center, 64 percent of American adults owned a smartphone in 2015 – a 29-percentage point increase in four years. Smartphone ownership levels reached 85 percent among youth (18-29) and 84 percent of those living in households with annual income above $75,000. About 15 percent of Americans are “smartphone dependent,” which means they have limited ways to get online other than through their smartphone. The smartphone dependent population tends to be younger, minorities, or lower income. Although only 27 percent of American adults over the age of 65 owned a smartphone as of January 2015, this was an 8-percentage point year-over-year increase.31 Americans now spend the majority of their time online in mobile applications. Mobile application usage accounted for 52 percent of digital media time in 2014. Seven out of eight minutes spent on a mobile device is spent using a mobile application.32 Smartphones are also location aware and many Americans use them to navigate roads and cities, and to access transportation options: 67 percent of smartphone owners report using their phones at least occasionally for navigation while
driving, while 31 percent report doing so frequently; 25 percent of smartphone owners use their phone at least occasionally to get public transit
information, with 10 percent doing frequently; and 11 percent of smartphone owners report using their smartphone to reserve a taxi or car service, with
only 4 percent reporting that they do so frequently.33 The huge volumes of data that are created and captured on mobile devices has upended or reshaped many industries. Whether it is retailers offering personalized shopping recommendations or financial institutions texting customers their account balances, today’s consumers are increasingly conditioned to not just demand, but expect that across industries and technology platforms a personalized, instantaneous, and intuitive experience is available to facilitate their decision making. The immediacy, trust and peer review that are the hallmarks of social media and social networking are now fundamental to many digital interactions. They play an increasingly central role in how transportation is transforming.
4 Emerging Markets These changes – in American driving patterns, in travel preferences, and in how pervasive digital technology has become – combine to challenge the status quo and consumers’ acquiescence to it. This interplay means that travelers like Rob, who drives to work, or Terri, who uses carsharing, or Maria, who is a multimodal millennial, possess an expanding choice set and the ability to make informed decisions right on their dashboards or smartphones. Before diving into each traveler’s specific transportation options, it is useful to first examine how the transformation in transportation is proceeding on two main fronts: first, the growth in shared-use mobility, and second, the progress toward designing the traveler’s entire trip, and integrating trip planning and payment. 30 “Social Networking Fact Sheet,” Pew Research Center, accessed April 2, 2015, http://www.pewinternet.org/fact-sheets/social-networking-fact-sheet/. 31 “US Smartphone Use in 2015,” Pew Research Center, accessed April 5, 2015, http://www.pewinternet.org/2015/04/01/us-smartphone-use-in-2015/. 32 “The US Mobile App Report,” Comscore, accessed April 5, 2015, http://www.comscore.com/Insights/Presentations-and-Whitepapers/2014/The-US-Mobile-App-Report. 33 US Smartphone Use in 2015, Pew Research Center.

Rise of the Real-time Traveler: An exploration of trends and innovation in urban mobility 10
4.1 From Ownership to Access: Shared-use Mobility According to PricewaterhouseCoopers (PWC), the sharing economy will generate about $15 billion in global revenues for 2015. The market for shared-use mobility is one of the highest-profile and most dynamic sectors of the sharing economy. The shared-use mobility market provides consumers with short-term access to transportation modes – automobile, bicycle, shuttle, or other mode – on an “as needed” basis. This shift from ownership to collaborative consumption is the premise of the sharing economy. Its promise is of more efficient utilization and monetization of assets. Cars, as expensive household line items with low daily usage rates, are prime for this. The sharing economy, which also encompasses lodging, dining, peer-to-peer lending and crowdfunding, and even personal errands, is organized almost exclusively through online marketplaces. Establishing trust, providing for peer review, and fulfilling needs swiftly are all critical to the marketplaces’ success with consumers. The shared-use mobility market comprises the submarkets of carsharing, ridesharing, on-demand ride sourcing, shuttle services, bikesharing, and other emerging services, including shared parking. Established definitions of common shared-use mobility models are provided in Appendix 1. Each week brings new market entrants as well as exits and, as such, market size and growth data is not available for the shared-use mobility market in its entirety. In examining the scope and impact of shared-use mobility, this paper will focus on carsharing and on-demand ride sourcing.
4.2 Carsharing The carsharing concept emerged in the 1940s and the first program launched in North America in 1994. Carsharing’s exponential growth in the last five years, however, suggests that a previously nascent, niche market is one that advances in technology have helped serve and expand. Digital technology has made the process of reserving, paying for, and locating cars easier, while digital unlocking and verification services have eliminated the hassle of keys. Customer experience has improved, the system has gained in efficiency, and membership has grown. Global carsharing revenues topped an estimated $1 billion in 2013. At projected annual growth rates of 30 percent, revenues could reach $6.2 billion by 2020.34 In 2014, there were 23 active carsharing programs in the US that had more than 19,000 vehicles in their fleet and more than 1.3 million members. These figures do not include peer-to-peer carsharing. Figure 2 presents US membership and vehicle fleet growth from 2003-2014.35
34 “Carsharing Services will reach nearly $6.2 Billion in Revenue by 2020,” Navigant Research, December 11, 2013, http://www.navigantresearch.com/newsroom/carsharing-services-will-reach-nearly-6-2-billion-in-revenue-by-2020. 35 Adam Cohen and Susan Shaheen. Innovative Mobility Carsharing Outlook: Carsharing Market Overview, Analysis and Trends.

Rise of the Real-time Traveler: An exploration of trends and innovation in urban mobility 11
Figure 2: Growth in Carsharing Membership and Vehicle Fleet
The carsharing market is highly concentrated and the three largest operators have 87 percent of the total membership. Rental car programs, including Hertz and Zipcar (owned by Avis), account for 67 percent of the total carsharing membership and 64 percent of the fleet deployed. Two automaker programs, car2go (Daimler AG) and DriveNow (BMW), have 25 percent of the membership and 24 percent of the deployed fleet.36 Consolidation within the carsharing industry and the greater availability of capital is helping it reach beyond its initial growth markets in dense urban areas and into smaller cities or suburbs. One-way carsharing means users can pick up a car at one location and leave it at another location. As of July 2014, approximately a quarter of the fleet was one-way enabled and 26 percent of carsharing members had access to such a program.37 This model has posted impressive growth rates in Europe, but efficient management of the distributed fleet is critical to the model’s success. As of February 2015, one-way carsharing programs were available in 13 of the 70 largest cities in the U.S.38 Peer-to-peer carsharing uses Internet-based platforms to match individuals interested in renting out their cars with people looking to rent a vehicle. Some argue peer-to-peer carsharing is a more pure manifestation of the sharing economy since it is based on the sharing of already owned, underused assets and not on the development of a company-owned fleet. Peer-to-peer carsharing is available in 68 of the 70 largest cities in the US, but comprehensive data on membership and the number of vehicles offered through the platforms is not available.39
4.2.1 Environmental Impact of Carsharing Roundtrip carsharing programs are believed to result in net benefits to the environment. The key metrics are changes in vehicle ownership levels and vehicle miles/kilometers traveled (VMT/VKT) to calculate greenhouse gas (GHG) emissions. Every vehicle employed in a carsharing fleet is credited with removing approximately 9 to 13 vehicles from the road. This includes vehicle purchases that are avoided and vehicles that are sold due to a household’s participation in carsharing. Change in vehicle ownership levels primarily
36 Adam Cohen and Susan Shaheen. Innovative Mobility Carsharing Outlook: Carsharing Market Overview, Analysis and Trends. 37 Adam Cohen and Susan Shaheen. Innovative Mobility Carsharing Outlook: Carsharing Market Overview, Analysis and Trends. 38 Lindsey Hallock and Jeff Inglis, “The Innovative Transportation Index,” Frontier Group and U.S. PIRG Education Fund, February 2015, 34. 39 Lindsey Hallock and Jeff Inglis, 12.

Rise of the Real-time Traveler: An exploration of trends and innovation in urban mobility 12
occurs in single-car households becoming carless and in two-car households becoming one-car households. Vehicles that are sold tend to be older and less fuel-efficient than vehicles in the carsharing fleet.40 The impact of roundtrip carsharing on greenhouse gas emissions is more nuanced, but research reveals that, by gaining access to cars, the majority of households joining these carsharing programs increase their emissions. At the household level, however, these increases are small. The remaining households decrease their emissions significantly by shedding vehicles and driving less. These emission reductions from a minority of carsharing households outweigh the collective emission increases from a majority of households.41 This indicates that carsharing changes people’s driving behavior in significant ways. Research into the environmental impact of one-way and peer-to-peer carsharing models is in its infancy. The distribution of one-way carsharing vehicles and the need to potentially reposition them to meet supply in high-demand areas poses an operational challenge, and could potentially increase VMT and GHG emissions.
4.3 On-demand Ride Sourcing & Ridesharing The closest the shared-use mobility market comes to capturing the excess capacity of already owned underused assets is in the on-demand ride sourcing market. On-demand ride sourcing allows passengers to request a ride from a private vehicle driven by a non-commercially licensed driver through a mobile application. The mobile application facilitates the pickup, payment, and rating of driver and trip-taker. The backbone of this model is car owners’ economic incentive to participate and about 80 percent of the fare goes to the driver, with the remainder to the on-demand ride sourcing provider. Uber and Lyft are prominent examples of this model, and their rivalry and clashes with the taxi industry in various cities are well documented. Their growth has been swift and extensive. As of April 2015, Uber operated in 301 cities in 57 countries.42 The users of on-demand ride sourcing cite speed and convenience as the top reasons for choosing the service. Speed refers not only to shorter travel time over transit or other modes, but also shorter wait times. Convenience includes aspects of on-demand ride services like digital payment, ease of requesting a car, shorter wait times, and not needing to look for parking. Although much of the focus to date has been on Uber and Lyft’s competition to the taxi industry, the companies are also offering on-demand ridesharing in certain US markets. This means that when a passenger requests a ride and enters the destination, he or she is matched with another passenger taking a similar route. According to Uber, “if you have a little more time, you can ride for a lot less money.”43 According to Lyft, their ridesharing offering, Lyftline, now accounts for more than 50 percent of the rides on their platform in the San Francisco area and 30 percent of rides in New York City. 44
4.3.1 Environmental Impact of On-demand Ride Sourcing and Ridesharing The emergence and growth in on-demand ride sourcing is recent, and limited data and studies exist for assessing its overall environmental impact. The results of a 2014 survey in the San Francisco Bay Area of on-demand ride sourcing users revealed a few key insights: 40 percent of respondents who owned a car and used the on-demand ride services said they drove
less than before they started using such services;
40 Jeffrey Lidicker, Elliot Martin, and Susan Shaheen. “Carsharing’s Impact on Household Vehicle Holdings: Results from a North American Shared-use Vehicle Survey,” March 15, 2010, http://www.carsharing.net/library/Martin-Shaheen-Lidicker-TRR-10-3437.pdf. 41 Elliot Martin and Susan Shaheen. “Greenhouse Gas Emission Impacts of Carsharing in North America,” Mineta Transportation Institute, June 2010. 42 Uber, “Expansion,” accessed April 23, 2014, http://blog.uber.com/frontpage/expansion/. 43 Uber, “What to expect with Uberpool,” accessed April 23, 2014, http://blog.uber.com/what-to-expect-with-uberpool. 44 Lyft, “Paving the Way for Greener Cities,” accessed April 23, 2014, http://blog.lyft.com/posts/earthday.

Rise of the Real-time Traveler: An exploration of trends and innovation in urban mobility 13
92 percent of respondents said they would have still made the trip even if on-demand ride services were unavailable, which suggests an induced travel effect of 8 percent; and
respondents who would have made the trip anyway would have used a taxi (39 percent) or transit (33 percent).
The researchers believe it is possible that the induced travel effect is underestimated, which would have clear implications for the environmental profile of the service. Of particular interest was whether or not on-demand ride sourcing complements or substitutes for public transit, and it appears that it is a substitute for longer transit trips and acts as a complement to shorter transit trips.45 Ridesharing is one of the most impactful methods for reducing congestion and emissions since each seat that’s filled in a vehicle can represent one less car on the road. Transportation costing work from the Victoria Transport Policy Institute (VTPI) estimates that shifting a traveler from driving their own car for a typical 20-mile roundtrip urban commute to sharing a ride is the third most effective option for mitigating the external impact of a trip. Only shifting travelers onto bikes or enabling them to walk saves more.46 Appendix 2 provides the VTPI cost categories, their influence on travel behavior, and the projected savings that result from shifting commute modes. This VTPI framework is useful in assessing the costs and benefits associated with a particular transportation choice.
4.4 Growth Outlook and Implications for the Automotive Industry Carsharing can be a viable and cost-effective alternative to car ownership that can also deliver clear environmental benefits. But the level of access to carsharing can be uneven throughout a city. Integrating carsharing with other shared-use mobility modes and with transit is important to increasing the scale and connectivity needed to make carsharing a real option for a broader population. Peer-to-peer carsharing may have an important role to play in scaling carsharing within and across markets. The results of a survey conducted in the San Francisco Bay Area revealed that only about 25 percent of surveyed vehicle owners would be willing to rent out their vehicle, but that 60 percent of people without access to a car would be willing to rent a peer-to-peer vehicle. Those willing to rent out their vehicle cited economic benefits as the chief motivator. Renters cited convenience and availability as the main attractions for renting through a peer-to-peer platform. However, the study also revealed that frequent transit users were most open to renting through peer-to-peer carsharing, and people who drove frequently were less open to it.47 These findings indicate that, like traditional carsharing models, peer-to-peer carsharing is likely to grow in dense, urban markets where car ownership is less prevalent and critical to the daily routine. However, peer-to-peer carsharing has drawn interest as a model that could work better than traditional carsharing in suburbs and rural areas. On-demand ride sourcing and ridesharing merit close observation. Since on-demand ride sourcing approximates the taxi experience, ordering a ride from a stranger does not appear to cause many Americans hesitation. What remains to be seen, however, is if Americans can overcome a disinclination to share rides with strangers or use their own vehicle to pick up more than one stranger. There is a clear economic incentive to participate for both rider and driver. But while the digital recordkeeping and rating systems address some security and liability concerns, it is unclear whether this will be enough to overcome peoples’ natural hesitation at ridesharing.
45 Lisa Rayle et al., “App-Based, On-Demand Ride Services: Comparing Taxi and Ridesourcing Trips and User Characteristics in San Francisco,” Berkeley: University of California Transportation Center (2014), http://tsrc.berkeley.edu/node/797. 46 “Transportation Cost and Benefit Analysis II – Cost Summary and Analysis,” Victoria Transport Policy Institute, 20 January 2009, http://www.vtpi.org/tca/tca06.pdf. 47 Ingrid Ballus-Armut et al., “Peer-to-Peer Carsharing: Exploring Public Perception and Market Characteristics in the San Francisco Bay Area, California,” Transportation Research Record No. 2416: 27-36.
Rise of the Real-time Traveler: An exploration of trends and innovation in urban mobility 14
Not only is shared-use mobility changing the financial relationship people have with vehicles, it may also change vehicle design itself. At present, vehicles in the majority of carsharing programs are standard model vehicles fitted with aftermarket telematics. However, some automakers have started to manufacture vehicles that are purpose-built for sharing. Growth in purpose-built vehicles for shared-use mobility is likely to bring down the cost of embedding sensors and transmitters for on-board telematics. Moreover, car owners’ participation in peer-to-peer carsharing or on-demand ride sourcing programs could speed the adoption of vehicles with advanced technology by offsetting the purchase cost and expanding the available market. According to KPMG’s 2013 Global Auto Executive Summary, 83 percent of executives believe increased urbanization will impact vehicle design. The interplay of urbanization and shared-use mobility could lead to the “right sizing” of vehicles and changes to the overall fleet mix. Many car owners purchase a vehicle to meet occasional usage needs, like a family weekend trip, even though the majority of trips made are single occupancy to and from work. With widespread carsharing, drivers could choose the car to match the trip purpose. This means the majority of the carsharing fleet would likely be smaller and lighter electric vehicles that would reduce the environmental impact of road transportation. Carsharing also changes the lifespan of vehicles. Since cars are on the road and in motion more often, their lifespan is shorter and more similar to that of police or fleet vehicles, resulting in more frequent upgrades to the latest technology. And, if shared-use mobility models were to facilitate the quicker adoption and integration of advanced technologies, this would accelerate the contribution of cars to the creation of a “connected city,” as they would be instrumental in collecting and transmitting valuable data on air quality, road condition, vehicle speeds and other important aspects of city life.
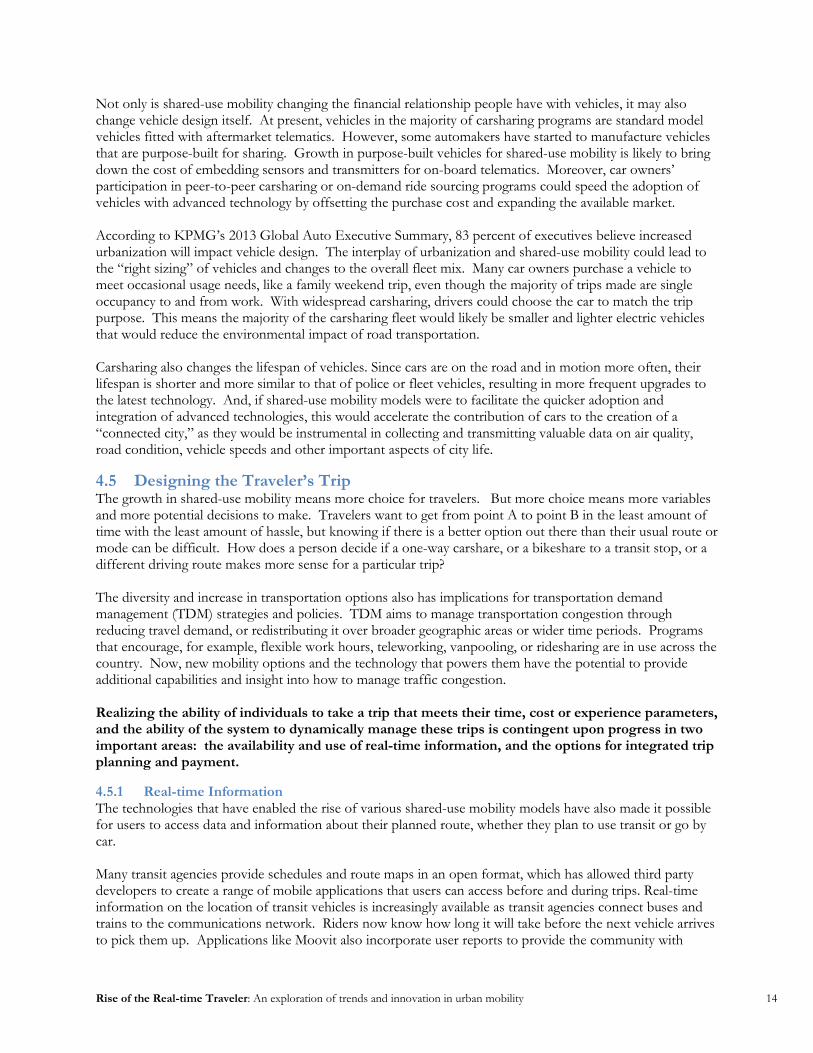
4.5 Designing the Traveler’s Trip The growth in shared-use mobility means more choice for travelers. But more choice means more variables and more potential decisions to make. Travelers want to get from point A to point B in the least amount of time with the least amount of hassle, but knowing if there is a better option out there than their usual route or mode can be difficult. How does a person decide if a one-way carshare, or a bikeshare to a transit stop, or a different driving route makes more sense for a particular trip? The diversity and increase in transportation options also has implications for transportation demand management (TDM) strategies and policies. TDM aims to manage transportation congestion through reducing travel demand, or redistributing it over broader geographic areas or wider time periods. Programs that encourage, for example, flexible work hours, teleworking, vanpooling, or ridesharing are in use across the country. Now, new mobility options and the technology that powers them have the potential to provide additional capabilities and insight into how to manage traffic congestion. Realizing the ability of individuals to take a trip that meets their time, cost or experience parameters, and the ability of the system to dynamically manage these trips is contingent upon progress in two important areas: the availability and use of real-time information, and the options for integrated trip planning and payment.
4.5.1 Real-time Information The technologies that have enabled the rise of various shared-use mobility models have also made it possible for users to access data and information about their planned route, whether they plan to use transit or go by car. Many transit agencies provide schedules and route maps in an open format, which has allowed third party developers to create a range of mobile applications that users can access before and during trips. Real-time information on the location of transit vehicles is increasingly available as transit agencies connect buses and trains to the communications network. Riders now know how long it will take before the next vehicle arrives to pick them up. Applications like Moovit also incorporate user reports to provide the community with

Rise of the Real-time Traveler: An exploration of trends and innovation in urban mobility 15
information on other aspects of the travel experience like station crowdedness, cleanliness, and live events. Studies show that providing riders with real-time information improves the entire transit experience, reducing both perceived and actual wait times, and making riders feel more confident about relying on transit for trips.48 Traffic and navigation applications are increasingly integral to the driving experience, whether on the dashboard or smartphone. Applications like Waze incorporate both crowdsourced data and official data to provide users and transportation agencies with valuable insight into how traffic is moving. Features like TomTom’s eco-route function let drivers select a route to maximize fuel efficiency. Driving has become both more personalized and more participatory than ever before. Drivers can tailor their driving experience to their individual goals and preferences while engaging and responding to the system at large. The result is an increasingly dynamic, collaborative environment of real-time information flows.
4.5.2 Integrated Trip Planning and Payment As choice and information have proliferated, developers of mobile applications have moved to stitch the transportation landscape together and facilitate the traveler’s decision making. These applications enable the traveler to pull up an array of options and potential combinations, along with timing and route data. According to The Innovative Transportation Index, residents in 47 out of the 70 largest US cities have access to these multi-modal applications for planning their trip. But these applications vary in how comprehensively they aggregate transportation options and incorporate shared-use mobility modes. For example, in addition to offering its own carsharing program, Car2Go, automaker Daimler AG has its own multi-modal application, moovel, which facilitates transportation choice and payment between its mobility services as well as those offered by public providers. But there is discussion about a potential “balkanization” of the transportation landscape between different providers and partners that could make it more difficult to arrive at inclusive, sustainable transportation options for diverse communities. At present, a seamless, integrated trip planning and payment experience is not yet available for most travelers. This is due to varying levels of integration between public and private transportation providers, and the aggregation limitations of various applications.
4.6 Influencing Behavior and Outcomes: Considerations in Designing the Traveler’s Trip
Continued progress toward integrated trip planning and payment is important to transforming the transportation system. It would provide new inflection points for individuals to optimize their own behavior and for the system to influence or respond to these trip-making decisions. “[A multi-modal mobility recommendation engine] has the potential to be very disruptive because it doesn’t fully exist. It gets powerful when there is coordination between certain modes, like bikeshare and mass transit, and common fare structures. Research shows that integrated ticketing leads to much higher use of both modes.”
- Ryan Chin, Managing Director, City Science Initiative, MIT Media Lab49 Conventional choice theory assumes that individuals have complete knowledge of the alternatives and can make a rational choice. More recent empirical research suggests that a more proactive approach is required that not only informs but also helps individuals decide what is most suitable for them.50 Taking this one step
48 Lindsey Hallock and Jeff Inglis, 16. 49 Ryan Chin, interview by author, April 7, 2015. 50David Banister, “The sustainable mobility paradigm,” Transport Policy 15 (2008): 77.

Rise of the Real-time Traveler: An exploration of trends and innovation in urban mobility 16
further, research has also found that forming an implementation intention (when, where, and how to perform an action) increases the probability that the decision is manifested in behavior.51 Travelers therefore become more able to evaluate mobility options, select the one that meets their needs at a particular point in time, and follow through on that selection if the information presented is timely, relevant, and actionable. A seamless, intuitive user experience is necessary for acquiring and retaining the engagement of today’s discerning app user. User experience experts know that for every sign-up related task a user is expected to complete, the sign-up rate completion diminishes. Entering credit card information into mobile applications is a well-known hurdle on the way to obtaining usage. But solving through design challenges may be less difficult and pressing than answering this fundamental question: “Just because you build it does not mean they will come. How do you enroll people in the idea that this is useful to them?”
- Jeffrey Chernick, CEO and Co-Founder of Rideamigos52
5 Real-time Travelers: Rob, Terri, and Maria A traveler’s individual choices are at the heart of the transportation system. Understanding what will be useful to travelers requires knowing what they need and want to achieve as they move through their daily activities. While Rob, Terri, and Maria are fictional characters, they serve to illuminate how current and future mobility innovations can be leveraged to improve the transportation status quo. Each persona is representative of real transportation preferences and needs in different U.S. cities. The discussion is intended to provide a snapshot of how an increasingly information- and choice-rich transportation system could affect daily lives and transportation decision making. The discussion incorporates transportation options that require a few leaps forward from what is currently or widely available to travelers, and is clearly not inclusive. However, the discussion reflects issues and areas where there is consensus that transportation stakeholders could work together to improve feasibility and performance. The discussion also concentrates on the role of incentives and gamification in influencing and enhancing individual travel behavior and engagement. If the paper so far has concentrated on what is happening in this transportation transformation, this section attempts an introduction into exploring why this matters for individuals.
5.1 Rob: “The career-driven commuter”53 “Drivers’ time is the major cost of suburban mobility. It’s become less of a transportation problem and more of a productivity problem.”
– David Block-Schachter, Chief Scientist, Bridj54
51 S. Bamberg, “The Promotion of New Behavior by Forming an Implementation Intention: Results of a Field Experiment in the Domain of Travel Mode Choice,” Journal of Applied Social Psychology, Vol. 30, No. 9: 1903-1922 as quoted in Hani S. Mahmassani et al., “Synthesis of Traveler Choice Research: Improving Modeling Accuracy for Better Transportation Decisionmaking,” Publication No. FHWA-HRT-13-022, (2013): 15. 52 Jeffrey Chernick, interview by author, April 7, 2015. 53 “Who’s on Board 2014: Mobility Attitudes Survey,” TransitCenter, September 2014. 54 David Block-Schachter, interview by author, April 14, 2015.

Rise of the Real-time Traveler: An exploration of trends and innovation in urban mobility 17
Rob lives and works in the Dallas-Fort Worth-Arlington metropolitan statistical area. He is one of the 2.5 million people in the metro area who drive alone each day in their vehicle to work.55 He makes a 20-mile round trip commute each weekday to his office job at an international consumer product goods company. Rob belongs to a segment of Americans identified as “career-driven commuters.” The 2014 nationwide survey, Who’s on Board 2014: Mobility Attitudes Survey, identified seven categories of Americans based on their attitudes toward mobility and urbanism. While people within each segment tend to share certain demographic and behavioral characteristics, the groups are identified based on shared attitudes and not objective criteria. As a “career-driven commuter,” Rob makes his housing and transportation decisions based on getting to and from work as quickly as possible. He doesn’t think much about the environmental impact of his car-centric lifestyle or about transportation options other than driving, and he is not eager to try new things. In short, Rob is content with how he gets around – except for the fact that it’s taking longer and longer to get to and from work. Rob’s main concern is travel time. He feels like he is losing time that could be better spent on other activities or with friends and family. Rob will occasionally take an alternate commute route and he’s also started to switch routes when traffic conditions are especially bad. His boss even remarked in his team’s last staff meeting that people seemed to be irritated as they arrived at the office and needed time to decompress before digging into the day’s work. Not for the first time, Rob wishes he could know what his driving and commute experience would be like before he got into the car – and how he could improve it. Providing Rob with this information, the implementation intention, and the incentive to act on it, is the driving force behind the development of Metropia. Metropia is a mobile application that uses advanced algorithms to predict travel times, suggest alternative departure times and routes, and incentivize drivers to modify their behavior. According to Yi-Chang Chiu, Metropia founder, by waiting until the driver gets into the car and turns on the navigation device, “we are missing the opportunity to help the driver decide when is the best time to leave.”56 While real-time information is crucial to improving the transportation experience, it may not be good enough. How can drivers and communities proactively avoid congestion, and its wear and tear on individuals and infrastructure? The Metropia team wanted to develop a solution that would encourage commuters – like Rob – to leave a little earlier or later, which would improve the driving experience, and also reduce or delay the need to build more infrastructure by spreading out the peak demand. The application integrates real-time, crowd sourced, and official data with historical data to predict which routes and departure times will have available capacity. If the driver is flexible on departure or arrival time, they can reserve an alternative route and/or different departure time, and get points for modifying their behavior. These points can be redeemed at local businesses or put toward environmental initiatives, like planting trees. Rob would be heartened by the results from Metropia’s initial field tests, which showed that Metropia drivers saved about 10-15 percent in travel time on average. Those drivers who changed both their departure time and route were able to save travel time ranging from 20 to 30 percent.57 Most days, Rob has flexibility on his arrival and departure times for work, and is willing to use it. He isn’t alone – Metropia’s tests show that about 40 percent of users changed their routes and 60 percent changed the times they leave for their destinations.58
55 “B08301: MEANS OF TRANSPORTATION TO WORK - Universe: Workers 16 years and over,” 2009-2013 American Community Survey, U.S. Census Bureau. 56 ITSA Interview with Yi-Chang Chiu, Vassilis Papayannoulis, and Mia Zmud, April 2, 2015. 57 X.B. Hu et al., “Behavior Insights for an Incentive-Based Active Demand Management Platform,” Journal of Transportation, Research Board, 2014. 58 “How we all win,” accessed April 2, 2015, http://www.metropia.com/how-we-win.
Rise of the Real-time Traveler: An exploration of trends and innovation in urban mobility 18
The network effect is also at work: as the number of drivers in a city using the Metropia application increases, the travel time savings accruing to each driver also increases. Much like traditional TDM programs, Metropia aims to provide drivers with alternatives that reduce congestion. But it is at the forefront of how technology can present mobility options in a timely and actionable way to travelers. It incorporates strategies and approaches that are known to facilitate behavior change, like pre-commitment. Reserving the route helps the driver stick to the alternative plan and a push notification lets the driver know when it’s time to leave. “Drivers are habitual creatures and yet we’ve also seen this app become habit forming. People pull the app out early in the day – they want to know what’s happening in the future.”
– Yi-Chang Chiu, Founder, Metropia The peak shifting that Metropia’s application can facilitate delivers economic and environmental savings over the status quo. The app’s potential for mode shifting – getting people like Rob on to other forms of transportation – is just beginning to be tapped. The goal is for the application to discover the user’s mobility patterns and begin to layer in other options, including transit and shared-use mobility services, and build out the ecosystem of incentive-providing partners. Metropia is one option for helping drivers reclaim time otherwise spent sitting in the car. Another option for improving the cost, environmental and social impact of Rob’s travel patterns is on-demand ride sharing. Right now, Rob hasn’t considered this, but if travel conditions were to deteriorate further he could envision participating in such a program and benefitting financially from the driving he would do anyway. Or, he could check emails and get a head start on the day’s work while someone else did the driving. While Rob is leery of sharing his vehicle with strangers or getting into a stranger’s vehicle, he could envision participating in a workplace program. While the density in Rob’s neighborhood and community isn’t sufficient to enable successful, profitable traditional carsharing models or other options like bikesharing, his commuting behavior is predictable and presents an opportunity for greater optimization.
5.2 Terri: “The Bohemian Boomer”59 “These new business models are disruptive. They are dig itally oriented, cashless systems with minimal transaction times, and they deal with the parking issue quite elegantly.”
- Ryan Chin, Managing Director, City Science Initiative, MIT Media Lab60 Terri and David both work at a university in the Salt Lake City metropolitan area. They drive to work together most weekdays and are representative of the 12 percent of the metro area population that commutes via carpool.61 They own two cars and use the second vehicle for running occasional errands. Their son also uses the second car when he comes home from college for the holidays. As they get closer to retirement, Terri and David are questioning whether they really need the second car, especially as they contemplate downsizing their home and moving to a new mixed-use development in the area. Terri and David belong to the segment identified as “Bohemian Boomers.” They lead active lives, and like to be out and about in town. They also enjoy the outdoors and are concerned about the environment. When it comes to technology, both Terri and David are somewhat indifferent.62 When it gives them back time and improves an experience – like online banking – they’ve embraced it, but they don’t really engage with technology for technology’s sake. 59 “Who’s on Board 2014: Mobility Attitudes Survey,” TransitCenter, September 2014. 60 Ryan Chin, interview by author, April 7,2015. 61 B08301: MEANS OF TRANSPORTATION TO WORK - Universe: Workers 16 years and over, 2009-2013 American Community Survey 5-Year Estimates. 62 “Who’s on Board 2014: Mobility Attitudes Survey,” TransitCenter, September 2014.
Rise of the Real-time Traveler: An exploration of trends and innovation in urban mobility 19
However, they’ve heard a lot about new shared-use mobility models from their colleagues and students at the university. What started with an initial Zipcar a few years ago has blossomed into an ecosystem of services for meeting various mobility needs on and off-campus. Public agencies in the area have also been active in pushing the integration of these services with existing bus routes to solve first- and last-mile gaps to transit, and in encouraging the expansion of these services to various neighborhoods. The city now has a few different hubs in a hub- and spoke-system of transportation alternatives. A few years ago, Terri and David might have been concerned about the reliability or availability of options if they got rid of their second car, but this seems to be less and less of an issue. It doesn’t take much effort for Terri and David to download a mobile application that spells out real-time mobility options and combinations for making trips. If Terri is walking toward a bus stop, the application notifies her before she gets there when the next bus is due to pull up. When she looks to get across campus for lunch and sees the bikeshare option listed, she knows it’s because the bikeshare station has available bikes. The application gives her a comprehensive look at her options, and she can customize those based on her personal preferences for time vs. cost or desired activity level. It also facilitates her payment and performs any account management work needed to access the various modes, including carsharing. Terri feels that it’s removed a lot of the thinking and guesswork out of getting around without a personal vehicle. Before Terri and David decide whether or not to shed their second vehicle, they also want to evaluate another carsharing option – fractional ownership. Four of their potential new neighbors in a development they’re considering co-own a vehicle. An application lets the co-owners reserve the vehicle, and check on its location and fuel level, while an electronic beacon for each driver tracks their usage. All the co-owners are billed monthly for their usage and the bill includes insurance, maintenance, fuel, and any required cleaning.63 It’s an interesting proposition but Terri and David think the carsharing programs they already have access to provide more flexibility and better fit their price point. Shortly after moving to their new home, Terri and David decide to shed their second vehicle. Parking is not as plentiful in their new development and they feel comfortable that the available mobility services can meet their needs as they arise. Occasionally, David needs to take the car on a work trip. Terri doesn’t like to use the public bus to get to work because it takes too long and a one-way carshare would be pricey. But “microtransit” is available in the Salt Lake City area and Terri knows she can request a seat on a 15-passenger commuter vehicle that will take her directly to work.64 This is the need that companies like Bridj, which began operations in Boston in 2014, have set out to meet. Bridj’s shuttles don’t travel a fixed route. Instead, the routes are derived from reconciling the travel patterns of Bridj’s users with additional data sources on how non-Bridj users move around the city. Travelers input an origin and a destination and Bridj compares that data with requests from other users in the area. It then creates the route and notifies the users of the pick-up location. The goal is to offer people like Terri and others a trip that starts within a 10-minute walking distance of their origin and drops them off within a 10-minute walking distance of their destination. They also should not have to wait more than 10 minutes for the service to arrive. According to David Block-Schachter, Chief Scientist at Bridj, “this is a self-aggregation model similar to transit and the smaller direct trip model common with taxis or jitneys.” This data-driven model has the potential to make the system more dynamic and responsive by filling in gaps where and as they arise. It not only provides an end-to-end experience for users like Terri, but it also helps manage congestion through offering an alternative to cars on routes that transit does not serve or serves
63 “Audi Unite”, accessed April 6, 2015, https://www.audiunite.com/se/service/en_unite.html. 64 “How the Microtransit Movement is Changing Urban Mobility,” Citylab, The Atlantic, April 27, 2015, http://www.citylab.com/commute/2015/04/how-the-microtransit-movement-is-changing-urban-mobility/391565/.
Rise of the Real-time Traveler: An exploration of trends and innovation in urban mobility 20
inadequately. But for Block-Schachter, Bridj is more of a departure from established modes of thinking and traveling than might first appear: “Users input their orig in and destination, and 80 percent of the time the application will tell the user to go to the same spot for pick up. But 20 percent of the time the spot will vary. We are asking for a level of flexibility in exchange for improving the system. We want to take the concept of route out. We want to take the cognitive work away from the user and put it on the system.”
– David Block-Schachter, Chief Scientist, Bridj Terri and David’s decision making was a departure from decades of two-car dependency, but technology served to make it neither abrupt nor disconcerting. The growth in shared-use mobility in their area and its integration facilitated their transition to a one-car household. Like the majority of carsharing households that shed a vehicle, Terri and David drive less than they used to. By shifting costs to a pay-per-use basis, carsharing sends better market signals regarding the costs of driving as compared to vehicle ownership that involves a one-time major investment followed by relatively low marginal costs per trip. Terri and David have reduced their environmental footprint through driving less and accessing other modes. They’ve also improved their activity levels. Providing Terri and David with the option to become multimodal, and making it an easy and real alternative to car ownership requires coordination and collaboration that is underway but not yet extensive across the transportation landscape. Experts believe focusing on areas, like universities, that can be well served by shared-use mobility modes and where the user population can be expanded is vital to scaling these services outside of their initial growth markets in denser cities. Transitioning people like Terri and David, whose attitudes pre-dispose them to consider new ideas and whose changing life circumstances can facilitate new behavior, requires committed progress toward integrating services, planning and payment.
5.3 Maria: “The Cosmopolitan Youth”65 “We want to g ive the data back to the people who created it and make it adventurous, make it social… if you can g ive people time and occasion to reflect on how they’re traveling, that’s the sweet spot for how they might change their travel.”
- Charles Hunter, Managing Director, Mudlark66 Maria is a millennial who lives and works in Washington, DC. She is the embodiment of the segment identified in the national mobility attitudes survey as “Cosmopolitan Youth.”67 Like 14 percent of commuters in the DC-Maryland-Virginia metropolitan statistical area, Maria usually gets to work via transit.68 She is enamored with technology, especially her smartphone, and often tells pollsters that losing her smartphone would be devastating. She likes transportation modes that don’t require her full attention so she can keep texting friends, reading, or updating her online presence. In fact, Maria didn’t even get her driver’s license until she was 20 when she needed it for an internship that required her to drive. She’s never owned a car and doesn’t see why she would. Washington, DC’s density provides her with a plethora of transportation options that are increasingly integrated, flexible, easy to access, and engaging. Maria is participating in a citywide virtual game that rewards and incentivizes different travel behavior and activities. She is competing against friends and co-workers, and her smartphone tracks her movements and modes, regardless of travel network or ticketing infrastructure. She has engaged with the game much more 65 “Who’s on Board 2014: Mobility Attitudes Survey,” Transit Center, September 2014. 66 Charles Hunter, interview by author, March 31, 2015. 67 Who’s on Board 2014: Mobility Attitudes Survey,” TransitCenter, September 2014. 68 B08301: MEANS OF TRANSPORTATION TO WORK - Universe: Workers 16 years and over, 2009-2013 American Community Survey 5-Year Estimates.

Rise of the Real-time Traveler: An exploration of trends and innovation in urban mobility 21
than she thought she would since points, rewards, or “traps” laid by other users change dynamically. For instance, on her way home from work the buses are usually crowded so Maria knows she can get points – for relieving congestion and for healthy behavior – if she gets off one stop early and walks the rest of the way home. This scenario might seem far-fetched, but starting in 2010 about 10,000 people in London, England played a similar game using their Oyster cards, the plastic smartcard for paying and using services from Transport for London (TfL). The game, called Chromaroma, was built by Mudlark, a company that designs games and online experiences. According to Charles Hunter, Managing Director of Mudlark, the team was brainstorming “funky things to do with games” and came up with the idea to play around with the memory on the RFID chip on the Oyster card. Hunter said they “got into the idea and realized we could give people some entertainment based on their real behavior, and that we could return data to them in a way that was interesting and useful.” This included pure gaming elements like virtual props, such as a leech that players could plant at stations to sap points from other teams, and armor or mirrors to defend and deflect against the virtual point suckers.69 But Chromaroma also had a more practical side that enabled players to visualize their movement across the city and encouraged them to try different routes or visit new places. Chromaroma did not use smartphones and never had formal cooperation from TfL, but the demographics of participants opting in to share their data with the game was broader and more diverse than the company had anticipated. Chromaroma wound to an end as the number of players dwindled, but Mudlark is still intrigued at the potential for gamification in the transportation system. The company is developing a new game, Wend, that it hopes to launch in 2016 that could make Maria’s scenario a reality. Wend will use smartphones to capture travel data regardless of mode or network. Hunter sees Wend as a data aggregator and redistributor – running people’s data through the game and instantly giving it back to them, and whomever else the players have chosen to receive it. Unlike Chromaroma, Wend is envisioned as more than a pure game. This time around, Hunter said the objective is to have Wend and its partners reward people for sustainable travel choices and incentivize mode shift to help transportation agencies improve their services and manage their network. For example, this could take the form of discounted transit fares if the Wend player rideshares for their first- or last-mile connection to the transit station. According to Hunter, Mudlark’s “skill is at the user interface and the philosophy behind it. People like being shown what they do.” Research shows that personalization, competition, and engagement in a community are effective tools for changing behavior. How a Wend world would incorporate and reward peer-to-peer carsharing remains to be seen. But travelers like Maria are likely to embrace this carsharing option. If the platforms solve liability and insurance concerns that drivers and owners have, the potential supply of vehicles is large. This could make peer-to-peer carsharing cheaper than traditional carsharing programs and would likely also provide Maria with greater choice and flexibility. Maria is at the forefront of this transformation in transportation. Today, millennials like Maria move through their cities, taking transit, requesting on-demand rides, and renting cars by the minute to run errands or venture farther afield. Information and choice is abundant, and it takes minimal effort from Maria to access these new models and craft a multi-modal lifestyle. What takes more effort is using this information and choice to improve system performance. Technology has given rise to new possibilities for collaboration among transportation providers and with users. While gamification could be viewed as frivolous, the data and
69 “Chromaroma: the makeover London commuting has been waiting for, “ the guardian, November 30, 2010, http://www.theguardian.com/media/pda/2010/nov/30/chromaroma-oyster-transport-gaming.

Rise of the Real-time Traveler: An exploration of trends and innovation in urban mobility 22
engagement it could generate could act as an active transportation demand management tool and influence travelers to adapt their behavior in real-time.
6 Conclusions “Transport is one of the main stories of your life. More and more it occupies the agenda of public discourse around the world and particularly in cities, where most of us live. When the transport system doesn’t work well, nothing else works very well. That’s true at an individual level as it is at a system level.”
– Charles Hunter, Managing Director, Mudlark The transportation system and individuals participating in it are under strain. Whether it is financial pressures, environmental concerns, or quality of life considerations, the issues that stakeholders and consumers must grapple with are fundamental and formidable. In the meantime, technology has permeated every aspect of daily lives and its disruptive wave is roiling the transportation system. New business models providing different customer experiences and inculcating different customer expectations have emerged. They are already woven into the fabric of daily lives of urban millennials, and some are “crossing the chasm” to become viable choices for different demographics in different cities. It’s difficult to keep up with the emergence and evolution in mobility services, but there are some not-so-new concepts – like carsharing and ridesharing – that have gotten a makeover through digital technology. This has made them more accessible and more palatable to consumers that might otherwise have hesitated at giving up a car or hopping into a vehicle with someone they don’t know. These online digital marketplaces for mobility thrive on the backbone of immediate need fulfillment, and the establishment of trust through peer review and provider responsiveness. It is likely that peer-to-peer carsharing and on-demand ridesharing will continue to scale in urban markets since traditional carsharing models and on-demand ride sourcing have already nurtured the market. Outside of these cities, growth and adoption rates will be slower. The redefinition of car ownership may also remake the car itself. If car sharing fleets were to continue to grow globally, the annual demand for vehicles could decline, perhaps by a significant percentage. Dense, urban markets with congested roads and valuable real estate that is presently commandeered for parking would be better served by smaller, lighter vehicles. Since the cars would be in use more often, these fleets would turn over more quickly. This therefore presents a recurring opportunity to incorporate the most advanced, sustainable technology and makes it more financially feasible. In a sense, the emergence and proliferation in shared-use mobility modes and real-time information is component-level innovation. The challenge of knitting these mobility options together in ways that are meaningful for individuals and impactful for the system is still ahead. How is the traveler’s entire journey optimized – from their pre-trip strategic decision making to their en-route tactical decision making to their arrival at their destination? For people like Terri to reshape their transportation patterns, there will need to be much more collaboration between public and private stakeholders to deliver the reliability and quality of service needed. The ability to predict traffic for commuters like Rob and enable the weighing of costs and benefits associated with the commute before getting into the vehicle influences the trip making decision farther upstream. Providing the incentives and flexibility for this to transpire will also require engagement from a broad set of actors. The travel patterns of people like Maria and the “data shadows” they leave behind as they traverse city systems could prove invaluable in facilitating a transition to a dynamic system where user and infrastructure respond to each other in real-time. But this requires sorting through privacy concerns and figuring out who’s on first for demonstrating return on investment.

Rise of the Real-time Traveler: An exploration of trends and innovation in urban mobility 23
What is evident at this stage is the difficulty in measuring broader environmental, social, and economic benefits of these changes to travelers’ behavior. The interaction effects and interdependencies over time make accounting for human factors and the impact of any mobility management strategies difficult, and the exercise is plagued by data gaps and data reconciliation challenges. This should serve as a call to action for all public agencies and private transportation providers to work together on sharing and expanding access to data to render the system more comprehensible and more resilient. In this scan and assessment of mobility trends and innovation, there are several areas where greater collaboration and research could further enable and expand the information and choice set of travelers like Rob, Terri, and Maria. Governments and transit agencies should incorporate these new technology-enabled services into their transportation planning and modeling. It is imperative to move toward a more comprehensive view of today’s heterogeneous transportation system. The public sector should engage directly and proactively with these new transportation companies to integrate them into existing transit networks and unlock their ability to act as first- and last-mile connections. Pushing forward on progress toward common payment systems and expanding access to real-time transportation data helps move closer to realizing a seamless trip making experience. Cities and agencies should also evaluate the potential of the new tools to expand transportation access and options to the elderly, disabled or lower-income populations. Other stakeholders in the transportation system can also play an important role. Large corporations, like Rob’s employer, can facilitate better system outcomes by providing for flexibility in work arrangements and commute time. They can also focus on TDM strategies or policies that could improve employees’ transportation choices and engagement. Addressing the commute could become part of a corporate citizenship or sustainability program. This idea is not new but the technology now available has the potential to make this more effective, and easier to implement and measure than ever before. It is under researched what nudges people into different modes or changes their transportation patterns. With the new tools to capture traveler’s data, this should be an area of increasing experimentation and focus. It can provide useful insight into how these new mobility options can be integrated in a user friendly, sustainable way. Technology has enabled shared-use mobility to flourish and fulfill various market needs. In light of certain transportation and demographic trends, as well as the preferences of key market segments, the demand for mobility as a service is not likely to dissipate. Physical and virtual integration of these new shared-use mobility modes and existing transportation options is the next step. Encouraging this – through policy, technology and business model innovation, as well as the individual exercise of choice – is essential to harnessing this transformation and using it to build a more inclusive and sustainable transportation system.

Rise of the Real-time Traveler: An exploration of trends and innovation in urban mobility 24
7 Authors and Acknowledgements This report was produced by ITS America through the support of AT&T. It was authored by Sarah Cartmell, technical programs specialist with support from Jennifer Carter, senior vice president for technical programs. The team would like to extend its gratitude to the experts consulted for this report. Their time and insight were incredibly valuable. In particular, the team would like to thank David Block-Schachter with Bridj, Jeffrey Chernick with Rideamigos, Ryan Chin with MIT Media Lab, Yi-Chang Chiu, Vassilis Papayannoulis, and Mia Zmud with Metropia, Stephen Crim with Mobility Lab, Elizabeth Denton with Arlington Transportation Partners, Charles Hunter with Mudlark, Susan Shaheen with the University of California, Berkeley, and Sean Walcott with Ridescout.
8 About the Intelligent Transportation Society of America (ITS America)
ITS America – the high-tech transportation association – is the nation’s largest organization dedicated to advancing the research and deployment of Intelligent Transportation Systems (ITS) to improve mobility, increase connectivity, and build a safer, smarter, more efficient and sustainable transportation network. Learn more at ITSA.org.

Rise of the Real-time Traveler: An exploration of trends and innovation in urban mobility 25
9 Appendix
9.1.1 Appendix 1: Definitions of common shared-use mobility models70
Carsharing Round trip/classic A fleet of automobiles used for round trips that requires users to pay by the hour and/or mile Peer-to-peer The shared use of a privately owned vehicle, typically managed by a third party One-way An operator-owed fleet of automobiles used for point-to-point trips, facilitated through street parking
agreements, that usually require users to pay by the minute Fractional Ownership Individuals sublease or subscribe to a vehicle owned by a third party and share use of that vehicle
Ridesharing Carpooling Grouping of travelers into a privately-owned vehicle, typically for commuting Vanpooling Commuters traveling to/from a job-center sharing a ride in a van Classic real-time A web or mobile application that matches drivers and passengers based on their destination before the trip
starts On-demand ridesharing
Transportation Network Companies (TNCs)
A service that allows passengers to connect with and pay drivers who use their personal vehicles for pre-arranged trips facilitated through a mobile application
On-demand Professional Driver Services
A services that enables passengers to find, hail, and, in some cases, pay for a professional driver (taxi or black car) through a mobile application in real-time
Shuttle Services A privately-owned bus service for community or commuter transportation purposes
Bikesharing Public A fleet of bicycles used primarily for point-to-point trips that require users to pay a fee in order to receive
an unlimited number of rides within a time interval (e.g. 30 minutes) Peer-to-Peer A bicycle that is rented or borrowed from individuals via a mobile/web application or a bike rental shop Closed Community A fleet of bicycles placed within a campus – business or institutional – for private use by campus persons,
normally for roundtrip Scooter Sharing
An operator-owned fleet of motorized scooters made available to users by the hour or the minute. (Fills niche between bicycle and car) Shared parking
Online platforms for private individuals or companies to hire out vacant parking spaces by the hour or day
70 Matt Christensen and Susan Shaheen, Retrospective from North America’s First Gathering on Shared-use Mobility, Berkeley: Transportation Sustainability Research Center (2014), http://tsrc.berkley.edu/node/778.

Rise of the Real-time Traveler: An exploration of trends and innovation in urban mobility 26
9.1.2 Appendix 2: Framework for cost-benefit analysis of different mobility modes71
External Savings from shifting travel time or transportation modes ($ per passenger mile)
Estimated external cost savings (congestion, parking, roadway costs, etc.) due to shift from average car travel to another mode. Negative values for transit reflect low average ridership across the US
71 “Transportation Cost and Benefit Analysis II – Cost Summary and Analysis,” Victoria Transport Policy Institute, 20 January 2009, http://www.vtpi.org/tca/tca06.pdf.