Embed Size (px)
Citation preview
Rise of the Urban Startup Neighborhood: Micro-clusters of Venture Capital and
Startup Activity at the Neighborhood Level
Richard Florida, University of Toronto Karen King, Martin Prosperity Institute
June 2016 REF. 2016-MPIWP-003
Working Paper Series Martin Prosperity Research
Abstract Previous research has identified the clustering of high-tech industries, entrepreneurial startups, and venture capital across metropolitan areas. Using new detailed zip code data on venture capital investment and startup activity, this research tests two hypotheses informed by urban theory regarding the geography startup activity and venture capital investment: (1) that venture capital investment and startup activity will be concentrated in much tighter neighborhood-level micro-clusters and (2) that venture capital investment and startup activity will gravitate to denser, mixed used, transit served locations. We find considerable evidence for both. Venture capital investment and startup activity is concentrated in a relatively small number of neighborhood-level micro-clusters in the United States, the majority of which are located in dense urban neighborhoods where significantly larger than average numbers of commuters walk, bike, or use transit to get to work. This is especially the case for the leading micro-clusters of venture capital investment and startup activity.
Key Words: Venture capital, startups, neighborhoods, micro-clusters
MPI Working Paper Series: Rise of the Urban Startup Neighborhood (Florida & King) 3
Introduction Venture capital has long been the type of finance that powers new and innovative startup companies: Intel in semiconductors, Apple in personal computing, smart phones and more, Genentech in biotechnology, Google in Internet search engines, Facebook and Twitter in social media, and Airbnb and Uber in the sharing economy are just a small sample of the diverse and transformative companies financed by venture capital. It is a core component of the regional ecosystems and social structures of innovation that underpin leading high-tech region (Florida and Kenney 1988; Saxenian 1994).
Following Marshall (Marshall 1891) and Jacobs (Jacobs 1970; 1961), a huge body of literature has identified the clustering of innovative and entrepreneurial activity (Porter 1990, 1996 1998, 2006; P; Glaeser 1999; 2000; Glaeser 2001; Audretsch 2003; 2011; Feldman and Audretsch 1999; Florida 2002, 2005, 2006, 2012a; Feldman and Florida 1994). Other case study research has pointed to the tighter clustering of innovative and entrepreneurial activity in more localized areas (Saxenian 1994). But, the majority of these identified clusters were in suburban areas, in office and industrial parks dubbed “nerdistans” (Kotkin 1997, 2000) in places like California’s Silicon Valley, the Route 128 beltway outside of Boston, the suburbs of Seattle where Microsoft is located, suburban Austin, and the North Carolina Research Triangle. Early studies found that a majority of venture capital flowed to suburban areas in Silicon Valley and outside of Boston with no significant venture capital investment or startup activity occurring in urban areas (Florida and Kenney 1988; Florida and Kenney 1988; Florida and Smith 1993). Despite predictions of their greater diffusion given globalization and new technology, venture capital, investment and innovation have become increasingly concentrated geographically since that time. The Bay Area’s (including San Francisco as well as the Silicon Valley) share of venture capital investment increased substantially over the past few decades from roughly 22 percent in 1995 to 45 by 2015 (National Venture Capital Association 2016). Innovation has become similarly concentrated. Forman et al (2016) show that the San Francisco Bay areas has accounted for virtually all the increase in patenting in the United States since the mid-1970s, while patenting in all other large metros eithers stagnated or declined.
The past two decades have seen a powerful back-to-the-city movement of skilled and affluent people, which Ehrenhalt (2012) has dubbed a “great inversion.” Urbanists, going back to Jane Jacobs (1961; 1970), have long noted that innovative and entrepreneurial activity is the product of cities with their dense and diverse concentrations of people, talent, and companies. Following
MPI Working Paper Series: Rise of the Urban Startup Neighborhood (Florida & King) 4
this line of thinking, previous research identified an urban shift in venture capital and startup activity from the suburbs back to cities (Florida 2012b; 2013; 2014; Florida and Mellander 2016), from the suburban enclaves of Silicon Valley to the urban districts in and around downtown San Francisco and in New York City, especially Lower Manhattan. Stern and Guzman (Florida 2016) document the shift in the location of high quality startup activity from Silicon Valley to San Francisco and from the Route 128 suburbs to downtown Boston and Cambridge near Harvard and the Massachusetts Institute of Technology (MIT). Stern and Guzman (2016) document this urban shift in their analysis of high-quality entrepreneurial startups. They find evidence that high-quality entrepreneurial startups have shifted from the exurban Route 128 area to downtown Boston and dense transit-served areas of Cambridge around MIT and Harvard, and Silicon Valley to the downtown and adjacent areas of San Francisco. Their broader statistical analysis of data for the United States finds that high quality startups are the most likely to cluster geographically and in effect spread into adjacent neighborhoods or zip codes.
In fact, urban theory à la Jacobs (1961; 1970) has long identified dense, diverse, walkable, mixed-use urban areas — not more sprawling suburbs — as the prime generators of innovation and entrepreneurship.
Our research takes shape around two hypotheses, both informed by urban theory. The first is that venture capital investment and startup activity will be organized in tight neighborhood level micro-clusters within cities and metro areas. The second is that these micro-clusters of venture capital investment and startup activity are increasingly likely to be located in dense, walkable, transit-served urban neighborhoods.
We use new and more detailed data at the neighborhood or zip code level to test these two hypotheses. Previous research has been unable to test these claims across a large number of places primarily because data has been unavailable. Up until now, only highly aggregated data for venture capital investment and startup activity at the state or metro level has been available. Our research uses more granular, zip-code level data to examine micro-clusters of venture capital investment and startup activity at the neighborhood level across the United States in 2013. We do so for venture capital investment and startup activity overall and for the five leading industries receiving venture capital investment: software, biotechnology, media and entertainment, medical devices, and information technology services. We further identify venture capital investments and startup activity in urban and suburban neighborhoods based on density and the way people commute to work — looking at the share of workers who walk, bike, or use public transit versus those who drive their own
MPI Working Paper Series: Rise of the Urban Startup Neighborhood (Florida & King) 5
cars. We do so for all zip codes receiving venture capital investment across the United States and drill down with greater detail for the three metro areas that receive the largest amounts of venture capital: the San Francisco Bay Area, Greater New York, and the Boston-Cambridge metro.
Our findings provide substantial evidence in support of both hypotheses. We document tight clusters of venture capital investment and startup activity at the neighborhood level. We also find the majority of venture capital investment to be located in urban neighborhoods, and that this is especially the case for the leading micro-clusters of venture capital investment and startup activity.
The remainder of this paper is organized as follows. The next section describes the variables, data, and methodology used in this research. After that, we turn to our findings. We begin by summarizing our key findings regarding the location of venture capital investment and startup activity across urban versus suburban neighborhoods across the United States. We then chart and map the leading neighborhood-level micro-clusters of venture capital investment and startup activity across the country as a whole and by leading industry. After that, we turn to a more detailed analysis of the urban versus suburban micro-clusters of venture capital investment and startup activity in the San Francisco Bay Area, New York, and Boston. The conclusion summarizes our findings and outlines their implications for urban theory and future research.
Variables, Data and Methodology As noted above, a key limitation of previous research on startups and venture capital has been the availability of only highly aggregated data at the state or metro level. To deal with this, our research is based on detailed data from Thomson Reuters (“Venture Capital and Private Equity,” n.d.), which provides much more granular information on venture capital investments by location. These data include the name and address of startups receiving venture capital investment, the total dollar value of the investment, and geographic information including city and zip code.
We downloaded the data by address and location including identifiers for metropolitan area and zip code. We identified venture capital investments in 1,339 zip codes. This zip code data was assigned to Zip Code Tabulation Areas (ZCTAs), the representation of zip codes used by the U.S. Census. To aggregate this zip code data, we used Census conversions to convert the point-based data set of addresses into a polygon data set for ZCTAs. This conversion was done using the Missouri Census Data Center’s Zip Code to
MPI Working Paper Series: Rise of the Urban Startup Neighborhood (Florida & King) 6
ZCTA cross walk for 2010 (“All About ZIP Codes: 2010 Supplement” 2014). After this conversion, 1,339 zip codes became 1,302 ZCTAs receiving venture capital investment. Ultimately, we identified venture capital investments in roughly four percent (3.9 percent) of all 33,144 ZCTAs across the United States.
We also track venture capital investment and startup activity by zip code for the five leading industries or technology sectors receiving venture capital overall: software, biotechnology, media and entertainment, medical devices and equipment, and information technology services. These industry definitions are similar to those used by PricewaterhouseCoopers in their annual analysis of the venture capital industry (PricewaterhouseCoopers 2016).
We identify urban versus suburban zip codes based on a methodology originally devised by Kolko (2015), which classifies them based on density. The cut-off for urban areas is 2,213.2 households per square mile; suburban areas have between 101.6 and 2,213.2 households per square mile and rural areas have less than 101.6 households per square mile. Across the nation, 63.3 percent of ZCTAs (18,572 of the 29,330) are rural, 28.7 percent (8,406) are suburban, and 8 percent (2,352) are urban. In addition, 2.4 percent or 31 ZCTAs are non-residential zip codes than are not designated urban, suburban, or rural. Of the 1,301 ZCTAs that receive venture capital investment 38.6 percent (501) are urban, 44.3 percent (718) are suburban, and just 4 percent (49) are rural.
We further identify zip codes based on the way people commute to work, distinguishing between neighborhoods by the share of commuters who walk, bike, or use transit to get to work versus those who drive their own cars. These data are from the American Community Survey’s 2013 five-year estimate (American Community Survey 2013).1
We examine the micro-clusters of venture capital investment and startup activity in the three metro areas that receive the greatest amounts of venture capital, the San Francisco Bay Area, Greater New York, and the Boston-Cambridge metro. Together, these three metros attract roughly $20 billion in venture capital investment, 60 percent of all venture capital invested across the United States. The maps of venture capital investment and startup activity for these three metros also identify major research universities based on the Carnegie Corporation list of 115 R1 universities (Carnegie Corporation 2016). They also highlight subway and transit lines based on data from local transit authorities which we believe function as additional attractors for venture capital activity and startup activity. We now turn to the key findings of our research.
MPI Working Paper Series: Rise of the Urban Startup Neighborhood (Florida & King) 7
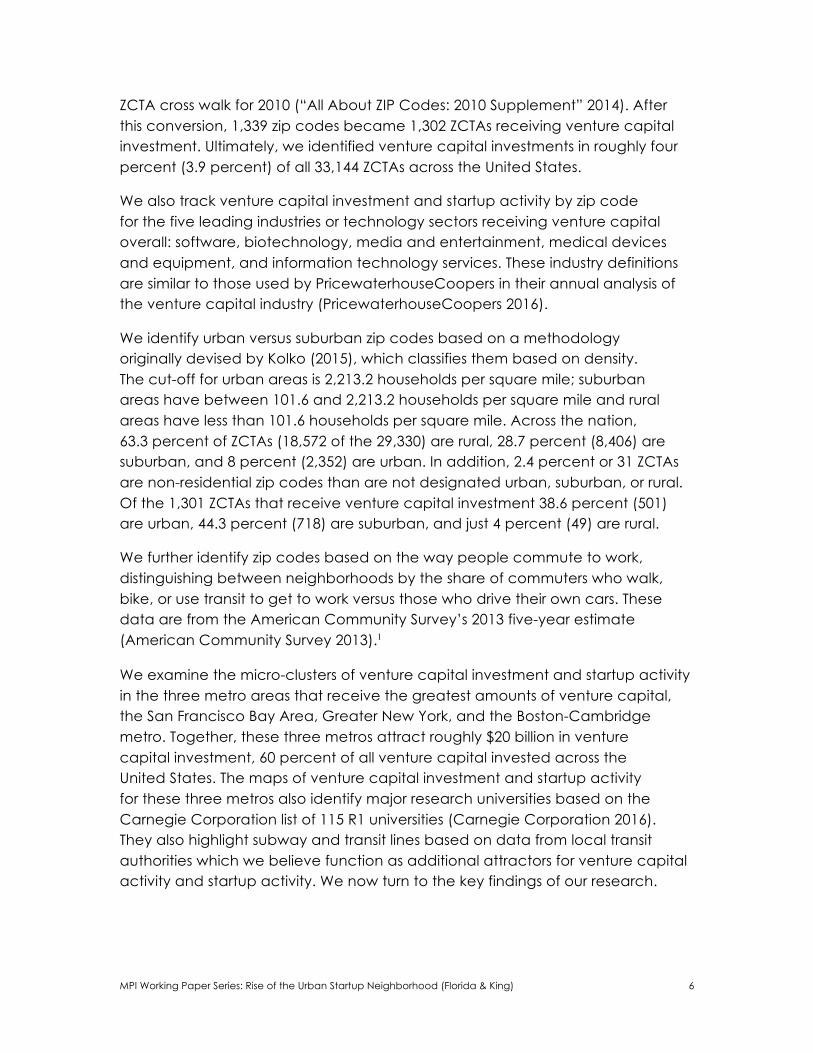
Venture Capital in Urban versus Suburban Areas We begin by looking at the distribution of venture capital investment across urban or suburban neighborhoods or zip codes (see Table 1). To get at this, we classify zip codes based on their population density following thresholds identified by Kolko (2015) as defined above.
Table 1: Venture Capital Investment in Urban vs. Suburban Neighborhoods
Venture Capital Investment Startups Receiving Venture Capital
Type Amount (millions) Share Number Share
Urban $17,843 54.0% 2,361 56.6%
Suburban $14,920 45.1% 1,709 40.9%
More than half of all venture capital investments (54 percent) and an even greater share of startup companies receiving venture capital investment (56.6 percent) of are located in urban zip codes. Across the nation, more than 60 percent of all zip codes are rural, about 30 percent are suburban, and just 8 percent are urban. In other words, the share of zip codes receiving venture capital investment is roughly seven times greater than the share of urban zip codes nationwide.
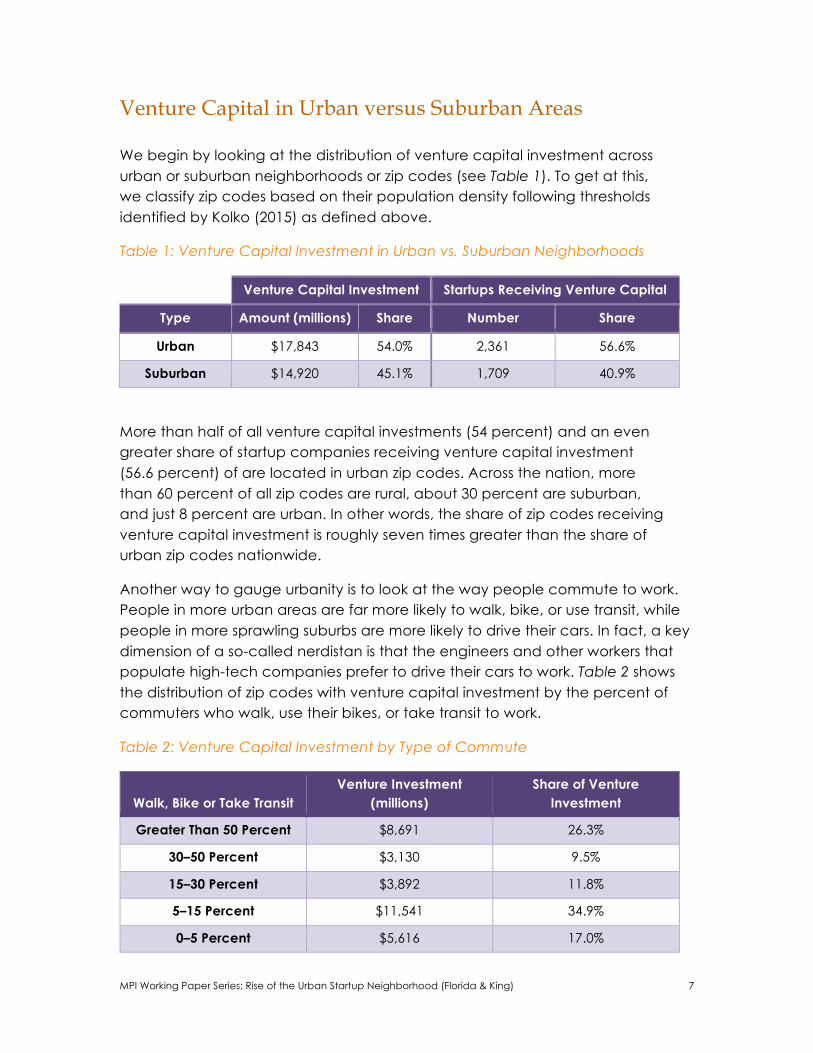
Another way to gauge urbanity is to look at the way people commute to work. People in more urban areas are far more likely to walk, bike, or use transit, while people in more sprawling suburbs are more likely to drive their cars. In fact, a key dimension of a so-called nerdistan is that the engineers and other workers that populate high-tech companies prefer to drive their cars to work. Table 2 shows the distribution of zip codes with venture capital investment by the percent of commuters who walk, use their bikes, or take transit to work.
Table 2: Venture Capital Investment by Type of Commute
Walk, Bike or Take Transit Venture Investment
(millions) Share of Venture
Investment
Greater Than 50 Percent $8,691 26.3%
30–50 Percent $3,130 9.5%
15–30 Percent $3,892 11.8%
5–15 Percent $11,541 34.9%
0–5 Percent $5,616 17.0%
MPI Working Paper Series: Rise of the Urban Startup Neighborhood (Florida & King) 8
Across America, 8.4 percent of workers walk, bike, or use public transit to get to work, while the vast majority drive. However, in neighborhoods where venture capital is invested significantly more workers walk, bike, or use transit. In fact, nearly twice as large a share of workers (16.6 percent) walk, bike, or use transit to get to work in neighborhoods that receive venture capital investment. Furthermore, nearly half of all venture capital investment is located in neighborhoods where more than 15 percent of workers walk, bike, or take transit to get to work. And more than a quarter of all venture investment goes to neighborhoods where more than half of all workers walk, bike, or take transit for their commute.
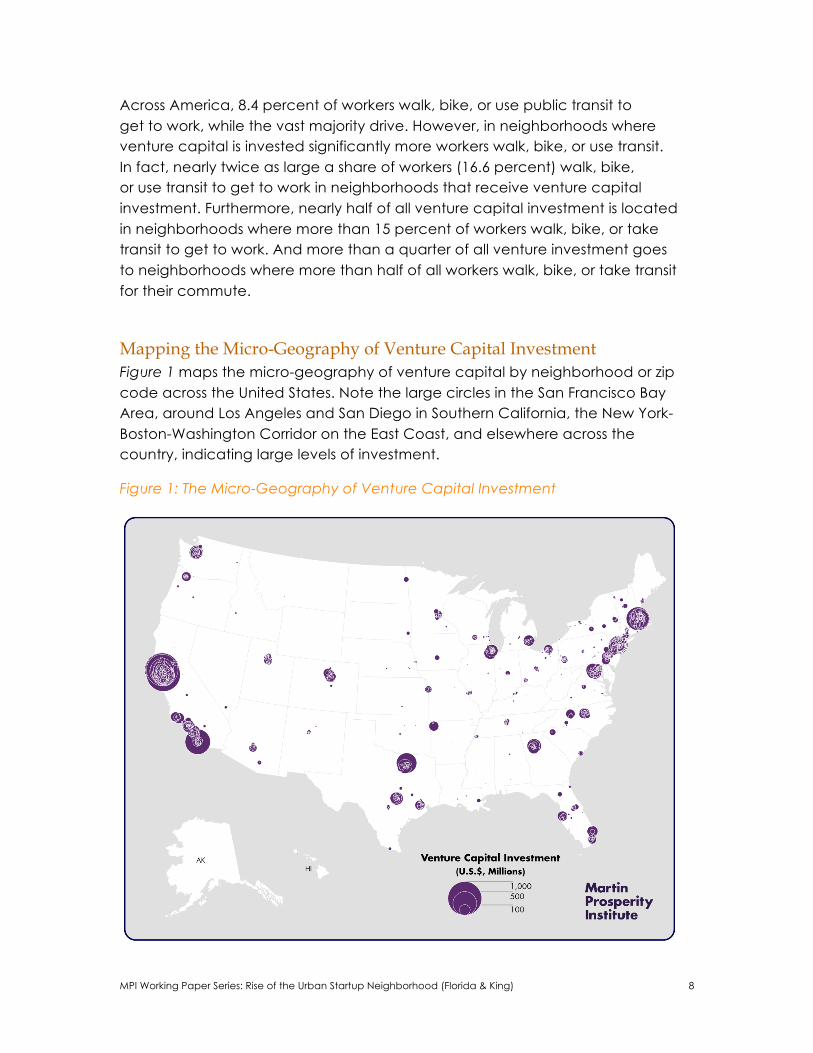
Mapping the Micro-Geography of Venture Capital Investment Figure 1 maps the micro-geography of venture capital by neighborhood or zip code across the United States. Note the large circles in the San Francisco Bay Area, around Los Angeles and San Diego in Southern California, the New York-Boston-Washington Corridor on the East Coast, and elsewhere across the country, indicating large levels of investment.
Figure 1: The Micro-Geography of Venture Capital Investment
MPI Working Paper Series: Rise of the Urban Startup Neighborhood (Florida & King) 9
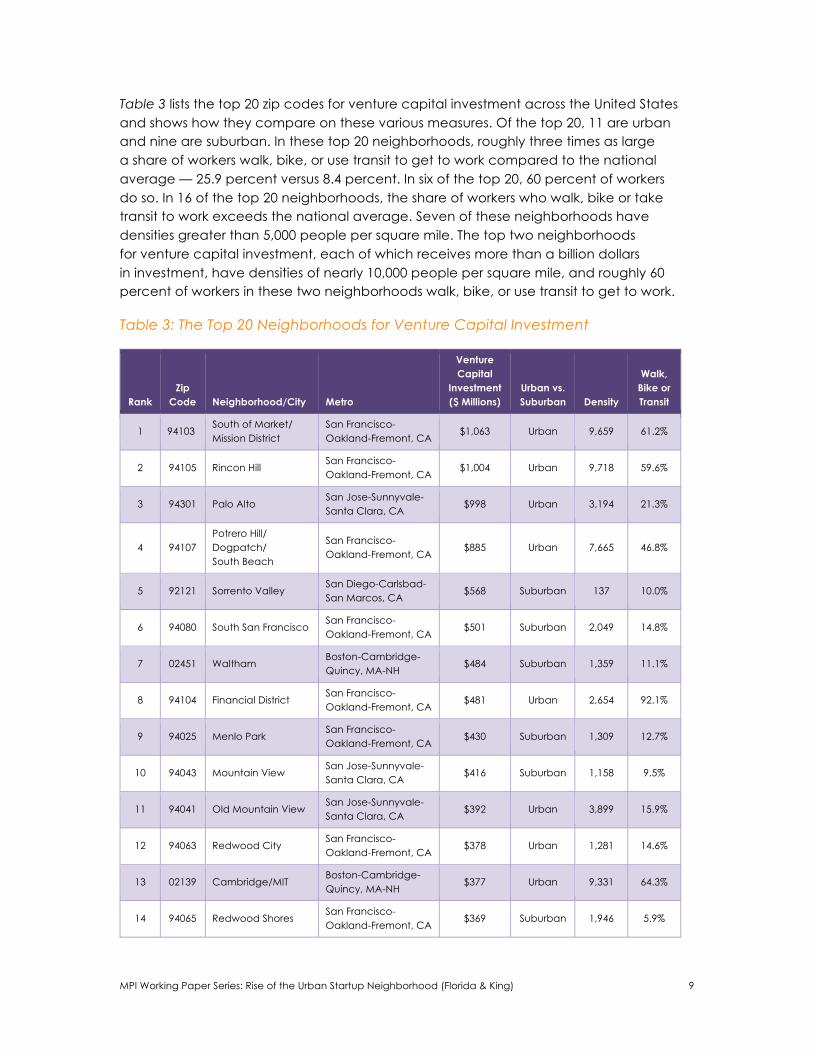
Table 3 lists the top 20 zip codes for venture capital investment across the United States and shows how they compare on these various measures. Of the top 20, 11 are urban and nine are suburban. In these top 20 neighborhoods, roughly three times as large a share of workers walk, bike, or use transit to get to work compared to the national average — 25.9 percent versus 8.4 percent. In six of the top 20, 60 percent of workers do so. In 16 of the top 20 neighborhoods, the share of workers who walk, bike or take transit to work exceeds the national average. Seven of these neighborhoods have densities greater than 5,000 people per square mile. The top two neighborhoods for venture capital investment, each of which receives more than a billion dollars in investment, have densities of nearly 10,000 people per square mile, and roughly 60 percent of workers in these two neighborhoods walk, bike, or use transit to get to work.
Table 3: The Top 20 Neighborhoods for Venture Capital Investment
Rank Zip
Code Neighborhood/City Metro
Venture Capital
Investment ($ Millions)
Urban vs. Suburban Density
Walk, Bike or Transit
1 94103 South of Market/ Mission District
San Francisco-Oakland-Fremont, CA
$1,063 Urban 9,659 61.2%
2 94105 Rincon Hill San Francisco-Oakland-Fremont, CA
$1,004 Urban 9,718 59.6%
3 94301 Palo Alto San Jose-Sunnyvale-Santa Clara, CA
$998 Urban 3,194 21.3%
4 94107 Potrero Hill/ Dogpatch/ South Beach
San Francisco-Oakland-Fremont, CA
$885 Urban 7,665 46.8%
5 92121 Sorrento Valley San Diego-Carlsbad-San Marcos, CA
$568 Suburban 137 10.0%
6 94080 South San Francisco San Francisco-Oakland-Fremont, CA
$501 Suburban 2,049 14.8%
7 02451 Waltham Boston-Cambridge-Quincy, MA-NH
$484 Suburban 1,359 11.1%
8 94104 Financial District San Francisco-Oakland-Fremont, CA
$481 Urban 2,654 92.1%
9 94025 Menlo Park San Francisco-Oakland-Fremont, CA
$430 Suburban 1,309 12.7%
10 94043 Mountain View San Jose-Sunnyvale-Santa Clara, CA
$416 Suburban 1,158 9.5%
11 94041 Old Mountain View San Jose-Sunnyvale-Santa Clara, CA
$392 Urban 3,899 15.9%
12 94063 Redwood City San Francisco-Oakland-Fremont, CA
$378 Urban 1,281 14.6%
13 02139 Cambridge/MIT Boston-Cambridge-Quincy, MA-NH
$377 Urban 9,331 64.3%
14 94065 Redwood Shores San Francisco-Oakland-Fremont, CA
$369 Suburban 1,946 5.9%
MPI Working Paper Series: Rise of the Urban Startup Neighborhood (Florida & King) 10
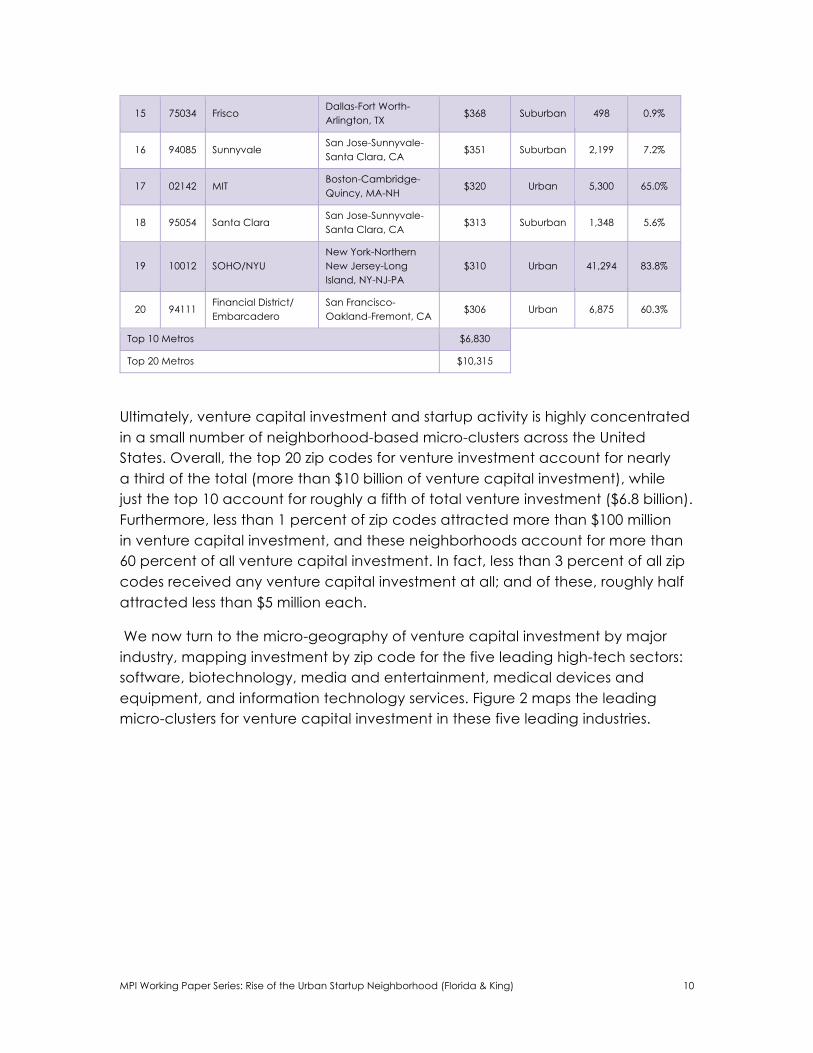
15 75034 Frisco Dallas-Fort Worth-Arlington, TX
$368 Suburban 498 0.9%
16 94085 Sunnyvale San Jose-Sunnyvale-Santa Clara, CA
$351 Suburban 2,199 7.2%
17 02142 MIT Boston-Cambridge-Quincy, MA-NH
$320 Urban 5,300 65.0%
18 95054 Santa Clara San Jose-Sunnyvale-Santa Clara, CA
$313 Suburban 1,348 5.6%
19 10012 SOHO/NYU New York-Northern New Jersey-Long Island, NY-NJ-PA
$310 Urban 41,294 83.8%
20 94111 Financial District/ Embarcadero
San Francisco-Oakland-Fremont, CA
$306 Urban 6,875 60.3%
Top 10 Metros $6,830
Top 20 Metros $10,315
Ultimately, venture capital investment and startup activity is highly concentrated in a small number of neighborhood-based micro-clusters across the United States. Overall, the top 20 zip codes for venture investment account for nearly a third of the total (more than $10 billion of venture capital investment), while just the top 10 account for roughly a fifth of total venture investment ($6.8 billion). Furthermore, less than 1 percent of zip codes attracted more than $100 million in venture capital investment, and these neighborhoods account for more than 60 percent of all venture capital investment. In fact, less than 3 percent of all zip codes received any venture capital investment at all; and of these, roughly half attracted less than $5 million each.
We now turn to the micro-geography of venture capital investment by major industry, mapping investment by zip code for the five leading high-tech sectors: software, biotechnology, media and entertainment, medical devices and equipment, and information technology services. Figure 2 maps the leading micro-clusters for venture capital investment in these five leading industries.
MPI Working Paper Series: Rise of the Urban Startup Neighborhood (Florida & King) 11
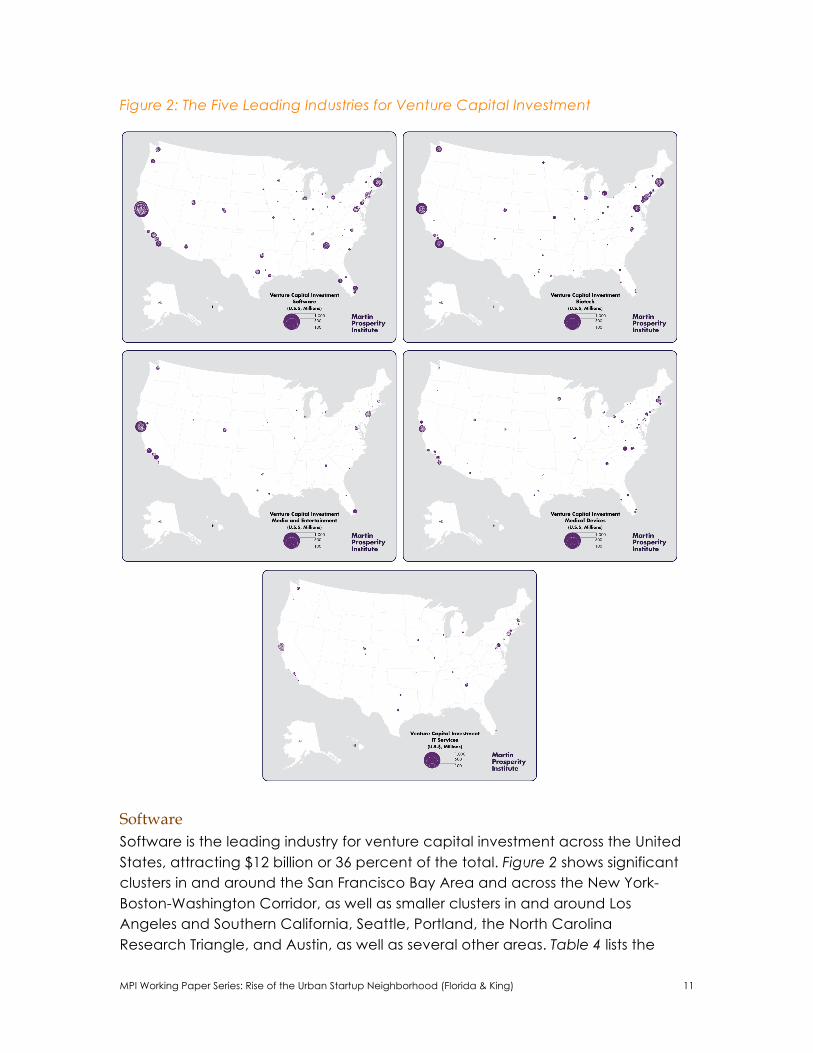
Figure 2: The Five Leading Industries for Venture Capital Investment
Software Software is the leading industry for venture capital investment across the United States, attracting $12 billion or 36 percent of the total. Figure 2 shows significant clusters in and around the San Francisco Bay Area and across the New York-Boston-Washington Corridor, as well as smaller clusters in and around Los Angeles and Southern California, Seattle, Portland, the North Carolina Research Triangle, and Austin, as well as several other areas. Table 4 lists the
MPI Working Paper Series: Rise of the Urban Startup Neighborhood (Florida & King) 12
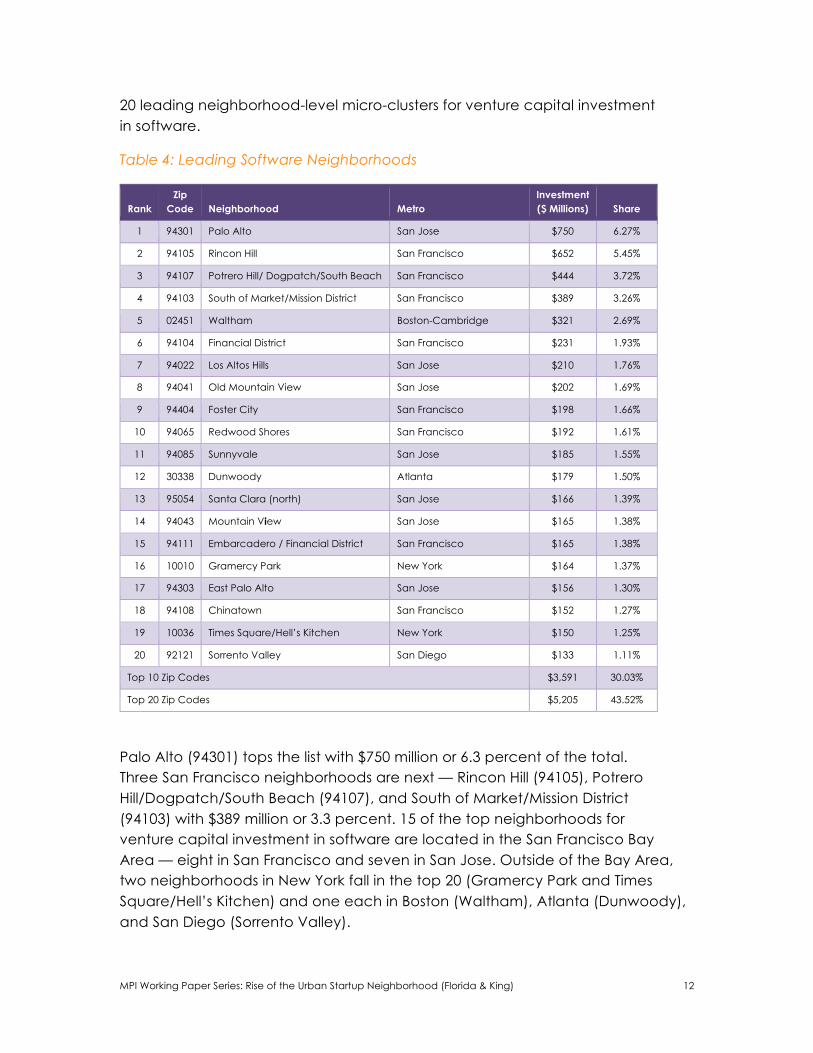
20 leading neighborhood-level micro-clusters for venture capital investment in software.
Table 4: Leading Software Neighborhoods
Rank Zip
Code Neighborhood Metro Investment ($ Millions) Share
1 94301 Palo Alto San Jose $750 6.27%
2 94105 Rincon Hill San Francisco $652 5.45%
3 94107 Potrero Hill/ Dogpatch/South Beach San Francisco $444 3.72%
4 94103 South of Market/Mission District San Francisco $389 3.26%
5 02451 Waltham Boston-Cambridge $321 2.69%
6 94104 Financial District San Francisco $231 1.93%
7 94022 Los Altos Hills San Jose $210 1.76%
8 94041 Old Mountain View San Jose $202 1.69%
9 94404 Foster City San Francisco $198 1.66%
10 94065 Redwood Shores San Francisco $192 1.61%
11 94085 Sunnyvale San Jose $185 1.55%
12 30338 Dunwoody Atlanta $179 1.50%
13 95054 Santa Clara (north) San Jose $166 1.39%
14 94043 Mountain View San Jose $165 1.38%
15 94111 Embarcadero / Financial District San Francisco $165 1.38%
16 10010 Gramercy Park New York $164 1.37%
17 94303 East Palo Alto San Jose $156 1.30%
18 94108 Chinatown San Francisco $152 1.27%
19 10036 Times Square/Hell’s Kitchen New York $150 1.25%
20 92121 Sorrento Valley San Diego $133 1.11%
Top 10 Zip Codes $3,591 30.03%
Top 20 Zip Codes $5,205 43.52%
Palo Alto (94301) tops the list with $750 million or 6.3 percent of the total. Three San Francisco neighborhoods are next — Rincon Hill (94105), Potrero Hill/Dogpatch/South Beach (94107), and South of Market/Mission District (94103) with $389 million or 3.3 percent. 15 of the top neighborhoods for venture capital investment in software are located in the San Francisco Bay Area — eight in San Francisco and seven in San Jose. Outside of the Bay Area, two neighborhoods in New York fall in the top 20 (Gramercy Park and Times Square/Hell’s Kitchen) and one each in Boston (Waltham), Atlanta (Dunwoody), and San Diego (Sorrento Valley).
MPI Working Paper Series: Rise of the Urban Startup Neighborhood (Florida & King) 13
Venture capital investment in software is highly clustered in neighborhood- level micro-clusters. The top 20 zip codes account for $5.2 billion or nearly half of the national total (43.5 percent), and the top 10 account for $3.6 billion or 30 percent of all software investment.
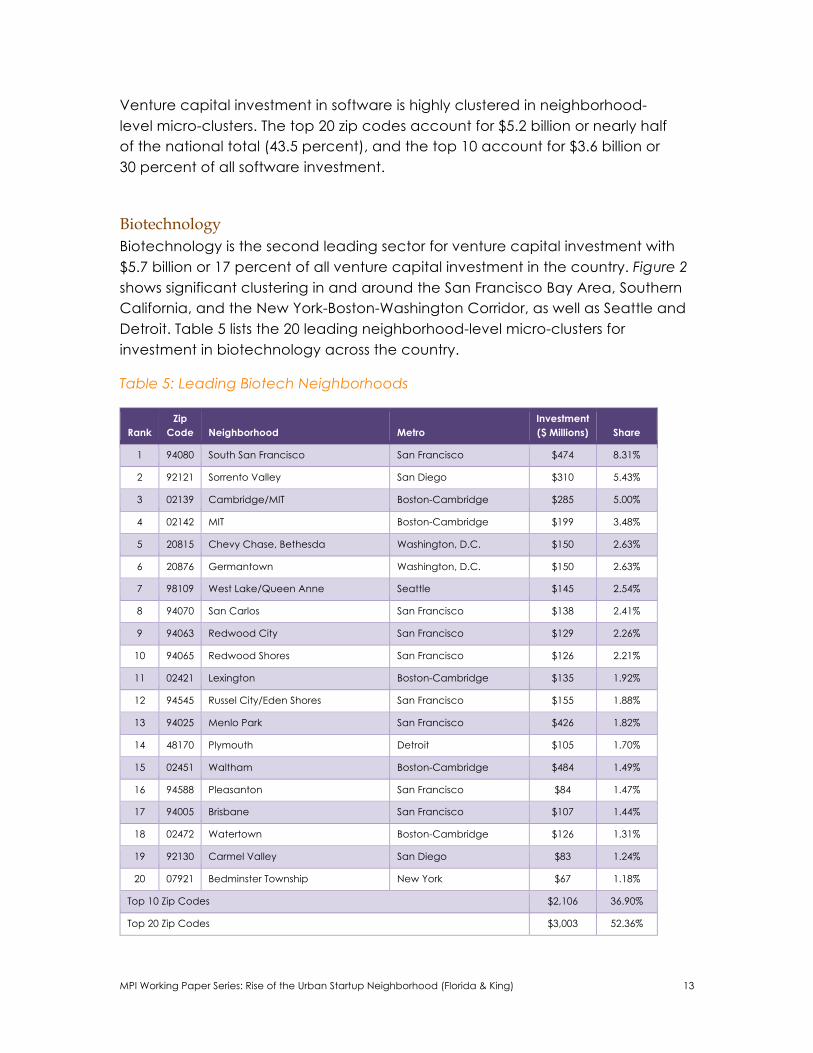
Biotechnology Biotechnology is the second leading sector for venture capital investment with $5.7 billion or 17 percent of all venture capital investment in the country. Figure 2 shows significant clustering in and around the San Francisco Bay Area, Southern California, and the New York-Boston-Washington Corridor, as well as Seattle and Detroit. Table 5 lists the 20 leading neighborhood-level micro-clusters for investment in biotechnology across the country.
Table 5: Leading Biotech Neighborhoods
Rank Zip
Code Neighborhood Metro Investment ($ Millions) Share
1 94080 South San Francisco San Francisco $474 8.31%
2 92121 Sorrento Valley San Diego $310 5.43%
3 02139 Cambridge/MIT Boston-Cambridge $285 5.00%
4 02142 MIT Boston-Cambridge $199 3.48%
5 20815 Chevy Chase, Bethesda Washington, D.C. $150 2.63%
6 20876 Germantown Washington, D.C. $150 2.63%
7 98109 West Lake/Queen Anne Seattle $145 2.54%
8 94070 San Carlos San Francisco $138 2.41%
9 94063 Redwood City San Francisco $129 2.26%
10 94065 Redwood Shores San Francisco $126 2.21%
11 02421 Lexington Boston-Cambridge $135 1.92%
12 94545 Russel City/Eden Shores San Francisco $155 1.88%
13 94025 Menlo Park San Francisco $426 1.82%
14 48170 Plymouth Detroit $105 1.70%
15 02451 Waltham Boston-Cambridge $484 1.49%
16 94588 Pleasanton San Francisco $84 1.47%
17 94005 Brisbane San Francisco $107 1.44%
18 02472 Watertown Boston-Cambridge $126 1.31%
19 92130 Carmel Valley San Diego $83 1.24%
20 07921 Bedminster Township New York $67 1.18%
Top 10 Zip Codes $2,106 36.90%
Top 20 Zip Codes $3,003 52.36%
MPI Working Paper Series: Rise of the Urban Startup Neighborhood (Florida & King) 14
Topping the list is South San Francisco (94080) with $474 million or 8.3 percent of total biotechnology investment. Next in line is Sorrento Valley in San Diego (92121) with $310 million or 5.4 percent. Two neighborhoods near MIT (02139 and 02142) and Chevy Chase/Bethesda (20815), close to the National Institutes of Health, round out the top five. Eight of the top 20 neighborhoods are located in San Francisco, five in Boston (Cambridge, MIT, Lexington, Waltham, and Watertown), two in San Diego (Sorrento Valley and Carmel Valley), and two in Washington, D.C. (Chevy Chase/Bethesda and Georgetown). Seattle (West Lake/Queen Anne), Detroit (Plymouth), and New York (Bedminster Township) have one each. Venture investment in biotechnology is often located near universities or research centers, notably around MIT, the University of California, San Francisco, and the University of California, San Diego.
Venture investment in biotechnology is also concentrated at the neighborhood level. The top 10 zip codes account for $2.1 billion or more than a third (36.9 percent) of total investment, while the top 20 account for $3 billion or over 50 percent (52.4 percent).
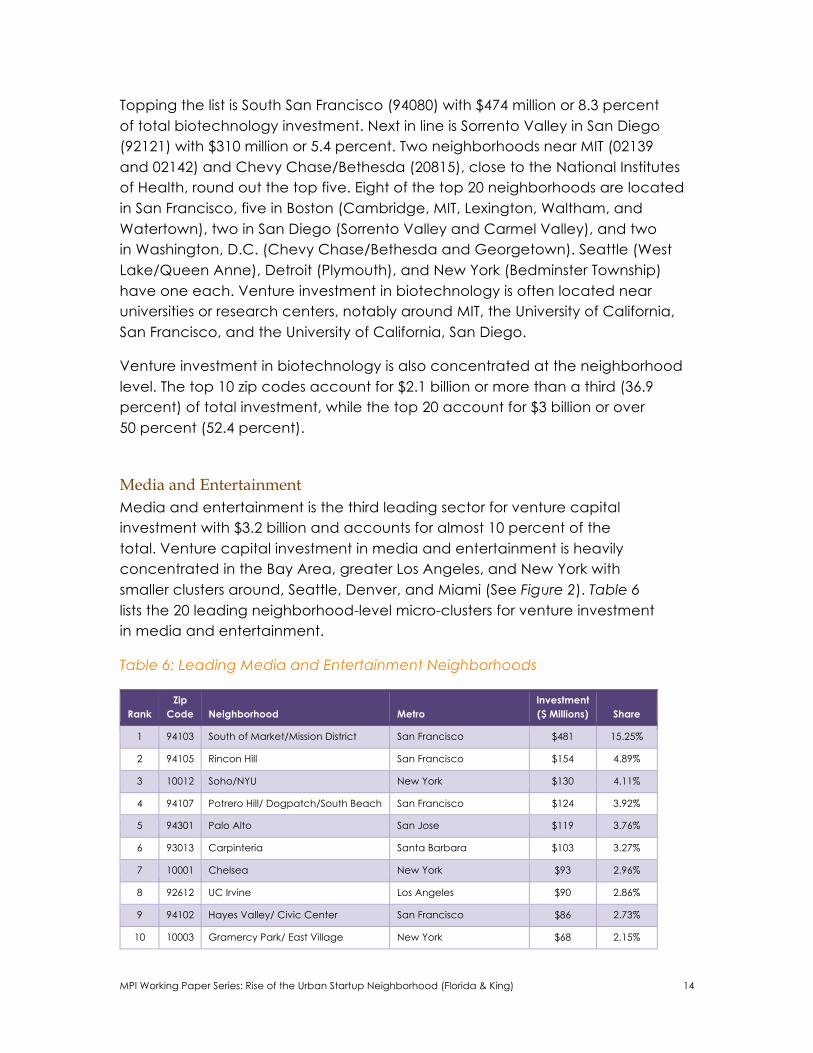
Media and Entertainment Media and entertainment is the third leading sector for venture capital investment with $3.2 billion and accounts for almost 10 percent of the total. Venture capital investment in media and entertainment is heavily concentrated in the Bay Area, greater Los Angeles, and New York with smaller clusters around, Seattle, Denver, and Miami (See Figure 2). Table 6 lists the 20 leading neighborhood-level micro-clusters for venture investment in media and entertainment.
Table 6: Leading Media and Entertainment Neighborhoods
Rank Zip
Code Neighborhood Metro Investment ($ Millions) Share
1 94103 South of Market/Mission District San Francisco $481 15.25%
2 94105 Rincon Hill San Francisco $154 4.89%
3 10012 Soho/NYU New York $130 4.11%
4 94107 Potrero Hill/ Dogpatch/South Beach San Francisco $124 3.92%
5 94301 Palo Alto San Jose $119 3.76%
6 93013 Carpinteria Santa Barbara $103 3.27%
7 10001 Chelsea New York $93 2.96%
8 92612 UC Irvine Los Angeles $90 2.86%
9 94102 Hayes Valley/ Civic Center San Francisco $86 2.73%
10 10003 Gramercy Park/ East Village New York $68 2.15%
MPI Working Paper Series: Rise of the Urban Startup Neighborhood (Florida & King) 15
11 10011 Chelsea New York $66 2.08%
12 33133 Coconut Grove Miami $65 2.06%
13 94040 Cuesta Park/Blossom Valley San Jose $63 2.00%
14 95070 Saratoga San Jose $60 1.90%
15 80202 Lodo Denver $54 1.72%
16 20036 Dupont Circle Washington, D.C. $51 1.62%
17 98121 Belltown Seattle $50 1.59%
18 94104 Financial District San Francisco $44 1.38%
19 90401 Santa Monica Los Angeles $43 1.36%
20 94108 Chinatown San Francisco $39 1.25%
Top 10 Zip Codes $1,448 45.90%
Top 20 Zip Codes $1,982 62.86%
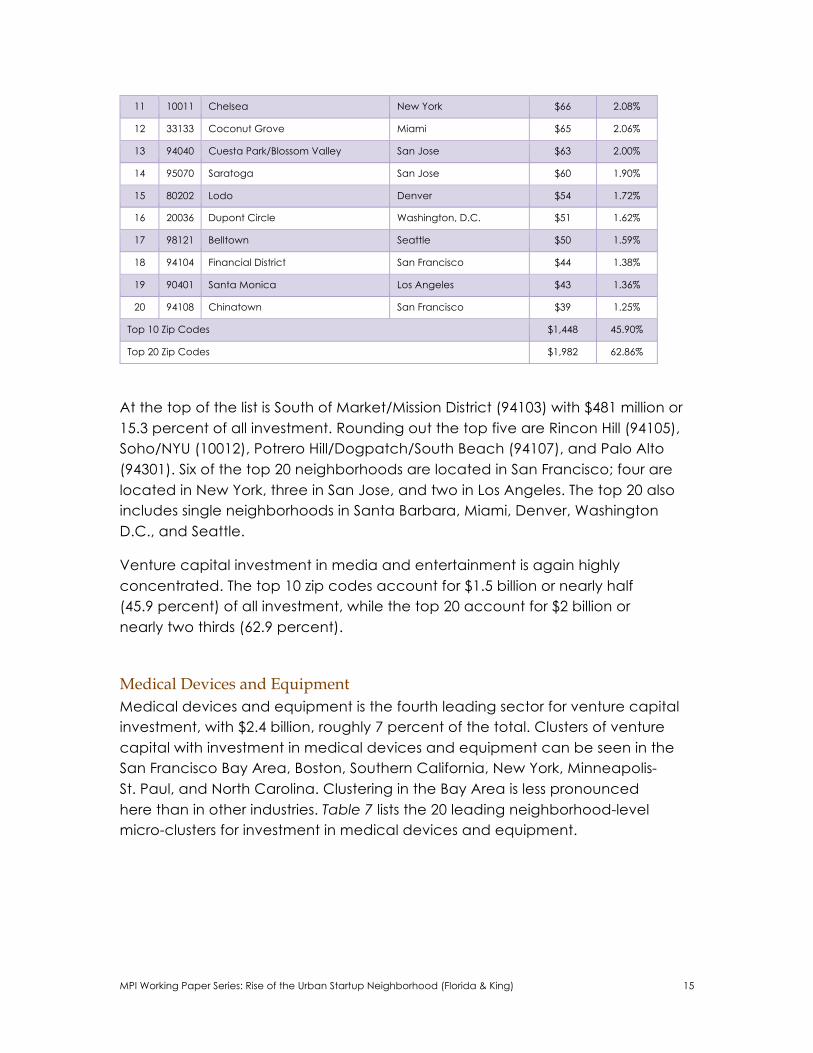
At the top of the list is South of Market/Mission District (94103) with $481 million or 15.3 percent of all investment. Rounding out the top five are Rincon Hill (94105), Soho/NYU (10012), Potrero Hill/Dogpatch/South Beach (94107), and Palo Alto (94301). Six of the top 20 neighborhoods are located in San Francisco; four are located in New York, three in San Jose, and two in Los Angeles. The top 20 also includes single neighborhoods in Santa Barbara, Miami, Denver, Washington D.C., and Seattle.
Venture capital investment in media and entertainment is again highly concentrated. The top 10 zip codes account for $1.5 billion or nearly half (45.9 percent) of all investment, while the top 20 account for $2 billion or nearly two thirds (62.9 percent).
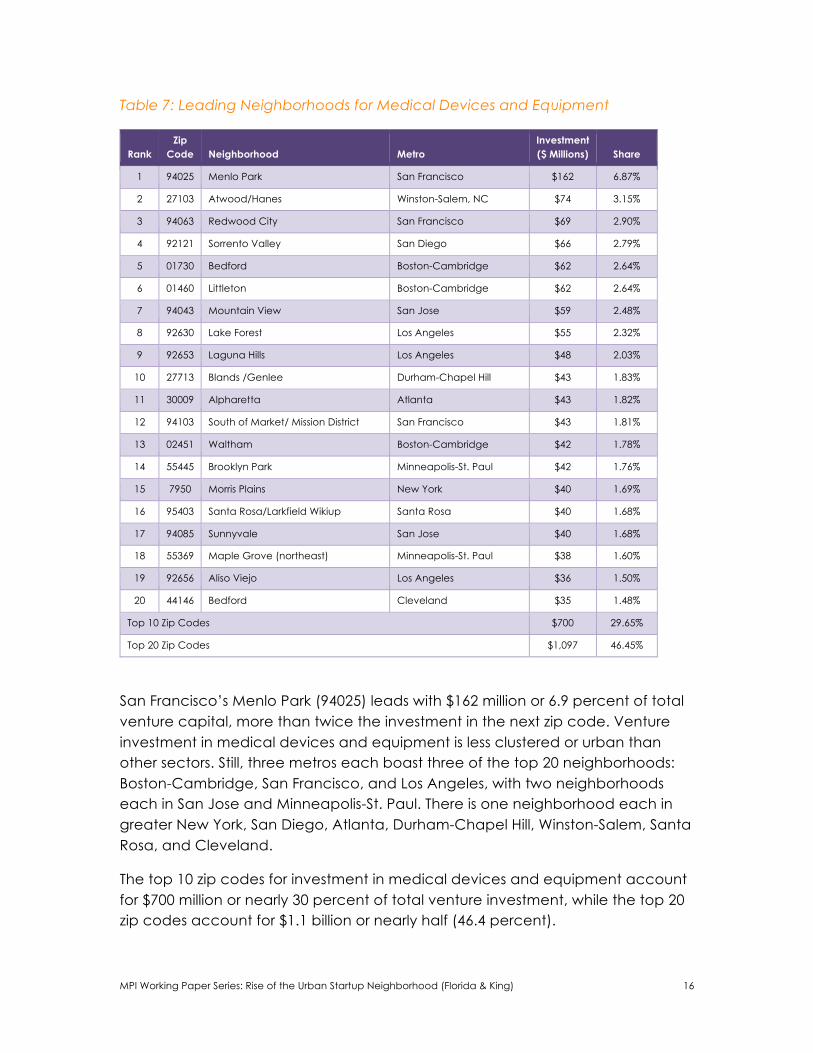
Medical Devices and Equipment Medical devices and equipment is the fourth leading sector for venture capital investment, with $2.4 billion, roughly 7 percent of the total. Clusters of venture capital with investment in medical devices and equipment can be seen in the San Francisco Bay Area, Boston, Southern California, New York, Minneapolis- St. Paul, and North Carolina. Clustering in the Bay Area is less pronounced here than in other industries. Table 7 lists the 20 leading neighborhood-level micro-clusters for investment in medical devices and equipment.
MPI Working Paper Series: Rise of the Urban Startup Neighborhood (Florida & King) 16
Table 7: Leading Neighborhoods for Medical Devices and Equipment
Rank Zip
Code Neighborhood Metro Investment ($ Millions) Share
1 94025 Menlo Park San Francisco $162 6.87%
2 27103 Atwood/Hanes Winston-Salem, NC $74 3.15%
3 94063 Redwood City San Francisco $69 2.90%
4 92121 Sorrento Valley San Diego $66 2.79%
5 01730 Bedford Boston-Cambridge $62 2.64%
6 01460 Littleton Boston-Cambridge $62 2.64%
7 94043 Mountain View San Jose $59 2.48%
8 92630 Lake Forest Los Angeles $55 2.32%
9 92653 Laguna Hills Los Angeles $48 2.03%
10 27713 Blands /Genlee Durham-Chapel Hill $43 1.83%
11 30009 Alpharetta Atlanta $43 1.82%
12 94103 South of Market/ Mission District San Francisco $43 1.81%
13 02451 Waltham Boston-Cambridge $42 1.78%
14 55445 Brooklyn Park Minneapolis-St. Paul $42 1.76%
15 7950 Morris Plains New York $40 1.69%
16 95403 Santa Rosa/Larkfield Wikiup Santa Rosa $40 1.68%
17 94085 Sunnyvale San Jose $40 1.68%
18 55369 Maple Grove (northeast) Minneapolis-St. Paul $38 1.60%
19 92656 Aliso Viejo Los Angeles $36 1.50%
20 44146 Bedford Cleveland $35 1.48%
Top 10 Zip Codes $700 29.65%
Top 20 Zip Codes $1,097 46.45%
San Francisco’s Menlo Park (94025) leads with $162 million or 6.9 percent of total venture capital, more than twice the investment in the next zip code. Venture investment in medical devices and equipment is less clustered or urban than other sectors. Still, three metros each boast three of the top 20 neighborhoods: Boston-Cambridge, San Francisco, and Los Angeles, with two neighborhoods each in San Jose and Minneapolis-St. Paul. There is one neighborhood each in greater New York, San Diego, Atlanta, Durham-Chapel Hill, Winston-Salem, Santa Rosa, and Cleveland.
The top 10 zip codes for investment in medical devices and equipment account for $700 million or nearly 30 percent of total venture investment, while the top 20 zip codes account for $1.1 billion or nearly half (46.4 percent).
MPI Working Paper Series: Rise of the Urban Startup Neighborhood (Florida & King) 17
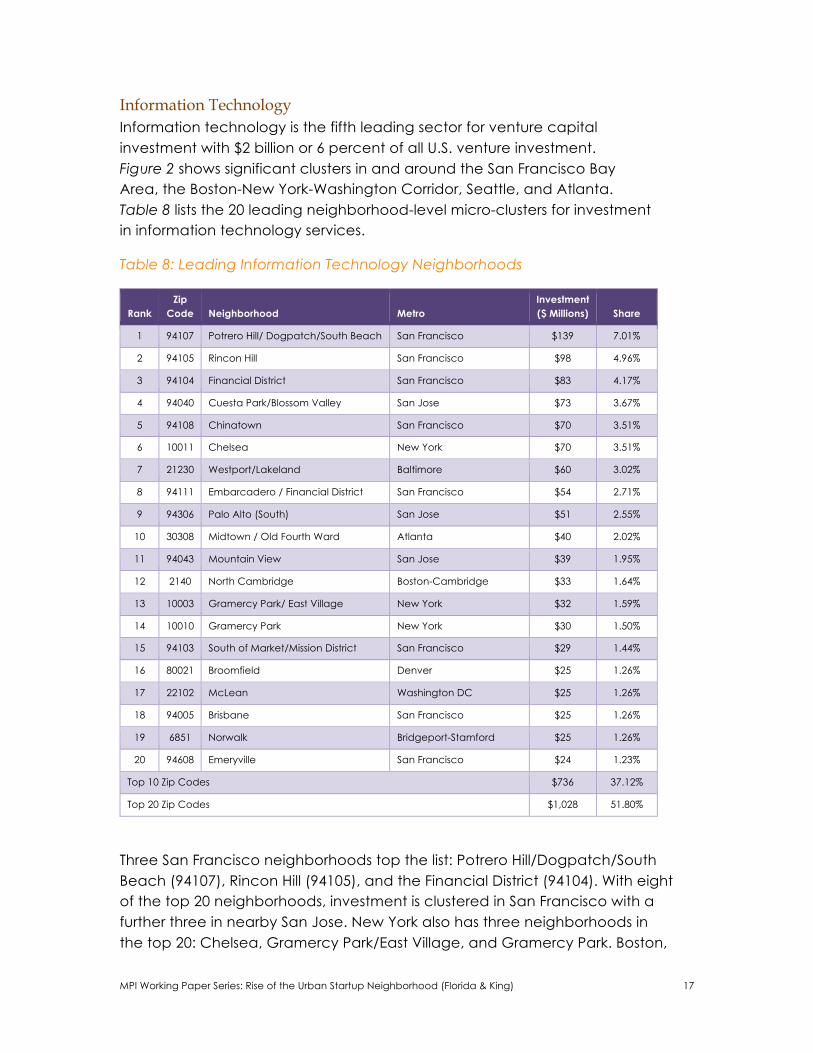
Information Technology Information technology is the fifth leading sector for venture capital investment with $2 billion or 6 percent of all U.S. venture investment. Figure 2 shows significant clusters in and around the San Francisco Bay Area, the Boston-New York-Washington Corridor, Seattle, and Atlanta. Table 8 lists the 20 leading neighborhood-level micro-clusters for investment in information technology services.
Table 8: Leading Information Technology Neighborhoods
Rank Zip
Code Neighborhood Metro Investment ($ Millions) Share
1 94107 Potrero Hill/ Dogpatch/South Beach San Francisco $139 7.01%
2 94105 Rincon Hill San Francisco $98 4.96%
3 94104 Financial District San Francisco $83 4.17%
4 94040 Cuesta Park/Blossom Valley San Jose $73 3.67%
5 94108 Chinatown San Francisco $70 3.51%
6 10011 Chelsea New York $70 3.51%
7 21230 Westport/Lakeland Baltimore $60 3.02%
8 94111 Embarcadero / Financial District San Francisco $54 2.71%
9 94306 Palo Alto (South) San Jose $51 2.55%
10 30308 Midtown / Old Fourth Ward Atlanta $40 2.02%
11 94043 Mountain View San Jose $39 1.95%
12 2140 North Cambridge Boston-Cambridge $33 1.64%
13 10003 Gramercy Park/ East Village New York $32 1.59%
14 10010 Gramercy Park New York $30 1.50%
15 94103 South of Market/Mission District San Francisco $29 1.44%
16 80021 Broomfield Denver $25 1.26%
17 22102 McLean Washington DC $25 1.26%
18 94005 Brisbane San Francisco $25 1.26%
19 6851 Norwalk Bridgeport-Stamford $25 1.26%
20 94608 Emeryville San Francisco $24 1.23%
Top 10 Zip Codes $736 37.12%
Top 20 Zip Codes $1,028 51.80%
Three San Francisco neighborhoods top the list: Potrero Hill/Dogpatch/South Beach (94107), Rincon Hill (94105), and the Financial District (94104). With eight of the top 20 neighborhoods, investment is clustered in San Francisco with a further three in nearby San Jose. New York also has three neighborhoods in the top 20: Chelsea, Gramercy Park/East Village, and Gramercy Park. Boston,
MPI Working Paper Series: Rise of the Urban Startup Neighborhood (Florida & King) 18
Washington D.C., Baltimore, Atlanta, Denver, and Bridgeport, CT each claim a single neighborhood.
Venture capital investment in information technology services is again concentrated. Overall, the top 10 neighborhoods account for $736 million or 37.1 percent of venture investment, while the top 20 account for more than $1 billion or more than half (51.8 percent) of all venture investment in the sector.
MPI Working Paper Series: Rise of the Urban Startup Neighborhood (Florida & King) 19
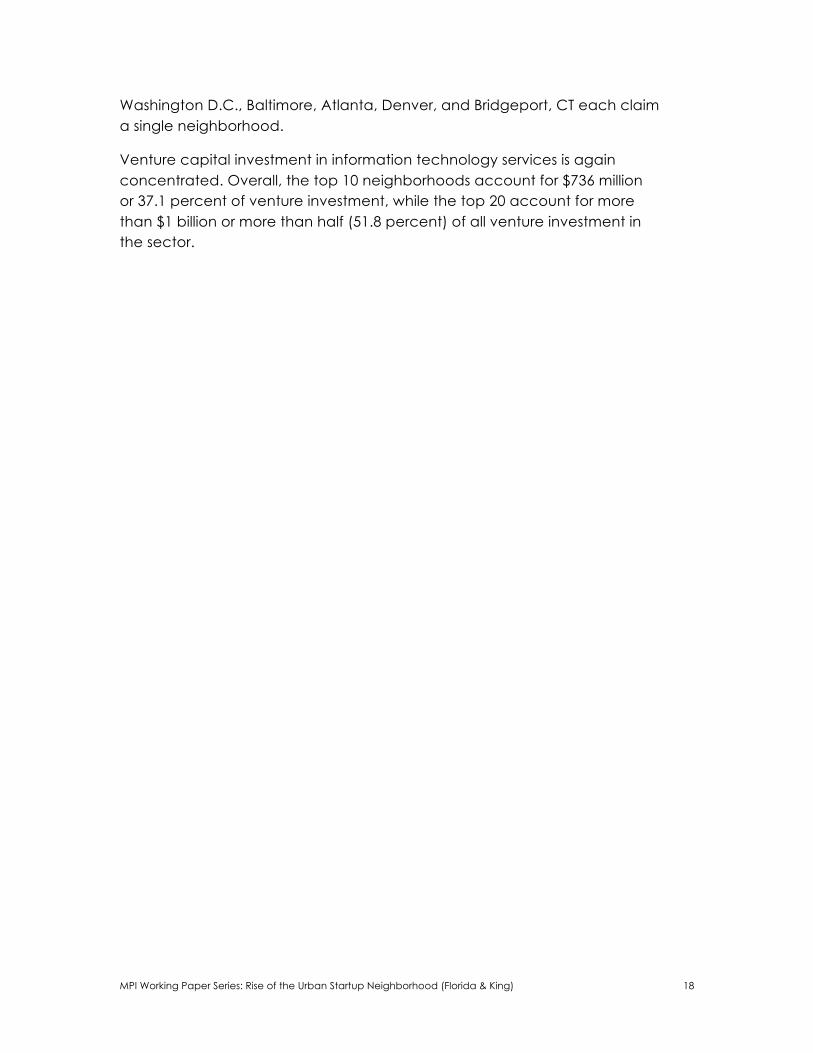
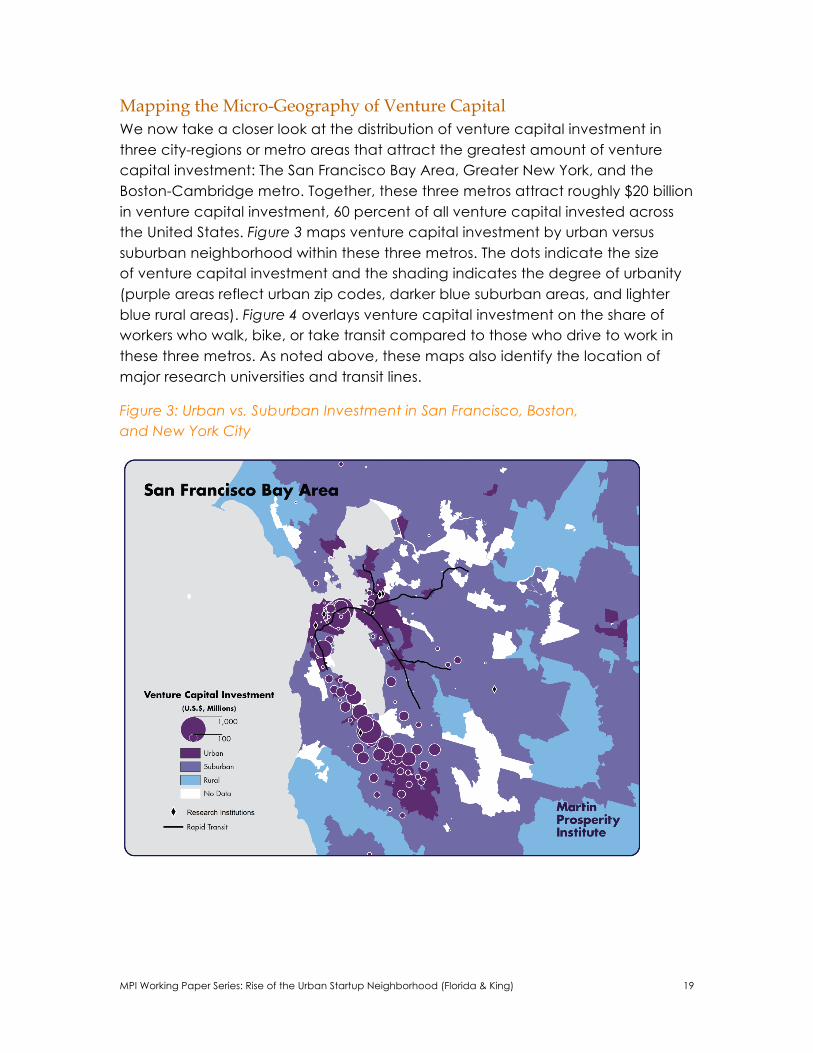
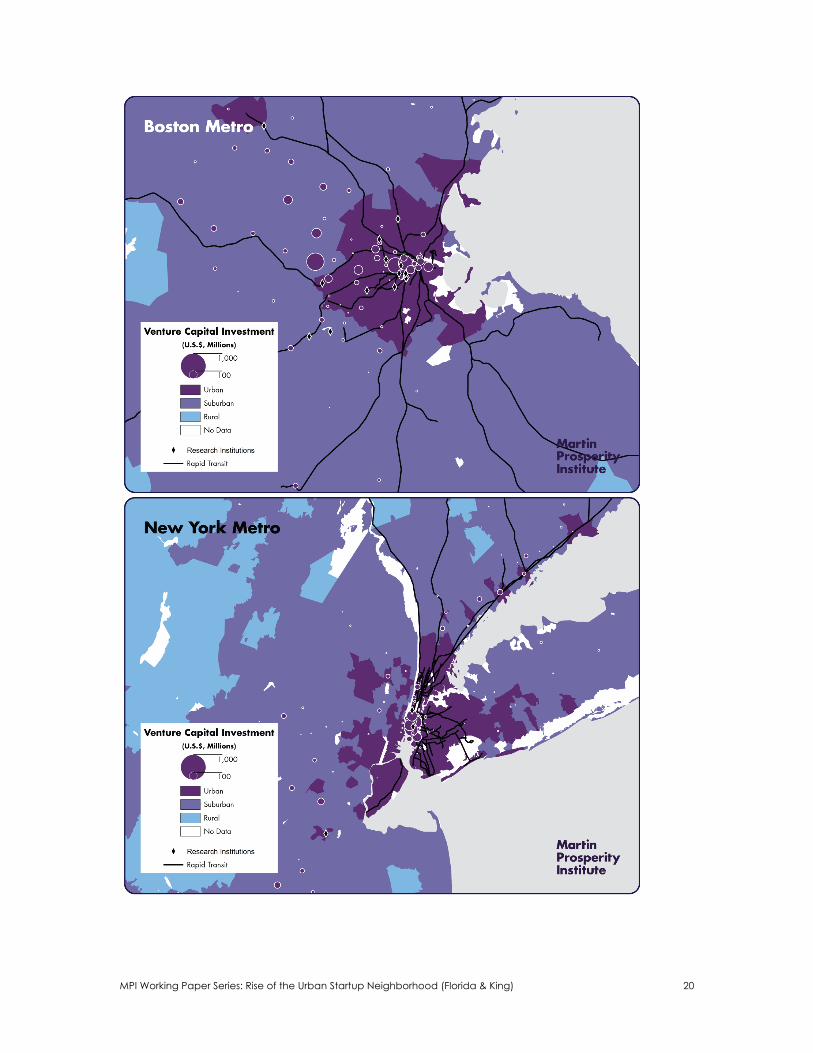
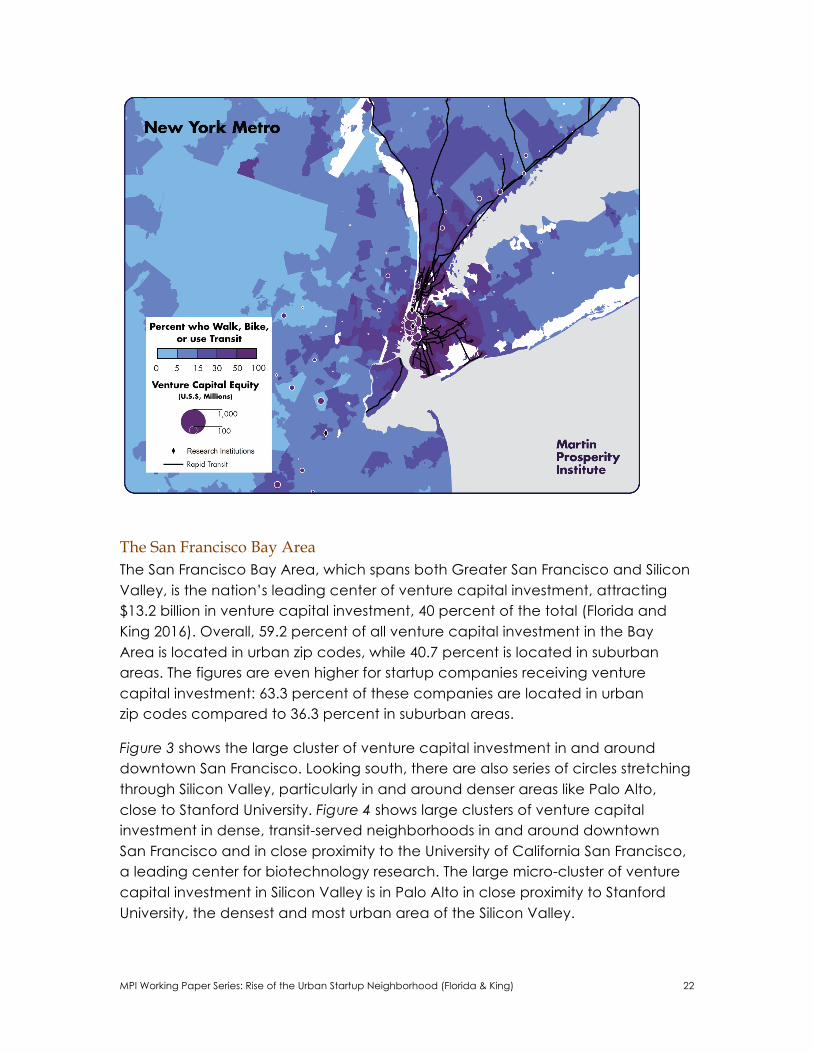
Mapping the Micro-Geography of Venture Capital We now take a closer look at the distribution of venture capital investment in three city-regions or metro areas that attract the greatest amount of venture capital investment: The San Francisco Bay Area, Greater New York, and the Boston-Cambridge metro. Together, these three metros attract roughly $20 billion in venture capital investment, 60 percent of all venture capital invested across the United States. Figure 3 maps venture capital investment by urban versus suburban neighborhood within these three metros. The dots indicate the size of venture capital investment and the shading indicates the degree of urbanity (purple areas reflect urban zip codes, darker blue suburban areas, and lighter blue rural areas). Figure 4 overlays venture capital investment on the share of workers who walk, bike, or take transit compared to those who drive to work in these three metros. As noted above, these maps also identify the location of major research universities and transit lines.
Figure 3: Urban vs. Suburban Investment in San Francisco, Boston, and New York City
MPI Working Paper Series: Rise of the Urban Startup Neighborhood (Florida & King) 20
MPI Working Paper Series: Rise of the Urban Startup Neighborhood (Florida & King) 21
Figure 4: Venture Investment by Percent Who Walk, Bike, or Use Transit in San Francisco, Boston, and New York City
MPI Working Paper Series: Rise of the Urban Startup Neighborhood (Florida & King) 22
The San Francisco Bay Area The San Francisco Bay Area, which spans both Greater San Francisco and Silicon Valley, is the nation’s leading center of venture capital investment, attracting $13.2 billion in venture capital investment, 40 percent of the total (Florida and King 2016). Overall, 59.2 percent of all venture capital investment in the Bay Area is located in urban zip codes, while 40.7 percent is located in suburban areas. The figures are even higher for startup companies receiving venture capital investment: 63.3 percent of these companies are located in urban zip codes compared to 36.3 percent in suburban areas.
Figure 3 shows the large cluster of venture capital investment in and around downtown San Francisco. Looking south, there are also series of circles stretching through Silicon Valley, particularly in and around denser areas like Palo Alto, close to Stanford University. Figure 4 shows large clusters of venture capital investment in dense, transit-served neighborhoods in and around downtown San Francisco and in close proximity to the University of California San Francisco, a leading center for biotechnology research. The large micro-cluster of venture capital investment in Silicon Valley is in Palo Alto in close proximity to Stanford University, the densest and most urban area of the Silicon Valley.
MPI Working Paper Series: Rise of the Urban Startup Neighborhood (Florida & King) 23
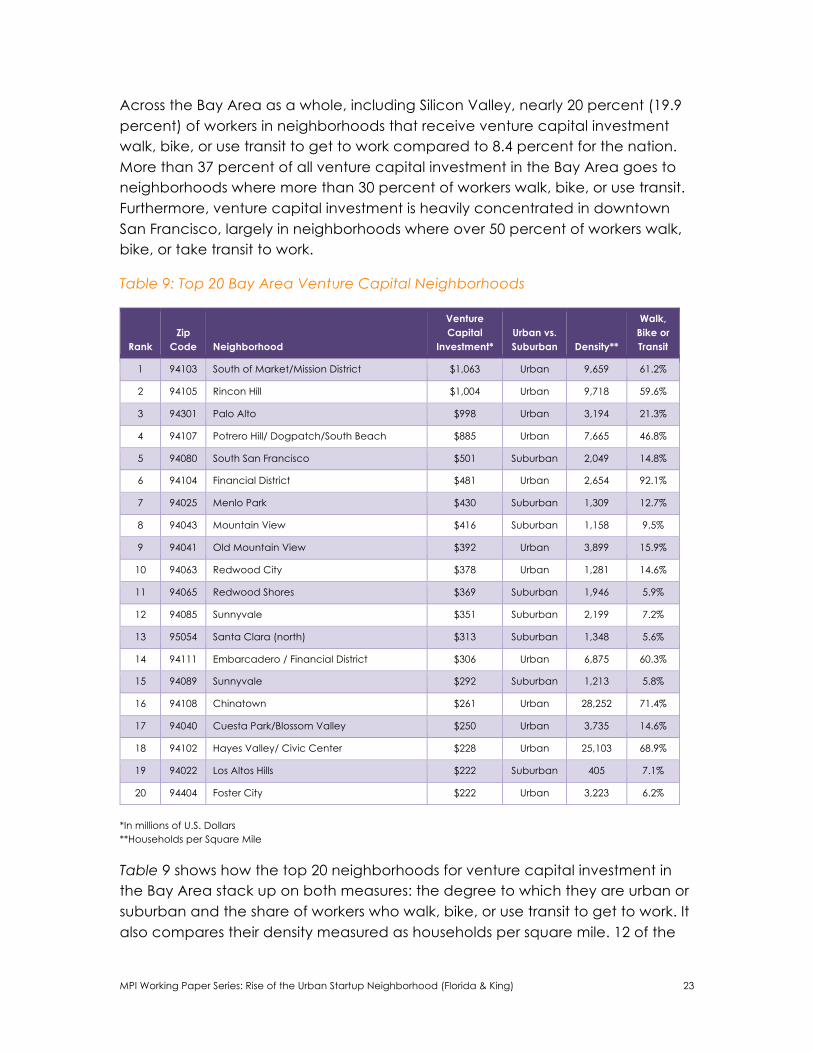
Across the Bay Area as a whole, including Silicon Valley, nearly 20 percent (19.9 percent) of workers in neighborhoods that receive venture capital investment walk, bike, or use transit to get to work compared to 8.4 percent for the nation. More than 37 percent of all venture capital investment in the Bay Area goes to neighborhoods where more than 30 percent of workers walk, bike, or use transit. Furthermore, venture capital investment is heavily concentrated in downtown San Francisco, largely in neighborhoods where over 50 percent of workers walk, bike, or take transit to work.
Table 9: Top 20 Bay Area Venture Capital Neighborhoods
Rank Zip
Code Neighborhood
Venture Capital
Investment* Urban vs. Suburban Density**
Walk, Bike or Transit
1 94103 South of Market/Mission District $1,063 Urban 9,659 61.2%
2 94105 Rincon Hill $1,004 Urban 9,718 59.6%
3 94301 Palo Alto $998 Urban 3,194 21.3%
4 94107 Potrero Hill/ Dogpatch/South Beach $885 Urban 7,665 46.8%
5 94080 South San Francisco $501 Suburban 2,049 14.8%
6 94104 Financial District $481 Urban 2,654 92.1%
7 94025 Menlo Park $430 Suburban 1,309 12.7%
8 94043 Mountain View $416 Suburban 1,158 9.5%
9 94041 Old Mountain View $392 Urban 3,899 15.9%
10 94063 Redwood City $378 Urban 1,281 14.6%
11 94065 Redwood Shores $369 Suburban 1,946 5.9%
12 94085 Sunnyvale $351 Suburban 2,199 7.2%
13 95054 Santa Clara (north) $313 Suburban 1,348 5.6%
14 94111 Embarcadero / Financial District $306 Urban 6,875 60.3%
15 94089 Sunnyvale $292 Suburban 1,213 5.8%
16 94108 Chinatown $261 Urban 28,252 71.4%
17 94040 Cuesta Park/Blossom Valley $250 Urban 3,735 14.6%
18 94102 Hayes Valley/ Civic Center $228 Urban 25,103 68.9%
19 94022 Los Altos Hills $222 Suburban 405 7.1%
20 94404 Foster City $222 Urban 3,223 6.2%
*In millions of U.S. Dollars **Households per Square Mile
Table 9 shows how the top 20 neighborhoods for venture capital investment in the Bay Area stack up on both measures: the degree to which they are urban or suburban and the share of workers who walk, bike, or use transit to get to work. It also compares their density measured as households per square mile. 12 of the
MPI Working Paper Series: Rise of the Urban Startup Neighborhood (Florida & King) 24
top 20 neighborhoods are urban, while eight are suburban. Of the top 10, seven are urban, while just three are suburban. Five of the top 20 have densities greater than 5,000 people per square mile. The two leading neighborhoods — each of which attracts more than a billion dollars in venture capital investment — have densities of roughly 10,000 people per square mile. Roughly 60 percent of workers walk, bike, or take transit to work in these neighborhoods. While suburban nerdistans still play a role in Bay Area venture capital and startup activity, the preponderance of it is located in urban neighborhoods in the city itself.
Boston-Cambridge With its cluster of leading edge universities and research institutions, the Boston-Cambridge metro is the nation’s second leading center of venture capital investment, attracting $3.4 billion, roughly 10 percent of the national total.
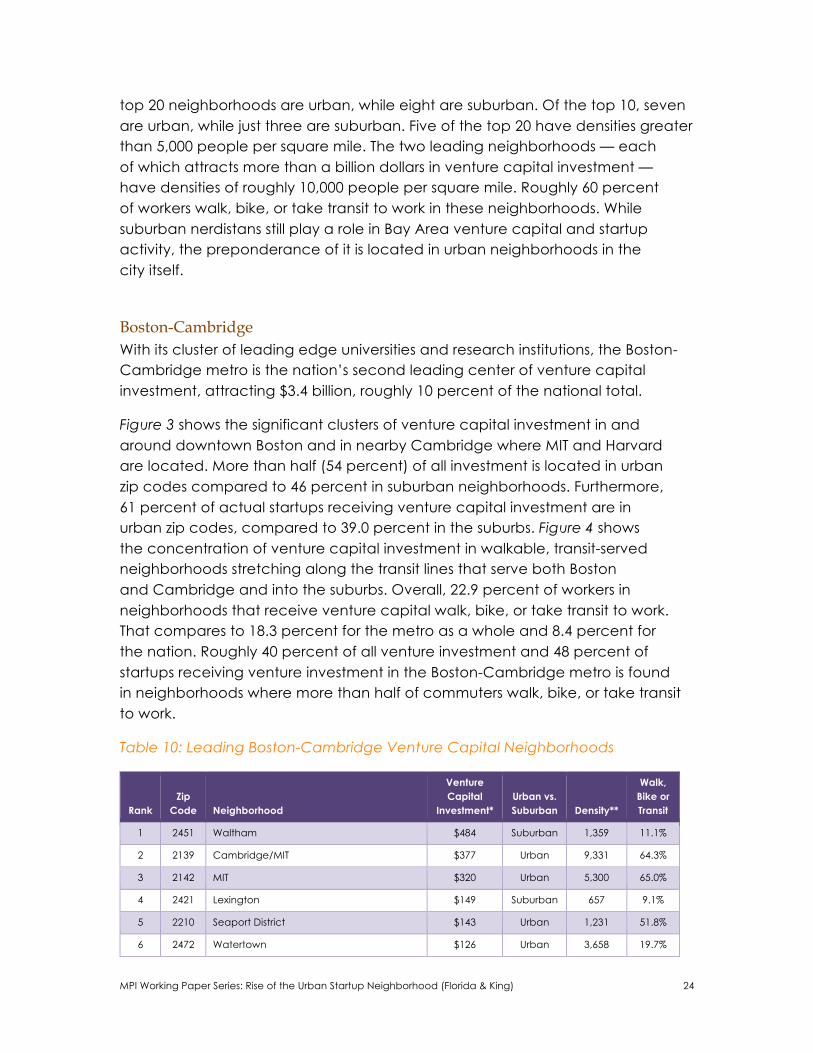
Figure 3 shows the significant clusters of venture capital investment in and around downtown Boston and in nearby Cambridge where MIT and Harvard are located. More than half (54 percent) of all investment is located in urban zip codes compared to 46 percent in suburban neighborhoods. Furthermore, 61 percent of actual startups receiving venture capital investment are in urban zip codes, compared to 39.0 percent in the suburbs. Figure 4 shows the concentration of venture capital investment in walkable, transit-served neighborhoods stretching along the transit lines that serve both Boston and Cambridge and into the suburbs. Overall, 22.9 percent of workers in neighborhoods that receive venture capital walk, bike, or take transit to work. That compares to 18.3 percent for the metro as a whole and 8.4 percent for the nation. Roughly 40 percent of all venture investment and 48 percent of startups receiving venture investment in the Boston-Cambridge metro is found in neighborhoods where more than half of commuters walk, bike, or take transit to work.
Table 10: Leading Boston-Cambridge Venture Capital Neighborhoods
Rank Zip
Code Neighborhood
Venture Capital
Investment* Urban vs. Suburban Density**
Walk, Bike or Transit
1 2451 Waltham $484 Suburban 1,359 11.1%
2 2139 Cambridge/MIT $377 Urban 9,331 64.3%
3 2142 MIT $320 Urban 5,300 65.0%
4 2421 Lexington $149 Suburban 657 9.1%
5 2210 Seaport District $143 Urban 1,231 51.8%
6 2472 Watertown $126 Urban 3,658 19.7%
MPI Working Paper Series: Rise of the Urban Startup Neighborhood (Florida & King) 25
7 1730 Bedford $125 Suburban 375 3.6%
8 2116 Back Bay $108 Urban 17,502 61.6%
9 2140 North Cambridge $95 Urban 7,139 47.3%
10 2453 Brandeis/Waltham $94 Urban 3,251 16.3%
11 2110 Waterfront $83 Urban 5,665 72.0%
12 1803 Burlington $77 Suburban 792 5.0%
13 2141 Cambridge $68 Urban 9,270 60.4%
14 1460 Littleton $62 Suburban 200 4.2%
15 2111 Chinatown $56 Urban 12,745 70.4%
16 1720 Acton $56 Suburban 404 6.9%
17 2138 Harvard $50 Urban 5,095 54.9%
18 1821 Billerica $48 Suburban 653 4.0%
19 1760 Natick $48 Suburban 900 10.8%
20 2038 Franklin $40 Suburban 413 11.3%
*In millions of U.S. Dollars **Households per Square Mile
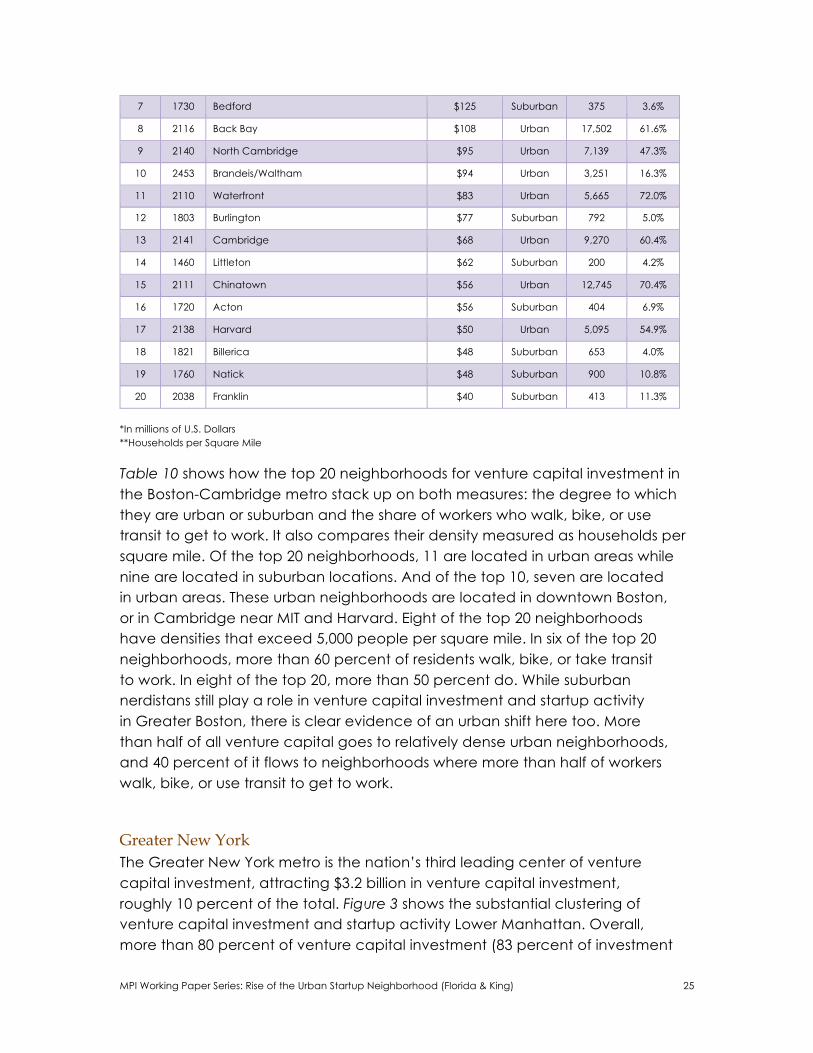
Table 10 shows how the top 20 neighborhoods for venture capital investment in the Boston-Cambridge metro stack up on both measures: the degree to which they are urban or suburban and the share of workers who walk, bike, or use transit to get to work. It also compares their density measured as households per square mile. Of the top 20 neighborhoods, 11 are located in urban areas while nine are located in suburban locations. And of the top 10, seven are located in urban areas. These urban neighborhoods are located in downtown Boston, or in Cambridge near MIT and Harvard. Eight of the top 20 neighborhoods have densities that exceed 5,000 people per square mile. In six of the top 20 neighborhoods, more than 60 percent of residents walk, bike, or take transit to work. In eight of the top 20, more than 50 percent do. While suburban nerdistans still play a role in venture capital investment and startup activity in Greater Boston, there is clear evidence of an urban shift here too. More than half of all venture capital goes to relatively dense urban neighborhoods, and 40 percent of it flows to neighborhoods where more than half of workers walk, bike, or use transit to get to work.
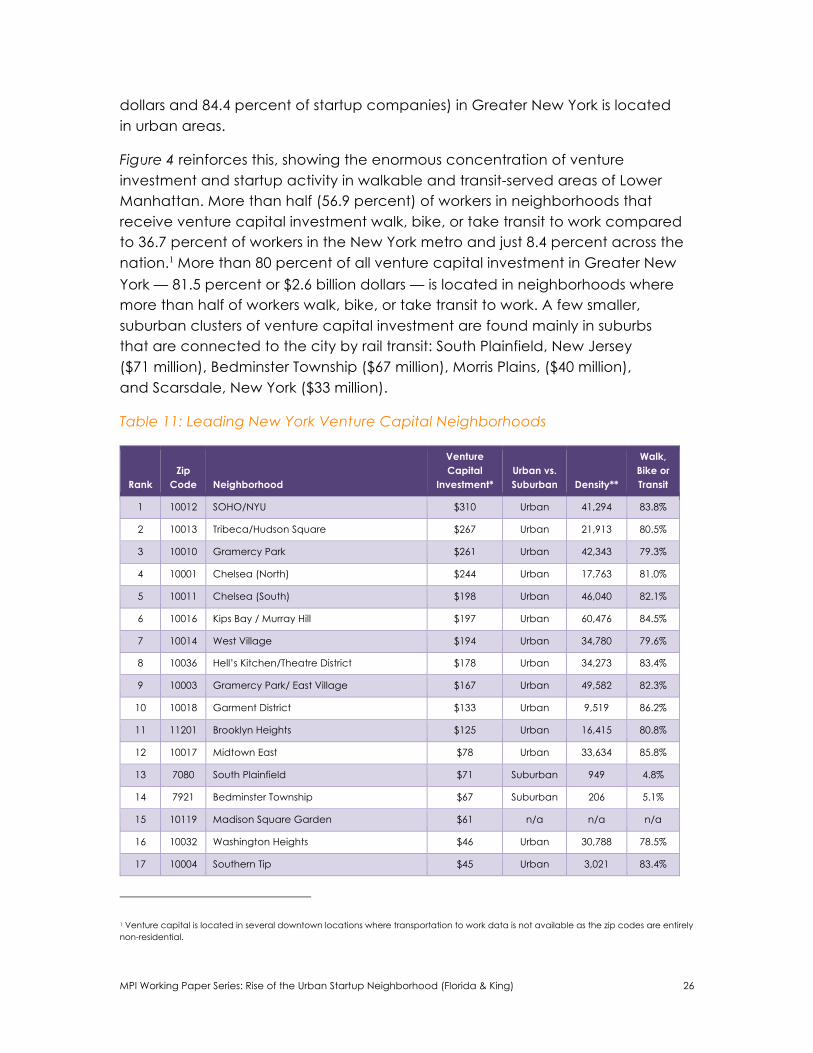
Greater New York The Greater New York metro is the nation’s third leading center of venture capital investment, attracting $3.2 billion in venture capital investment, roughly 10 percent of the total. Figure 3 shows the substantial clustering of venture capital investment and startup activity Lower Manhattan. Overall, more than 80 percent of venture capital investment (83 percent of investment
MPI Working Paper Series: Rise of the Urban Startup Neighborhood (Florida & King) 26
dollars and 84.4 percent of startup companies) in Greater New York is located in urban areas.
Figure 4 reinforces this, showing the enormous concentration of venture investment and startup activity in walkable and transit-served areas of Lower Manhattan. More than half (56.9 percent) of workers in neighborhoods that receive venture capital investment walk, bike, or take transit to work compared to 36.7 percent of workers in the New York metro and just 8.4 percent across the nation.1 More than 80 percent of all venture capital investment in Greater New York — 81.5 percent or $2.6 billion dollars — is located in neighborhoods where more than half of workers walk, bike, or take transit to work. A few smaller, suburban clusters of venture capital investment are found mainly in suburbs that are connected to the city by rail transit: South Plainfield, New Jersey ($71 million), Bedminster Township ($67 million), Morris Plains, ($40 million), and Scarsdale, New York ($33 million).
Table 11: Leading New York Venture Capital Neighborhoods
Rank Zip
Code Neighborhood
Venture Capital
Investment* Urban vs. Suburban Density**
Walk, Bike or Transit
1 10012 SOHO/NYU $310 Urban 41,294 83.8%
2 10013 Tribeca/Hudson Square $267 Urban 21,913 80.5%
3 10010 Gramercy Park $261 Urban 42,343 79.3%
4 10001 Chelsea (North) $244 Urban 17,763 81.0%
5 10011 Chelsea (South) $198 Urban 46,040 82.1%
6 10016 Kips Bay / Murray Hill $197 Urban 60,476 84.5%
7 10014 West Village $194 Urban 34,780 79.6%
8 10036 Hell’s Kitchen/Theatre District $178 Urban 34,273 83.4%
9 10003 Gramercy Park/ East Village $167 Urban 49,582 82.3%
10 10018 Garment District $133 Urban 9,519 86.2%
11 11201 Brooklyn Heights $125 Urban 16,415 80.8%
12 10017 Midtown East $78 Urban 33,634 85.8%
13 7080 South Plainfield $71 Suburban 949 4.8%
14 7921 Bedminster Township $67 Suburban 206 5.1%
15 10119 Madison Square Garden $61 n/a n/a n/a
16 10032 Washington Heights $46 Urban 30,788 78.5%
17 10004 Southern Tip $45 Urban 3,021 83.4%
1 Venture capital is located in several downtown locations where transportation to work data is not available as the zip codes are entirely non-residential.
MPI Working Paper Series: Rise of the Urban Startup Neighborhood (Florida & King) 27
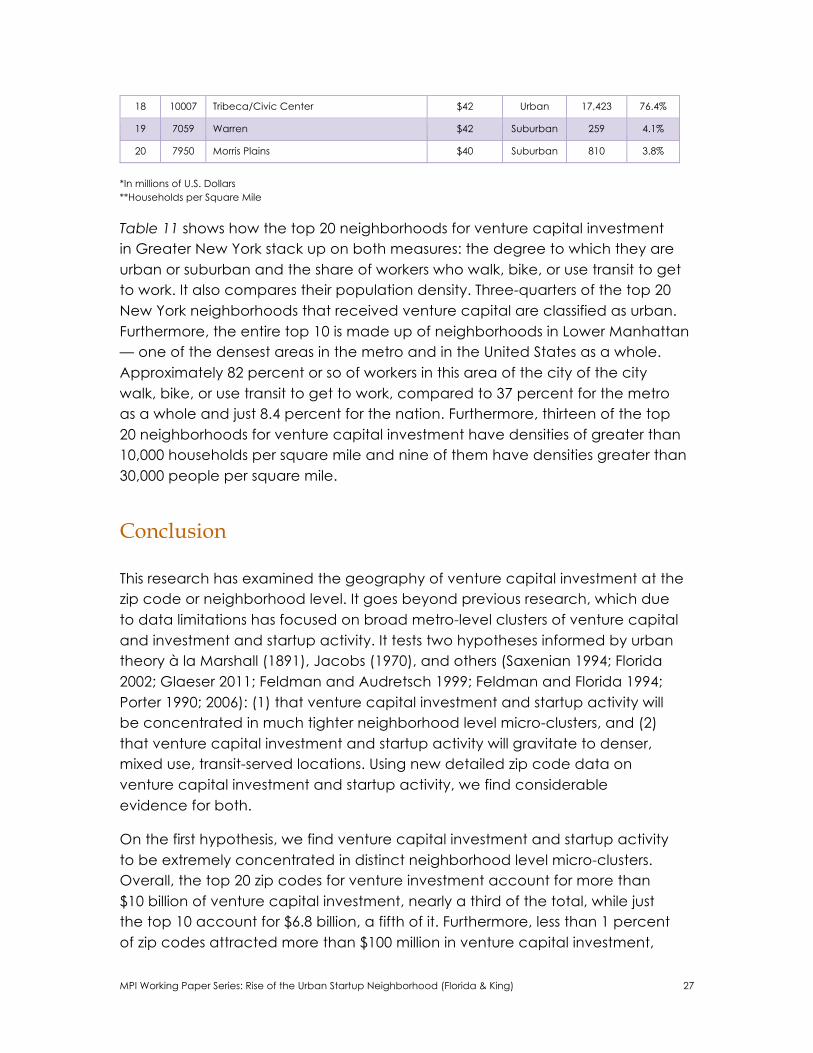
18 10007 Tribeca/Civic Center $42 Urban 17,423 76.4%
19 7059 Warren $42 Suburban 259 4.1%
20 7950 Morris Plains $40 Suburban 810 3.8%
*In millions of U.S. Dollars **Households per Square Mile
Table 11 shows how the top 20 neighborhoods for venture capital investment in Greater New York stack up on both measures: the degree to which they are urban or suburban and the share of workers who walk, bike, or use transit to get to work. It also compares their population density. Three-quarters of the top 20 New York neighborhoods that received venture capital are classified as urban. Furthermore, the entire top 10 is made up of neighborhoods in Lower Manhattan — one of the densest areas in the metro and in the United States as a whole. Approximately 82 percent or so of workers in this area of the city of the city walk, bike, or use transit to get to work, compared to 37 percent for the metro as a whole and just 8.4 percent for the nation. Furthermore, thirteen of the top 20 neighborhoods for venture capital investment have densities of greater than 10,000 households per square mile and nine of them have densities greater than 30,000 people per square mile.
Conclusion This research has examined the geography of venture capital investment at the zip code or neighborhood level. It goes beyond previous research, which due to data limitations has focused on broad metro-level clusters of venture capital and investment and startup activity. It tests two hypotheses informed by urban theory à la Marshall (1891), Jacobs (1970), and others (Saxenian 1994; Florida 2002; Glaeser 2011; Feldman and Audretsch 1999; Feldman and Florida 1994; Porter 1990; 2006): (1) that venture capital investment and startup activity will be concentrated in much tighter neighborhood level micro-clusters, and (2) that venture capital investment and startup activity will gravitate to denser, mixed use, transit-served locations. Using new detailed zip code data on venture capital investment and startup activity, we find considerable evidence for both.
On the first hypothesis, we find venture capital investment and startup activity to be extremely concentrated in distinct neighborhood level micro-clusters. Overall, the top 20 zip codes for venture investment account for more than $10 billion of venture capital investment, nearly a third of the total, while just the top 10 account for $6.8 billion, a fifth of it. Furthermore, less than 1 percent of zip codes attracted more than $100 million in venture capital investment,
MPI Working Paper Series: Rise of the Urban Startup Neighborhood (Florida & King) 28
and these neighborhoods account for more than 60 percent of all venture capital investment. In fact, less than 3 percent of all zip codes received any venture capital investment at all; and of these, roughly half attracted less than $5 million each.
With regard to the second hypothesis, we find considerable evidence that these micro-clusters of venture capital investment and startup activity are located in the dense, mixed-use, transit-served urban neighborhoods that urban theory would predict. While previous research identified a preponderance of venture capital investment in suburban areas like California’s Silicon Valley, the Route 128 suburbs outside Boston and other similar areas (Florida and Kenney 1988; 1988a), our research finds the majority of venture capital investment and startup activity to be in urban neighborhoods. Across the nation as a whole, more than half of all venture capital investment is located in urban zip codes. In New York, more than 80 percent of venture investment goes to urban zip codes; in the San Francisco Bay Area, roughly 60 percent does, and in the Boston-Cambridge area more than half does. Furthermore, there are two billion dollar venture capital neighborhoods in the United States, both in downtown San Francisco. Palo Alto, neighboring Stanford University, comes close with $988 million in venture capital investment.
We also find clear evidence of substantial micro-clusters of venture capital investment and startup activity in walkable, bikeable, and transit served urban neighborhoods. Across all neighborhoods receiving venture capital investment, nearly twice as large a share of workers who walk, bike, or use transit to get to work compared to national average. More than a quarter of venture capital investment is concentrated in neighborhoods where more than half of all workers walk, bike, or take transit, and a third is located in neighborhoods where more than 30 percent do. In the San Francisco Bay Area, New York, and Greater Boston, more than 45 percent (45.8 percent) of venture capital investment is located in neighborhoods where more than 30 percent of workers walk, bike, or use transit to get to work, and nearly 40 percent (37.8 percent) is located in neighborhoods where more than 50 percent of workers do so.
The findings of our industry analysis are suggestive of an emerging spatial division of labor in venture capital investment and startup activity across two dimensions. On the one hand, venture capital investment in sectors like media and entertainment and software tends to locate in micro-clusters in urban centers. These areas are increasingly attractive for the broad range of technical, managerial, and marketing talent required for success in these fields. A number of studies (Ehrenhalt 2012; Edlund 2005; Couture and Handbury 2015; Baum-Snow and Hartley 2015; Kolko 2016) document the locational preferences
MPI Working Paper Series: Rise of the Urban Startup Neighborhood (Florida & King) 29
of young, highly educated, and highly skilled workers who are moving back to urban neighborhoods. Other research (Florida and Mellander 2016) finds a significant correlation between venture capital investment and two key markers of talent: college graduates and the creative class.
Dense urban neighborhoods in major cities like San Francisco and New York also provide close proximity and access to the customers and end-users that drive these industries and use their products. Startups also benefit from flexible old warehouses and loft buildings, which can be reconfigured for various uses and neighborhoods that are close to transit. On the other hand, venture capital investment and startup activity in biotechnology is more clustered around major universities and research institutes, which provide access to the required technology and talent in this field.
It is worth noting that many, if not most, of the leading neighborhoods for venture capital-backed startups were essentially blanks slates in terms of their industry and economic structure. The two leading neighborhoods in downtown San Francisco, as well as many others in that city, New York and Boston-Cambridge were essentially older, underutilized in and in many cases formerly derelict and abandoned urban space where no existing firm clusters were located. In other words, these micro-cluster grew up over time in isolation from existing firm- or individual level capabilities. They were self-generating from the talent and diversity attracted to and generated by the place itself.
This new spatial division of labor in venture capital investment and startup activity does not necessarily mean the end of the suburban nerdistans, however. What appears to be emerging is a broad new geography and spatial division of labor for the high tech industry in which smaller startups, especially those which draw on talent pools that are thickest in urban centers, are incubated in cities. In contrast, established companies like Apple, Google, or Facebook operate in the suburbs of Silicon Valley where land is cheaper, enabling the continued expansion of their already established large campuses.
Ultimately, our research provides clear evidence of a new, more urban geography of venture capital investment and startup activity that is increasingly concentrated in tight neighborhood level micro-clusters within cities and urban areas. It may well turn out that the widespread movement of industry and people to the suburbs in the middle of the last century and the prevalence of the suburban high-tech nerdistans that went along with it were historical aberrations, not the permanent new model that many took it to be. Today, the locus of innovation and entrepreneurship appears to be gravitating back to the great urban centers that have been their true catalysts all along.
MPI Working Paper Series: Rise of the Urban Startup Neighborhood (Florida & King) 30
Venture capital investment and startup activity are spiky — tightly concentrated not just in cities and metro regions, but in distinct neighborhood micro-clusters across the United States. Overall, our findings confirm that more venture capital investment is now located in urban areas as opposed to the suburban nerdistans of the past.
MPI Working Paper Series: Rise of the Urban Startup Neighborhood (Florida & King) 31
Bibliography U.S Census. “2013 American Community Survey 5-Year Estimates Table B08006.”
2013. United States Census Bureau American Community Survey. https://www.census.gov/programs-surveys/acs/data.html.
“All About ZIP Codes: 2010 Supplement.” 2014. Missouri Census Data Center. January 20. http://mcdc.missouri.edu/allabout/zipcodes_2010supplement.shtml.
Audretsch, David B. 2003. “Innovation And Spatial Externalities.” International Regional Science Review 26 (2): 167–74. doi:10.1177/0160017602250973.
Baum-Snow, Nathaniel, and Daniel Hartley. 2015. “Demographic Changes in and near US Downturns.” Economic Trends. Federal Reserve Bank of Cleveland. https://www.clevelandfed.org/newsroom-and-events/publications/economic-trends/2015-economic-trends/et-20150605-demographic-changes-in-and-near-us-downtowns.aspx.
Carnegie Corporation. 2016. The Carnegie Classification of Institutions of Higher Education. March 9. http://carnegieclassifications.iu.edu/classification_descriptions/basic.php.
Couture, Victor, and Jessie Handbury. 2015. “Urban Revival in America, 2000 to 2010,” Working Paper, November. http://faculty.haas.berkeley.edu/couture/download/Couture_Handbury_Revival.pdf.
Edlund, Lena. 2005. “Sex and the City.” Scandinavian Journal of Economics 107 (1): 25–44.
Ehrenhalt, Alan. 2012. The Great Inversion and the Future of the American City. Knopf.
Feldman, Maryann P., and David B. Audretsch. 1999. “Innovation in Cities: Science-Based Diversity, Specialization and Localized Competition.” European Economic Review 43: 409–29.
Feldman, Maryann P., and Richard Florida. 1994. “The Geographic Sources of Innovation: Technological Infrastructure and Product Innovation in the United States.” Annals of the Association American Geographers 84 (2): 210–29.
Florida, Richard. 1995. “Toward the Learning Region.” Futures 27 (5): 527–36.
MPI Working Paper Series: Rise of the Urban Startup Neighborhood (Florida & King) 32
———. 2002. The Rise of the Creative Class: And How It’s Transforming Work, Leisure, Community and Everyday Life. New York: Basic Books.
———. 2005. “The World Is Spiky.” The Atlantic, October. http://www.theatlantic.com/past/docs/images/issues/200510/world-is-spiky.pdf.
———. 2006. “Where the Brains Are.” The Atlantic Monthly, October.
———. 2012a. The Rise of the Creative Class - Revisited: 10th Anniversary Edition - Revised and Expanded. Second Edition edition. New York: Basic Books.
———. 2012b. “The Joys of Urban Tech.” The Wall Street Journal. August 31. http://online.wsj.com/news/articles/SB10000872396390444914904577619441778073340.
———. 2013. “The Connection Between Venture Capital and Diverse, Dense Communities.” CityLab. July 9. http://www.citylab.com/work/2013/07/connection-between-venture-capital-and-diverse-dense-communities/5444/.
———. 2014. “Startup City: The Urban Shift in Venture Capital and High Technology.” Toronto, ON: Martin Prosperity Institute. http://martinprosperity.org/media/Startup-City.pdf.
———. 2016. “The Relationship Between High-Quality Startups and Geography.” CityLab. March 22. http://www.citylab.com/work/2016/03/map-geography-america-entrepreneurship-startups/474597/.
Florida, Richard, and Martin Kenney. 1988. “Venture Capital, High Technology and Regional Development.” Regional Studies 22 (1): 33–48. doi:10.1080/00343408812331344750.
Florida, Richard, and Karen King. 2016. “Spiky Venture Capital: The Geography of Venture Capital Investment by Metro and Zip Code.” Startup City. Martin Prosperity Institute. http://martinprosperity.org/content/spiky-venture-capital.
Florida, Richard L. 2002. The Rise of the Creative Class: And How It’s Transforming Work, Leisure, Community and Everyday Life. Basic Books.
Florida, Richard L., and Martin Kenney. 1988. “Venture Capital-Financed Innovation and Technological Change in the USA.” Research Policy 17 (3): 119–37.
MPI Working Paper Series: Rise of the Urban Startup Neighborhood (Florida & King) 33
Florida, Richard, and Charlotta Mellander. 2016. “Rise of the Startup City: The Changing Geography of Venture Capital Financed Innovation.” California Management Review.
Florida, Richard, and Donald F. Smith. 1993. “Vemture Capital Formation, Investment, and Regional Industrialization.” Annals of the Association American Geographers 83 (3): 434–51.
Forman, Chris, Avi Goldfarb, and Shane Greenstein. 2016. “Agglomeration of Invetion in the Bay Area: Not Just ICT.” American Economic Review 106 (5): 146–51.
Glaeser, Edward L. 1999. “Learning in Cities.” Journal of Urban Economics 46 (2): 254–77.
Glaeser, Edward L. 2000. “The New Economics of Urban and Regional Growth.” In The Oxford Handbook of Economic Geography, edited by Gordon Clark, Meric Gertler, and Maryann Feldman. Oxford: Oxford University Press.
———. 2001. “Consumer City.” Journal of Economic Geography 1 (1): 27–50.
———. 2011. The Triumph of the City: How Our Greatest Invention Makes Us Richer, Smarter, Greener, Healthier, and Happier. London: Pan Macmillan.
Guzman, Jorge, and Stern Stern. 2016. “The State of American Entrepreneurship: New Estimates of the Quality of Entrepreneurship for 15 US States, 1988-2014.” 22095. NBER Working Paper Series. http://www.nber.org/papers/w22095.
“Industry Definitions.” n.d. Pricewaterhouse Coopers Money Tree Report. https://www.pwcmoneytree.com/Definitions/Definitions.
Jacobs, Jane. 1961. The Death and Life of Great American Cities. Random House Digital, Inc.
———. 1970. The Economy of Cities. New York, NY: Vintage.
Kolko, Jed. 2015. “How Suburban Are Big American Cities?” Fivethirtyeight.com. May 21. http://fivethirtyeight.com/features/how-suburban-are-big-american-cities/.
———. 2016. “Urban Revival? Not For Most Americans.” JedKolko.com. March 30. http://jedkolko.com/2016/03/30/urban-revival-not-for-most-americans/.
MPI Working Paper Series: Rise of the Urban Startup Neighborhood (Florida & King) 34
Kotkin, Joel. 1997. “Escape From Nerdistan: Artistic Types Run With the Geeks in the New Centers of Multimedia.” The Washington Post (1974-Current File), September 14, sec. Outlook. http://search.proquest.com.myaccess.library.utoronto.ca/docview/1444632370/abstract?accountid=14771.
———. 2000. The New Geography: How the Digital Revolution Is Reshaping the American Landscape. New York: Random House.
Marshall, Alfred. 1891. Principles of Economics. Macmillan and Company.
“National Venture Capital Association Yearbook 2016.” 2016. National Venture Capital Association. file:///C:/Users/Ian.Gormely/Downloads/NVCA-Yearbook-2016.pdf.
Porter, Michael. 1990. The Competitive Advantage of Nations. New York, NY: Free Press.
———. 1996. “Competitive Advantage, Agglomeration Economies, and Regional Policy.” International Regional Science Review 19 (1): 85–94.
———. 2006. “Q & A with Michael Porter.” Business Weel, August 21. www.businessweek.com/magazine/content/06_34/b3998460.htm.
Porter, Michael E. 1998. “Clusters and the New Economics of Competition.” Harvard Business Review. http://www.alanausterman.com/wp-content/uploads/2009/12/Clusters-The-New-Economics-of-Competition-Michael-Porter.pdf.
Saxenian, Annalee. 1994. Regional Advantage: Culture and Competition in Silicon Valley and Route 128. Cambridge, MA: Harvard University Press.
Thomson Reuters. “Venture Capital and Private Equity.” n.d. Thomson Reuters. http://thomsonreuters.com/en/products-services/financial/venture-capital-and-private-equity.html.
MPI Working Paper Series: Rise of the Urban Startup Neighborhood (Florida & King) 35
Author Bio
Richard Florida ([email protected]) is Director at the Martin Prosperity Institute in the University of Toronto’s Rotman School of Management and Research Professor at NYU.
Karen King is a Research Associate at the Martin Prosperity Institute.
The authors thank Isabel Ritchie for research assistance.
Working Paper Series
The MPI is dedicated to producing research that engages individuals, organizations and governments. We strive to make as much research as possible publicly available.
Our research focuses on developing data and new insight about the underlying forces that power economic prosperity. It is oriented around three main themes: economic performance, place, and creativity.
Disclaimer
The views represented in this paper are those of the author and may not necessarily reflect the views of the Martin Prosperity Institute, its affiliates or its funding partners.
Any omissions or errors remain the sole responsibility of the author. Any comments or questions regarding the content of this report may be directed to the author.