Embed Size (px)
Citation preview

Rising Food Prices:Rising Food Prices:Causes, Effects, and Actions NeededCauses, Effects, and Actions Needed
Rajul Pandya-Lorch Rajul Pandya-Lorch International Food Policy Research InstituteInternational Food Policy Research Institute
2008 Norman E. Borlaug International Symposium2008 Norman E. Borlaug International Symposium““Confronting Crisis: Agriculture and Global Development in the Next 50 Years”Confronting Crisis: Agriculture and Global Development in the Next 50 Years”
Des Moines, October 15-17, 2008Des Moines, October 15-17, 2008

Pandya-Lorch, IFPRI, October 2008
OverviewOverview
• Price developments and causesPrice developments and causes
• Impacts on the poor and hungryImpacts on the poor and hungry
• Priorities for actionPriorities for action

Pandya-Lorch, IFPRI, October 2008
Most sustained and significant increase of Most sustained and significant increase of food prices in 3 decadesfood prices in 3 decades
Source: FAO 2008.Source: FAO 2008.
Annual FAO Food Price Index 1998-2000=100, 1961-2008 Annual FAO Food Price Index 1998-2000=100, 1961-2008

Pandya-Lorch, IFPRI, October 2008
Higher and more volatile pricesHigher and more volatile prices
0
20
40
60
80
100
120
140
0
200
400
600
800
US
$/b
arre
l
US
$/to
n
Corn
Wheat
Rice
Oil (right scale)
Source: Data from FAO 2008 and IMF 2008Source: Data from FAO 2008 and IMF 2008.
(As of Sept. 2008)(As of Sept. 2008)
Since Jan. 2003, mSince Jan. 2003, maize and wheat prices aize and wheat prices doubleddoubled, , rice prices rice prices tripledtripled, oil prices , oil prices quadrupledquadrupled

Pandya-Lorch, IFPRI, October 2008
Soaring global fertilizer pricesSoaring global fertilizer prices
World Fertilizer Prices, 2000-2008, US$/mt
200
400
600
800
1000
1200
1400
0
DAP, US Gulf
MOP, VancouverUrea, Arab Gulf, prilled
April 2008
Jan-00 Jan-01 Jan-02 Jan-03 Jan-04 Jan-05 Jan-06 Jan-07 Jan-08
Source: IFDC 2008.Source: IFDC 2008.

Pandya-Lorch, IFPRI, October 2008
Sources of the price increaseSources of the price increase
1.1. Income and population growthIncome and population growth
2.2. Energy and biofuelsEnergy and biofuels
3.3. Slow agricultural responseSlow agricultural response
4.4. Market and trade policyMarket and trade policy

Pandya-Lorch, IFPRI, October 2008
(1) Income and population growth(1) Income and population growth
• Income growth (2005-07 per annum)Income growth (2005-07 per annum)- 9% in Asia, 6% in Africa9% in Asia, 6% in Africa- 2% in industrialized countries2% in industrialized countries
• Population growth of more than 1% per yearPopulation growth of more than 1% per year
• Since 2000, Since 2000, globalglobal cereal use for: cereal use for:
- Food 5%, feed 8%, industry 38%Food 5%, feed 8%, industry 38%
• Non-cereal demand rises dramaticallyNon-cereal demand rises dramatically- 6 kg grain generates 1 kg beef6 kg grain generates 1 kg beef- 3 kg grain generates 1 kg pork3 kg grain generates 1 kg pork- 2 kg grain generates 1 kg poultry2 kg grain generates 1 kg poultry
Sources: FAO 2003 and 2008; IMF 2008.Sources: FAO 2003 and 2008; IMF 2008.

Pandya-Lorch, IFPRI, October 2008
(2) Energy and biofuels(2) Energy and biofuels
Energy prices traditionally affected agric. Energy prices traditionally affected agric. inputinput prices prices (fertilizer, pesticides, irrigation, transport)(fertilizer, pesticides, irrigation, transport)
Now, they also affect agric. Now, they also affect agric. outputoutput prices through prices through opportunity costsopportunity costs
Generous developed country Generous developed country subsidiessubsidies for for biofuels and energy crops distort marketsbiofuels and energy crops distort markets
Biofuel demand contributed to Biofuel demand contributed to 30% 30% of the of the increase of grain prices in 2000-07 increase of grain prices in 2000-07
Source: Rosegrant 2008Source: Rosegrant 2008

Pandya-Lorch, IFPRI, October 2008
0
1
2
3
4
5
6
1963 1967 1971 1975 1979 1983 1987 1991 1995 1999 2003
Ave
rage
ann
ual g
row
th r
ate
(%)
maize
rice
wheat
Source: World Development Report 2008.Source: World Development Report 2008.
(3) Slow agricultural response: (3) Slow agricultural response: Declining productivity growthDeclining productivity growth

Pandya-Lorch, IFPRI, October 2008
(4) Market and trade policy:(4) Market and trade policy:Distorting ad hoc measuresDistorting ad hoc measures
• Export bans/restrictions:Export bans/restrictions:- Reduce global market size, increase volatility, Reduce global market size, increase volatility,
harm import-dependent trading partnersharm import-dependent trading partners
- Stimulate cartel formation, undermine trust, Stimulate cartel formation, undermine trust, encourage protectionismencourage protectionism
E.g. Argentina, China, India, Indonesia, RussiaE.g. Argentina, China, India, Indonesia, Russia
• Price controls: Price controls: - Reduce farmers’ incentives to produce moreReduce farmers’ incentives to produce more
- Divert resources away from those who need Divert resources away from those who need them mostthem most
E.g. China, Egypt, Malaysia, Pakistan, RussiaE.g. China, Egypt, Malaysia, Pakistan, Russia

Pandya-Lorch, IFPRI, October 2008
Variety of government policy responsesVariety of government policy responses
Trade Trade restrictionrestriction
Trade Trade liberaliz.liberaliz.
Consumer Consumer subsidysubsidy
Social Social protectionprotection
Increase Increase supplysupply
AsiaAsiaBangladeshBangladesh XX XX XX XXChinaChina XX XX XX XXIndiaIndia XX XX XX XX XXIndonesiaIndonesia XX XX XXMalaysiaMalaysia XX XX XXThailandThailand XX XX XX
Latin AmericaLatin AmericaArgentinaArgentina XX XX XX XXBrazilBrazil XX XX XXMexicoMexico XX XX XXPeruPeru XX XX XXVenezuela Venezuela XX XX XX XX
AfricaAfricaEgyptEgypt XX XX XX XXEthiopiaEthiopia XX XX XX XXGhanaGhana XX XXKenyaKenya XXNigeriaNigeria XX XX XXTanzaniaTanzania XX XX XX
Source: IMF, FAO, and news reports, 2007-08.Source: IMF, FAO, and news reports, 2007-08.

Pandya-Lorch, IFPRI, October 2008
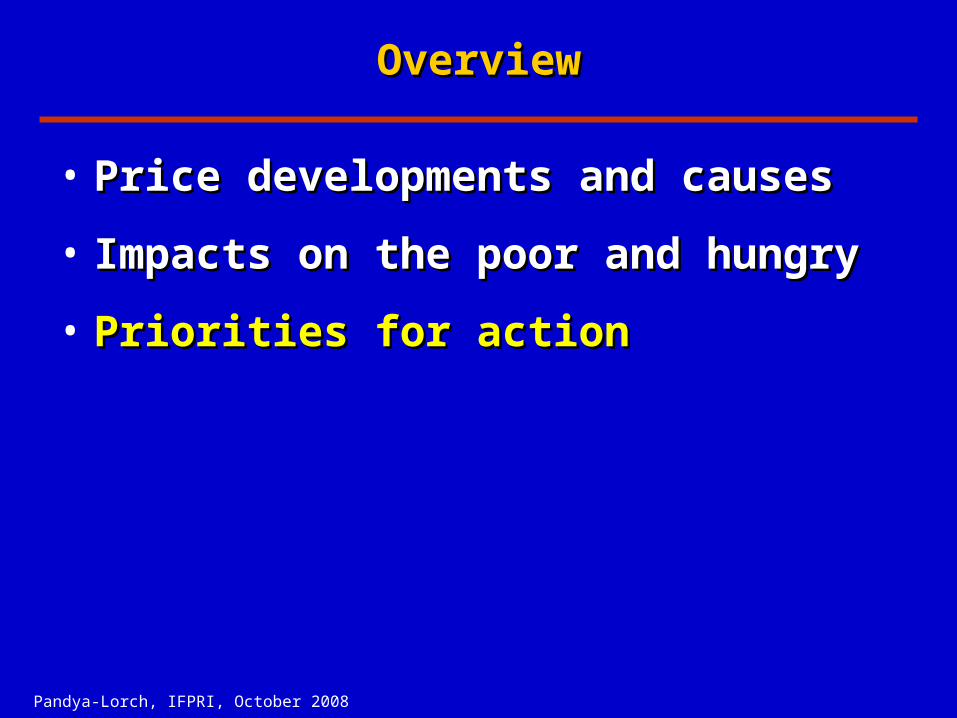
OverviewOverview
• Price developments and causesPrice developments and causes
• Impacts on the poor and hungryImpacts on the poor and hungry
• Priorities for actionPriorities for action

Pandya-Lorch, IFPRI, October 2008
Looking beneath the $1 a day line (2004)Looking beneath the $1 a day line (2004)
PoorPoor
($.75 cents – $1)($.75 cents – $1)
485 million people485 million people
Medial poorMedial poor
($.50 cents – $.75 cents)($.50 cents – $.75 cents)
323 million people323 million people
Ultra poorUltra poor
(less than $.50 cents)(less than $.50 cents)
162 million people162 million peopleSource: Ahmed et al. 2007.Source: Ahmed et al. 2007.

Pandya-Lorch, IFPRI, October 2008
World map of hunger:World map of hunger:2008 GHI by severity2008 GHI by severity
Source: von Grebmer et al. 2008. Source: von Grebmer et al. 2008.

Pandya-Lorch, IFPRI, October 2008
The number of hungry increased in 2007, The number of hungry increased in 2007, mainly due to high food pricesmainly due to high food prices
The number of undernourished in 2007 The number of undernourished in 2007 increased by increased by 75 mil. 75 mil. since 2003-05 (to 923 mil.)since 2003-05 (to 923 mil.)
•Asia / Pacific Asia / Pacific 41 mil. 41 mil.
•Latin America / Caribbean 6 mil.Latin America / Caribbean 6 mil.
•Near East / North Africa 4 mil.Near East / North Africa 4 mil.
•Sub-Saharan Africa Sub-Saharan Africa 24 mil. 24 mil.
Sources: FAO 2008.Sources: FAO 2008.
Pandya-Lorch, IFPRI, October 2008
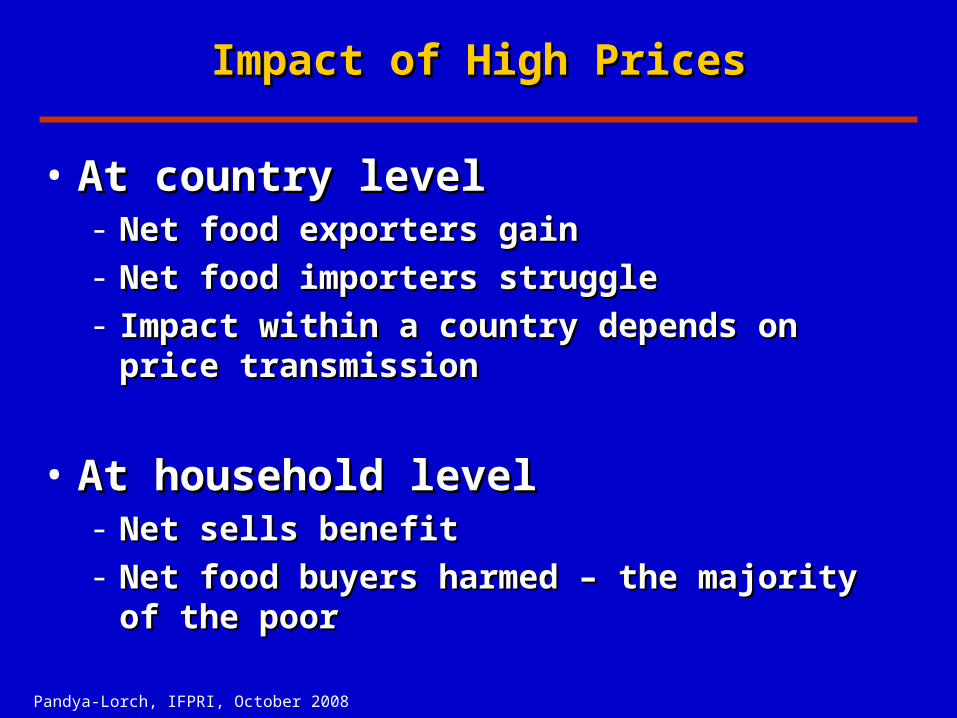
Impact of High PricesImpact of High Prices
• At country levelAt country level- Net food exporters gainNet food exporters gain- Net food importers struggleNet food importers struggle- Impact within a country depends on price Impact within a country depends on price
transmissiontransmission
• At household levelAt household level- Net sells benefitNet sells benefit- Net food buyers harmed – the majority of the poorNet food buyers harmed – the majority of the poor

Pandya-Lorch, IFPRI, October 2008
Impacts of high prices on the poorestImpacts of high prices on the poorest
Driven by Driven by initial conditionsinitial conditions and and adjustmentsadjustments in labor, in labor, finance, and goods marketsfinance, and goods markets
•Level of inequality below the poverty line (up)Level of inequality below the poverty line (up)•Exclusion and discrimination (up)Exclusion and discrimination (up)•Level of diet (low) and nutritional deficiencies (high)Level of diet (low) and nutritional deficiencies (high)•Wage rate adjustments among unskilled labor to Wage rate adjustments among unskilled labor to changing prices (slow)changing prices (slow)•Capability to respond to market opportunities (small)Capability to respond to market opportunities (small)
A 50% increase in food prices in Bangladesh A 50% increase in food prices in Bangladesh = 25% more prevalence of micronutrient deficiency in = 25% more prevalence of micronutrient deficiency in
women and children (Bouis 2008)women and children (Bouis 2008)

Pandya-Lorch, IFPRI, October 2008
Irreversible consequences with long-Irreversible consequences with long-term impactterm impact
• Deterioration of nutritional status of women Deterioration of nutritional status of women and preschool childrenand preschool children
• Withdrawal of children esp. girls from schoolWithdrawal of children esp. girls from school
• Distress sale of productive assets and Distress sale of productive assets and decrease of purchasing powerdecrease of purchasing power

Pandya-Lorch, IFPRI, October 2008
The food crisis tradeoffs and effectsThe food crisis tradeoffs and effects
+ Mass protests in about 60 countries + Mass protests in about 60 countries Violent: Bangladesh, Egypt, Guinea, Haiti, Honduras, Tunisia, etc. Violent: Bangladesh, Egypt, Guinea, Haiti, Honduras, Tunisia, etc.
+ The poorest suffer most and do so silently+ The poorest suffer most and do so silently
+ Inflation and macro-economic imbalances+ Inflation and macro-economic imbalances
+ Environmental sustainability consequences+ Environmental sustainability consequences
Political security Political security risksrisks
Energy security Energy security risksrisks
Food security Food security risksrisks
Pandya-Lorch, IFPRI, October 2008
OverviewOverview
• Price developments and causesPrice developments and causes
• Impacts on the poor and hungryImpacts on the poor and hungry
• Priorities for actionPriorities for action

Pandya-Lorch, IFPRI, October 2008
The food crisis is The food crisis is notnot overcome, overcome, actions are needed nowactions are needed now
IFPRI’s proposal:IFPRI’s proposal:
• Emergency package: Emergency package: for immediate food for immediate food assistance and availability needsassistance and availability needs
[Implement immediately][Implement immediately]
• Resilience package: Resilience package: to meet ongoing and to meet ongoing and future challenges in the food systemfuture challenges in the food system
[Phase in now for future impact][Phase in now for future impact]

Pandya-Lorch, IFPRI, October 2008
Policy actions: Policy actions: Emergency packageEmergency package
1. Expand emergency and humanitarian 1. Expand emergency and humanitarian assistanceassistanceInternational (price indexed) and nationalInternational (price indexed) and national
2. Eliminate agricultural export restrictions2. Eliminate agricultural export restrictionsReduces price levels by up to 30%Reduces price levels by up to 30%
3. Fast-impact production programs in key areas3. Fast-impact production programs in key areasPoorest 50% of farmers in Africa - partly publicly Poorest 50% of farmers in Africa - partly publicly
funded = US$2.3 billion per annumfunded = US$2.3 billion per annum
4. Change grain and oil seeds bio-fuel policies4. Change grain and oil seeds bio-fuel policiesReduces maize price 20%, wheat 10%Reduces maize price 20%, wheat 10%

Pandya-Lorch, IFPRI, October 2008
Policy actions: Policy actions: Resilience packageResilience package
5. Calm markets with: 5. Calm markets with: Market-oriented regulation of speculationMarket-oriented regulation of speculationEstablish global (virtual) grain bank Establish global (virtual) grain bank
6. Invest in social protection6. Invest in social protectionFocus on child nutrition, women, and poorestFocus on child nutrition, women, and poorest
7. Investments for sustained agric. growth7. Investments for sustained agric. growthGlobal incremental public agric. investment for Global incremental public agric. investment for
MDG1 = US$14 billion per annum MDG1 = US$14 billion per annum
8. Complete the WTO Doha Round8. Complete the WTO Doha RoundStrengthen rule based tradeStrengthen rule based trade

Pandya-Lorch, IFPRI, October 2008
Improved information and monitoring neededImproved information and monitoring needed
Source: Benson et al. IFPRI 2008.Source: Benson et al. IFPRI 2008.
• Information is Information is notnot available: available:
-EverywhereEverywhere-Quickly enoughQuickly enough-At the needed level of disaggregationAt the needed level of disaggregation
•Information strengthening and monitoring Information strengthening and monitoring needed through:needed through:
-Internet-based portalInternet-based portal-Capacity-strengthening toolboxCapacity-strengthening toolbox-Facilitation of fast data collection and Facilitation of fast data collection and
estimationsestimations

Pandya-Lorch, IFPRI, October 2008
Implementation of actions must be soundImplementation of actions must be sound
• Country-driven and -ownedCountry-driven and -owned programs – with programs – with prioritization and sequencing prioritization and sequencing
• Costs: Face the high Costs: Face the high investmentinvestment needed; the needed; the benefits for people, growth, security are hugebenefits for people, growth, security are huge
• New international New international governance architecturegovernance architecture of of agriculture, food, and nutrition neededagriculture, food, and nutrition needed
• AccountabilityAccountability at international and national at international and national levels: independent monitoring and levels: independent monitoring and assessmentassessment