Embed Size (px)
Citation preview
HAL Id: hal-01937401https://hal.archives-ouvertes.fr/hal-01937401
Submitted on 28 Nov 2018
HAL is a multi-disciplinary open accessarchive for the deposit and dissemination of sci-entific research documents, whether they are pub-lished or not. The documents may come fromteaching and research institutions in France orabroad, or from public or private research centers.
L’archive ouverte pluridisciplinaire HAL, estdestinée au dépôt et à la diffusion de documentsscientifiques de niveau recherche, publiés ou non,émanant des établissements d’enseignement et derecherche français ou étrangers, des laboratoirespublics ou privés.
Risk Analysis of Flare Flame-out Condition in a GasProcess Facility
O. Zadakbar, R. Abbassi, F. Khan, K. Karimpour, M. Golshani, A. Vatani
To cite this version:O. Zadakbar, R. Abbassi, F. Khan, K. Karimpour, M. Golshani, et al.. Risk Analysis of FlareFlame-out Condition in a Gas Process Facility. Oil & Gas Science and Technology - Revue d’IFPEnergies nouvelles, Institut Français du Pétrole, 2011, 66 (3), pp.521-530. �10.2516/ogst/2010027�.�hal-01937401�
Résumé — Analyse des risques des conditions d’extinction de torche au sein d’une installation detraitement de gaz — Le torchage est un procédé courant d’élimination des gaz résiduaires inflammablesdans les industries de traitement. L’extinction de la torche (par décollage ou soufflage de flamme)provoque souvent une émission de vapeurs toxiques. Ces gaz toxiques libérés peuvent présenter deseffets dangereux sur le milieu environnant. Pour étudier l’effet d’une exposition par inhalation de ces gaztoxiques sur la santé, cet article croise les quatre étapes de la démarche de l’EPA (EnvironmentalProtection Agency, Agence de protection de l’environnement) avec les données d’exploitation afin dequantifier le risque sanitaire cancérologique et non cancérologique. Dans le cadre de l’estimationd’exposition, une modélisation de dispersion des gaz utilisant AERMOD et UDM-PHAST est évaluéedans deux configurations différentes de torchage normal et d’extinction de torche à l’occasion deconditions climatiques particulières dans la région du Khangiran. L’article propose également desrecommandations destinées à éviter les conditions d’une extinction de flamme de torche.
Abstract — Risk Analysis of Flare Flame-out Condition in a Gas Process Facility — Flaring is acommon method of disposal of flammable waste gases in the downstream industries. Flare flame out(flame lift-off or blow-outs) often occurs causing toxic vapors to discharge. The toxic gases releasedmay have hazardous effects on the surrounding environment. To study the effect of inhalationexposure of these toxic gases on human health, the four steps of the EPA (Environmental ProtectionAgency) framework with the field data to quantify the cancer and non-cancer health risks areintegrated in this paper. As a part of exposure assessment, gas dispersion modeling using AERMODand UDM-PHAST is applied in two different conditions of normal flaring and flare flame out duringa particular climate condition in Khangiran region. Recommendations to avoid flare flame outconditions are also presented here.
Oil & Gas Science and Technology – Rev. IFP Energies nouvelles, Vol. 66 (2011), No. 3, pp. 521-530Copyright © 2011, IFP Energies nouvellesDOI: 10.2516/ogst/2010027
Risk Analysis of Flare Flame-out Conditionin a Gas Process Facility
O. Zadakbar1*, R. Abbassi1, F. Khan1, K. Karimpour2, M. Golshani2 and A. Vatani3
1 Faculty of Engineering & Applied Science, Memorial University of Newfoundland, St. John’s, NL, A1B 3X5 - Canada2 Nargan Consulting Engineers, Tehran - Iran
3 Institute of Petroleum Engineering, Faculty of Engineering, University of Tehran, Tehran - Irane-mail: [email protected] - [email protected] - [email protected] - [email protected] - [email protected] - [email protected]
* Corresponding author
ogst100008_Zadakbar 22/07/11 17:35 Page 521
Oil & Gas Science and Technology – Rev. IFP Energies nouvelles, Vol. 66 (2011), No. 3
INTRODUCTIONRefinery flares are used for the safe disposal of flammablewaste gases from emergency process upsets as well as forstart-up, shut-down and turnaround operations. Flaring couldrelease large quantities of SO2 and CO into the atmosphere.The magnitude of emissions resulted from flaring process inIran is not clear, as many refineries do not have flare moni-toring and emissions recording procedures in place. Thus,there is a concern about the potential underestimation ofreported emissions released during flaring processes [1].
In the downwind plume of sour gas flares, SO2 and H2Sexist, in addition to a wide spectrum of sulfur-containingchemicals and the range of unburned hydrocarbons. Anannual exposure greater than 4 μg/m3 H2S is associated withspontaneous abortion in humans and animals [2]. The odorthreshold of H2S is approximately 7 μg/m3, which is less thanthe critical concentration. An acceptable daily intake of1.8 μg/m3 H2S has been presented [3].
Combustion efficiency of a flare is severely affected bywind. Regardless of the regulatory stricture imposed, a
conventional flare will never operate above 95% ofefficiency except in wind speed of about less than 2 kmph[4]. Reduced combustion efficiency must be regarded possi-ble in any operation with flaring. Simultaneous low combus-tion efficiency causes release of unburned gas. Thatincludes hydrogen sulfide with sour gas flares.
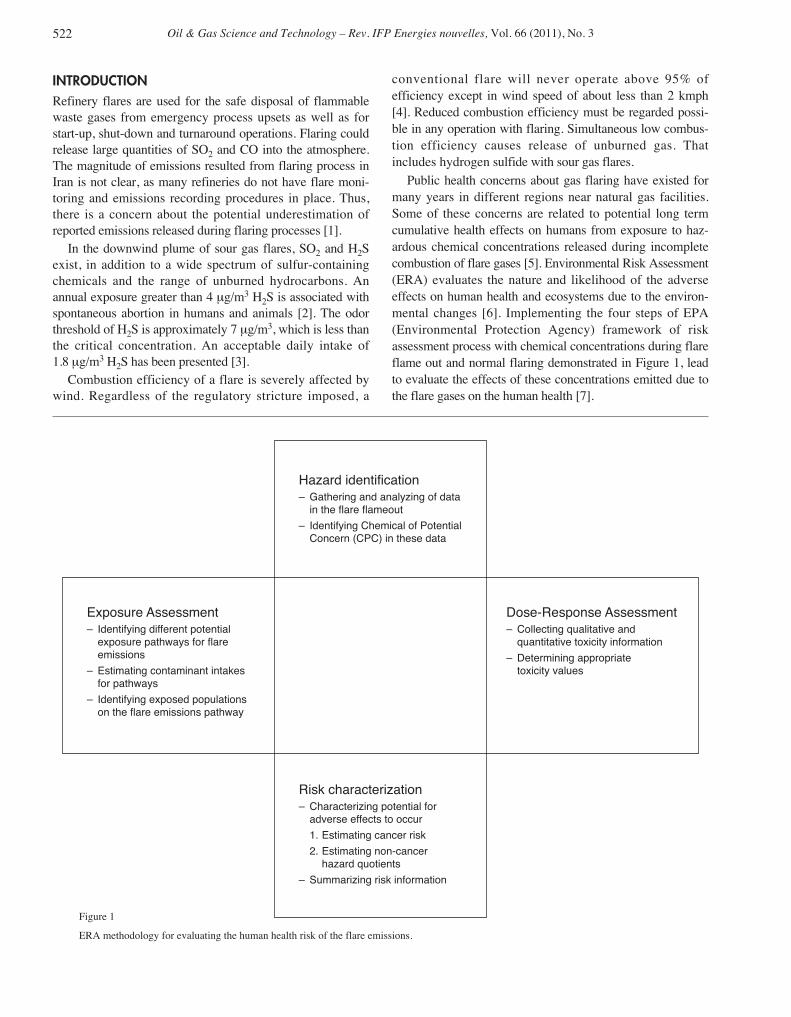
Public health concerns about gas flaring have existed formany years in different regions near natural gas facilities.Some of these concerns are related to potential long termcumulative health effects on humans from exposure to haz-ardous chemical concentrations released during incompletecombustion of flare gases [5]. Environmental Risk Assessment(ERA) evaluates the nature and likelihood of the adverseeffects on human health and ecosystems due to the environ-mental changes [6]. Implementing the four steps of EPA(Environmental Protection Agency) framework of riskassessment process with chemical concentrations during flareflame out and normal flaring demonstrated in Figure 1, leadto evaluate the effects of these concentrations emitted due tothe flare gases on the human health [7].
522
Risk characterization– Characterizing potential for adverse effects to occur
1. Estimating cancer risk
2. Estimating non-cancer hazard quotients
– Summarizing risk information
Hazard identification– Gathering and analyzing of data in the flare flameout
– Identifying Chemical of Potential Concern (CPC) in these data
Exposure Assessment– Identifying different potential exposure pathways for flare emissions
– Estimating contaminant intakes for pathways
– Identifying exposed populations on the flare emissions pathway
Dose-Response Assessment– Collecting qualitative and quantitative toxicity information
– Determining appropriate toxicity values
Figure 1
ERA methodology for evaluating the human health risk of the flare emissions.
ogst100008_Zadakbar 22/07/11 17:35 Page 522
Risk-based evaluation of chemical concentrations duringnormal flaring as well as flare flame out via a case study inthe Khangiran gas process facility (Sarakhs-Iran) is consid-ered in this paper. Recommendations for precluding theflame out conditions are also presented.
1 ENVIRONMENTAL RISK ASSESSMENT
1.1 Site Specification
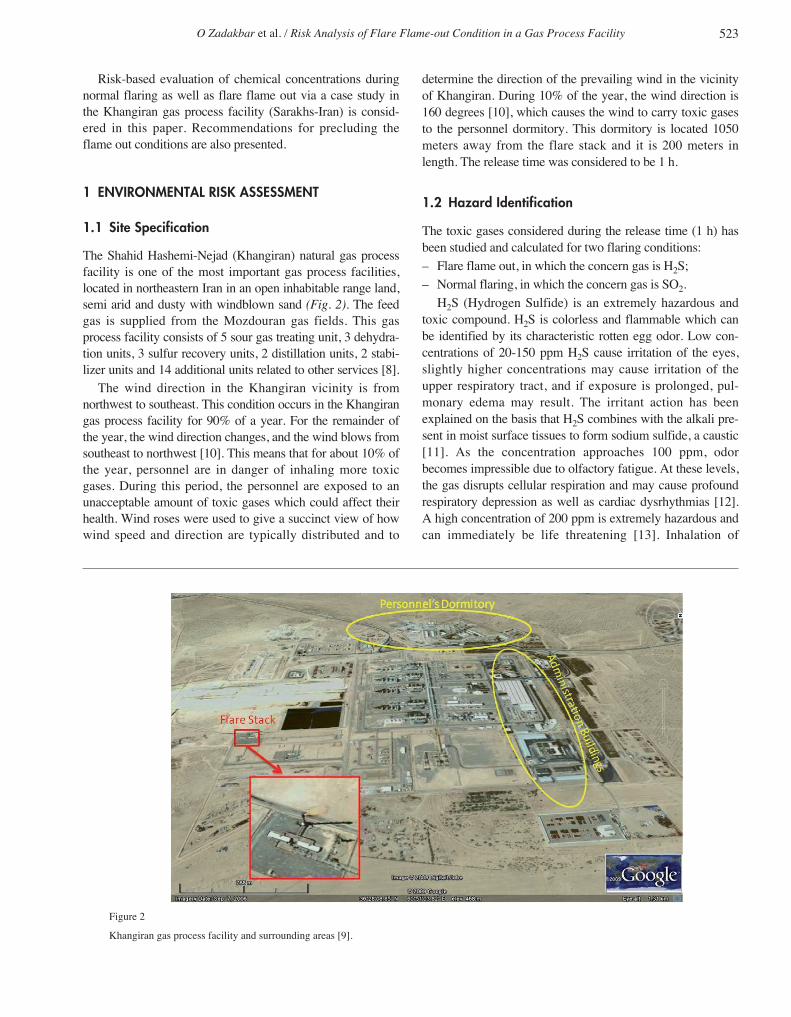
The Shahid Hashemi-Nejad (Khangiran) natural gas processfacility is one of the most important gas process facilities,located in northeastern Iran in an open inhabitable range land,semi arid and dusty with windblown sand (Fig. 2). The feedgas is supplied from the Mozdouran gas fields. This gasprocess facility consists of 5 sour gas treating unit, 3 dehydra-tion units, 3 sulfur recovery units, 2 distillation units, 2 stabi-lizer units and 14 additional units related to other services [8].
The wind direction in the Khangiran vicinity is fromnorthwest to southeast. This condition occurs in the Khangirangas process facility for 90% of a year. For the remainder ofthe year, the wind direction changes, and the wind blows fromsoutheast to northwest [10]. This means that for about 10% ofthe year, personnel are in danger of inhaling more toxicgases. During this period, the personnel are exposed to anunacceptable amount of toxic gases which could affect theirhealth. Wind roses were used to give a succinct view of howwind speed and direction are typically distributed and to
determine the direction of the prevailing wind in the vicinityof Khangiran. During 10% of the year, the wind direction is160 degrees [10], which causes the wind to carry toxic gasesto the personnel dormitory. This dormitory is located 1050meters away from the flare stack and it is 200 meters inlength. The release time was considered to be 1 h.
1.2 Hazard Identification
The toxic gases considered during the release time (1 h) hasbeen studied and calculated for two flaring conditions:– Flare flame out, in which the concern gas is H2S;– Normal flaring, in which the concern gas is SO2.
H2S (Hydrogen Sulfide) is an extremely hazardous andtoxic compound. H2S is colorless and flammable which canbe identified by its characteristic rotten egg odor. Low con-centrations of 20-150 ppm H2S cause irritation of the eyes,slightly higher concentrations may cause irritation of theupper respiratory tract, and if exposure is prolonged, pul-monary edema may result. The irritant action has beenexplained on the basis that H2S combines with the alkali pre-sent in moist surface tissues to form sodium sulfide, a caustic[11]. As the concentration approaches 100 ppm, odorbecomes impressible due to olfactory fatigue. At these levels,the gas disrupts cellular respiration and may cause profoundrespiratory depression as well as cardiac dysrhythmias [12].A high concentration of 200 ppm is extremely hazardous andcan immediately be life threatening [13]. Inhalation of
O Zadakbar et al. / Risk Analysis of Flare Flame-out Condition in a Gas Process Facility 523
Figure 2
Khangiran gas process facility and surrounding areas [9].
ogst100008_Zadakbar 22/07/11 17:35 Page 523
Oil & Gas Science and Technology – Rev. IFP Energies nouvelles, Vol. 66 (2011), No. 3
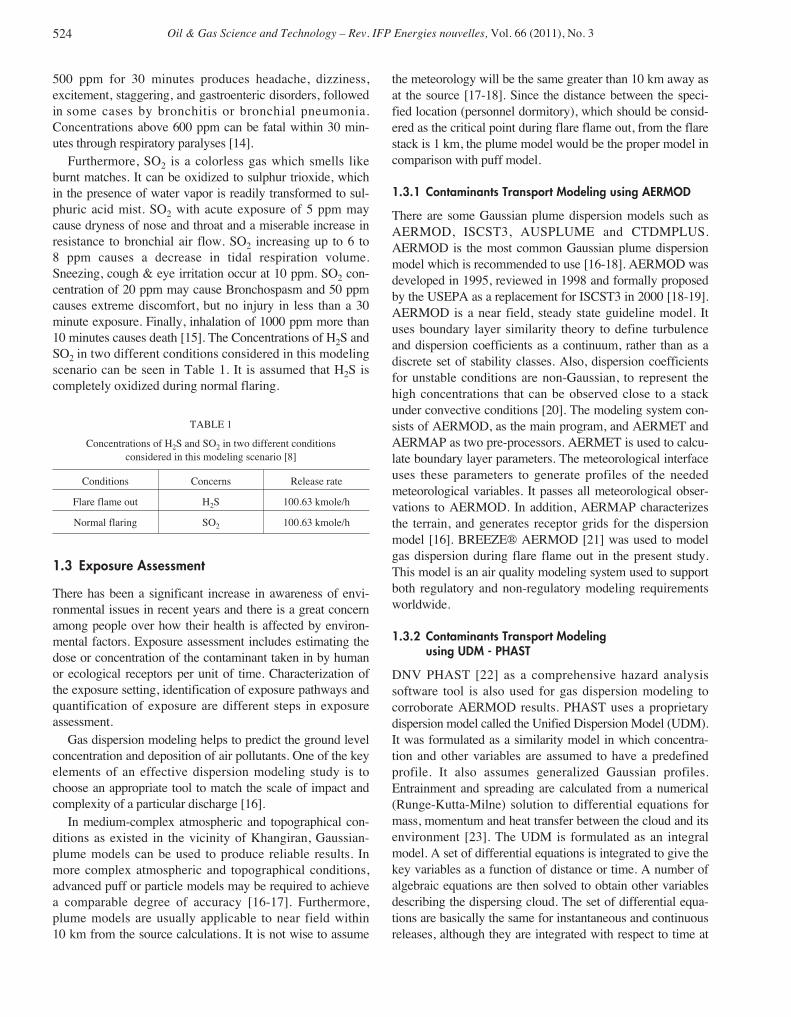
500 ppm for 30 minutes produces headache, dizziness,excitement, staggering, and gastroenteric disorders, followedin some cases by bronchitis or bronchial pneumonia.Concentrations above 600 ppm can be fatal within 30 min-utes through respiratory paralyses [14].
Furthermore, SO2 is a colorless gas which smells likeburnt matches. It can be oxidized to sulphur trioxide, whichin the presence of water vapor is readily transformed to sul-phuric acid mist. SO2 with acute exposure of 5 ppm maycause dryness of nose and throat and a miserable increase inresistance to bronchial air flow. SO2 increasing up to 6 to8 ppm causes a decrease in tidal respiration volume.Sneezing, cough & eye irritation occur at 10 ppm. SO2 con-centration of 20 ppm may cause Bronchospasm and 50 ppmcauses extreme discomfort, but no injury in less than a 30minute exposure. Finally, inhalation of 1000 ppm more than10 minutes causes death [15]. The Concentrations of H2S andSO2 in two different conditions considered in this modelingscenario can be seen in Table 1. It is assumed that H2S iscompletely oxidized during normal flaring.
TABLE 1
Concentrations of H2S and SO2 in two different conditionsconsidered in this modeling scenario [8]
Conditions Concerns Release rate
Flare flame out H2S 100.63 kmole/h
Normal flaring SO2 100.63 kmole/h
1.3 Exposure Assessment
There has been a significant increase in awareness of envi-ronmental issues in recent years and there is a great concernamong people over how their health is affected by environ-mental factors. Exposure assessment includes estimating thedose or concentration of the contaminant taken in by humanor ecological receptors per unit of time. Characterization ofthe exposure setting, identification of exposure pathways andquantification of exposure are different steps in exposureassessment.
Gas dispersion modeling helps to predict the ground levelconcentration and deposition of air pollutants. One of the keyelements of an effective dispersion modeling study is tochoose an appropriate tool to match the scale of impact andcomplexity of a particular discharge [16].
In medium-complex atmospheric and topographical con-ditions as existed in the vicinity of Khangiran, Gaussian-plume models can be used to produce reliable results. Inmore complex atmospheric and topographical conditions,advanced puff or particle models may be required to achievea comparable degree of accuracy [16-17]. Furthermore,plume models are usually applicable to near field within10 km from the source calculations. It is not wise to assume
the meteorology will be the same greater than 10 km away asat the source [17-18]. Since the distance between the speci-fied location (personnel dormitory), which should be consid-ered as the critical point during flare flame out, from the flarestack is 1 km, the plume model would be the proper model incomparison with puff model.
1.3.1 Contaminants Transport Modeling using AERMOD
There are some Gaussian plume dispersion models such asAERMOD, ISCST3, AUSPLUME and CTDMPLUS.AERMOD is the most common Gaussian plume dispersionmodel which is recommended to use [16-18]. AERMOD wasdeveloped in 1995, reviewed in 1998 and formally proposedby the USEPA as a replacement for ISCST3 in 2000 [18-19].AERMOD is a near field, steady state guideline model. Ituses boundary layer similarity theory to define turbulenceand dispersion coefficients as a continuum, rather than as adiscrete set of stability classes. Also, dispersion coefficientsfor unstable conditions are non-Gaussian, to represent thehigh concentrations that can be observed close to a stackunder convective conditions [20]. The modeling system con-sists of AERMOD, as the main program, and AERMET andAERMAP as two pre-processors. AERMET is used to calcu-late boundary layer parameters. The meteorological interfaceuses these parameters to generate profiles of the neededmeteorological variables. It passes all meteorological obser-vations to AERMOD. In addition, AERMAP characterizesthe terrain, and generates receptor grids for the dispersionmodel [16]. BREEZE® AERMOD [21] was used to modelgas dispersion during flare flame out in the present study.This model is an air quality modeling system used to supportboth regulatory and non-regulatory modeling requirementsworldwide.
1.3.2 Contaminants Transport Modelingusing UDM - PHAST
DNV PHAST [22] as a comprehensive hazard analysissoftware tool is also used for gas dispersion modeling tocorroborate AERMOD results. PHAST uses a proprietarydispersion model called the Unified Dispersion Model (UDM).It was formulated as a similarity model in which concentra-tion and other variables are assumed to have a predefinedprofile. It also assumes generalized Gaussian profiles.Entrainment and spreading are calculated from a numerical(Runge-Kutta-Milne) solution to differential equations formass, momentum and heat transfer between the cloud and itsenvironment [23]. The UDM is formulated as an integralmodel. A set of differential equations is integrated to give thekey variables as a function of distance or time. A number ofalgebraic equations are then solved to obtain other variablesdescribing the dispersing cloud. The set of differential equa-tions are basically the same for instantaneous and continuousreleases, although they are integrated with respect to time at
524
ogst100008_Zadakbar 22/07/11 17:35 Page 524
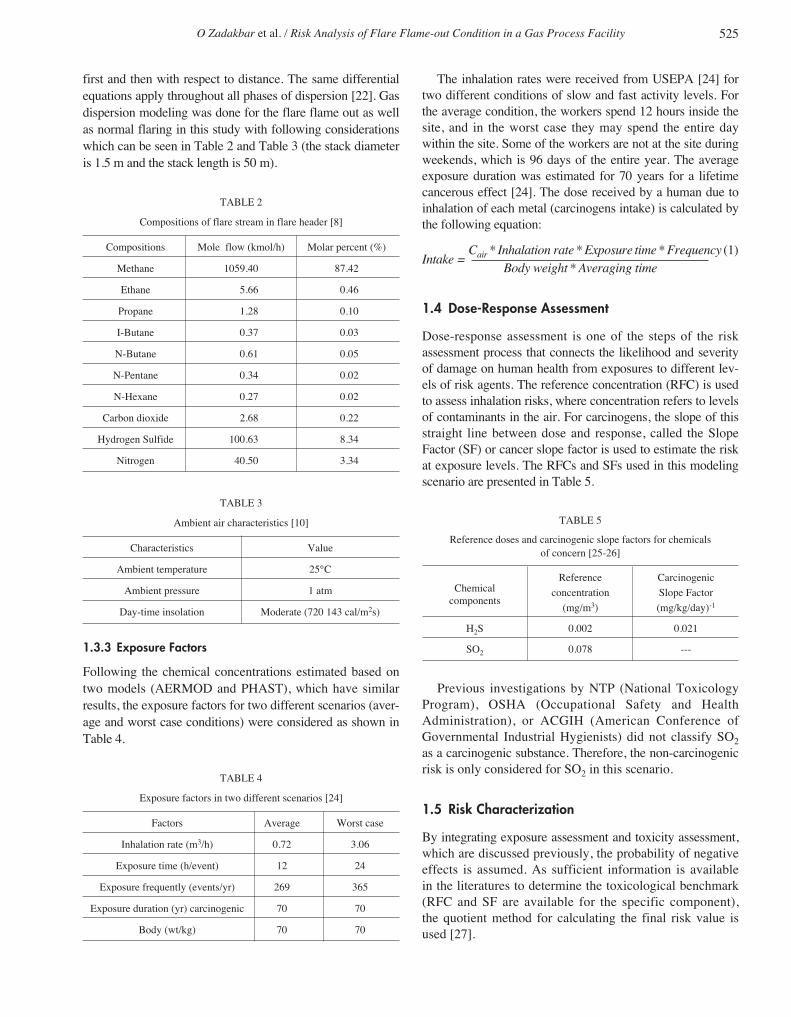
first and then with respect to distance. The same differentialequations apply throughout all phases of dispersion [22]. Gasdispersion modeling was done for the flare flame out as wellas normal flaring in this study with following considerationswhich can be seen in Table 2 and Table 3 (the stack diameteris 1.5 m and the stack length is 50 m).
TABLE 2
Compositions of flare stream in flare header [8]
Compositions Mole flow (kmol/h) Molar percent (%)
Methane 1059.40 87.42
Ethane 5.66 0.46
Propane 1.28 0.10
I-Butane 0.37 0.03
N-Butane 0.61 0.05
N-Pentane 0.34 0.02
N-Hexane 0.27 0.02
Carbon dioxide 2.68 0.22
Hydrogen Sulfide 100.63 8.34
Nitrogen 40.50 3.34
TABLE 3
Ambient air characteristics [10]
Characteristics Value
Ambient temperature 25°C
Ambient pressure 1 atm
Day-time insolation Moderate (720 143 cal/m2s)
1.3.3 Exposure Factors
Following the chemical concentrations estimated based ontwo models (AERMOD and PHAST), which have similarresults, the exposure factors for two different scenarios (aver-age and worst case conditions) were considered as shown inTable 4.
TABLE 4
Exposure factors in two different scenarios [24]
Factors Average Worst case
Inhalation rate (m3/h) 0.72 3.06
Exposure time (h/event) 12 24
Exposure frequently (events/yr) 269 365
Exposure duration (yr) carcinogenic 70 70
Body (wt/kg) 70 70
The inhalation rates were received from USEPA [24] fortwo different conditions of slow and fast activity levels. Forthe average condition, the workers spend 12 hours inside thesite, and in the worst case they may spend the entire daywithin the site. Some of the workers are not at the site duringweekends, which is 96 days of the entire year. The averageexposure duration was estimated for 70 years for a lifetimecancerous effect [24]. The dose received by a human due toinhalation of each metal (carcinogens intake) is calculated bythe following equation:
Intake = Cair * Inhalation rate * Exposure time * Frequency (1)
Body weight * Averaging time
1.4 Dose-Response Assessment
Dose-response assessment is one of the steps of the riskassessment process that connects the likelihood and severityof damage on human health from exposures to different lev-els of risk agents. The reference concentration (RFC) is usedto assess inhalation risks, where concentration refers to levelsof contaminants in the air. For carcinogens, the slope of thisstraight line between dose and response, called the SlopeFactor (SF) or cancer slope factor is used to estimate the riskat exposure levels. The RFCs and SFs used in this modelingscenario are presented in Table 5.
TABLE 5
Reference doses and carcinogenic slope factors for chemicalsof concern [25-26]
ChemicalReference Carcinogenic
componentsconcentration Slope Factor
(mg/m3) (mg/kg/day)-1
H2S 0.002 0.021
SO2 0.078 ---
Previous investigations by NTP (National ToxicologyProgram), OSHA (Occupational Safety and HealthAdministration), or ACGIH (American Conference ofGovernmental Industrial Hygienists) did not classify SO2as a carcinogenic substance. Therefore, the non-carcinogenicrisk is only considered for SO2 in this scenario.
1.5 Risk Characterization
By integrating exposure assessment and toxicity assessment,which are discussed previously, the probability of negativeeffects is assumed. As sufficient information is available in the literatures to determine the toxicological benchmark(RFC and SF are available for the specific component), the quotient method for calculating the final risk value isused [27].
O Zadakbar et al. / Risk Analysis of Flare Flame-out Condition in a Gas Process Facility 525
ogst100008_Zadakbar 22/07/11 17:35 Page 525
Oil & Gas Science and Technology – Rev. IFP Energies nouvelles, Vol. 66 (2011), No. 3
The data from Table 5 are used to calculate the HazardQuotient (HQ) and the risk for carcinogens. The HQ is calcu-lated from Equation (2), while the carcinogenic risk wascalculated from Equation (3).
HQ = Non-carcinogenic intake (mg/m3)/Reference concentration (mg/m3)
(2)
Risk = Carcinogenic intake (mg/kg/day) ×Cancer slope factor (mg/kg/day)-1 (3)
If the HQ is less than 1, it shows that the risk is slight andlittle or no action is required. If the HQ is near 1, it showsuncertainty in the risk estimate and additional data isrequired. Finally, if the HQ is more than 1, it shows that therisk is greater and regulatory action may be indicated [28]. Asingle specified acceptable risk level, applicable for all car-cinogens regulated by EPA is 10-6 (one death per millionpeople). Whenever the risk of carcinogenic substance exceedsthis value, it shows that the component has a carcinogeniceffect [27].
2 RESULTS AND DISCUSSION
Implementing the four steps of EPA framework, with thecontaminant concentrations released in two different conditionsof normal flaring and flare flame out (see Tab. 6) leads to thefollowing results.
TABLE 6
Application of AERMOD and UDMfor gas dispersion modeling in Khangiran
ConditionModel AERMOD UDM
Flare flame out H2S dispersion H2S dispersion
(impact area, restricted area)
Normal flaring - SO2 dispersion
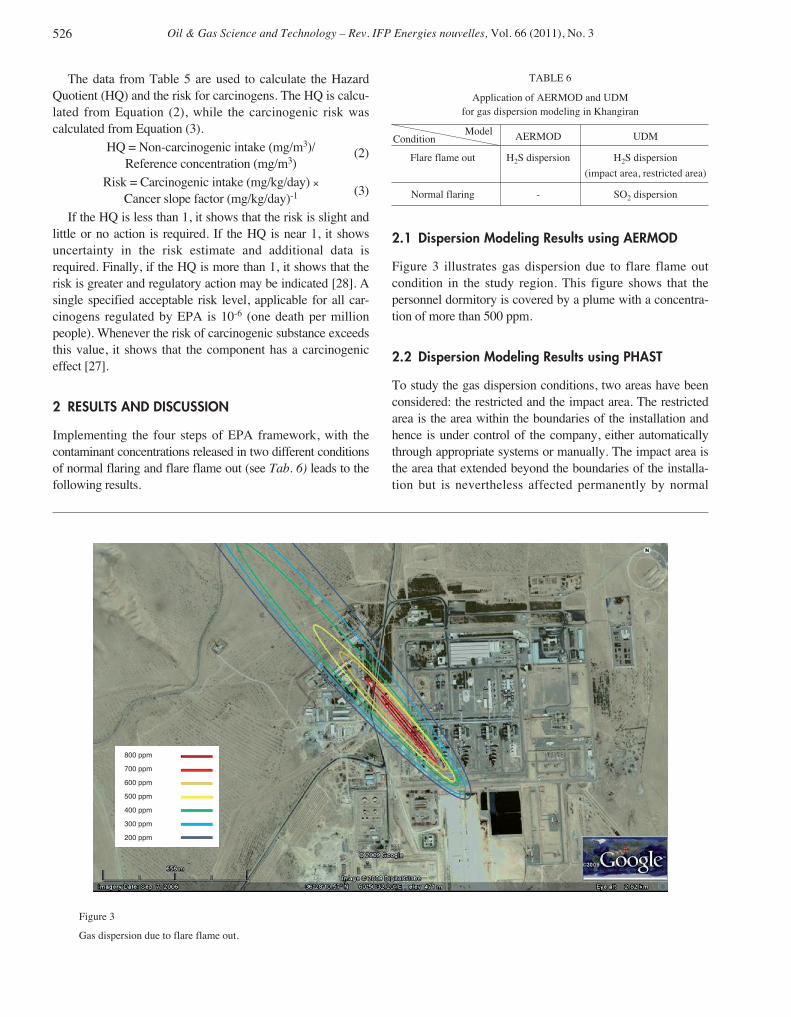
2.1 Dispersion Modeling Results using AERMOD
Figure 3 illustrates gas dispersion due to flare flame outcondition in the study region. This figure shows that thepersonnel dormitory is covered by a plume with a concentra-tion of more than 500 ppm.
2.2 Dispersion Modeling Results using PHAST
To study the gas dispersion conditions, two areas have beenconsidered: the restricted and the impact area. The restrictedarea is the area within the boundaries of the installation andhence is under control of the company, either automaticallythrough appropriate systems or manually. The impact area isthe area that extended beyond the boundaries of the installa-tion but is nevertheless affected permanently by normal
526
800 ppm
700 ppm
600 ppm
500 ppm
400 ppm
300 ppm
200 ppm
Figure 3
Gas dispersion due to flare flame out.
ogst100008_Zadakbar 22/07/11 17:35 Page 526
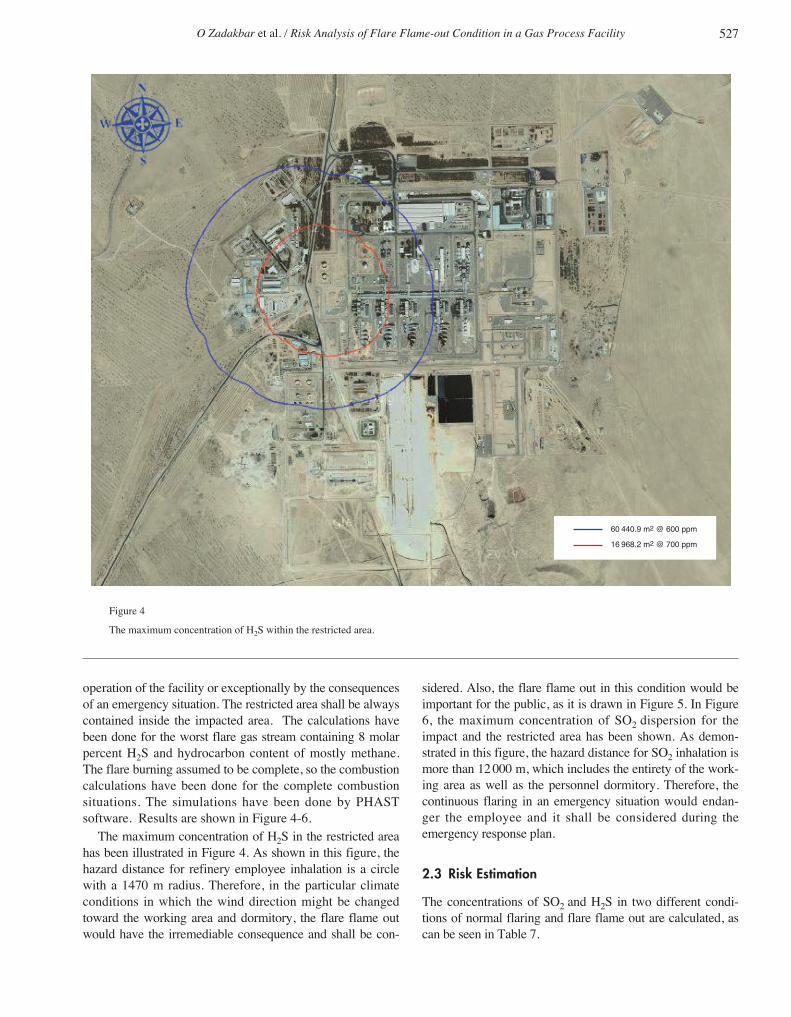
operation of the facility or exceptionally by the consequencesof an emergency situation. The restricted area shall be alwayscontained inside the impacted area. The calculations havebeen done for the worst flare gas stream containing 8 molarpercent H2S and hydrocarbon content of mostly methane.The flare burning assumed to be complete, so the combustioncalculations have been done for the complete combustionsituations. The simulations have been done by PHASTsoftware. Results are shown in Figure 4-6.
The maximum concentration of H2S in the restricted areahas been illustrated in Figure 4. As shown in this figure, thehazard distance for refinery employee inhalation is a circlewith a 1470 m radius. Therefore, in the particular climateconditions in which the wind direction might be changedtoward the working area and dormitory, the flare flame outwould have the irremediable consequence and shall be con-
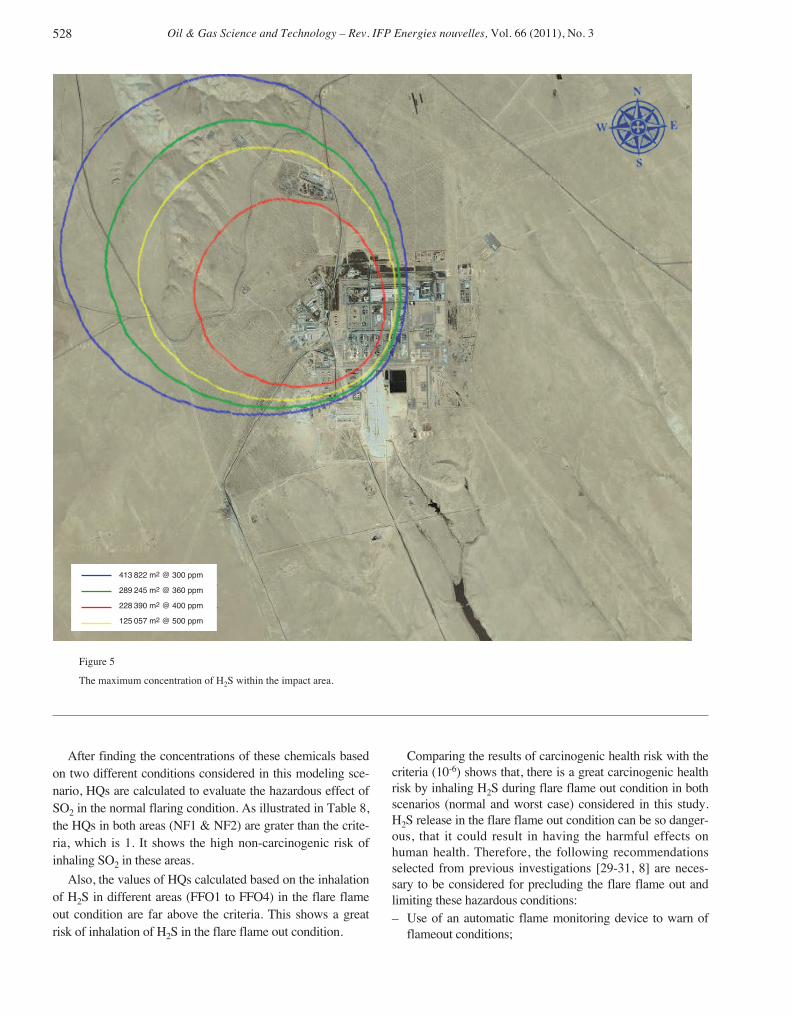
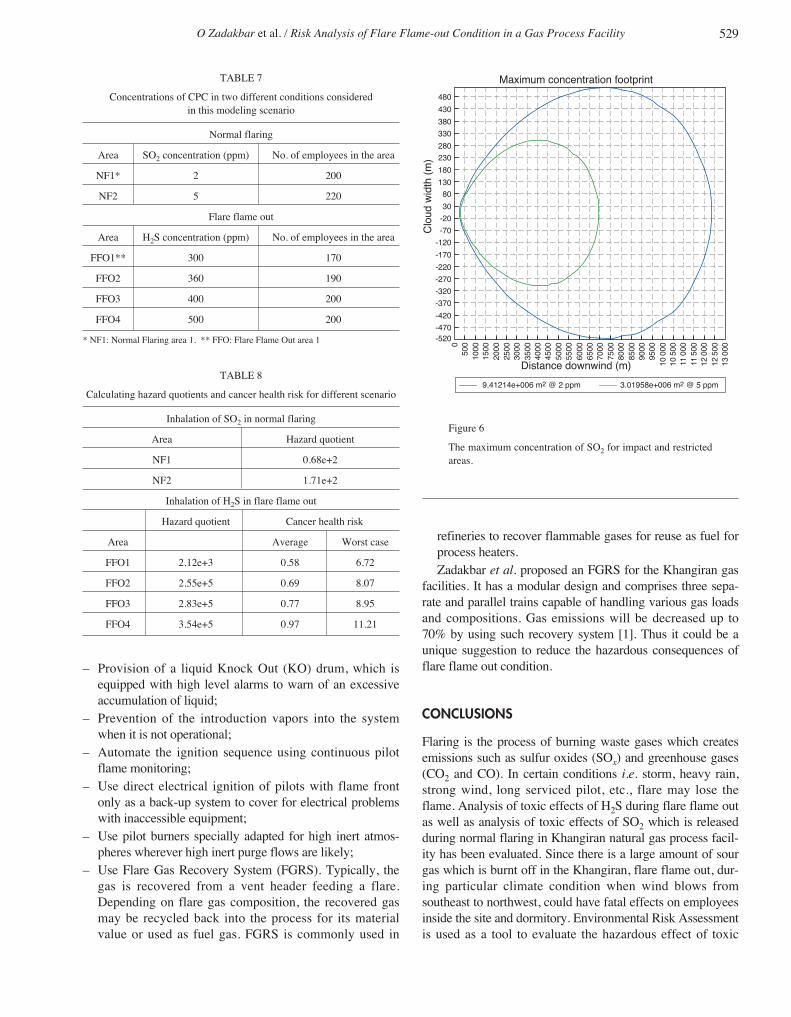
sidered. Also, the flare flame out in this condition would beimportant for the public, as it is drawn in Figure 5. In Figure6, the maximum concentration of SO2 dispersion for theimpact and the restricted area has been shown. As demon-strated in this figure, the hazard distance for SO2 inhalation ismore than 12 000 m, which includes the entirety of the work-ing area as well as the personnel dormitory. Therefore, thecontinuous flaring in an emergency situation would endan-ger the employee and it shall be considered during theemergency response plan.
2.3 Risk Estimation
The concentrations of SO2 and H2S in two different condi-tions of normal flaring and flare flame out are calculated, ascan be seen in Table 7.
O Zadakbar et al. / Risk Analysis of Flare Flame-out Condition in a Gas Process Facility 527
60 440.9 m2 @ 600 ppm
16 968.2 m2 @ 700 ppm
Figure 4
The maximum concentration of H2S within the restricted area.
ogst100008_Zadakbar 22/07/11 17:35 Page 527
Oil & Gas Science and Technology – Rev. IFP Energies nouvelles, Vol. 66 (2011), No. 3
After finding the concentrations of these chemicals basedon two different conditions considered in this modeling sce-nario, HQs are calculated to evaluate the hazardous effect ofSO2 in the normal flaring condition. As illustrated in Table 8,the HQs in both areas (NF1 & NF2) are grater than the crite-ria, which is 1. It shows the high non-carcinogenic risk ofinhaling SO2 in these areas.
Also, the values of HQs calculated based on the inhalationof H2S in different areas (FFO1 to FFO4) in the flare flameout condition are far above the criteria. This shows a greatrisk of inhalation of H2S in the flare flame out condition.
Comparing the results of carcinogenic health risk with thecriteria (10-6) shows that, there is a great carcinogenic healthrisk by inhaling H2S during flare flame out condition in bothscenarios (normal and worst case) considered in this study.H2S release in the flare flame out condition can be so danger-ous, that it could result in having the harmful effects onhuman health. Therefore, the following recommendationsselected from previous investigations [29-31, 8] are neces-sary to be considered for precluding the flare flame out andlimiting these hazardous conditions:– Use of an automatic flame monitoring device to warn of
flameout conditions;
528
413 822 m2 @ 300 ppm
289 245 m2 @ 360 ppm
228 390 m2 @ 400 ppm
125 057 m2 @ 500 ppm
Figure 5
The maximum concentration of H2S within the impact area.
ogst100008_Zadakbar 22/07/11 17:35 Page 528
– Provision of a liquid Knock Out (KO) drum, which isequipped with high level alarms to warn of an excessiveaccumulation of liquid;
– Prevention of the introduction vapors into the systemwhen it is not operational;
– Automate the ignition sequence using continuous pilotflame monitoring;
– Use direct electrical ignition of pilots with flame frontonly as a back-up system to cover for electrical problemswith inaccessible equipment;
– Use pilot burners specially adapted for high inert atmos-pheres wherever high inert purge flows are likely;
– Use Flare Gas Recovery System (FGRS). Typically, thegas is recovered from a vent header feeding a flare.Depending on flare gas composition, the recovered gasmay be recycled back into the process for its materialvalue or used as fuel gas. FGRS is commonly used in
refineries to recover flammable gases for reuse as fuel forprocess heaters.Zadakbar et al. proposed an FGRS for the Khangiran gas
facilities. It has a modular design and comprises three sepa-rate and parallel trains capable of handling various gas loadsand compositions. Gas emissions will be decreased up to70% by using such recovery system [1]. Thus it could be aunique suggestion to reduce the hazardous consequences offlare flame out condition.
CONCLUSIONS
Flaring is the process of burning waste gases which createsemissions such as sulfur oxides (SOx) and greenhouse gases(CO2 and CO). In certain conditions i.e. storm, heavy rain,strong wind, long serviced pilot, etc., flare may lose theflame. Analysis of toxic effects of H2S during flare flame outas well as analysis of toxic effects of SO2 which is releasedduring normal flaring in Khangiran natural gas process facil-ity has been evaluated. Since there is a large amount of sourgas which is burnt off in the Khangiran, flare flame out, dur-ing particular climate condition when wind blows fromsoutheast to northwest, could have fatal effects on employeesinside the site and dormitory. Environmental Risk Assessmentis used as a tool to evaluate the hazardous effect of toxic
O Zadakbar et al. / Risk Analysis of Flare Flame-out Condition in a Gas Process Facility 529
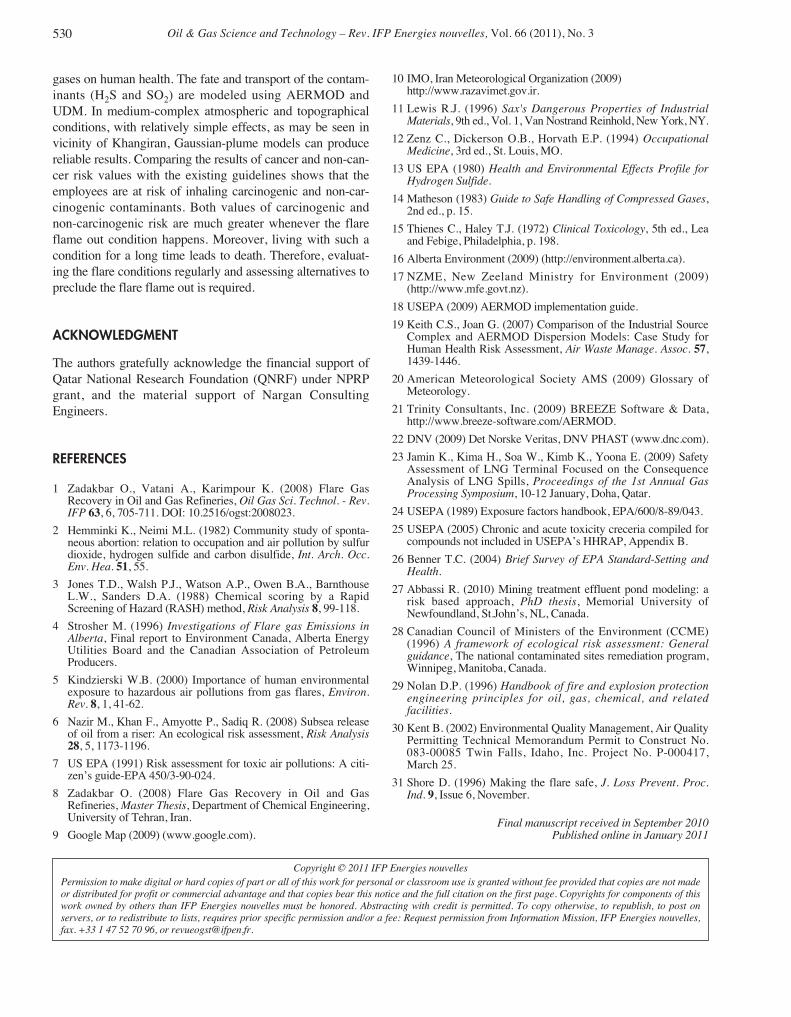
TABLE 7
Concentrations of CPC in two different conditions consideredin this modeling scenario
Normal flaring
Area SO2 concentration (ppm) No. of employees in the area
NF1* 2 200
NF2 5 220
Flare flame out
Area H2S concentration (ppm) No. of employees in the area
FFO1** 300 170
FFO2 360 190
FFO3 400 200
FFO4 500 200
* NF1: Normal Flaring area 1. ** FFO: Flare Flame Out area 1
TABLE 8
Calculating hazard quotients and cancer health risk for different scenario
Inhalation of SO2 in normal flaring
Area Hazard quotient
NF1 0.68e+2
NF2 1.71e+2
Inhalation of H2S in flare flame out
Hazard quotient Cancer health risk
Area Average Worst case
FFO1 2.12e+3 0.58 6.72
FFO2 2.55e+5 0.69 8.07
FFO3 2.83e+5 0.77 8.95
FFO4 3.54e+5 0.97 11.21
1300
0
Clo
ud w
idth
(m
)
Distance downwind (m)
Maximum concentration footprint
1250
012
000
1150
011
000
1050
010
000
9500
9000
8500
8000
7500
7000
6500
6000
5500
5000
4500
4000
3500
3000
2500
2000
1500
10005000
-470-520
-420
-370
-320
-270
-220
-170
-120
-70
-20
30
80
130
180
230
280
330
380
430
480
9.41214e+006 m2 @ 2 ppm 3.01958e+006 m2 @ 5 ppm
Figure 6
The maximum concentration of SO2 for impact and restrictedareas.
ogst100008_Zadakbar 22/07/11 17:35 Page 529
Oil & Gas Science and Technology – Rev. IFP Energies nouvelles, Vol. 66 (2011), No. 3530
gases on human health. The fate and transport of the contam-inants (H2S and SO2) are modeled using AERMOD andUDM. In medium-complex atmospheric and topographicalconditions, with relatively simple effects, as may be seen invicinity of Khangiran, Gaussian-plume models can producereliable results. Comparing the results of cancer and non-can-cer risk values with the existing guidelines shows that theemployees are at risk of inhaling carcinogenic and non-car-cinogenic contaminants. Both values of carcinogenic andnon-carcinogenic risk are much greater whenever the flareflame out condition happens. Moreover, living with such acondition for a long time leads to death. Therefore, evaluat-ing the flare conditions regularly and assessing alternatives topreclude the flare flame out is required.
ACKNOWLEDGMENT
The authors gratefully acknowledge the financial support ofQatar National Research Foundation (QNRF) under NPRPgrant, and the material support of Nargan ConsultingEngineers.
REFERENCES
1 Zadakbar O., Vatani A., Karimpour K. (2008) Flare GasRecovery in Oil and Gas Refineries, Oil Gas Sci. Technol. - Rev.IFP 63, 6, 705-711. DOI: 10.2516/ogst:2008023.
2 Hemminki K., Neimi M.L. (1982) Community study of sponta-neous abortion: relation to occupation and air pollution by sulfurdioxide, hydrogen sulfide and carbon disulfide, Int. Arch. Occ.Env. Hea. 51, 55.
3 Jones T.D., Walsh P.J., Watson A.P., Owen B.A., BarnthouseL.W., Sanders D.A. (1988) Chemical scoring by a RapidScreening of Hazard (RASH) method, Risk Analysis 8, 99-118.
4 Strosher M. (1996) Investigations of Flare gas Emissions inAlberta, Final report to Environment Canada, Alberta EnergyUtilities Board and the Canadian Association of PetroleumProducers.
5 Kindzierski W.B. (2000) Importance of human environmentalexposure to hazardous air pollutions from gas flares, Environ.Rev. 8, 1, 41-62.
6 Nazir M., Khan F., Amyotte P., Sadiq R. (2008) Subsea releaseof oil from a riser: An ecological risk assessment, Risk Analysis28, 5, 1173-1196.
7 US EPA (1991) Risk assessment for toxic air pollutions: A citi-zen’s guide-EPA 450/3-90-024.
8 Zadakbar O. (2008) Flare Gas Recovery in Oil and GasRefineries, Master Thesis, Department of Chemical Engineering,University of Tehran, Iran.
9 Google Map (2009) (www.google.com).
10 IMO, Iran Meteorological Organization (2009)http://www.razavimet.gov.ir.
11 Lewis R.J. (1996) Sax's Dangerous Properties of IndustrialMaterials, 9th ed., Vol. 1, Van Nostrand Reinhold, New York, NY.
12 Zenz C., Dickerson O.B., Horvath E.P. (1994) OccupationalMedicine, 3rd ed., St. Louis, MO.
13 US EPA (1980) Health and Environmental Effects Profile forHydrogen Sulfide.
14 Matheson (1983) Guide to Safe Handling of Compressed Gases,2nd ed., p. 15.
15 Thienes C., Haley T.J. (1972) Clinical Toxicology, 5th ed., Leaand Febige, Philadelphia, p. 198.
16 Alberta Environment (2009) (http://environment.alberta.ca).
17 NZME, New Zeeland Ministry for Environment (2009)(http://www.mfe.govt.nz).
18 USEPA (2009) AERMOD implementation guide.
19 Keith C.S., Joan G. (2007) Comparison of the Industrial SourceComplex and AERMOD Dispersion Models: Case Study forHuman Health Risk Assessment, Air Waste Manage. Assoc. 57,1439-1446.
20 American Meteorological Society AMS (2009) Glossary ofMeteorology.
21 Trinity Consultants, Inc. (2009) BREEZE Software & Data,http://www.breeze-software.com/AERMOD.
22 DNV (2009) Det Norske Veritas, DNV PHAST (www.dnc.com).
23 Jamin K., Kima H., Soa W., Kimb K., Yoona E. (2009) SafetyAssessment of LNG Terminal Focused on the ConsequenceAnalysis of LNG Spills, Proceedings of the 1st Annual GasProcessing Symposium, 10-12 January, Doha, Qatar.
24 USEPA (1989) Exposure factors handbook, EPA/600/8-89/043.
25 USEPA (2005) Chronic and acute toxicity creceria compiled forcompounds not included in USEPA’s HHRAP, Appendix B.
26 Benner T.C. (2004) Brief Survey of EPA Standard-Setting andHealth.
27 Abbassi R. (2010) Mining treatment effluent pond modeling: arisk based approach, PhD thesis, Memorial University ofNewfoundland, St.John’s, NL, Canada.
28 Canadian Council of Ministers of the Environment (CCME)(1996) A framework of ecological risk assessment: Generalguidance, The national contaminated sites remediation program,Winnipeg, Manitoba, Canada.
29 Nolan D.P. (1996) Handbook of fire and explosion protectionengineering principles for oil, gas, chemical, and relatedfacilities.
30 Kent B. (2002) Environmental Quality Management, Air QualityPermitting Technical Memorandum Permit to Construct No.083-00085 Twin Falls, Idaho, Inc. Project No. P-000417,March 25.
31 Shore D. (1996) Making the flare safe, J. Loss Prevent. Proc.Ind. 9, Issue 6, November.
Final manuscript received in September 2010Published online in January 2011
Copyright © 2011 IFP Energies nouvellesPermission to make digital or hard copies of part or all of this work for personal or classroom use is granted without fee provided that copies are not madeor distributed for profit or commercial advantage and that copies bear this notice and the full citation on the first page. Copyrights for components of thiswork owned by others than IFP Energies nouvelles must be honored. Abstracting with credit is permitted. To copy otherwise, to republish, to post onservers, or to redistribute to lists, requires prior specific permission and/or a fee: Request permission from Information Mission, IFP Energies nouvelles,fax. +33 1 47 52 70 96, or [email protected].
ogst100008_Zadakbar 22/07/11 17:35 Page 530