Embed Size (px)
Citation preview
PSA
M 6
pre
sent
atio
n / R
. Moc
k / 2
Jul
y, 2
002
1
HOCHSCHULE FÜR TECHNIK, WIRTSCHAFT UND VERWALTUNG ZÜRICH
Risk Analysis Related Issues of IT-Systems:Case Studies in Review
PSAM 6, San Juan, Puerto Rico USA, June 27th, 2002
Frank MöhleAndreas Fischer
Ralf Mock
University of Applied Sciences Zurich
Swiss Federal Instituteof Technology Zurich

PSA
M 6
pre
sent
atio
n / R
. Moc
k / 2
Jul
y, 2
002
2
HOCHSCHULE FÜR TECHNIK, WIRTSCHAFT UND VERWALTUNG ZÜRICH
Table of Content
• Positioning of Risk Analysis- in a Company’s Decision Making Process- Nuclear Power Generation- IT-Networks
• A Three-step Concept of Risk Analysis• Case Studies: Learning by Doing!
- Telecommunication- Banking- Internet Application Service- Educational
• Experiences in Risk Analyses• Conclusions for Risk Analysts of IT-Systems

PSA
M 6
pre
sent
atio
n / R
. Moc
k / 2
Jul
y, 2
002
3
HOCHSCHULE FÜR TECHNIK, WIRTSCHAFT UND VERWALTUNG ZÜRICH
EstablishedRisk
AnalysisTechniques
OperationalControl
ManagementControl
StrategicPlanning
Structured
Unstructured
Semistructured
„Best Practice“
Decision Level
Dec
isio
n M
akin
g
M. Diergardt, ETHZ-LSA, Jan. 2002
Positioning of Risk Analysis- in a Company’s Decision Making Process -

PSA
M 6
pre
sent
atio
n / R
. Moc
k / 2
Jul
y, 2
002
4
HOCHSCHULE FÜR TECHNIK, WIRTSCHAFT UND VERWALTUNG ZÜRICH
Positioning of Risk Analysis- Nuclear Power Generation -
System Characteristics• Topology
Complex, local• Stability
Unmodified basic system design during system operation
• Mean Time of System Operation 40 to 45 years
Risk Analysis Characteristics• Duration (CH)
≈ 3 years (without peer review) • Costs (CH)
≈ 1.8 – 2 Mio. USD per PRA• Data Evaluation
Well developed incident and equipment documentation
• Analysis TechniquesEstablished and approved techniques
• ResultsLong term usability of PRA results

PSA
M 6
pre
sent
atio
n / R
. Moc
k / 2
Jul
y, 2
002
5
HOCHSCHULE FÜR TECHNIK, WIRTSCHAFT UND VERWALTUNG ZÜRICH
Risk Analysis Characteristics• Duration: 3 to 6 months required• Costs: ????• Data Evaluation
Worse incident and equipment documentation
• Analysis TechniquesEstablished and approved checklist approaches (“Best Practises”)
• Results- Short term usefullness- Applying Occam's razor
Positioning of RSA-Analysis- IT-Networks -
System Characteristics• Topology
Complex, networked• Stability
Permanent variations of hardware, software, data, etc.
• Mean Time of System Operation ≈ 2 years
PSA
M 6
pre
sent
atio
n / R
. Moc
k / 2
Jul
y, 2
002
6
HOCHSCHULE FÜR TECHNIK, WIRTSCHAFT UND VERWALTUNG ZÜRICH
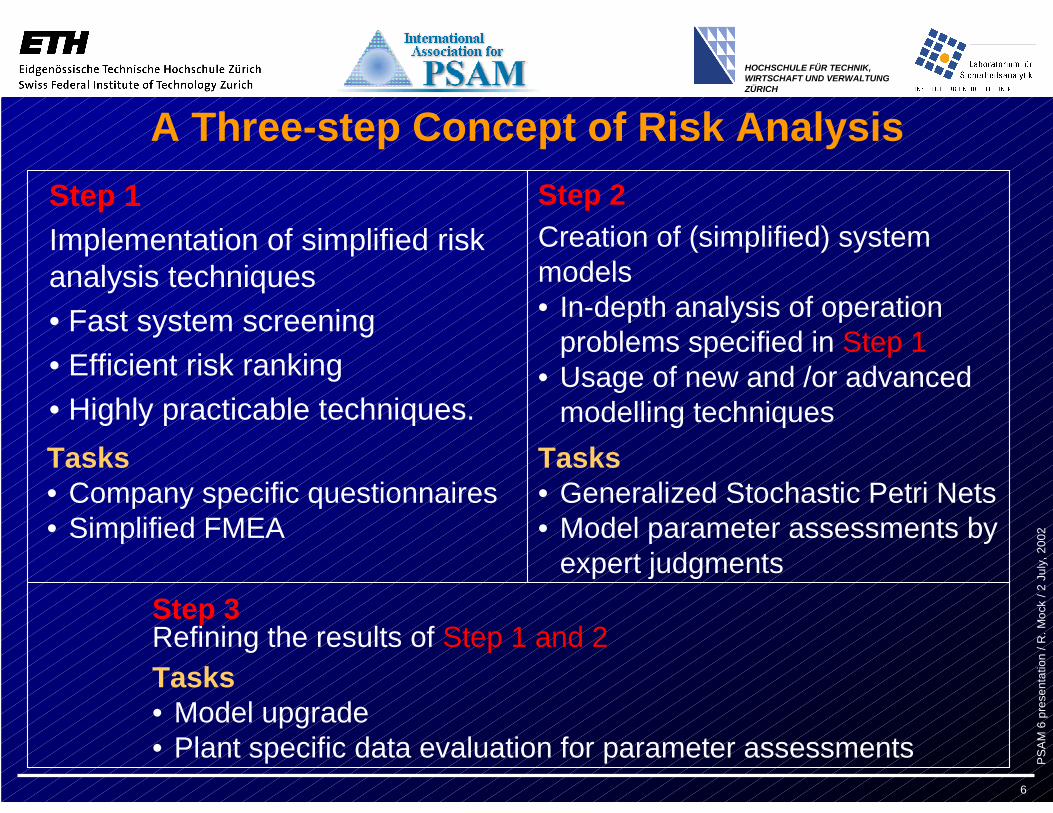
A Three-step Concept of Risk AnalysisStep 2Creation of (simplified) systemmodels
Step 3Refining the results of Step 1 and 2
Step 1Implementation of simplified riskanalysis techniques• Fast system screening• Efficient risk ranking• Highly practicable techniques.
• In-depth analysis of operationproblems specified in Step 1
• Usage of new and /or advancedmodelling techniques
Tasks• Generalized Stochastic Petri Nets• Model parameter assessments by
expert judgments
Tasks• Company specific questionnaires• Simplified FMEA
Tasks• Model upgrade• Plant specific data evaluation for parameter assessments

PSA
M 6
pre
sent
atio
n / R
. Moc
k / 2
Jul
y, 2
002
7
HOCHSCHULE FÜR TECHNIK, WIRTSCHAFT UND VERWALTUNG ZÜRICH
Case Studies: Learning by Doing!
• Branch: Telecommunication• Case study: Swisscom AG • Goals
– Fast system screening – Hot spot identification – Identification of financial risks
• Techniques: Step 1 & 2 approaches
• Branch: Banking• Case study: UBS Warburg • Goals
– Fast system screening – Hot spot identification – Identification of business risks
• Techniques: Step 1 approaches
• Branch: Internet application service• Case study: ASP• Goals
– Fast system screening – Assessment of reliability figures – Comparison of design versions
• Techniques: Step 1 - 3 approaches
• Branch: Educational• Case study: Univ. of Applied Sciences.• Goals
– System modelling– Log-file analysis
• Techniques: Step 3 approaches

PSA
M 6
pre
sent
atio
n / R
. Moc
k / 2
Jul
y, 2
002
8
HOCHSCHULE FÜR TECHNIK, WIRTSCHAFT UND VERWALTUNG ZÜRICH
Case Study: Telecommunication
Step 1: Simplified FMEA Methodology
Swisscom SpecificationsSwisscom
SpecificationsCategories ofConsequences
Categories ofUnits
ConsequenceAssessments
Questionnaire Failure Modes
Unit j
Failure Causes i
Frequency Assessments
MatrixCause i x Unit j
MatrixCause i x Unit j
PSA
M 6
pre
sent
atio
n / R
. Moc
k / 2
Jul
y, 2
002
9
HOCHSCHULE FÜR TECHNIK, WIRTSCHAFT UND VERWALTUNG ZÜRICH
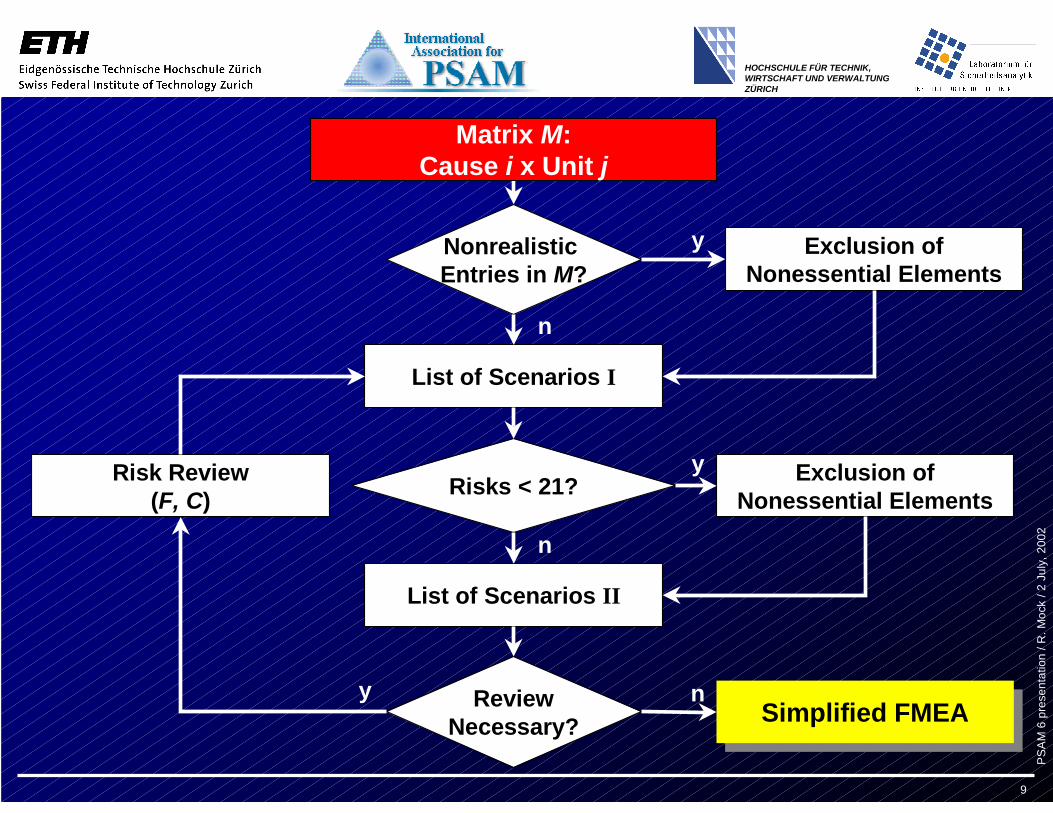
Nonrealistic Entries in M?
Simplified FMEASimplified FMEA
Risk Review(F, C)
Exclusion ofNonessential Elements
List of Scenarios II
List of Scenarios I
Exclusion ofNonessential Elements
Risks < 21?
ReviewNecessary?
y
y
y
n
n
n
Matrix M:Cause i x Unit j

PSA
M 6
pre
sent
atio
n / R
. Moc
k / 2
Jul
y, 2
002
10
HOCHSCHULE FÜR TECHNIK, WIRTSCHAFT UND VERWALTUNG ZÜRICH
Result: Simplified FMEA of all Modules (Excerpt)
Module Unit Item FailureMode
FailureCauses
Consequence F C Risk
SAP Application ApplicationSW
Modification Maloperation Inconsistent billing 4 7 28
Gateway Networkinterface
RouterISDN
Failure Maloperation No billing 5 5 25
Gateway Information Referencedata
Stolen/deleted
Vandalism Perturbed billing 4 6 24
Gateway Information Referencedata
Stolen/deleted
Organisationproblems
Perturbed billing 4 6 24
LAN Information Referencedata
Unapprovedinsight
Organisationproblems
Loss of image 4 6 24
Risk Ranking• Maximum: 100• Medium: 25.
Risk Ranking• Maximum: 100• Medium: 25.
Risk =• Frequency •••• Consequence• F, C: 10 categories each
Risk =• Frequency •••• Consequence• F, C: 10 categories each

PSA
M 6
pre
sent
atio
n / R
. Moc
k / 2
Jul
y, 2
002
11
HOCHSCHULE FÜR TECHNIK, WIRTSCHAFT UND VERWALTUNG ZÜRICH
Step 2: Generalized Stochastic Petri Net
Bottle neck identification of data flow

PSA
M 6
pre
sent
atio
n / R
. Moc
k / 2
Jul
y, 2
002
12
HOCHSCHULE FÜR TECHNIK, WIRTSCHAFT UND VERWALTUNG ZÜRICH
Case Study: BankingStep 1: SWOT-Analysis and FMEA of CaTS
SWOT: Strengths/Weaknesses, Opportunities/Threats
SquaresInterferences• Black: positive• Grey: negative• White: balanced
PSA
M 6
pre
sent
atio
n / R
. Moc
k / 2
Jul
y, 2
002
13
HOCHSCHULE FÜR TECHNIK, WIRTSCHAFT UND VERWALTUNG ZÜRICH
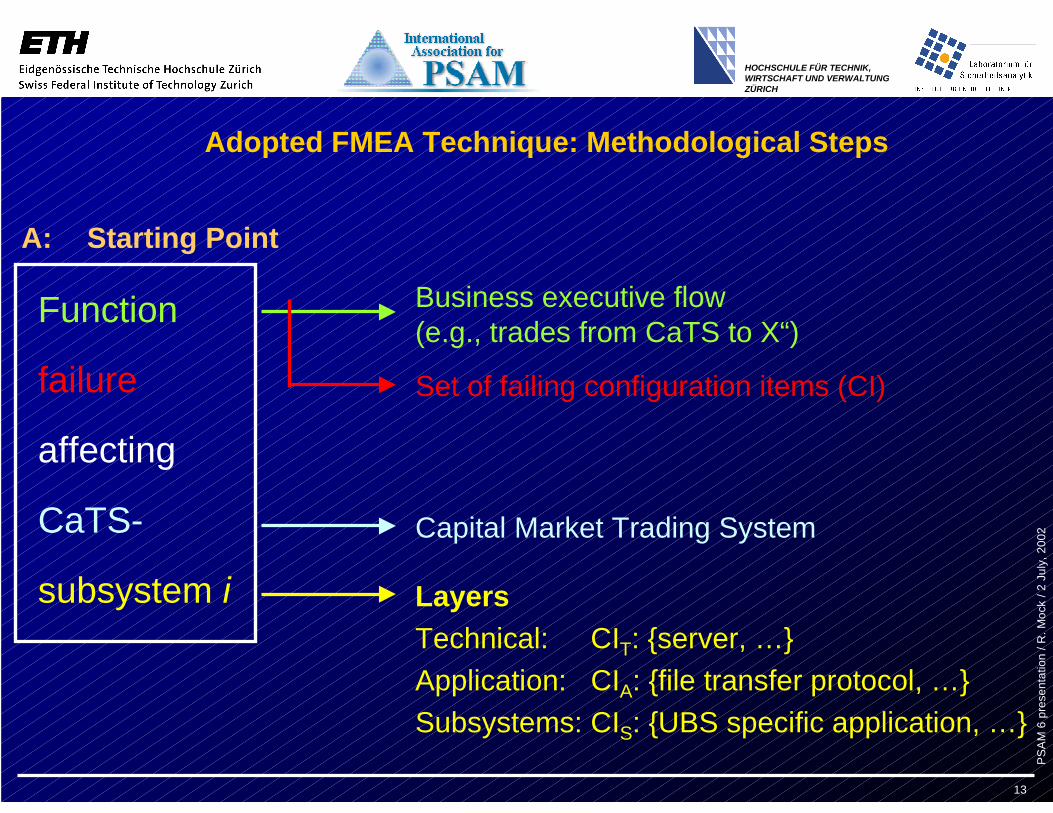
Adopted FMEA Technique: Methodological Steps
Function
failure
affecting
CaTS-
subsystem i
Business executive flow (e.g., trades from CaTS to X“)
Set of failing configuration items (CI)
Capital Market Trading System
LayersTechnical: CIT: {server, …}Application: CIA: {file transfer protocol, …}Subsystems: CIS: {UBS specific application, …}
A: Starting Point

PSA
M 6
pre
sent
atio
n / R
. Moc
k / 2
Jul
y, 2
002
14
HOCHSCHULE FÜR TECHNIK, WIRTSCHAFT UND VERWALTUNG ZÜRICH
B: AssessmentsExpert Judgements (Using 10 Classes Classsification Schemes)
• TTRi : Time to recover of subsystem i)• CIR,i : „CI-reliability“
• Rfin,i : Financial risk• Rrep,i : Reputation risk
• If, i : Impact
CI-availabilityAi = TTRi ·CIR,i
Impact of i with regard to CaTSIi, CaTs = Rfin,i ·Rrep, i
Function impact with regard to i

PSA
M 6
pre
sent
atio
n / R
. Moc
k / 2
Jul
y, 2
002
15
HOCHSCHULE FÜR TECHNIK, WIRTSCHAFT UND VERWALTUNG ZÜRICH
C: Computations• Function impact with regard to CaTS:
• Function priority number:
1
, , , ,1
n
f CaTS i CaTS f i f ii
I I I I−
=
� �= ⋅ ⋅ � �� ��
D: Some Results
Pf = Ai ·If, CaTS
Most „risky“ functions• Orders and cancellation requests to SWX (derivates, shares)• Market funds to CaTS (derivates)• Orders and cancellations to SWX (bounds)• Market funds to CaTS (shares), ….
FailingFunction f
AffectedSubsystem i
Impact Failure Cause(Failing CI)
Function Impact If, CaTS
FunctionPriority Pf
Availability
CI Ai

PSA
M 6
pre
sent
atio
n / R
. Moc
k / 2
Jul
y, 2
002
16
HOCHSCHULE FÜR TECHNIK, WIRTSCHAFT UND VERWALTUNG ZÜRICH
Case Study: Internet Application ServiceStep 1• Definition of functional modules
- Characterization of the ASP data center network
• Fishbone Diagram• FMEA
Results: „most important risks“• „Loss of privacy“ due to
- Data manipulation- Hacker attacks
• Server failures due to data manipulation
• Viruses, hacker attacks, etc.Step 2 + 3Server availabilities independancy of operating systems
- Markovian state diagram
Results: single server system• Operating System: WINDOWS
2000 is ≈ 3x more stable thanWINDOW NT 4.0
• Limitations: Poor database,exclusion of human factors, etc.
PSA
M 6
pre
sent
atio
n / R
. Moc
k / 2
Jul
y, 2
002
17
HOCHSCHULE FÜR TECHNIK, WIRTSCHAFT UND VERWALTUNG ZÜRICH
Case Study: Educational- In Progress-
Step 3Usage of Logfiles for Risk Analysis Purposes• Solving the „filtering problem“• Triggering sophisticated system models or simulation

PSA
M 6
pre
sent
atio
n / R
. Moc
k / 2
Jul
y, 2
002
18
HOCHSCHULE FÜR TECHNIK, WIRTSCHAFT UND VERWALTUNG ZÜRICH
Experiences in Risk Analyses
may be nice to have mustno
SAG UBS ASP UAS
Resources
• Project duration (months) 6 3 3 ?
• Man power team team small team team
Analysis goals
• Simple risk representation
• Minute availability figures
• Risk assessment
• Fast system screening
• System modeling
• System optimization
na
na
na
PSA
M 6
pre
sent
atio
n / R
. Moc
k / 2
Jul
y, 2
002
19
HOCHSCHULE FÜR TECHNIK, WIRTSCHAFT UND VERWALTUNG ZÜRICH
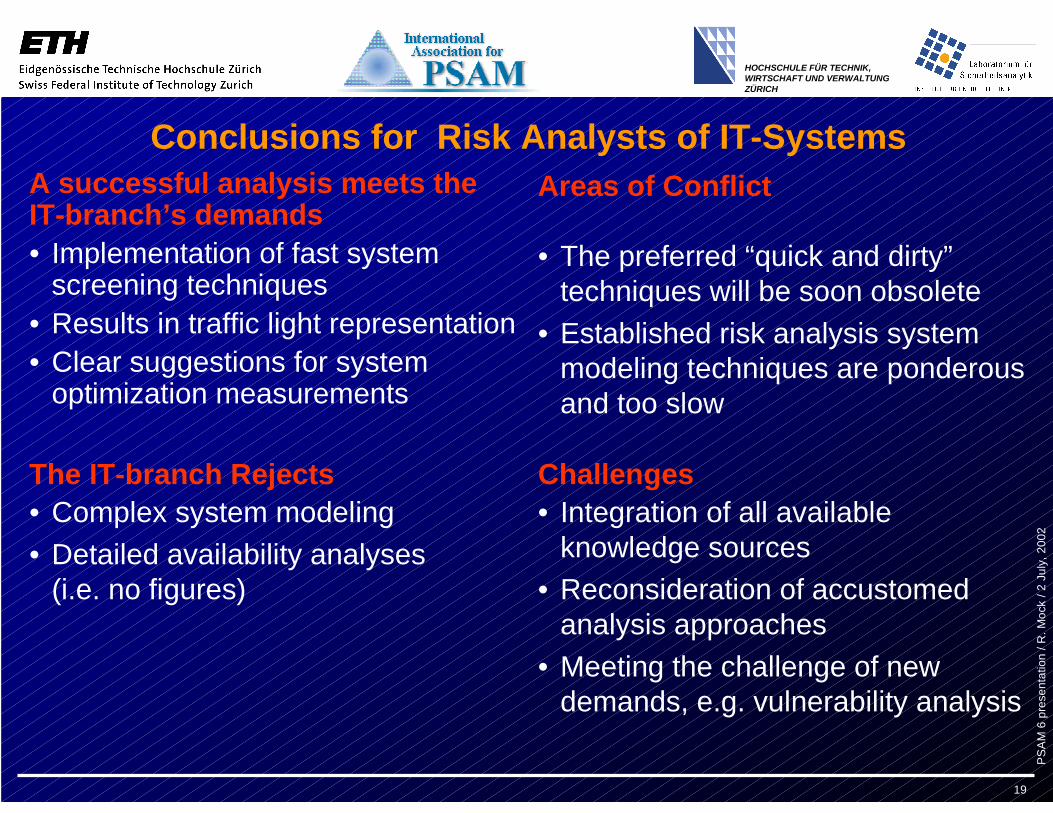
Conclusions for Risk Analysts of IT-Systems
• Complex system modeling• Detailed availability analyses
(i.e. no figures)
• The preferred “quick and dirty”techniques will be soon obsolete
• Established risk analysis systemmodeling techniques are ponderousand too slow
• Implementation of fast systemscreening techniques
• Results in traffic light representation• Clear suggestions for system
optimization measurements
Challenges
A successful analysis meets theIT-branch’s demands
Areas of Conflict
The IT-branch Rejects• Integration of all available
knowledge sources• Reconsideration of accustomed
analysis approaches• Meeting the challenge of new
demands, e.g. vulnerability analysis