Embed Size (px)
Citation preview
Risk and Behavior of Fire Spread in a Densely-built Urban Area
KEISUKE HIMOTO1, YASUO AKIMOTO2, AKIHIKO HOKUGO2, and TAKEYOSHI TANAKA1 1 Disaster Prevention Research Institute, Kyoto University
Gokasho, Uji, Kyoto 611-0011, Japan 2 Graduate School of Engineering, Kobe University
Rokkodai 1-1, Nada, Kobe 657-8501, Japan
ABSTRACT
A fire staring in a densely-built urban area easily spreads to adjacent buildings. In the case of large earthquakes in which multiple fires may break out simultaneously, the spread of such fires may overwhelm the ability of firefighters and damage large areas. In this study, fire spread simulations were carried out in order to investigate behavior of fire spread in Kyoto Higashiyama area, one of the representatives of densely-built urban areas in Japan. A physics-based model was used in which the following mechanisms of fire spread are considered: thermal radiation heat transfer from fire-involved buildings; elevation of ambient temperature by wind-blown fire plumes; and spotting ignition by firebrands. The risk of fire spread was also analyzed by the Monte Carlo method to evaluate the expected magnitude of loss. The effect of uncertainty of the location of fire origin and the weather conditions was investigated.
KEYWORDS: risk assessment, modeling, urban conflagrations, densely-built environment
NOMENCLATURE LISTING *B dimensionless parameter for spotting (-) V volume (m3)
Tb half width of fire plume (m) x windward distance (m) D length scale of heat source building (m) Y mass fraction of species (-)
Pd length scale of firebrands (m) y orthogonal distance of wind (m) Pc specific heat (kJ/(kgK))
g acceleration due to gravity (m/s2) GreekL loss (-) Γ mass production rate of species (kg/s) m mass flow rate (kg/s) ε emissivity (-)
Fm mass release rate of flammable gas (kg/s) θ inclined angle (rad)N number of fire scenarios μ meann number of buildings ρ density (kg/m3)p probability (-) σ standard deviation
Rq ′′ radiant heat flux (kW/m2) Rχ fraction of radiant heat loss (-) BQ heat release rate (kW) *Ω dimensionless wind velocity (-) LQ heat loss rate (kW)
R risk of fire spread (-) subscriptsr radial distance from trajectory (m) B burn, burnt outs separation from target building (m) F fuelT temperature (K) G gross∞T ambient temperature (K) O oxygen
t time (s) P pyrolysisTΔ temperature rise (K) R thermal radiation, regional
∞U wind velocity (m/s) ∞ ambient
INTRODUCTION
Historically, Japanese cities have experienced many urban conflagrations which involved thousands or more buildings at a time. A fire starting in a densely-built urban area easily spreads to adjacent buildings. Especially, in the case of large earthquakes, in which multiple fires may break out simultaneously, the spread of such fires may overwhelm the ability of firefighters and damage large areas. The fires followed Kobe Earthquake in 1995 (Fig. 1) which burnt about 66ha of city area in total are recent examples.
Densely built environments are highly vulnerable to disasters (Fig. 2). Common problems include: (a) narrow streets enabling fire to spread easily from one building to another; (b) streets cluttered with collapsed buildings in an earthquake restricting fire engine access; (c) shortage of open spaces which
267
FIRE SAFETY SCIENCE–PROCEEDINGS OF THE NINTH INTERNATIONAL SYMPOSIUM, pp. 267-278
COPYRIGHT © 2008 INTERNATIONAL ASSOCIATION FOR FIRE SAFETY SCIENCE / DOI:10.3801/IAFSS.FSS.9-267

Fig. 1. Fires followed Kobe Earthquake 1995 [11]. Fig. 2. An example of densely-built urban area.
function as fire breaks or evacuation sites; (d) older and less robust wooden houses that easily collapse and burn in an earthquake; (e) a majority of elderly residents with little motivation for rebuilding old housing; and (f) building sites not meeting requirements of the latest Japanese Building Standard Law, restricting the building of new and fire-resistant houses. Such areas are currently estimated to total 25,000ha. Densely built areas in Japan’s two major metropolitan areas, Tokyo and Osaka, involve 6,000ha of vulnerable areas each [1].
The importance of urban reconstruction of densely-built urban areas has not necessarily been underestimated, because fires and other disasters such as earthquakes are common in Japan. One of the reasons behind the lack of urban management is attributed to legislations such as the Building Standard Law and the City Planning Law. They are not authorized to forcibly implement appropriate construction without social consensus on the need for controlled urban reconstruction. Daily life in densely-built urban environments did not necessarily involve under-privileged populations requiring social intervention by the government. Residents had no imminent concerns encouraging them to reconstruct their environments, except the threat of natural disasters. However, as the occurrence of natural disasters is unpredictable, no one knows whether an earthquake will strike the city tomorrow or 100 years later.
In order to devise an effective measure against urban conflagrations, risk and behavior of fire spread in these urban areas need to be evaluated. Several approaches have been taken so far, generally by using empirical- or GIS based- fire spread models [2-10]. In these models, rates of fire spread are usually formulated as functions of macroscopic parameters of the relevant city area, such as wind speed, building scale, building-to-building separation, construction types, etc.. In the present study, a physics-based model was used for simulating fire spread. The model treats urban fires as a collection of individual building fires that evolve under the thermal influence from surrounding building fires. The principal advantage of adopting such an approach is that it enables detailed and rational analysis of fire spread in a city area. Kyoto Higashiyama area, one of the representatives of densely-built environment, was selected for the case study. The fire spread risk of the area was assessed by the Monte Carlo method evaluating expected magnitude of loss.
OUTLINE OF THE FIRE SPREAD MODEL
A schematic diagram of the fire spread model used in the present study is shown in Fig. 3. The model treats urban fire as a collection of individual building fires evolving under the thermal influence from neighboring building fires. The model consists of two major sub-models: the one describing fire behavior inside buildings; and the other describing fire spread between buildings [12].
Fire Behavior inside Building
As to the building fire model, each room of a building is considered as a control volume with uniform physical properties, and the transient development of the internal fire behavior is calculated by solving the governing equations simultaneously. This uniformity assumption is appropriate for an urban fire spread model as the vigorous phase of fire occupies a large portion of compartment fires, and building-to-building fire spread takes place mostly within this particular phase.
268

∞U
∞ΔT
BQ
BQ
BQ
∞ΔT
Rq ′′m
∑ LQ
Spotting of firebrandsTemperature rise due to wind blown fire plumes
Thermal radiation heat transfer from fire involved buildings
m
mm
m
m mm m m
m
m
Rq ′′
Rq ′′ Rq ′′
BQ
BQ
∑ LQ
∑ LQ
Fig. 3. Schematic of the urban fire spread model.
Following the definition of the one layer zone model, the conservation equations of mass, energy, and chemical species (the subscripts O and F denote oxygen and gasified fuel, respectively) for an arbitrary control volume is expressed as follows, respectively,
( ) ( )∑ −−=j
jiijiFii mmmVdtd
,ρ (1)
( ) ( ) ( )⎭⎬⎫
⎩⎨⎧∑ ∑ −+−+=
jjjiPiijPiLPiFPiBiiiP TmcTmcQTmcQVTc
dtd
,,,ρ (2)
( ) ( )∑ −−Γ= j jXjiiXijiXiXii YmYmYVdtd
,,,,ρ ( )FOX ,= (3)
The equation of state of the gas is given by,
353≅Tρ (4)
In Eqs. (1-4), Pc is the gas heat capacity, ρ is the gas density, T is the gas temperature, PT is the pyrolysis temperature of combustibles,V is the volume of the control volume, Y is the mass fraction of chemical species, Fm is the mass release rate of flammable gas due to pyrolysis of combustibles, m is the mass flow rate through an opening, BQ is the heat release rate, ∑ LQ is the sum of heat loss rate through openings and walls, and Γ is the mass production rate of chemical species. Subscripts ij and ji denote the direction of mass flow between compartments i and j . Transient change of gas temperature, density, and mass fraction of chemical species are calculated by solving these equations simultaneously.
Building-to-building Fire Spread
As to the thermal influence upon a building from the other fire-involved buildings, the following mechanisms are considered as contributing factors to fire spread: (A) thermal radiation heat transfer from fire involved buildings; (B) temperature rise due to wind-blown fire plumes; and (C) spotting of firebrands to the downwind of fire-involved buildings. Under the influence of the above phenomena, fire spread is assumed to occur when one of the following conditions are met: (α ) incident heat flux through opening exceeds a critical value; ( β ) surface temperature of exterior wooden wall exceeds a critical value; ( γ ) firebrands at high energy states fall upon combustibles.
(A) Thermal Radiation Heat Transfer from Fire Involved Buildings
In the model, we assumed hot gas inside the fire room and the window flame are the two heat sources radiating to neighboring buildings. Radiation from the window flame is represented by a point heat source X of equivalent radiant intensity. If the overall heat flux passing through a sphere of any radius is identical
269

to the radiation energy from the heat source X, the radiant heat flux transferred to the adjacent building of separation s will be given by,
⎟⎟⎠
⎞⎜⎜⎝
⎛=′′
24coss
Qq RR π
θχε (5)
where ε is the emissivity, Rχ is the fraction of radiant heat loss to the total heat release, and θ is the angle between the target wall and the line drawn from the representative point X. The virtual heat release rate Q is evaluated as sum of the rate of heat loss by convection through windows, and the heat release rate of excess gasified fuel burnt outside of the compartment. As buildings are sited in complex configuration in a densely-built urban area, the effect of radiation shielding by neighboring buildings are also considered in the heat flux computation.
(B) Temperature Rise Due to Wind-blown Fire Plumes
When a plume originating from a fire is blown by wind, an extensive area in the downwind will be enveloped in the plume. We assumed that the wind effect on the diffusion characteristic of the plume is negligible and that the temperature rise along the trajectory mTΔ for a building fire is about the same as that of a point heat source in a quiescent atmosphere (Fig. 4). Temperature distribution of fire plume perpendicular to its trajectory line )(rTΔ is assumed to take the following Gaussian profile,
⎥⎥⎦
⎤
⎢⎢⎣
⎡⎟⎟⎠
⎞⎜⎜⎝
⎛−=
ΔΔ
2
exp)(
Tm br
TrT (6)
where Tb is the half width, and r is the radial distance. For simplicity, wind is assumed to be strong, so that the wind profile is unaffected by the fire plume. As the radial distance r is the minimum distance from the trajectory to the target building, value of the inclined angle θ of the fire plume is needed in order to compute r . The inclined angle θ is given by the following formula derived by Yokoi, which is,
43*1.0tan −Ω=θ (7)
31*
⎟⎟⎠
⎞⎜⎜⎝
⎛ ′≡Ω
∞∞
∞
TcgQ
U
Pρ
(8)
where *Ω is the dimensionless wind velocity, ∞U is the wind velocity, Q′ is the heat release rate per unit length scale of the heat source, g is the acceleration due to gravity, and ∞T is the ambient temperature. As an urban fire is an ensemble of multiple building fires, a specific building in an urban area may possibly be under the overlapping effect of multiple fire plumes originating somewhere in the upwind (Fig. 5). Assuming that the thermal properties of individual fire plumes are independent of the other fire plumes, the following overlapping relation is adopted for the estimation of the overall elevation of ambient temperature around the relevant building,
32
1
23 ⎟⎠⎞⎜
⎝⎛∑Δ=Δ
=
N
iiTT (9)
(C) Spotting of Firebrands to the Downwind of Fire Involved Buildings
Enormous amount of firebrands will be released into the fire-induced flow field in the event of an urban fire. However, as the occurrence of ignition depends on the properties of the firebrand, properties of target combustible, local-scale wind conditions, atmospheric conditions, etc., only a fraction of the released firebrands actually causes ignition. So we adopted a probabilistic approach in modeling the firebrand ignition. The distribution probability of fallen firebrands in the downwind of the burning building Bp is
270

BθAQ
BQ
AmT ,Δ
BmT ,Δ
Aθ
)( BB rTΔ
)( AA rTΔAr
Br∞U
zy
x
Aξ
Bξ
XBp ,
yBp ,
yy
x
xO′
∞U
Burningbuilding
O′
O′
Fig. 4. Effect of wind-blown fire plumes. Fig. 5. Spotting distribution of firebrands.
given by the product of the distribution probability in the windward direction (i.e., x-direction) xBp , and that in the orthogonal direction (i.e., y-direction) yBp , (see Fig. 5),
yBxBB ppp ,, ⋅= (10)
( )
⎪⎪⎪
⎭
⎪⎪⎪
⎬
⎫
∞<<−∞⎟⎟⎠
⎞⎜⎜⎝
⎛−=
∞<<⎪⎭
⎪⎬⎫
⎪⎩
⎪⎨⎧ −−=
)(2
exp2
1
)0(2
lnexp
21
2
2
,
2,
2,
,
,
yyp
xx
xp
yy
yB
xL
xL
xL
xB
σσπ
σμ
σπ (11)
where μ is the mean, and σ is the standard deviation. Following the results of a previous numerical experiment using Large Eddy Simulations [13], the distribution probabilities xBp , and yBp , are approximated with a log-normal function and a normal function, respectively. We can evaluate the fallen distribution of firebrands by substituting xL ,μ , xL ,σ and yσ in Eq.(11) with the following results,
⎭⎬⎫
=
=31*
32*
88.047.0
BDBD
x
x
σμ
and ⎪⎭
⎪⎬⎫
=
=
92.00
DD
y
y
σ
μ (12)
( )
21
25
21
434
3
21
*
⎟⎟
⎠
⎞
⎜⎜
⎝
⎛⎟⎠⎞
⎜⎝⎛
⎟⎟⎠
⎞⎜⎜⎝
⎛≡
∞∞
−−
∞
∞
DgTcQ
Dd
gDUB
P
PP
ρρρ (13)
where Pd is the length scale of the firebrand, D is the length scale of the heat source. The dimensionless parameter *B , which governs the transport behavior of firebrands, is a combined function of the dimensionless wind speed gDU∞ , dimensionless density ∞ρρP , dimensionless length Dd P , and dimensionless heat release rate )( 2521 DgTcQ P ∞∞ρ . Note that xμ and xσ need to be converted into the form of a natural logarithm , that is xL ,μ and xL ,σ , before substituting into Eq.(12).
FIRE SPREAD RISK ANALYSIS OF KYOTO HIGASHIYAMA
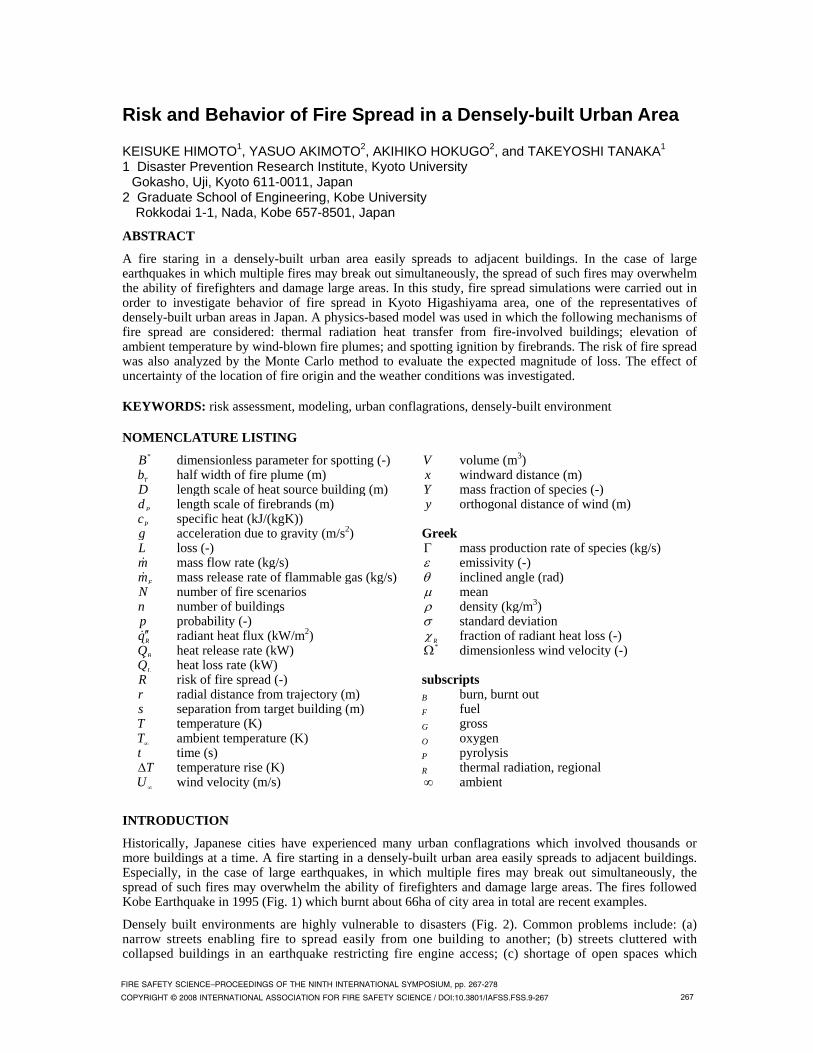
The presented model was applied to Kyoto Higashiyama district and the risk of fire spread was analyzed. The area is well known as one of the representatives of the densely-built urban areas, as well as those of Japanese traditional city areas which involve several historical monuments. The aerial view of the target city area is shown in Fig. 6. There is a low range of hills (Higashiyama Mountains) on the east side, so the majority of the city area is sited on a slight slope. While on the west side, there is a river (Kamogawa River) about 60m wide flowing from north to south. As shown in Fig. 7, traditional Japanese houses generally have exposed wooden members on their façades. Although the sequence of the wooden façades is one of the principal factors of traditional cityscape, they have a risk of igniting due to fires in adjacent
271
0 500 1000 (m)
N
S
Fig. 6. Aerial view of the target city area [14]. Fig. 7. Cityscape in the Higashiyama area.
buildings. The improvement of fire safety of densely-built areas of historical cities has particular importance in preserving the unique culture of cities. The assessment of fire spread risk in such city areas will provide guidance to the design of effective countermeasures.
The risk of fire spread R is evaluated by Monte Carlo Simulation, which estimates the expectation value of an event by iterating through a large number of numerical trials. The parameters affecting behavior of fire spread are varied in each trial probabilistically. Assuming the overall number of burnt out buildings as the magnitude of loss L , we obtain the gross fire spread risk of the concerning area GR as follows,
( )∑==
N
iiiG LpR
1 (14)
where p is the event probability of fire, i represents a fire scenario, and N is the number of expected fire scenarios. The gross fire spread risk is appropriate for estimating macroscopic damage of the entire target city area, which is generally applicable to an area consisting of over 1,000 buildings. Another index is the regional fire spread risk RR which evaluates fire spread risk of a specific area, which is defined as,
kBR
n
ikBR pnpR
R
,1
, =∑==
(15)
where Bp is the probability of a building to catch on fire out of all the expected fire scenarios, and Rn is the number of buildings in the area. The regional fire spread risk RR is congruent to the average probability of fire for a group of buildings. In contrast to the gross fire spread risk GR , the regional fire spread risk RR is generally appropriate for a city area consisting of 10-100 buildings as it evaluates the vulnerability rather from a microscopic point of view.
Numerical Conditions
The list of numerical conditions is shown in Table 1. We have carried out two sets of Monte Carlo Simulations; namely, cases (A) and (B). All the conditions except for the outbreak point and the number of numerical trials were the same between the two cases. The outbreak point was fixed throughout the iterative trials in case (A), and outbreak points were randomly varied for every trial in case (B). Case (A) was run to show the basic characteristics of the adopted fire spread model and the general behavior of fire spread in the target urban area. Case (B) provides a straightforward evaluation of the fire spread risk.
The adopted probabilistic parameters which govern the loss L were the outbreak conditions (ignition point and time) and weather conditions (ambient temperature, direction and velocity of wind). The time of fire outbreak was given randomly regardless of building construction or the use of appliances. Fire spread behavior was simulated for the subsequent 12 hours. As the weather data were consecutive data, the change in time series was also considered. The computational domain set in the present study is a rectangular area which covers 2.0km in the west-east and 1.5km in the north-south directions (Fig. 6). The area data needed
272

Table 1. Numerical conditions for the Monte Carlo Simulation.
Case (A) Case (B) Number of buildings (%, wooden buildings) 7,909 (82.2 %)
Fire origin fixed random Outbreak time random Time duration (hrs) 12 Weather data AMeDAS standard weather data Number of trials 100 500
05
10152025303540
0 6 12 18 24
Mea
n Te
mp.
(o C)
Time (h)
Dec-Feb
Jun-Aug
Mar-May
Sep-Nov
0
0.5
1
1.5
2
2.5
3
0 6 12 18 24M
ean
Win
d Ve
loci
ty (m
/s)
Time (h)
Dec-Feb
Jun-Aug
Mar-MAy
Sep-Nov
(A) Mean temperature variation in a day. (B) Mean wind velocity variation in a day.
Fig. 8. Standard weather data of Kyoto city.
0
0.2
0.4
0.6
0.8
1
0 1 2 3 4 5 6 7
Freq
uenc
y (-)
Wind Velocity (m/s)
cumulative
Spring(Mar-May)
0
0.2
0.4
0.6
0.8
1
0 1 2 3 4 5 6 7
Freq
uenc
y (-)
Wind Velocity (m/s)
cumulative
Summer(Jun-Aug)
0
0.2
0.4
0.6
0.8
1
0 1 2 3 4 5 6 7
Freq
uenc
y (-)
Wind Velocity (m/s)
cumulative
Autumn(Sep-Nov)
0
0.2
0.4
0.6
0.8
1
0 1 2 3 4 5 6 7
Freq
uenc
y (-)
Wind Velocity (m/s)
cumulative
Winter(Dec-Feb)
Fig. 9. Frequency distribution of hourly wind velocity in Kyoto city.
for the fire spread simulation, such as building configuration, building construction type, or topography were produced from the GIS data, city planning maps and aerial survey photographs. The area involves 7,909 buildings in total, and 6,505 of them (i.e., 82.2 %) were wood-frame constructions.
The standard weather data, obtained from the Automated Meteorological Data Acquisition System (AMeDAS) from 1981 to 1995, was used as the input weather data on ambient temperature and wind velocity/direction. The variation in average temperature and wind velocity in a day is shown in Fig. 8.
273
0 1 2 3 4 5 6 7
Wind velocity (m/s)
0 500
1000
1500
2000
2500
Number of buildings (-)
Time (hrs)
Windvelocity(m/s)
02
46
810
12
Burningbuildings
Burntout
buildings
N
S
EW
N
S
EW
N
S
EW
N
S
EW
N
S
EW
5 hrs af ter outbreak
10 hrs af ter outbreak
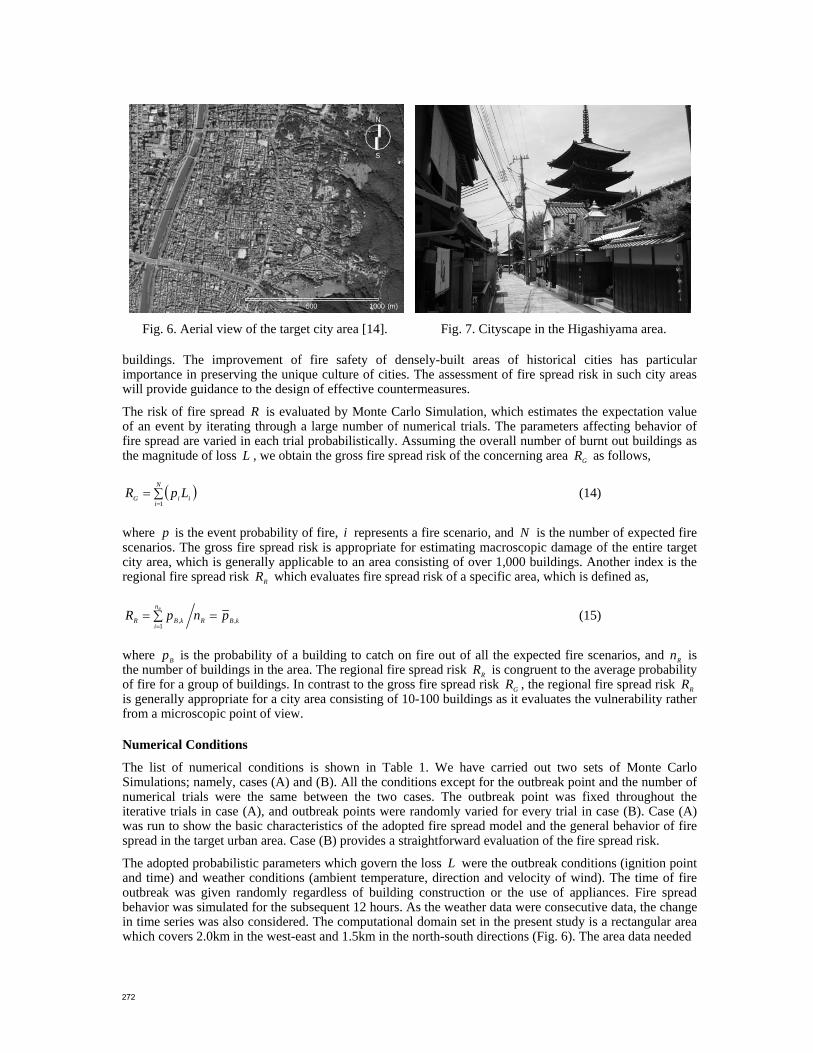
Fig. 10. An example of the fire spread simulation for the case (A).
There is a temperature difference of about 20oC between the summer season (Jun-Aug) and the winter season (Dec-Feb). However, the influence of ambient temperature on the fire spread behavior itself is often negligible, because the magnitude of the ignition temperatures of materials is much larger. An increase in the moisture content of construction materials, especially for wooden buildings, may decrease the rate of fire spread by retarding ignition. However, this is not reflected in the present study, because the relation between the hysteresis of ambient temperature and the moisture content is not incorporated in the model. On the other hand, the magnitude of wind velocity is expected to be influential on the rate of fire spread. The frequency distribution of the wind velocity in Kyoto city is shown in Fig. 9. As Kyoto is a city in an inland basin, changes in the wind conditions between seasons are rather small compared to other cities.
Case (A): Results for fixed fire origins
An example of the fire spread simulation for Case (A) is illustrated in Fig.10. The arrow in the center of the computational domain indicates the fire origin. Polygons in red and black correspond to burning buildings and burnt out buildings, respectively. The fire spread almost concentrically around the fire origin in the early stages. However, Fig. 10 shows that the fire had jumped over Higashioji Street (about 15m wide) by 5 hrs after the outbreak. The wind direction was generally from the west to the east throughout the computation. Thus, one important reason for the jump is attributed to firebrands causing distant ignitions in the leeward area. By 10 hrs after the outbreak, the fire front reached as far as the city boundary at the foot
274

0
500
1000
1500
2000
2500
0 1 2 3 4
Num
ber o
f bur
nt o
ut b
uild
ings
(-)
Average wind velocity (m/s)
0
500
1000
1500
2000
2500
0 2 4 6 8 10 12 14
Num
ber o
f bur
nt o
ut b
uild
ings
(-)
Time (hrs)
mean
maximum
minimum
s.d.
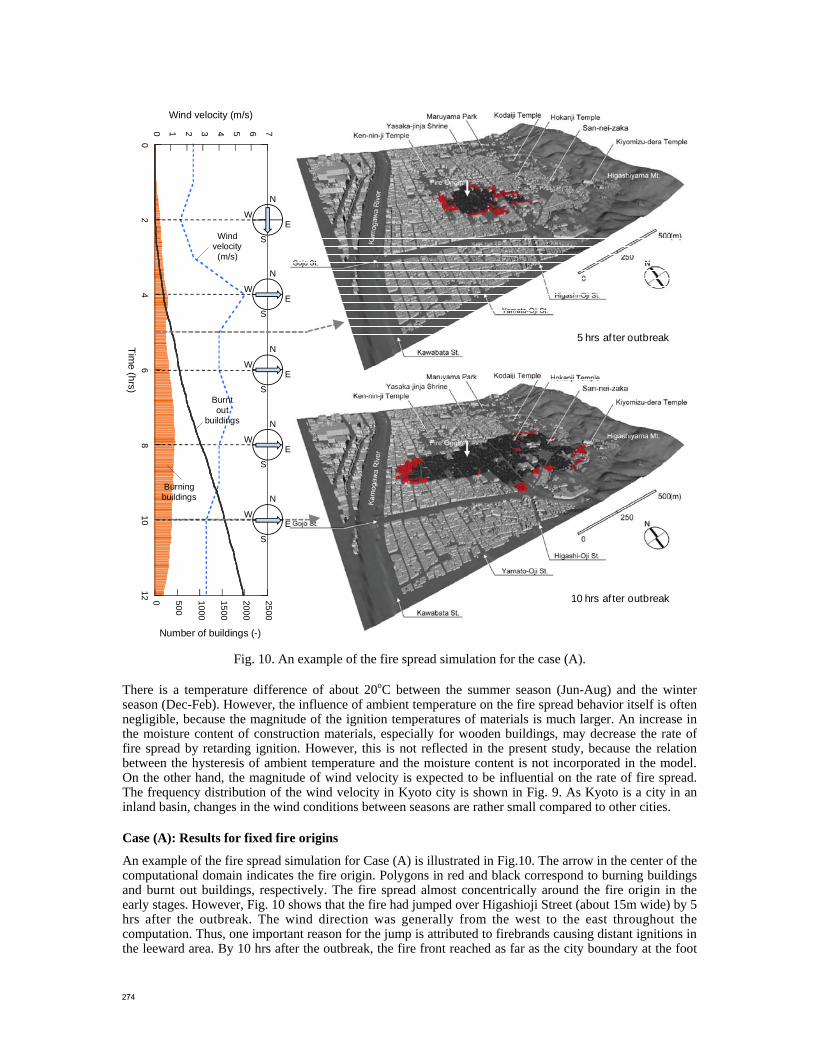
Fig. 11. The effect of wind velocity. Fig. 12. Time history of number of burnt out buildings.
of Higashiyama Mountain in the east. Whereas, the fire front in the west side almost reached Kamogawa river (about 60m wide). The rate of fire spread was faster in the east, because buildings in the leeward side of the burning area were exposed to wind-blown fire plumes. The wind velocity was higher than usual in Kyoto city, i.e., the average velocity throughout the computation was 3.5m/s. However, in the later stage of the computation, the spread of fire in the north and south directions was stopped by open spaces including wide streets. The eventual number of burnt out buildings in the Higashiyama area was around 2,000. The number of burnt out buildings in the 1976 Sakata Fire, which lasted about 11 hrs, was 1,744 [15]. Although the conditions affecting fire spread are distinct, the sizes of these fires were similar.
Wind velocity is one of the governing parameters of fire spread rate, because high wind velocity generally blows down fire plumes and extends the transport distance of firebrands. The relation between average wind velocity and eventual number of burnt out buildings is shown in Fig. 11. It shows a moderate correlation between the two parameters. The maximum number of burnt out buildings was as many as 2,200 when the average wind velocity was 3.6m/s, which is the highest among the tested fire scenarios. The minimum number of burnt out buildings was 1,050. Such a large loss was brought about, even in calm weather conditions, because no fire fighting activity was considered in the present simulation. Another reason is due to the location of the fire origin, which was within an area of high regional fire spread risk. Classification of areas based on the regional fire spread risk will be described later. However, as it is clear in Fig. 11, the minimum loss (1,050 burnt buildings) was estimated even though the average wind velocity was around 2 m/s. This result implies that wind velocity may become influential on the rate of fire spread when it is higher than 2 m/s.
The time history of the number of burnt out buildings is shown in Fig. 12, in which error bars correspond to standard deviations. In the initial 2 hours, the number of burnt out buildings gradually increased with time. The general feature of the curve within this period was similar to that of a quadratic curve. From then on, the growth rate of the fire was almost proportional to the time. Approximating the area of burning to a circle, the change of the burning area AΔ is given by,
( )( ) ( )2
22
2 rrrrrrAΔ+Δ⋅=
−Δ+=Δππππ (16)
where π is the circumference ratio, r is the radius, and rΔ is its change. In the initial period, the number of buildings was few and the second term in Eq.(16) was not negligible as rr Δ≅ . In the later period, the first term in Eq.(16) became dominant as the burning area was extended, i.e., rr Δ>> . Time histories are also shown for both the minimum and maximum loss fires. In the latter case, the number of burnt out buildings slightly decreased in the later period of computation. This is around the time at which the fire fronts started reaching large open spaces or wide streets preventing further fire spread. The maximum discrepancy in the eventual number of burnt out buildings was as large as 1,100 within the tested fire scenarios. However, the averaged fire loss curve was rather close to that of the minimum fire loss.
Case (B): Results for random fire origins
Probability distribution on the number of burnt out buildings for the whole city area is shown in Fig.13, in
275

0 500 1000 1500 20000
0.01
0.02
0.03
0.04
0.05
Prp
babi
lity
(-)
Number of burnt out buildings (-)
Cum
ulat
ive
Pro
babi
lity
(-)
RG=5
03.0
0
0.2
0.4
0.6
0.8
10.215
Fig. 13. The probability distribution and the gross fire spread risk of Higashiyama.
Fig. 14. The regional fire spread risk of Higashiyama.
which data intervals of the histogram is 20. Although there were a number of local extremes, the number of burnt out buildings was moderately distributed and no apparent bias was observed. As an extensive city area was involved in the present simulation, the area could be divided into several blocks compartmented by large open spaces or wide streets. As a result, the loss caused by fire was more or less dependent on the location of fire origin, except for strong wind conditions at which fires jump over the boundary of the compartmented blocks. Thus, the column for the number of burnt out buildings less than 20 correspond to
276

the fires started either at isolated positions or near the computational boundary. Employing the definition in Eq.(14), the gross fire spread risk GR of Higashiyama area was found to be 503 buildings.
The target city area consists of multiple administrative units. The regional risks of fire spread RR for the individual administrative unit is color-coded in Fig. 14. The results for the units near the computational boundary are omitted, because the effect of fire spread from the neighboring units is not adequately evaluated in such areas. Regional risk is the highest in the south-western part of the area, and it is comparatively low in the eastern part. In general, regional risk is high in areas at high building coverage and high wooden building ratios. Similarly, regional risk of areas along broad streets (>15m) is rated relatively low, as fire spread from the other side of the street seldom takes place. However, as the eastern area has Higashiyama Mountains on one side, evacuation routes for residents will be restricted in case of urban conflagration starting in the western area. In other words, the regional fire spread risk in Fig.14 is not congruent with the risk of evacuation.
The risk of fire spread analyzed in Kyoto Higashiyama area is controlled by the structure of the city. However, in order to maintain the safety of residents in case of urban conflagration, issues of evacuation need to be considered in parallel. It is reported that the proportion of elderly person (over 65 years old) in this area is 28.7%, which is considerably higher than other areas. Also, a large number of tourists, who are unfamiliar with the area, visit Higashiyama. Thus the area involves serious evacuation problems which need to be solved. By contrast, the magnitude of loss, in such a situation, could be reduced substantially by implementing effective countermeasures.
CONCLUSIONS
Risk and behavior of fire spread in the Kyoto Higashiyama area was analyzed by using a physics-based urban fire spread model. In the simulation at which the fire origin was fixed (i.e., Case (A)), the effect of weather conditions on fire spread was investigated. The obtained result showed that wind velocity was not always influential on the behavior of fire spread when it is below 2m/s. In the simulation in which the location of fire origin was randomly given (i.e., Case (B)), the gross and regional fire spread risk of the Higashiyama area was assessed by Monte Carlo method. It is suggested that the loss caused by fire was more or less dependent on the location of fire origin, except for strong wind conditions when fires jump over large open spaces or wide streets.
Future work is listed below:
1) Probabilistic parameters such as locations of fire origin or weather conditions were adopted as factors contributing to the magnitude of loss. However, several uncertain factors were involved in the present risk analysis which may need further consideration. These are, for example, the representativeness of the model, accuracy of the input GIS data, amount and types of combustibles. Sensitivity analysis will be one of the approaches that evaluate quantitative effect of these uncertainties on estimated fire spread risk.
2) The present model is specialized in simulating the behavior of fire spread in urban area However, important mechanisms of fire spread in urban area have similar feature with those of wildland fire. Recent wildland fires often involved numbers of housings in areas along mountains, and have brought about devastating damage to the communities. A model for wildland fire can be developed by incorporating new sub-models to the present model.
3) Development of a convenient user interface enables involvement of city planners, consultants, or fire fighters in countermeasure design. In addition, by integrating the model with GIS data, results of simulated fire spread risk can be analyzed in relation to some important indices of urban management. This helps to detect principal factors of vulnerability and find effective approaches to reduce fire spread risk in urban area.
REFERENCES
[1] Ministry of Land, Infrastructure and Transport, Disaster Resilient City Planning for Urban Regeneration, 2003 (in Japanese).
[2] Hamada, M., 1951. On The Rate of Fire Spread, Disaster Research, Non-life Insurance Rating Organization of Japan, 1: 35-44 (in Japanese).
277

[3] Horiuchi, S., Fire Protection of Buildings, Asakura Publishing, 1972 (in Japanese).
[4] Fujita, T., 1975. Fire Spread Model and Numerical Simulation, Disaster Research, Non-life Insurance Rating Organization of Japan, 8: 380-393 (in Japanese).
[5] Yasuno, K., Takai, H., Namba Y., 1982. A Basic Study on Fire Spread Formula of Houses used by Logistic Curve, Transaction of Architectural Institute of Japan, 311: 137-144 (in Japanese).
[6] Ministry of Construction, “Development of Countermeasures against Urban Fire”, Project Report of The Integrated Technology Development, 1982 (in Japanese).
[7] Itoigawa, E., Iwami, T., Kaji, H., Kawanaka, T., Kumagai, Y., Tsukagoshi, and Y., Masuyama, T., “Study on Real Time System for Information Processing for Post-earthquake Fire”, Report of The Building Research Institute, No.120, 1989 (in Japanese).
[8] Tokyo Fire Department, Investigation on The Spread Behaviors of Post-Earthquake Fire and Its Countermeasures, Report of Tokyo Fire Department, 1997 (in Japanese).
[9] Thomas, G.C., Cousins, W.J., Lloydd, D.A., Heron, D.W. and Mazzoni, S., 2003. Post-earthquake Fire Spread Between Buildings Estimating And Costing Extent In Wellington. Fire Safety Science 7: 691-702. doi:10.3801/IAFSS.FSS.7-691
[10] Kato, T., Hong, C., Yusfu, Y., Yamaguchi, M., and Natori, A., 2006. A Method for The Integrated Earthquake Fire Risk Evaluation Based on The Single Building Fire Probability Applying to Any Different Map-scale, Journal of Social Safety Science, 8: 279-288 (in Japanese).
[11] Japan Association for Fire Science and Technology, Report of The Fire Damage caused by The 1995 Kobe Earthquake, 1996 (in Japanese).
[12] Himoto, K., and Tanaka T., 2008. Development and Validation of A Physics-based Urban Fire Spread Model, Fire Safety Journal. doi:10.1016/j.firesaf.2007.12.008.
[13] Himoto, K. and Tanaka, T., 2005. Transport Of Disk-shaped Firebrands In A Turbulent Boundary Layer. Fire Safety Science 8: 433-444. doi:10.3801/IAFSS.FSS.8-433
[14] Live search maps (http://maps.live.com/)
[15] National Research Institute of Fire and Disaster, “Fire Spread Behaviors of The Sakata Fire”, Technical Report of National Research Institute of Fire and Disaster, No.11, 1977 (in Japanese).
278