Embed Size (px)
Citation preview
Fina
ncia
l Sta
tem
ent
s
Risk and Capital Management Disclosure
CONTENTS
1. Background 912. Statement of Financial Position Under The Regulatory scope of Consolidation 913. Capital Adequacy 924. Risk Management 94
90 BAHRAIN ISLAMIC BANKANNUAL REPORT 2016
www.bisb.com
BAHRAIN ISLAMIC BANKANNUAL REPORT 2016
91www.bisb.com
Risk and Capital Management Disclosure31 December 2016
1. Background
The Public Disclosures under this section have been prepared in accordance with the Central Bank of Bahrain (“CBB”) requirements outlined in its Public Disclosure Module (“PD”), Section PD-1: Annual Disclosure requirements, CBB Rule Book, Volume II for Islamic Banks. Rules concerning the disclosures under this section are applicable to Bahrain Islamic Bank B.S.C. (the “Bank”) being a locally incorporated Bank with a retail banking license, and its subsidiaries together known as (the “Group”).
The Board of Directors seeks to optimise the Group’s performance by enabling the various Group business units to realise the Group’s business strategy and meet agreed business performance targets by operating within the agreed capital and risk parameters and the Group risk policy framework.
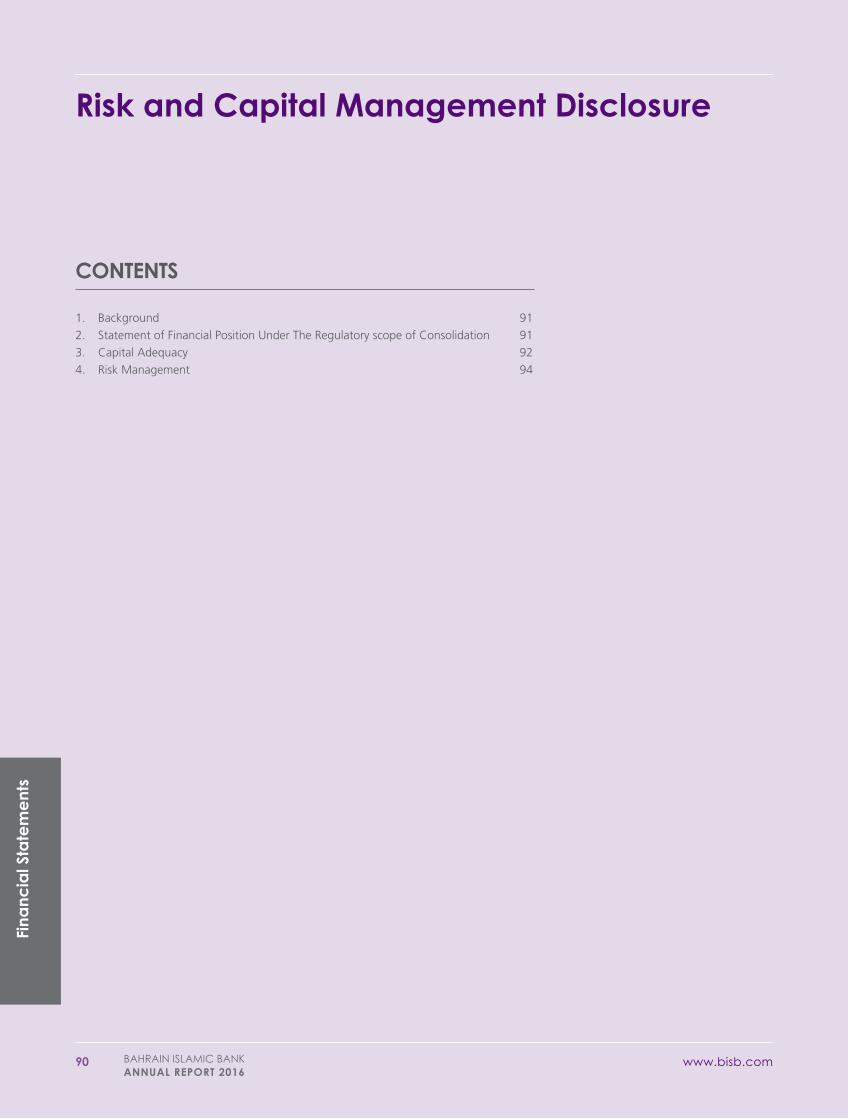
2. Statement of Financial Position Under The Regulatory scope of Consolidation
The table below shows the link between the statement of financial position in the published financial statements (accounting statement of financial position) and the regulatory statement of financial position.
Table – 1. Statement of Financial Position (PD- 1.3.14)
Statement of Financial
position as per in published
financialstatements
2016BD'000
Statement of Financial position as per Regulatory
Reporting2016
BD'000 ReferenceAssetsCash and balances with banks and Central Bank 63,208 63,208Placements with financial institutions 63,805 63,805Gross financing assets 553,338 553,338Less: sepcific impairment provisions (16,560) (16,560) aLess: collective impairment provisions (10,141) (10,141) aNet financing assets 526,637 526,637Investment securities 145,731 145,731Ijarah Muntahia Bittamleek 151,752 151,752Gross ijarah rental receivables 21,888 21,888Less: sepcific impairment provisions (10,977) (10,977) bLess: collective impairment provisions (2,293) (2,293) bNet ijarah rental receivables 8,618 8,618Investment in associates 26,487 26,487Investment in real estate 28,066 28,066Property and equipment 15,881 15,881Other assets 12,003 12,003TOTAL ASSETS 1,042,188 1,042,188Liabilities, Equity Of Investment Accountholders and Owners' EquityPlacements from financial institutions 103,874 103,874Customers’ current accounts 152,647 152,647Other liabilities 14,879 14,879Total Liabilities 271,400 271,400Equity of Investment Accountholders 654,316 654,316Owners' EquityShare capital 101,339 101,339 cTreasury shares (563) (563) dShares under employee share incentive scheme (604) (604) eShare premium 56 56 fStatutory reserve 1,963 1,963 gReal estate fair value reserve 5,361 5,361 hInvestment fair value reserve 531 531 iProfit for the year 7,578 7,578 jRetained earnigs brought forward 811 811 kTotal Owners' Equity 116,472 116,472TOTAL LIABILITIES, EQUITY OF INVESTMENT ACCOUNTHOLDERS AND OWNERS' EQUITY 1,042,188 1,042,188
Risk and Capital Management Disclosure31 December 2016
92 BAHRAIN ISLAMIC BANKANNUAL REPORT 2016
www.bisb.com
3. Capital Adequacy
The primary objectives of the Group’s capital management are to ensure that the Group complies with externally imposed capital requirements and the Group maintains strong credit ratings and healthy capital ratios in order to support its business and to maximise shareholders’ value.
The Group manages its capital structure and makes adjustments to it in the light of changes in economic conditions and the risk characteristics of its activities. In order to maintain or adjust the capital structure, the Group may adjust the amount of dividend payment to shareholders, return capital to shareholders, issue sukuk etc. No changes were made in the objectives, policies, and processes from the previous years.
The Group’s capital structure is primarily made up of its paid-up capital, and including reserves. From a regulatory perspective, the significant amount of the Group’s capital is in Tier 1 form as defined by the CBB, i.e., most of the capital is of a permanent nature.
The Group’s capital adequacy policy is to maintain a strong capital base to support the development and growth of the business. Current and future capital requirements are determined on the basis of financing facilities growth expectations for each business group, expected growth in off-balance sheet facilities, and future sources and uses of funds. To assess its capital adequacy requirements in accordance with CBB requirements, the Group adopts the Standardised Approach for its Credit Risk, Basic Indicator Approach for its Operational Risk, and Standardised Approach for its Market Risk. All assets funded by profit sharing investment accounts are subject to Board approval.
All transfer of funds or regulatory capital within the Group is carried out after proper approval process.
For the purposes of guidance every table was cross referenced with the relevant paragraph number of the Central Bank of Bahrain’s Public Disclosures Module.
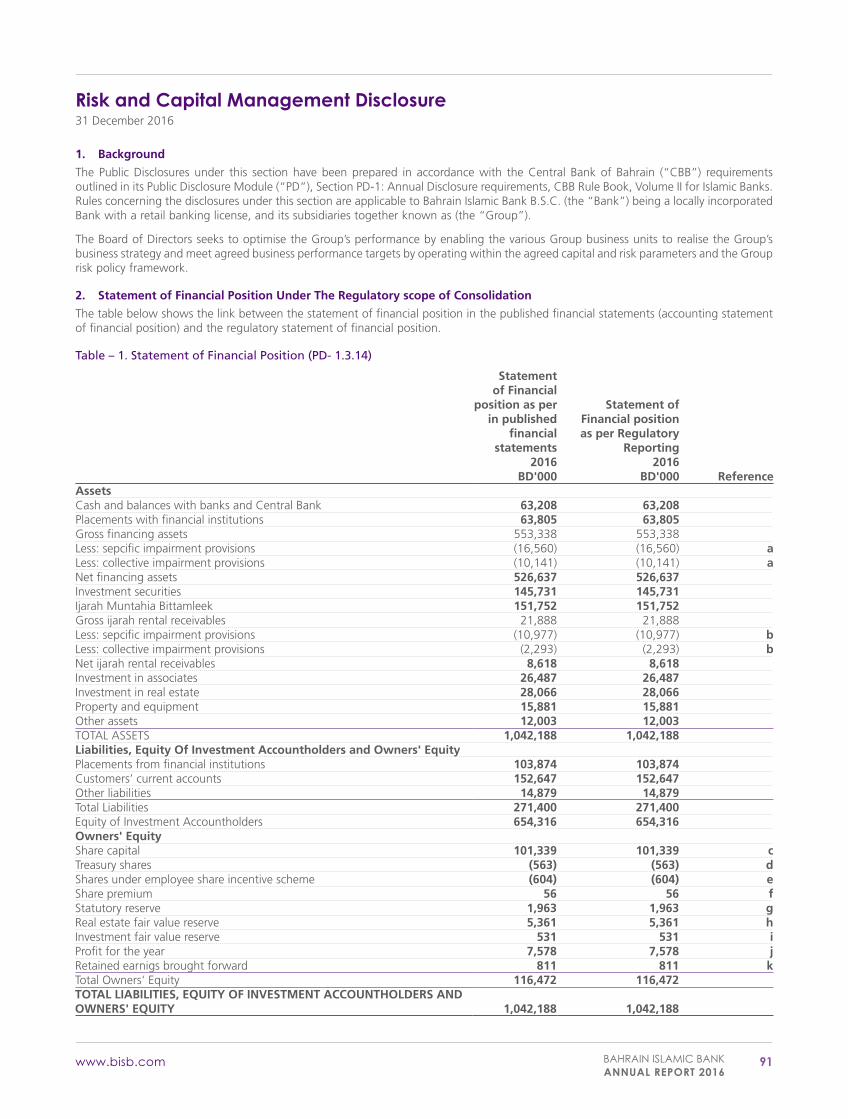
Table – 2. Capital Structure (PD-1.3.12, 1.3.13, and1.3.14)
The following table summarises the eligible capital as of 31 December 2016 after deductions for Capital Adequacy Ratio (CAR) calculation:
Components of capitalCET 1
BD’000T2
BD’000
Source based on reference letters of
the statement of financial position
under the regulatory
scope of consolidation
Issued and fully paid ordinary shares 101,339 - cGeneral reserves - -Legal / statutory reserves 1,963 - gShare premium 56 - fRetained earnings brought forward 811 - kCurrent year profits 7,578 jUnrealized gains and losses on available for sale financial instruments 531 - iLess:Employee stock incentive program funded by the bank (outstanding) 604 - eTreasury Shares 563 - dTotal Common Equity Tier 1 capital after the regulatory adjustments above (CET1 d) 111,111 -Assets revaluation reserve - property, plant, and equipment 5,363 hGeneral financing loss provisions 6,598 53% (a+b)Total Available AT1 & T2 Capital 11,961Total Capital 123,072
Risk and Capital Management Disclosure31 December 2016
BAHRAIN ISLAMIC BANKANNUAL REPORT 2016
93www.bisb.com
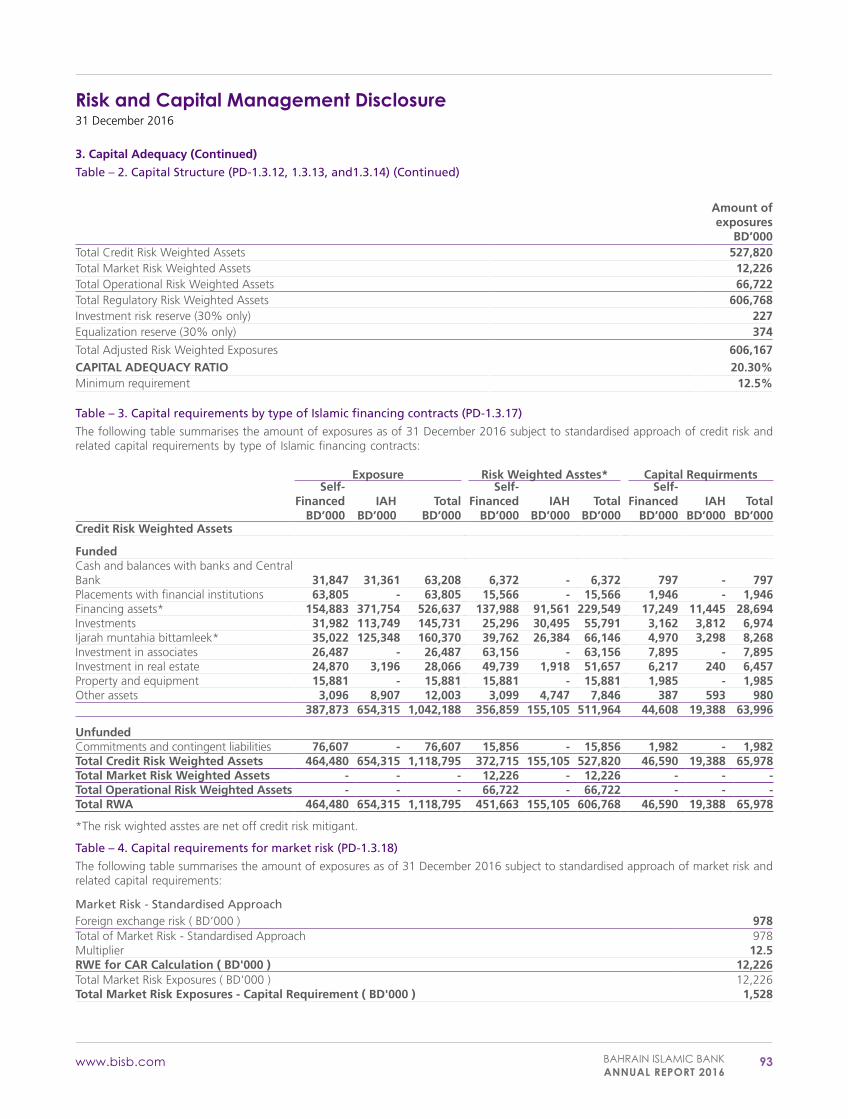
3. Capital Adequacy (Continued)
Table – 2. Capital Structure (PD-1.3.12, 1.3.13, and1.3.14) (Continued)
Amount ofexposures
BD’000Total Credit Risk Weighted Assets 527,820Total Market Risk Weighted Assets 12,226Total Operational Risk Weighted Assets 66,722Total Regulatory Risk Weighted Assets 606,768Investment risk reserve (30% only) 227Equalization reserve (30% only) 374
Total Adjusted Risk Weighted Exposures 606,167CAPITAL ADEQUACY RATIO 20.30%Minimum requirement 12.5%
Table – 3. Capital requirements by type of Islamic financing contracts (PD-1.3.17)
The following table summarises the amount of exposures as of 31 December 2016 subject to standardised approach of credit risk and related capital requirements by type of Islamic financing contracts:
Exposure Risk Weighted Asstes* Capital RequirmentsSelf-
FinancedBD’000
IAHBD’000
TotalBD’000
Self-Financed
BD’000IAH
BD’000Total
BD’000
Self-Financed
BD’000IAH
BD’000Total
BD’000Credit Risk Weighted Assets
FundedCash and balances with banks and Central Bank 31,847 31,361 63,208 6,372 - 6,372 797 - 797Placements with financial institutions 63,805 - 63,805 15,566 - 15,566 1,946 - 1,946Financing assets* 154,883 371,754 526,637 137,988 91,561 229,549 17,249 11,445 28,694Investments 31,982 113,749 145,731 25,296 30,495 55,791 3,162 3,812 6,974Ijarah muntahia bittamleek* 35,022 125,348 160,370 39,762 26,384 66,146 4,970 3,298 8,268Investment in associates 26,487 - 26,487 63,156 - 63,156 7,895 - 7,895Investment in real estate 24,870 3,196 28,066 49,739 1,918 51,657 6,217 240 6,457Property and equipment 15,881 - 15,881 15,881 - 15,881 1,985 - 1,985Other assets 3,096 8,907 12,003 3,099 4,747 7,846 387 593 980
387,873 654,315 1,042,188 356,859 155,105 511,964 44,608 19,388 63,996
UnfundedCommitments and contingent liabilities 76,607 - 76,607 15,856 - 15,856 1,982 - 1,982Total Credit Risk Weighted Assets 464,480 654,315 1,118,795 372,715 155,105 527,820 46,590 19,388 65,978Total Market Risk Weighted Assets - - - 12,226 - 12,226 - - -Total Operational Risk Weighted Assets - - - 66,722 - 66,722 - - -Total RWA 464,480 654,315 1,118,795 451,663 155,105 606,768 46,590 19,388 65,978
*The risk wighted asstes are net off credit risk mitigant.
Table – 4. Capital requirements for market risk (PD-1.3.18)
The following table summarises the amount of exposures as of 31 December 2016 subject to standardised approach of market risk and related capital requirements:
Market Risk - Standardised ApproachForeign exchange risk ( BD’000 ) 978Total of Market Risk - Standardised Approach 978Multiplier 12.5RWE for CAR Calculation ( BD'000 ) 12,226Total Market Risk Exposures ( BD'000 ) 12,226Total Market Risk Exposures - Capital Requirement ( BD'000 ) 1,528
Risk and Capital Management Disclosure31 December 2016
94 BAHRAIN ISLAMIC BANKANNUAL REPORT 2016
www.bisb.com
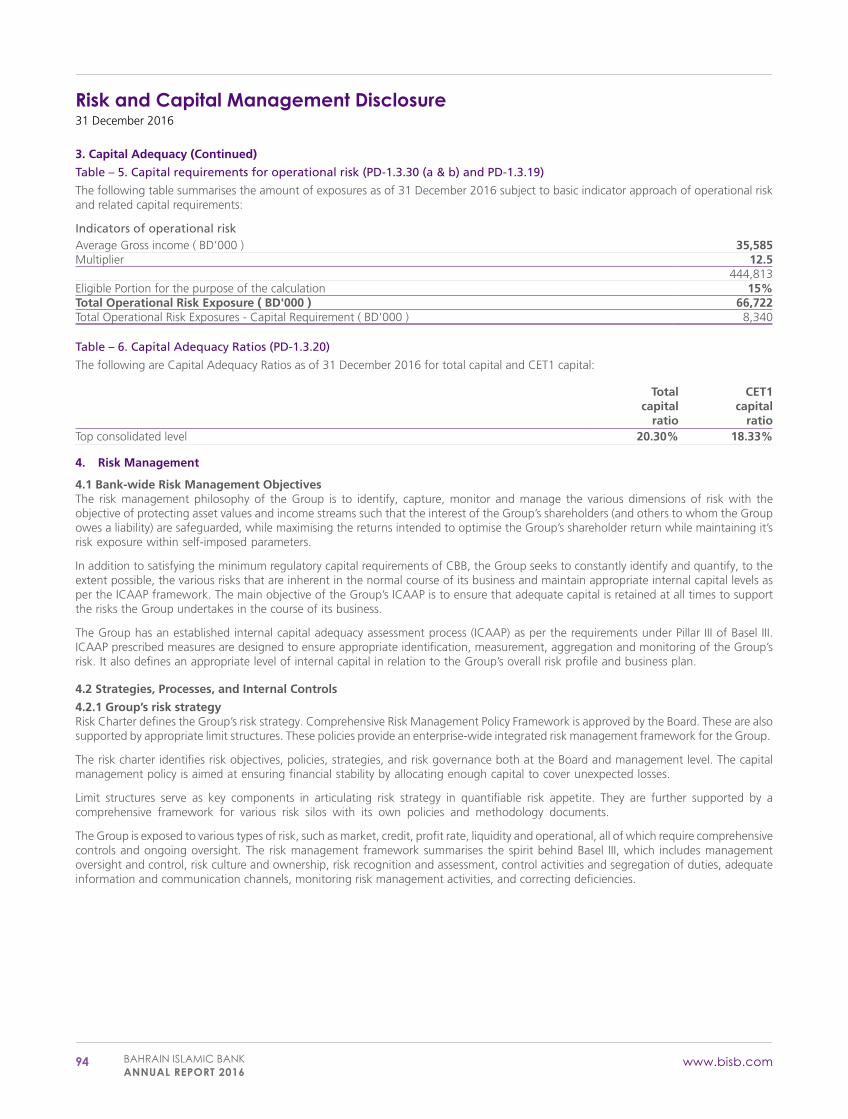
3. Capital Adequacy (Continued)
Table – 5. Capital requirements for operational risk (PD-1.3.30 (a & b) and PD-1.3.19)
The following table summarises the amount of exposures as of 31 December 2016 subject to basic indicator approach of operational risk and related capital requirements:
Indicators of operational riskAverage Gross income ( BD’000 ) 35,585Multiplier 12.5
444,813Eligible Portion for the purpose of the calculation 15%Total Operational Risk Exposure ( BD'000 ) 66,722Total Operational Risk Exposures - Capital Requirement ( BD'000 ) 8,340
Table – 6. Capital Adequacy Ratios (PD-1.3.20)
The following are Capital Adequacy Ratios as of 31 December 2016 for total capital and CET1 capital:
Total capital
ratio
CET1 capital
ratioTop consolidated level 20.30% 18.33%
4. Risk Management
4.1 Bank-wide Risk Management ObjectivesThe risk management philosophy of the Group is to identify, capture, monitor and manage the various dimensions of risk with the objective of protecting asset values and income streams such that the interest of the Group’s shareholders (and others to whom the Group owes a liability) are safeguarded, while maximising the returns intended to optimise the Group’s shareholder return while maintaining it’s risk exposure within self-imposed parameters.
In addition to satisfying the minimum regulatory capital requirements of CBB, the Group seeks to constantly identify and quantify, to the extent possible, the various risks that are inherent in the normal course of its business and maintain appropriate internal capital levels as per the ICAAP framework. The main objective of the Group’s ICAAP is to ensure that adequate capital is retained at all times to support the risks the Group undertakes in the course of its business.
The Group has an established internal capital adequacy assessment process (ICAAP) as per the requirements under Pillar III of Basel III. ICAAP prescribed measures are designed to ensure appropriate identification, measurement, aggregation and monitoring of the Group’s risk. It also defines an appropriate level of internal capital in relation to the Group’s overall risk profile and business plan.
4.2 Strategies, Processes, and Internal Controls
4.2.1 Group’s risk strategyRisk Charter defines the Group’s risk strategy. Comprehensive Risk Management Policy Framework is approved by the Board. These are also supported by appropriate limit structures. These policies provide an enterprise-wide integrated risk management framework for the Group.
The risk charter identifies risk objectives, policies, strategies, and risk governance both at the Board and management level. The capital management policy is aimed at ensuring financial stability by allocating enough capital to cover unexpected losses.
Limit structures serve as key components in articulating risk strategy in quantifiable risk appetite. They are further supported by a comprehensive framework for various risk silos with its own policies and methodology documents.
The Group is exposed to various types of risk, such as market, credit, profit rate, liquidity and operational, all of which require comprehensive controls and ongoing oversight. The risk management framework summarises the spirit behind Basel III, which includes management oversight and control, risk culture and ownership, risk recognition and assessment, control activities and segregation of duties, adequate information and communication channels, monitoring risk management activities, and correcting deficiencies.
Risk and Capital Management Disclosure31 December 2016
BAHRAIN ISLAMIC BANKANNUAL REPORT 2016
95www.bisb.com
4. Risk Management (Continued)
4.2 Strategies, Processes, and Internal Controls (Continued)
4.2.2 Credit riskThe Group manages its credit risk exposure by evaluating each new product/activity with respect to the credit risk introduced by it. The Group has established a limit structure to avoid concentration of risks for counterparty, sector, and geography.
4.2.3 Market riskThe Group proactively measures and monitors the market risk in its portfolio using appropriate measurement techniques such as limits on its foreign exchange open positions although they are insignificant. The Group regularly carries out stress testing to assess the impact of adverse market conditions on its market risk sensitive portfolio.
The Group has established a limit structure to monitor and control the market risk in its equity type instruments portfolio. These limits include maximum Stop-loss limits, position limits, VaR limits, and maturity limits. As at 31 December 2016, the group did not have any trading portfolio.
4.2.4 Operational riskThe Group has carried out Risk Control Self-Assessment (“RCSA”) exercises on a regular basis to record potential risks, controls and events on a continuous basis across different business and support functions.
The Group has established a clear segregation of duties, through documentation and implementation of policies and procedures. This ensures objectivity, security, and avoids conflicts of interest. Maker checker concept and dual eye principles are applied across the Group, where possible.
4.2.5 Equity price riskEquity price risk is the risk that the fair values of equities decrease as a result of changes in the levels of equity indices and the value of individual stocks. The equity price risk exposure arises from the investment portfolio. The Group manages this risk through diversification of investments in terms of geographical distribution and industry concentration.
4.2.6 Profit rate riskProfit rate risk arises from the possibility that changes in profit rates will affect future profitability or the fair values of financial instruments. The Group’s management believes that the Group is not exposed to material profit rate risk as a result of mismatches of profit rate repricing of assets, liabilities, and equity of investment account holders. The profit distribution to investment accountholders is based on profit sharing agreements. Therefore, the Group is not subject to any significant profit rate risk.
However, the profit sharing agreements will result in displaced commercial risk when the Group’s results do not allow the Group to distribute profits inline with market rates.
4.2.7 Displaced Commercial RiskDisplaced commercial risk (“DCR”) refers to the market pressure to pay returns that exceed the rate that has been earned on the assets financed by the liabilities, when the return on assets is underperforming as compared with competitors rates.
The Group manages its Displaced Commercial Risk by placing gap limits between the returns paid to investors and market returns.
The Group manages its Displaced Commercial Risk as outlined in the Risk Charter of the Group. The Group may forego its fee in case displaced commercial risk arises. The Group benchmarks its rates with other leading banks in the market.
All the above strategies used have been effective throughout the reporting year.
Risk and Capital Management Disclosure31 December 2016
96 BAHRAIN ISLAMIC BANKANNUAL REPORT 2016
www.bisb.com
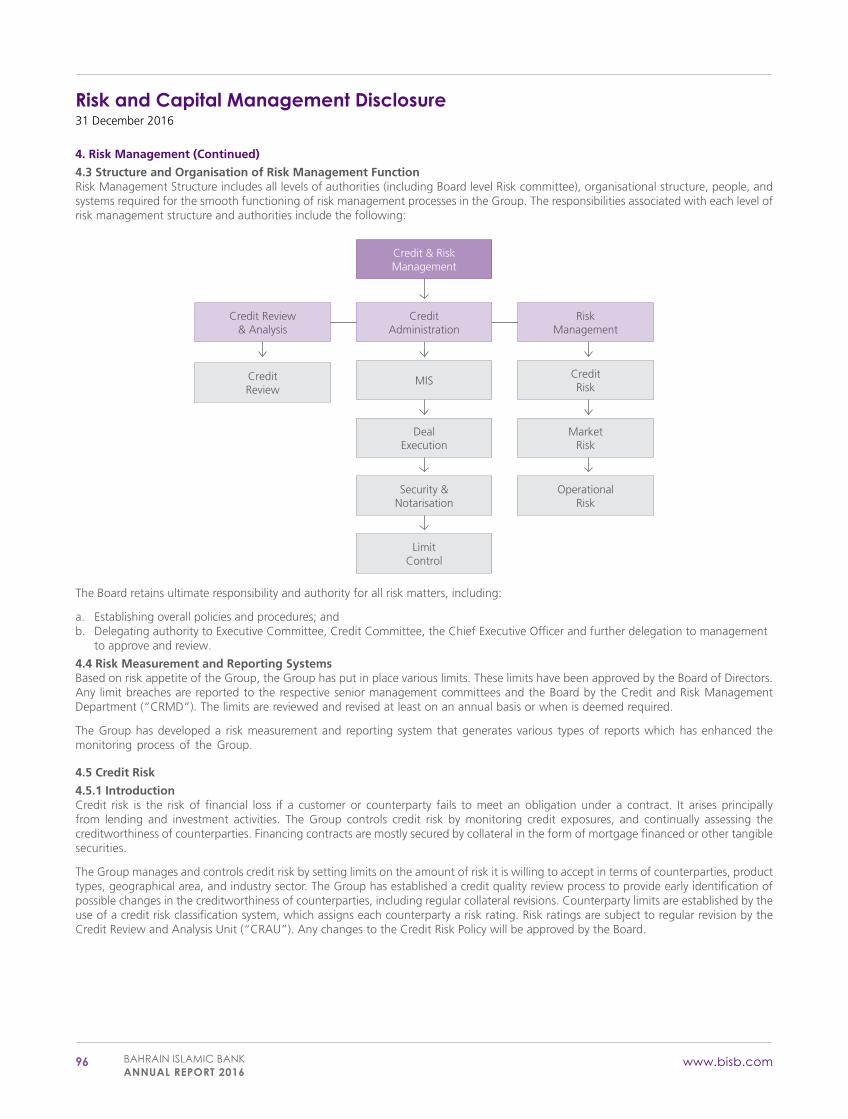
4. Risk Management (Continued)
4.3 Structure and Organisation of Risk Management FunctionRisk Management Structure includes all levels of authorities (including Board level Risk committee), organisational structure, people, and systems required for the smooth functioning of risk management processes in the Group. The responsibilities associated with each level of risk management structure and authorities include the following:
CreditRisk
MISCreditReview
Deal Execution
Security & Notarisation
Limit Control
MarketRisk
OperationalRisk
Credit Administration
Risk Management
Credit Review & Analysis
Credit & Risk Management
The Board retains ultimate responsibility and authority for all risk matters, including:
a. Establishing overall policies and procedures; andb. Delegating authority to Executive Committee, Credit Committee, the Chief Executive Officer and further delegation to management
to approve and review.
4.4 Risk Measurement and Reporting SystemsBased on risk appetite of the Group, the Group has put in place various limits. These limits have been approved by the Board of Directors. Any limit breaches are reported to the respective senior management committees and the Board by the Credit and Risk Management Department (“CRMD”). The limits are reviewed and revised at least on an annual basis or when is deemed required.
The Group has developed a risk measurement and reporting system that generates various types of reports which has enhanced the monitoring process of the Group.
4.5 Credit Risk
4.5.1 IntroductionCredit risk is the risk of financial loss if a customer or counterparty fails to meet an obligation under a contract. It arises principally from lending and investment activities. The Group controls credit risk by monitoring credit exposures, and continually assessing the creditworthiness of counterparties. Financing contracts are mostly secured by collateral in the form of mortgage financed or other tangible securities.
The Group manages and controls credit risk by setting limits on the amount of risk it is willing to accept in terms of counterparties, product types, geographical area, and industry sector. The Group has established a credit quality review process to provide early identification of possible changes in the creditworthiness of counterparties, including regular collateral revisions. Counterparty limits are established by the use of a credit risk classification system, which assigns each counterparty a risk rating. Risk ratings are subject to regular revision by the Credit Review and Analysis Unit (“CRAU”). Any changes to the Credit Risk Policy will be approved by the Board.
Risk and Capital Management Disclosure31 December 2016
BAHRAIN ISLAMIC BANKANNUAL REPORT 2016
97www.bisb.com
4. Risk Management (Continued)
4.5 Credit Risk (Continued)
4.5.1 Introduction (Continued)All credit proposals undergo a comprehensive risk assessment examining the customer’s financial condition, trading performance, nature of the business, quality of management, and market position, etc. In addition, the Group has implemented Moody’s Risk Analyst system in 2016 which has different rating models and generates ratings after taking into consideration quantitative and qualitative factors. This has further strengthened the approval process. The credit approval decision is then made and terms and conditions are set.
Exposure limits are based on the aggregate exposure to counterparty and any connected entities across the Group. Corporate contracts/facilities are reviewed on an annual basis by CRAU.
4.5.2 Types of credit riskFinancing contracts mainly comprise of due from banks and financial institutions, Murabaha receivables, Musharaka investments, and Ijarah muntahia bittamleek.
Due from banks and financial institutionsDue from banks and financial institutions comprise commodity murabaha receivables and wakala receivables.
Murabaha receivablesThe Group finances these transactions through buying the commodity which represents the object of the Murabaha contract and then reselling this commodity to the Murabeh (beneficiary) at a profit. The sale price (cost plus profit margin) is repaid in installments by the Murabeh over the agreed period. The transactions are secured at times by the object of the Murabaha contract (in case of real estate finance) and other times by a total collateral package securing the facilities given to the Murabeh.
Musharaka investmentsMusharaka is a form of partnership between the Group and its clients whereby each party contributes to the capital of partnership in equal or varying degrees to establish a new project or share in an existing one, whereby each of the parties becomes an owner of the capital on a permanent or declining basis. Profits are shared in an agreed ratio, but losses are shared in proportion to the amount of capital contributed.
Ijarah Muntahia BittamleekThe legal title of the assets under Ijarah muntahia bittamleek only passes to the lessee at the end of the Ijarah term, through gift, consideration, or gradual sale, provided that all Ijarah instalments are settled.
4.5.3 Past Due and impaired Islamic financingThe Group defines non-performing facilities as the facilities that are overdue for a period of 90 days or more. These exposures are placed on a non-accrual status with income being recognised to the extent that it is actually received. It is the Group’s policy that when an exposure is overdue for a period of 90 days or more, the whole financing facility extended is considered as non performing, not only the overdue instalments/payments.
As a policy, the Group places on a non-accrual basis any facility where there is reasonable doubt about the collectability of the receivable, irrespective of whether the customer concerned is currently in arrears or not.
4.5.4 External credit assessment institutionsThe Group relies on external ratings for rated corporate customers and counterparties. The Group uses Standard & Poor’s, Fitch, Moody’s and Capital Intelligence to provide ratings for such counterparties. In case of unrated counterparties, the Group will assess the credit risk on the basis of defined parameters. These ratings are used for risk assessment and calculation of risk weighted equivalents. The Group’s policy has the mapping of the external ratings with the ratings used by the Group and the corresponding rating is allocated to the exposure accordingly to transfer it in the Group’s banking book.
4.5.5 Definition of Geographical distributionThe geographic distribution of the credit exposures is monitored on an ongoing basis by Group’s Risk Management Department and reported to the Board on a quarterly basis. The Group’s classification of geographical area is according to its business needs and the distribution of its portfolios.
4.5.6 Concentration riskConcentration risk is the credit risk stemming from not having a well diversified credit portfolio, i.e. being overexposed to a single customer, industry sector, or geographic region. As per CBB’s single obligor regulations, banks incorporated in Bahrain are required to obtain the CBB’s prior approval for any planned exposure to a single counterparty, or group of connected counterparties, exceeding 15% of the regulatory capital base.
In order to avoid excessive concentrations of risk, the Group’s policies and procedures include specific guidelines to focus on maintaining a diversified portfolio. Identified concentrations of credit risks are controlled and managed accordingly.
Risk and Capital Management Disclosure31 December 2016
98 BAHRAIN ISLAMIC BANKANNUAL REPORT 2016
www.bisb.com
4. Risk Management (Continued)
4.5 Credit Risk (Continued)
4.5.7 Credit risk mitigationCredit risk mitigation refers to the use of a number of techniques, like collaterals and guarantees to mitigate the credit risks that the Group is exposed to. Credit risk mitigants reduce the credit risk by allowing the Group to protect against counterparty non-performance of credit contracts through collaterals, netting agreements, and guarantees.
Generally, the Group extends credit facilities only where supported by adequate tangible collateral security and/or audited financial statements. Facilities may be considered without adequate tangible collateral security, when audited financial statements reveal satisfactory financial position/repayment ability and the facilities are properly structured and supported by assignments, guarantees, etc. as appropriate.
In general, personal guarantees of the partners/promoters/directors of the borrowing entity are obtained in support of credit facilities. In all cases, a statement of net worth of the guarantor is to be compiled by the Account Officer, so that adequate information is available at a future date in case the guarantees need to be enforced.
The market value of tangible collateral security is properly evaluated by the Group’s approved valuers (for properties) or based on publicly available quotations. The value of such security is considered only to the extent of the ouststanding exposure of relevent credit facilities.
From time to time, the Credit and Investment Committee reviews and approves the loan-able value of securities. It has also approved a list of acceptable securities.
The majority of the Group’s current credit portfolio is secured through mortgage of commercial real estate properties. The Group may dispose off the assets as a last resort after carrying out due legal process.
4.5.7.1 General policy guidelines of collateral managementAcceptable Collaterals:
The Group has developed guidelines for acceptable collaterals. Assets offered by customers must meet the following criteria to qualify as acceptable collateral:
a. Assets must be maintaining their value, at the level prevalent at inception, until maturity date of the facility granted;b. Such assets should be easily convertible into cash, if required (liquidity);c. There should be a reasonable market for the assets (marketability); andd. The Group should be able to enforce its rights over the asset if necessary (enforceability).
Ownership:Prior to valuation or further follow up on the offered collateral, Credit Administration ensures satisfactory evidence of the borrower’s ownership of the assets.
Valuation:All assets offered as collateral are valued by an appropriate source either in-house (through another department in the Group) or by an external appraiser (real estate related collateral). The Group maintains a list of independent appraisers, approved by management.
a. Valuation of shares and goods: Where competent staff is available within the Group, the valuation is conducted in-house. The Group performs in-house valuation on the following types of securities:• Pledge of shares of local companies;• Pledge of international marketable shares and securities; and• Pledge and hypothecation of goods.Quoted shares are valued at the quotes available from stock exchanges, periodicals, etc.
b. Valuation of real estate and others: Besides assets mentioned above the valuation, of following securities are also conducted:• Real Estate;• Equipment and machinery; and• Precious metals and jewels.The Credit Administration requests the concerned department to arrange for the valuation from approved valuators.
The following additional guidelines are also followed by the Group:
a. No facility should be disbursed until credit documentation is properly signed and security/guarantees required have been signed and registered, where required. Exceptional cases can be considered by sanctioning authorities; and
b. All documents received as security or support for credit facilities will be lodged in the safe custody through the Credit Administration and should be kept under dual control. Group must ascertain that collateral providers are authorised and acting within their capacity.
Risk and Capital Management Disclosure31 December 2016
BAHRAIN ISLAMIC BANKANNUAL REPORT 2016
99www.bisb.com
4. Risk Management (Continued)
4.5 Credit Risk (Continued)
4.5.7.2 GuaranteesIn cases where a letter of guarantee from parent company or a third party is accepted as a credit risk mitigant, the Group ensures that all guarantees are irrevocable, legal opinion has been obtained from a legal counsellor domiciled in the country of guarantor (overseas) regarding the enforceability of the guarantee, if the guarantor / prime obligor is domiciled outside Bahrain and all guarantees should be valid until full settlement of the facilities. Also no maturity negative mismatch is permissible between the guarantee and exposure.
4.5.7.3 Custody / collateral managementThe assets, or title to the asset, will be maintained in the Group’s custody or with custodian approved by the Group. The Credit Administration will obtain confirmation of the assets held with each custodian on an annual basis.
The release of collateral without full repayment of all related financial obligations requires authorisation of the same level that originally approved and sanctioned the facility. Substitution of collateral is permitted if the new collateral would further minimise the Group’s risk exposure.
When collateral is released to the customer, the Head of Credit Administration obtains and maintains in his records acknowledgement of receipt from the customer or his/her authorised representative.
4.5.8 Counterparty credit riskThe Group has adopted the Standardised Approach to allocate capital for counterparty credit risk. The Group has put in place an internal counterparty limit structure which is based on internal / external ratings for different types of counterparties. The Group has also set concentration limits as a percentage of its capital based on internal and external grades. In case of a counterparty rating downgrade / deterioration, the Group may require further collateral or advise the counterparty to reduce its exposure on a case by case basis.
4.5.8.1 ExposureThe measure of exposure reflects the maximum loss that the Group may suffer in case counterparty fails to fulfil its commitments. Exposure shall always be calculated on the basis of approved limits or actual outstanding exposure (Financing facilities, Investments or others), whichever is higher.
4.5.8.2 CounterpartyA counterparty is defined as an obligor (individual/company/other legal entity), a guarantor of an obligor, or a person receiving funds from the Group, the issuer of a security in case of a security held by the Group, or a party with whom a contract is made by the Group for financial transactions.
4.5.8.3 Group exposureGroup exposure is defined as the total exposure to all counterparties closely related or connected to each other. For this purpose, a Group is two or more counterparties related in such a way that financial soundness of one may affect the financial soundness of the other(s) and one of them has a direct or indirect control over the other(s).
4.5.8.4 Connected counterpartiesConnected counterparties are companies or individuals connected with the Group or its subsidiaries and associated companies (whether such association is due to control or shareholding or otherwise), Directors and their associates (whether such association is due to control, family links or otherwise), members of the Shari’a Supervisory Board, management and other staff, and shareholders holding more than 10% or more of the equity voting rights in the Group.
4.5.8.5 Large exposureLarge exposure is any exposure whether direct, indirect, or funded by equity of investment accountholders to a counterparty or a group of closely related counterparties which is greater than or equal to 10% of the Group’s capital base.
Prior written approval from the CBB is required in the following cases:
a. If any counterparty (single/group) exposure exceeds 15% of Group’s Capital Base; andb. If any facility (new/extended) to an employee is equal or above BD100,000 (or equivalent).
4.5.8.6 Maximum exposureThe Group has set an internal maximum exposure limit in the light of CBB guidelines.
4.5.8.7 ReportingThe Group reports large counterparty exposures (as defined above) to CBB on a periodic basis. The Group reports the exposures on a gross basis without any set-off. However, debit balances on accounts may be offset against credit balances where both are related to the same counterparty, provided the Group has a legally enforceable right to do so.
Risk and Capital Management Disclosure31 December 2016
100 BAHRAIN ISLAMIC BANKANNUAL REPORT 2016
www.bisb.com
4. Risk Management (Continued)
4.5 Credit Risk (Continued)
4.5.8.8 Other mattersAs a Group’s strategy, exposure to connected counterparties may be undertaken only when negotiated and agreed on an arm’s length basis.
The Group shall not assume any exposure to its external auditors.
4.5.9 Related party transactionsThe disclosure relating to related party transactions has been made in the consolidated financial statements as of 31 December 2016. All related party transactions have been made on arm’s length basis.
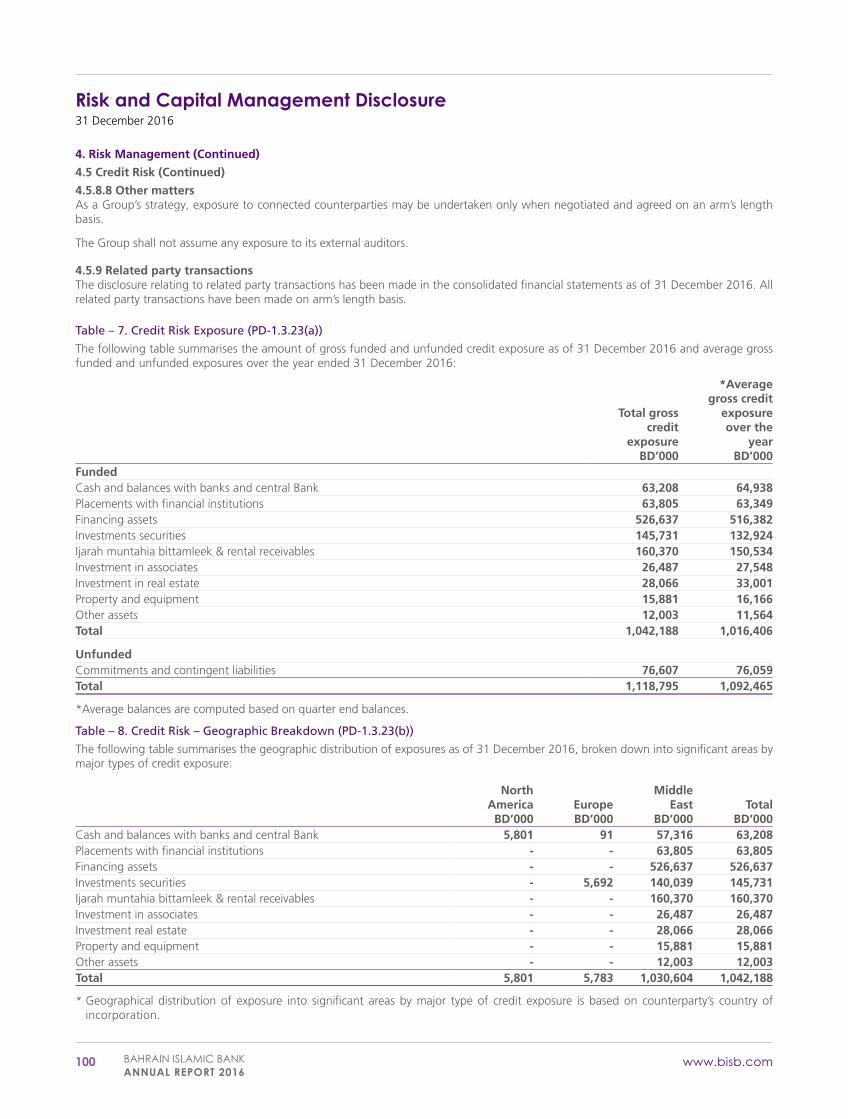
Table – 7. Credit Risk Exposure (PD-1.3.23(a))
The following table summarises the amount of gross funded and unfunded credit exposure as of 31 December 2016 and average gross funded and unfunded exposures over the year ended 31 December 2016:
Total grosscredit
exposureBD’000
*Averagegross credit
exposureover the
yearBD’000
FundedCash and balances with banks and central Bank 63,208 64,938Placements with financial institutions 63,805 63,349Financing assets 526,637 516,382Investments securities 145,731 132,924Ijarah muntahia bittamleek & rental receivables 160,370 150,534Investment in associates 26,487 27,548Investment in real estate 28,066 33,001Property and equipment 15,881 16,166Other assets 12,003 11,564Total 1,042,188 1,016,406
UnfundedCommitments and contingent liabilities 76,607 76,059Total 1,118,795 1,092,465
*Average balances are computed based on quarter end balances.
Table – 8. Credit Risk – Geographic Breakdown (PD-1.3.23(b))
The following table summarises the geographic distribution of exposures as of 31 December 2016, broken down into significant areas by major types of credit exposure:
NorthAmericaBD’000
EuropeBD’000
MiddleEast
BD’000Total
BD’000Cash and balances with banks and central Bank 5,801 91 57,316 63,208Placements with financial institutions - - 63,805 63,805Financing assets - - 526,637 526,637Investments securities - 5,692 140,039 145,731Ijarah muntahia bittamleek & rental receivables - - 160,370 160,370Investment in associates - - 26,487 26,487Investment real estate - - 28,066 28,066Property and equipment - - 15,881 15,881Other assets - - 12,003 12,003Total 5,801 5,783 1,030,604 1,042,188
* Geographical distribution of exposure into significant areas by major type of credit exposure is based on counterparty’s country of incorporation.
Risk and Capital Management Disclosure31 December 2016
BAHRAIN ISLAMIC BANKANNUAL REPORT 2016
101www.bisb.com
4. Risk Management (Continued)
4.5 Credit Risk (Continued)
4.5.9 Related party transactions (Continued
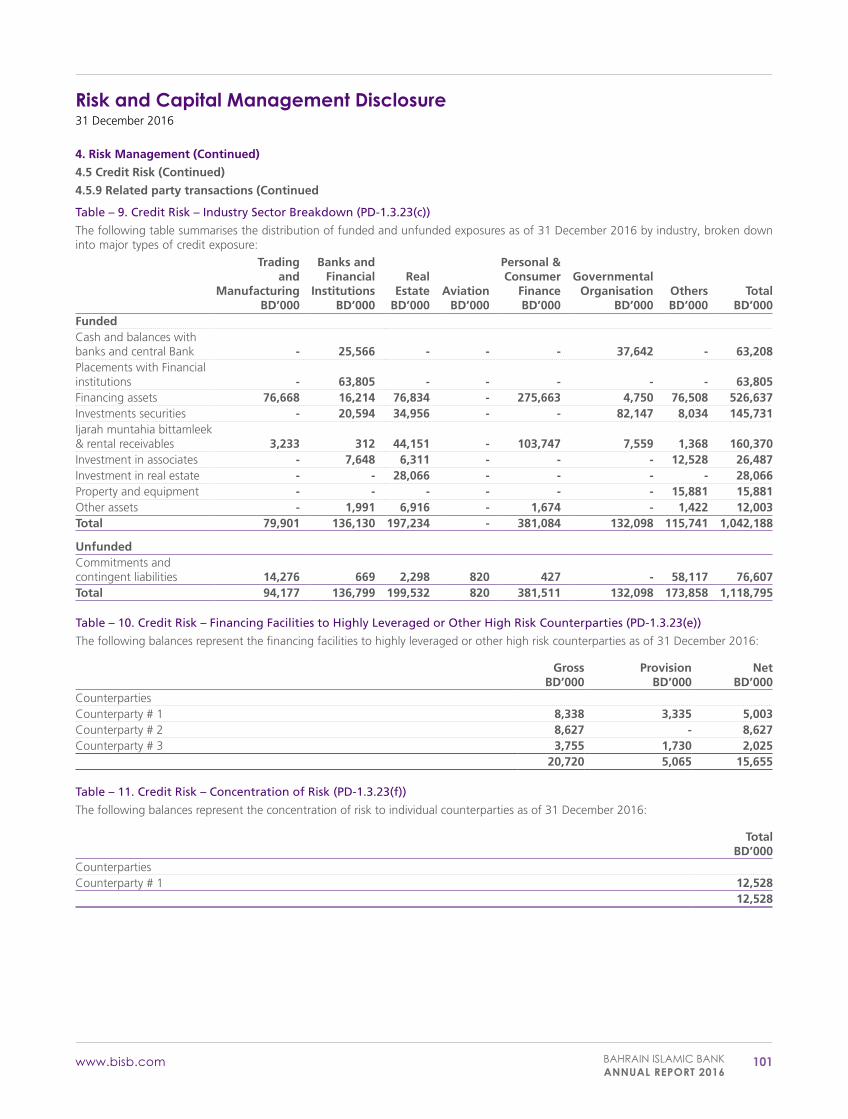
Table – 9. Credit Risk – Industry Sector Breakdown (PD-1.3.23(c))
The following table summarises the distribution of funded and unfunded exposures as of 31 December 2016 by industry, broken down into major types of credit exposure:
Tradingand
ManufacturingBD’000
Banks andFinancial
InstitutionsBD’000
RealEstate
BD’000Aviation
BD’000
Personal &Consumer
FinanceBD’000
GovernmentalOrganisation
BD’000OthersBD’000
TotalBD’000
FundedCash and balances with banks and central Bank - 25,566 - - - 37,642 - 63,208Placements with Financial institutions - 63,805 - - - - - 63,805Financing assets 76,668 16,214 76,834 - 275,663 4,750 76,508 526,637Investments securities - 20,594 34,956 - - 82,147 8,034 145,731Ijarah muntahia bittamleek & rental receivables 3,233 312 44,151 - 103,747 7,559 1,368 160,370Investment in associates - 7,648 6,311 - - - 12,528 26,487Investment in real estate - - 28,066 - - - - 28,066Property and equipment - - - - - - 15,881 15,881Other assets - 1,991 6,916 - 1,674 - 1,422 12,003Total 79,901 136,130 197,234 - 381,084 132,098 115,741 1,042,188
UnfundedCommitments and contingent liabilities 14,276 669 2,298 820 427 - 58,117 76,607Total 94,177 136,799 199,532 820 381,511 132,098 173,858 1,118,795
Table – 10. Credit Risk – Financing Facilities to Highly Leveraged or Other High Risk Counterparties (PD-1.3.23(e))
The following balances represent the financing facilities to highly leveraged or other high risk counterparties as of 31 December 2016:
GrossBD’000
ProvisionBD’000
NetBD’000
CounterpartiesCounterparty # 1 8,338 3,335 5,003Counterparty # 2 8,627 - 8,627Counterparty # 3 3,755 1,730 2,025
20,720 5,065 15,655
Table – 11. Credit Risk – Concentration of Risk (PD-1.3.23(f))
The following balances represent the concentration of risk to individual counterparties as of 31 December 2016:
TotalBD’000
CounterpartiesCounterparty # 1 12,528
12,528
Risk and Capital Management Disclosure31 December 2016
102 BAHRAIN ISLAMIC BANKANNUAL REPORT 2016
www.bisb.com
4. Risk Management (Continued)
4.5 Credit Risk (Continued)
4.5.9 Related party transactions (Continued
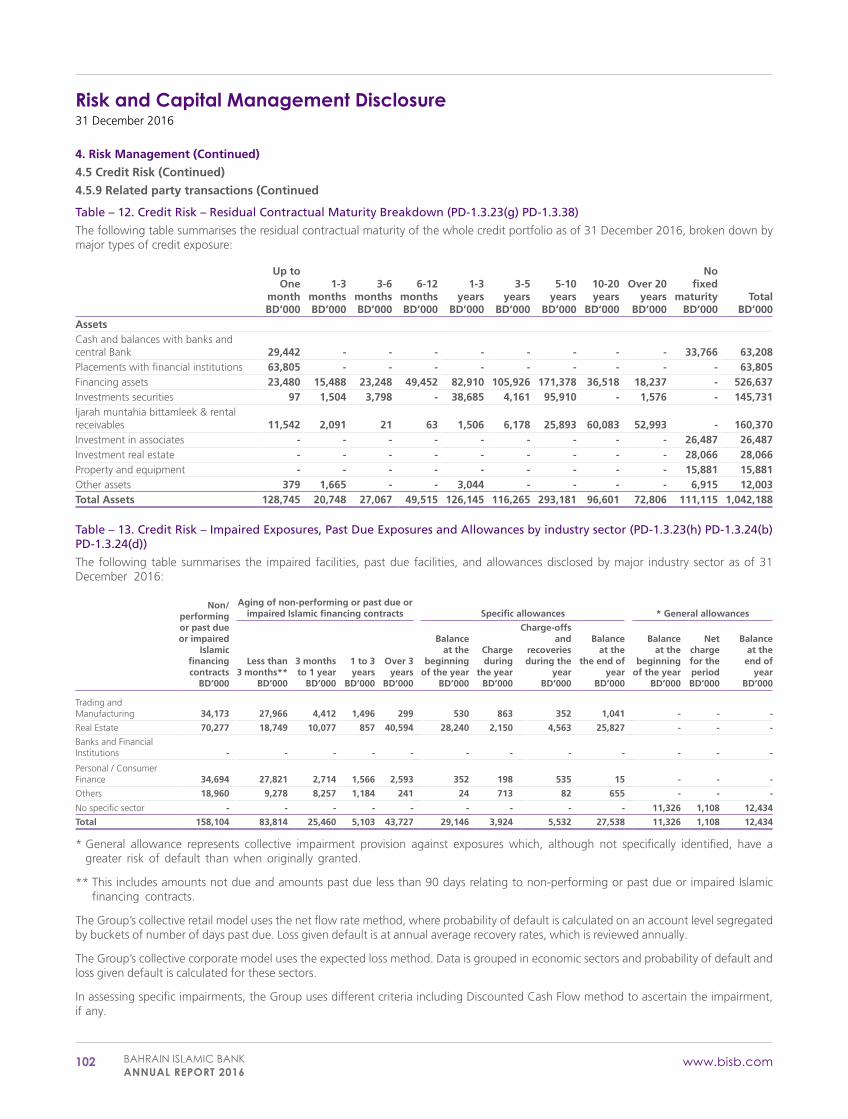
Table – 12. Credit Risk – Residual Contractual Maturity Breakdown (PD-1.3.23(g) PD-1.3.38)
The following table summarises the residual contractual maturity of the whole credit portfolio as of 31 December 2016, broken down by major types of credit exposure:
Up to One
monthBD’000
1-3monthsBD’000
3-6monthsBD’000
6-12monthsBD’000
1-3years
BD’000
3-5years
BD’000
5-10years
BD’000
10-20years
BD’000
Over 20years
BD’000
No fixed
maturityBD’000
TotalBD’000
AssetsCash and balances with banks and central Bank 29,442 - - - - - - - - 33,766 63,208Placements with financial institutions 63,805 - - - - - - - - - 63,805Financing assets 23,480 15,488 23,248 49,452 82,910 105,926 171,378 36,518 18,237 - 526,637Investments securities 97 1,504 3,798 - 38,685 4,161 95,910 - 1,576 - 145,731Ijarah muntahia bittamleek & rental receivables 11,542 2,091 21 63 1,506 6,178 25,893 60,083 52,993 - 160,370Investment in associates - - - - - - - - - 26,487 26,487Investment real estate - - - - - - - - - 28,066 28,066Property and equipment - - - - - - - - - 15,881 15,881Other assets 379 1,665 - - 3,044 - - - - 6,915 12,003Total Assets 128,745 20,748 27,067 49,515 126,145 116,265 293,181 96,601 72,806 111,115 1,042,188
Table – 13. Credit Risk – Impaired Exposures, Past Due Exposures and Allowances by industry sector (PD-1.3.23(h) PD-1.3.24(b) PD-1.3.24(d))
The following table summarises the impaired facilities, past due facilities, and allowances disclosed by major industry sector as of 31 December 2016:
Non/performingor past dueor impaired
Islamicfinancingcontracts
BD’000
Aging of non-performing or past due or impaired Islamic financing contracts Specific allowances * General allowances
Less than3 months**
BD’000
3 monthsto 1 year
BD’000
1 to 3years
BD’000
Over 3years
BD’000
Balanceat the
beginningof the year
BD’000
Chargeduring
the yearBD’000
Charge-offsand
recoveriesduring the
yearBD’000
Balanceat the
the end ofyear
BD’000
Balanceat the
beginningof the year
BD’000
Net chargefor the periodBD’000
Balanceat theend of
yearBD’000
Trading and Manufacturing 34,173 27,966 4,412 1,496 299 530 863 352 1,041 - - -
Real Estate 70,277 18,749 10,077 857 40,594 28,240 2,150 4,563 25,827 - - -
Banks and Financial Institutions - - - - - - - - - - - -
Personal / Consumer Finance 34,694 27,821 2,714 1,566 2,593 352 198 535 15 - - -
Others 18,960 9,278 8,257 1,184 241 24 713 82 655 - - -
No specific sector - - - - - - - - - 11,326 1,108 12,434
Total 158,104 83,814 25,460 5,103 43,727 29,146 3,924 5,532 27,538 11,326 1,108 12,434
* General allowance represents collective impairment provision against exposures which, although not specifically identified, have a greater risk of default than when originally granted.
** This includes amounts not due and amounts past due less than 90 days relating to non-performing or past due or impaired Islamic financing contracts.
The Group’s collective retail model uses the net flow rate method, where probability of default is calculated on an account level segregated by buckets of number of days past due. Loss given default is at annual average recovery rates, which is reviewed annually.
The Group’s collective corporate model uses the expected loss method. Data is grouped in economic sectors and probability of default and loss given default is calculated for these sectors.
In assessing specific impairments, the Group uses different criteria including Discounted Cash Flow method to ascertain the impairment, if any.
Risk and Capital Management Disclosure31 December 2016
BAHRAIN ISLAMIC BANKANNUAL REPORT 2016
103www.bisb.com
4. Risk Management (Continued)
4.5 Credit Risk (Continued)
4.5.9 Related party transactions (Continued
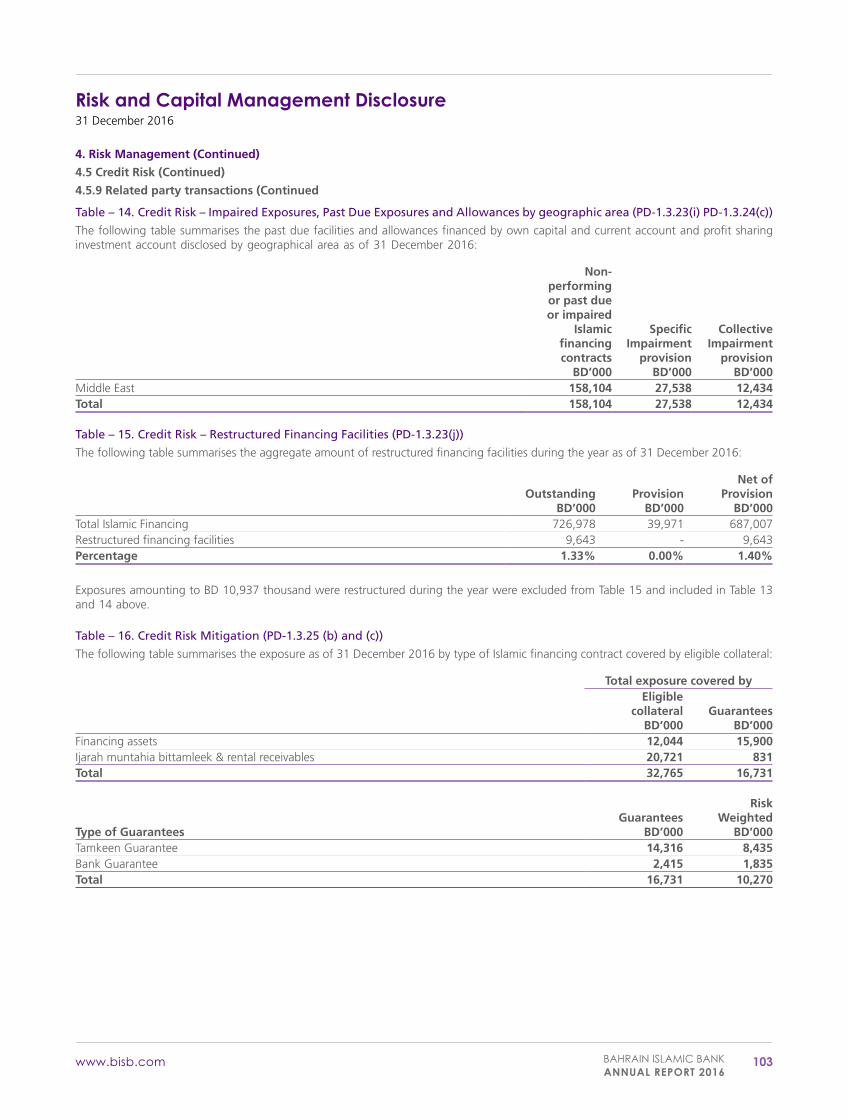
Table – 14. Credit Risk – Impaired Exposures, Past Due Exposures and Allowances by geographic area (PD-1.3.23(i) PD-1.3.24(c))
The following table summarises the past due facilities and allowances financed by own capital and current account and profit sharing investment account disclosed by geographical area as of 31 December 2016:
Non-performingor past dueor impaired
Islamicfinancingcontracts
BD’000
SpecificImpairment
provisionBD’000
CollectiveImpairment
provisionBD’000
Middle East 158,104 27,538 12,434Total 158,104 27,538 12,434
Table – 15. Credit Risk – Restructured Financing Facilities (PD-1.3.23(j))
The following table summarises the aggregate amount of restructured financing facilities during the year as of 31 December 2016:
Outstanding BD’000
ProvisionBD’000
Net of Provision
BD’000Total Islamic Financing 726,978 39,971 687,007Restructured financing facilities 9,643 - 9,643Percentage 1.33% 0.00% 1.40%
Exposures amounting to BD 10,937 thousand were restructured during the year were excluded from Table 15 and included in Table 13 and 14 above.
Table – 16. Credit Risk Mitigation (PD-1.3.25 (b) and (c))
The following table summarises the exposure as of 31 December 2016 by type of Islamic financing contract covered by eligible collateral:
Total exposure covered byEligible
collateralBD’000
GuaranteesBD’000
Financing assets 12,044 15,900Ijarah muntahia bittamleek & rental receivables 20,721 831Total 32,765 16,731
Type of GuaranteesGuarantees
BD’000
RiskWeighted
BD’000Tamkeen Guarantee 14,316 8,435Bank Guarantee 2,415 1,835Total 16,731 10,270
Risk and Capital Management Disclosure31 December 2016
104 BAHRAIN ISLAMIC BANKANNUAL REPORT 2016
www.bisb.com
4. Risk Management (Continued)
4.5 Credit Risk (Continued)
4.5.9 Related party transactions (Continued
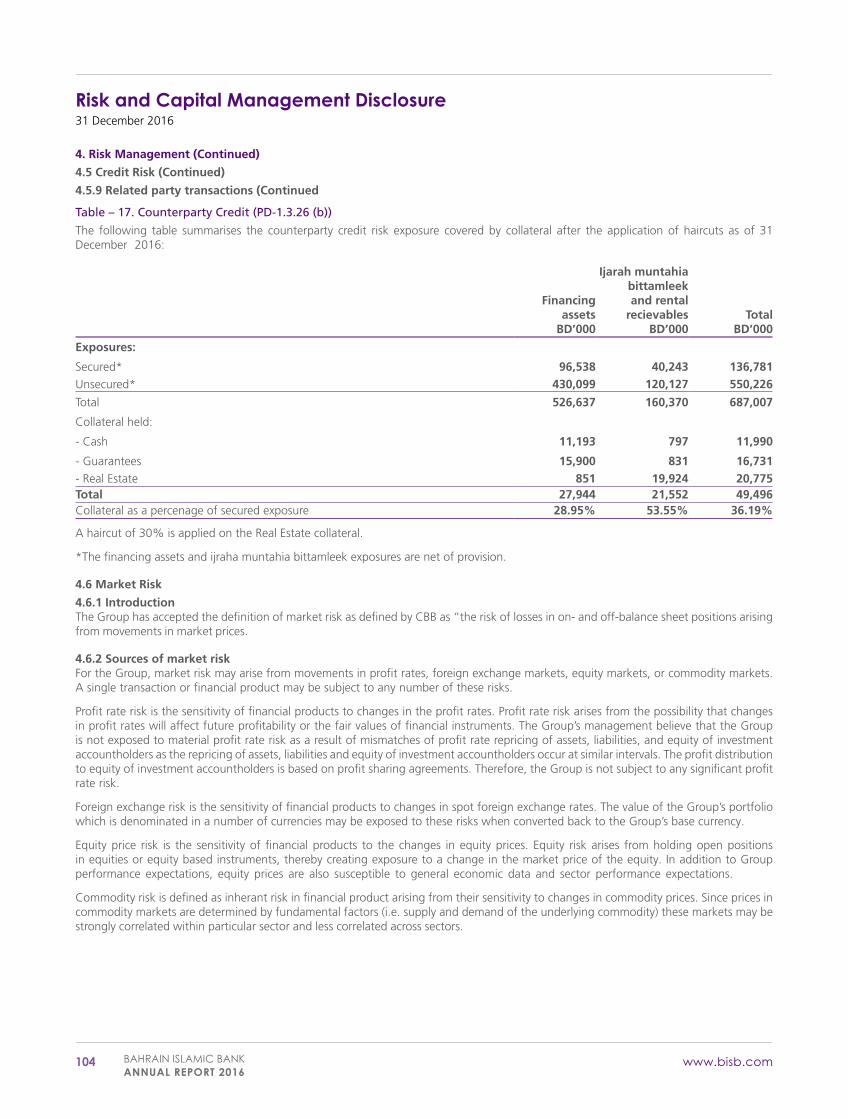
Table – 17. Counterparty Credit (PD-1.3.26 (b))
The following table summarises the counterparty credit risk exposure covered by collateral after the application of haircuts as of 31 December 2016:
Financingassets
BD’000
Ijarah muntahiabittamleekand rental
recievablesBD’000
TotalBD’000
Exposures:
Secured* 96,538 40,243 136,781Unsecured* 430,099 120,127 550,226
Total 526,637 160,370 687,007
Collateral held:
- Cash 11,193 797 11,990
- Guarantees 15,900 831 16,731- Real Estate 851 19,924 20,775Total 27,944 21,552 49,496Collateral as a percenage of secured exposure 28.95% 53.55% 36.19%
A haircut of 30% is applied on the Real Estate collateral.
*The financing assets and ijraha muntahia bittamleek exposures are net of provision.
4.6 Market Risk
4.6.1 IntroductionThe Group has accepted the definition of market risk as defined by CBB as “the risk of losses in on- and off-balance sheet positions arising from movements in market prices.
4.6.2 Sources of market riskFor the Group, market risk may arise from movements in profit rates, foreign exchange markets, equity markets, or commodity markets. A single transaction or financial product may be subject to any number of these risks.
Profit rate risk is the sensitivity of financial products to changes in the profit rates. Profit rate risk arises from the possibility that changes in profit rates will affect future profitability or the fair values of financial instruments. The Group’s management believe that the Group is not exposed to material profit rate risk as a result of mismatches of profit rate repricing of assets, liabilities, and equity of investment accountholders as the repricing of assets, liabilities and equity of investment accountholders occur at similar intervals. The profit distribution to equity of investment accountholders is based on profit sharing agreements. Therefore, the Group is not subject to any significant profit rate risk.
Foreign exchange risk is the sensitivity of financial products to changes in spot foreign exchange rates. The value of the Group’s portfolio which is denominated in a number of currencies may be exposed to these risks when converted back to the Group’s base currency.
Equity price risk is the sensitivity of financial products to the changes in equity prices. Equity risk arises from holding open positions in equities or equity based instruments, thereby creating exposure to a change in the market price of the equity. In addition to Group performance expectations, equity prices are also susceptible to general economic data and sector performance expectations.
Commodity risk is defined as inherant risk in financial product arising from their sensitivity to changes in commodity prices. Since prices in commodity markets are determined by fundamental factors (i.e. supply and demand of the underlying commodity) these markets may be strongly correlated within particular sector and less correlated across sectors.
Risk and Capital Management Disclosure31 December 2016
BAHRAIN ISLAMIC BANKANNUAL REPORT 2016
105www.bisb.com
4. Risk Management (Continued)
4.6 Market Risk (Continued)
4.6.3 Market risk strategyThe Group’s Board is responsible for approving and reviewing (at least annually) the risk strategy and significant amendments to the risk policies. The Group’s senior management is responsible for implementing the risk strategy approved by the Board, and continually enhancing the policies and procedures for identifying, measuring, monitoring,and controlling risks.
In line with the Group’s risk management objectives and risk tolerance levels, the specific strategies for market risk management include:
1 The Group will manage its market risk exposure by evaluating each new product / activity with respect to the market risk introduced by it;
2 The Group will proactively measure and continually monitor the market risk in its portfolio;3 The Group will at all time hold sufficient capital in line with the CBB Pillar 1 regulatory capital requirements;4 The Group will establish a limit structure to monitor and control the market risk in its portfolio. These limits will include position
limits, maximum/stop loss limits, factor sensitivity limits, VaR limits and maturity limits;5 The Group will carry out stress testing periodically using the worst case scenarios to assess the effects of changes in the market value
due to changing market conditions;6 The Group will periodically carry out back testing of market risk assessment models in order to evaluate their accuracy and the
inherent model risk;7 The Group will match the amount of floating rate assets with floating rate liabilities; and8 The Group will clearly identify the foreign currencies in which it wishes to deal in and actively manage its market risk in all foreign
currencies in which it has significant exposure.
4.6.4 Market risk measurement methodologyMarket risk measurement techniques include the use of a number of techniques for market risk measurement. The risk measurement techniques mentioned in this section are used for measuring market risk in both trading book as well as banking book.
The various techniques which are used by the Group for the measurement, monitoring and control of market risk are as follows:
a. Overnight open positions;b. Stop loss limits;c. Factor sensitivity limits;d. VaR limits; ande. Profit rate risk gap analysis.
4.6.5 Market risk monitoring and limits structureThe Asset and Liability Committee (ALCO) proposes through the Executive Committee and Board the tolerance for market risk. Based on these tolerances, Risk and Compliance Unit and Treasury have established appropriate risk limits that maintain the Group’s exposure within the strategic risk tolerances over a range of possible changes in market prices and rates.
4.6.6 Limits monitoringThe Treasury Department and Risk and Compliance Unit monitor the risk limits for each transaction, ensure that the limits are well within set parameters, and report periodically to top management.
4.6.7 Breach of limitsIn case a limit is breached, an approval from the CEO is required to continue with the transaction. An immediate report is provided to the ALCO after every significant limit breach. This breach is also reported to and approved by the Executive Committee (EXCOM). The limits are revised at least bi-annually or when deemed required.
4.6.8 Portfolio review processOn a monthly basis, Risk and Compliance Unit reviews the Group’s assets and liabilities portfolio to evaluate the overall corporate exposure to market risk. As part of the review, Risk and Compliance Unit also monitors the Group’s overall market exposure against the risk tolerance limits set by the Board. Risk and Compliance Unit also reviews the adherence to approved limits to control the market risk. Changes, if any, in market risk limits are communicated to business units after review by the GM-C&RM/CEO and approval by the ALCO or EXCOM, as per the delegated authorities approved by the Board. Balance sheet exposure is being reviewed on a quarterly basis by the Board level Audit and Risk committees.
4.6.9 ReportingRisk and Compliance Unit generates at regular periodic intervals market risk management reports. These reports aim to provide the Group’s senior management with an up-to-date view of its market risk exposure.

Risk and Capital Management Disclosure31 December 2016
106 BAHRAIN ISLAMIC BANKANNUAL REPORT 2016
www.bisb.com
4. Risk Management (Continued)
4.6 Market Risk (Continued)
4.6.10 Stress testingStress tests produce information summarising the Group’s exposure to extreme, but possible, circumstances and offer a way of measuring and monitoring the portfolio against extreme price movements of this type. The Group’s Risk and Compliance Unit employs four stress categories: profit rates, foreign exchange rates, equity prices, and commodity prices. For each stress category, the worst possible stress shocks that might realistically occur in the market are defined.
4.6.11 Foreign subsidiaryThe Group does not have any foreign subsidiary.
Table – 18. Market Risk Capital Requirements (PD-1.3.27 (b))
The following table summarises the maximum and minimum capital requirement for foreign exchange risk as of 31 December 2016:
Foreignexchange
riskBD’000
Maximum value capital requirement 1,528Minimum value capital requirement 975
4.7 Operational Risk
4.7.1 IntroductionOperational risk is the risk of loss arising from system failure, human error, fraud , or external events. When controls fail to perform, operational risks can cause damage to reputation, have legal or regulatory implications, or lead to financial loss. The Group cannot expect to eliminate all operational risks, but through a control framework and by monitoring and responding to potential risks, the Group is able to manage the risks. Controls include effective segregation of duties, access, authorisation and reconciliation procedures, staff education and assessment processes, including the use of internal audit.
4.7.2 Sources of operational riskThe different sources of operational risks faced by the Group can be classified broadly into the following categories;
1. People risk which arises due to staffing inadequacy, unattractive remuneration structure, lack in staff development policies, lack in procedures for appointment, unhealthy professional working relationship , and unethical environment;
2. Processes risk which arises due to inadequate general controls, inadequate application controls, improper business and market practices and procedures, inappropriate/inadequate monitoring and reporting; and
3. Systems (Technology) risk which arise due to integrity of information - lacking in timeliness of information, omission and duplication of data, hardware failures due to power surge, obsolescence or low quality.
4. Legal risk which arised due to contractual obligations.
4.7.3 Operational risk management strategyAs a strategy, the Group will identify the sources of operational risks in coordination with each business unit. The Group carried out Risk Control Self-Assessments (“RCSA”), and plans to do a continuous and on-going exercise to identify the operational risks it is exposed to.
The Group on a continuous basis will:
a. assess the effectiveness of controls associated with identified risks;b. regularly monitor operational risk profiles and material exposures to losses / loss events; andc. identify stress events and scenarios to which it is vulnerable and assess their potential impact, and the probability of aggregated
losses from a single event leading to other risks.
4.7.4 Operational risk monitoring and reportingThe internal monitoring and reporting process ensures a consistent approach for providing pertinent information to senior management for the quick detection and correction of deficiencies in the policies, processes, and procedures for managing operational risk through ongoing, periodic reviews.
The objective of the reporting process is to ensure relevant information is provided to senior management and the Board to enable the proactive management of operational risk. The process ensures a consistent approach for providing information that enables appropriate decision making and action taking.
The Bank has a legal department dedicated to monitor any legal risk arising out of contracts / agreements entered into by the Bank on a day to day basis. The department also liases with external lawyers for legal cases filed by the bank against deliquent accounts for recovery or any legal cases filed against the Bank.
Risk and Capital Management Disclosure31 December 2016
BAHRAIN ISLAMIC BANKANNUAL REPORT 2016
107www.bisb.com
4. Risk Management (Continued)
4.7 Operational Risk (Continued)
4.7.5 Operational risk mitigation and controlThe business units, in consultation with Risk and Compliance Units will determine all material operational risks and decide the appropriate procedures to be used to control and/or mitigate the risks.
For those risks that cannot be controlled, the business units in conjunction with Risk and Compliance Unit will decide whether to accept the risks, reduce the level of business activity involved, transfer the risk outside the Group, or withdraw from the associated activity completely. Risk and Compliance Unit facilitates the business units in co-developing the mitigation plans. Bank deals with the pending legal cases through internal and external lawyers depending upon the severity of the cases.
4.7.6 Business Continuity Plan (BCP)The Group has also developed a comprehensive business continuity plan detailing the steps to be taken in the event of extreme conditions to resume the Group’s operations with minimum delay and disturbance. The plan is in implementation stage. Elements of contingency plans and disaster recovery processes include operating systems, physical space, telecommunications , and resources.
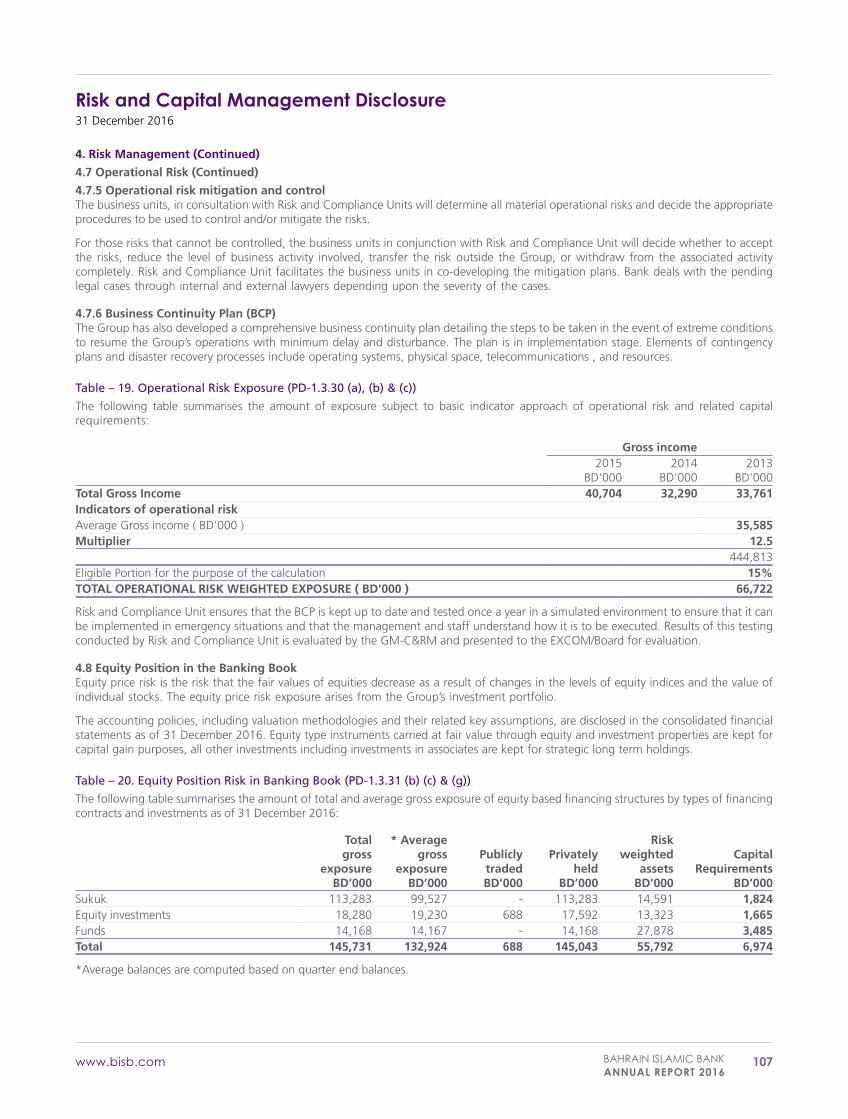
Table – 19. Operational Risk Exposure (PD-1.3.30 (a), (b) & (c))
The following table summarises the amount of exposure subject to basic indicator approach of operational risk and related capital requirements:
Gross income2015
BD'0002014
BD'0002013
BD'000Total Gross Income 40,704 32,290 33,761Indicators of operational riskAverage Gross income ( BD'000 ) 35,585Multiplier 12.5
444,813Eligible Portion for the purpose of the calculation 15%TOTAL OPERATIONAL RISK WEIGHTED EXPOSURE ( BD'000 ) 66,722
Risk and Compliance Unit ensures that the BCP is kept up to date and tested once a year in a simulated environment to ensure that it can be implemented in emergency situations and that the management and staff understand how it is to be executed. Results of this testing conducted by Risk and Compliance Unit is evaluated by the GM-C&RM and presented to the EXCOM/Board for evaluation.
4.8 Equity Position in the Banking BookEquity price risk is the risk that the fair values of equities decrease as a result of changes in the levels of equity indices and the value of individual stocks. The equity price risk exposure arises from the Group’s investment portfolio.
The accounting policies, including valuation methodologies and their related key assumptions, are disclosed in the consolidated financial statements as of 31 December 2016. Equity type instruments carried at fair value through equity and investment properties are kept for capital gain purposes, all other investments including investments in associates are kept for strategic long term holdings.
Table – 20. Equity Position Risk in Banking Book (PD-1.3.31 (b) (c) & (g))
The following table summarises the amount of total and average gross exposure of equity based financing structures by types of financing contracts and investments as of 31 December 2016:
Totalgross
exposureBD’000
* Averagegross
exposureBD’000
PubliclytradedBD’000
Privatelyheld
BD’000
Riskweighted
assetsBD’000
CapitalRequirements
BD’000Sukuk 113,283 99,527 - 113,283 14,591 1,824Equity investments 18,280 19,230 688 17,592 13,323 1,665Funds 14,168 14,167 - 14,168 27,878 3,485Total 145,731 132,924 688 145,043 55,792 6,974
*Average balances are computed based on quarter end balances.
Risk and Capital Management Disclosure31 December 2016
108 BAHRAIN ISLAMIC BANKANNUAL REPORT 2016
www.bisb.com
4. Risk Management (Continued)
4.8 Equity Position in the Banking Book (Continued)
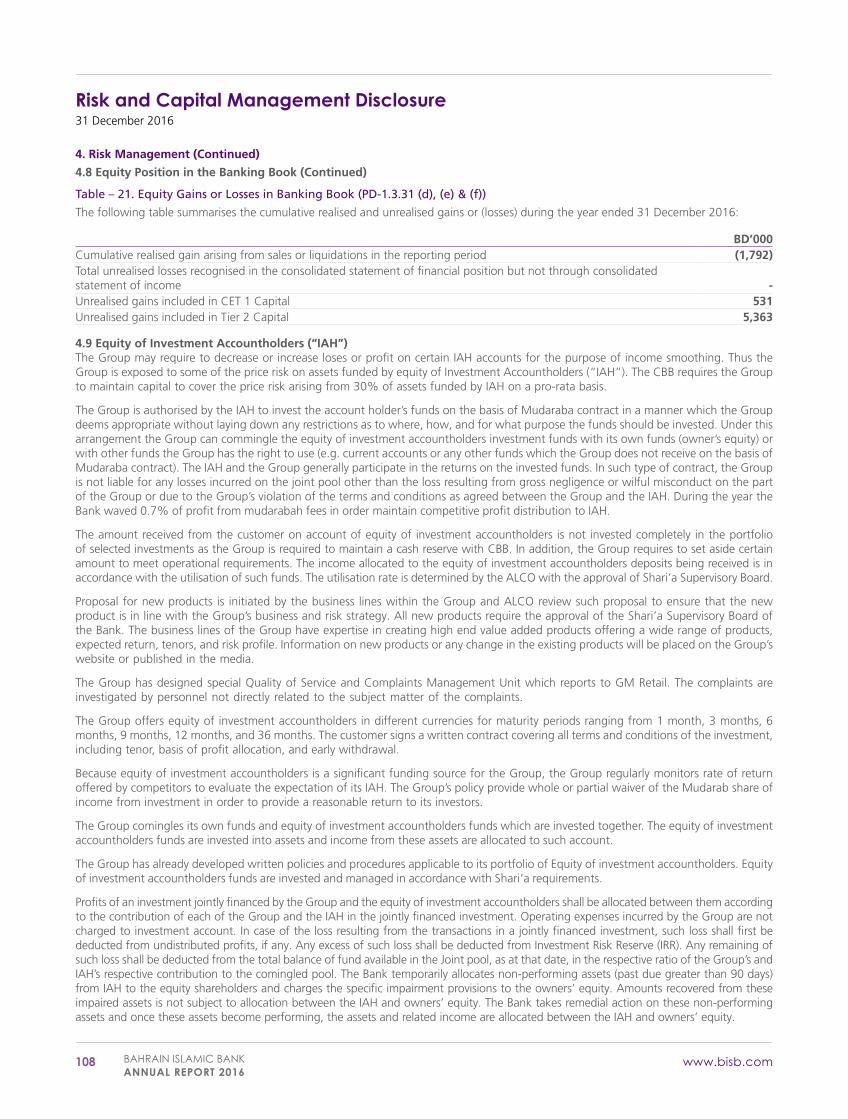
Table – 21. Equity Gains or Losses in Banking Book (PD-1.3.31 (d), (e) & (f))
The following table summarises the cumulative realised and unrealised gains or (losses) during the year ended 31 December 2016:
BD’000Cumulative realised gain arising from sales or liquidations in the reporting period (1,792)Total unrealised losses recognised in the consolidated statement of financial position but not through consolidated statement of income -Unrealised gains included in CET 1 Capital 531Unrealised gains included in Tier 2 Capital 5,363
4.9 Equity of Investment Accountholders (“IAH”)The Group may require to decrease or increase loses or profit on certain IAH accounts for the purpose of income smoothing. Thus the Group is exposed to some of the price risk on assets funded by equity of Investment Accountholders (“IAH”). The CBB requires the Group to maintain capital to cover the price risk arising from 30% of assets funded by IAH on a pro-rata basis.
The Group is authorised by the IAH to invest the account holder’s funds on the basis of Mudaraba contract in a manner which the Group deems appropriate without laying down any restrictions as to where, how, and for what purpose the funds should be invested. Under this arrangement the Group can commingle the equity of investment accountholders investment funds with its own funds (owner’s equity) or with other funds the Group has the right to use (e.g. current accounts or any other funds which the Group does not receive on the basis of Mudaraba contract). The IAH and the Group generally participate in the returns on the invested funds. In such type of contract, the Group is not liable for any losses incurred on the joint pool other than the loss resulting from gross negligence or wilful misconduct on the part of the Group or due to the Group’s violation of the terms and conditions as agreed between the Group and the IAH. During the year the Bank waved 0.7% of profit from mudarabah fees in order maintain competitive profit distribution to IAH.
The amount received from the customer on account of equity of investment accountholders is not invested completely in the portfolio of selected investments as the Group is required to maintain a cash reserve with CBB. In addition, the Group requires to set aside certain amount to meet operational requirements. The income allocated to the equity of investment accountholders deposits being received is in accordance with the utilisation of such funds. The utilisation rate is determined by the ALCO with the approval of Shari’a Supervisory Board.
Proposal for new products is initiated by the business lines within the Group and ALCO review such proposal to ensure that the new product is in line with the Group’s business and risk strategy. All new products require the approval of the Shari’a Supervisory Board of the Bank. The business lines of the Group have expertise in creating high end value added products offering a wide range of products, expected return, tenors, and risk profile. Information on new products or any change in the existing products will be placed on the Group’s website or published in the media.
The Group has designed special Quality of Service and Complaints Management Unit which reports to GM Retail. The complaints are investigated by personnel not directly related to the subject matter of the complaints.
The Group offers equity of investment accountholders in different currencies for maturity periods ranging from 1 month, 3 months, 6 months, 9 months, 12 months, and 36 months. The customer signs a written contract covering all terms and conditions of the investment, including tenor, basis of profit allocation, and early withdrawal.
Because equity of investment accountholders is a significant funding source for the Group, the Group regularly monitors rate of return offered by competitors to evaluate the expectation of its IAH. The Group’s policy provide whole or partial waiver of the Mudarab share of income from investment in order to provide a reasonable return to its investors.
The Group comingles its own funds and equity of investment accountholders funds which are invested together. The equity of investment accountholders funds are invested into assets and income from these assets are allocated to such account.
The Group has already developed written policies and procedures applicable to its portfolio of Equity of investment accountholders. Equity of investment accountholders funds are invested and managed in accordance with Shari’a requirements.
Profits of an investment jointly financed by the Group and the equity of investment accountholders shall be allocated between them according to the contribution of each of the Group and the IAH in the jointly financed investment. Operating expenses incurred by the Group are not charged to investment account. In case of the loss resulting from the transactions in a jointly financed investment, such loss shall first be deducted from undistributed profits, if any. Any excess of such loss shall be deducted from Investment Risk Reserve (IRR). Any remaining of such loss shall be deducted from the total balance of fund available in the Joint pool, as at that date, in the respective ratio of the Group’s and IAH’s respective contribution to the comingled pool. The Bank temporarily allocates non-performing assets (past due greater than 90 days) from IAH to the equity shareholders and charges the specific impairment provisions to the owners’ equity. Amounts recovered from these impaired assets is not subject to allocation between the IAH and owners’ equity. The Bank takes remedial action on these non-performing assets and once these assets become performing, the assets and related income are allocated between the IAH and owners’ equity.
Risk and Capital Management Disclosure31 December 2016
BAHRAIN ISLAMIC BANKANNUAL REPORT 2016
109www.bisb.com
4. Risk Management (Continued)
4.9 Equity of Investment Accountholders (“IAH”) (Continued)In case of early withdrawal of IAH fund before completion of the term, the effective utilisation method will be applied.
In case of term deposits, the IAH account holders can withdraw fundson a premature basis by paying a nominal amount of fees / penalty; such penalties are offered for charity.
Additional disclosures such as the below are disclosed in the Bank›s website;
a) Characteristics of investors for whom investment account may be appropriate
b) Purchase redemption and distribution procedures
c) Product information and the manner in which the products are made avialble to investors
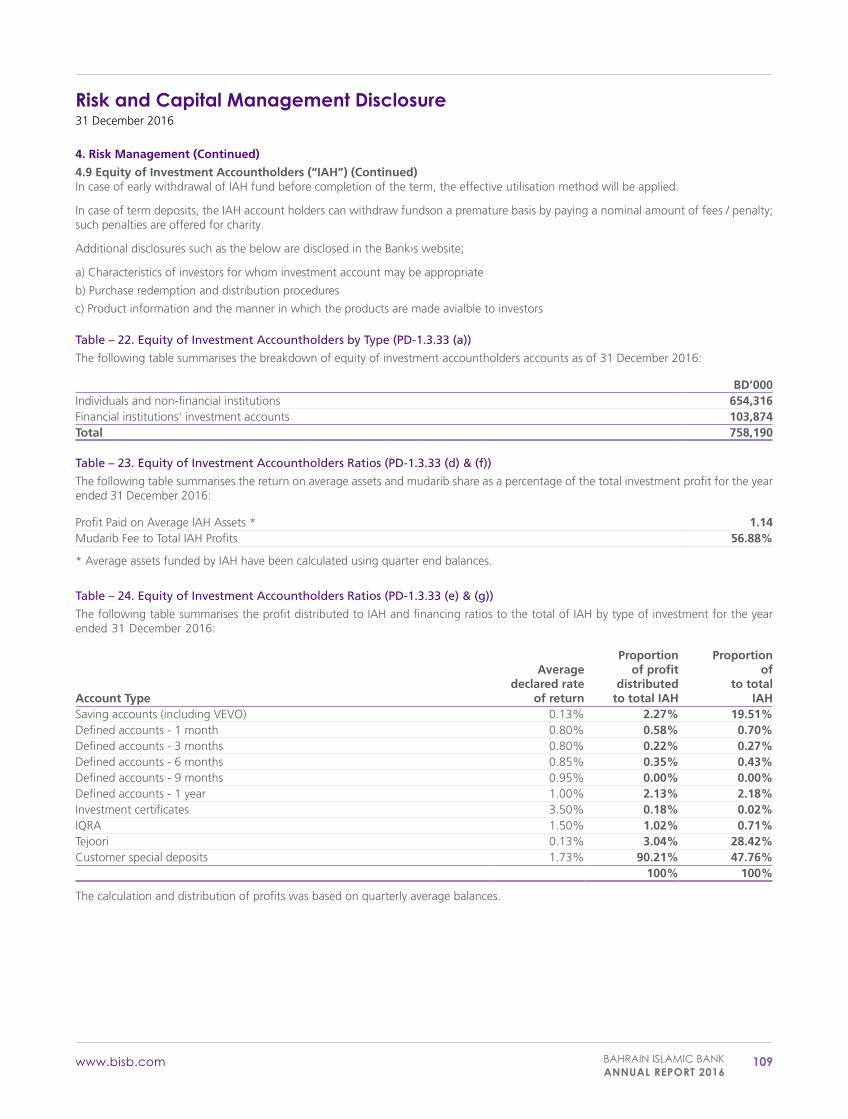
Table – 22. Equity of Investment Accountholders by Type (PD-1.3.33 (a))
The following table summarises the breakdown of equity of investment accountholders accounts as of 31 December 2016:
BD’000Individuals and non-financial institutions 654,316Financial institutions' investment accounts 103,874Total 758,190
Table – 23. Equity of Investment Accountholders Ratios (PD-1.3.33 (d) & (f))
The following table summarises the return on average assets and mudarib share as a percentage of the total investment profit for the year ended 31 December 2016:
Profit Paid on Average IAH Assets * 1.14Mudarib Fee to Total IAH Profits 56.88%
* Average assets funded by IAH have been calculated using quarter end balances.
Table – 24. Equity of Investment Accountholders Ratios (PD-1.3.33 (e) & (g))
The following table summarises the profit distributed to IAH and financing ratios to the total of IAH by type of investment for the year ended 31 December 2016:
Account Type
Averagedeclared rate
of return
Proportionof profit
distributedto total IAH
Proportionof
to totalIAH
Saving accounts (including VEVO) 0.13% 2.27% 19.51%Defined accounts - 1 month 0.80% 0.58% 0.70%Defined accounts - 3 months 0.80% 0.22% 0.27%Defined accounts - 6 months 0.85% 0.35% 0.43%Defined accounts - 9 months 0.95% 0.00% 0.00%Defined accounts - 1 year 1.00% 2.13% 2.18%Investment certificates 3.50% 0.18% 0.02%IQRA 1.50% 1.02% 0.71%Tejoori 0.13% 3.04% 28.42%Customer special deposits 1.73% 90.21% 47.76%
100% 100%
The calculation and distribution of profits was based on quarterly average balances.
Risk and Capital Management Disclosure31 December 2016
110 BAHRAIN ISLAMIC BANKANNUAL REPORT 2016
www.bisb.com
4. Risk Management (Continued)
4.9 Equity of Investment Accountholders (“IAH”) (Continued)
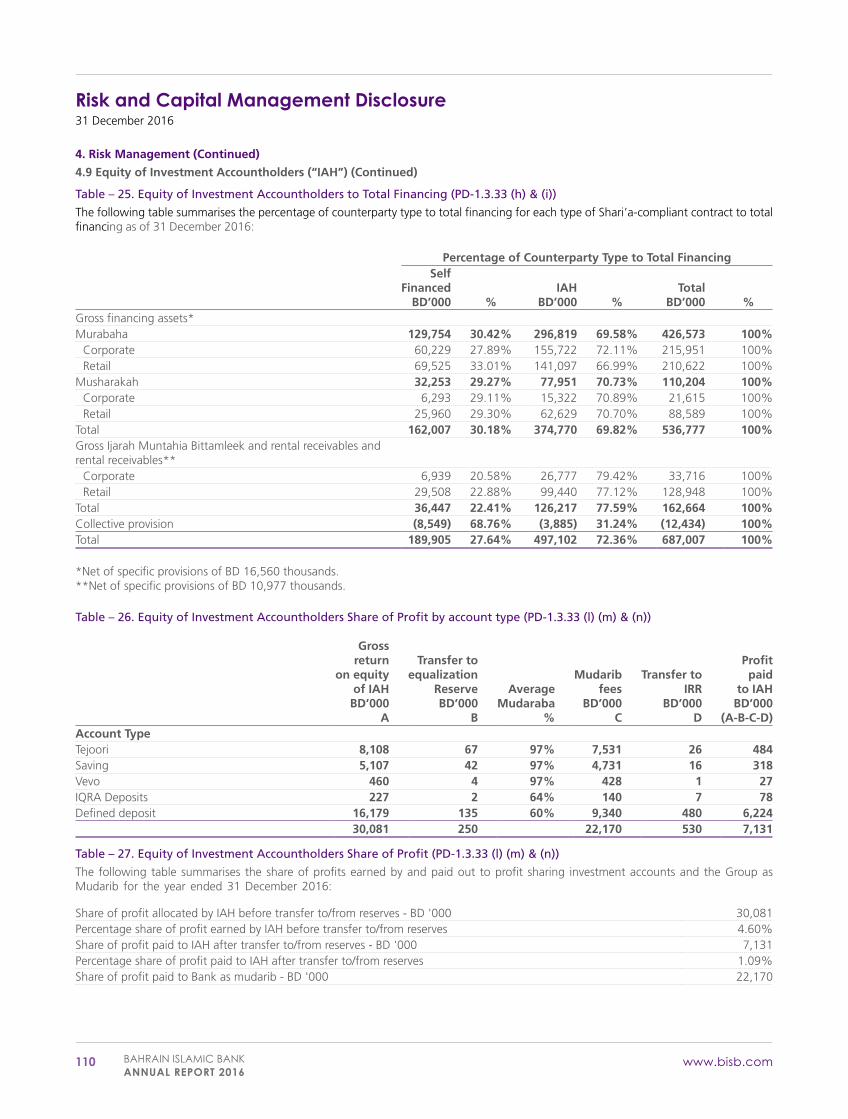
Table – 25. Equity of Investment Accountholders to Total Financing (PD-1.3.33 (h) & (i))
The following table summarises the percentage of counterparty type to total financing for each type of Shari’a-compliant contract to total financing as of 31 December 2016:
Percentage of Counterparty Type to Total FinancingSelf
FinancedBD’000 %
IAHBD’000 %
TotalBD’000 %
Gross financing assets*Murabaha 129,754 30.42% 296,819 69.58% 426,573 100%
Corporate 60,229 27.89% 155,722 72.11% 215,951 100%Retail 69,525 33.01% 141,097 66.99% 210,622 100%
Musharakah 32,253 29.27% 77,951 70.73% 110,204 100%Corporate 6,293 29.11% 15,322 70.89% 21,615 100%Retail 25,960 29.30% 62,629 70.70% 88,589 100%
Total 162,007 30.18% 374,770 69.82% 536,777 100%Gross Ijarah Muntahia Bittamleek and rental receivables and rental receivables**
Corporate 6,939 20.58% 26,777 79.42% 33,716 100%Retail 29,508 22.88% 99,440 77.12% 128,948 100%
Total 36,447 22.41% 126,217 77.59% 162,664 100%Collective provision (8,549) 68.76% (3,885) 31.24% (12,434) 100%Total 189,905 27.64% 497,102 72.36% 687,007 100%
*Net of specific provisions of BD 16,560 thousands.**Net of specific provisions of BD 10,977 thousands.
Table – 26. Equity of Investment Accountholders Share of Profit by account type (PD-1.3.33 (l) (m) & (n))
Gross return
on equityof IAH
BD’000A
Transfer toequalization
ReserveBD’000
B
AverageMudaraba
%
Mudaribfees
BD’000C
Transfer toIRR
BD’000D
Profitpaid
to IAHBD’000
(A-B-C-D)Account TypeTejoori 8,108 67 97% 7,531 26 484Saving 5,107 42 97% 4,731 16 318Vevo 460 4 97% 428 1 27IQRA Deposits 227 2 64% 140 7 78Defined deposit 16,179 135 60% 9,340 480 6,224
30,081 250 22,170 530 7,131
Table – 27. Equity of Investment Accountholders Share of Profit (PD-1.3.33 (l) (m) & (n))
The following table summarises the share of profits earned by and paid out to profit sharing investment accounts and the Group as Mudarib for the year ended 31 December 2016:
Share of profit allocated by IAH before transfer to/from reserves - BD '000 30,081Percentage share of profit earned by IAH before transfer to/from reserves 4.60%Share of profit paid to IAH after transfer to/from reserves - BD '000 7,131Percentage share of profit paid to IAH after transfer to/from reserves 1.09%Share of profit paid to Bank as mudarib - BD '000 22,170
Risk and Capital Management Disclosure31 December 2016
BAHRAIN ISLAMIC BANKANNUAL REPORT 2016
111www.bisb.com
4. Risk Management (Continued)
4.9 Equity of Investment Accountholders (“IAH”) (Continued)
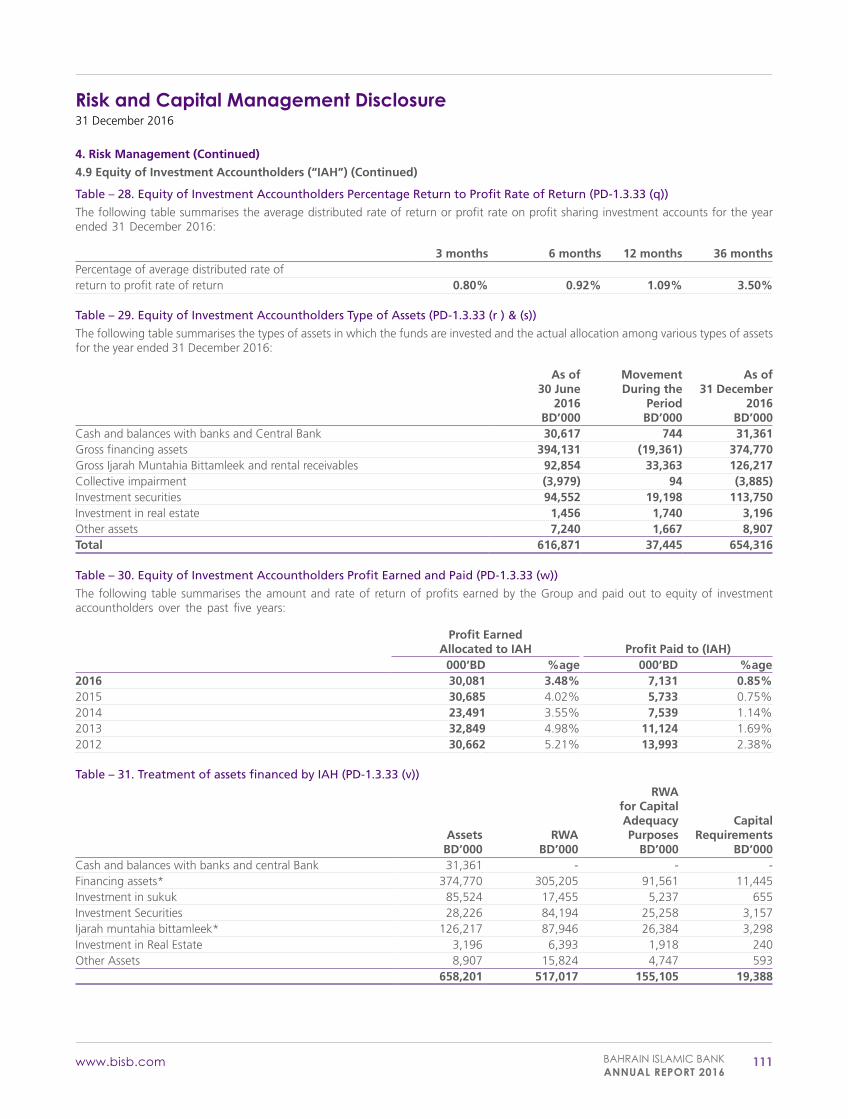
Table – 28. Equity of Investment Accountholders Percentage Return to Profit Rate of Return (PD-1.3.33 (q))
The following table summarises the average distributed rate of return or profit rate on profit sharing investment accounts for the year ended 31 December 2016:
3 months 6 months 12 months 36 monthsPercentage of average distributed rate ofreturn to profit rate of return 0.80% 0.92% 1.09% 3.50%
Table – 29. Equity of Investment Accountholders Type of Assets (PD-1.3.33 (r ) & (s))
The following table summarises the types of assets in which the funds are invested and the actual allocation among various types of assets for the year ended 31 December 2016:
As of30 June
2016BD’000
MovementDuring the
PeriodBD’000
As of31 December
2016BD’000
Cash and balances with banks and Central Bank 30,617 744 31,361Gross financing assets 394,131 (19,361) 374,770Gross Ijarah Muntahia Bittamleek and rental receivables 92,854 33,363 126,217Collective impairment (3,979) 94 (3,885)Investment securities 94,552 19,198 113,750Investment in real estate 1,456 1,740 3,196Other assets 7,240 1,667 8,907Total 616,871 37,445 654,316
Table – 30. Equity of Investment Accountholders Profit Earned and Paid (PD-1.3.33 (w))
The following table summarises the amount and rate of return of profits earned by the Group and paid out to equity of investment accountholders over the past five years:
Profit EarnedAllocated to IAH Profit Paid to (IAH)
000‘BD %age 000‘BD %age2016 30,081 3.48% 7,131 0.85%2015 30,685 4.02% 5,733 0.75%2014 23,491 3.55% 7,539 1.14%2013 32,849 4.98% 11,124 1.69%2012 30,662 5.21% 13,993 2.38%
Table – 31. Treatment of assets financed by IAH (PD-1.3.33 (v))
AssetsBD’000
RWABD’000
RWA for Capital Adequacy Purposes
BD’000
Capital Requirements
BD’000Cash and balances with banks and central Bank 31,361 - - -Financing assets* 374,770 305,205 91,561 11,445Investment in sukuk 85,524 17,455 5,237 655Investment Securities 28,226 84,194 25,258 3,157Ijarah muntahia bittamleek* 126,217 87,946 26,384 3,298Investment in Real Estate 3,196 6,393 1,918 240Other Assets 8,907 15,824 4,747 593
658,201 517,017 155,105 19,388
Risk and Capital Management Disclosure31 December 2016
112 BAHRAIN ISLAMIC BANKANNUAL REPORT 2016
www.bisb.com
4. Risk Management (Continued)
4.10 Liquidity Risk
4.10.1 IntroductionLiquidity risk is defined as “the risk that the Group will be unable to meet its obligations as they come due because of an inability to obtain adequate funding or to liquidate assets”.
4.10.2 Sources of liquidity riskThe sources of liquidity risk can broadly be categorised in the following:
a. Funding risk is the risk of not being able to fund net outflows due to unanticipated withdrawal of capital or deposits;
b. Call risk is the risk of crystallisation of a contingent liability; and
c. Event risk is the risk of rating downgrades or other negative public news leading to a loss of market confidence in the Group.
4.10.3 Bank’s funding strategyThe Board reviews the funding strategy on an annual basis and amends the existing strategy, as deemed necessary. For this purpose, all business units advise the Treasurer of their projected liquidity requirements and contributions at the start of each year as part of annual budgeting process.
The funding strategy highlights any anticipated liquidity shortfalls, the funding requirements to finance these shortfalls and their impact on the statement of financial position. The Group’s Risk Charter and Liquidity Policy address liquidity contingency plan to deal with stressed scenarios and outline an action plan that can be taken in the event of liquidity stress situation.
4.10.4 Liquidity risk strategyThe Group monitors the liquidity position by comparing maturing assets and liabilities over different time buckets of up to 1 month, 1-3 months, 3-6 months, 6 months to 1 year, 1-3 years, and over 3 years. The Group carries out stress testing periodically using the worst case scenarios to assess the effects of changes in market conditions on the liquidity of the Group. As a strategy the Group maintains a large customer base and good customer relationships.
The Treasury Department, in conjunction with Risk and Compliance Unit periodically reviews/updates (at least annually) the liquidity risk strategy which is evaluated by ALCO before presenting to the EXCOM and the Board for approval.
4.10.5 Liquidity risk measurement toolsThe Group is monitoring the liquidity risk through ALCO
4.10.6 Liquidity risk monitoringThe Group has set the tolerance for liquidity risk which are communicated to the Risk and Compliance Unit and Treasury Department. Based on these tolerances, Risk and Compliance Unit and Treasury have established appropriate risk limits that maintain the Group’s exposure within the strategic risk tolerances over a range of possible changes in liquidity situations due to cash flows in current accounts, unrestricted investment accounts and restricted investment accounts.
4.10.7 Liquidity limits structureThe Group uses a combination of different limits to ensure that liquidity is managed and controlled in an optimal manner. The Group has set the following limits for monitoring liquidity risks:
a. Liquidity Gap limits;b. Liquidity Ratio limits; andc. Minimum Liquidity Guideline (“MLG”).
4.10.8 Liquidity risk stress testingTo evaluate whether the Group is sufficiently liquid, behavior of the Group’s cash flows under different conditions are observed.
4.10.9 Contingency funding planThe Group does contingency funding exercises which details procedures to be followed by the Group, in the event of a liquidity crisis or a situation where the Group faces stressed liquidity conditions. The contingency funding plan will be an extension of day to day liquidity management and involves maintenance of an adequate amount of liquid assets and management of access to funding resources. The ALCO members discuss and monitor the situation over regular time-intervals to ensure sufficient liquidity in the Group.
Risk and Capital Management Disclosure31 December 2016
BAHRAIN ISLAMIC BANKANNUAL REPORT 2016
113www.bisb.com
4. Risk Management (Continued)
4.10 Liquidity Risk (Continued)
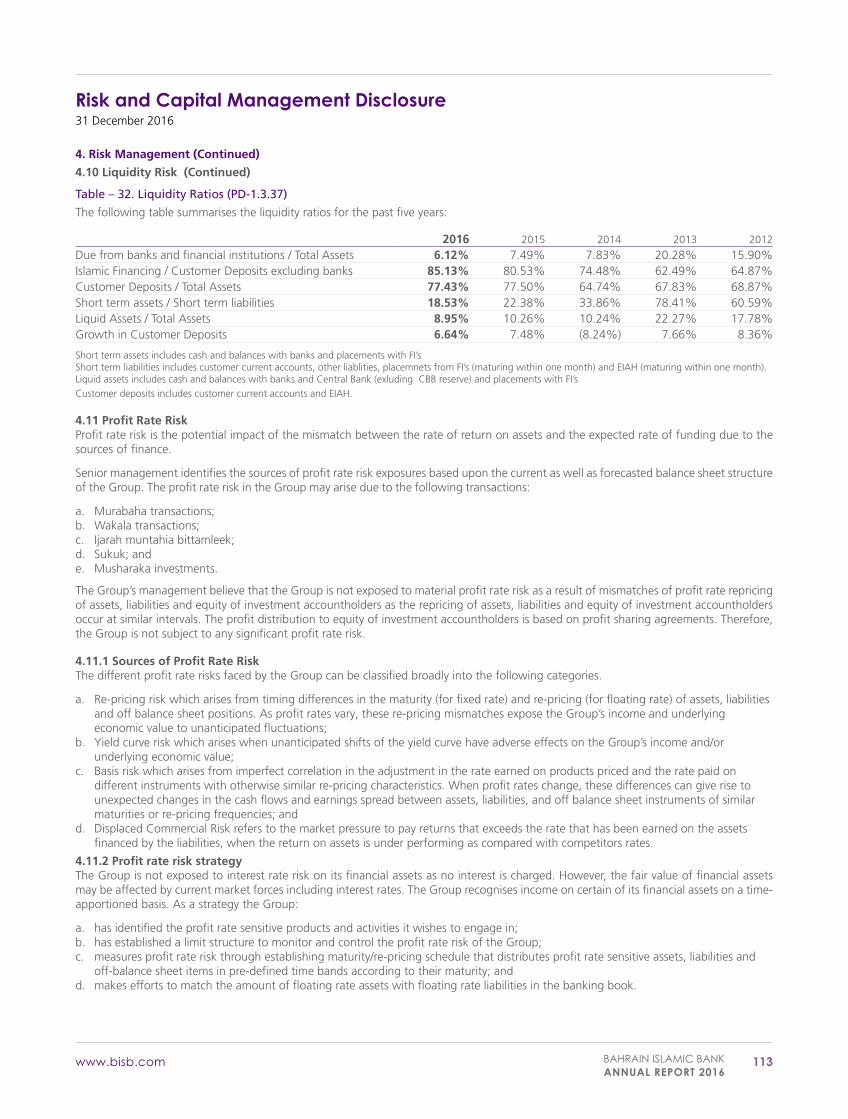
Table – 32. Liquidity Ratios (PD-1.3.37)
The following table summarises the liquidity ratios for the past five years:
2016 2015 2014 2013 2012
Due from banks and financial institutions / Total Assets 6.12% 7.49% 7.83% 20.28% 15.90%Islamic Financing / Customer Deposits excluding banks 85.13% 80.53% 74.48% 62.49% 64.87%Customer Deposits / Total Assets 77.43% 77.50% 64.74% 67.83% 68.87%Short term assets / Short term liabilities 18.53% 22.38% 33.86% 78.41% 60.59%Liquid Assets / Total Assets 8.95% 10.26% 10.24% 22.27% 17.78%Growth in Customer Deposits 6.64% 7.48% (8.24%) 7.66% 8.36%
Short term assets includes cash and balances with banks and placements with FI’sShort term liabilities includes customer current accounts, other liablities, placemnets from FI’s (maturing within one month) and EIAH (maturing within one month).Liquid assets includes cash and balances with banks and Central Bank (exluding CBB reserve) and placements with FI’sCustomer deposits includes customer current accounts and EIAH.
4.11 Profit Rate RiskProfit rate risk is the potential impact of the mismatch between the rate of return on assets and the expected rate of funding due to the sources of finance.
Senior management identifies the sources of profit rate risk exposures based upon the current as well as forecasted balance sheet structure of the Group. The profit rate risk in the Group may arise due to the following transactions:
a. Murabaha transactions;b. Wakala transactions;c. Ijarah muntahia bittamleek;d. Sukuk; ande. Musharaka investments.
The Group’s management believe that the Group is not exposed to material profit rate risk as a result of mismatches of profit rate repricing of assets, liabilities and equity of investment accountholders as the repricing of assets, liabilities and equity of investment accountholders occur at similar intervals. The profit distribution to equity of investment accountholders is based on profit sharing agreements. Therefore, the Group is not subject to any significant profit rate risk.
4.11.1 Sources of Profit Rate RiskThe different profit rate risks faced by the Group can be classified broadly into the following categories.
a. Re-pricing risk which arises from timing differences in the maturity (for fixed rate) and re-pricing (for floating rate) of assets, liabilities and off balance sheet positions. As profit rates vary, these re-pricing mismatches expose the Group’s income and underlying economic value to unanticipated fluctuations;
b. Yield curve risk which arises when unanticipated shifts of the yield curve have adverse effects on the Group’s income and/or underlying economic value;
c. Basis risk which arises from imperfect correlation in the adjustment in the rate earned on products priced and the rate paid on different instruments with otherwise similar re-pricing characteristics. When profit rates change, these differences can give rise to unexpected changes in the cash flows and earnings spread between assets, liabilities, and off balance sheet instruments of similar maturities or re-pricing frequencies; and
d. Displaced Commercial Risk refers to the market pressure to pay returns that exceeds the rate that has been earned on the assets financed by the liabilities, when the return on assets is under performing as compared with competitors rates.
4.11.2 Profit rate risk strategyThe Group is not exposed to interest rate risk on its financial assets as no interest is charged. However, the fair value of financial assets may be affected by current market forces including interest rates. The Group recognises income on certain of its financial assets on a time-apportioned basis. As a strategy the Group:
a. has identified the profit rate sensitive products and activities it wishes to engage in;b. has established a limit structure to monitor and control the profit rate risk of the Group;c. measures profit rate risk through establishing maturity/re-pricing schedule that distributes profit rate sensitive assets, liabilities and
off-balance sheet items in pre-defined time bands according to their maturity; andd. makes efforts to match the amount of floating rate assets with floating rate liabilities in the banking book.
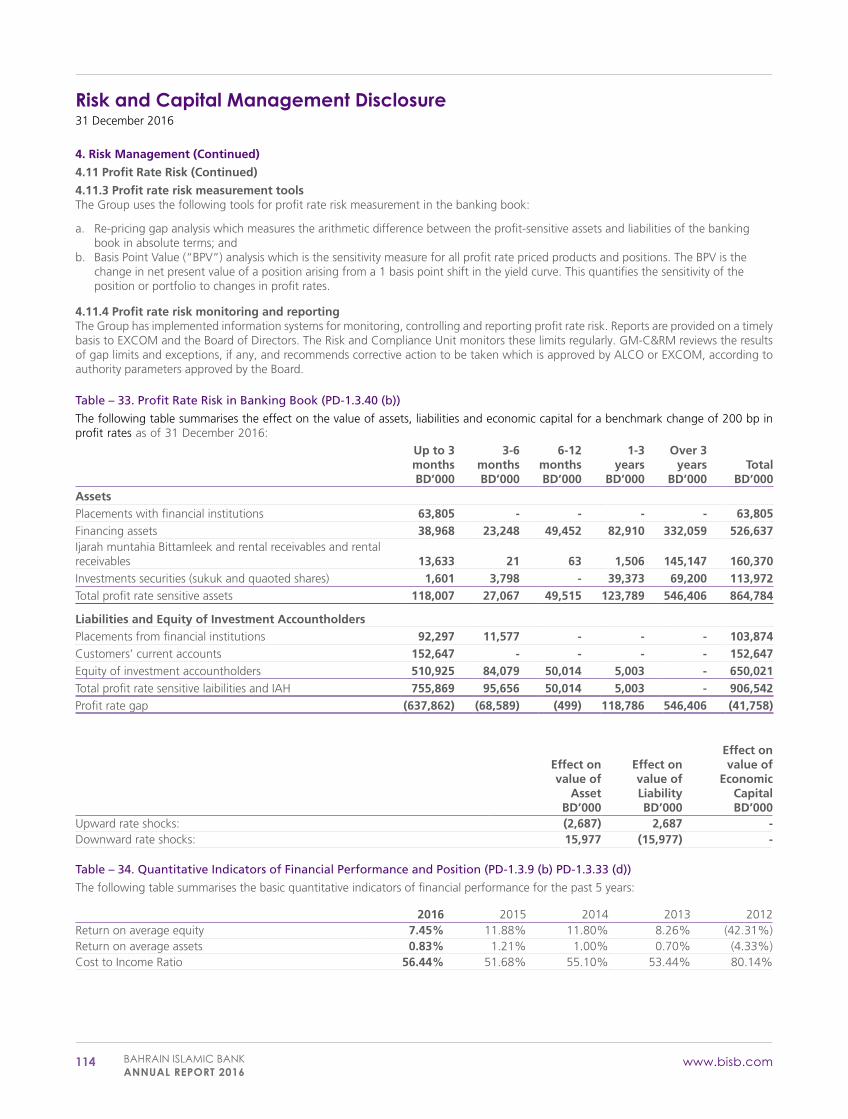
Risk and Capital Management Disclosure31 December 2016
114 BAHRAIN ISLAMIC BANKANNUAL REPORT 2016
www.bisb.com
4. Risk Management (Continued)
4.11 Profit Rate Risk (Continued)
4.11.3 Profit rate risk measurement toolsThe Group uses the following tools for profit rate risk measurement in the banking book:
a. Re-pricing gap analysis which measures the arithmetic difference between the profit-sensitive assets and liabilities of the banking book in absolute terms; and
b. Basis Point Value (“BPV”) analysis which is the sensitivity measure for all profit rate priced products and positions. The BPV is the change in net present value of a position arising from a 1 basis point shift in the yield curve. This quantifies the sensitivity of the position or portfolio to changes in profit rates.
4.11.4 Profit rate risk monitoring and reportingThe Group has implemented information systems for monitoring, controlling and reporting profit rate risk. Reports are provided on a timely basis to EXCOM and the Board of Directors. The Risk and Compliance Unit monitors these limits regularly. GM-C&RM reviews the results of gap limits and exceptions, if any, and recommends corrective action to be taken which is approved by ALCO or EXCOM, according to authority parameters approved by the Board.
Table – 33. Profit Rate Risk in Banking Book (PD-1.3.40 (b))
The following table summarises the effect on the value of assets, liabilities and economic capital for a benchmark change of 200 bp in profit rates as of 31 December 2016:
Up to 3monthsBD’000
3-6monthsBD’000
6-12monthsBD’000
1-3years
BD’000
Over 3years
BD’000Total
BD’000AssetsPlacements with financial institutions 63,805 - - - - 63,805Financing assets 38,968 23,248 49,452 82,910 332,059 526,637Ijarah muntahia Bittamleek and rental receivables and rental receivables 13,633 21 63 1,506 145,147 160,370Investments securities (sukuk and quaoted shares) 1,601 3,798 - 39,373 69,200 113,972Total profit rate sensitive assets 118,007 27,067 49,515 123,789 546,406 864,784
Liabilities and Equity of Investment AccountholdersPlacements from financial institutions 92,297 11,577 - - - 103,874Customers’ current accounts 152,647 - - - - 152,647Equity of investment accountholders 510,925 84,079 50,014 5,003 - 650,021Total profit rate sensitive laibilities and IAH 755,869 95,656 50,014 5,003 - 906,542Profit rate gap (637,862) (68,589) (499) 118,786 546,406 (41,758)
Effect onvalue of
AssetBD’000
Effect onvalue ofLiabilityBD’000
Effect onvalue of
EconomicCapitalBD’000
Upward rate shocks: (2,687) 2,687 -Downward rate shocks: 15,977 (15,977) -
Table – 34. Quantitative Indicators of Financial Performance and Position (PD-1.3.9 (b) PD-1.3.33 (d))
The following table summarises the basic quantitative indicators of financial performance for the past 5 years:
2016 2015 2014 2013 2012Return on average equity 7.45% 11.88% 11.80% 8.26% (42.31%)Return on average assets 0.83% 1.21% 1.00% 0.70% (4.33%)Cost to Income Ratio 56.44% 51.68% 55.10% 53.44% 80.14%
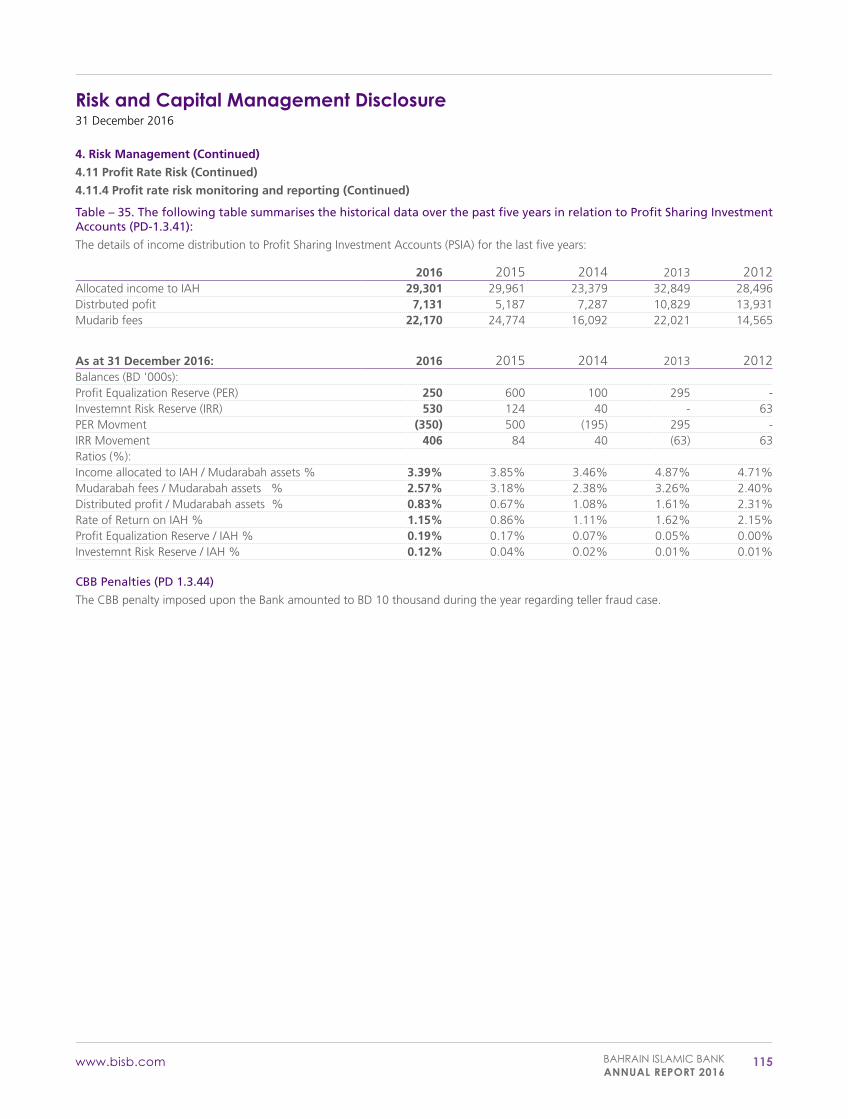
Risk and Capital Management Disclosure31 December 2016
BAHRAIN ISLAMIC BANKANNUAL REPORT 2016
115www.bisb.com
4. Risk Management (Continued)
4.11 Profit Rate Risk (Continued)
4.11.4 Profit rate risk monitoring and reporting (Continued)
Table – 35. The following table summarises the historical data over the past five years in relation to Profit Sharing Investment Accounts (PD-1.3.41):
The details of income distribution to Profit Sharing Investment Accounts (PSIA) for the last five years:
2016 2015 2014 2013 2012Allocated income to IAH 29,301 29,961 23,379 32,849 28,496Distrbuted pofit 7,131 5,187 7,287 10,829 13,931Mudarib fees 22,170 24,774 16,092 22,021 14,565
As at 31 December 2016: 2016 2015 2014 2013 2012Balances (BD '000s):Profit Equalization Reserve (PER) 250 600 100 295 -Investemnt Risk Reserve (IRR) 530 124 40 - 63PER Movment (350) 500 (195) 295 -IRR Movement 406 84 40 (63) 63Ratios (%):Income allocated to IAH / Mudarabah assets % 3.39% 3.85% 3.46% 4.87% 4.71%Mudarabah fees / Mudarabah assets % 2.57% 3.18% 2.38% 3.26% 2.40%Distributed profit / Mudarabah assets % 0.83% 0.67% 1.08% 1.61% 2.31%Rate of Return on IAH % 1.15% 0.86% 1.11% 1.62% 2.15%Profit Equalization Reserve / IAH % 0.19% 0.17% 0.07% 0.05% 0.00%Investemnt Risk Reserve / IAH % 0.12% 0.04% 0.02% 0.01% 0.01%
CBB Penalties (PD 1.3.44)
The CBB penalty imposed upon the Bank amounted to BD 10 thousand during the year regarding teller fraud case.

www.bisb.com