Embed Size (px)
Citation preview

Risk and Rates of Return

Defining and Measuring Risk
What is risk in the financial world
What are some examples of risky investments?
What security is usually considered to be a risk free investment?

Probability Distributions
Definition: A probability distribution is a listing of all possible outcomes with a probability assigned to each. The probabilities must sum to 1.00 (i.e., 100%).
Example: Write the probability distribution of a coin toss.
Outcome Probability Heads 0.5 (or 50%)
Tails 0.5 (or 50%)
Sum = 1.0 (or 100%)

Probability Distributions - cont
Which do you think is more risky?
Why?
Example: Martin Products and U. S. Electric State of the Probability Rate of Return on Stock if This State Occurs: Economy of this State (“Outcome”) Occurring Martin Products U.S. Electric Boom 0.2 110% 20% Normal 0.5 22% 16% Recession 0.3 - 60% 10%
1.0

Expected Rate of Return
The following all mean the same thing The rate of return expected to be realized from an
investment.
The mean value of the probability distribution of possible returns.
The weighted average of the outcomes, where the weights are the probabilities.
k Pr
k Pr ... k Pr k Pr k̂
ii
nn2211
n
1i
•

Expected Rate of Return - cont
Example: Martin Products and U. S. Electric State of the Probability Martin Products U.S. Electric Economy of this State Return if this Return if this (“Outcome”) Occurring State Occurs Product* State Occurs Product* Boom 0.2 110% 20% Normal 0.5 22% 16% Recession 0.3 - 60% 10%
* Product = probability in state i multiplied by return if state i occurs.
k̂ MP k̂USE
k Pr
k Pr ... k Pr k Pr k̂
ii
nn2211
n
1i

Continuous vs Discrete Probability Distributions Discrete Probability Distribution:
The number of outcomes is limited (ie finite)
Martin Products U.S. Electric Probability of Probability of Occurrence Occurrence
0.5 -- 0.5 – 0.4 -- 0.4 --
0.3 -- 0.3 –
0.2 -- 0.2 – 0.1 -- 0.1 –
-60 -45 -30 -15 0 15 30 45 60 75 90 110 -10 -5 0 5 10 15 20 25 Rate of Return Rate of Return Expected Rate Expected Rate Of Return = 15% Of Return = 15%

Continuous vs Discrete Probability Distributions - cont
Continuous Probability Distribution: The number of outcomes is unlimited (ie infinite)
Probability Density U.S. Electric Martin Products
-60 0 15 110
Rate of Return (%) Expected Rate of Return

Measuring Stand Alone Risk: The Standard Deviation
k Pr k̂ return ofrate Expected ii
n
1i
k̂ -k Deviation i
Pr Variance n
1i
22ii k̂ -k
Pr deviation Standardn
1i
22ii k̂ -k

Measuring Stand Alone Risk: The Standard Deviation
Example: Calculating Martin Products’ Standard Deviation Return in Expected Deviation Probability State i (ki) Return(k^) ki - k
^ (ki - k^)2 of State i (ki - k
^)2Pr i
110% 22% - 60%
Variance 2
deviation Standard 2
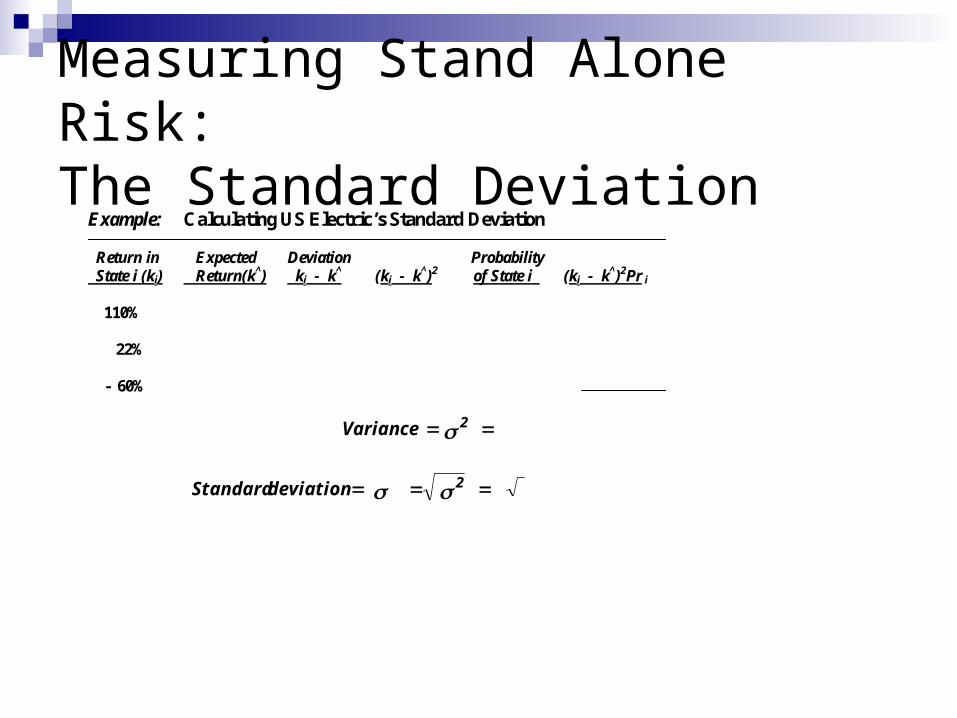
Measuring Stand Alone Risk: The Standard Deviation
Example: Calculating US Electric’s Standard Deviation Return in Expected Deviation Probability State i (ki) Return(k^) ki - k
^ (ki - k^)2 of State i (ki - k
^)2Pr i
110% 22% - 60%
Variance 2
deviation Standard 2

Comparison Distributions and Rates of Return for U.S. Electric & Biobotics:
Probability Density U.S. Electric Biobotics
0 15 35
Rate of Return
(%)
Expected Rate Expected Rate of Return of Return for U.S. Electric for Biobotics
We need a standardized measure of risk per unit of return. Coefficient of variation.

Measuring Risk - Coefficient of Variation Standardized measure of risk per unit of return Calculated as the standard deviation divided by
the expected return Useful where investments differ in risk and
expected returns
k̂
Return
Risk CV variation
oftCoefficien

Measuring Risk - Coefficient of Variation (cont)
Implications:
Example: Calculate coefficients of variation for Martin Products, U.S. Electric, and Biobotics:
Company Expected return Standard deviation CV Martin Products 15% 59.3% U.S. Electric 15% 3.6% Biobotics 35% 7.5%

Risk Aversion and Required Returns Risk-Aversion:
Most investors don’t like risk. In, other words, they’re averse to it.
Risk-averse investors require higher expected rates of return for higher-risk securities.
Exceptions:

Risk Aversion and Required Returns Risk Premium:
The portion of the expected return on an investment that can be attributed to its additional risk
The difference between the expected return of a given risky asset and that of a less risky asset (e.g., a risk-free asset such as a T-bill):
Example: You can invest $1 million in a one-year T-bill at 5% or in Biobotics stock. What’s the risk premium on Biobotics?

Portfolio Risk – Holding Combinations of Assets Portfolio - a collection of investment securities
Portfolio Returns -The expected return on a portfolio ( k^ p ) is the weighted average return of the stocks held in the portfolio.
k̂ w
k̂ w ... k̂ w k̂ w k̂
jj
nn2211p
N
1j
(Note: The sum of the wi’s has to add up to 1.00, or 100%.)

Portfolio Returns
Example: What is the expected return of a portfolio made up of:
25% Martin Products,
45% U.S. Electric, and
30% Biobotics?

Portfolio Returns - Cont How is an expected portfolio return different from
a realized portfolio return?
The realized rate of return is the return that is actually earned!
The realized return is usually different from the expected return!
k w
k w ... k w k w k return Realized
jj
nn2211p
N
1j

Return Distribution for two perfectly negatively correlated stocks
Stock W Stock M Portfolio of 50:50 W&M
25 -- 25 -- 25 -- 15 -- -------------------- 15 -- ------------------- 15 -- ---------------- 0 -- 0 -- 0 --
-10 -- -10 -- -10 --

Return Distribution for two perfectly positively correlated stocks
Stock W Stock X Portfolio of 50:50 W&X
25 -- 25 -- 25 -- 15 -- -------------------- 15 -- ------------------- 15 -- ---------------- 0 -- 0 -- 0 --
-10 -- -10 -- -10 --

Portfolio Risk
Correlation Coefficient ( r ):
A measure of the degree of relationship between 2 variables, such as the expected return of company A and the expected return of company B.
Positively correlated stocks’ rates of return tend to move in the same direction.
Negatively correlated stocks’ rates of return tend to move in opposite directions.
Perfectly correlated stocks’ rates of return move exactly together or exactly opposite.

Portfolio Risk - cont
Risk Reduction:
Combining stocks that are NOT perfectly correlated will reduce portfolio risk.
We call this diversification.
The risk of a portfolio is reduced as the number of stocks in the portfolio increases.
The lower the positive correlation of each stock we add to the portfolio, the lower the risk.

Example: Which makes a lower risk 2-stock portfolio? GM and Ford (r = 0.9) or GM and P&G (r = 0.4)
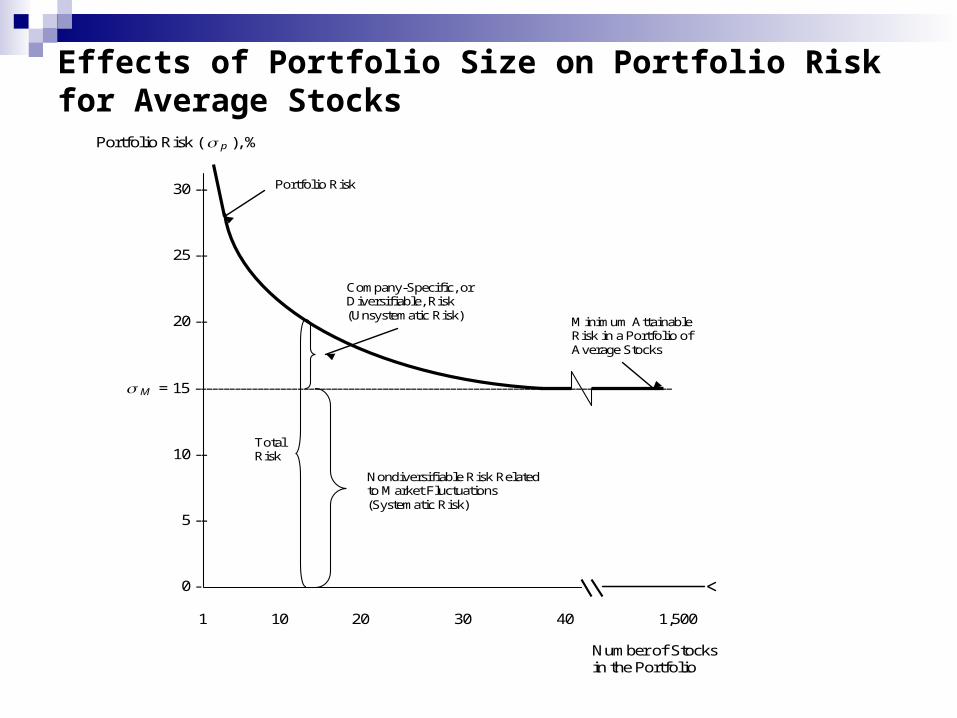
Effects of Portfolio Size on Portfolio Risk for Average Stocks
Portfolio Risk ( p ), %
30 --
25 --
20 --
M = 15 ------------------------------------------------------------------------------------
10 --
5 --
0 -
1 10 20 30 40 1,500
Company-Specific, or Diversifiable, Risk (Unsystematic Risk)
Portfolio Risk
Nondiversifiable Risk Related to Market Fluctuations (Systematic Risk)
Minimum Attainable Risk in a Portfolio of Average Stocks
Total Risk
Number of Stocks in the Portfolio

Firm Specific vs Market Risk
Firm-Specific Risk: - That part of a security’s risk associated with factors generated by events, or behaviors, specific to the firm. Examples of such firm-specific factors:
It can be eliminated by proper diversification. What do we mean by “proper”?

Firm Specific vs Market Risk (cont)
Market Risk: - That part of a security’s risk that cannot be eliminated by diversification because it is associated with economic or market factors that systematically affect most firms. Examples of such factors:

Firm Specific vs Market Risk (cont)
Investors who hold a company’s stock as part of a diversified portfolio will be willing to pay more for that stock than someone how holds only that one stock. Why?
Therefore, we say a stock’s relevant risk is that part of the stock’s risk that cannot be diversified away… i.e., its market risk.
This risk reflects the stock’s contribution to a diversified portfolio.
How can we measure this relevant risk?

The Concept of Beta
Beta Coefficient ( ):A measure of the extent to which the returns
on a given stock move with the stock market.Beta is just the coefficient of regression for a
simple linear regression of a stock’s return with the return for the stock market as a whole.

The Concept of Beta
Examples: If stock’s = 0.5, then the stock is half as
risky as the average stock. If stock’s = 1.0, then the stock is of average
stock market risk. If stock’s = 2.0, then the stock is twice as
risky as the average stock.

The Concept of Beta (cont)
The Capital Asset Pricing Model (“CAPM”):A model based on the proposition that any
stock’s required rate of return is equal to the risk-free rate of return plus a risk premium, where risk reflects diversification

Relative Volatility of Stocks H, A, and L
50 --
40 --
30 --
20 --
10 --
0 -- -20 -10 0 10 20 30
-10 --
-20 --
-30 -- -40 --
Stock H, High Risk: = 2.0
%in ) k ( jStock on Return j
%in ) k (market on theReturn M
Stock A, Average Risk: = 1.0
Stock L, Low Risk: = 0.5

Portfolio Beta Coefficients The beta of any set of securities is the
weighted average of the individual securities’ betas.
w
w ... w w
j j
n n2211p
N
1j

Portfolio Beta Coefficients
Example: What is the beta of a portfolio made up of:
25% of Stock H, 45% of Stock A, and 30% of Stock L?

The Relationship between Risk and Rates of Return The Security Market Line (SML): - The line that
shows the relationship between risk as measured by beta and the required rate of return for individual securities:
Where k j required rate of return for stock jkRF risk-free rate of return k M required rate of return for stock market
(or “average stock”) j beta for stock j
jRFMRFj kkkk

The Relationship between Risk and Rates of Return Example: Using the SML, what is the
required return for a stock that has a beta of 1.5 if T-bills yield 6% and the stock market required return is 14%?

The Security Market Line (SML): (continued)
30 --
22 --
14 __
6 --
0 --
0 0.5 1.0 1.5 2.0
jRFMRFj kk kk
(%)Return of Rate Required
Risk, j
k M =
k RF =

The Relationship between Risk and Rates of Return The Security Market Line (cont)
We also sometimes refer to the risk premium of the market ( RPM ), which is the additional return over the risk-free rate needed to compensate investors for assuming an average amount of risk,
kk RPMarketthe of Premium Risk RFMM

The Relationship between Risk and Rates of Return The Security Market Line (cont)
And to the risk premium of a stock j ( RP j ), which is the additional return over the risk-free rate needed to compensate investors for assuming stock j’s risk.
jRFMj kk RP JStock of Premium Risk

The Relationship between Risk and Rates of Return The Security Market Line (cont)
Example: Calculate the risk premium for the market and for a stock that has a beta of 1.5 if T-bills yield 6% and the stock market required return is 14%?
RP M =
RP j =

The Relationship between Risk and Rates of Return The Impact of Inflation
k j is the price of money to a riskless borrower.
The nominal rate consists of: a real (inflation-free) rate of return, and an inflation premium ( IP ).
An increase in expected inflation would increase the risk-free rate.

The Relationship between Risk and Rates of Return Changes in Risk Aversion
The slope of the SML reflects the extent to which investors are averse to risk.
An increase in risk aversion increases the risk premium and increases the slope.
The Relationship between Risk and Rates of Return Changes in a Stock’s Beta Coefficient
The beta risk of a company’s stock is affected by:
the composition of the company’s assets, its use of debt, any increased or decreased competition, expiration of patents, other…

The Security Market Line (SML): (continued)
30 --
22 --
14 __
6 --
0 --
0 0.5 1.0 1.5 2.0
1) Draw the new SML if expected inflation increases the risk-free rate.
2) Draw the new SML if investors become more risk averse. 3) Show the impact of increased competition for a company ( assume company’s
beta increases: =1.0 goes to =1.5).
jRFMRFj kk kk
(%)Return of Rate Required
Risk, j
k M =
k RF =

Some Limitations of the Beta Approach
Beta and the Capital Asset Pricing Model (CAPM): The CAPM is based on expected conditions, but we only have
historical data to use to estimate beta.
Timeframe we select for the regression of the historical data impacts our estimate of beta.
As conditions change, future volatility may differ from past volatility.
Where does our forecast of the risk-free rate ( R RF ) and the required rate of return for the market ( R m ) come from?