Embed Size (px)
Citation preview
2018 Final Report CRRP2016-03MY-Nunn
Risk and Resilience in the Pacific: Influence of Peripherality on Exposure
and Responses to Global Change
The following collaborators worked on this project:
1. Dr. Isoa Korovulavula, University of the South Pacific (The Institute of
Applied Science), Suva, Fiji, [email protected]
2. Mr. Eugene Joseph, Conservation Society of Pohnpei, Federated States of
Micronesia, [email protected]
1
Copyright © 2018 Asia-Pacific Network for Global Change Research
APN seeks to maximise discoverability and use of its knowledge and information. All publications
are made available through its online repository “APN E-Lib” (www.apn-gcr.org/resources/).
Unless otherwise indicated, APN publications may be copied, downloaded and printed for private
study, research and teaching purposes, or for use in non-commercial products or services.
Appropriate acknowledgement of APN as the source and copyright holder must be given, while
APN’s endorsement of users’ views, products or services must not be implied in any way. For
reuse requests: http://www.apn-gcr.org/?p=10807

3
Table of Contents
Project Overview ................................................................................................................... 4
1. Introduction .............................................................................................................. 15
2. Methodology ............................................................................................................. 16
3. Results & Discussion ................................................................................................ 17
4. Conclusions .............................................................................................................. 20
5. Future Directions ...................................................................................................... 21
6. References ............................................................................................................... 22
7. Appendices .............................................................................................................. 24
Appendix 1. Questionnaire ............................................................................................. 24
Appendix 2. Calculation of Indices A-C (in Bua, Fiji) ...................................................... 28
Appendix 3. Conference presentations and posters produced as a result of this project 33
Appendix 4. Funding sources outside the APN .............................................................. 35
Appendix 5. List of Young Scientists .............................................................................. 35
4
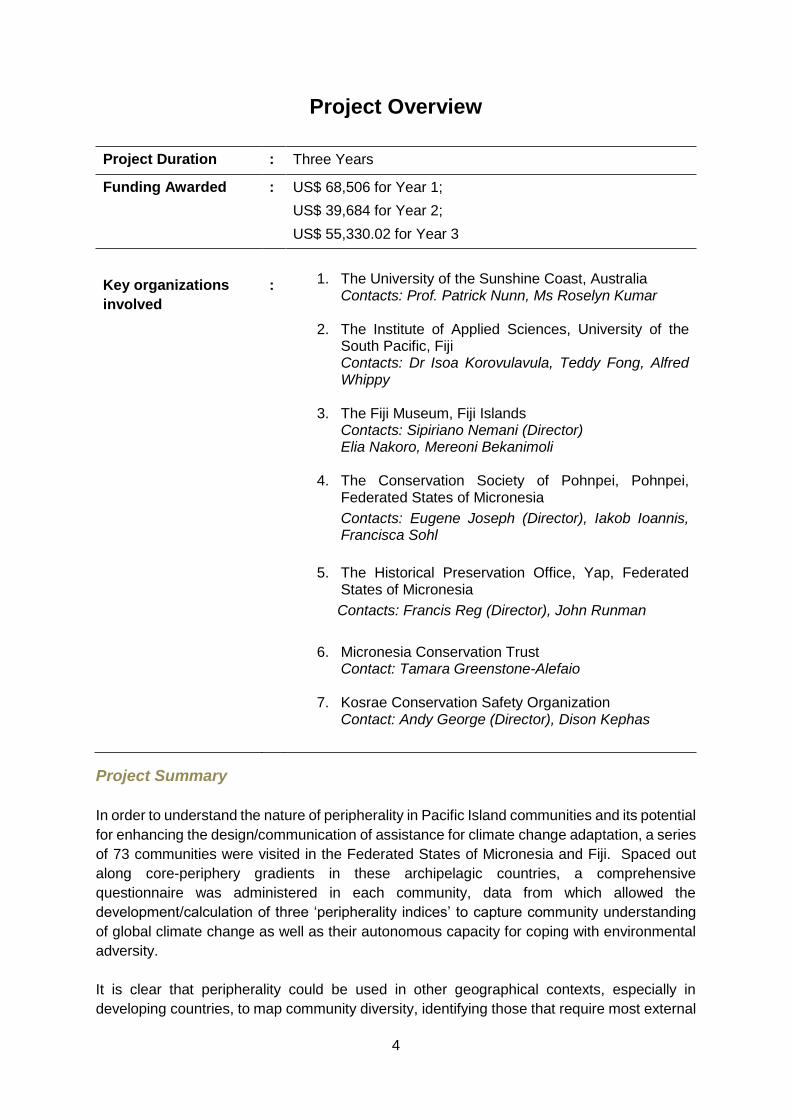
Project Overview
Project Duration : Three Years
Funding Awarded : US$ 68,506 for Year 1;
US$ 39,684 for Year 2;
US$ 55,330.02 for Year 3
Key organizations
involved
:
1. The University of the Sunshine Coast, Australia
Contacts: Prof. Patrick Nunn, Ms Roselyn Kumar
2. The Institute of Applied Sciences, University of the South Pacific, Fiji Contacts: Dr Isoa Korovulavula, Teddy Fong, Alfred Whippy
3. The Fiji Museum, Fiji Islands Contacts: Sipiriano Nemani (Director) Elia Nakoro, Mereoni Bekanimoli
4. The Conservation Society of Pohnpei, Pohnpei, Federated States of Micronesia
Contacts: Eugene Joseph (Director), Iakob Ioannis, Francisca Sohl
5. The Historical Preservation Office, Yap, Federated
States of Micronesia
Contacts: Francis Reg (Director), John Runman
6. Micronesia Conservation Trust Contact: Tamara Greenstone-Alefaio
7. Kosrae Conservation Safety Organization Contact: Andy George (Director), Dison Kephas
Project Summary
In order to understand the nature of peripherality in Pacific Island communities and its potential
for enhancing the design/communication of assistance for climate change adaptation, a series
of 73 communities were visited in the Federated States of Micronesia and Fiji. Spaced out
along core-periphery gradients in these archipelagic countries, a comprehensive
questionnaire was administered in each community, data from which allowed the
development/calculation of three ‘peripherality indices’ to capture community understanding
of global climate change as well as their autonomous capacity for coping with environmental
adversity.
It is clear that peripherality could be used in other geographical contexts, especially in
developing countries, to map community diversity, identifying those that require most external
5
assistance and those that require least. One thing became clear is how there are trends of
increasing dependency (on funding and outside assistance) in most communities for coping
with environmental adversity, including the effects of climate change. Given the likely funding
futures, this trend is dangerous, even maladaptive, and should be reversed. It is in the interest
of all actors to promote greater autonomy among such communities.
Keywords: Peripherality; climate change; traditional knowledge; autonomous coping
capacity; dependency.
Project outputs and outcomes
Project outputs
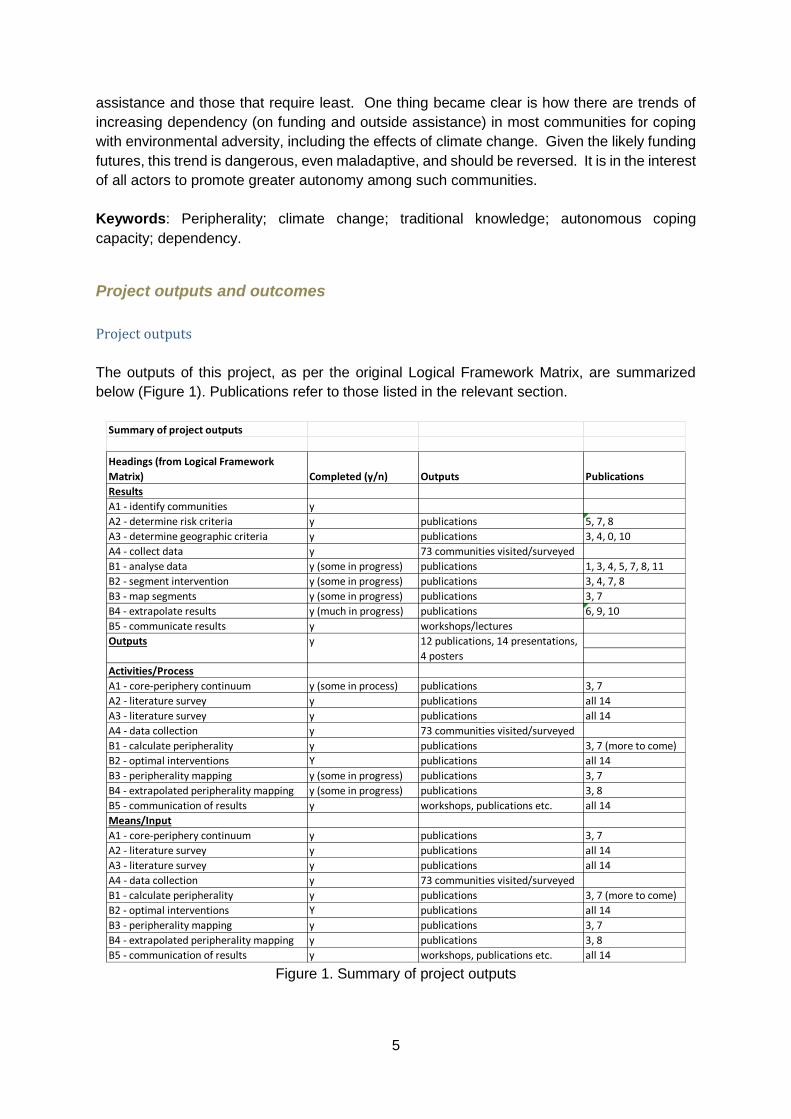
The outputs of this project, as per the original Logical Framework Matrix, are summarized
below (Figure 1). Publications refer to those listed in the relevant section.
Figure 1. Summary of project outputs
Summary of project outputs
Results
A1 - identify communities y
A2 - determine risk criteria y publications 5, 7, 8
A3 - determine geographic criteria y publications 3, 4, 0, 10
A4 - collect data y 73 communities visited/surveyed
B1 - analyse data y (some in progress) publications 1, 3, 4, 5, 7, 8, 11
B2 - segment intervention y (some in progress) publications 3, 4, 7, 8
B3 - map segments y (some in progress) publications 3, 7
B4 - extrapolate results y (much in progress) publications 6, 9, 10
B5 - communicate results y workshops/lectures
Activities/Process
A1 - core-periphery continuum y (some in process) publications 3, 7
A2 - literature survey y publications all 14
A3 - literature survey y publications all 14
A4 - data collection y 73 communities visited/surveyed
B1 - calculate peripherality y publications 3, 7 (more to come)
B2 - optimal interventions Y publications all 14
B3 - peripherality mapping y (some in progress) publications 3, 7
B4 - extrapolated peripherality mapping y (some in progress) publications 3, 8
B5 - communication of results y workshops, publications etc. all 14
Means/Input
A1 - core-periphery continuum y publications 3, 7
A2 - literature survey y publications all 14
A3 - literature survey y publications all 14
A4 - data collection y 73 communities visited/surveyed
B1 - calculate peripherality y publications 3, 7 (more to come)
B2 - optimal interventions Y publications all 14
B3 - peripherality mapping y publications 3, 7
B4 - extrapolated peripherality mapping y publications 3, 8
B5 - communication of results y workshops, publications etc. all 14
Headings (from Logical Framework
Matrix) Completed (y/n) Outputs Publications
12 publications, 14 presentations,
4 posters
Outputs y

6
All outputs were produced as intended. The main exception was that rather than 24
communities being identified, a total of 73 communities were identified to capture the diversity
of community attributes – something that was uncertain before this survey began. Gathering
data from 73 communities (from 18 islands) produced more data than expected when this
project was designed, meaning that some of the analysis and write-up is still underway. It is
expected that all this will be completed around the end of 2019.
This project has resulted in 12 publications, 14 presentations (including workshop) and four
posters. These are listed in the relevant sections and appendices below.
Specific outputs include:
An extensive socio-cultural-economic database for 73 communities in the FSM and Fiji
(see maps below).
The development of three “peripherality indices” intended to readily capture
information from individual communities that allows their degree of peripherality to be
measured (Publication 7 and Appendix 2).
The demonstration that peripherality is a good measure of (traditional) community
coping capacity, suitable for informing external interventions for climate change
adaptation in the island and in developing-country contexts that are optimally
configured to be effective and sustainable (Publications 3, 7).
The communication to a range of stakeholders of the nature and measurement (using
peripherality) of community diversity in non-urban contexts in developing-country
(specifically island-archipelagic) contexts (all Publications, but especially 1, 3, 7, 8, 9,
10, 11).
The demonstration that the loss of traditional knowledge (and community self-belief) is
anathemic to future climate-change adaptation, requiring that trends of growing
dependency on outside solutions/funding should be reversed (specifically Publications
3, 6, 12).
Project outcomes
The intention of developing an easily-usable tool for the rapid characterization of community
peripherality was achieved in this project. Through current, impending and future
communication, it is expected that this tool will become used widely to help governments,
donor agencies and other actors understand the diversity of communities in places like
archipelagic countries in the Pacific (and other developing countries in the Asia-Pacific) – and
in turn move away from the widespread “one size fits all” approach that has demonstrably
failed to produce effective or sustainable adaptation to climate change.
This project has identified the diversity of community needs for achieving optimal adaptation
to future climate change, and it is expected that the communication of project results to
governments and other agencies will result in better-aligned adaptation in the future. In
particular, several of the papers and presentations have highlighted the need to reverse trends
of decreasing self-reliance (falling resilience) and increasing dependency, especially because
it is unlikely that external funding to underwrite costs of future climate change adaptation will
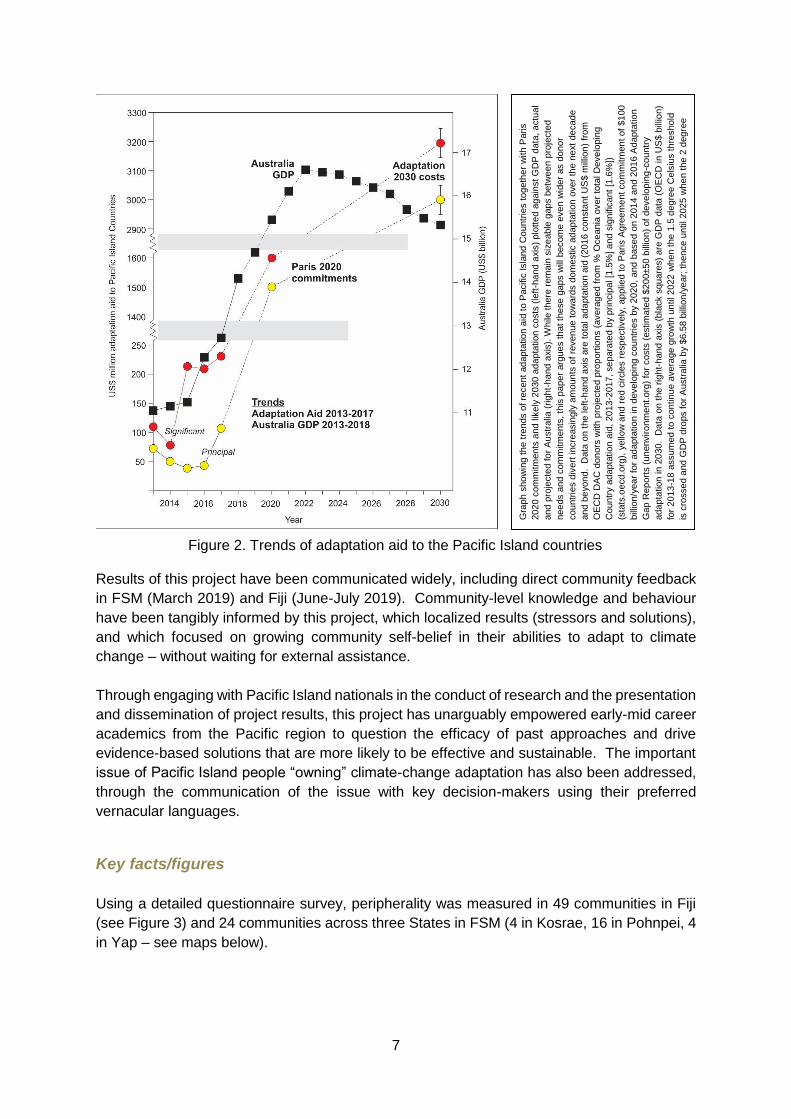
continue to increase. This point is illustrated in Figure 2, a figure from Publication 6.
7
Figure 2. Trends of adaptation aid to the Pacific Island countries
Results of this project have been communicated widely, including direct community feedback
in FSM (March 2019) and Fiji (June-July 2019). Community-level knowledge and behaviour
have been tangibly informed by this project, which localized results (stressors and solutions),
and which focused on growing community self-belief in their abilities to adapt to climate
change – without waiting for external assistance.
Through engaging with Pacific Island nationals in the conduct of research and the presentation
and dissemination of project results, this project has unarguably empowered early-mid career
academics from the Pacific region to question the efficacy of past approaches and drive
evidence-based solutions that are more likely to be effective and sustainable. The important
issue of Pacific Island people “owning” climate-change adaptation has also been addressed,
through the communication of the issue with key decision-makers using their preferred
vernacular languages.
Key facts/figures
Using a detailed questionnaire survey, peripherality was measured in 49 communities in Fiji
(see Figure 3) and 24 communities across three States in FSM (4 in Kosrae, 16 in Pohnpei, 4
in Yap – see maps below).
Gra
ph s
ho
win
g th
e t
ren
ds o
f re
cent
ad
apta
tio
n a
id t
o P
acific
Isla
nd
Co
untr
ies t
og
eth
er
with P
aris
202
0 c
om
mitm
ents
and
lik
ely
20
30 a
da
pta
tion c
osts
(le
ft-h
and a
xis
) plo
tte
d a
gain
st
GD
P d
ata
, a
ctu
al
and
pro
jecte
d fo
r A
ustr
alia
(rig
ht-
ha
nd
axis
). W
hile
there
rem
ain
siz
eable
gaps b
etw
ee
n p
roje
cte
d
nee
ds a
nd
com
mitm
ents
, th
is p
ap
er
arg
ue
s th
at th
ese g
ap
s w
ill b
ecom
e e
ven
wid
er
as d
ono
r
cou
ntr
ies d
ivert
incre
asin
gly
am
oun
ts o
f re
ven
ue t
ow
ard
s d
om
estic a
dap
tation o
ver
the n
ext
de
cad
e
and
be
yon
d.
Data
on t
he left
-hand
axis
are
to
tal ad
apta
tio
n a
id (
20
16 c
on
sta
nt
US
$ m
illio
n)
from
OE
CD
DA
C d
on
ors
with
pro
jecte
d p
rop
ort
ions (
avera
ged f
rom
% O
ce
ania
over
tota
l D
evelo
pin
g
Coun
try a
dapta
tion a
id,
20
13
-2017
, se
para
ted b
y p
rincip
al [1
.5%
] a
nd s
ignific
ant
[1.6
%])
(sta
ts.o
ecd
.org
), y
ello
w a
nd
re
d c
ircle
s r
esp
ectively
, ap
plie
d to
Pari
s A
gre
em
ent com
mitm
en
t of
$1
00
bill
ion/y
ea
r fo
r ad
apta
tio
n in
develo
pin
g c
ou
ntr
ies b
y 2
02
0,
and
base
d o
n 2
01
4 a
nd 2
01
6 A
dapta
tio
n
Gap R
ep
ort
s (
un
envir
onm
ent.
org
) fo
r costs
(estim
ate
d $
20
0±50
bill
ion)
of
develo
pin
g-c
ountr
y
ada
pta
tion
in 2
030.
Data
on t
he
rig
ht-
hand
axis
(bla
ck s
qu
are
s)
are
GD
P d
ata
(O
EC
D in U
S$ b
illio
n)
for
20
13-1
8 a
ssum
ed
to c
on
tinu
e a
ve
rage g
row
th u
ntil 2
022
wh
en t
he
1.5
deg
ree C
els
ius th
reshold
is c
rosse
d a
nd G
DP
dro
ps f
or
Austr
alia
by $
6.5
8 b
illio
n/y
ear;
th
ence u
ntil 202
5 w
he
n t
he 2
deg
ree
Cels
ius t
hre
shold
is c
rossed a
nd G
DP
dro
ps f
or
Austr
alia
by $
23.7
2 b
illio
n/y
ea
r.
8
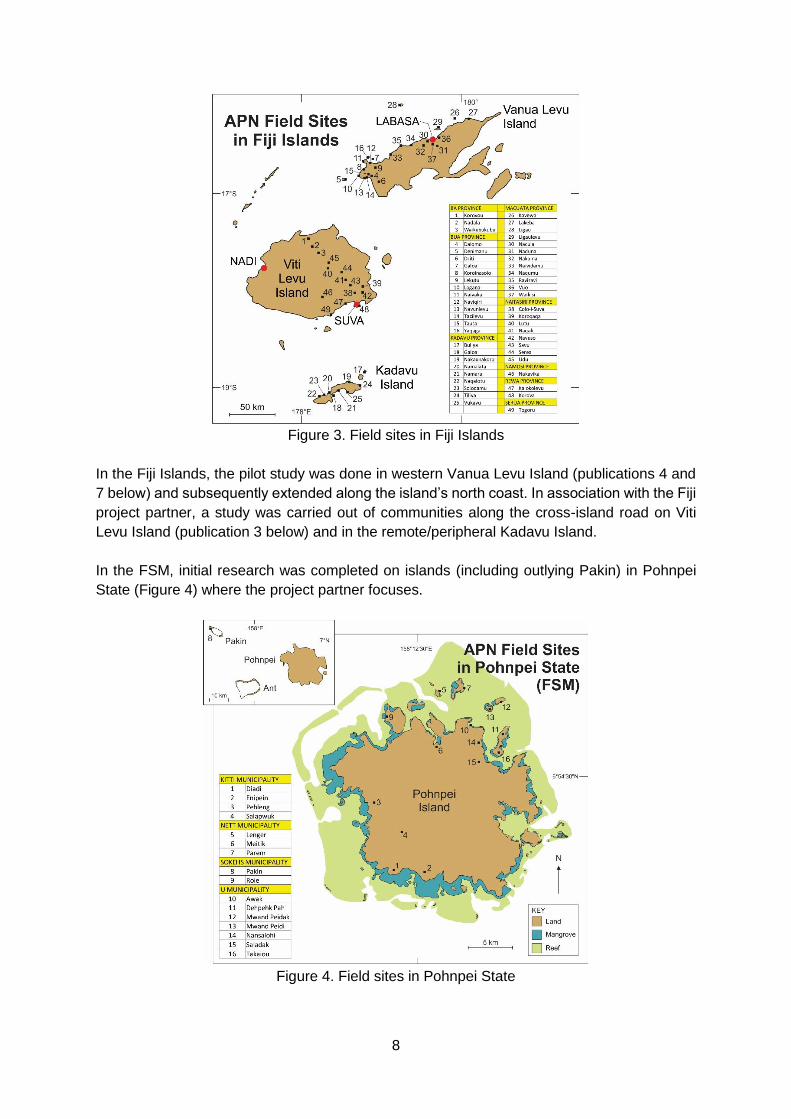
Figure 3. Field sites in Fiji Islands
In the Fiji Islands, the pilot study was done in western Vanua Levu Island (publications 4 and
7 below) and subsequently extended along the island’s north coast. In association with the Fiji
project partner, a study was carried out of communities along the cross-island road on Viti
Levu Island (publication 3 below) and in the remote/peripheral Kadavu Island.
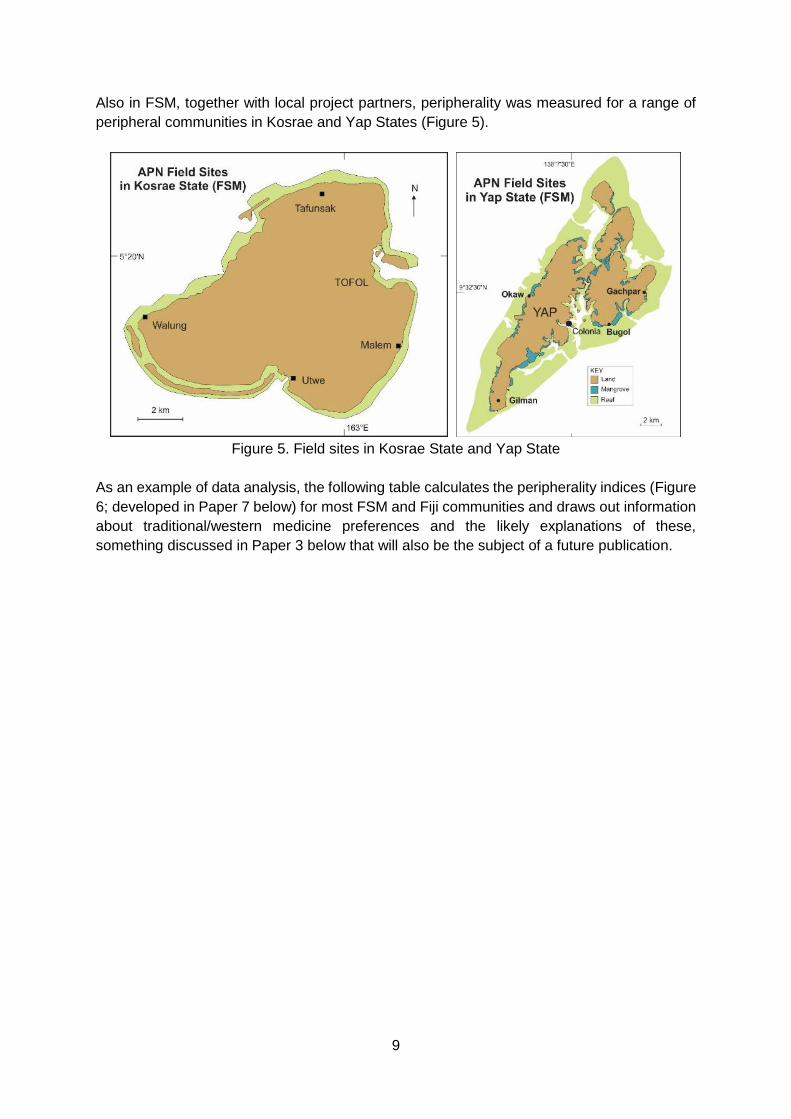
In the FSM, initial research was completed on islands (including outlying Pakin) in Pohnpei
State (Figure 4) where the project partner focuses.
Figure 4. Field sites in Pohnpei State
9
Also in FSM, together with local project partners, peripherality was measured for a range of
peripheral communities in Kosrae and Yap States (Figure 5).
Figure 5. Field sites in Kosrae State and Yap State
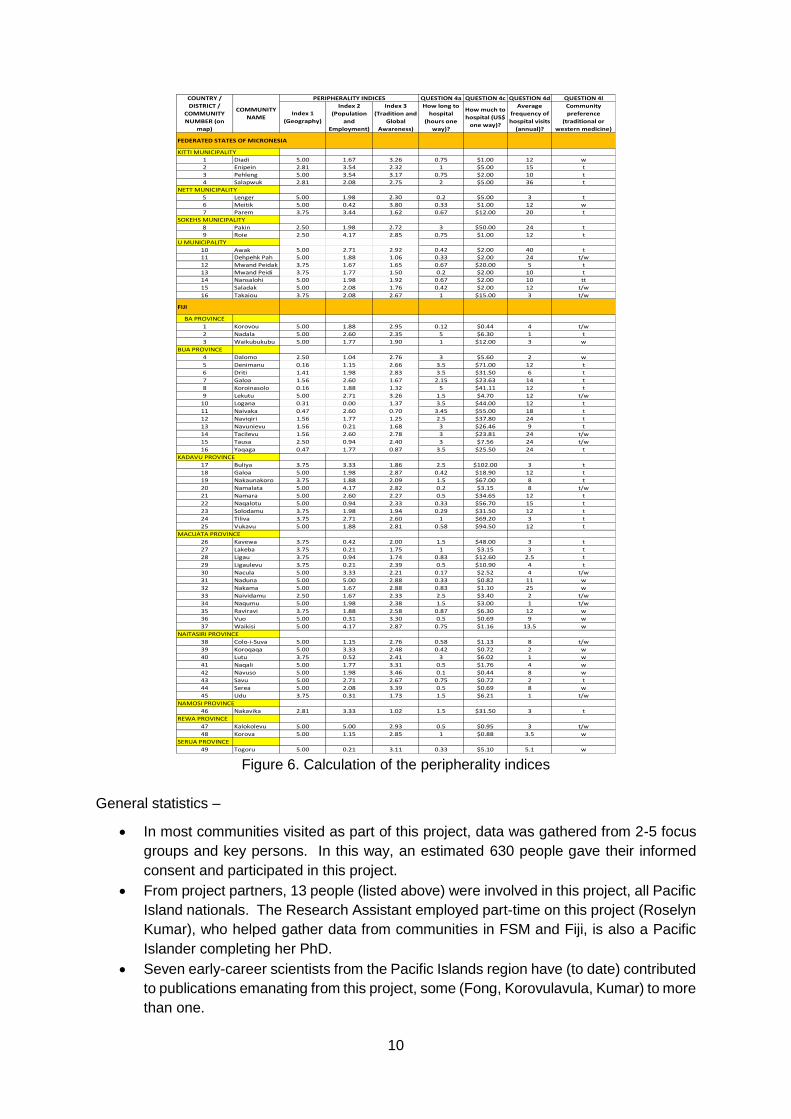
As an example of data analysis, the following table calculates the peripherality indices (Figure
6; developed in Paper 7 below) for most FSM and Fiji communities and draws out information
about traditional/western medicine preferences and the likely explanations of these,
something discussed in Paper 3 below that will also be the subject of a future publication.
10
Figure 6. Calculation of the peripherality indices
General statistics –
In most communities visited as part of this project, data was gathered from 2-5 focus
groups and key persons. In this way, an estimated 630 people gave their informed
consent and participated in this project.
From project partners, 13 people (listed above) were involved in this project, all Pacific
Island nationals. The Research Assistant employed part-time on this project (Roselyn
Kumar), who helped gather data from communities in FSM and Fiji, is also a Pacific
Islander completing her PhD.
Seven early-career scientists from the Pacific Islands region have (to date) contributed
to publications emanating from this project, some (Fong, Korovulavula, Kumar) to more
than one.
QUESTION 4a QUESTION 4c QUESTION 4d QUESTION 4l
FEDERATED STATES OF MICRONESIA
1 Diadi 5.00 1.67 3.26 0.75 $1.00 12 w
2 Enipein 2.81 3.54 2.32 1 $5.00 15 t
3 Pehleng 5.00 3.54 3.17 0.75 $2.00 10 t
4 Salapwuk 2.81 2.08 2.75 2 $5.00 36 t
5 Lenger 5.00 1.98 2.30 0.2 $5.00 3 t
6 Meitik 5.00 0.42 3.80 0.33 $1.00 12 w
7 Parem 3.75 3.44 1.62 0.67 $12.00 20 t
8 Pakin 2.50 1.98 2.72 3 $50.00 24 t
9 Roie 2.50 4.17 2.85 0.75 $1.00 12 t
10 Awak 5.00 2.71 2.92 0.42 $2.00 40 t
11 Dehpehk Pah 5.00 1.88 1.06 0.33 $2.00 24 t/w
12 Mwand Peidak 3.75 1.67 1.65 0.67 $20.00 5 t
13 Mwand Peidi 3.75 1.77 1.50 0.2 $2.00 10 t
14 Nansalohi 5.00 1.98 1.92 0.67 $2.00 10 tt
15 Saladak 5.00 2.08 1.76 0.42 $2.00 12 t/w
16 Takaiou 3.75 2.08 2.67 1 $15.00 3 t/w
BA PROVINCE
1 Korovou 5.00 1.88 2.95 0.12 $0.44 4 t/w
2 Nadala 5.00 2.60 2.35 5 $6.30 1 t
3 Waikubukubu 5.00 1.77 1.90 1 $12.00 3 w
BUA PROVINCE
4 Dalomo 2.50 1.04 2.76 3 $5.60 2 w
5 Denimanu 0.16 1.15 2.66 3.5 $71.00 12 t
6 Driti 1.41 1.98 2.83 3.5 $31.50 6 t
7 Galoa 1.56 2.60 1.67 2.15 $23.63 14 t
8 Koroinasolo 0.16 1.88 1.32 5 $41.11 12 t
9 Lekutu 5.00 2.71 3.26 1.5 $4.70 12 t/w
10 Logana 0.31 0.00 1.37 3.5 $44.00 12 t
11 Naivaka 0.47 2.60 0.70 3.45 $55.00 18 t
12 Naviqiri 1.56 1.77 1.25 2.5 $37.80 24 t
13 Navunievu 1.56 0.21 1.68 3 $26.46 9 t
14 Tacilevu 1.56 2.60 2.78 3 $23.81 24 t/w
15 Tausa 2.50 0.94 2.40 3 $7.56 24 t/w
16 Yaqaga 0.47 1.77 0.87 3.5 $25.50 24 t
KADAVU PROVINCE
17 Buliya 3.75 3.33 1.86 2.5 $102.00 3 t
18 Galoa 5.00 1.98 2.87 0.42 $18.90 12 t
19 Nakaunakoro 3.75 1.88 2.09 1.5 $67.00 8 t
20 Namalata 5.00 4.17 2.82 0.2 $3.15 8 t/w
21 Namara 5.00 2.60 2.27 0.5 $34.65 12 t
22 Naqalotu 5.00 0.94 2.33 0.33 $56.70 15 t
23 Solodamu 3.75 1.98 1.94 0.29 $31.50 12 t
24 Tiliva 3.75 2.71 2.60 1 $69.20 3 t
25 Vukavu 5.00 1.88 2.81 0.58 $94.50 12 t
MACUATA PROVINCE
26 Kavewa 3.75 0.42 2.00 1.5 $48.00 3 t
27 Lakeba 3.75 0.21 1.75 1 $3.15 3 t
28 Ligau 3.75 0.94 1.74 0.83 $12.60 2.5 t
29 Ligaulevu 3.75 0.21 2.39 0.5 $10.90 4 t
30 Nacula 5.00 3.33 2.21 0.17 $2.52 4 t/w
31 Naduna 5.00 5.00 2.88 0.33 $0.82 11 w
32 Nakama 5.00 1.67 2.88 0.83 $1.10 25 w
33 Naividamu 2.50 1.67 2.33 2.5 $3.40 2 t/w
34 Naqumu 5.00 1.98 2.38 1.5 $3.00 1 t/w
35 Raviravi 3.75 1.88 2.58 0.87 $6.30 12 w
36 Vuo 5.00 0.31 3.30 0.5 $0.69 9 w
37 Waikisi 5.00 4.17 2.87 0.75 $1.16 13.5 w
NAITASIRI PROVINCE
38 Colo-i-Suva 5.00 1.15 2.76 0.58 $1.13 8 t/w
39 Koroqaqa 5.00 3.33 2.48 0.42 $0.72 2 w
40 Lutu 3.75 0.52 2.41 3 $6.02 1 w
41 Naqali 5.00 1.77 3.31 0.5 $1.76 4 w
42 Navuso 5.00 1.98 3.46 0.1 $0.44 8 w
43 Savu 5.00 2.71 2.67 0.75 $0.72 2 t
44 Serea 5.00 2.08 3.39 0.5 $0.69 8 w
45 Udu 3.75 0.31 1.73 1.5 $6.21 1 t/w
NAMOSI PROVINCE
46 Nakavika 2.81 3.33 1.02 1.5 $31.50 3 t
REWA PROVINCE
47 Kalokolevu 5.00 5.00 2.93 0.5 $0.95 3 t/w
48 Korova 5.00 1.15 2.85 1 $0.88 3.5 w
SERUA PROVINCE
49 Togoru 5.00 0.21 3.11 0.33 $5.10 5.1 w
FIJI
COMMUNITY
NAME
How much to
hospital (US$
one way)?
Average
frequency of
hospital visits
(annual)?
How long to
hospital
(hours one
way)?
COUNTRY /
DISTRICT /
COMMUNITY
NUMBER (on
map)
PERIPHERALITY INDICES
Index 1
(Geography)
Index 2
(Population
and
Employment)
Index 3
(Tradition and
Global
Awareness)
KITTI MUNICIPALITY
NETT MUNICIPALITY
SOKEHS MUNICIPALITY
U MUNICIPALITY
Community
preference
(traditional or
western medicine)
11
Potential for further work
This project has raised many questions that merit further research, as elaborated in Section 5
below. These include
the extension of peripherality studies from the two case-study nations in the Pacific to
developing countries elsewhere;
the growing need to reverse trends of increasing dependency and replace them with
ones involving increasing (community/national) autonomy and self-belief; and
the pressing need to educate external actors (like donor agencies) about the dangers
of dependency and urge them to embrace more sustainable models of assistance for
climate-change adaptation.
Publications
This section lists the 12 publications (to date) to have resulted from this project. The names
of people directly involved in this project are underlined.
Publications
1. Fink, M., Klöck, C., Korovulavula, I., & Nunn, P. D. (in review). Community
participation, situated knowledge and climate change (mal-)adaptation in rural island
communities: evidence from artificial shoreline-protection structures in Fiji. In S.
Moncada, L. Briguglio, H. Bambrick, I. Kelman, C. Iorns, & L. Nurse (Eds.), Climate
Change and Development in Small Island Developing States. Berlin: Springer.
2. Klöck, C., & Nunn, P. D. (2019). Adaptation to climate change in Small Island
Developing States: a systematic literature review. Journal of Environment and
Development. doi:10.1177/1070496519835895
3. Korovulavula, I., Nunn, P. D., Kumar, R., & Fong, T. (in review). Peripherality as key
to understanding opportunities and needs for effective and sustainable climate-change
adaptation: a case study from Viti Levu Island, Fiji. Climate and Development.
4. Martin, P. C. M., Nunn, P. D., Leon, J., & Tindale, N. (2018). Responding to multiple
climate-linked stressors in a remote island context: the example of Yadua Island, Fiji.
Climate Risk Management, 21, 7-15. doi:10.1016/j.crm.2018.04.003
5. Nunn, P. D., & Kumar, R. (2018). Understanding climate-human interactions in Small
Island Developing States (SIDS): implications for future livelihood sustainability.
International Journal of Climate Change Strategies and Management, 10(2), 245-271.
doi:10.1108/IJCCSM-01-2017-0012
6. Nunn, P. D., & Kumar, R. (forthcoming-a). Cashless adaptation to climate change in
developing countries: unwelcome yet unavoidable? One Earth.
12
7. Nunn, P. D., & Kumar, R. (forthcoming-b). Measuring peripherality to improve and
sustain climate-change adaptation in island contexts: a case study of Bua Province,
Fiji Islands. Social Sciences.
8. Nunn, P. D., McLean, R. F., Dean, A., Fong, T., Iese, V., Katonivualiku, M., . . . Tabe,
T. (forthcoming). Adaptation to climate change: contemporary challenges and
perspectives. In L. Kumar (Ed.), Climate Change and Impacts in the South Pacific.
Berlin: Springer.
9. Nunn, P. D., & McNamara, K. E. (in review). Failing adaptation in island contexts: the
growing need for transformational change. In C. Klock & M. Fink (Eds.), Dealing with
Climate Change on Small Islands: Towards Effective and Sustainable Adaptation.
Gottingen: Gottingen University Press.
10. Piggott-McKellar, A., McNamara, K., Nunn, P. D., & Watson, J. (2019). What are the
barriers to successful community-based climate change adaptation? A review of grey
literature. Local Environment. doi:10.1080/13549839.2019.1580688
11. Piggott-McKellar, A., McNamara, K. E., Nunn, P. D., & Sekinini, S. (2019). Moving
people in a changing climate: lessons from two case studies in Fiji. Social Sciences,
8, #133. doi:10.1080/13549839.2019.1580688
12. Westoby, R., McNamara, K. E., Kumar, R., & Nunn, P. D. (in review). Is community-
led adaptation the way forward? Global Environmental Change.
Awards and honours
The proponent’s background and interests in the areas of climate change, in addition to his
recent work in this area in the Pacific as result of this APN-funded project, led to the proponent
being invited in mid-2017 to prepare a new National Climate Policy for the Government of
Fiji, which was presented to the COP23 summit in Bonn, Germany in November 2017.
The proponent’s expertise in the areas of climate change in the Pacific and numerous
publication outputs led to his nomination by the Government of the Federated States of
Micronesia, the Government of Fiji, and the Government of Australia to the 6th Assessment
Report of the Intergovernmental Panel on Climate Change in June 2018. Note especially
the role of this APN project, which focused on the Federated States of Micronesia and on Fiji.
The proponent was subsequently appointed as Lead Author on the ‘Small Islands’ chapter of
the 6th Assessment Report.
The proponent was awarded the J. P. Thomson Gold Medal of the Royal Geographical
Society of Queensland in May 2018 for his novel research linking oral histories to periods of
significant changes in the environment. The APN project provided the proponent with
opportunities to visit various communities in the Pacific to collect a range of relevant data
about traditional knowledge for coping with environmental adversity. The proponent also
presented the 2018 Thomson Oration at the Society.
13
Pull quote
“Treat Climate Change as a Challenge and not a Threat”
Professor Patrick Nunn, University of the Sunshine Coast, Proponent on the APN
Project, CRRP2016-03MY. The above quote was used by a staff member of the Fiji Museum,
Ms. Mereoni C. Bekanimoli (Field Archaeologist) at a conference in Japan. Ms. Bekanimoli
provided technical assistance to the APN project in Fiji. This quote goes to the heart of the
research conducted in this project, which is that external solutions for climate-change
adaptation are sometimes poorly designed and indifferently received (because they appear
alien) by rural Pacific Island communities which often have considerable (culturally-grounded)
knowledge for coping with environmental adversity.
Acknowledgments
The APN project would not have been successful and the results equally illuminating without
the constant support and assistance of the following;
Institutions
Conservation Society of Pohnpei (CSP)
Fiji Museum
Historical Preservation Office, Yap (HPO)
Institute of Applied Sciences, University of the South Pacific (IAS)
Kosrae Safety and Conservation Office
Micronesia Conservation Trust
Ministry of Education, Fiji
Ministry of iTaukei (Fijian) Affairs
National FSM Historic Preservation Office- Pohnpei
Provincial Offices for Bua, Kadavu, Macuata, Nadroga Rewa, Serua in Fiji
University of the Sunshine Coast (USC)
Technical Resource Personnel
Andy George (Director, Kosrae Safety and Conservation Office
Augustine Kohler, (National Historical Preservation Officer, FSM)
Dr Isoa Korovulavula (Institute of Applied Sciences, University of the Sunshine Coast)
Elia Nakoro (Manager, Archaeology, Fiji Museum)
Eugene Joseph (Director, Conservation Society of Pohnpei)
Francis Reg, (Yap State Historical Preservation Officer)
Francisca Sohl Obispo (Terrestrial Program Manager, Conservation Society of
Pohnpei)
Iakob Ioannis (Environmental Educator, Conservation Society of Pohnpei)
Kirino (Conservation Society of Pohnpei)
Losalini Makareta (Resident, Savu village)
14
Mereoni Camailakeba Bekanimoli, (Senior Archaeological Field Officer, Fiji Museum)
Tamara Greenstone-Alefaio (Conservation Program Manager, Micronesia
Conservation Trust)
Ratu Sakiusa Nagata (Chief of Gusuituva)
Communities
Fiji:
Buliya, Colo-i-Suva, Dalomo, Denimanu, Driti, Galoa (Bua), Galoa (Kadavu), Kalokolevu
Kavewa, Koroinasolo, Koroqaqa, Korova, Korovou, Lekutu, Ligau, Ligaulevu, Lutu, Nacula,
Nadala, Naduna, Nakama, Nakaunakoro/Nakasaleka, Naivaka, Nakavika, Naqali, Naqalotu,
Naqumu, Naividamu, Namalata, Namara, Naviqiri, Navunievu, Navusa, Raviravi, Savu, Serea,
Solodamu, Tacilevu, Tausa, Tiliva, Togoru, Udu, Vukavu, Vuo, Wakisi, Waikubukubu,
Yaqaga.
Federal State of Micronesia (FSM):
Pohnpei:
Awak, Depehk, Diadi, Enipein, Lenger, Meitik, Mwand Peidak, Mwand Peidi, Nansalohi, Nan-
welin-rohi, Pakin Atoll, Parem Atoll, Pehleng, Roie, Saladak, Salapwuk, Takaiou.
Yap:
Bugol, Gachpar, Gilman, Okaw
Kosrae:
Malem, Walung, Tafunsak, Utwe.
15
1. Introduction
The impacts of climate change will be felt by communities in the Pacific in different
geographical locations differently. In particular, it is imperative to understand the effects of
climate change in communities far from (peripheral) and near town centres (cores) to avoid
applying generic global interventions across all communities – the ubiquitous “one size fits all”
- that is rarely effective and sustainable (Piggott-McKellar, McNamara, Nunn, & Watson, 2019).
To ensure that external interventions address climate change issues in Pacific Island
communities, it is essential to apply meaningful localized adaptations that incorporate
traditional knowledge to cope with environmental adversities (Lebel, 2013; Mazmanian,
Jurewitz, & Nelson, 2013).
The imposition of generic/global solutions in peripheral and poorer communities may not be
as effective as expected because many stakeholders and community members may not be
aware of the science behind or convinced of the long-term success of the proposed
interventions. This is especially true where key decision-makers have insufficient science
education to evaluate the interventions. Also, it is clear that many peripheral/poorer Pacific
Island communities favour spiritual rather than science-based solutions. Therefore, there is a
need to understand societal dynamics and recognise the value and utility of traditional/local
worldviews in such communities. Such a shift seems likely to increase community ownership
of adaptation solutions that will optimize their sustainability (Granderson, 2017; Leon et al.,
2015; Nalau et al., 2018).
This study addresses global/local issues related to climate change in a range of traditional
communities in an insular developing-world context. Communities exhibit various degrees of
coping with environmental adversity depending on largely on their degree of peripherality: the
distance/time of a particular community from a globally-connected (urban) centre. As
proposed by Nunn and Kumar (2018), more-peripheral communities usually have a greater
stock of traditional knowledge and use it more often than do less-peripheral (near-core)
communities that are usually more globally exposed. This study assesses whether, as many
interventions implicitly assume, increasing global awareness is key to effective and
sustainable adaptation in such contexts or whether growing the support for local/traditional
methods of coping is at least of equal importance.
The study reported here is based on detailed surveys of 73 communities in Fiji and Federated
States of Micronesia. The methods involved in data collection from all the communities in Fiji
and FSM are described in Section 2. Section 3 describes the results and discusses how key
data can be used to assess peripherality and thereby influence interventions for climate
change in such developing-country communities. Section 4 provides concluding remarks
about the rapid large-scale assessment of peripherality that guide the development of optimal
solutions for future climate change adaptation. Section 5 explains how the results of the study
show the need for additional investigations into sustainable cash-minimised adaptations for
vulnerable communities to address future climate change.
16
2. Methodology
This section describes the steps taken to carry out the research activities.
All research permits were obtained in 2017 from the relevant state governments of Federated
States of Micronesia (FSM) and Fiji. This was necessary before any fieldwork could take place
in these two countries. It took almost one year to obtain research permits. The policies and
internal management practices of both countries were observed to obtain the permits. Once
the permits were issued, it was possible to carry out the fieldwork in Fiji and FSM.
Both research partners from FSM and Fiji have been involved with conducting fieldwork as
per the project proposal. To save time and to keep costs within budget, local assistance was
sought – with APN’s explicit approval - from the Historical Preservation Office in Yap and
Kosrae Safety and Conservation Office in Kosrae to help collect data from sample
communities.
Community-based questionnaire survey
The survey was designed after multiple consultations with the research partners about how
best to collect information on key socio-economic, education, traditional, health, diet,
components of communities to understand the vulnerability/resilience of a community
concerning its distance from a core centre.
Only those communities in areas, districts and provinces for which we had research permits
and formal permissions to interview were engaged. There was no bias in selecting the
communities other than they had to be accessible either by vehicle and/or by boat.
Each community was approached in a culturally appropriate manner to strengthen the
relationships between the various stakeholders involved and maintain cultural sensitiveness.
All data were collected through the use of a detailed set of questions about a range of topics:
population and economy; transport and infrastructure; government services and education;
health; communications and technology; culture, tradition and religion; climate, natural
disaster prediction and response; water, diet and food production (questionnaire in Appendix
1).
Data were collected from communities mostly through focus-group discussions, the preferred
and generally most effective way of gathering information in such contexts (Lata & Nunn,
2012). In most communities, more than one set of data was acquired from groups organized
by age group and gender to maximize the chances of gathering all pertinent information and
identifying all key issues. Respondents over the age of 18 were considered adults for this
project.
The interviews mostly occurred either in community halls, traditional houses, by the beach,
and mostly in front of ceremonial drinks in an informal free-flowing style to encourage
responses from all gender and age groups (over 18). This less regimented style of interviews
is effective in these contexts.
17
Each survey took approximately three to four hours to complete. All responses to the questions
were handwritten during the time of the interviews and later brought to the University of the
Sunshine Coast (USC) for analysis.
3. Results & Discussion
All raw data for Fiji and FSM were entered and stored in a large data bank (R Drive) at USC.
All primary data were analysed to calculate indices, numerical values that reflect a
community’s level of vulnerability and resilience (see Appendix 2). The indices have been
successfully used to measure peripherality of communities in both FSM and Fiji.
The indices were used to carry out the segmentation of the communities in FSM and Fiji along
a core-peripherality continuum so that this information might be used by policymakers and
stakeholders to implement appropriate and sustainable climate change intervention pathways
for communities. Three examples are given below.
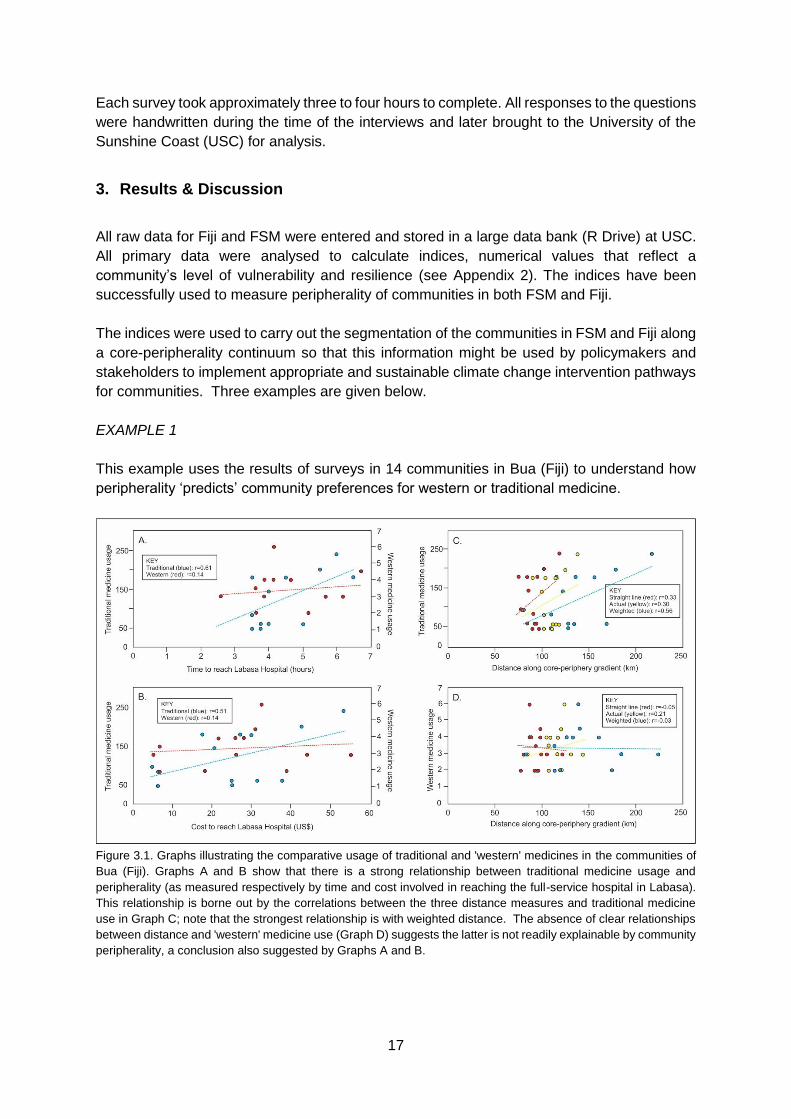
EXAMPLE 1
This example uses the results of surveys in 14 communities in Bua (Fiji) to understand how
peripherality ‘predicts’ community preferences for western or traditional medicine.
Figure 3.1. Graphs illustrating the comparative usage of traditional and 'western' medicines in the communities of
Bua (Fiji). Graphs A and B show that there is a strong relationship between traditional medicine usage and
peripherality (as measured respectively by time and cost involved in reaching the full-service hospital in Labasa).
This relationship is borne out by the correlations between the three distance measures and traditional medicine
use in Graph C; note that the strongest relationship is with weighted distance. The absence of clear relationships
between distance and 'western' medicine use (Graph D) suggests the latter is not readily explainable by community
peripherality, a conclusion also suggested by Graphs A and B.

18
EXAMPLE 2
This example considers 11 communities along the cross-island road on Viti Levu Island (Fiji)
and reports their medicine preferences as well as their autonomous coping capacity, both of
which are readily explained by peripherality.
Figure 3.2. Various data related to autonomous community coping. A: Frequency of use of traditional remedies for
various ailments (top ten). B: Frequency of use of western (non-traditional) remedies for various ailments (top ten).
C: Frequency of use of traditional disaster precursors (top ten).
EXAMPLE 3
Segmentation analysis is almost complete but is illustrated by the map below – from Bua (Fiji)
– showing peripherality segments defined by each of Peripherality Indices 1-3 (see Appendix
2).
19
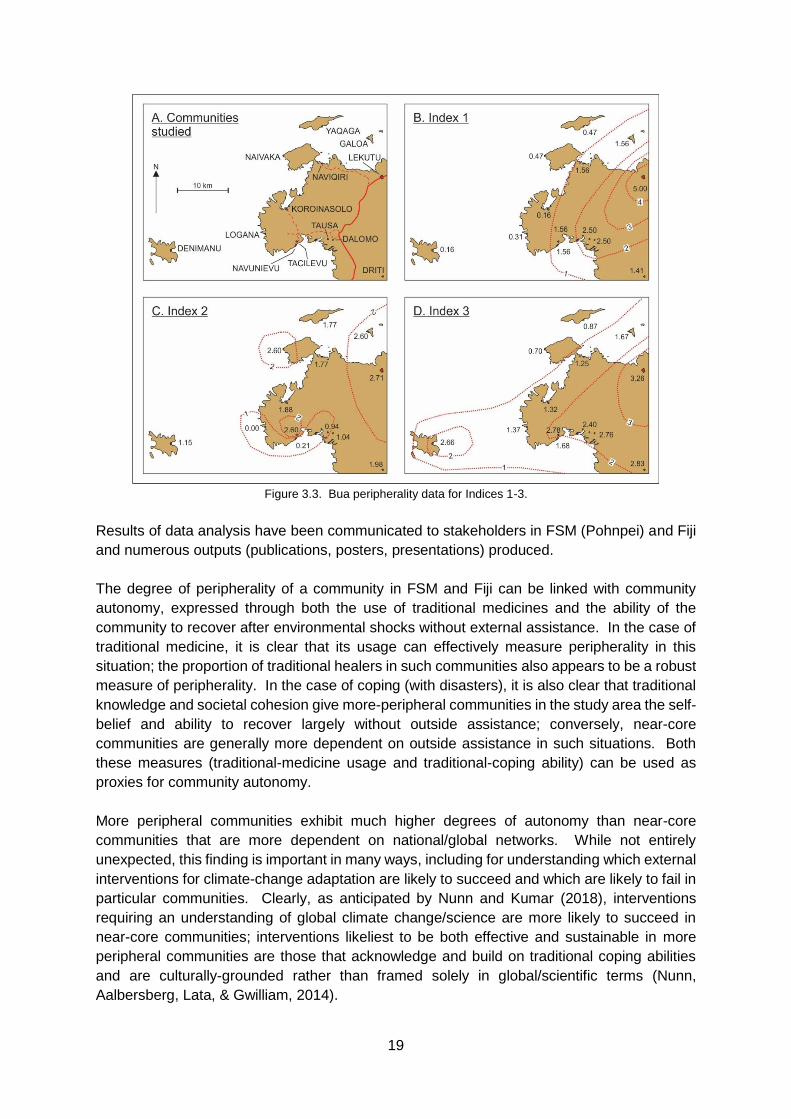
Figure 3.3. Bua peripherality data for Indices 1-3.
Results of data analysis have been communicated to stakeholders in FSM (Pohnpei) and Fiji
and numerous outputs (publications, posters, presentations) produced.
The degree of peripherality of a community in FSM and Fiji can be linked with community
autonomy, expressed through both the use of traditional medicines and the ability of the
community to recover after environmental shocks without external assistance. In the case of
traditional medicine, it is clear that its usage can effectively measure peripherality in this
situation; the proportion of traditional healers in such communities also appears to be a robust
measure of peripherality. In the case of coping (with disasters), it is also clear that traditional
knowledge and societal cohesion give more-peripheral communities in the study area the self-
belief and ability to recover largely without outside assistance; conversely, near-core
communities are generally more dependent on outside assistance in such situations. Both
these measures (traditional-medicine usage and traditional-coping ability) can be used as
proxies for community autonomy.
More peripheral communities exhibit much higher degrees of autonomy than near-core
communities that are more dependent on national/global networks. While not entirely
unexpected, this finding is important in many ways, including for understanding which external
interventions for climate-change adaptation are likely to succeed and which are likely to fail in
particular communities. Clearly, as anticipated by Nunn and Kumar (2018), interventions
requiring an understanding of global climate change/science are more likely to succeed in
near-core communities; interventions likeliest to be both effective and sustainable in more
peripheral communities are those that acknowledge and build on traditional coping abilities
and are culturally-grounded rather than framed solely in global/scientific terms (Nunn,
Aalbersberg, Lata, & Gwilliam, 2014).
20
Comparable examples have been documented elsewhere. In outer-island (peripheral)
communities in Micronesia, for example, autonomous coping capacity is greater than among
those on core islands (Monnereau & Abraham, 2013) but current climate-change impacts are
straining this capacity. In such situations, limits to autonomous coping have become clear,
particularly in the aftermath of saltwater inundation (attributable to extreme waves produced
by rising sea level). In contrast, peripherality is not the key determinant of coping ability among
Jamaican fishing communities where gender and occupation/role are of comparable
importance (Baptiste & Kinlocke, 2016). A parallel also exists in responses to climate-
associated stressors in Nairobi slums (Thorn, Thornton, & Helfgott, 2015) where (more-
peripheral) responses in the poorest areas are autonomous but in other (less-peripheral) areas
where residents are more prosperous, responses become more informed (and better-funded)
just as they are in near-core settings in island archipelagoes.
The practical nature of this research is in developing an easily-calculated and effective tool for
measuring the diversity of rural communities in island nations, especially archipelagic ones
like Fiji. The motivation for this research was the discovery that many agencies, both national
and supranational in island countries, tend to treat all rural communities as having the same
strengths and frailties, an approach that ignores community diversity of the kind explored here.
Given the long history of failed interventions for livelihood sustainability, particularly in the face
of future climate change, it was felt important that the efficacy of external investments of time
and money should be optimized. Through the calculation of tools like Indices 1-3, it is
unequivocally possible to capture the diversity of autonomous community coping capacity. In
this way, it should also be possible to design interventions that acknowledge the strengths and
weaknesses of a particular community through measurement of its peripherality.
For example, it seems clear that many of the communities that score low on Index 3 have
considerable ability to help themselves and are accustomed to doing so. Any externally-driven
approach that seeks to sideline the autonomous coping ability of such communities will
endanger their sustainability and may prove maladaptive. It is much better in such
communities for external interventions to acknowledge inherent community coping capacity
and incorporate it into their design.
4. Conclusions
This research explains how three indices that adequately capture community peripherality
were calculated in rural archipelagic contexts, something applicable to other peripheral
contexts, particularly in developing countries. This approach provides a tool for the rapid
assessment of peripherality in similar geographical situations. Among the main applications
of calculating peripherality in this way is the demonstration that the autonomous (traditional)
capacity of such rural communities to cope with environmental adversity (like climate change
or natural disasters) is something that varies. Such information could be used to inform the
design of strategies for disaster risk management or climate change adaptation rather than
making glib assumptions about all rural communities being equally unequipped to deal with
such challenges (Maru, Smith, Sparrow, Pinho, & Dube, 2014; Nunn et al., 2014).
21
As the pace of 21st-century climate change increases over the next few decades, it will become
increasingly important to devise and implement pathways for sustaining such communities in
the face of its multifarious impacts. Understanding community peripherality, its implications
for vulnerability and resilience, and all this imply permits the development of precise
(community-specific) interventions for community sustainability. In addition, as external
funding for climate-change adaptation diminishes – as appears probable as problems multiply
in donor countries – it will become increasingly important to support the autonomous coping
capacity of such rural communities by engaging with their strengths and underwriting their
frailties.
5. Future Directions
The demonstration that peripherality is a good measure of both community vulnerability and
autonomous coping capacity among rural communities in island-archipelagic contexts is
something that could be extended to other developing-country contexts, especially in the Asia-
Pacific. This could allow country/region-specific tools for the rapid assessment of community
diversity/needs to be developed. These tools could be key to future interventions for effective
and sustainable adaptation to climate change.
As a result of this project, it is also clear that the autonomous capacity of Pacific Island
communities for coping with environmental adversity has been (and is being) significantly
eroded by globalization, especially through the growing dependency of such communities on
external assistance. This is not a sustainable situation and identifies a trend (growing
dependency) that is potentially maladaptive and should be reversed for these communities to
remain viable in the next few decades. More research is needed into how to reverse this
trend, how to give rural communities in developing countries greater self-belief in their ability
to manage and cope with the effects of climate change. Key to this is something the APN
research team identified in numerous communities is the potential to reduce their dependency
(for climate-change adaptation) on money; in other words, moving towards the cash-
minimized adaptation of the kind that proved effective in pre-globalization times in many such
communities (see Publication 6 above).
Related to this is the need to educate outsiders, be they aid-donor countries or national
governments, about the dangers of the growing dependency of developing countries (and
specifically the rural communities within them) on outside assistance to cope with climate
change. The current model whereby climate-change adaptation is largely funded by outside
funding is not sustainable, especially if, as seems likely, current levels of donor funding are
likely to fall in the future. In response, rural communities in the Pacific Islands (and other
developing countries) need to acquire more autonomy (less dependency) and to tap into their
traditional knowledge to design and drive local strategies for climate change adaptation.
22
6. References
Baptiste, A. K., & Kinlocke, R. (2016). We are not all the same!: comparative climate change
vulnerabilities among fishers in Old Harbour Bay, Jamaica. Geoforum, 73, 47-59.
doi:10.1016/j.geoforum.2015.05.006
Granderson, A. A. (2017). The role of traditional knowledge in building adaptive capacity for
climate change: perspectives from Vanuatu. Weather Climate and Society, 9(3), 545-
561. doi:10.1175/wcas-d-16-0094.1
Lata, S., & Nunn, P. (2012). Misperceptions of climate-change risk as barriers to climate-
change adaptation: a case study from the Rewa Delta, Fiji. Climatic Change, 110(1-2),
169-186. doi:10.1007/s10584-011-0062-4
Lebel, L. (2013). Local knowledge and adaptation to climate change in natural resource-based
societies of the Asia-Pacific. Mitigation and Adaptation Strategies for Global Change,
18(7), 1057-1076. doi:10.1007/s11027-012-9407-1
Leon, J. X., Hardcastle, J., James, R., Albert, S., Kereseka, J., & Woodroffe, C. D. (2015).
Supporting local and traditional knowledge with science for adaptation to climate
change: lessons learned from participatory three-dimensional modeling in BoeBoe,
Solomon Islands. Coastal Management, 43(4), 424-438.
doi:10.1080/08920753.2015.1046808
Maru, Y. T., Smith, M. S., Sparrow, A., Pinho, P. F., & Dube, O. P. (2014). A linked vulnerability
and resilience framework for adaptation pathways in remote disadvantaged
communities. Global Environmental Change-Human and Policy Dimensions, 28, 337-
350. doi:10.1016/j.gloenvcha.2013.12.007
Mazmanian, D. A., Jurewitz, J., & Nelson, H. T. (2013). The paradox of "Acting Globally While
Thinking Locally": discordance in climate change adaption policy. Journal of
Environment & Development, 22(2), 186-206. doi:10.1177/1070496512471947
Monnereau, I., & Abraham, S. (2013). Limits to autonomous adaptation in response to coastal
erosion in Kosrae, Micronesia. International Journal of Global Warming, 5(4), 416-432.
doi:10.1504/ijgw.2013.057283
Nalau, J., Becken, S., Schliephack, J., Parsons, M., Brown, C., & Mackey, B. (2018). The Role
of Indigenous and Traditional Knowledge in Ecosystem-Based Adaptation: A Review
of the Literature and Case Studies from the Pacific Islands. Weather Climate and
Society, 10(4), 851-865. doi:10.1175/wcas-d-18-0032.1
Nunn, P. D., Aalbersberg, W., Lata, S., & Gwilliam, M. (2014). Beyond the core: community
governance for climate-change adaptation in peripheral parts of Pacific Island
Countries. Regional Environmental Change, 14(1), 221-235. doi:10.1007/s10113-013-
0486-7
23
Nunn, P. D., & Kumar, R. (2018). Understanding climate-human interactions in Small Island
Developing States (SIDS): implications for future livelihood sustainability. International
Journal of Climate Change Strategies and Management, 10(2), 245-271.
doi:10.1108/IJCCSM-01-2017-0012
Piggott-McKellar, A., McNamara, K., Nunn, P. D., & Watson, J. (2019). What are the barriers
to successful community-based climate change adaptation? A review of grey literature.
Local Environment. doi:10.1080/13549839.2019.1580688
Thorn, J., Thornton, T. F., & Helfgott, A. (2015). Autonomous adaptation to global
environmental change in peri-urban settlements: Evidence of a growing culture of
innovation and revitalisation in Mathare Valley Slums, Nairobi. Global Environmental
Change-Human and Policy Dimensions, 31, 121-131.
doi:10.1016/j.gloenvcha.2014.12.009

24
7. Appendices
Appendix 1. Questionnaire
Name of Community:
Island/Province/Country:
Date when the information was collected (and name of interviewer):
Name(s) and Gender of Key Informants:
Languages used in Interview
1 Population and Economy
a How many people live in this community?
b How many households are there?
c How many people under 21 are normally resident in this community?
d How many people over 65 are normally resident in this community?
e How many people are in in full-time employment at present?
f How many people are in casual/seasonal employment?
g What is the average household income (in US dollars) in this community?
2 Transport and Infrastructure
a What are the three most common types of transport used by people in this community?
b How much does it cost (US$) a person to travel (one way) from their home to the nearest
town (see definition below) by the cheapest route?
c How long (hours) does it take a person to travel from their home (one way) to the nearest
town by the cheapest route?
d Does the community have any motor vehicles? If yes, what kind and how many of each
kind?
e How many households in the community have electricity?
f How is this electricity supplied (what are the sources of electricity)?
g How many solar panels are there in the community?
3 Government Services and Education
a How many people in this community attend primary school?
b Do primary school students go to school and come home every day - or every week - or
longer?
c How many people in this community attend secondary school?
d Do secondary school students go to school and come home every day - or every week -
or longer?
e How many people staying in this community have completed high school/secondary
education?
f How many people from this community attend tertiary institutions
(vocational/college/university)?
g Do tertiary students go to college and come home every day - or every week - or longer?
h How many people staying in this community have completed a program of tertiary study?
i How much does it cost (US$) one student to travel to primary school and back?
j How long does it take (hours) one student to travel to primary school and back?
k How much does it cost (US$) one student to travel to secondary school and back?

25
l How long does it take (hours) one student to travel to secondary school and back?
m Which government departments have offices within 30 minutes walk of the community
4 Health
a How long (hours) does it take to reach the closest hospital (defined as a place where
surgery can be performed)?
b How do you get to this hospital (what means of transport do you use)?
c How much does it cost (US$) to reach this hospital (one way)?
d How many times each year does a typical member of an average household in this
community visit this hospital?
e How long (hours) does it take to reach the closest medical post (nursing station,
dispensary)?
f How do you get there (means of transport)?
g Can the community access an ambulance service?
h If there is a medical emergency, how does the patient get medical treatment in the main
hospital by a doctor?
i Do people in this community use traditional (non-western) medicines commonly or rarely
(including not at all)?
j What are the main uses for traditional medicines in this community?
k Does the community have any traditional healers? If yes, how many?
l Which does your community mostly prefer, western or traditional medicine?
m Which ailments or diseases do people in the community prefer to treat using western
medicine?
n How many times each month does a typical member of an average household in the
community use traditional medicine?
5 Communications and Technology
a How many televisions are there in the community?
b Is the television signal reliable and the reception quality good?
c How many television channels can the community receive well?
d How many mobile phones are there in the community?
e Do people have reliable phone reception?
f What sources of information do most people in the community use to find out what is
happening on other islands and overseas?
g How many people access internet services in the community?
h What do people in this community use to access internet?
i Do people in the community use Facebook, Facebook messenger, Twitter, Viber and
Instagram?
j Which social platform do people in this community use most?
k Is there a (working) radiotelephone (RT) or similar in the community?
6 Culture, Tradition and Religion
a How many different religions are followed by people in this community?
b How many churches/temples are there in or close to this community that serve its
members?
c What are the most common types of equipment that community members use to garden
or farm?
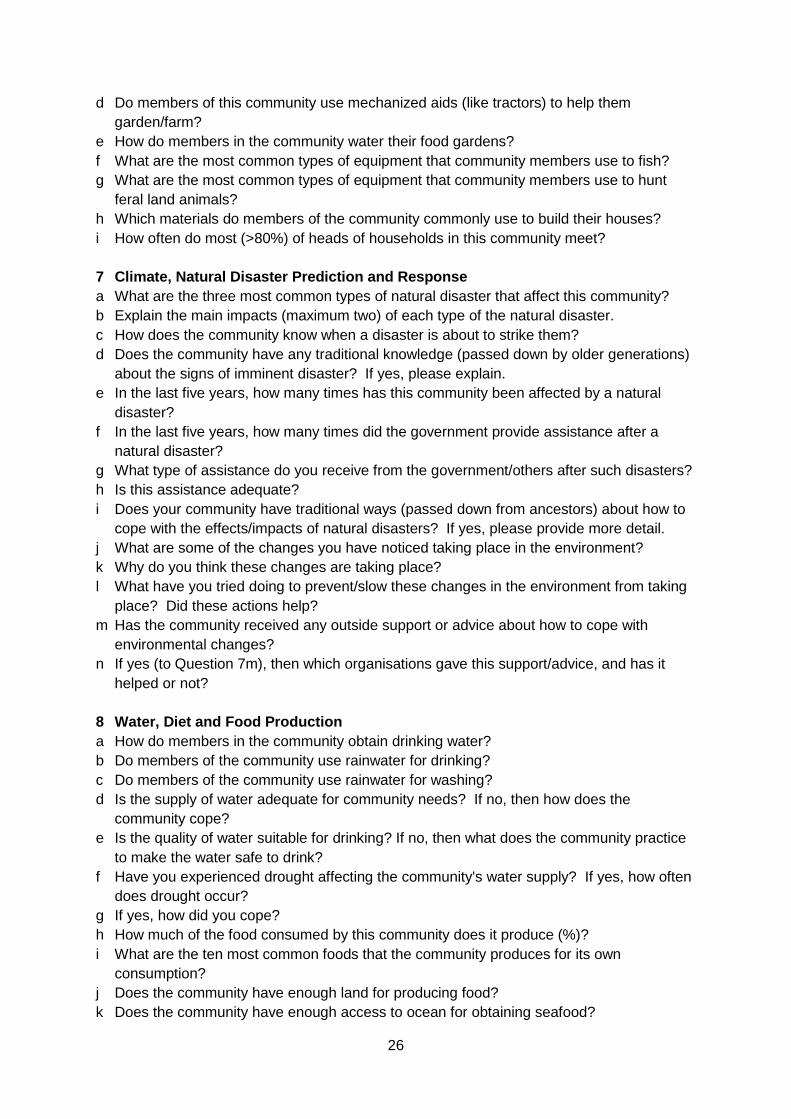
26
d Do members of this community use mechanized aids (like tractors) to help them
garden/farm?
e How do members in the community water their food gardens?
f What are the most common types of equipment that community members use to fish?
g What are the most common types of equipment that community members use to hunt
feral land animals?
h Which materials do members of the community commonly use to build their houses?
i How often do most (>80%) of heads of households in this community meet?
7 Climate, Natural Disaster Prediction and Response
a What are the three most common types of natural disaster that affect this community?
b Explain the main impacts (maximum two) of each type of the natural disaster.
c How does the community know when a disaster is about to strike them?
d Does the community have any traditional knowledge (passed down by older generations)
about the signs of imminent disaster? If yes, please explain.
e In the last five years, how many times has this community been affected by a natural
disaster?
f In the last five years, how many times did the government provide assistance after a
natural disaster?
g What type of assistance do you receive from the government/others after such disasters?
h Is this assistance adequate?
i Does your community have traditional ways (passed down from ancestors) about how to
cope with the effects/impacts of natural disasters? If yes, please provide more detail.
j What are some of the changes you have noticed taking place in the environment?
k Why do you think these changes are taking place?
l What have you tried doing to prevent/slow these changes in the environment from taking
place? Did these actions help?
m Has the community received any outside support or advice about how to cope with
environmental changes?
n If yes (to Question 7m), then which organisations gave this support/advice, and has it
helped or not?
8 Water, Diet and Food Production
a How do members in the community obtain drinking water?
b Do members of the community use rainwater for drinking?
c Do members of the community use rainwater for washing?
d Is the supply of water adequate for community needs? If no, then how does the
community cope?
e Is the quality of water suitable for drinking? If no, then what does the community practice
to make the water safe to drink?
f Have you experienced drought affecting the community's water supply? If yes, how often
does drought occur?
g If yes, how did you cope?
h How much of the food consumed by this community does it produce (%)?
i What are the ten most common foods that the community produces for its own
consumption?
j Does the community have enough land for producing food?
k Does the community have enough access to ocean for obtaining seafood?

27
l How many shops are there within 30 minutes walk of this community?
m What are the five most common items the community purchases from these shops?
n How much does each of these five items cost (per unit) in these shops?
o How many times each week does the average household in the community buy food from
the shops?
p In one week for an average household, how many meals (from 21 meals per week) are
eaten with mainly food from the garden or sea?
q In one week, does the average household eat more shop-bought food than food they get
by themselves from the land and sea?
28
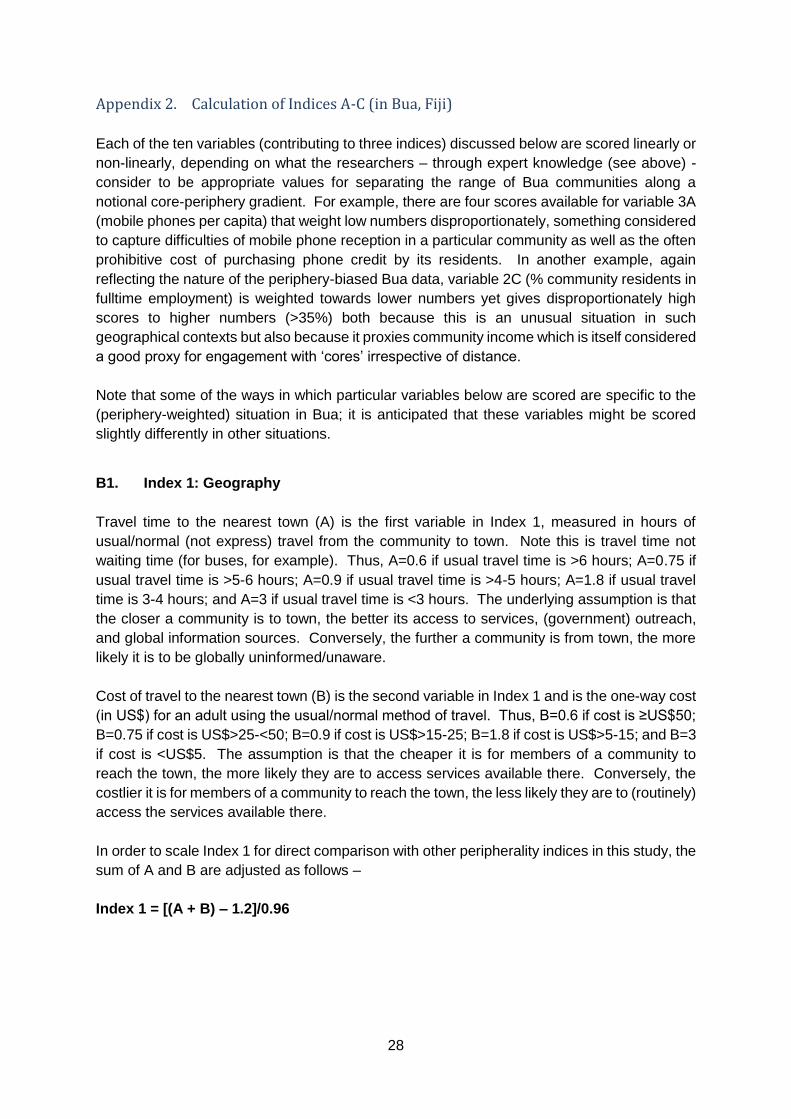
Appendix 2. Calculation of Indices A-C (in Bua, Fiji)
Each of the ten variables (contributing to three indices) discussed below are scored linearly or
non-linearly, depending on what the researchers – through expert knowledge (see above) -
consider to be appropriate values for separating the range of Bua communities along a
notional core-periphery gradient. For example, there are four scores available for variable 3A
(mobile phones per capita) that weight low numbers disproportionately, something considered
to capture difficulties of mobile phone reception in a particular community as well as the often
prohibitive cost of purchasing phone credit by its residents. In another example, again
reflecting the nature of the periphery-biased Bua data, variable 2C (% community residents in
fulltime employment) is weighted towards lower numbers yet gives disproportionately high
scores to higher numbers (>35%) both because this is an unusual situation in such
geographical contexts but also because it proxies community income which is itself considered
a good proxy for engagement with ‘cores’ irrespective of distance.
Note that some of the ways in which particular variables below are scored are specific to the
(periphery-weighted) situation in Bua; it is anticipated that these variables might be scored
slightly differently in other situations.
B1. Index 1: Geography
Travel time to the nearest town (A) is the first variable in Index 1, measured in hours of
usual/normal (not express) travel from the community to town. Note this is travel time not
waiting time (for buses, for example). Thus, A=0.6 if usual travel time is >6 hours; A=0.75 if
usual travel time is >5-6 hours; A=0.9 if usual travel time is >4-5 hours; A=1.8 if usual travel
time is 3-4 hours; and A=3 if usual travel time is <3 hours. The underlying assumption is that
the closer a community is to town, the better its access to services, (government) outreach,
and global information sources. Conversely, the further a community is from town, the more
likely it is to be globally uninformed/unaware.
Cost of travel to the nearest town (B) is the second variable in Index 1 and is the one-way cost
(in US$) for an adult using the usual/normal method of travel. Thus, B=0.6 if cost is ≥US$50;
B=0.75 if cost is US$>25-<50; B=0.9 if cost is US$>15-25; B=1.8 if cost is US$>5-15; and B=3
if cost is <US$5. The assumption is that the cheaper it is for members of a community to
reach the town, the more likely they are to access services available there. Conversely, the
costlier it is for members of a community to reach the town, the less likely they are to (routinely)
access the services available there.
In order to scale Index 1 for direct comparison with other peripherality indices in this study, the
sum of A and B are adjusted as follows –
Index 1 = [(A + B) – 1.2]/0.96
29
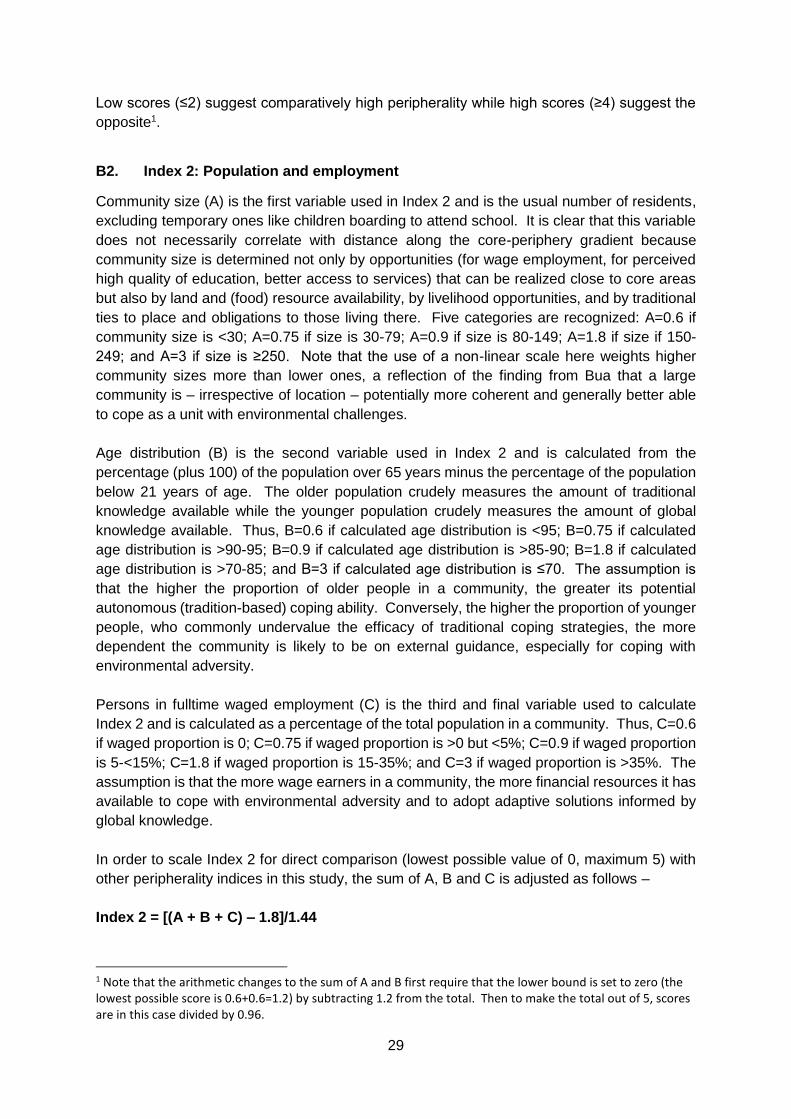
Low scores (≤2) suggest comparatively high peripherality while high scores (≥4) suggest the
opposite1.
B2. Index 2: Population and employment
Community size (A) is the first variable used in Index 2 and is the usual number of residents,
excluding temporary ones like children boarding to attend school. It is clear that this variable
does not necessarily correlate with distance along the core-periphery gradient because
community size is determined not only by opportunities (for wage employment, for perceived
high quality of education, better access to services) that can be realized close to core areas
but also by land and (food) resource availability, by livelihood opportunities, and by traditional
ties to place and obligations to those living there. Five categories are recognized: A=0.6 if
community size is <30; A=0.75 if size is 30-79; A=0.9 if size is 80-149; A=1.8 if size if 150-
249; and A=3 if size is ≥250. Note that the use of a non-linear scale here weights higher
community sizes more than lower ones, a reflection of the finding from Bua that a large
community is – irrespective of location – potentially more coherent and generally better able
to cope as a unit with environmental challenges.
Age distribution (B) is the second variable used in Index 2 and is calculated from the
percentage (plus 100) of the population over 65 years minus the percentage of the population
below 21 years of age. The older population crudely measures the amount of traditional
knowledge available while the younger population crudely measures the amount of global
knowledge available. Thus, B=0.6 if calculated age distribution is <95; B=0.75 if calculated
age distribution is >90-95; B=0.9 if calculated age distribution is >85-90; B=1.8 if calculated
age distribution is >70-85; and B=3 if calculated age distribution is ≤70. The assumption is
that the higher the proportion of older people in a community, the greater its potential
autonomous (tradition-based) coping ability. Conversely, the higher the proportion of younger
people, who commonly undervalue the efficacy of traditional coping strategies, the more
dependent the community is likely to be on external guidance, especially for coping with
environmental adversity.
Persons in fulltime waged employment (C) is the third and final variable used to calculate
Index 2 and is calculated as a percentage of the total population in a community. Thus, C=0.6
if waged proportion is 0; C=0.75 if waged proportion is >0 but <5%; C=0.9 if waged proportion
is 5-<15%; C=1.8 if waged proportion is 15-35%; and C=3 if waged proportion is >35%. The
assumption is that the more wage earners in a community, the more financial resources it has
available to cope with environmental adversity and to adopt adaptive solutions informed by
global knowledge.
In order to scale Index 2 for direct comparison (lowest possible value of 0, maximum 5) with
other peripherality indices in this study, the sum of A, B and C is adjusted as follows –
Index 2 = [(A + B + C) – 1.8]/1.44
1 Note that the arithmetic changes to the sum of A and B first require that the lower bound is set to zero (the lowest possible score is 0.6+0.6=1.2) by subtracting 1.2 from the total. Then to make the total out of 5, scores are in this case divided by 0.96.
30
Low scores (≤2) suggest comparatively high peripherality while high scores (≥4) suggest the
opposite2.
B3. Index 3: Tradition and global awareness
Mobile phones per capita (A) is the first variable used to calculate Index 3. Thus, A=1.5 if
mobile phones per capita is <20%; A=1.8 if mobile phones per capita is >20-<30%; A=2.2 if
mobile phones per capita is >30-<50%; and A=3 if mobile phones per capita is ≥50%. The
assumption is that the more (routinely functional) mobile phones in a community, the more
globally exposed it is – and thus more potentially able to access global knowledge for coping
with environmental adversity. The fewer the mobile phones in a community, the less globally
exposed it is expected to be – and therefore less informed about non-traditional ways for
coping with environmental adversity.
The use of western versus traditional health solutions (B) is the second variable used to
calculate Index 3 and is measured by answers to three questions (B1-B3) about preferences,
uses, and the number of (traditional) healers in a community. Thus, B1=1 if people prefer
traditional over western medicine; or B1=2 if people prefer western over traditional medicine.
Then B2=1 if people frequently/routinely use traditional medicines; or B2=2 if people
rarely/never use traditional medicines. Then B3=1 if the community has resident traditional
healers, or B3=2 if the community does not have traditional healers.
Thus,
B = (B1 + B2 + B3)/2
The assumption is that greater the use of traditional medicines and the existence of people
practised in their use, the more traditional knowledge the community is likely to have,
knowledge that probably extends to other aspects of community life and is, therefore, a
measure of traditional community resilience.
The nature of coping with natural disasters (C) is the third variable used to calculate Index 3
and is measured by answers to four questions (C1-C4) about the traditional knowledge of
disaster precursors, post-disaster external/government support, traditional coping, and the
use of outside advice/support. Thus, C1=1 if people have meaningful traditional knowledge
of disaster precursors; or C1=2 if people do not have meaningful traditional knowledge of
disaster precursors. Then C2=1 if government assistance was received promptly in the
aftermath of <70% of disasters; or C2=2 if the government assistance was received promptly
in the aftermath of >70% of disasters. Then C3=1 if the community uses traditional coping
methods; or C3=2 if the community does not use traditional coping methods. Then C4=1 if
the community has not received outside support/advice about how to cope with the impacts of
natural disasters; or C4=2 if the community has received such support/advice.
Thus,
2 Note that the arithmetic changes to the sum of A and B and C first require that the lower bound is set to zero (the lowest possible score is 0.6+0.6+0.6=1.8) by subtracting 1.8 from the total. Then to make the total out of 5, scores are in this case divided by 1.44.
31
C = (C1 + C2 + C3 +C4)/2.67
The assumption is that the greater the traditional knowledge and (autonomous) coping
capacity of a community, the less dependent it is on external assistance. Conversely, a
community that has no or little traditional knowledge is likely to be more dependent on outside
assistance for coping with environmental adversity – and to make uninformed decisions when
that assistance is absent.
Diet (D) is the fourth variable used in the calculation of Index 3 and reflects the relative use of
locally-acquired foods and shop-bought foods, as measured by answers to four questions (D1-
D4) about the consumption of local produce, the number of nearby shops, the frequency of
shop-bought food consumption, and the number of shop food-based meals per week. Thus,
D1=1 if the community produces/catches ≥80% of the food it routinely consumes; or D1=1.5
if the community produces/catches 60-<80% of the food it routinely consumes; or D1=2 if the
community produces/catches <60% of the food it routinely consumes. Then D2=1 if there are
no shops within 30 minutes walk of the community; or D2=1.5 if there is one shop within 30
minutes walk of the community; or D2=2 if there is more than one shop within 30 minutes walk
of the community. Then D3=1 if an average household buys food from shops ≤3 times a week;
or D3=1.5 if an average household buys food from shops 4-5 times a week; or D3=2 if an
average household buys food from shops more than 5 times a week. Then D4=1 if an average
household eats mostly shop-bought food for 0-6 meals (out of 21) each week; or D4=1.5 if an
average household eats mostly shop-bought food for 7-11 meals (out of 21) each week; or
D4=2 if an average household eats mostly shop-bought food for ≥12 meals (out of 21) each
week.
Thus,
D = (D1 + D2 + D3 + D4)/2.67
The assumption is that the less reliant a community is on shop-bought food, the more resilient
it is to economic challenges although, conversely, the more vulnerable it may be to
environmental ones.
Water and energy security (E) is the fifth and final variable used to calculate Index 3. It reflects
the adequacy of water and energy (electricity) in particular communities, based on the answers
to five questions (E1-E5) about water supply/quality and electricity. Thus, E1=1 if the
community obtains its drinking water from a single source; or E1= 2 if the community obtains
its drinking water from more than one source. Then E2=1 if the supply of water is adequate
for the community’s needs; E2=2 if the supply of water is inadequate for the community’s
needs. Then E3=1 if the quality of water is generally suitable for drinking (and/or if the water
is treated), or E3=2 if the quality of water is often unsuitable for drinking (and perhaps requires
boiling before consumption). Then E4=1 if <10% household in the community have regular
electricity; or E4=1.5 if 10-60% households in the community have regular electricity; or E4=2
if >60% households in the community have regular electricity. Then E5=1 if the community
receives electricity from a single source (multiple household generators count as just one
source); or E5=2 if the community receives electricity from more than one source (multiple
household generators count as just one source, community generators count as one, solar as
one, mains as one).
32
Thus,
E = (E1 + E2 + E3 + E4 + E5)/3.33
The assumption is that the fewer the sources and less reliable the water supply, the fewer
houses with electricity and the fewer the electricity supply sources, the more vulnerable a
community is to economic and environmental changes that impact water and energy.
In order to scale Index 3 for direct comparison with other peripherality indices in this study, the
sum of A, B, C, D and E is adjusted arithmetically as follows –
Index 3 = [(A + B + C + D + E) – 7.5]/1.5
Low scores (≤2) suggest comparatively high peripherality while high scores (≥4) suggest the
opposite3.
3 Note that the arithmetic changes to the sum of A and B and C and D and E first require that the lower bound is set to zero (the lowest possible score is 1.5x5=7.5) by subtracting 7.5 from the total. Then to make the total out of 5, scores are in this case divided by 1.5.

33
Appendix 3. Conference presentations and posters produced as a result of this project
A list of the 14 conference presentations (including three Keynote addresses) plus the four
posters is given below. Names of people directly associated with this project are underlined.
Conference Presentations
1. Nunn, P.D. 2017. Sustaining ecosystem services under a changing climate: an agenda
for younger people. Keynote Address, Oceania Ecosystem Services Forum, Brisbane,
Australia [30.3.17].
2. Nunn, P.D. and Kumar, R. 2017. Through the lens of peripherality: climate-driven
changes to ecosystem services for communities in Bua, western Vanua Levu Island
(Fiji). Oceania Ecosystem Services Forum, Brisbane, Australia [30.3.17].
3. Nunn, P.D. and Kumar, R. 2017. Capturing community diversity for adaptation in the
Pacific Islands: the role of peripherality. 11th Conference of the European Society for
Oceanists, Munich, Germany [1.7.17].
4. Nunn, P.D. and Betzold, C. 2017. False promises: seawalls as maladaptations
throughout the rural Pacific Islands. 11th Conference of the European Society for
Oceanists, Munich, Germany [1.7.17].
5. Nunn, P.D. 2017. Maladaptation in Pacific Island countries: why the widespread and
sustained failure of externally-sponsored interventions for climate-change adaptation
in rural communities? Institute of Australian Geographers’ Conference, University of
Queensland [5.7.17]
6. Nunn, P.D. 2018. Climate-Human Interactions in Fiji. Ministry of iTaukei (Indigenous)
Affairs, Government of Fiji, Suva [22.1.18].
7. Nunn, P.D. 2018. Améliorer la préparation aux catastrophes et l'adaptation au
changement climatique en Australie et dans les îles du Pacifique: le rôle des histoires
anciennes (Improving disaster preparedness and climate-change adaptation in
Australia and the Pacific Islands: the role of ancient stories). Faculté des Lettres,
Langues et Sciences humaines, Université du Maine, France [4.4.18].
8. Nunn, P.D. 2018. Changements côtiers Holocènes rappelés dans les histoires
anciennes: exemples de l'Australie, du Pacifique Sud-Ouest et du Nord-Ouest de la
France (Holocene coastal change recalled in ancient stories: examples from Australia,
the Southwest Pacific, and Northwest France). Faculté des Lettres et Langages,
Université de Nantes, France [11.4.18].
9. Nunn, P.D. 2018. Barriers have two sides: the challenges of transformational
adaptation in island contexts. Keynote Speech, Adaptation Futures 2018, Cape Town,
South Africa [June 2018].

34
10. Nunn, P.D. 2018. Failing adaptation in island contexts: the growing need for
transformational change. Opening Keynote Address, Symposium on Dealing with
Climate Change on Small Islands, Hannover, Germany [25.7.18].
11. Nunn, P.D. 2018. Improving the Effectiveness and Sustainability of Climate-Change
Adaptation Outcomes in the Pacific Islands: A Role for Faith-Engaged Approaches?
Griffith University Climate Change Response Program (Gold Coast Campus), Australia
[21.8.18].
12. Nunn, P.D. 2018. Climate change and faith in the Pacific Islands. Griffith University,
Multi-Faith Centre (Nathan Campus), Australia [6.11.18].
13. Nunn, P.D. and Kumar, R. 2019. Climate-Human Interactions in the Federated States
of Micronesia. Public Talk, Conservation Society of Pohnpei, Pohnpei, Federated
States of Micronesia [27.3.19].
14. Nunn, P.D. 2019. Is Policy Necessary? A Climate Scientist’s Reflections on Climate-
Driven Relocations in the Pacific Islands. Monash University Centre for Commercial
Law and Regulatory Studies, Melbourne, Australia [12.4.19].
Conference Posters
1. Nunn, P.D. 2017. Harnessing spiritual wellbeing for effective climate-change
adaptation in Pacific Islands. University of the Sunshine Coast, USC Research
Showcase (July 2017).
2. Lykins, A., Kumar, R. and Nunn, P.D. 2017. Climate change and mental health in rural
Fiji (Southwest Pacific). University of the Sunshine Coast, USC Research Showcase
(July 2017).
3. Nunn, P.D. 2017. Underestimating God: spiritual beliefs and climate-change
adaptation in the Pacific … and the pitfalls of ignoring them. Institute of Australian
Geographers’ Conference, University of Queensland [5.7.17].
4. Scott-Parker, B. and Kumar, R. 2017 . Fiji adolescents’ understanding of climate
change: the importance of bringing it closer to scientific projections. Institute of
Australian Geographers’ Conference, University of Queensland [5.7.17].
35
Appendix 4. Funding sources outside the APN
Work on this project benefitted from a project funded by the Australian Research Council
through its Linkage grant LP160100941 to Dr Karen McNamara, Prof Patrick Nunn and Dr
James Watson for research into intervention failure in Federated States of Micronesia, Fiji,
Kiribati, Solomon Islands and Vanuatu.
Appendix 5. List of Young Scientists
Roselyn Kumar (Fiji) – PhD candidate at University of the South Pacific
“Being involved in this APN project allowed me insights into how Pacific islanders think about
environmental risk; it also allowed me to travel throughout Micronesia and work with local
communities and understand their similarities to those in my Fiji homeland”