Embed Size (px)
Citation preview

Risk and Resilience
AGROBIODIVERSITY INDEX REPORT
2019


Risk and Resilience
AGROBIODIVERSITY INDEX REPORT
2019
The Agrobiodiversity Index Team
Roseline Remans, Sarah Jones, Ehsan Dulloo, Chiara Villani, Natalia Estrada Carmona, Stella Dimitri Juventia, Marie-Angelique Laporte, Elizabeth Arnaud, Carlos Quiros, Allan Coto, Hannes Gaisberger, Allison G. Smith, Fred Werneck, Christine Negra, Coosje Hoogendoorn, Gianpiero Menza, Richard China, Stephan Weise, Marleni Ramirez, Krishna Kumar, Zongwen Zhang.
Production Team
Editor: Arwen Bailey Copy editor: Nora Capozio Design: Pablo Gallo and Luca Pierotti Editorial assistance: Chiara Villani
Citation
Bioversity International (2019) Agrobiodiversity Index Report 2019: Risk and Resilience. Rome (Italy): Bioversity International. https://hdl.handle.net/10568/100820
Cover photo
Agricultural landscape in Cuba. Credit: INIFAT (Instituto de Investigaciones Fundamentales en Agricultura Tropical).
The Agrobiodiversity Index Report 2019: Risk and Resilience is based on version 1.0 of the Agrobiodiversity Index methodology. We invite constructive feedback to help us improve the next round of measurements so as to ensure the information generated is useful for countries to �nd and validate their pathways towards sustainable and resilient food systems.
The perspectives presented in the thought pieces are the authors’ own and do not necessarily re�ect those of Bioversity International.
Bioversity International Headquarters
Via dei Tre Denari, 472/a - 00054 Maccarese (Fiumicino) - Italy Tel. (+39) 06 61181 - Fax. (+39) 06 61979661 - [email protected] - www.bioversityinternational.org
Agrobiodiversity Index contact: [email protected]
Bioversity International is a CGIAR Research Centre. CGIAR is a global research partnership for a food-secure future. www.cgiar.org
Bioversity International is registered as a 501(c)(3) non-pro�t organization in the US. Bioversity International (UK) is a Registered UK Charity No. 1131854.
ISBN: 978-92-9255-125-4
Some rights reserved. This work is licensed under a Creative Commons Attribution-NonCommercial-NoDerivatives 4.0 International License (CC BY-NC-ND 4.0 https://creativecommons.org/licenses/by-nc-nd/4.0/legalcode)
© Bioversity International, 2019

III
Contents
Authors v
preface vii
Foreword viii
Acknowledgements ix
seCtion 1 1
Country profiles 1
introducing the Agrobiodiversity index 3
Paulo Lourenço Dias Nunes, Roseline Remans, Chiara Villani, Nelida Ale, Anita Mannella, Juan Lucas Restrepo and René Castro Salazar
Agrobiodiversity index methodology in a nutshell 7
Comparison across countries 11
Australia – Country profile 17
China – Country profile 25
ethiopia – Country profile 33
india – Country profile 41
italy – Country profile 49
Kenya – Country profile 57
nigeria – Country profile 65
peru – Country profile 73
south Africa – Country profile 81
United states of America – Country profile 89

IV
SECTION 2 97
Thought Pieces 97
Policies and finance to spur appropriate private-sector engagement in food systems 99
Greg S. Garrett, Laura Platenkamp, Mduduzi N.N. Mbuya
Nurturing diversity in our guts and on our farms to reduce health risks and increase food system resilience 107
Salvatore Ceccarelli
Reducing risk of poor diet quality through food biodiversity 115
Giles Hanley-Cook, Gina Kennedy, Carl Lachat
Healthy food systems require resilient seed systems 127
Abishkar Subedi and Ronnie Vernooy
Can crop diversity strengthen small-scale farmers’ resilience? 135
Marta Kozicka, Jeroen C.J. Groot, Elisabetta Gotor
Crop genetic resources manage risks in China. How to manage risks to crop genetic resources? 145
Xu Liu and Zongwen Zhang
Measurement choices with consequences 153
C. Leigh Anderson and Travis W. Reynolds
Women are key to resilient food systems as seed keepers in Ethiopia 163
Fetien Abay

V
Nelida Ale (PhD International Relations specialized in economic and social development) is a technical officer at the Climate, Biodiversity, Land and Water Department of the Food and Agriculture Organization of the United Nations (FAO).
C. Leigh Anderson (PhD Economics) is the Marc Lindenberg Professor and Associate Dean at the University of Washington’s Daniel J. Evans School of Public Policy and Governance. Her interest is in how low and variable income affects financial, environmental, health, and other rural livelihood decisions, with a focus on agriculture and policy institutions.
Rene Castro-Salazar (Doctor of Design) is Assistant Director-General and Director of the Climate, Biodiversity, Land and Water Department at the Food and Agriculture Organization of the United Nations (FAO). He is a Member of Bioversity International Board of Trustees.
Salvatore Ceccarelli (PhD Applied Genetics) is a (retired) professor of Agricultural Genetics at Perugia University, Italy. He has conducted plant breeding research in several developing countries implementing participatory plant breeding and evolutionary plant breeding programmes to make farmers the focus of agricultural development.
Paulo Lourenço Dias Nunes (PhD Economics) is a Senior Economist at the office of the Assistant Director-General and Director of the Climate, Biodiversity, Land and Water Department of the Food and Agriculture Organization of the United Nations (FAO). He is an Alternate-Member of Bioversity International Board of Trustees.
M. Ehsan Dulloo (PhD Conservation Biology) is a genetic resource scientist with almost 40 years of experience working on in situ and ex situ conservation methodologies and strategies and the management of protected areas and genebanks. His current research focus is on the monitoring of agrobiodiversity and crop wild relatives. He is author of more than 130 publications.
Natalia Estrada Carmona (PhD Natural Resources) is an Associate Scientist at Bioversity International. Since 2007 she has been assessing ecosystem services in agricultural landscapes through participatory and modelling tools to identify agricultural diversification strategies for multifunctional and resilient landscapes.
Greg S. Garrett (MSc International Development) is Director of Food Policy & Financing at the Global Alliance for Improved Nutrition (GAIN), and serves on the boards of the Iodine Global Network and Food Fortification Initiative.
Elisabetta Gotor (PhD Agricultural and Food Economics) is the Head of the Development Impact Unit at Bioversity International. Her research is focused on developing integrated modelling tools in which ex post impact analysis is used to inform ex ante and foresight predictions with the aim of assessing the causal relationship between diversity-based interventions and key outcomes generated such as vulnerability and resilience.
Jeroen C.J. Groot (PhD Agronomy) is associate professor at the Farming Systems Ecology group of Wageningen University, currently seconded to the CGIAR centres Bioversity International and the International Maize and Wheat Improvement Center (CIMMYT). He has specialized in farming systems analysis, model-based landscape planning and design, and participatory modelling and gaming. His research focuses on the analysis and improvement of cropping systems, farms and rural livelihoods of smallholders in Asia, Africa and Latin America.
Hannes Gaisberger (MSc Biology) is a GIS specialist at Bioversity International and a PhD candidate at Salzburg University. His current research focuses on spatially explicit threat mapping of tree species to identify efficient conservation and restoration strategies.
Giles Hanley-Cook (MSc Nutrition and Rural Development) is a PhD candidate in Applied Biological Sciences: Food Science and Nutrition at Ghent University, Belgium. His research involves exploring food biodiversity as a lever for diet quality and environmental health.
Sarah Jones (PhD Geography) is an Associate Scientist at Bioversity International working on trade-offs between food production and environmental and social sustainability outcomes.
Stella Dimitri Juventia (BSc Agriculture) is a Research Assistant at Bioversity International and MSc candidate at Wageningen University, working on agroecological complex adaptive systems, at the intersection of agronomy, ecology and rural community development.
Authors 1 2

VI
Gina Kennedy (PhD Public Health Nutrition) has 25 years of experience in international public health and nutrition. Her research involves exploring the relationship between food systems, diet quality and sustainability and the role of agricultural biodiversity in improving human health and nutrition, and creating more sustainable food systems.
Carl Lachat (PhD Applied Biological Sciences) is professor of Public Health nutrition and nutrition epidemiology at Ghent University, Belgium. His research aims to develop effective approaches to enhance diets and nutritional status of vulnerable populations, including those in low- and middle-income countries.
Anita Mannella (MSc Environmental and Development Economics) is an intern at the Climate, Biodiversity, Land and Water Department of the Food and Agriculture Organization of the United Nations (FAO).
Marta Kozicka (PhD in Agricultural Economics) is an Associate Scientist in the Development Impact Unit of Bioversity International. Her work encompasses interdisciplinary research on ex ante impact assessment and foresight analysis of topics related to food security and sustainable agricultural development.
Marie-Angélique Laporte (PhD in Ecology) is an Associate Scientist at Bioversity International, working on various data-related issues, including developing ontologies and metadata standards relevant to the agricultural domain.
Xu Liu (PhD Crop Genetics and Breeding), Academician of the Chinese Academy of Engineering, has worked on crop genetic resources for more than 40 years. He has played a critical role in building the national system for conservation and use of crop genetic resources. In recent years, he has focused on developing and implementing the national programmes and strategies for conservation of biological genetic resources in China.
Mduduzi N.N. Mbuya (PhD Nutrition) is a Senior Technical Specialist, Knowledge Leadership with the Global Alliance for Improved Nutrition (GAIN) and courtesy Associate Professor at Cornell University, working on research and learning pertaining to micronutrients, food systems and governance programmes.
Laura Platenkamp (MSc International Relations, LLM Public International Law) is a Senior Associate, Urban Governance for Improved Nutrition with the Global Alliance for Improved Nutrition (GAIN), working on food and nutrition policy, governance and urban food systems.
Roseline Remans (PhD Biosystems Engineering) is a Senior Scientist working on the link between agriculture, environment and nutrition, at the Agriculture and Food Security Center of the Earth Institute (Columbia University) and Bioversity International.
Juan Lucas Restrepo Ibiza (MSc Agricultural Economics) is the Director General of Bioversity International and CEO of the Alliance between Bioversity International and the International Center for Tropical Agriculture (CIAT).
Travis W. Reynolds (PhD Public Policy and Management) is an Assistant Professor in the Department of Community Development and Applied Economics at the University of Vermont. His research areas include institutional economics, agricultural development, and payments for environmental services, with an emphasis on the links between agriculture, food security, community governance institutions and the environment.
Abishkar Subedi (PhD Plant Science) is specialized in designing and managing projects on plant genetic resources for food and nutrition security, especially with a focus on on-farm agrobiodiversity management and integrated seed sector development. Building community resilience through action-oriented research, fostering multistakeholder processes and capacity building are key interest areas.
Ronnie Vernooy (PhD Rural Development Sociology) focuses on the policy and legal aspects of the safeguarding and sustainable use of plant genetic resources, both ex situ and in situ, from local to international levels. One topic of particular interest is community seedbanks (as a form of collective action) and their roles in providing voice and choice to farmers to keep local crop diversity and associated knowledge in their own hands and alive.
Chiara Villani (MSc International Relations) is a Communications Specialist, working as a junior professional officer supporting communications and partnerships for the Agrobiodiversity Index project.
Zongwen Zhang (PhD Crop Genetics and Breeding) is Bioversity International’s Regional Representative for Southeast Asia. He has dedicated more than 30 years to promoting conservation and use of agrobiodiversity in the region in collaboration with national partners. His research focuses on promoting use of genebank accessions of buckwheat and oat with molecular tools and participatory approaches.
VII
Global risks in 2019 considered at once highly likely and highly impactful include extreme weather events, failure of climate-change mitigation and adaptation, biodiversity loss and ecosystem collapse. Not far behind are food crises.1
Using agrobiodiversity in production systems can help reduce many of these risks. For farmers, having a portfolio of species and within-species diversity on farm helps them to withstand or recover from extreme weather events. Crop genetic diversity helps adapt to changing climates, and can even help mitigate climate change by capturing carbon in trees and biodiverse soils. Using agrobiodiversity – from genetic to ecosystem level – produces a web of interactions, which make ecosystems more resilient.
If you increase resilience in a system, you reduce risk. Resilience is not a final state, but an active ability to manage shocks so that, at the very least, you can regain what you originally had. Ideally, it goes beyond simply maintaining the status quo to develop the ability to adapt flexibly to change and to trigger transformative changes that make communities fundamentally less vulnerable to shocks.
The Agrobiodiversity Index measures aspects of risk and pinpoints areas where governments can intervene to increase resilience. To provide a context and stimulate thinking, we have invited a range of practitioners from the private and public sector, with backgrounds as varied as finance, policy, breeding, seed systems, ecology and gender to reflect on the role of agrobiodiversity to mitigate risk and build resilience in this first Agrobiodiversity Index report.
Greg Garrett and colleagues from GAIN (the Global Alliance to Improve Nutrition) discuss financing mechanisms and private-sector initiatives that could be applied to mainstream agrobiodiversity in food systems and reduce the risks of poor nutrition and improve planetary health. Researcher and breeder Salvatore Ceccarelli makes the link between the diversity in our guts, diets and production systems and how we need to cultivate diversity to optimize all three. Two pieces stimulate thinking on indicators. The first, by colleagues at Wageningen University and Bioversity International,
looks at the challenges in linking measurements of dietary diversity to measurements of agrobiodiversity in a meaningful way. The second, by Leigh Anderson and Travis Reynolds of the Evans School Policy Analysis and Research Group (EPAR) at the University of Washington, looks at how the way we define yield, crop diversity and smallholders can mischaracterize contributions of agrobiodiversity to smallholder livelihoods.
Production systems are also the focus of an analysis, by Bioversity colleagues with systems modelling specialist Jeroen Groot, that looks at the effects of different portfolios of crop species to help a smallholder achieve multiple goals, such as yield, nutrition and income, under different climate change and pest and disease scenarios up to 2050. Since sustainable food systems depend on good quality and appropriate seeds, seed system experts Abishkar Subedi and Ronnie Vernooy provide practical examples of ways to build resilient seed systems.
In Ethiopia – one of the Agrobiodiversity Index countries – Fetien Abay writes about women as seed keepers and innovators whose knowledge allows them to maintain or increase diversity in the system and build resilience to different disturbances. Finally, we present the example of China, a megadiverse country that is facing threats to its remarkably diverse genetic resources, which affect its capacity for healthy, diverse diets, income-generation opportunities and low-input agricultural practices. Genetic resource experts Xu Liu and Zongwen Zhang discuss what can be done to mitigate those risks in the country.
Preface
1 World Economic Forum. 2019. The Global Risks Report 2019. http://www3.weforum.org/docs/WEF_Global_Risks_Report_2019.pdf

VIII
Foreword
The Agrobiodiversity Index Report is the first of its kind. Applied to a sample of ten countries, it uses the lens of agrobiodiversity to connect genetic resource conservation to sustainable production in farms and landscapes and to dietary diversity on the plate for better nutrition. The ten profiles span across all major continents and cover a large diversity of agroecological and socioeconomic settings. The Index is an action-oriented tool that countries, companies and investors can use to assess their sustainable use of agrobiodiversity for improving food systems and identify areas where they can take action to make diets, markets and production systems healthier, more resilient and more sustainable.
The release of the Agrobiodiversity Index could not have come at a more appropriate time. Recent reports have brought to public attention that we are living through a period of biodiversity and climate change emergency. At the same time, levels of hunger are on the rise and at least a third of the world’s population suffers from poor nutrition.
Agrobiodiversity – the subset of biodiversity, both domesticated and wild, which contributes in one way or another to agriculture and food production – is a green, renewable resource that can help global efforts to stop the emergency and transform to more sustainable and nutritious food systems. Agrobiodiversity-based practices are at the heart of production systems that deliver not only on productivity, but also on environmental health. And agrobiodiversity is the source of dietary diversity, which can ensure adequate nutrient intake.
Diverse diets need diversity in markets and food supply, resilient ecosystems need diversity in production systems, and diverse production systems need diversity at genetic and species level. In theory, these should bolster one another, with demand for diversity on the plate reflected in diversity on farms and conserved. However, the unique combination of policies and practices in each country means that these play out differently. Some countries import diversity for diets but neglect local diversity that could underpin healthy agricultural systems and support in situ conservation of unique species and varieties. In other countries, farmers still manage high levels of agrobiodiversity on their farms, but sometimes markets and policies are unfavourable to them benefitting fully from it and so undermine their desire to maintain it long term.
Measuring diversity in diets and markets, production systems and genetic resources together can indicate strengths and weaknesses in agrobiodiversity conservation, use and consumption. The Agrobiodiversity Index assesses the extent to which low agrobiodiversity is contributing to increasing risk in six areas: poverty traps, biodiversity loss, climate change, pests and diseases, malnutrition and land degradation. On the flip side, the Index combines selected indicators to evaluate the extent to which agrobiodiversity-based practices are contributing to resilience in those areas.
The Agrobiodiversity Index development and implementation takes a design approach. The Agrobiodiversity Index will continue to evolve and improve, as more information, datasets and analytical work can be undertaken. For example, we will integrate data and analyses from Bioversity International’s Alliance partner, the International Center for Tropical Agriculture (CIAT), to enhance the Index robustness and resolution. Learning from the current applications of the Agrobiodiversity Index to countries (and later companies) will allow us to enhance the framework and will provide incentives to those measured to provide access to key data that can improve the results over time. Feedback will be used to further upgrade the tool and the country profiles and to expand the application of the Index to other countries.
We hope that the thought pieces and the insights generated by the Agrobiodiversity Index will help countries in their efforts to meet national and international development goals, including improving food security and nutrition, increasing production in a sustainable way, and achieving resilience to climate change, pests and diseases through increased use of biodiversity.
Juan Lucas Restrepo
Director General, Bioversity International
CEO-Designate, Alliance between Bioversity International and CIAT
IX
The Agrobiodiversity Index Report 2019: Risk and Resilience has been prepared by the Agrobiodiversity Index team, and it is based on the Agrobiodiversity Index Methodology Version 1.0.
A broad and distinguished array of collaborators has contributed to the development of this first Agrobiodiversity Index report. We begin with a word of sincere thanks to the European Commision and the Italian Development Cooperation, which have provided generous support to developing this report.
We extend our gratitude to the Agrobiodiversity Index Strategic Advisory Panel and the Expert Review Committee for their support, insights and critical feedback. The Strategic Advisory panel is chaired by Christine Negra and includes: Alison Cairns, Rene Castro, Luigi De Chiara, Jessica Fanzo, Frank Hawkins, Juan Lucas Restrepo, Roberto Ridolfi, Ido Verhagen, Mary Ann Sayoc and Paul Winters.
The expert Review Committee is chaired by Coosje Hoogendoorn and includes: Simon Attwood, Adriana De Palma, Romano De Vivo, Luigi Guarino, Brian King, Carl Lachat, Nigel Maxted, Shakuntala Thilsted and Lisanne Urlings.
We also thank our partners in Peru and India, who have engaged in discussions on the insights contained in this report. The chance to interact with these counterparts has been essential to deepen our understanding about how to best support dialogue and action related to the findings.
Last but not least, we would like to thank everyone who has provided insights and suggestions on how to present contents and make them useful for countries.
Acknowledgements
Small red chillies. Credit: Bioversity International/C. Zanzanaini

Country Profiles
SEC
TIO
N 1

Quinoa variety growing in Bolivia. Credit: Bioversity International/S. Padulosi

Introducing the Agrobiodiversity IndexPaulo Lourenço Dias Nunes, Roseline Remans, Chiara Villani, Nelida Ale, Anita Mannella, Juan Lucas Restrepo and René Castro Salazar
4
Agrobiodiversity Index Report 2019 – Risk and Resilience
Today, global food production is the single largest driver of environmental degradation and biodiversity loss (1). Rising global food demand and limited arable land are pushing us to expand agricultural frontiers and increase production. This often happens without regard to the environment, causing biodiversity loss, and land and water degradation (2).
Climate change is also a major cause of biodiversity loss. Higher temperatures are already disrupting pollination and natural pest control, affecting the quality of food (3). In many of the poorest regions of the world, climate change will reduce crop yields and increase the incidence of animal diseases, leading to higher food prices – up to even 84% by 2050 – and food insecurity for farmers (4).
At the same time, the need to feed an additional 2 billion people by 2050 is tempting us to increase yields of a few staple foods, which in turn is eroding food diversity and genetic resources. Today, of the 6,000 plant species cultivated for food, fewer than 200 make major contributions to food production globally, regionally or nationally. Only nine of these plants account for 66% of total crop production (5). Livestock and fish biodiversity are also at stake. Of the 7,745 local breeds of livestock still in existence, 26% risk extinction. In addition, nearly a third of fish stocks are overfished and a third of freshwater fish species assessed are considered threatened (5).
Biodiversity loss in our food systems leaves farmers with fewer options to deal with risks of crop failure, declining soil fertility or increasingly variable weather (2). This is already causing production losses, increasing food insecurity and malnutrition. Today, more than 820 million people still suffer from hunger, and many more consume an unhealthy diet that contributes to premature death and disease, with about 2 billion people lacking one or more essential micronutrients and just under 2 billion obese or overweight (sometimes the same people) (1, 6).
The way we produce and consume our food is clearly hurting both people and the planet. Business as usual is not working and it is time for a paradigm shift. What we need is to be able to produce and consume more diverse and nutritious foods while having minimal impact on the environment, promoting a sustainable food system. This calls upon all of us, from governments to producers and consumers, to prioritize biodiversity and support actions that protect, foster and mainstream it.
Agricultural biodiversity is essential for building sustainable and resilient food systems. Agrobiodiversity – the wealth of plants, animals and microorganisms used for food and agriculture – boosts productivity and nutrition quality, increases soil and
water quality, and reduces the need for synthetic fertilizers. It also makes farmers’ livelihoods more resilient, reducing yield losses due to climate change and pest damage. Broadening the types of cultivated plants is also good for the environment, increasing the abundance of pollinators and beneficial soil organisms, and reducing the risk of pest epidemics.
Today, the importance of biodiversity for food and agriculture is widely recognized at the global level. From the 2030 Agenda for Sustainable Development, to the United Nations Framework Convention on Climate Change and its Paris Agreement, the United Nations Convention on Biological Diversity and the United Nations Convention to Combat Desertification, all the main international agreement embed considerations on the role of biodiversity in addressing today’s global challenges. International development frameworks are essential to guide and align our actions to conserve and sustainably use biodiversity. However, on their own political commitments are not enough.
To sustainably use and conserve biodiversity in food and agriculture, we need to go the extra mile. A multistakeholder approach such as the one foreseen in the framework of the UN FAO Biodiversity Mainstreaming Platform can be a suitable method to facilitate dialogue among stakeholders and find more coherent and inclusive solutions at country level (7). Governments will need to initiate dedicated, multisectoral and evidence-based policies and interventions that integrate agrobiodiversity as a strategy to address today’s global challenges. Public–private partnerships will also be needed. From smallholder farmers to multinational companies, food producers are becoming increasingly important in conserving genetic resources and adopting sustainable agricultural practices. Consumers will need to become more aware of the impact of their food choices on the planet and their role in preserving the environment.
What actions do we need to put in place to make change happen? To answer this question, we need to be able to measure biodiversity in food systems. While decades of efforts have advanced our understanding of sustainable food systems, agrobiodiversity data remain uneven and oftentimes information is analyzed from sectoral perspectives (e.g. production, consumption or conservation). To transform food systems, we need to look at the broader picture and understand the systemic linkages between biodiversity, food security and nutrition, agricultural production, and the environment. While evidence shows the potential of agrobiodiversity for resilient and sustainable food systems, translation of this knowledge into policy and investment decisions has been tenuous. One of the reasons is multiple ways of measuring agrobiodiversity for multiple goals.
Introduction

5
Introducing the Agrobiodiversity Index
To address this, Bioversity International has developed the Agrobiodiversity Index, an innovative tool that, crossing disciplinary boundaries, brings together existing measures and data on diets and markets, production and genetic resources, analyzing them under the lens of agricultural biodiversity for multiple goals (8). By accessing open data on food and agriculture, the tool allows biodiversity trends in food systems to be understood and monitored. In particular, it helps food systems actors to measure agrobiodiversity in selected areas or value chains, and understand to what extent their commitments and actions are contributing to its sustainable use and conservation.
The Agrobiodiversity Index equips food system actors with the data needed to make informed decisions to achieve sustainability and resilience. Countries can use the Agrobiodiversity Index in different ways. First, they can use it to assess risks in food and agriculture related to low agrobiodiversity. Based on the Index results, countries can understand how much they can build resilience for six risk areas by leveraging agrobiodiversity: malnutrition, poverty trap, climate change and variability, land degradation, pests and diseases, and biodiversity loss.
Second, they can use the information generated through the Index to plan interventions and formulate evidence-based policies and strategies that address efficiently today’s global challenges – including malnutrition, climate change and natural resource degradation. Despite its importance, the majority of the interactions between biodiversity, ecosystem services and the agricultural sector are invisible in established informational systems – including the quantities and respective prices of food and agricultural trade, markets, and supply and demand. The Agrobiodiversity Index addresses this information gap and makes these interactions more visible. This information will, therefore, constitute solid policy and management guidance to decision-makers. The tool provides insights into how biodiversity, at every level from genetic to ecosystem, is a driver that influences food systems sustainability and, as such, how it needs to be considered and integrated into national and regional environmental, agricultural, health and food research infrastructure, strategies and policies.
Third, Agrobiodiversity Index results allow countries’ performance related to use and conservation of agrobiodiversity to be compared. This can stimulate positive competition to improve performance related to maintaining and enhancing agrobiodiversity. Not only can the tool stimulate a race to the top, but it can also foster knowledge exchange among countries, including South–South Cooperation, by identifying best practices to sustainably use and conserve agrobiodiversity. In addition, the Agrobiodiversity Index can help monitor global development goals and targets related to agricultural agrobiodiversity. The 2030 Development Agenda makes an ambitious call for a transformation in food and agriculture systems: it insists on an
integrated and holistic approach to sustainable use of natural resources, including natural capital, biodiversity and ecosystem services. The Agrobiodiversity Index supports progress towards Sustainable Development Goals 3, 12, 13 and 15 and Aichi Biodiversity Targets 7 and 13.
Last but not least, the Agrobiodiversity Index can help countries leverage investments for sustainable and resilient food systems. With almost US$162.5 billion green bonds issued in 2017, the world is getting serious about protecting and preserving our planet. Countries can apply the Agrobiodiversity Index to demonstrate the value for money of their agrobiodiversity-themed green bonds. In particular, green bond issuers can use the Index to produce a baseline assessment of the status of agrobiodiversity in specific areas where they plan to implement an intervention financed through the bonds and to monitor progress once the intervention is implemented.
References
1. Willett W, et al. (2019) Food in the Anthropocene: the EAT–Lancet Commission on healthy diets from sustainable food systems. The Lancet 393(10170):447–492.
2. Bioversity International (2017) Mainstreaming Agrobiodiversity in Sustainable Food Systems: Scientific Foundations for and Agrobiodiversity Index (Bioversity International, Rome, Italy).
3. FAO (Food and Agriculture Organization) (2017) The Future of Food and Agriculture: Trends and Challenges (Rome, Italy).
4. World Economic Forum (2017) Shaping the Future of Global Food Systems: A Scenarios Analysis (Geneva, Switzerland).
5. FAO (Food and Agriculture Organization) (2019) The State of the World’s Biodiversity for Food and Agriculture eds Belanger J, Pilling D (FAO Commission on Genetic Resources for Food and Agriculture Assessments, Rome, Italy) Available at: http://www.fao.org/3/CA3129EN/CA3129EN.pdf.
6. FAO, IFAD, UNICEF, WFP, WHO (2018) The State of Food Security and Nutrition in the World in 2018. Building climate resilience for food security and nutrition.
7. FAO (Food and Agriculture Organization) FAO Biodiversity Mainstreaming Platform | Biodiversity | Food and Agriculture Organization of the United Nations. Available at: http://www.fao.org/biodiversity/mainstreaming-platform/en/ [Accessed April 30, 2019].
8. Bioversity International (2018) The Agrobiodiversity Index: Methodology Report v.1.0 (Rome, Italy).
Coffee berries, Costa Rica. Credit: Bioversity International/C. Zanzanaini

Agrobiodiversity Index methodology in a nutshell

8
Agrobiodiversity Index Report 2019 – Risk and Resilience
The Agrobiodiversity Index methodology 1.0 in a nutshell
The Agrobiodiversity Index is an innovative tool that helps measure agrobiodiversity and identify concrete actions to help achieve diverse, sustainable and resilient food systems. In measuring agrobiodiversity, we look at its potential contribution to healthy diets, sustainable agriculture and genetic resource management for future options. These constitute the three pillars of the Index.
The Agrobiodiversity Index measures:
• Status - the current state of agrobiodiversity in markets and consumption, in agricultural production, and in genetic resource management, looking at diversity in terms of species, varieties, functions, soil biodiversity and landscape complexity.
• Progress - the extent to which commitments and actions at national level support sustainable use and conservation of agrobiodiversity for healthy diets, sustainable agriculture and future options.
It does so by bringing together existing data, reports and policies, on markets and consumption, production and genetic resource management, analyzing them through the lens of agrobiodiversity:
• Status indicators are scored based on spatially explicit global data sets (such as those in Collect Earth and Earth Map) and national data sets (mainly accessed through global databases at United Nations agencies).
• Action indicators are scored based on country reports, such as those from the World Information and Early Warning System on Plant Genetic Resources for Food and Agriculture (WIEWS) and in the State of the World Biodiversity for Food and Agriculture, both compiled by the Food and
Agriculture Organization of the UN (FAO), as well as some spatially explicit globally available datasets that help track actions (for example percentage of agricultural land with agroforestry, and percentage of agricultural land diversified through crop-livestock systems).
• Commitment indicators are scored based on national policies and strategies, assessed through a text-mining tool that analyzes policies, strategies and other national legislation, retrieved from the FAO’s legislation and policies database, FAOLEX, and the World Health Organizations’ Global database on the Implementation of Nutrition Action (GINA).
• The Agrobiodiversity Index has 22 indicators, comprising three commitment indicators, four action indicators and 15 status indicators. However, data for six of the status indicators (varietal diversity in healthy diets, varietal, functional, underutilised species and pollinator diversity in production, and functional diversity in genetic resources) are not yet available at the country level. For the ten pilot countries assessed in this report, scores are based on data from 50 measurements feeding into the remaining 16 indicators.
The Agrobiodiversity Index Report 2019: Risk and Resilience is based on version 1.0 of the Agrobiodiversity Index methodology. The Agrobiodiversity Index aims to assess performance yearly and help countries track their progress towards sustainable food systems. Scores will be updated yearly, as countries take actions to sustainably use and conserve agrobiodiversity for healthy diets, sustainable agriculture and future options and as the methodology and databases feeding into the Index improve. We invite constructive feedback to help us improve the next round of measurements so as to ensure the information generated is useful for countries to find and validate their pathways towards sustainable and resilient food systems.
Access the full version of the Agrobiodiversity Index methodology report version 1.0 and its data sources at: https://www.bioversityinternational.org/abd-index/
9
Method in a nutshell
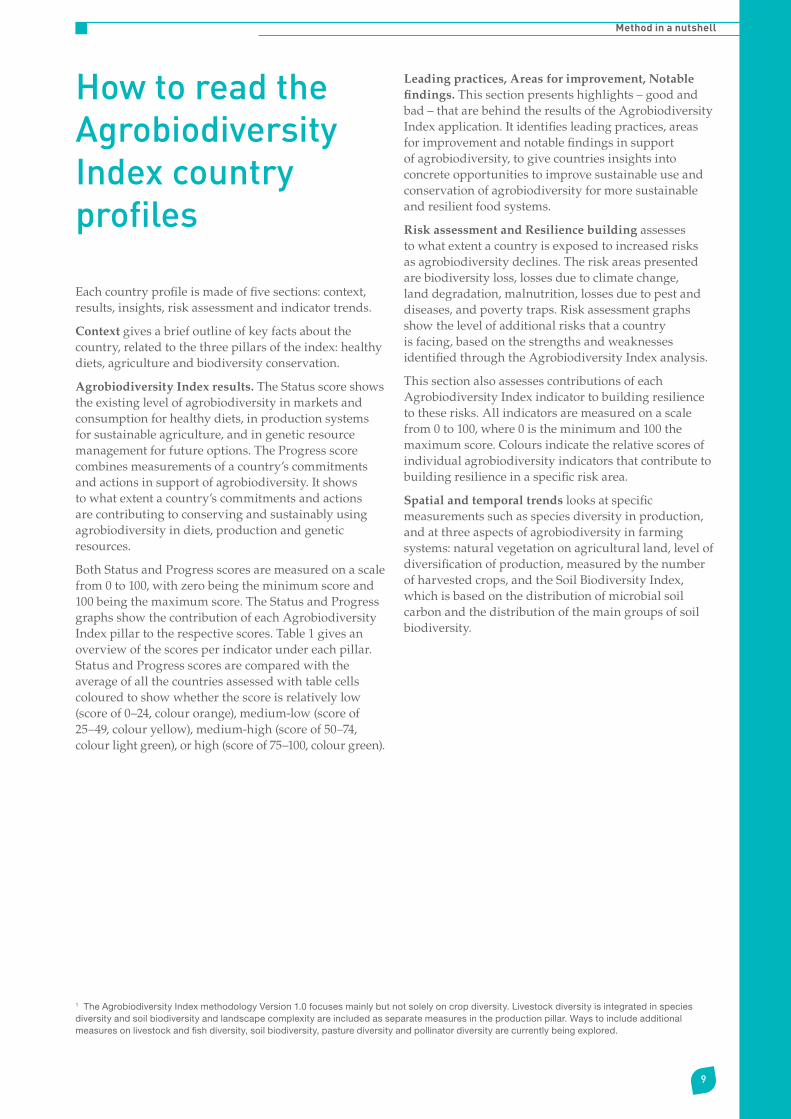
How to read the Agrobiodiversity Index country profiles
Each country profile is made of five sections: context, results, insights, risk assessment and indicator trends.
Context gives a brief outline of key facts about the country, related to the three pillars of the index: healthy diets, agriculture and biodiversity conservation.
Agrobiodiversity Index results. The Status score shows the existing level of agrobiodiversity in markets and consumption for healthy diets, in production systems for sustainable agriculture, and in genetic resource management for future options. The Progress score combines measurements of a country’s commitments and actions in support of agrobiodiversity. It shows to what extent a country’s commitments and actions are contributing to conserving and sustainably using agrobiodiversity in diets, production and genetic resources.
Both Status and Progress scores are measured on a scale from 0 to 100, with zero being the minimum score and 100 being the maximum score. The Status and Progress graphs show the contribution of each Agrobiodiversity Index pillar to the respective scores. Table 1 gives an overview of the scores per indicator under each pillar. Status and Progress scores are compared with the average of all the countries assessed with table cells coloured to show whether the score is relatively low (score of 0–24, colour orange), medium-low (score of 25–49, colour yellow), medium-high (score of 50–74, colour light green), or high (score of 75–100, colour green).
Leading practices, Areas for improvement, Notable findings. This section presents highlights – good and bad – that are behind the results of the Agrobiodiversity Index application. It identifies leading practices, areas for improvement and notable findings in support of agrobiodiversity, to give countries insights into concrete opportunities to improve sustainable use and conservation of agrobiodiversity for more sustainable and resilient food systems.
Risk assessment and Resilience building assesses to what extent a country is exposed to increased risks as agrobiodiversity declines. The risk areas presented are biodiversity loss, losses due to climate change, land degradation, malnutrition, losses due to pest and diseases, and poverty traps. Risk assessment graphs show the level of additional risks that a country is facing, based on the strengths and weaknesses identified through the Agrobiodiversity Index analysis.
This section also assesses contributions of each Agrobiodiversity Index indicator to building resilience to these risks. All indicators are measured on a scale from 0 to 100, where 0 is the minimum and 100 the maximum score. Colours indicate the relative scores of individual agrobiodiversity indicators that contribute to building resilience in a specific risk area.
Spatial and temporal trends looks at specific measurements such as species diversity in production, and at three aspects of agrobiodiversity in farming systems: natural vegetation on agricultural land, level of diversification of production, measured by the number of harvested crops, and the Soil Biodiversity Index, which is based on the distribution of microbial soil carbon and the distribution of the main groups of soil biodiversity.
1 The Agrobiodiversity Index methodology Version 1.0 focuses mainly but not solely on crop diversity. Livestock diversity is integrated in species diversity and soil biodiversity and landscape complexity are included as separate measures in the production pillar. Ways to include additional measures on livestock and fish diversity, soil biodiversity, pasture diversity and pollinator diversity are currently being explored.

Dragon�ies help provide several ecosystem services, including pest control and riparian restoration. Credit: Bioversity International/C. Fadda
Comparison across countries
12
Agrobiodiversity Index Report 2019 – Risk and Resilience
Introduction
A cross-country comparison to stimulate dialogue, feedback and a race to the top
While agrobiodiversity depends very much on the agroecological environment, analyzing trends in its sustainable use and conservation across countries can help governments identify lessons learned, disseminate best practices and find solutions to common problems.
This cross-country analysis aims to stimulate dialogue and exchange on how to better integrate agrobiodiversity into diets, production and genetic resource management to achieve sustainable and resilient food systems, from local to global, and encourage a ‘race to the top’.
Agrobiodiversity Index results across ten countries
The Agrobiodiversity Index Report 2019 is based on a sample of ten pilot countries, which span the continents and cover a large diversity of agroecological and socioeconomic settings.
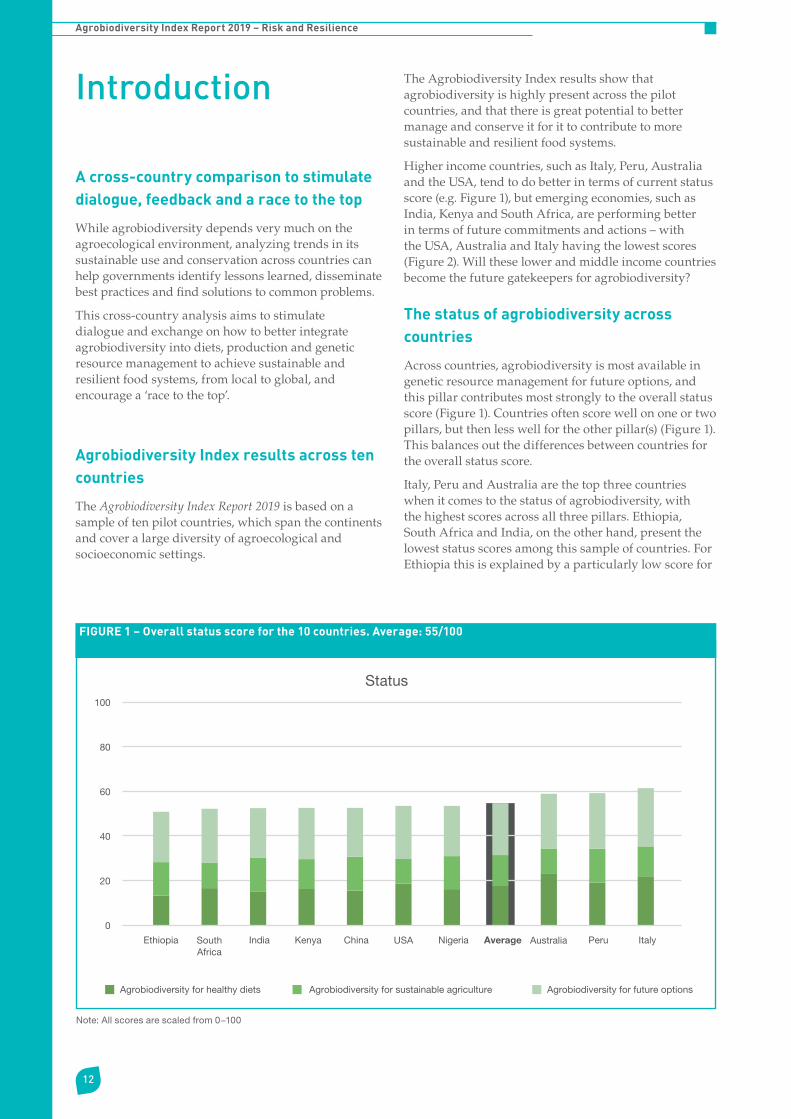
The Agrobiodiversity Index results show that agrobiodiversity is highly present across the pilot countries, and that there is great potential to better manage and conserve it for it to contribute to more sustainable and resilient food systems.
Higher income countries, such as Italy, Peru, Australia and the USA, tend to do better in terms of current status score (e.g. Figure 1), but emerging economies, such as India, Kenya and South Africa, are performing better in terms of future commitments and actions – with the USA, Australia and Italy having the lowest scores (Figure 2). Will these lower and middle income countries become the future gatekeepers for agrobiodiversity?
The status of agrobiodiversity across countries
Across countries, agrobiodiversity is most available in genetic resource management for future options, and this pillar contributes most strongly to the overall status score (Figure 1). Countries often score well on one or two pillars, but then less well for the other pillar(s) (Figure 1). This balances out the differences between countries for the overall status score.
Italy, Peru and Australia are the top three countries when it comes to the status of agrobiodiversity, with the highest scores across all three pillars. Ethiopia, South Africa and India, on the other hand, present the lowest status scores among this sample of countries. For Ethiopia this is explained by a particularly low score for
Note: All scores are scaled from 0−100
FIGURE 1 – Overall status score for the 10 countries. Average: 55/100
0
20
40
60
80
100
Ethiopia South Africa
India Kenya China USA Nigeria Average Australia Peru Italy
Status
Agrobiodiversity for healthy diets Agrobiodiversity for sustainable agriculture Agrobiodiversity for future options
13
Cross Country comparison
agrobiodiversity for healthy diets. South Africa shows a low score in agrobiodiversity for sustainable agriculture, while India presents low scores in agrobiodiversity both for healthy diets and for sustainable agriculture.
Progress towards sustainable use and conservation of agrobiodiversity across countries
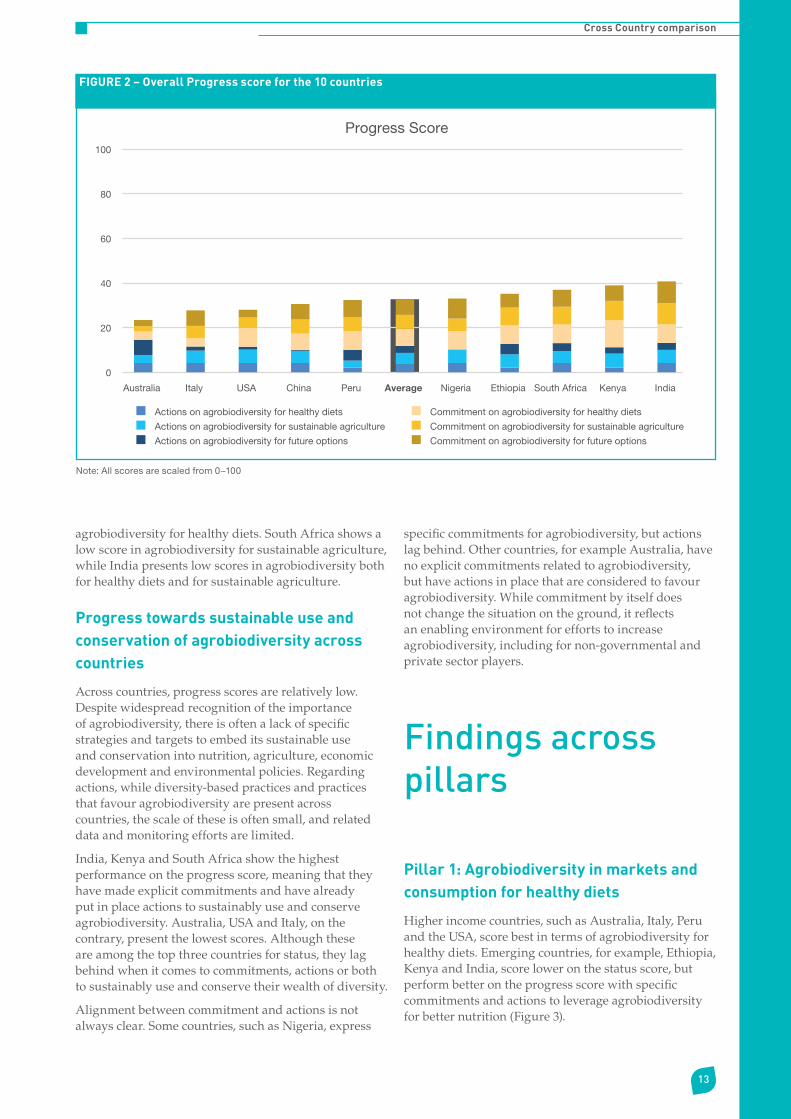
Across countries, progress scores are relatively low. Despite widespread recognition of the importance of agrobiodiversity, there is often a lack of specific strategies and targets to embed its sustainable use and conservation into nutrition, agriculture, economic development and environmental policies. Regarding actions, while diversity-based practices and practices that favour agrobiodiversity are present across countries, the scale of these is often small, and related data and monitoring efforts are limited.
India, Kenya and South Africa show the highest performance on the progress score, meaning that they have made explicit commitments and have already put in place actions to sustainably use and conserve agrobiodiversity. Australia, USA and Italy, on the contrary, present the lowest scores. Although these are among the top three countries for status, they lag behind when it comes to commitments, actions or both to sustainably use and conserve their wealth of diversity.
Alignment between commitment and actions is not always clear. Some countries, such as Nigeria, express
specific commitments for agrobiodiversity, but actions lag behind. Other countries, for example Australia, have no explicit commitments related to agrobiodiversity, but have actions in place that are considered to favour agrobiodiversity. While commitment by itself does not change the situation on the ground, it reflects an enabling environment for efforts to increase agrobiodiversity, including for non-governmental and private sector players.
Findings across pillars
Pillar 1: Agrobiodiversity in markets and consumption for healthy diets
Higher income countries, such as Australia, Italy, Peru and the USA, score best in terms of agrobiodiversity for healthy diets. Emerging countries, for example, Ethiopia, Kenya and India, score lower on the status score, but perform better on the progress score with specific commitments and actions to leverage agrobiodiversity for better nutrition (Figure 3).
Note: All scores are scaled from 0−100
FIGURE 2 – Overall Progress score for the 10 countries
0
20
40
60
80
100
Progress Score
Australia Italy USA China Peru Average Nigeria Ethiopia South Africa Kenya India
Actions on agrobiodiversity for healthy diets
Actions on agrobiodiversity for sustainable agriculture
Actions on agrobiodiversity for future options
Commitment on agrobiodiversity for healthy diets
Commitment on agrobiodiversity for sustainable agriculture
Commitment on agrobiodiversity for future options

14
Agrobiodiversity Index Report 2019 – Risk and Resilience
Italy and Australia stand out in terms of agrobiodiversity in markets and consumption for healthy diets. This is explained by a large species diversity in supply systems (including for fruits, vegetables, legumes, nuts and seeds), a large proportion of calories coming from non-staples, and relatively high diet quality (using DALYs, disability-adjusted life years, a proxy for diet quality). The progress score for sustainable use of agrobiodiversity for healthy diets in these countries is however rather low.
Leveraging the large diversity of available vegetables, fruits, nuts and seeds can help tackle the health risks related to diets too low in those food groups and too high in processed and red meat, and sugar-sweetened beverages.
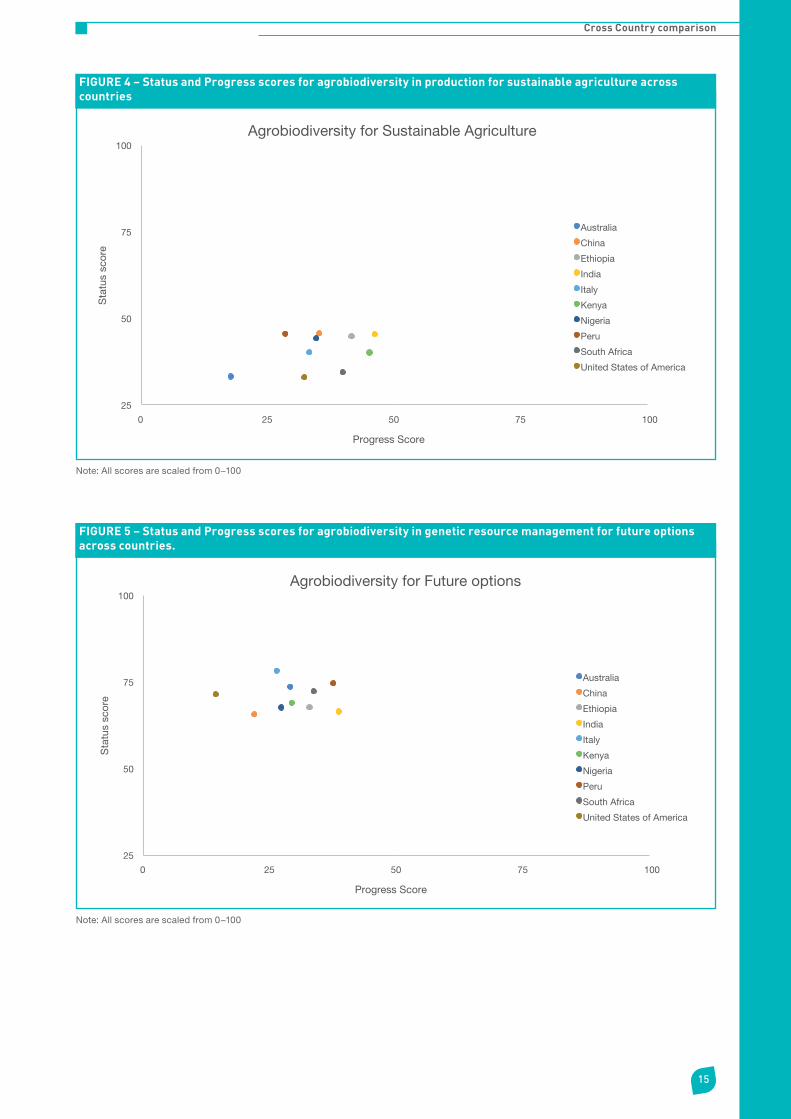
Pillar 2: Agrobiodiversity in production for sustainable agriculture
The presence of agrobiodiversity in sustainable agricultural production systems is the highest in China and Peru (Figure 4). This is mainly explained by the presence of rich species diversity per land unit in China and strong integration of natural vegetation in agricultural land in Peru.
Countries with more industrialized agriculture and large-scale farming, such as Australia, South Africa and the USA, score low on agrobiodiversity for sustainable agriculture. This is explained by large-scale intensification of mainly one or two crops or livestock species. Such monoculture systems increase the
vulnerability of the agroecological systems to climate change, pests and diseases, and land degradation.
Countries greatly differ in terms of their progress score for sustainable agriculture and it will be of interest to compare their various paths moving forward. India, Ethiopia and Kenya show a more explicit interest in agrobiodiversity-based approaches, and present therefore the highest progress score in sustainable production.
Pillar 3: Agrobiodiversity in genetic resource management for future options
Agrobiodiversity in genetic resource management for future options is generally high across countries (Figure 5). Most of them have high diversity in the plant samples conserved ex situ. Across the ten countries, about 1.8 million plant samples are conserved ex situ.
Italy and Australia score high on Status for this pillar thanks to the rich diversity of crop-wild relatives and useful wild plants found in situ, i.e. growing in their natural habitats.
In terms of the Progress score, India and Peru stand out, presenting strong commitments and actions for both ex situ and in situ conservation.
Note: All scores are scaled from 0−100
FIGURE 3 – Status and Progress scores for agrobiodiversity in markets and consumption for healthy diets across countries
25
50
75
100
0 25 50
Sta
tus
scor
e
Progress Score
Agrobiodiversity for Healthy Diets
Australia
China
Ethiopia
India
Italy
Kenya
Nigeria
Peru
South Africa
United States of America
75 100
15
Cross Country comparison
Note: All scores are scaled from 0−100
Note: All scores are scaled from 0−100
FIGURE 4 – Status and Progress scores for agrobiodiversity in production for sustainable agriculture across countries
FIGURE 5 – Status and Progress scores for agrobiodiversity in genetic resource management for future options across countries.
25
50
75
100
0 25 50
Sta
tus
scor
e
Progress Score
Agrobiodiversity for Sustainable Agriculture
Australia
China
Ethiopia
India
Italy
Kenya
Nigeria
Peru
South Africa
United States of America
75 100
25
50
75
100
0 25 50 75 100
Sta
tus
scor
e
Progress Score
Agrobiodiversity for Future options
Australia
China
Ethiopia
India
Italy
Kenya
Nigeria
Peru
South Africa
United States of America

Finger millet (Eleusine coracana). Credit: Bioversity International/N. Capozio

Australia – Country profile

Agrobiodiversity Index Report 2019 – Risk and Resilience
18
FIGURE 1 – Major land use (A) and changes in major land use (B)
Land cover – IPCC categories (2015)
Agriculture Bare areas Forest Grassland Ice and snow Shrubland Sparse vegetation Urban Water Wetland
Land cover change 1992–2015
Gain Loss
Agricultural Forest Grassland Shrubland Wetland Urban Water
A B
Source: Adapted from: A) European Space Agency, 2017;vii B) Nowosad, et al., 2019.viii
Context
• Covering48%ofthecountry’sland(Figure1A),agriculturecontributes3%toAustralia’stotalgrossdomesticproduct.Togetherwiththerelatedsupplychains,agricultureprovidesajobtoover1.6millionpeople.Approximately86,000farmbusinessesinAustraliaprovide93%ofthecountry’sdailydomesticfoodsupply.iInaddition,Australianfarmersexportabout77%ofwhattheygrowandproduce.ThelivestockexportindustryisanimportantpartoftheAustralianagriculturalsectorandvitaltothecountry’sinternationalcompetitiveness.Australiaisalsoamajorgrainproducerandexporter.Wheat,barley,canola(rapeseed),oatsandlupinproducedinthecountryareexportedacrosstheworldforavarietyoffoodandlivestockfeedpurposes.
• InAustralia,over220,000plantaccessionsarestoredinex situgenebanks.Australiaisthepredominantholderofforagelegumegermplasm,with30%oftheworldholdingsofMedicago(aleguminous
forageplant,themostwell-knownspeciesofwhichisalfalfa)attheAustralianMedicagoGeneticResourceCentreand15%oftheworld’scloverholdingsattheWesternAustralianDepartmentofAgriculture.ii
• Amongadults,themortalityrateattributabletoinadequatedietsisrelativelylowat143per100,000people.iiiNonationalleveldataarefoundonminimumdietdiversityofchildrennorchildmalnutritionstatus.iv
• Landusechange,habitatfragmentationanddegradation(Figure1B)areprevalentinmanyareas,andinvasivespecies,particularlyferalanimals,areincreasingthepressuretheyexertonlocalbiodiversity.Impactsofclimatechangeareincreasing.Agriculturaltechniquesinvolvingintensiveuseoffertilizers,pesticidesandlargemachineryputadditionalpressureonlocalecosystems,furtherreducingbiodiversity.vForexample,theGreatBarrierReefoffthecoastofAustraliaisseriouslyaffectedbynutrientandpesticiderunofffromsugarcanefarmingandothertypesofagriculture.vi

Australia – Country profile
19
Agrobiodiversity Index results
• Australiascoresmedium-highforstatusofagrobiodiversity(Figure2A).Theavailabilityofgeneticresourcesforfutureoptionsandagrobiodiversityinmarketsandconsumptionforhealthydietscontributemoststronglytothisscore,butthelevelofagrobiodiversityinproductionismuchlower.Thisindicatesthatagrobiodiversityishighlyavailableingeneticresourcemanagementandinmarketsandconsumption,butthatagriculturalproductionsystemsarenotverydiversified.
• Theprogressscore(Figure2B)showsthatagrobiodiversityrelatedcommitmentandactionsinplaceareratherweak.Mentionsofagrobiodiversityforhealthydiets,sustainableproductionorfutureoptions,andspecificstrategiesandtargetsaremostlymissinginthesourcesanalyzed.Australia
alsoscoreslowforproductionpracticesthatsupportagrobiodiversity,suchasagroforestry,integrationofcrop–livestocksystemsandlimitedoveruseofpesticidesandfertilizers.
• Forstatus,Australiaoutperformsthe10-countryaverage.Australia’shighscoreondiversityinmarketsandconsumptionforhealthierdietsstandsout,whileagrobiodiversityinproductionisbelowaverage.However,Australiaunderperformsontheprogressscorecomparedtothe10-countryaverage.Thishighlightstheriskoflosingagrobiodiversityanditsbenefitsinthefutureandcallsformoreexplicitcommitmentandactionstowardssustainableuseandconservationofagrobiodiversityforcurrentandfutureoptions.
FIGURE 2 – Overview of Agrobiodiversity Index scores for Australia
59%
(A) Status score (B) Progress score
23%
Agrobiodiversity for healthy diets
Agrobiodiversity for sustainable agriculture
Agrobiodiversity for future options
Actions on agrobiodiversity for healthy diets
Actions on agrobiodiversity for sustainable agriculture
Actions on agrobiodiversity for future options
Commitment on agrobiodiversity for healthy diets
Commitment on agrobiodiversity for sustainable agriculture
Commitment on agrobiodiversity for future options
Agrobiodiversity Index Report 2019 – Risk and Resilience
20
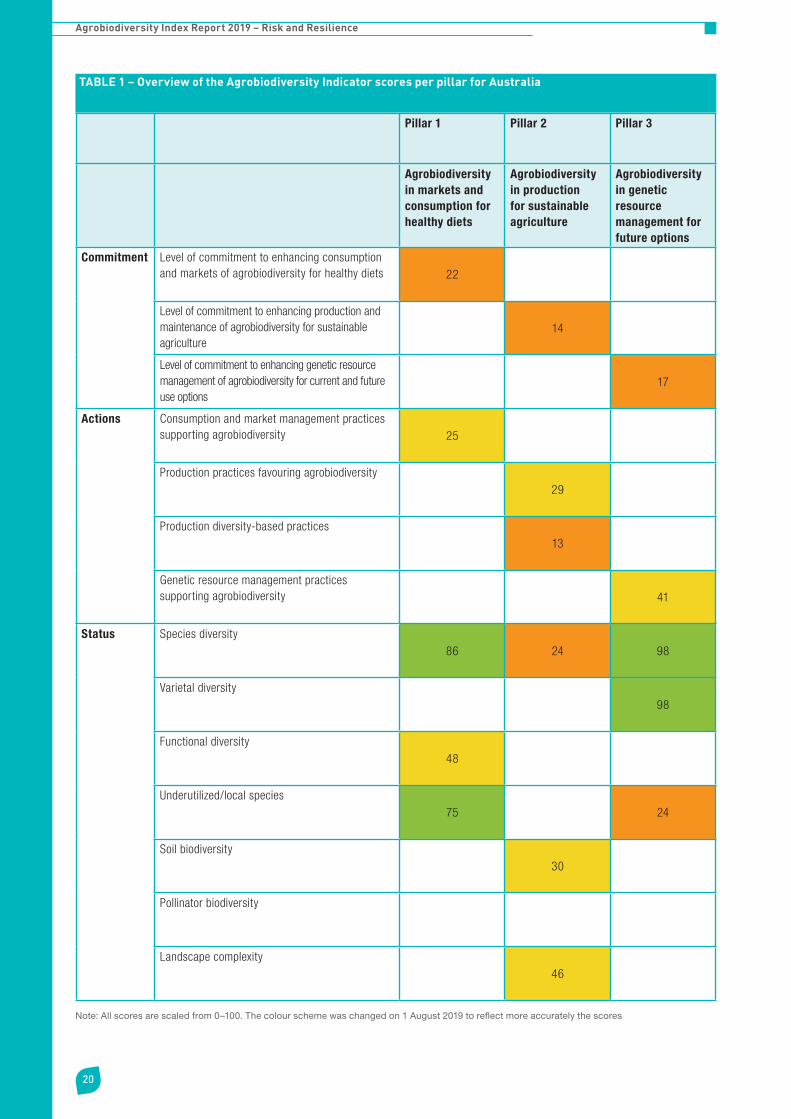
TABLE 1 – Overview of the Agrobiodiversity Indicator scores per pillar for Australia
Pillar 1 Pillar 2 Pillar 3
Agrobiodiversity in markets and consumption for healthy diets
Agrobiodiversity in production for sustainable agriculture
Agrobiodiversity in genetic resource management for future options
Commitment Level of commitment to enhancing consumption and markets of agrobiodiversity for healthy diets 22
Level of commitment to enhancing production and maintenance of agrobiodiversity for sustainable agriculture
14
Level of commitment to enhancing genetic resource management of agrobiodiversity for current and future use options
17
Actions Consumption and market management practices supporting agrobiodiversity 25
Production practices favouring agrobiodiversity 29
Production diversity-based practices 13
Genetic resource management practices supporting agrobiodiversity 41
Status Species diversity86 24 98
Varietal diversity 98
Functional diversity48
Underutilized/local species75 24
Soil biodiversity 30
Pollinator biodiversity
Landscape complexity 46
Note: All scores are scaled from 0–100. The colour scheme was changed on 1 August 2019 to reflect more accurately the scores

Australia – Country profile
21
Leading practices
• Diversityinsupply:About75%ofdietarycaloriescomefromnon-staples,andspeciesdiversityinnationalfoodsupplyishighcomparedtoothercountries.Thedisability-adjustedlifeyearsattributedtoinadequatedietsismedium-lowat2,087per100,000population,reflectingageneralhighdietdiversitybutstilltoolowinvegetables,fruits,wholegrains,nutsandseeds,andtoohighinprocessedmeat,redmeatandsalt.ix
• Conservationagriculture:Conservationagricultureispractisedonabout37%ofAustralia’sagriculturalland.Implementationofconservationagricultureisbasedonlocallydevelopedsetsofpracticesinvolvingintegratedmanagementofcrops,soil,nutrients,water,pests,labourandenergy,toenhanceandsustainanoptimalenvironment.
• Internationalreportingonagrobiodiversity:Australiasystematicallyreportson80%ofindicatorstotheWorldInformationandEarlyWarningSystem(WIEWS)onPlantGeneticResourcesforFoodandAgriculture.
• Integratedex situandin situconservation:Australiacombinesahighdiversityinex situcollections(223,137accessionsarereportedinWIEWS)withalargediversityofcropwildrelativesandamanyusefulwildplants(49%)conservedin situ.Combiningex situandin situconservationisthemostcomprehensivewaytoachievesuccessfulconservation,butthistendstoberareinpractice.x, xiForexample,only0.2%ofthe49%usefulwildplantsthatareconservedin situarestoredex situinthecountry.ThissuggestthatAustraliacanfurtherstrengthenitsactionstocombineex situandin situconservation.
Areas for improvement
• Commitmenttosustainableuseandconservationofagrobiodiversity:Specificcommitmentstomanagingagrobiodiversityforsustainableagriculture,healthydietsandfutureuseoptionsarenotexplicitandcanbestrengthenedthroughstrategiesandtargetsettingrelatedtosustainableuseandconservationofagrobiodiversity.
• Agriculturalproductionpractices:Australiascoreslowforagrobiodiversityinproductionforsustainableagriculture,forbothstatusandprogress.Speciesdiversityinproductionisbelowaverage,thesoilbiodiversityindexislow,andonly46%ofagriculturallandincludesnaturalorsemi-naturalvegetation.Apartfromconservationagriculturepractices,actionsandcommitmenttoincreaseagrobiodiversityinproductionareweak.Only5%ofagriculturallandincludesagroforestry,andonly21%includesintegratedcrop–livestocksystems.Nitrogenuseefficiency(theratiobetweentheamountoffertilizerremovedfromthefieldbythecropandtheamountoffertilizerapplied,whichisconsideredaproxyforavoidedoveruseoffertilizer)isat0.75,abovethe10-countryaverage,butitcanbefurtherimprovedtoavoidharmfuleffectsonAustralia’svulnerableecosystems.
• Children’sdietdiversitydata:Thecountryisencouragedtomakeavailabledataonchildren’sdietdiversity.
Notable findings
• Healthydiets:Australiaperformshigherthanothercountriesinagrobiodiversityforhealthydiets.Thisisexplainedbyhighspeciesdiversityindomesticsupply,andahighnumberofcaloriesfromnon-staples.However,71%ofmenand58%ofwomenareoverweight,xiianddietaryintakeofvegetables,fruits,wholegrains,nutsandseedsisstilllow,whileintakeofprocessedmeat,redmeatandsaltishigh.Whileagrobiodiversityseemspresentinmarketsanddomesticsupply,itisnotknownifandhowtheproductsareconsumed,andcurrentdietsmaybecontributingtohighratesofoverweight.
• Sustainableproduction:Australiascoreslowonagrobiodiversityinproductionforsustainableagriculture.Whilethecountryhasclearcommitmentsforsustainableagriculturalproduction,agrobiodiversityseemsnottobepartofthisagendayet.Improvingagrobiodiversitymanagementinproductionsystems,forexamplethroughmoreagroforestry,naturalvegetation,cropspeciesandcrop–livestockintegration,offersamajoropportunityformoresustainableandresilientagricultureinthecountry.
• Geneticresources:Australiaperformsrelativelywellonbothex situandin situindicatorsofconservation.Thecountrycanimprovethisbyadoptingacomprehensiveapproachtoconservation,combiningin situandex situconservation.

Agrobiodiversity Index Report 2019 – Risk and Resilience
22
Risk assessment
LimitedagrobiodiversityinAustralia’sproductionsystemsexposesthecountrytoincreasedriskforlanddegradationandclimatechangelosses(Figure3).Medium-lowsoilbiodiversity,limitedinterconnectionbetweenagricultureandnaturalvegetation,andlowspeciesdiversityperunitoflandcontributetomakingthisriskhigh.Theabsenceofexplicitstrategiesandactionstoincreaseagrobiodiversityinproductionsystemsfurtherincreasesthoserisks.
Resilience building
Reversingtheriskassessment,currentuseofagrobiodiversityhelpsmoststronglytoreducetheriskofmalnutrition(Figure4),althoughitisuncertainhowthisagrobiodiversityisusedandbywhom.Speciesdiversityindomesticsupplyisrelativelyhighandatleast75%ofdietarycaloriescomefromnon-staplefoods.Thehighscoresingeneticresourcemanagementofagrobiodiversityhelpreducetheriskofbiodiversityloss,throughin situandex situconservation.
FIGURE 3 – Increased risks related to low agrobiodiversity levels in Australia
Pes
ts a
nd d
isea
ses
P
overty trap
Biodiversity loss Clim
ate change
Malnutrition Land degradatio
n
Risks related to low agrobiodiversity
Low High
FIGURE 4 – Contributions of Agrobiodiversity Index indicators to resilience building in Australia
0 20 40 60 80 100
Reducing risk of malnutrition
Reducing risks related to climate changes
Reducing risk of land degradation
Reducing risks related to pests and diseases
Reducing risk of biodiversity loss
Reducing risk of poverty trap
Commitment to agrobiodiversity for healthy diets
Commitment to agrobiodiversity for sustainable agriculture
Commitment to agrobiodiversity for future use options
Production practices favoring agrobiodiversity
Production diversity-based practices
Genetic resource management practices supporting agrobiodiversity
Species diversity
Varietal diversity
Functional diversity
Underutilized/local species
Soil biodiversity
Landscape complexity
Pollinator biodiversity
Consumption and market management practices supporting agrobiodiversity
AUS fig.4
Note: All scores are scaled to a maximum of 100. Colours indicate relative scores of individual agrobiodiversity indicators that contribute to building resilience for that speci�c risk area. No data available for pollinator biodiversity.

Australia – Country profile
23
Indicator trends
Spatial trends
AgriculturalcroplandinAustraliaisconcentratedinthesouthernandeasternregions.About46%ofthislandcontainsaminimumof10%ofnaturalorsemi-naturalvegetation(Figure5A),suggestingthatagricultureismoderatelyintertwinedwiththesurroundingenvironment.ThislandsharingismainlypracticedineasternAustraliaandcontributestoagroecosystemfunctioningandresilience.Cropspeciesdiversityis
generallylowcomparedtoothercountries.Themajorityofagriculturalcroplandhostsfewerthan10cropsperlandunit(10x10km).Cropdiversityislowestinthenortheastandinthesouthwest.Thissuggeststhatproductionsystemscouldbenefitfromdiversificationtoimproveriskmanagementandecosystemfunctioning.Thesoilbiodiversityindex(Figure5C)islowinlargeareasofthecountry(Figure5C),includingsomeoftheagriculturalareas,indicatinglimitationsforagriculturalpotential.NorthernandeasternAustraliahavehighersoilbiodiversity(Figure5C).Thecombinationoflowsoilbiodiversitypotential,lowcropspeciesdiversityandabsenceofnaturalvegetationinagriculturallandinsouthwesternAustraliamakethisareavulnerabletolanddegradation.
FIGURE 5 – Spatial trends in agrobiodiversity indicators for sustainable agriculture, including A) agricultural land with >10% natural or semi-natural vegetation; B) number of harvested crops per pixel, and C) soil biodiversity index
Soil biodiversity indexAgricultural landscapes embedding
Agriculture >= 10% natural vegetation < 10% natural vegetation
No. harvested crops per pixel
0 1-5 6-10 11-22 23-44 >= 45
A B C
Soil biodiversity indexHigh
Low
100km
High
Low
FIGURE 6 – Temporal trends in species diversity in production in Australia (Shannon diversity index)
0.40
0.50
0.60
0.70
0.80
0.90
1.00
1960 1970 1980 1990 2000 2010 2020
Div
ersi
ty
Year
Species Diversity 10 countries Species Diversity Production
Source: FAOxv
Source: Adapted from: A) European Space Agency, 2017; B) Monfreda et al., 2008;xiii C) European Soil Data Center, 2016.xiv
Temporal trends
TemporaltrendsinspeciesdiversityinAustralia’sproductionillustratearatherstableproductiondiversity,butlevelsarebelowthe10-countryaverage(Figure6).Aslightincreaseinspeciesdiversitycanbeobservedmorerecently.Itwillbeofinteresttoexplorehowthistrendfurtherevolves,incombinationalsowiththepercentageofnaturalorsemi-naturalvegetationonagriculturalland.

References
iNationalFarmers’Federation.(2019).Farmfacts[Online].Availableat:https://www.nff.org.au/farm-facts.html
iiFAO2010.TheSecondReportontheStateoftheWorld’sPlantGeneticResourcesforFoodandAgriculture.Rome.Availableat:http://www.fao.org/3/i1500e/i1500e.pdf
iiiAfshin,Ashkan&JohnSur,Patrick&A.Fay,Kairsten&Cornaby,Leslie&Ferrara,Giannina&SSalama,Joseph&CMullany,Erin&Abate,Kalkidan&Cristiana,Abbafati&Abebe,Zegeye&Afarideh,Mohsen&Aggarwal,Anju&Agrawal,Sutapa&Akinyemiju,Tomi&Alahdab,Fares&Bacha,Umar&FBachman,Victoria&Badali,Hamid&Badawi,Alaa.(2019).Healtheffectsofdietaryrisksin195countries,1990–2017:asystematicanalysisfortheGlobalBurdenofDiseaseStudy2017.TheLancet.393.1958-1972.10.1016/S0140-6736(19)30041-8.Availableat:https://www.thelancet.com/journals/lancet/article/PIIS0140-6736(19)30041-8/fulltext
ivUNICEF.(2018).Infantandyoungchildfeedingdatabase[Online].Availableat:https://data.unicef.org/topic/nutrition/infant-and-young-child-feeding/
vCSIRO.(2014).Bioiversity.ScienceandSolutionsforAustralia[Online].Availableat:http://www.publish.csiro.au/ebook/download/pdf/6967
viFAO.(2019).TheStateoftheWorld’sBiodiversityforFoodandAgriculture,J.Bélanger&D.Pilling(eds.).FAOCommissiononGeneticResourcesforFoodandAgricultureAssessments.Rome.572pp.Availableat:http://www.fao.org/3/CA3129EN/CA3129EN.pdf
viiEuropeanSpaceAgency(2017).EuropeanSpaceAgencyLandCoverCCIProductUserguideversion2.0.TechnicalreportYear2015.Availableat:https://maps.elie.ucl.ac.be/CCI/viewer/download/ESACCI-LC-Ph2-PUGv2_2.0.pdf
viiiNowosad,J.,Stepinski,T.F.,Netzel,P.(2019).Global assessment and mapping of changes in mesoscale landscapes: 1992–2015inScienceDirect,Volume78,pp332-340.Doi:https://doi.org/10.1016/j.jag.2018.09.013
ixGlobalNutritionReport.(2018).AustraliaCountrynutritionprofile[Online].Availableat:https://globalnutritionreport.org/nutrition-profiles/oceania/australia-and-new-zealand/australia/#profile)
xFAO.(2019).TheStateoftheWorld’sBiodiversityfor
FoodandAgriculture,J.Bélanger&D.Pilling(eds.).FAOCommissiononGeneticResourcesforFoodandAgricultureAssessments.Rome.572pp.Availableat:http://www.fao.org/3/CA3129EN/CA3129EN.pdf
xiKhoury,ColinK.&Amariles,Daniel&Soto,Stivens&Diaz,María&Sotelo,Steven&SosaArango,Chrystian&Ramírez-Villegas,Julian&Achicanoy,Harold&Velásquez-Tibata,Jorge&Guarino,Luigi&León,Blanca&Navarro-Racines,Carlos&CastanedaAlvarez,Nora&Dempewolf,Hannes&Wiersema,John&Jarvis,Andy.(2018).Comprehensivenessofconservationofusefulwildplants:Anoperationalindicatorforbiodiversityandsustainabledevelopmenttargets.EcologicalIndicators.98.420-429.10.1016/j.ecolind.2018.11.016.Availableat:https://www.sciencedirect.com/science/article/pii/S1470160X18308781
xiiGlobalNutritionReport.(2018).AustraliaCountrynutritionprofile[Online].Availableat:https://globalnutritionreport.org/nutrition-profiles/oceania/australia-and-new-zealand/australia/#profile)
xiiiMonfreda,C.,Ramankutty,N.,Foley,J.A.(2008).Farmingtheplanet:2.Geographicdistributionofcropareas,yields,physiologicaltypes,andnetprimaryproductionintheyear2000.In:GlobalBiogeochemicalCycles,Volume22,Issue1.Doi:10.1029/2007GB002947
xivEuropeanSoilDataCenter.(2016).“GlobalSoilBiodiversityMaps”associatedwiththeGlobalSoilBiodiversityAtlas.JointResearchCentreoftheEuropeanCommission.Availableonlineat:https://esdac.jrc.ec.europa.eu/content/global-soil-biodiversity-maps-0
xvFAO.2019.FoodBalanceSheets.In:FAOSTAT[Online].Availableat:http://www.fao.org/faostat/en/#data/FBS

China – Country profile

Agrobiodiversity Index Report 2019 – Risk and Resilience
26
Context
• InChina,agricultureoccupiesabout56%oftotallandarea(Figure1A)andemploysabout27%ofthepopulation.In2017,thesectorcontributed8%ofgrossdomesticproductandChina’sagriculturalrawmaterialexportsaccountedfor0.4%ofmerchandiseexportsinthesameyear.iThecountryhoststhreemajoragroecologicalzones:apastoralregioninnorthernChina,ariceregioninsouthernChinaandawheatregionacrossthecentre.iiChinaplaysanimportantroleinteaandriceproduction,whicharegrowninthesouthernregion,mostlyfordomesticconsumption.iii
• China,togetherwithNorthandSouthKorea,formsoneoftheeightVavilovcentresoforiginofcultivatedplants,withhighgeneticdiversityforatleast136endemicplants,includingseveral
grains(e.g.rice,sorghum),legumes(e.g.soybean,velvetbean),rootsandtubers(e.g.Chineseyam),vegetablesandfruits(e.g.Chinesecabbage,onion,cucumber,pear,apricot),drugandfibreplants(e.g.ginseng,opium).iv
• Chinahostsoneoftheworld’sfourlargestnationalgenebanksattheChineseAcademyofAgriculturalSciences(ICGR-CAAS),witharound450,000accessionsrepresentingmorethan180plants.
• Around35%ofyoungchildren(6−23months)inthecountryconsumeaminimumdietdiversity.Amongadults,themortalityrateattributabletoinadequatedietsis350per100,000population.v
• Acceleratedurbanization,industrializationandoverexploitation(Figure1B)haveledtohabitatlossandseriouslanddegradation,puttinghigherpressureonagriculturalpotential.viTheIUCNRedListestimatesthatin2015around1,040plantandanimalspeciesacrosstaxawerethreatenedinthecountrydirectlyorindirectlyrelatedtoagriculture.vii
FIGURE 1 – Major land use (A) and changes in major land use (B)
Land cover – IPCC categories (2015)
Agriculture Bare areas Forest Grassland Ice and snow Shrubland Sparse vegetation Urban Water Wetland
A B
Source: Adapted from: A) European Space Agency, 2017;viii B) Nowosad, et al., 2019.ix
Land cover change 1992–2015
Gain Loss
Agricultural Forest Grassland Shrubland Wetland Urban Water
China – Country profile
27
Agrobiodiversity Index results
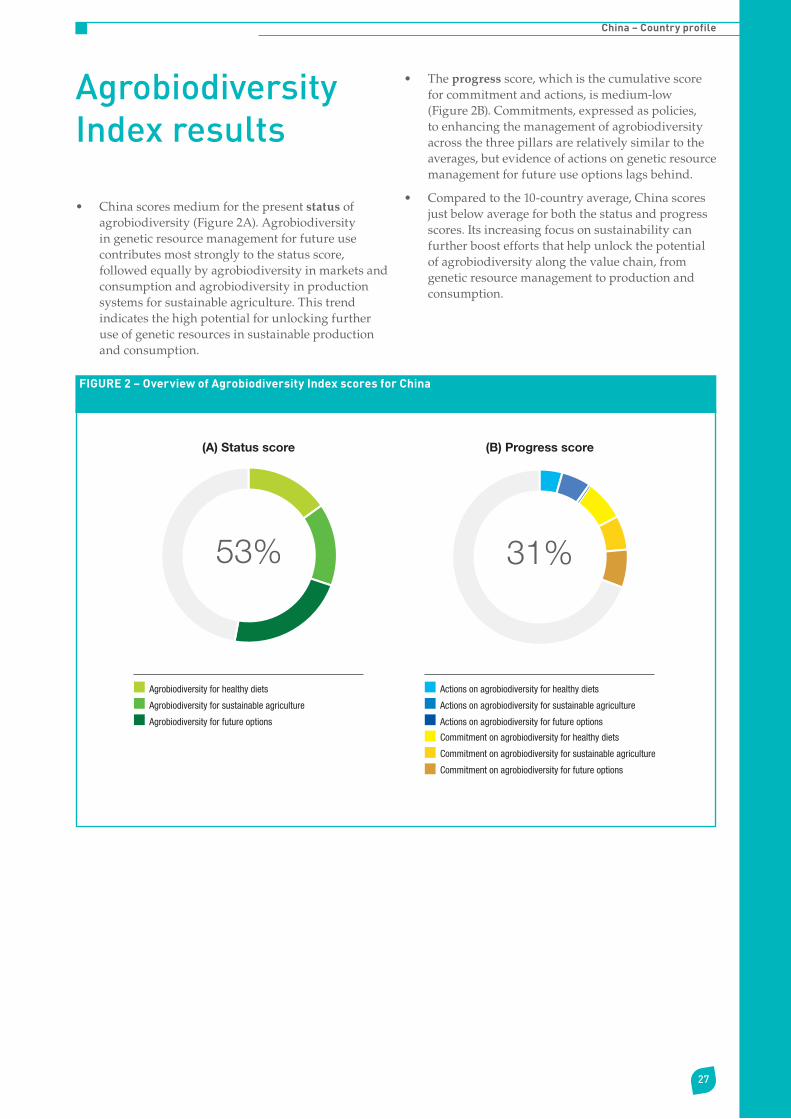
• Chinascoresmediumforthepresentstatusofagrobiodiversity(Figure2A).Agrobiodiversityingeneticresourcemanagementforfutureusecontributesmoststronglytothestatusscore,followedequallybyagrobiodiversityinmarketsandconsumptionandagrobiodiversityinproductionsystemsforsustainableagriculture.Thistrendindicatesthehighpotentialforunlockingfurtheruseofgeneticresourcesinsustainableproductionandconsumption.
• Theprogressscore,whichisthecumulativescoreforcommitmentandactions,ismedium-low(Figure2B).Commitments,expressedaspolicies,toenhancingthemanagementofagrobiodiversityacrossthethreepillarsarerelativelysimilartotheaverages,butevidenceofactionsongeneticresourcemanagementforfutureuseoptionslagsbehind.
• Comparedtothe10-countryaverage,Chinascoresjustbelowaverageforboththestatusandprogressscores.Itsincreasingfocusonsustainabilitycanfurtherboosteffortsthathelpunlockthepotentialofagrobiodiversityalongthevaluechain,fromgeneticresourcemanagementtoproductionandconsumption.
FIGURE 2 – Overview of Agrobiodiversity Index scores for China
53%
(A) Status score (B) Progress score
31%
CHN fig. 2
Agrobiodiversity for healthy diets
Agrobiodiversity for sustainable agriculture
Agrobiodiversity for future options
Actions on agrobiodiversity for healthy diets
Actions on agrobiodiversity for sustainable agriculture
Actions on agrobiodiversity for future options
Commitment on agrobiodiversity for healthy diets
Commitment on agrobiodiversity for sustainable agriculture
Commitment on agrobiodiversity for future options
Agrobiodiversity Index Report 2019 – Risk and Resilience
28
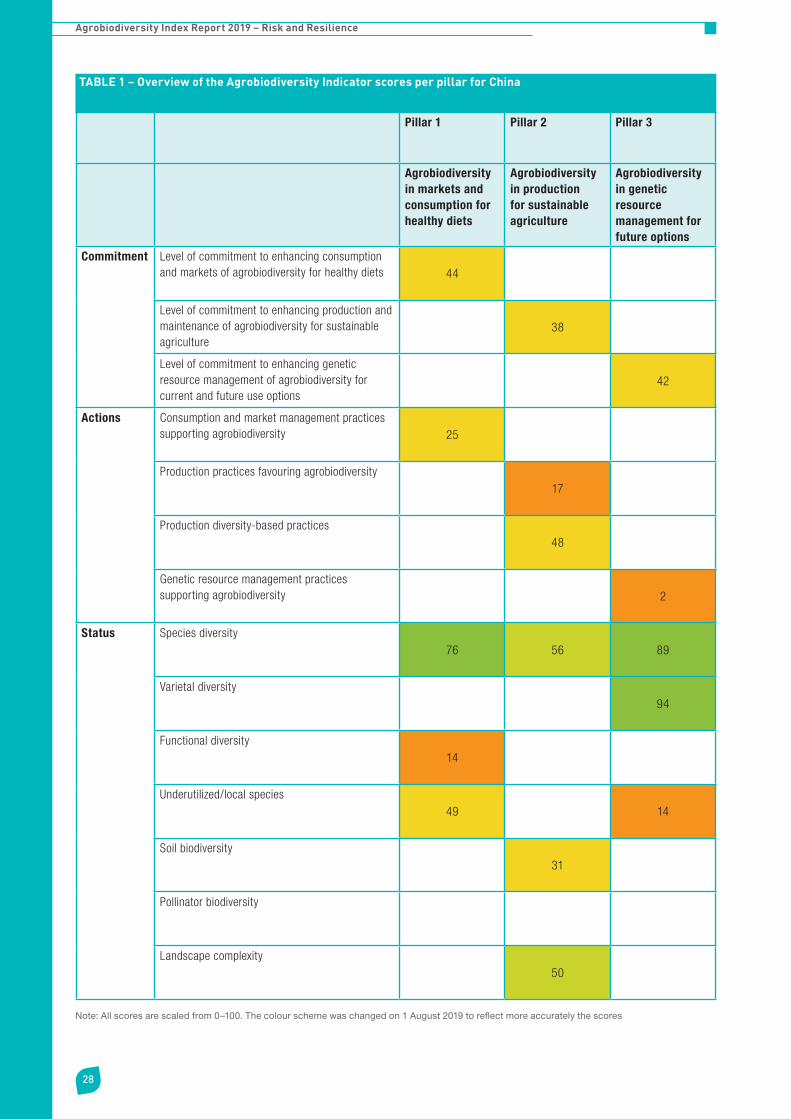
TABLE 1 – Overview of the Agrobiodiversity Indicator scores per pillar for China
Pillar 1 Pillar 2 Pillar 3
Agrobiodiversity in markets and consumption for healthy diets
Agrobiodiversity in production for sustainable agriculture
Agrobiodiversity in genetic resource management for future options
Commitment Level of commitment to enhancing consumption and markets of agrobiodiversity for healthy diets 44
Level of commitment to enhancing production and maintenance of agrobiodiversity for sustainable agriculture
38
Level of commitment to enhancing genetic resource management of agrobiodiversity for current and future use options
42
Actions Consumption and market management practices supporting agrobiodiversity 25
Production practices favouring agrobiodiversity 17
Production diversity-based practices 48
Genetic resource management practices supporting agrobiodiversity 2
Status Species diversity76 56 89
Varietal diversity 94
Functional diversity14
Underutilized/local species49 14
Soil biodiversity 31
Pollinator biodiversity
Landscape complexity 50
Note: All scores are scaled from 0–100. The colour scheme was changed on 1 August 2019 to reflect more accurately the scores

China – Country profile
29
Leading practices
• Speciesdiversity:Chinahashighspeciesdiversityingeneticresourcemanagement,inagriculturalproductionandinmarketsandconsumption.TheimportanceofvegetablesinChina’sproductionandconsumptionpracticescontributetothishighspeciesdiversity.ParticularlyinnortheasternChina,wherefarmsizesareverysmall,speciesdiversityisveryhigh.x
• Afforestationandagroecology:Chinaleadslarge-scaleafforestationprogrammeswhich,between2010and2015havecontributedtonetgainsinforestaccountingto1.5millionhaxiand,relevantforagrobiodiversity,tolargeramountsofnaturalvegetationonagriculturalland.InecologicallyfragilezonesinnorthwesternChina,Chinapromotesagroecology,alongwithecotourismandrotationalgrazing,toimprovethelivingstandardsoflocalfarmersandlivestockkeeperswhileconservingbiodiversity,includingagrobiodiversity.xii
• Newfood-baseddietaryguidelines:China’sNationalNutritionPlan(2017–2030)aimstoachieveahealthycountryby2030,increasingpeople’snutritionandhealthliteracy,andreducingprevalenceofanaemia,stuntingandobesity.ThenewlyrevisedChineseDietaryGuidelines,whichtargetspecificpopulations,suchasinfantsandchildrenunderdifferentages,vegetariansandpregnantwomen,aimtoincreasepublicawarenessofhealthydiversediets.xiii
Areas for improvement
• Geneticresourcemanagementpractices:CropwildrelativesofelevengloballyimportantcropsarefoundinChinaandabout17%ofnationalhigh-prioritynativecropwildrelativesareconsideredthreatenedornearthreatened.xiv
Thecountryis,therefore,encouragedtodevelopsystematiccropwildrelativeconservationplanningaswellastoimplementpoliciestosupporttheconservationandsustainableuseofagrobiodiversityforagricultureandfoodsecurity.
• Internationalreportingonagrobiodiversity:WhileChinamanagesalargediversityofplantaccessionsex situ,informationontheseaccessionsisnotyetavailableintheWorldInformationand
EarlyWarningSystem(WIEWS)onPlantGeneticResourcesforFoodandAgriculture.However,Chinahascontributedanin-depthcountryreporttotheFAOState of the World’s Biodiversity for Food and Agriculture 2019,indicatingthatithasdevelopedanationalbiodiversitymonitoringnetwork,includingtheuseofahabitat-qualityindex,toevaluatethebiodiversitymaintenancefunctionofhabitats.
• Sustainableproductionpractices:Landareasunderproductionpracticesthatsupportagrobiodiversityarelimited.Forexample,agroforestryoccupiesonly12%ofland,conservationagriculture6%,andorganicagriculture0.3%.Nitrogen-useefficiency(theratiobetweentheamountoffertilizerremovedfromthefieldbythecropandtheamountoffertilizerapplied),consideredasaproxyforavoidedoveruseofnitrogen,islowat0.27,highlightingtheriskoffertilizeroveruse.
Notable findings
• Agrobiodiversityinproduction:Outof122cropsforwhichglobalproductiondataareavailable,Chinacultivatesalmostallwith118intotal.Preliminaryvarietalinformationindicatesthatlandracesandoldcultivarsofrice,wheat,soybean,potato,milletandyamhavebeenrelativelywellconservedbutendemicspeciessuchastea,appleandpeardemandurgentconservationactions.
• Crop–livestockintegration:84%ofChina’sagriculturallandintegratescropandlivestockproduction.Suchintegratedsystemscancontributetomoreclosedandefficientnutrientcycles,soilfertility,anddiversifiedandresilientproductionsystems.
• Agrobiodiversitymonitoring:China’s12th5-yearPlanforAgriculturalTechnologyDevelopment,compiledbytheMinistryofAgriculture,includesmonitoringofbiodiversityinagroecologicalsystems.Chinahasbeeninvolvedinlarge-scalesurveys,suchastheSixthNationalForestResourcesInventory,theNationalWetlandSurvey,theNationalWildlifeResourcesSurveyandtheNationalSurveyonLivestockGeneticResources,resultinginthepublicationofinventoriessuchastheChina Red Data Book on Endangered Animals.Anationalforest,agriculturalandmarineresourcemonitoringsystemhasbeenestablishedatmunicipalandcountylevelstosupportmonitoringoftrendsinspeciesdiversity.
• Wild-foodresources:Chinanotesthatdevelopmentanduseofwild-foodresourceshasattractedtheattentionoflocalgovernmentsandenterprises,creatingjobopportunitiesandincentivizingenvironmentalprotection.xv

Agrobiodiversity Index Report 2019 – Risk and Resilience
30
Risk assessment
Chinaisexposedtomediumlevelsofrisksrelatedtolowagrobiodiversity(Figure3).Thiscanbeexplainedbythemedium-weakexplicitcommitmentsandactionstomanageanduseagrobiodiversityasanadaptationmechanism.Theriskformalnutrition,climatechangeandbiodiversitylossareslightlyhigher.Despitehighspeciesdiversity,morethan50%ofdietarycaloriescomefromstaples,especiallyrice.Consumptionoffruits,legumesandwholegrainsisfarbelowtherecommendedvalues.xviForevery100,000peopleinChina,7,054disability-adjustedlifeyearsareattributedtoinadequatediets.
Resilience building
Reversingtheriskassessment,existingagrobiodiversityandrelatedactionsandcommitmentshelpbuildresiliencetomultiplerisks(Figure4).CurrentagrobiodiversitymanagementinChinacontributesmostsignificantlytomanagingrisksrelatedtopests
anddiseases,throughtheavailabilityofwithin-speciesdiversity,highspeciesdiversityandintegrationofnaturalvegetationinagriculturalland.
FIGURE 3 – Increased risks related to low agrobiodiversity levels in China
Pes
ts a
nd d
isea
ses
P
overty trap
Biodiversity loss Clim
ate change
Malnutrition Land degradatio
n
Risks related to low agrobiodiversity
Low High
FIGURE 4 – Contributions of Agrobiodiversity Index indicators to resilience building in China
Reducing risk of malnutrition
Reducing risks related to climate changes
Reducing risk of land degradation
Reducing risks related to pests and diseases
Reducing risk of biodiversity loss
Reducing risk of poverty trap
0 20 40 60 80 100
CHN fig.4Commitment to agrobiodiversity for healthy diets
Commitment to agrobiodiversity for sustainable agriculture
Commitment to agrobiodiversity for future use options
Production practices favouring agrobiodiversity
Production diversity-based practices
Genetic resource management practices supporting agrobiodiversity
Species diversity
Varietal diversity
Functional diversity
Underutilized/local species
Soil biodiversity
Landscape complexity
Pollinator biodiversity
Consumption and market management practices supporting agrobiodiversity
Note: All scores are scaled to a maximum of 100. Colours indicate relative scores of individual agrobiodiversity indicators that contribute to building resilience for that speci�c risk area. No data available for pollinator biodiversity.

China – Country profile
31
FIGURE 5 – Spatial trends in agrobiodiversity indicators for sustainable agriculture, including A) agricultural land with >10% natural or semi-natural vegetation; B) number of harvested crops per pixel, and C) soil biodiversity index
Soil biodiversity indexAgricultural landscapes embedding
Agriculture >= 10% natural vegetation < 10% natural vegetation
No. harvested crops per pixel
0 1-5 6-10 11-22 23-44 >= 45
A B C
Soil biodiversity indexHigh
Low
100km
High
Low
Source: Adapted from: A) European Space Agency, 2017; B) Monfreda et al., 2008;xviii C) European Soil Data Center, 2016.xix
Indicator trends
Spatial trends
InChina,50%ofagriculturallandcontainsaminimumof10%ofnaturalorsemi-naturalvegetation(Figure5A).ThemapindicatesthatagricultureismoreintertwinedwithnaturalvegetationinsouthernChina,comparedtonortheasternareasofthecountry.Onthecontrary,
cropspeciesdiversityisveryhighinnortheasternChina,wherefarmssizesareverysmall,xviiandlowerinsouthernChina(Figure5B).Comparedtoothercountries,speciesdiversityperunitoflandishighacrossthewholecountry(Figure5B).Thesoilbiodiversityindex(Figure5C)ismedium-lowinthenorthwesternaridarea,wherefragileecosystemsexist,andintheeasternagriculturalarea,wherethereisalowerproportionofnaturalvegetation.Improvedmanagementoftheintersectionofnaturalvegetationinagriculturallandintheseareascanhelpincreasesoilbiodiversityandecosystemresilience.
FIGURE 6 – Temporal trends in species diversity in production in China (Shannon diversity index)
0.40
0.50
0.60
0.70
0.80
0.90
1.00
1960 1970 1980 1990 2000 2010 2020
Div
ersi
ty
Year
Species Diversity 10 countries Species Diversity Production
Source: FAO, 2019xx
Temporal trends
Overall,speciesdiversityinproductionincreasedbetween1975and1995,reachinglevelsaboveaverage.AftertheGreatChineseFaminebetween1959and1961,speciesdiversitystartedincreasinginthe1970s,inparallelwiththecountry’seconomicdevelopment.From1995onwards,speciesdiversityinproductionhasremainedstable,whilethecountry’seconomyhastransformedvastly.
References
iWorldBank.(2019).Agriculturalrawmaterialsexports(%ofmerchandiseexports).In:The World Bank[Online].Availableat:https://data.worldbank.org/indicator/TX.VAL.AGRI.ZS.UN
iiLeeming,F.(1987).PhysicalGeographyofChina.BySongqiao.Zhao[BeijingandNewYork,SciencePressandJohnWiley,1986,244pp.£24-95.].TheChinaQuarterly,112,671-672.doi:10.1017/S0305741000027259
iiiCommodity.com.(2019).China’sMainCommodityImports&Exports:WhyCotton&CrudeOilTopTheLists.In:Commodity.com[Online].Availableat:https://commodity.com/china/
ivConventiononBiologicalDiversity.China’sSixthNationalReport.Availableat:https://www.cbd.int/doc/world/cn/cn-nbsap-v2-en.pdf
vAfshin,Ashkan&JohnSur,Patrick&A.Fay,Kairsten&Cornaby,Leslie&Ferrara,Giannina&SSalama,Joseph&CMullany,Erin&Abate,Kalkidan&Cristiana,Abbafati&Abebe,Zegeye&Afarideh,Mohsen&Aggarwal,Anju&Agrawal,Sutapa&Akinyemiju,Tomi&Alahdab,Fares&Bacha,Umar&FBachman,Victoria&Badali,Hamid&Badawi,Alaa.(2019).Healtheffectsofdietaryrisksin195countries,1990–2017:asystematicanalysisfortheGlobalBurdenofDiseaseStudy2017.TheLancet.393.1958-1972.10.1016/S0140-6736(19)30041-8.Availableat:https://www.thelancet.com/journals/lancet/article/PIIS0140-6736(19)30041-8/fulltext
viGovernmentofChina.(2011).ChinaNationalBiodiversityConservationStrategyandActionPlan(2011-2030).Availableat:https://www.cbd.int/doc/world/cn/cn-nbsap-v2-en.pdf
viiIUCN.(2015).RedList.Threatenedspeciesineachcountry.Availableat:http://cmsdocs.s3.amazonaws.com/summarystats/2015_2_Summary_Stats_Page_Documents/2015_2_RL_Stats_Table_5.pdf
viiiEuropeanSpaceAgency(2017).EuropeanSpaceAgencyLandCoverCCIProductUserguideversion2.0.TechnicalreportYear2015.Availableat:https://maps.elie.ucl.ac.be/CCI/viewer/download/ESACCI-LC-Ph2-PUGv2_2.0.pdf
ixNowosad,J.,Stepinski,T.F.,Netzel,P.(2019).Global assessment and mapping of changes in mesoscale landscapes: 1992–2015inScienceDirect,Volume78,pp332-340.Doi:https://doi.org/10.1016/j.jag.2018.09.013
xHerrero,Mario&Thornton,Philip&Power,Brendan&Bogard,Jessica&Remans,Roseline&Fritz,Steffen&SGerber,James&Nelson,Gerald&See,Linda&Waha,Katharina&Watson,Reg&West,Paul&Samberg,Leah&vandeSteeg,Jeannette&Stephenson,Eloise&VanWijk,Mark&Havlík,Petr.(2017).Farmingandthegeographyofnutrientproductionforhumanuse:atransdisciplinaryanalysis.TheLancetPlanetaryHealth.1.33-42
xiFAO.(2019).TheStateoftheWorld’sBiodiversityforFoodandAgriculture,J.Bélanger&D.Pilling(eds.).FAOCommissiononGeneticResourcesforFoodandAgricultureAssessments.Rome.572pp.Availableat:http://www.fao.org/3/CA3129EN/CA3129EN.pdf
xiiFAO.(2019).TheStateoftheWorld’sBiodiversityforFoodandAgriculture,J.Bélanger&D.Pilling(eds.).FAOCommissiononGeneticResourcesforFoodandAgricultureAssessments.Rome.572pp.Availableat:http://www.fao.org/3/CA3129EN/CA3129EN.pdf
xiiiWHO.(2017).Globalnutritionpolicyreview2016-2017:countryprogressincreatingenablingpolicyenvironmentsforpromotinghealthydietsandnutrition.Geneva:WorldHealthOrganization;2018.Availableat:https://apps.who.int/iris/bitstream/handle/10665/275990/9789241514873-eng.pdf?ua=1
xivKell,S.,Qin,H.,Chen,B.,Ford-Lloyd,B.,Wei,W.,Kang,D.,&Maxted,N.(2015).China’scropwildrelatives:Diversityforagricultureandfoodsecurity.Agriculture, Ecosystems & Environment,209,138-154.
xvFAO.(2019).TheStateoftheWorld’sBiodiversityforFoodandAgriculture,J.Bélanger&D.Pilling(eds.).FAOCommissiononGeneticResourcesforFoodandAgricultureAssessments.Rome.572pp.Availableat:http://www.fao.org/3/CA3129EN/CA3129EN.pdf
xviGlobalNutritionReport.(2018).ChinaCountrynutritionprofile[Online].Availableat:https://globalnutritionreport.org/nutrition-profiles/asia/eastern-asia/china
xviiHerrero,Mario&Thornton,Philip&Power,Brendan&Bogard,Jessica&Remans,Roseline&Fritz,Steffen&SGerber,James&Nelson,Gerald&See,Linda&Waha,Katharina&Watson,Reg&West,Paul&Samberg,Leah&vandeSteeg,Jeannette&Stephenson,Eloise&VanWijk,Mark&Havlík,Petr.(2017).Farmingandthegeographyofnutrientproductionforhumanuse:atransdisciplinaryanalysis.TheLancetPlanetaryHealth.1.33-42
xviiiMonfreda,C.,Ramankutty,N.,Foley,J.A.(2008).Farmingtheplanet:2.Geographicdistributionofcropareas,yields,physiologicaltypes,andnetprimaryproductionintheyear2000.In:GlobalBiogeochemicalCycles,Volume22,Issue1.Doi:10.1029/2007GB002947
xixEuropeanSoilDataCenter.(2016).“GlobalSoilBiodiversityMaps”associatedwiththeGlobalSoilBiodiversityAtlas.JointResearchCentreoftheEuropeanCommission.Availableonlineat:https://esdac.jrc.ec.europa.eu/content/global-soil-biodiversity-maps-0
xxFAO.2019.FoodBalanceSheets.In:FAOSTAT[Online].Availableat:http://www.fao.org/faostat/en/#data/FBS

Ethiopia – Country profile
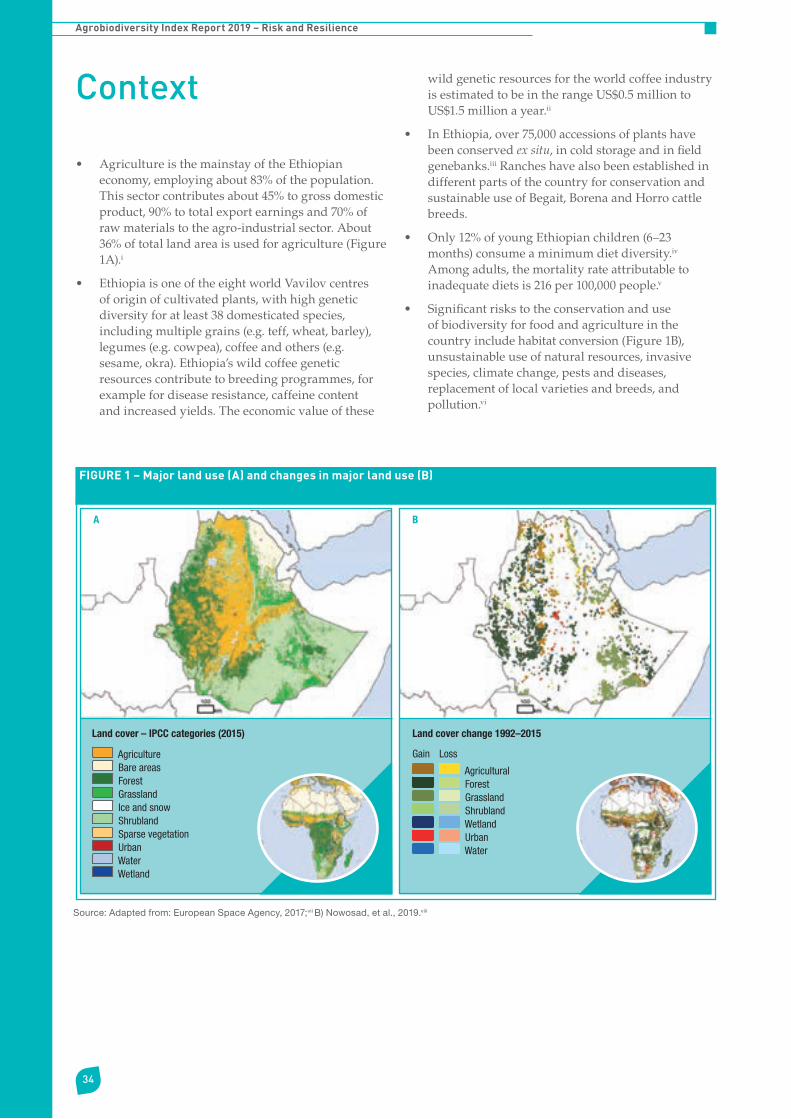
Agrobiodiversity Index Report 2019 – Risk and Resilience
34
Context
• AgricultureisthemainstayoftheEthiopianeconomy,employingabout83%ofthepopulation.Thissectorcontributesabout45%togrossdomesticproduct,90%tototalexportearningsand70%ofrawmaterialstotheagro-industrialsector.About36%oftotallandareaisusedforagriculture(Figure1A).i
• EthiopiaisoneoftheeightworldVavilovcentresoforiginofcultivatedplants,withhighgeneticdiversityforatleast38domesticatedspecies,includingmultiplegrains(e.g.teff,wheat,barley),legumes(e.g.cowpea),coffeeandothers(e.g.sesame,okra).Ethiopia’swildcoffeegeneticresourcescontributetobreedingprogrammes,forexamplefordiseaseresistance,caffeinecontentandincreasedyields.Theeconomicvalueofthese
wildgeneticresourcesfortheworldcoffeeindustryisestimatedtobeintherangeUS$0.5milliontoUS$1.5millionayear.ii
• InEthiopia,over75,000accessionsofplantshavebeenconservedex situ,incoldstorageandinfieldgenebanks.iiiRancheshavealsobeenestablishedindifferentpartsofthecountryforconservationandsustainableuseofBegait,BorenaandHorrocattlebreeds.
• Only12%ofyoungEthiopianchildren(6–23months)consumeaminimumdietdiversity.ivAmongadults,themortalityrateattributabletoinadequatedietsis216per100,000people.v
• Significantriskstotheconservationanduseofbiodiversityforfoodandagricultureinthecountryincludehabitatconversion(Figure1B),unsustainableuseofnaturalresources,invasivespecies,climatechange,pestsanddiseases,replacementoflocalvarietiesandbreeds,andpollution.vi
FIGURE 1 – Major land use (A) and changes in major land use (B)
Land cover – IPCC categories (2015)
Agriculture Bare areas Forest Grassland Ice and snow Shrubland Sparse vegetation Urban Water Wetland
Land cover change 1992–2015
Gain Loss
Agricultural Forest Grassland Shrubland Wetland Urban Water
A B
Source: Adapted from: European Space Agency, 2017;vii B) Nowosad, et al., 2019.viii

Ethiopia – Country profile
35
Agrobiodiversity Index results
• Ethiopiahasamiddle-rangescoreforthecurrentstatusofagrobiodiversity(Figure2A).Agrobiodiversityingeneticresourcemanagementforfutureoptionsaddsmoststronglytothestatusscore,followedbyagrobiodiversityinproductionsystemsforsustainableagriculture,andagrobiodiversityinmarketsandconsumptionforhealthydiets.Thistrendindicatesthatgeneticresourcesarehighlyavailableandcanbefurtherunlockedforsustainableuseinproductionandconsumption.
• Theprogress scorecombiningcommitmentandactionsismedium-low(Figure2B).Specificstrategiesandtargetstousetheavailableagrobiodiversityaremostlymissinginthesourcesanalyzed.Onthepositiveside,thecountryshowsagreatambitiontodiversifydietsaspartofitsNationalNutritionProgramme2016−2020andNutritionSensitiveAgricultureStrategy2016.
• Comparedtothe10-countryaverage,Ethiopiascoresjustbelowaverageforstatusandaboveaverageforprogress.Itsincreasingfocusonandcommitmenttotheroleofagrobiodiversityfornutritioncantriggerdemandthathelpsunlockthepotentialofagrobiodiversityalongthevaluechain,fromgeneticresourcemanagementtoproductionandconsumption.
FIGURE 2 – Overview of Agrobiodiversity Index scores for Ethiopia
Agrobiodiversity for healthy diets
Agrobiodiversity for sustainable agriculture
Agrobiodiversity for future options
51%
(A) Status score (B) Progress score
35%
ETH fig. 2
Actions on agrobiodiversity for healthy diets
Actions on agrobiodiversity for sustainable agriculture
Actions on agrobiodiversity for future options
Commitment on agrobiodiversity for healthy diets
Commitment on agrobiodiversity for sustainable agriculture
Commitment on agrobiodiversity for future options
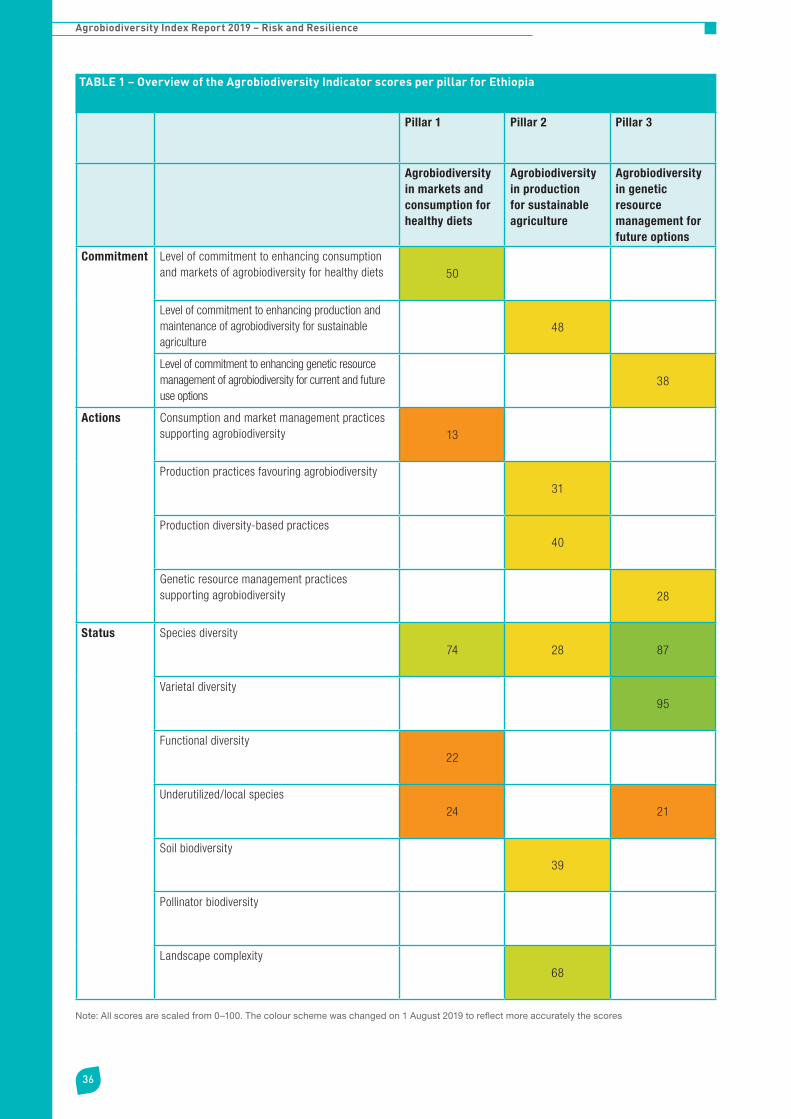
Agrobiodiversity Index Report 2019 – Risk and Resilience
36
TABLE 1 – Overview of the Agrobiodiversity Indicator scores per pillar for Ethiopia
Pillar 1 Pillar 2 Pillar 3
Agrobiodiversity in markets and consumption for healthy diets
Agrobiodiversity in production for sustainable agriculture
Agrobiodiversity in genetic resource management for future options
Commitment Level of commitment to enhancing consumption and markets of agrobiodiversity for healthy diets 50
Level of commitment to enhancing production and maintenance of agrobiodiversity for sustainable agriculture
48
Level of commitment to enhancing genetic resource management of agrobiodiversity for current and future use options
38
Actions Consumption and market management practices supporting agrobiodiversity 13
Production practices favouring agrobiodiversity 31
Production diversity-based practices 40
Genetic resource management practices supporting agrobiodiversity 28
Status Species diversity74 28 87
Varietal diversity 95
Functional diversity22
Underutilized/local species24 21
Soil biodiversity 39
Pollinator biodiversity
Landscape complexity 68
Note: All scores are scaled from 0–100. The colour scheme was changed on 1 August 2019 to reflect more accurately the scores

Ethiopia – Country profile
37
Leading practices• Commitment to promoting agrobiodiversity for
food security and nutrition:Ethiopiashowsastrongcommitmenttoimprovingdietqualityandnutrition,asdeclaredintheSeqotadeclaration,NationalNutritionProgramme2016−2020andNutritionSensitiveAgricultureStrategy2016.Thegovernmenthascommittedtoendinghungerandmalnutritionby2030by:ensuringfoodaccess,affordability,diversityandnutritionalqualityathouseholdlevelinbothruralandurbancommunities;safeguardingdomesticagriculturalproductionasthemainsourceofsuchdiets;andimprovinghumanhealth,whichhaspositiveeffectsonagriculturalproductivityinlabour-intensivesmallholderfarmingsystems.Thegovernmentaimstobridgethegapsinnutritionthroughprogrammesthatnotonlyfocusonhigh-valuecropsbutpromotediversifiedandnutritionallyrichcrops,forinstanceusingindigenousvarieties.
• Landscape-based initiatives:Ethiopia’sSustainableLandManagementprojectisanationalprogrammethatimplementslandscape-basedinitiativestoprotectbiodiversityforfoodandagriculturethroughwatershedmanagement,infrastructurebuildingandlandcertification,amongothers.Theprojecthasmadeasubstantialcontributiontoimprovingnaturalresourcemanagementinruralareas,throughcommunity-drivenplanningandimplementationof45participatoryWatershedManagementPlans,whichintegratedsoilandwaterconservationmeasuresincommunalhillsidesandindividualfarmland.
• International reporting on agrobiodiversity:Ethiopiasystematicallyreportson84%ofindicatorstotheWorldInformationandEarlyWarningSystem(WIEWS)onPlantGeneticResourcesforFoodandAgriculture,andcontributedanin-depthcountryprofiletotheFAOState of the World’s Biodiversity for Food and Agriculture 2019.
• Exsitu conservation:InEthiopia,over75,000samplesofplantshavebeenconservedunderex situconditions.Twelvefieldgenebanksandsixcommunityseedbankshavebeenestablishedtoconservecoffee,medicinalplantsandforestspecies.In situconservationisalsoontherise:13in situconservationsitesforplantshavebeenestablishedand8additionalsitesareunderestablishmenttoconserveenset(auniqueEthiopianbanana),durumwheat,teff,coffee,medicinalplantsandforestplantspecies.
Areas for improvement• Diversity in markets and consumption for healthy
diets:DietdiversityinEthiopiaislow.Only24%ofcaloriesforhumanconsumptioncomefromnon-staplesandconsumptionofvegetables,fruits,nutsandanimal-basedproductsisbelowtherecommendedvalues.Whilechronicundernutritionhasdeclined,itremainshigh,affectingalmost38%ofchildrenunderfivein2016.ixNationalprogrammes,suchastheNationalNutritionProgramme2016−2020andNutritionSensitiveAgricultureStrategy2016includeprioritiestoincreasebiodiversityinfoodandagriculture.Improvingmarketfunctioningforlocalfreshproducts,stakeholderinvolvement,capacitybuildingandaddressinggenderaspectswillbecrucialtomaketheseplanseffective.x,xi
• Sustainable production practices:Percentagesofagriculturallandwithpracticesthatsupportagrobiodiversityarelow.Forexample,only11%ofagriculturallandincludesagroforestry.Inadequatewatermanagement,overgrazing,uncontrolledforestclearingandoverharvestingaresomeoftheunsustainablepracticesinplace,whichhavenegativeimpactsonbiodiversityand/orwildfoods.xii
• Conservation of useful wild plants:Only3%ofusefulwildplansareadequatelyconservedex situand39%in situ.xiiiIntegrationoftheseplantsinexistingstronggeneticresourcemanagementsystemsisencouraged.
Notable findings• Sustainable production practices:About68%of
Ethiopia’sagriculturallandintegratescropandlivestockproduction.Suchintegratedsystemscancontributetomoreefficientnutrientcycles,soilfertility,agriculturaldiversificationandresiliencetoclimaticandeconomicshocks.Inaddition,67%ofagriculturallandincludesmorethan10%ofnaturalorsemi-naturalvegetation,suggestingthatagricultureiswellintegratedwiththesurroundingecosystem.
• Linking genetic resources, markets and nutrition: Ethiopiaisrecognizedworldwideasacentreofagrobiodiversity,anditisoneofthefastestgrowingcountriesintermsofpopulationandeconomy,whichincreasestheriskoflosingbiodiversity.However,Ethiopiahasthebasicstructuresinplace(genebanks,sustainablelandmanagementandstrongcommitmentonnutrition)tosafeguardandsustainablyuseitsagrobiodiversityforinnovation,adaption,andimprovingnutrition,whiletransitioningeconomicallyanddemographically.

Agrobiodiversity Index Report 2019 – Risk and Resilience
38
Risk assessment
Multiplerisksrelatedtolowagrobiodiversityarehigh(Figure3).Theriskofmalnutritionstandsout.Thisismainlyexplainedbythelargeproportionofdietarycaloriescomingfromstaples(76%),thelimitedspeciesdiversityinsupply,andtheabsenceofnationalfood-baseddietaryguidelines(whichareunderdevelopment).
Theriskofagriculturallossesduetoclimatechangeispartlyexplainedbylowspeciesdiversityinproductioninvastareas,aswellasmedium-weakcommitmentstomanagingandusingagrobiodiversityinagricultureasaclimatechangeadaptationoption.
Resilience building
Reversingtheriskassessment,theexistingagrobiodiversityandrelatedactionsandcommitmentshelpbuildresiliencetovariousrisks(Figure4).CurrentagrobiodiversitymanagementinEthiopiacontributes
mostsignificantlytomanagingrisksrelatedtopestanddiseases,throughtheuseandconservationofvarietaldiversity.
FIGURE 3 – Increased risks related to low agrobiodiversity levels in Ethiopia
Pes
ts a
nd d
isea
ses
P
overty trap
Biodiversity loss Clim
ate change
Malnutrition Land degradatio
n
Risks related to low agrobiodiversity
Low High
FIGURE 4 – Contributions of Agrobiodiversity Index indicators to resilience building in Ethiopia
0 20 40 60 80 100
Reducing risk of malnutrition
Reducing risks related to climate changes
Reducing risk of land degradation
Reducing risks related to pests and diseases
Reducing risk of biodiversity loss
Reducing risk of poverty trap
ETH fig.4Commitment to agrobiodiversity for healthy diets
Commitment to agrobiodiversity for sustainable agriculture
Commitment to agrobiodiversity for future use options
Production practices favouring agrobiodiversity
Production diversity-based practices
Genetic resource management practices supporting agrobiodiversity
Species diversity
Varietal diversity
Functional diversity
Underutilized/local species
Soil biodiversity
Landscape complexity
Pollinator biodiversity
Consumption and market management practices supporting agrobiodiversity
Note: All scores are scaled to a maximum of 100. Colours indicate relative scores of individual agrobiodiversity indicators that contribute to building resilience for that speci�c risk area. No data available for pollinator biodiversity.

Ethiopia – Country profile
39
Indicator trends
Spatial trends
InEthiopia,67%ofagriculturallandcontainsaminimumof10%ofnaturalorsemi-naturalvegetation(Figure5A),suggestingthatagricultureisintertwinedwithnaturalvegetation.Continued
managementoftherelationshipbetweenagricultureandnaturalvegetationiscriticalforagriculturalandenvironmentalsustainability.Thecountryisveryheterogeneous,with10ecosystems,18majorand49minoragroecologicalzones.Thenumberofcropspeciesharvestedperlandunitstronglyvariesacrossthecountry,withmorediversifiedproductionsystemsbeingconcentratedinthehighlands(Figure5B).Thiscontributestomoreresiliencetoclimateandpestanddiseaseshocks.Soilbiodiversitypotential(Figure5C)ishighinthemainagriculturalareas,suggestinghighpotentialfordiversifiedsystemsandlandrestoration.
FIGURE 5 – Spatial trends in agrobiodiversity indicators for sustainable agriculture, including A) agricultural land with >10% natural or semi-natural vegetation; B) number of harvested crops per pixel, and C) soil biodiversity index
Soil biodiversity indexAgricultural landscapes embedding
Agriculture >= 10% natural vegetation Forest
No. harvested crops per pixel
0 1-5 6-10 11-22 23-44 >= 45
A B C
Soil biodiversity indexHigh
Low
100km
High
Low
FIGURE 6 – Temporal trends in species diversity in production in Ethiopia (Shannon diversity index)
Source: Adapted from: A) European Space Agency, 2017; B) Monfreda et al., 2008;xiv C) European Soil Data Center, 2016.xv
0.40
0.50
0.60
0.70
0.80
0.90
1.00
1960 1970 1980 1990 2000 2010 2020
Div
ersi
ty
Year
Species Diversity 10 countries Species Diversity Production
Source: FAO, 2019xvi
Temporal trends
Whileremainingrelativelyhighandabovethe10-countryaverage,speciesdiversityinagriculturalproductionhasbeendecliningfrom1960onwards,particularlybetween1975and1995(Figure6).Speciesdiversitythenstagnatedinthe2000sandhasveryslowlyincreasedagainmorerecently.
References
iWorldBank.(2019).Agriculturalland(%oflandarea)data.In:The World Bank[Online].Availableat:https://data.worldbank.org/indicator/ag.lnd.agri.zs
iiFAO.(2019).TheStateofEthiopia’sBiodiversityforFoodandAgriculture.Rome.Availableat:http://www.fao.org/3/CA3490EN/ca3490en.pdf
iiiFAO.(2019).TheStateofEthiopia’sBiodiversityforFoodandAgriculture.Rome.Availableat:http://www.fao.org/3/CA3490EN/ca3490en.pdf
ivUNICEF.(2018).Infantandyoungchildfeedingdatabase[Online].Availableat:https://data.unicef.org/topic/nutrition/infant-and-young-child-feeding/
vAfshin,Ashkan&JohnSur,Patrick&A.Fay,Kairsten&Cornaby,Leslie&Ferrara,Giannina&SSalama,Joseph&CMullany,Erin&Abate,Kalkidan&Cristiana,Abbafati&Abebe,Zegeye&Afarideh,Mohsen&Aggarwal,Anju&Agrawal,Sutapa&Akinyemiju,Tomi&Alahdab,Fares&Bacha,Umar&FBachman,Victoria&Badali,Hamid&Badawi,Alaa.(2019).Healtheffectsofdietaryrisksin195countries,1990–2017:asystematicanalysisfortheGlobalBurdenofDiseaseStudy2017.TheLancet.393.1958-1972.10.1016/S0140-6736(19)30041-8.Availableat:https://www.thelancet.com/journals/lancet/article/PIIS0140-6736(19)30041-8/fulltext
viFAO.(2019).TheStateofEthiopia’sBiodiversityforFoodandAgriculture.Rome.Availableat:http://www.fao.org/3/CA3490EN/ca3490en.pdf
viiEuropeanSpaceAgency(2017).EuropeanSpaceAgencyLandCoverCCIProductUserguideversion2.0.TechnicalreportYear2015.Availableat:https://maps.elie.ucl.ac.be/CCI/viewer/download/ESACCI-LC-Ph2-PUGv2_2.0.pdf
viiiNowosad,J.,Stepinski,T.F.,Netzel,P.(2019).Global assessment and mapping of changes in mesoscale landscapes: 1992–2015inScienceDirect,Volume78,pp332-340.Doi:https://doi.org/10.1016/j.jag.2018.09.013
ixGlobalNutritionReport.(2018).EthiopiaCountrynutritionprofile[Online].Availableat:https://globalnutritionreport.org/nutrition-profiles/africa/eastern-africa/ethiopia/
xGebru,Mestawet;Remans,Roseline;Brouwer,Inge;Baye,Kaleab;Melesse,MequanintBiset;Covic,Namukolo;Habtamu,Fekadu;Abay,AlemHadera;Hailu,Tesfaye;Hirvonen,Kalle;Kassaye,Tarik;Kennedy,Gina;Lachat,Carl;Lemma,Ferew;McDermott,John;Minten,Bart;Moges,Tibebu;Reta,Fidaku;Tadesse,Eneye;Taye,Tamene;Truebswasser,Ursula;andVandenberg,Marrit.2018.FoodsystemsforhealthierdietsinEthiopia:Towardaresearchagenda.IFPRIDiscussionPaper1720.Washington,DC:InternationalFoodPolicyResearchInstitute(IFPRI).Availableat:http://ebrary.ifpri.org/cdm/ref/collection/p15738coll2/id/132417
xiFAO.(2019).TheStateofEthiopia’sBiodiversityforFoodandAgriculture.Rome.Availableat:http://www.fao.org/3/CA3490EN/ca3490en.pdf
xiiFAO.(2019).TheStateofEthiopia’sBiodiversityforFoodandAgriculture.Rome.Availableat:http://www.fao.org/3/CA3490EN/ca3490en.pdf
xiiiKhoury,ColinK.&Amariles,Daniel&Soto,Stivens&Diaz,María&Sotelo,Steven&SosaArango,Chrystian&Ramírez-Villegas,Julian&Achicanoy,Harold&Velásquez-Tibata,Jorge&Guarino,Luigi&León,Blanca&Navarro-Racines,Carlos&CastanedaAlvarez,Nora&Dempewolf,Hannes&Wiersema,John&Jarvis,Andy.(2018).Comprehensivenessofconservationofusefulwildplants:Anoperationalindicatorforbiodiversityandsustainabledevelopmenttargets.EcologicalIndicators.98.420-429.10.1016/j.ecolind.2018.11.016.Availableat:https://www.sciencedirect.com/science/article/pii/S1470160X18308781
xivMonfreda,C.,Ramankutty,N.,Foley,J.A.(2008).Farmingtheplanet:2.Geographicdistributionofcropareas,yields,physiologicaltypes,andnetprimaryproductionintheyear2000.In:GlobalBiogeochemicalCycles,Volume22,Issue1.Doi:10.1029/2007GB002947
xvEuropeanSoilDataCenter.(2016).“GlobalSoilBiodiversityMaps”associatedwiththeGlobalSoilBiodiversityAtlas.JointResearchCentreoftheEuropeanCommission.Availableonlineat:https://esdac.jrc.ec.europa.eu/content/global-soil-biodiversity-maps-0
xviFAO.2019.FoodBalanceSheets.In:FAOSTAT[Online].Availableat:http://www.fao.org/faostat/en/#data/FBS

India – Country profile

Agrobiodiversity Index Report 2019 – Risk and Resilience
42
FIGURE 1 – Major land use (A) and changes in major land use (B)
Land cover – IPCC categories (2015)
Agriculture Bare areas Forest Grassland Ice and snow Shrubland Sparse vegetation Urban Water Wetland
A B
Source: Adapted from: A) European Space Agency, 2017;vii B) Nowosad, et al., 2019.viii
Land cover change 1992–2015
Gain Loss
Agricultural Forest Grassland Shrubland Wetland Urban Water
Context
• With60%oftotallandarea,agriculturedominatestheIndianlandscape(Figure1A).Theagriculturalsectorprovides45%ofemploymentandcontributes16%ofgrossdomesticproduct.Today,Indiaistheworld’slargestproducerofmilk,pulsesandjute,andranksasthesecondlargestproducerofrice,wheat,sugarcane,groundnut,vegetables,fruitandcotton.Thecountryisalsooneoftheleadingproducersofspices,fish,poultry,livestockandplantationcrops.i
• Indiaisoneoftheworld’seightVavilovcentresoforiginofcultivatedplants,withhighgeneticdiversityforatleast172domesticatedspecies,includingmanylegumes(e.g.chickpea,pigeonpea),vegetables(e.g.eggplant,cucumber),tubers(e.g.taro,yam),fruits(mango,citron,tamarind),spicesanddyes.iiTheProtectionofPlantVarieties
andFarmers’RightsAuthorityofIndiaidentifiesupto22differentagrobiodiversityhotspotsinthecountry.Hundredsofspeciesandvarietiesofcropsanddomesticatedanimalshaveoriginatedhereandaretheresultofthousandsofyearsoffarmers’selectionandbreedingefforts.iii
• Indiahostsoneoftheworld’sfourlargestnationalgenebanksattheNationalBureauofPlantGeneticResources(NBPGR),andmorethan400,000plantaccessionsarereportedintheWorldInformationandEarlyWarningSystem(WIEWS)onPlantGeneticResourcesforFoodandAgriculture.
• Only20%ofyoungchildren(6−23monthsold)inIndiaconsumeaminimumdietdiversity.ivAmongadults,themortalityrateattributabletoinadequatedietsis310per100,000people.v
• Significantriskstoagrobiodiversityincluderapidpopulationgrowthandurbanization(Figure1B),pollution,invasivespecies,unsustainableuseofnaturalresources,climatechange,pestsanddiseases.vi
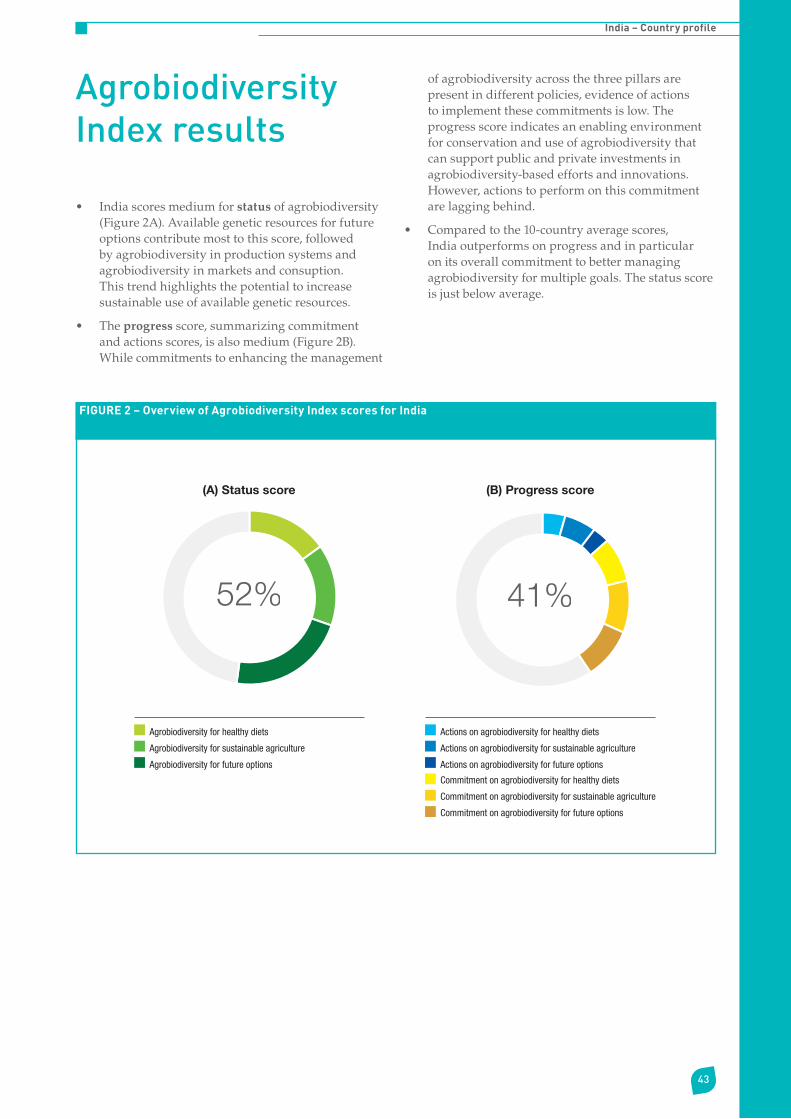
India – Country profile
43
Agrobiodiversity Index results
• Indiascoresmediumforstatusofagrobiodiversity(Figure2A).Availablegeneticresourcesforfutureoptionscontributemosttothisscore,followedbyagrobiodiversityinproductionsystemsandagrobiodiversityinmarketsandconsuption.Thistrendhighlightsthepotentialtoincreasesustainableuseofavailablegeneticresources.
• Theprogressscore,summarizingcommitmentandactionsscores,isalsomedium(Figure2B).Whilecommitmentstoenhancingthemanagement
ofagrobiodiversityacrossthethreepillarsarepresentindifferentpolicies,evidenceofactionstoimplementthesecommitmentsislow.Theprogressscoreindicatesanenablingenvironmentforconservationanduseofagrobiodiversitythatcansupportpublicandprivateinvestmentsinagrobiodiversity-basedeffortsandinnovations.However,actionstoperformonthiscommitmentarelaggingbehind.
• Comparedtothe10-countryaveragescores,Indiaoutperformsonprogressandinparticularonitsoverallcommitmenttobettermanagingagrobiodiversityformultiplegoals.Thestatusscoreisjustbelowaverage.
FIGURE 2 – Overview of Agrobiodiversity Index scores for India
52%
(A) Status score (B) Progress score
41%
IND fig. 2
Agrobiodiversity for healthy diets
Agrobiodiversity for sustainable agriculture
Agrobiodiversity for future options
Actions on agrobiodiversity for healthy diets
Actions on agrobiodiversity for sustainable agriculture
Actions on agrobiodiversity for future options
Commitment on agrobiodiversity for healthy diets
Commitment on agrobiodiversity for sustainable agriculture
Commitment on agrobiodiversity for future options

Agrobiodiversity Index Report 2019 – Risk and Resilience
44
TABLE 1 – Overview of the Agrobiodiversity Indicator scores per pillar for India
Pillar 1 Pillar 2 Pillar 3
Agrobiodiversity in markets and consumption for healthy diets
Agrobiodiversity in production for sustainable agriculture
Agrobiodiversity in genetic resource management for future options
Commitment Level of commitment to enhancing consumption and markets of agrobiodiversity for healthy diets 50
Level of commitment to enhancing production and maintenance of agrobiodiversity for sustainable agriculture
57
Level of commitment to enhancing genetic resource management of agrobiodiversity for current and future use options
58
Actions Consumption and market management practices supporting agrobiodiversity 25
Production practices favouring agrobiodiversity 25
Production diversity-based practices 45
Genetic resource management practices supporting agrobiodiversity 19
Status Species diversity79 72 93
Varietal diversity 94
Functional diversity14
Underutilized/local species43 13
Soil biodiversity 37
Pollinator biodiversity
Landscape complexity 27
Note: All scores are scaled from 0–100. The colour scheme was changed on 1 August 2019 to reflect more accurately the scores

India – Country profile
45
Leading practices
• Commitmenttosustainableuseandconservationofagrobiodiversityforhealthydiets:Acrosspolicies,Indiahasexpressedspecificcommitmentstosustainablyusingandconservingitsagrobiodiversitytocontributetohealthydiets,sustainableagriculture,andcurrentandfutureoptions.Indiahasalsodevelopedlocallyadaptedfood-baseddietaryguidelinesthatpromotefooddiversity,andhasmadeavailablenationalfoodcompositiontablesatspeciesand,insomecases,varietylevel.
• Speciesdiversity:Indiascoreshighintermsofspeciesdiversityacrossallthreepillars:inmarketsandconsumption,inproductionandingeneticresourcemanagement.Thisispairedwithintegratedcrop–livestocksystems,whichcharacterizeabout82%ofIndia’sagriculturalland.Suchintegratedsystemscontributetomoreclosedandefficientnutrientcycles,soilfertilityandcropdiversification.
Areas for improvement
• Naturalvegetationinagriculturalland:Only27%ofagriculturallandincludesatleast10%ofnaturalvegetation(Figure5A),suggestingthatintegrationbetweenagricultureandnaturecanbeimproved.Forexample,agroforestryisestimatedtobepresentononly7%ofagriculturalland.Recognizingthisissue,IndiahasadoptedaNationalAgroforestryPolicy,backedwithacapitaloutlayofUS$450millionforfouryears(2017to2020),ixwhichisexpectedtohaveapositiveimpactonagroforestryandnaturalvegetationinagriculturalland.
• Agrobiodiversityforhealthydiets:InIndia,morethan50%ofdietarycaloriescomefrommajorstaples.Legumesandwholegrainsreachadequatelevels,butaveragedietsfallshortofvegetables,fruitsandsomeanimal-basedproducts.xThiscontributesto7,149disability-adjustedlifeyearsper100,000population,attributabletoinadequatediets.Thehighlevelsofagrobiodiversityresourcescanhelptoaddressthis.
• Geneticresourcemanagementpractices:While401,727plantaccessionsarestoredex situandreportedinWIEWS,only0.8%ofusefulwildplantsareconservedex situandabout24%in situ.
• Internationalreportingonagrobiodiversity:IndiahassubmittedadetailedcountryprofiletotheFAOState of the World’s Biodiversity for Food and Agriculture 2019andreportsonaregularbaseinWIEWS,butonlyfor55%oftheindicators.
Notable findings
• Intensificationanddiversifiedproductionsystems:WhileIndiahasinvestedheavilyinagriculturalintensification,ingeneral,India’sagriculturalproductionsystemsremaindiverseintermsofcropandlivestockspecies.On66%ofIndia’sagriculturalland,morethantencropsareharvestedonanannualbasis.Thereisalsostrongcrop–livestockintegration,asobservedonmorethan80%ofIndia’sagriculturalland.Outof122cropswithglobaldatasets,80−about65%−arereportedtobeharvestedinIndia.Despitetherelativelyhighspeciesdiversityinproductionandsupply,themajorityofdietarycalories(57%)comefrommajorgrains,andhealthrisksattributabletoinadequatedietsarehigh.Thereispotentialtoleveragethevastamountofagrobiodiversitytohelpimprovedietaryqualityinthecountry.
• Soilbiodiversity:Recognizingthedegradationofsoilqualityasaresultofexcessiveuseofagrochemicals,inappropriateagriculturalpractices,climatechange,andrepeatedfloodsamongothercauses,theIndiangovernmentestablishedtheNationalBureauofAgriculturallyImportantMicroorganismsin2001andhasastrongcommitmenttoimprovingsoilhealthandsoilbiodiversity.xi
• Homegardens:Whileglobalstatisticsonhomegardensandrelatedagrobiodiversityarelacking,studiesinIndiaindicatehomegardensareanimportantandwidespreadpracticesupportingfarmers’agrobiodiversity.xii

Agrobiodiversity Index Report 2019 – Risk and Resilience
46
Risk assessment
Agrobiodiversitystatusandlimitedactionstomanageagrobiodiversityleadtorelativelyhighlevelsofrisksacrossallsixareas(Figure3).Thisispartlyexplainedbythelowscoresforactionsinsupportofsustainableuseofagrobiodiversity.Contributingtotheparticularlyhighriskformalnutritionisthelargeproportion(57%)ofdietarycaloriesprovidedbystaples,andthehighnumberofdisability-adjustedlifeyearsattributabletodietaryrisks(7,149per100,000in2017)relatedtodietsthataretoolowinhealthyfoods(suchasfruits,vegetables,legumes,wholegrains,nuts)ortoohighinunhealthyfoods(suchassugar-sweetenedbeverages,processedmeat).xiiiContributingtothehighriskofbiodiversitylossisthelowscoreforthecomprehensiveconservationofusefulwildplants:only0.8%ofusefulwildplantsareadequatelyconservedex situand24.3%in situ.xiv
Resilience building
Reversingtheriskassessment,theexistingagrobiodiversityandrelatedactionsandcommitmenthelpbuildresiliencetovariousrisks(Figure4).Current
agrobiodiversitymanagementinIndiacontributesmostsignificantlytomanagingrisksrelatedtopestsanddiseases.
FIGURE 3 – Increased risks related to low agrobiodiversity levels in India
Pes
ts a
nd d
isea
ses
P
overty trap
Biodiversity loss Clim
ate change
Malnutrition Land degradatio
n
Risks related to low agrobiodiversity
Low High
FIGURE 4 – Contributions of Agrobiodiversity Index indicators to resilience building in India
Reducing risk of malnutrition
Reducing risks related to climate changes
Reducing risk of land degradation
Reducing risks related to pests and diseases
Reducing risk of biodiversity loss
Reducing risk of poverty trap
0 20 40 60 80 100
IND fig.4Commitment to agrobiodiversity for healthy diets
Commitment to agrobiodiversity for sustainable agriculture
Commitment to agrobiodiversity for future use options
Production practices favouring agrobiodiversity
Production diversity-based practices
Genetic resource management practices supporting agrobiodiversity
Species diversity
Varietal diversity
Functional diversity
Underutilized/local species
Soil biodiversity
Landscape complexity
Pollinator biodiversity
Consumption and market management practices supporting agrobiodiversity
Note: All scores are scaled to a maximum of 100. Colours indicate relative scores of individual agrobiodiversity indicators that contribute to building resilience for that speci�c risk area. No data available for pollinator biodiversity.

India – Country profile
47
FIGURE 5 – Spatial trends in agrobiodiversity indicators for sustainable agriculture, including A) agricultural land with >10% natural or semi-natural vegetation; B) number of harvested crops per pixel, and C) soil biodiversity index
Soil biodiversity indexAgricultural landscapes embedding
Agriculture >= 10% natural vegetation < 10% natural vegetation
No. harvested crops per pixel
0 1-5 6-10 11-22 23-44 >= 45
A B C
Soil biodiversity indexHigh
Low
100km
High
Low
Source: Adapted from: A) European Space Agency, 2017; B) Monfreda et al., 2008;xvi C) European Soil Data Center, 2016.xvii
Indicator trends
Spatial trends
InIndia,only27%ofagriculturallandcontainsaminimumof10%ofnaturalorsemi-naturalvegetation(Figure5A),suggestingthatthereislittleintegrationofagriculturewiththesurroundingenvironment.Aminimumpercentageofnaturalorsemi-naturalvegetationinagriculturallandscapesisimportanttoprovideecosystemservicessuchaspollination,soilfertility,waterretentionandbiodiversityhabitat.Managementofnaturallandwithinagriculturallandscapesisstronglyencouragedforagriculturalandenvironmentalsustainability.ItisthereforeverypromisingthatIndiahasadoptedaNational
AgroforestryPolicysince2014,anditwillbeimportanttomonitorchangesinagroforestryandnaturalvegetationinagriculturallandasthepolicyisimplemented.
Indiaishighlydiverse,anddiversifiedproductionsystemsarefoundacrossthecountry.On66%oftheagriculturalland,morethantencropsareharvestedonanannualbaseacrossseasons,withsomeexceptionsinareasinRajasthan,Chhattisgarh,HimachalPradeshandUttarakhandwherecropdiversityislower(Figure5B).
RisksforlowsoilbiodiversityareobservedacrossthecountrybutparticularlyinthenorthwesternareasofRajasthanandPunjab(Figure5C).Recognizingsoilhealthissuesrelatedtounsustainableagriculturalpracticesandoveruseoffertilizersandpesticides,theIndiangovernmenthasestablishedtheNationalBureauofAgriculturallyImportantMicroorganismsin2001andhassincehadastrongcommitmenttoimprovingsoilhealthandsoilbiodiversity.xv
FIGURE 6 – Temporal trends in species diversity in production in India (Shannon diversity index)
0.40
0.50
0.60
0.70
0.80
0.90
1.00
1960 1970 1980 1990 2000 2010 2020
Div
ersi
ty
Year
Species Diversity 10 countries Species Diversity Production
Source: FAOxv
Temporal trends
SpeciesdiversityinproductioninIndiahasgenerallyremainedstablefrom1965to2000,withsomepeaksinthe1980s(Figure6).Theincreaseinspeciesdiversityfrom2000to2005couldbeexplainedbyanimprovedcommitmentsinagriculturalpoliciestoenhancingconservationanduseofagrobiodiversity,whilerecognizingsomeofthetradeoffsofthegrain-focusedGreenRevolution.Thisincreaselevelsoffaround2005,andslightlydeclinesagainmorerecently.

References
iFAO.(2019).India at a glance.In:FAO[Online].Availableat:http://www.fao.org/india/fao-in-india/india-at-a-glance/en/
iiFAO.(2019).TheStateofIndia’sBiodiversityforFoodandAgriculture.Rome.Availableat:http://www.fao.org/3/CA3444EN/ca3444en.pdf
iiiChaudhuri,S.K.(2015).GeneticErosionofAgrobiodiversityinIndiaandIntellectualPropertyRights:InterplayandsomeKeyIssues.Availableat:http://eprints.rclis.org/7902/1/Patentmatics_June_2005.pdf
ivUNICEF.(2018).Infantandyoungchildfeedingdatabase[Online].Availableat:https://data.unicef.org/topic/nutrition/infant-and-young-child-feeding/
vAfshin,Ashkan&JohnSur,Patrick&A.Fay,Kairsten&Cornaby,Leslie&Ferrara,Giannina&SSalama,Joseph&CMullany,Erin&Abate,Kalkidan&Cristiana,Abbafati&Abebe,Zegeye&Afarideh,Mohsen&Aggarwal,Anju&Agrawal,Sutapa&Akinyemiju,Tomi&Alahdab,Fares&Bacha,Umar&FBachman,Victoria&Badali,Hamid&Badawi,Alaa.(2019).Healtheffectsofdietaryrisksin195countries,1990–2017:asystematicanalysisfortheGlobalBurdenofDiseaseStudy2017.TheLancet.393.1958-1972.10.1016/S0140-6736(19)30041-8.Availableat:https://www.thelancet.com/journals/lancet/article/PIIS0140-6736(19)30041-8/fulltext
viFAO.(2019).TheStateofIndia’sBiodiversityforFoodandAgriculture.Rome.Availableat:http://www.fao.org/3/CA3444EN/ca3444en.pdf
viiEuropeanSpaceAgency(2017).EuropeanSpaceAgencyLandCoverCCIProductUserguideversion2.0.TechnicalreportYear2015.Availableat:https://maps.elie.ucl.ac.be/CCI/viewer/download/ESACCI-LC-Ph2-PUGv2_2.0.pdf
viiiNowosad,J.,Stepinski,T.F.,Netzel,P.(2019).Global assessment and mapping of changes in mesoscale landscapes: 1992–2015inScienceDirect,Volume78,pp332-340.Doi:https://doi.org/10.1016/j.jag.2018.09.013
ixFAO.(2019).TheStateoftheWorld’sBiodiversityforFoodandAgriculture,J.Bélanger&D.Pilling(eds.).FAOCommissiononGeneticResourcesforFoodandAgricultureAssessments.Rome.572pp.Availableat:http://www.fao.org/3/CA3129EN/CA3129EN.pdf
xGlobalNutritionReport.(2018).IndiaCountrynutritionprofile[Online].Availableat:https://globalnutritionreport.org/nutrition-profiles/asia/southern-asia/india/#profile
xiFAO.(2019).TheStateoftheWorld’sBiodiversityforFoodandAgriculture,J.Bélanger&D.Pilling(eds.).FAOCommissiononGeneticResourcesforFoodandAgricultureAssessments.Rome.572pp.Availableat:http://www.fao.org/3/CA3129EN/CA3129EN.pdf
xiiFAO.(2019).TheStateoftheWorld’sBiodiversityforFoodandAgriculture,J.Bélanger&D.Pilling(eds.).FAOCommissiononGeneticResourcesforFoodandAgricultureAssessments.Rome.572pp.Availableat:http://www.fao.org/3/CA3129EN/CA3129EN.pdf
xiiiAfshin,Ashkan&JohnSur,Patrick&A.Fay,Kairsten&Cornaby,Leslie&Ferrara,Giannina&SSalama,Joseph&CMullany,Erin&Abate,Kalkidan&Cristiana,Abbafati&Abebe,Zegeye&Afarideh,Mohsen&Aggarwal,Anju&Agrawal,Sutapa&Akinyemiju,Tomi&Alahdab,Fares&Bacha,Umar&FBachman,Victoria&Badali,Hamid&Badawi,Alaa.(2019).Healtheffectsofdietaryrisksin195countries,1990–2017:asystematicanalysisfortheGlobalBurdenofDiseaseStudy2017.TheLancet.393.1958-1972.10.1016/S0140-6736(19)30041-8.Availableat:https://www.thelancet.com/journals/lancet/article/PIIS0140-6736(19)30041-8/fulltext
xivKhoury,ColinK.&Amariles,Daniel&Soto,Stivens&Diaz,María&Sotelo,Steven&SosaArango,Chrystian&Ramírez-Villegas,Julian&Achicanoy,Harold&Velásquez-Tibata,Jorge&Guarino,Luigi&León,Blanca&Navarro-Racines,Carlos&CastanedaAlvarez,Nora&Dempewolf,Hannes&Wiersema,John&Jarvis,Andy.(2018).Comprehensivenessofconservationofusefulwildplants:Anoperationalindicatorforbiodiversityandsustainabledevelopmenttargets.EcologicalIndicators.98.420-429.10.1016/j.ecolind.2018.11.016.Availableat:https://www.sciencedirect.com/science/article/pii/S1470160X18308781
xvFAO.(2019).TheStateoftheWorld’sBiodiversityforFoodandAgriculture,J.Bélanger&D.Pilling(eds.).FAOCommissiononGeneticResourcesforFoodandAgricultureAssessments.Rome.572pp.Availableat:http://www.fao.org/3/CA3129EN/CA3129EN.pdf
xviMonfreda,C.,Ramankutty,N.,Foley,J.A.(2008).Farmingtheplanet:2.Geographicdistributionofcropareas,yields,physiologicaltypes,andnetprimaryproductionintheyear2000.In:GlobalBiogeochemicalCycles,Volume22,Issue1.Doi:10.1029/2007GB002947
xviiEuropeanSoilDataCenter.(2016).“GlobalSoilBiodiversityMaps”associatedwiththeGlobalSoilBiodiversityAtlas.JointResearchCentreoftheEuropeanCommission.Availableonlineat:https://esdac.jrc.ec.europa.eu/content/global-soil-biodiversity-maps-0
xviiiFAO.2019.FoodBalanceSheets.In:FAOSTAT[Online].Availableat:http://www.fao.org/faostat/en/#data/FBS
Italy – Country profile
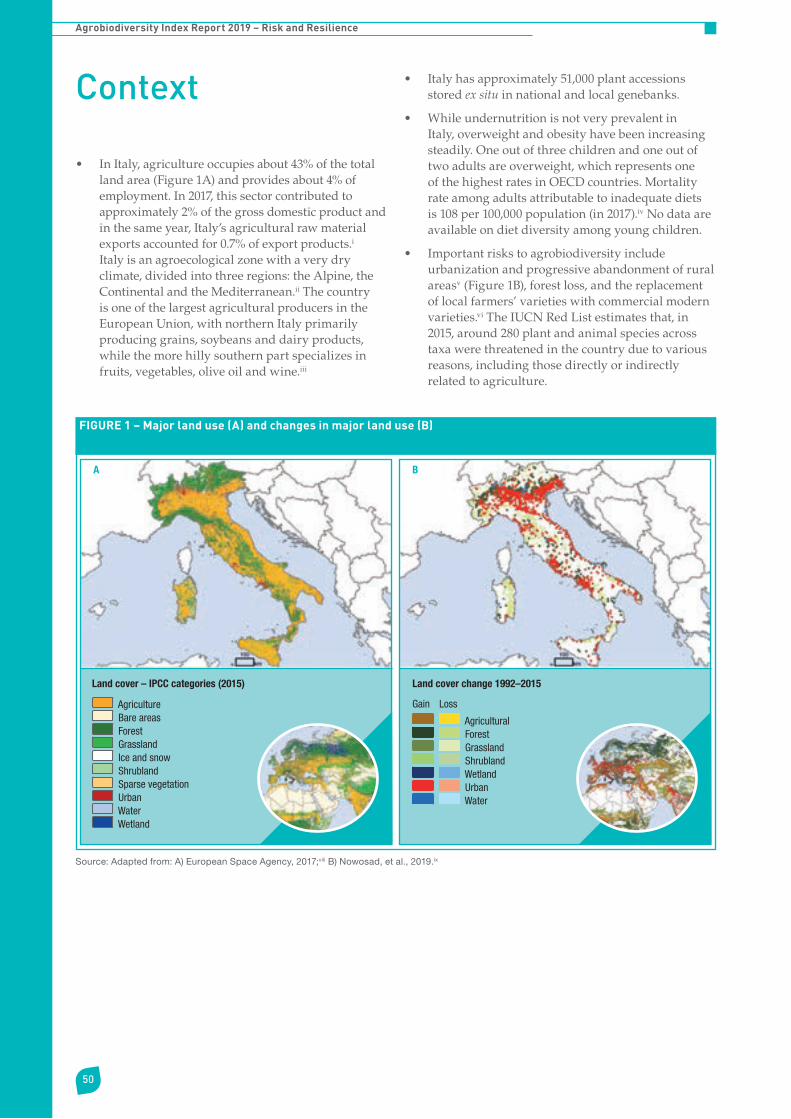
Agrobiodiversity Index Report 2019 – Risk and Resilience
50
FIGURE 1 – Major land use (A) and changes in major land use (B)
Land cover – IPCC categories (2015)
Agriculture Bare areas Forest Grassland Ice and snow Shrubland Sparse vegetation Urban Water Wetland
A B
Source: Adapted from: A) European Space Agency, 2017;viii B) Nowosad, et al., 2019.ix
Land cover change 1992–2015
Gain Loss
Agricultural Forest Grassland Shrubland Wetland Urban Water
Context
• InItaly,agricultureoccupiesabout43%ofthetotallandarea(Figure1A)andprovidesabout4%ofemployment.In2017,thissectorcontributedtoapproximately2%ofthegrossdomesticproductandinthesameyear,Italy’sagriculturalrawmaterialexportsaccountedfor0.7%ofexportproducts.iItalyisanagroecologicalzonewithaverydryclimate,dividedintothreeregions:theAlpine,theContinentalandtheMediterranean.iiThecountryisoneofthelargestagriculturalproducersintheEuropeanUnion,withnorthernItalyprimarilyproducinggrains,soybeansanddairyproducts,whilethemorehillysouthernpartspecializesinfruits,vegetables,oliveoilandwine.iii
• Italyhasapproximately51,000plantaccessionsstoredex situinnationalandlocalgenebanks.
• WhileundernutritionisnotveryprevalentinItaly,overweightandobesityhavebeenincreasingsteadily.Oneoutofthreechildrenandoneoutoftwoadultsareoverweight,whichrepresentsoneofthehighestratesinOECDcountries.Mortalityrateamongadultsattributabletoinadequatedietsis108per100,000population(in2017).ivNodataareavailableondietdiversityamongyoungchildren.
• Importantriskstoagrobiodiversityincludeurbanizationandprogressiveabandonmentofruralareasv(Figure1B),forestloss,andthereplacementoflocalfarmers’varietieswithcommercialmodernvarieties.viTheIUCNRedListestimatesthat,in2015,around280plantandanimalspeciesacrosstaxawerethreatenedinthecountryduetovariousreasons,includingthosedirectlyorindirectlyrelatedtoagriculture.

Italy – Country profile
51
Agrobiodiversity Index results
• Italyscoresmedium-highforthecurrentstatusofagrobiodiversity(Figure2A).Agrobiodiversityingeneticresourcemanagementforfutureoptionsandagrobiodiversityinmarketsandconsumptionforhealthydietsbothaddmoststronglytothestatusscore,followedbyagrobiodiversityinproductionsystemsforsustainableagriculture.Thistrendindicatesthehighpotentialforcontinuedcommitmentandmanagementofgeneticresourcesforsustainableproductionandconsumption.
• Theprogressscoreismoderate-low(Figure2B).Commitmentstomanagingagrobiodiversityaremoreexplicitinthecontextofgeneticresourcemanagement,andlesssoforsustainableagricultureandhealthydiets.Theprogressscoreindicatestheneedtostrengthenactionstoimplementcommitmentsandcreateanenablingenvironment,especiallyforsustainableagricultureandhealthydiets.
• Comparedtothe10-countryaverage,Italyscoresaboveaverageforthestatusscoreandbelowaveragefortheprogressscore.Theremightbeariskthatagrobiodiversityistakenforgrantedandthereforeendsupbeinglesswellmanagedthanitshouldbe.Atthesametime,highlevelsofagrobiodiversityinItalyprovideanopportunityforthecountrytostrengthenagrobiodiversitymanagementacrossthevaluechain,forfutureoptions,sustainableagricultureandhealthydiets.
FIGURE 2 – Overview of Agrobiodiversity Index scores for Italy
61%
(A) Status score (B) Progress score
28%
ITA fig. 2
Agrobiodiversity for healthy diets
Agrobiodiversity for sustainable agriculture
Agrobiodiversity for future options
Actions on agrobiodiversity for healthy diets
Actions on agrobiodiversity for sustainable agriculture
Actions on agrobiodiversity for future options
Commitment on agrobiodiversity for healthy diets
Commitment on agrobiodiversity for sustainable agriculture
Commitment on agrobiodiversity for future options
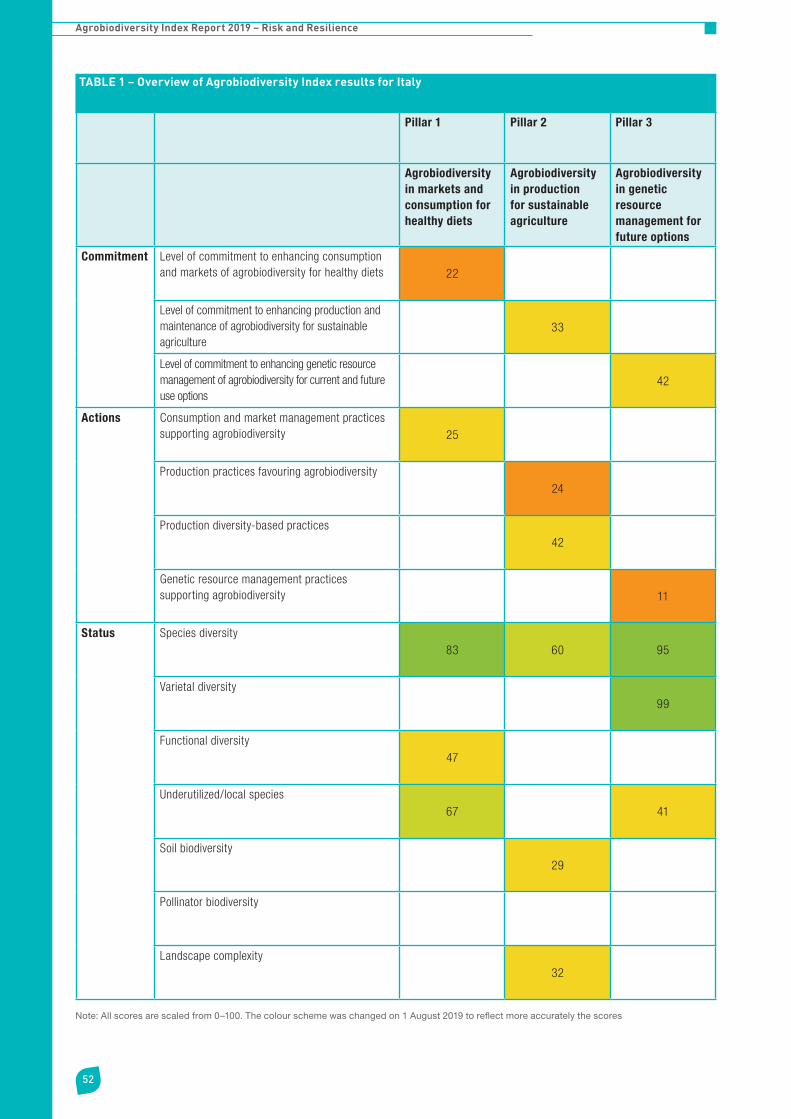
Agrobiodiversity Index Report 2019 – Risk and Resilience
52
TABLE 1 – Overview of Agrobiodiversity Index results for Italy
Pillar 1 Pillar 2 Pillar 3
Agrobiodiversity in markets and consumption for healthy diets
Agrobiodiversity in production for sustainable agriculture
Agrobiodiversity in genetic resource management for future options
Commitment Level of commitment to enhancing consumption and markets of agrobiodiversity for healthy diets 22
Level of commitment to enhancing production and maintenance of agrobiodiversity for sustainable agriculture
33
Level of commitment to enhancing genetic resource management of agrobiodiversity for current and future use options
42
Actions Consumption and market management practices supporting agrobiodiversity 25
Production practices favouring agrobiodiversity 24
Production diversity-based practices 42
Genetic resource management practices supporting agrobiodiversity 11
Status Species diversity83 60 95
Varietal diversity 99
Functional diversity47
Underutilized/local species67 41
Soil biodiversity 29
Pollinator biodiversity
Landscape complexity 32
Note: All scores are scaled from 0–100. The colour scheme was changed on 1 August 2019 to reflect more accurately the scores
Italy – Country profile
53
Leading practices
• Insitu and exsitu genetic resource conservation:Italyscoreshighonex situandin situmeasurements.Inadditiontothediversityofaccessionsavailableingenebanks,cropwildrelativesandusefulwildplantsarehighlypresentinnaturalorsemi-naturalareas.Italyhasestablishedvoluntaryregionalrepositoriesofindigenousgeneticresourcesaswellas87provincialgenebanksfornativeanimalandexistingornewplantspeciestosafeguardagrobiodiversity.Thesefacilitiesaresupportedbythestatethroughbudgetprovision.Thecountryalsoaimstoreducethenumberofthreatenedspeciestolessthan1%oftotalspeciesineachclass,focusingoninnovativelandmanagementforbiodiversityconservationintheMediterraneanregionandmarine−coastalecosystems.
• Species diversity:SpeciesdiversityinItalyishighacrossmarketsandconsumption,productionandgeneticresourcemanagement.Thediversityinvegetables,fruits,legumesandgrainsstronglyaddstothisdiversity.Comparedtoothercountries,speciesdiversityinproductionisparticularlyhighinnorthwesternItaly(Figure5B).
• Agrobiodiversity monitoring: TheItalianMinistryofAgricultural,FoodandForestryPolicieshassetupanationalportalforagriculturalandfoodbiodiversity,madeofinterconnecteddatabasesofgeneticresources.Thetoolallowsformonitoringandoptimizinginterventionsaimedatprotectionandmanagementofagriculturalandfooddiversityinthecountry.
Areas for improvement
• Agrobiodiversity for healthy diets:Whilespeciesdiversityishighindomesticsupply,andalargediversityofvegetables,fruitsandlegumesareavailable,dietaryintakeoffruits,vegetables,legumesandwholegrainsarestillbelowrecommendedvalues.Intakeofprocessedmeat,redmeat,saltandsugar-sweetenedbeveragesareconsumedinexcess.xBothtrendscontributetothehighoverweightprevalenceandanestimateof2,121disability-adjustedlifeyearsper100,000population.Food-baseddietaryguidelinesareinplace,but
specificcommitmentsandactionsatnationalleveltoputthoseintopracticelagbehind,e.g.throughinstitutionalprocurementthatfacilitateshealthysustainablediets.
• International reporting on agrobiodiversity:Italysystematicallyreportsonlyon16%ofindicatorstotheWorldInformationandEarlyWarningSystem(WIEWS)onPlantGeneticResourcesforFoodandAgriculture.
• Natural vegetation in agricultural areas:WhileItalyhasanagroecologypolicyinplace,only37%ofagriculturallandhasmorethan10%ofnaturalvegetation,andagroforestryisobservedonlyon2%ofagriculturalland.Managingnaturalvegetationandtreesinagriculturallandscapes,canincreaselong-termsustainabilityandresilience.
Notable findings
• Crop–livestock integration:about83%ofItaly’sagriculturallandintegratescropandlivestockproduction.Suchintegratedsystemscancontributetomoreclosedandefficientnutrientcycles,soilfertilityanddiversifiedandresilientproductionsystems.
• High agrobiodiversity in markets but inadequate dietary intake:Whilehighagrobiodiversitycanbeobservedindomesticfoodsupplyandmarkets,includingmanytypesoffruits,vegetables,legumesandwholegrains,dietaryintakedoesnotfollowrecommendations,andcontributestohighlevelsofoverweightandobesity.xiInnovativeapproachesarerecommendedtouseexistingagrobiodiversityfurthertohelpaddressthischallenge.TheMilanUrbanFoodPolicyPact(2015),aninternationalpactsignedby191citiesworldwidetodevelopsustainablefoodsystems,canleadtheway.
• Benchmark: Givenitshighstatusscore,Italysetsabenchmarkforothercountriestomanageagrobiodiversityacrossgeneticresourcemanagement,productionandmarkets.However,itisrecommendedthatinthenearfuture,thecountryalsoimprovesitscommitmentsandactionstosustainablyuseandconserveitsagrobiodiversityresourcesinordernottolosethebenefitsfromthese.
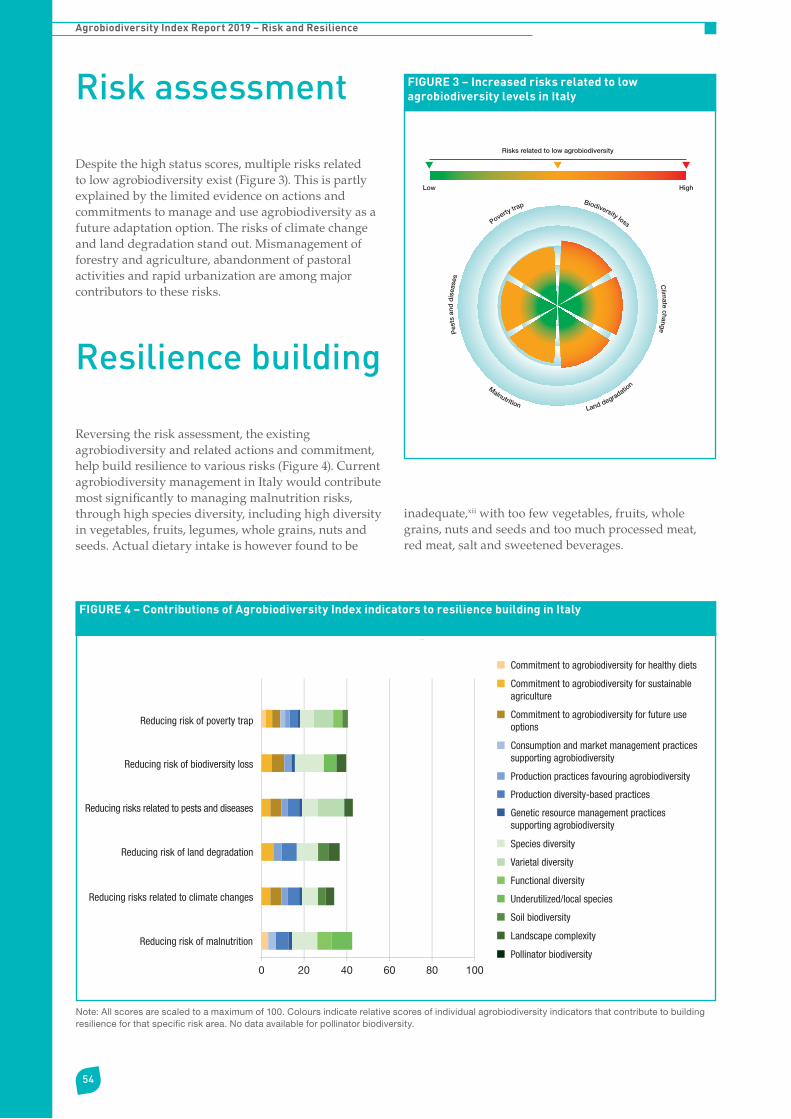
Agrobiodiversity Index Report 2019 – Risk and Resilience
54
Risk assessment
Despitethehighstatusscores,multiplerisksrelatedtolowagrobiodiversityexist(Figure3).Thisispartlyexplainedbythelimitedevidenceonactionsandcommitmentstomanageanduseagrobiodiversityasafutureadaptationoption.Therisksofclimatechangeandlanddegradationstandout.Mismanagementofforestryandagriculture,abandonmentofpastoralactivitiesandrapidurbanizationareamongmajorcontributorstotheserisks.
Resilience building
Reversingtheriskassessment,theexistingagrobiodiversityandrelatedactionsandcommitment,helpbuildresiliencetovariousrisks(Figure4).CurrentagrobiodiversitymanagementinItalywouldcontributemostsignificantlytomanagingmalnutritionrisks,throughhighspeciesdiversity,includinghighdiversityinvegetables,fruits,legumes,wholegrains,nutsandseeds.Actualdietaryintakeishoweverfoundtobe
inadequate,xiiwithtoofewvegetables,fruits,wholegrains,nutsandseedsandtoomuchprocessedmeat,redmeat,saltandsweetenedbeverages.
FIGURE 3 – Increased risks related to low agrobiodiversity levels in Italy
Pes
ts a
nd d
isea
ses
P
overty trap
Biodiversity loss Clim
ate change
Malnutrition Land degradatio
n
Risks related to low agrobiodiversity
Low High
FIGURE 4 – Contributions of Agrobiodiversity Index indicators to resilience building in Italy
Reducing risk of malnutrition
Reducing risks related to climate changes
Reducing risk of land degradation
Reducing risks related to pests and diseases
Reducing risk of biodiversity loss
Reducing risk of poverty trap
0 20 40 60 80 100
ITA fig.4Commitment to agrobiodiversity for healthy diets
Commitment to agrobiodiversity for sustainable agriculture
Commitment to agrobiodiversity for future use options
Production practices favouring agrobiodiversity
Production diversity-based practices
Genetic resource management practices supporting agrobiodiversity
Species diversity
Varietal diversity
Functional diversity
Underutilized/local species
Soil biodiversity
Landscape complexity
Pollinator biodiversity
Consumption and market management practices supporting agrobiodiversity
Note: All scores are scaled to a maximum of 100. Colours indicate relative scores of individual agrobiodiversity indicators that contribute to building resilience for that speci�c risk area. No data available for pollinator biodiversity.
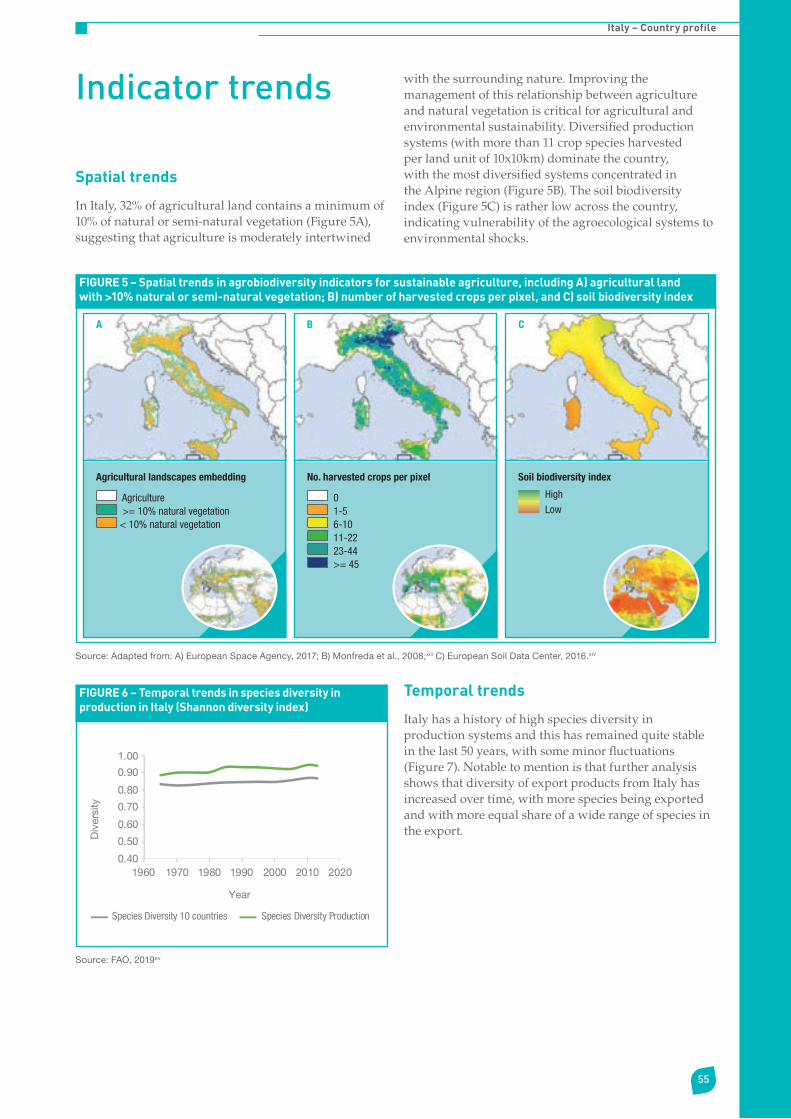
Italy – Country profile
55
FIGURE 5 – Spatial trends in agrobiodiversity indicators for sustainable agriculture, including A) agricultural land with >10% natural or semi-natural vegetation; B) number of harvested crops per pixel, and C) soil biodiversity index
Soil biodiversity indexAgricultural landscapes embedding
Agriculture >= 10% natural vegetation < 10% natural vegetation
No. harvested crops per pixel
0 1-5 6-10 11-22 23-44 >= 45
A B C
Soil biodiversity indexHigh
Low
100km
High
Low
Source: Adapted from: A) European Space Agency, 2017; B) Monfreda et al., 2008;xiii C) European Soil Data Center, 2016.xiv
Indicator trends
Spatial trends
InItaly,32%ofagriculturallandcontainsaminimumof10%ofnaturalorsemi-naturalvegetation(Figure5A),suggestingthatagricultureismoderatelyintertwined
withthesurroundingnature.Improvingthemanagementofthisrelationshipbetweenagricultureandnaturalvegetationiscriticalforagriculturalandenvironmentalsustainability.Diversifiedproductionsystems(withmorethan11cropspeciesharvestedperlandunitof10x10km)dominatethecountry,withthemostdiversifiedsystemsconcentratedintheAlpineregion(Figure5B).Thesoilbiodiversityindex(Figure5C)isratherlowacrossthecountry,indicatingvulnerabilityoftheagroecologicalsystemstoenvironmentalshocks.
FIGURE 6 – Temporal trends in species diversity in production in Italy (Shannon diversity index)
0.40
0.50
0.60
0.70
0.80
0.90
1.00
1960 1970 1980 1990 2000 2010 2020
Div
ersi
ty
Year
Species Diversity 10 countries Species Diversity Production
Source: FAO, 2019xv
Temporal trends
Italyhasahistoryofhighspeciesdiversityinproductionsystemsandthishasremainedquitestableinthelast50years,withsomeminorfluctuations(Figure7).NotabletomentionisthatfurtheranalysisshowsthatdiversityofexportproductsfromItalyhasincreasedovertime,withmorespeciesbeingexportedandwithmoreequalshareofawiderangeofspeciesintheexport.
References
iWorldBank.(2019).Agriculturalrawmaterialsexports(%ofmerchandiseexports).In:TheWorldBank[Online].Availableat:https://data.worldbank.org/indicator/TX.VAL.AGRI.ZS.UN
iiHijbeek,R.,Pronk,A.A.,vanIttersum,M.K.,Verhagen,A.,Ruysschaert,G.,Bijttebier,J.,...&tenBerge,H.F.M.(2019).Useoforganicinputsbyarablefarmersinsixagro-ecologicalzonesacrossEurope:Driversandbarriers.Agriculture,Ecosystems&Environment,275,42-53
iiiExport.gov.(2019).Italycountrycommercialguide.In:Export.gov[Online].Availableat:https://www.export.gov/article?id=Italy-Agricultural-Sector
ivAfshin,Ashkan&JohnSur,Patrick&A.Fay,Kairsten&Cornaby,Leslie&Ferrara,Giannina&SSalama,Joseph&CMullany,Erin&Abate,Kalkidan&Cristiana,Abbafati&Abebe,Zegeye&Afarideh,Mohsen&Aggarwal,Anju&Agrawal,Sutapa&Akinyemiju,Tomi&Alahdab,Fares&Bacha,Umar&FBachman,Victoria&Badali,Hamid&Badawi,Alaa.(2019).Healtheffectsofdietaryrisksin195countries,1990–2017:asystematicanalysisfortheGlobalBurdenofDiseaseStudy2017.TheLancet.393.1958-1972.10.1016/S0140-6736(19)30041-8.Availableat:https://www.thelancet.com/journals/lancet/article/PIIS0140-6736(19)30041-8/fulltext
vConventiononBiologicalDiversity.(2019).Italy-Countryprofile[Online].Availableat:https://www.cbd.int/countries/profile/default.shtml?country=it#facts
viPGRSecure.(2012).TheItalianlandraceconservationstrategy.Availablat:https://www.pgrsecure.bham.ac.uk/sites/default/files/documents/deliverables/D4.2_IT_landrace_conservation_strategy.pdf
viiIUCN.(2015).RedList.Threatenedspeciesineachcountry.Availableat:http://cmsdocs.s3.amazonaws.com/summarystats/2015_2_Summary_Stats_Page_Documents/2015_2_RL_Stats_Table_5.pdf
viiiEuropeanSpaceAgency(2017).EuropeanSpaceAgencyLandCoverCCIProductUserguideversion2.0.TechnicalreportYear2015.Availableat:https://maps.elie.ucl.ac.be/CCI/viewer/download/ESACCI-LC-Ph2-PUGv2_2.0.pdf
ixNowosad,J.,Stepinski,T.F.,Netzel,P.(2019).Global assessment and mapping of changes in mesoscale landscapes: 1992–2015inScienceDirect,Volume78,pp332-340.Doi:https://doi.org/10.1016/j.jag.2018.09.013
xGlobalNutritionReport.(2018).ItalyCountrynutritionprofile[Online].Availableat:https://globalnutritionreport.org/nutrition-profiles/europe/southern-europe/italy/
xiGlobalNutritionReport.(2018).ItalyCountrynutritionprofile[Online].Availableat:https://globalnutritionreport.org/nutrition-profiles/europe/southern-europe/italy/
xiiGlobalNutritionReport.(2018).ItalyCountrynutritionprofile[Online].Availableat:https://globalnutritionreport.org/nutrition-profiles/europe/southern-europe/italy/
xiiiMonfreda,C.,Ramankutty,N.,Foley,J.A.(2008).Farmingtheplanet:2.Geographicdistributionofcropareas,yields,physiologicaltypes,andnetprimaryproductionintheyear2000.In:GlobalBiogeochemicalCycles,Volume22,Issue1.Doi:10.1029/2007GB002947
xivEuropeanSoilDataCenter.(2016).“GlobalSoilBiodiversityMaps”associatedwiththeGlobalSoilBiodiversityAtlas.JointResearchCentreoftheEuropeanCommission.Availableonlineat:https://esdac.jrc.ec.europa.eu/content/global-soil-biodiversity-maps-0
xvFAO.2019.FoodBalanceSheets.In:FAOSTAT[Online].Availableat:http://www.fao.org/faostat/en/#data/FBS

Kenya – Country profile

Agrobiodiversity Index Report 2019 – Risk and Resilience
58
FIGURE 1 – Major land use (A) and changes in major land use (B)
Land cover − IPCC categories (2015)
Agriculture Bare areas Forest Grassland Ice and snow Shrubland Sparse vegetation Urban Water Wetland
A B
Source: Adapted from: A) European Space Agency, 2017;vii B) Nowosad, et al., 2019.viii
Land cover change 1992−2015
Gain Loss
Agricultural Forest Grassland Shrubland Wetland Urban Water
Context
• AgricultureisthebackboneoftheKenyaneconomy,occupyingabout49%ofthetotallandarea(Figure1A)andproviding58%ofemployment.In2017,agriculturecontributedtoapproximately35%ofnationalgrossdomesticproduct.iThesectoraccountsforabout65%ofexportearnings.iiKenyaisaleadingproduceroftea,coffeeandhorticulturalproducts.ThearidlandsofnorthernKenyasupportpastoralism.
• ExsituandinsituconservationinitiativesarewidespreadinKenyaandincludeseedbanking,fieldgenebanks,cryopreservationandlivestockconservationfarms.iiiApproximately51,000plantaccessionsarestoredinnationalgenebanks.
• About36%ofyoungKenyanchildren(6−23months)consumeaminimumdietdiversity.Amongadults,themortalityrateattributabletoinadequatedietsis225per100,000population.iv
• Populationgrowth,deforestation,grasslandandagriculturalexpansion(Figure1B)withpoorfarmingmethodshaveledtohabitatlossandseriouslanddegradation,puttinghighpressureonagriculturalpotential.vTheIUCNRedListestimatesthatin2015around463speciesacrosstaxawerethreatenedinthecountryduetovariousreasons,includingthosedirectlyorindirectlyrelatedtoagriculture.vi

Kenya – Country profile
59
Agrobiodiversity Index results
• Kenyascoresmediumforthepresentstatusofagrobiodiversity(Figure2A).Agrobiodiversityingeneticresourcemanagementforfutureuseaddsmoststronglytothestatusscore.Itisfollowedbyagrobiodiversityinmarketsandconsumptionforhealthydiets,andagrobiodiversityinproductionsystemsforsustainableagriculture.Thistrendindicatesthehighpotentialforunlockingfurtheruseofgeneticresourcesinsustainableproductionandconsumption.
• Progressscore:thecumulativescoreforcommitmentandactionsismedium-low(Figure2B).Ontheonehand,thecommitments,expressedinpolicies,toenhancethemanagementof
agrobiodiversityacrossthethreepillarsarerelativelyhighandaboveaverage.Ontheotherhand,actionstoimplementthesecommitmentsarelaggingbehind.Theprogressscoreindicatesthepresenceofanenablingenvironmenttoimprovethesustainableuseandconservationofagrobiodiversity,especiallyinthecommitmenttopromotehealthydietsandactionsinincorporatingagrobiodiversityinproductionsystemsforclimate-resilientagriculture.
• Comparedtothe10-countryaverage,Kenyascoresjustbelowaverageforthestatusscoreandaboveaveragefortheprogressscore.Thecountry’sincreasingfocusonhealthandnutritiousfoodcantriggerpublicdemandthatmayhelpunlockthepotentialofagrobiodiversityalongthevaluechain,fromgeneticresourcemanagementtoproductionandconsumption.
FIGURE 2 – Overview of Agrobiodiversity Index scores for Kenya
53%
(B) Progress score
39%
KEN fig. 2
(A) Status score
Agrobiodiversity for healthy diets
Agrobiodiversity for sustainable agriculture
Agrobiodiversity for future options
Actions on agrobiodiversity for healthy diets
Actions on agrobiodiversity for sustainable agriculture
Actions on agrobiodiversity for future options
Commitment on agrobiodiversity for healthy diets
Commitment on agrobiodiversity for sustainable agriculture
Commitment on agrobiodiversity for future options
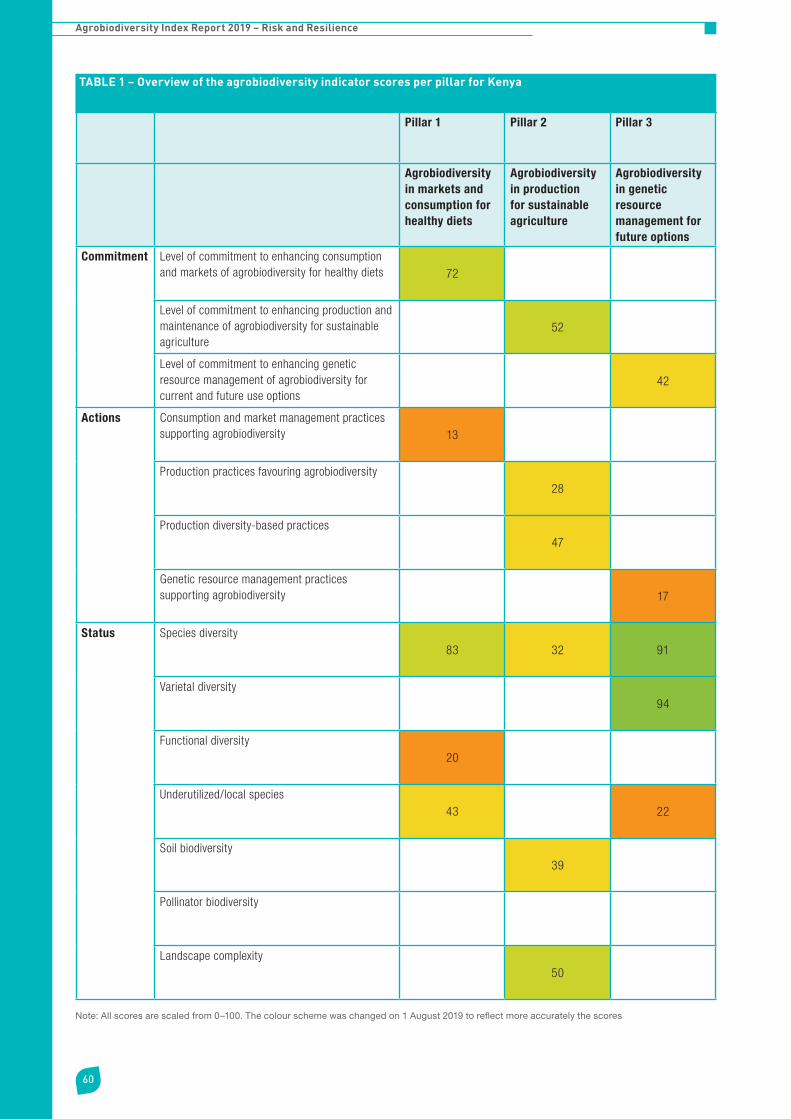
Agrobiodiversity Index Report 2019 – Risk and Resilience
60
TABLE 1 – Overview of the agrobiodiversity indicator scores per pillar for Kenya
Pillar 1 Pillar 2 Pillar 3
Agrobiodiversity in markets and consumption for healthy diets
Agrobiodiversity in production for sustainable agriculture
Agrobiodiversity in genetic resource management for future options
Commitment Level of commitment to enhancing consumption and markets of agrobiodiversity for healthy diets 72
Level of commitment to enhancing production and maintenance of agrobiodiversity for sustainable agriculture
52
Level of commitment to enhancing genetic resource management of agrobiodiversity for current and future use options
42
Actions Consumption and market management practices supporting agrobiodiversity 13
Production practices favouring agrobiodiversity 28
Production diversity-based practices 47
Genetic resource management practices supporting agrobiodiversity 17
Status Species diversity83 32 91
Varietal diversity 94
Functional diversity20
Underutilized/local species43 22
Soil biodiversity 39
Pollinator biodiversity
Landscape complexity 50
Note: All scores are scaled from 0–100. The colour scheme was changed on 1 August 2019 to reflect more accurately the scores
Kenya – Country profile
61
Leading practices
• Commitmenttosustainableuseofagrobiodiversity:Acrosspolicies,Kenyaexpressesspecificcommitmentstosustainablyuseagrobiodiversity.Forexample,Kenya’sClimateSmartAgricultureStrategyhasthelong-termgoaltopromotetheadoptionofclimate-smarttechnologies,includingagrobiodiversityandclimate-smartcrops,throughstatefacilitationandfunding,privateinvestmentsandextensionservices.Kenya’sVision2030andtheNationalNutritionActionPlanaimtoincreaseaffordabilityofadiversityoffoodsandpromotediverse,healthydietsasameanstoprevent,manageandcontrolmalnutritionanddiet-relatednoncommunicablediseases.Kenya’sAgriculture(FarmForestry)Rulesof2009requireatleast10%treecoveronallfarms.
• Biodiversityforfoodandnutrition:Kenyaishometoavastarrayoftraditionalandneglectednativefoods,bothwildandcultivated,whichhavehighnutritionalvaluebutarethreatenedbyenvironmentalpressuresorlackofuse.KenyaisoneofthefourcountriesleadingtheUNEnvironment’sBiodiversityforFoodandNutritionProject,whichhasincreasedawarenessoftheimportanceofconservationoffooddiversitybybuildingnationalcapacitytogeneratenutritiondataforunderutilizedspecies(primarilyplants).Theprojectcollectsinformationonthesocioculturalandmarketvalueofspecies,supportssmallholderfarmersintheproductionofbiodiversefoodsandlinksthemtoschoolmealprogrammes.ix
• Treeandlandscapemanagement:Approximately50%ofKenya’sagriculturallandcontainsmorethan10%ofnaturalvegetation,and13%includesagroforestry.Thosepracticesarespreadingacrossthecountry,xpartlyincentivizedbyKenya’sFarmForestryRulesandrelatedinvestments.
Areas for improvement
• Sustainableproductionpractices:Somepracticesthatnegativelyimpactwildbiodiversityassociatedwithprovisionofecosystemservicesincludingwildfoodsaremajor,includingovergrazing,overuseoffertilizersandpesticides,uncontrolledforestclearing,andinappropriatewatermanagement.xi
• Healthydiets:Whileeffortsaremadetopromotehealthydietsandmakeavailableinformationonbiodiversefoods,disabilityadjustedlifeyearsattributabletoinadequatedietsarestillhighat4971.4per100,000population.Despitealargevarietyofvegetablesandfruitsavailable,theirpresenceindietsisstillbelowrecommendedlevels.xiiPuttinginplacefood-baseddietaryguidelinesthattakeintoaccountthecountry’srichagrobiodiversity,andfurtherstrengtheninglocalmarketsandconsumerdemandforthesefreshfoodscanhelpfillthisgap.
• Insituconservation:RichbiodiversityisfoundinKenya.Commitmentandactionstowardsconservationcanbeimprovedtoreducetheriskofagrobiodiversityloss.About70%ofnationalresourcesbudgetedforbiodiversityconservationarereportedtobeallocatedtoareasoutsideprotectedareas.xiiiThecountryis,therefore,encouragedtodevelopandimplementpoliciestosupportconservationandsustainableuseofagrobiodiversity,especiallyinagriculturalproduction.
Notable findings
• Maintenanceanduseofindigenousknowledge:TheNationalMuseumsofKenyadocumentindigenousknowledgeonagrobiodiversitythroughvariousresearchactivitiesandcontributeandapplythisinformationinotherresearchanddevelopmentprogrammes.
• Crop−livestockintegration:About82%ofKenya’sagriculturallandintegratescropandlivestockproduction.Suchintegratedsystemscancontributetomoreclosedandefficientnutrientcycles,soilfertility,anddiversifiedandresilientproductionsystems.
• Commitmentfromthehighestlevel:Apresidentialbanisinplaceonoverexploitedresources,includingindigenoustrees,andiscontrolledbyagenciesliketheKenyaForestServiceandKenyaWildlifeService.RecentlyprotectedspeciesincludedinthepresidentialbanareAfricansandalwoodandaloe,amongothers.xiv

Agrobiodiversity Index Report 2019 – Risk and Resilience
62
Risk assessment
LowagrobiodiversitypatternsinKenyaaddtomultiplerisks,particularlyclimatechangelosses,landdegradation,andbiodiversityloss(Figure3).Thisisexplainedbytherelativelylowscoresforagrobiodiversityinproduction,speciesdiversityandsoilbiodiversity,andthelimitedscaleofmanagementpracticesthatareconsideredtofavouragrobiodiversity,suchassustainablesoilmanagementpractices,integratedpestmanagementandavoidedovergrazing.
Resilience building
Reversingtheriskassessment,theexistingagrobiodiversityandrelatedactionsandcommitmentshelpbuildresiliencetovariousrisks(Figure4).Currentmanagementofagrobiodiversityparticularlyhelpstoreducepovertyrisks(e.g.throughdiversificationeffortsinmarkets),andpestsanddiseases(e.g.throughmanagementofdisease-resistantvarietiesingenebanksandseedbanks).
FIGURE 3 – Increased risks related to low agrobiodiversity levels in Kenya
Pes
ts a
nd d
isea
ses
P
overty trap
Biodiversity loss Clim
ate change
Malnutrition Land degradatio
n
Risks related to low agrobiodiversity
Low High
FIGURE 4 – Contributions of Agrobiodiversity Index indicators to resilience building in Kenya
Reducing risk of malnutrition
Reducing risks related to climate changes
Reducing risk of land degradation
Reducing risks related to pests and diseases
Reducing risk of biodiversity loss
Reducing risk of poverty trap
0 20 40 60 80 100
KEN fig.4Commitment to agrobiodiversity for healthy diets
Commitment to agrobiodiversity for sustainable agriculture
Commitment to agrobiodiversity for future use options
Production practices favouring agrobiodiversity
Production diversity-based practices
Genetic resource management practices supporting agrobiodiversity
Species diversity
Varietal diversity
Functional diversity
Underutilized/local species
Soil biodiversity
Landscape complexity
Pollinator biodiversity
Consumption and market management practices supporting agrobiodiversity
Note: All scores are scaled to a maximum of 100. Colours indicate relative scores of individual agrobiodiversity indicators that contribute to building resilience for that speci�c risk area. No data available for pollinator biodiversity.
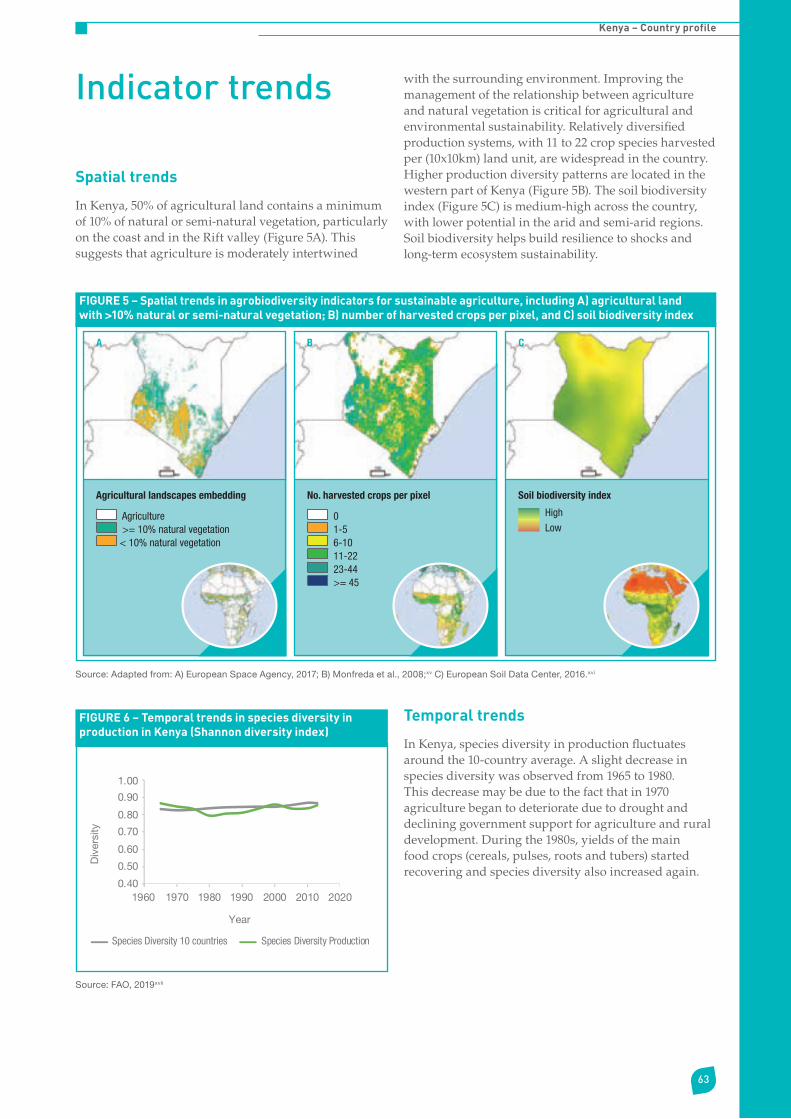
Kenya – Country profile
63
FIGURE 5 – Spatial trends in agrobiodiversity indicators for sustainable agriculture, including A) agricultural land with >10% natural or semi-natural vegetation; B) number of harvested crops per pixel, and C) soil biodiversity index
Soil biodiversity indexAgricultural landscapes embedding
Agriculture >= 10% natural vegetation < 10% natural vegetation
No. harvested crops per pixel
0 1-5 6-10 11-22 23-44 >= 45
A B C
Soil biodiversity indexHigh
Low
100km
High
Low
Source: Adapted from: A) European Space Agency, 2017; B) Monfreda et al., 2008;xv C) European Soil Data Center, 2016.xvi
Indicator trends
Spatial trends
InKenya,50%ofagriculturallandcontainsaminimumof10%ofnaturalorsemi-naturalvegetation,particularlyonthecoastandintheRiftvalley(Figure5A).Thissuggeststhatagricultureismoderatelyintertwined
withthesurroundingenvironment.Improvingthemanagementoftherelationshipbetweenagricultureandnaturalvegetationiscriticalforagriculturalandenvironmentalsustainability.Relativelydiversifiedproductionsystems,with11to22cropspeciesharvestedper(10x10km)landunit,arewidespreadinthecountry.HigherproductiondiversitypatternsarelocatedinthewesternpartofKenya(Figure5B).Thesoilbiodiversityindex(Figure5C)ismedium-highacrossthecountry,withlowerpotentialinthearidandsemi-aridregions.Soilbiodiversityhelpsbuildresiliencetoshocksandlong-termecosystemsustainability.
FIGURE 6 – Temporal trends in species diversity in production in Kenya (Shannon diversity index)
0.40
0.50
0.60
0.70
0.80
0.90
1.00
1960 1970 1980 1990 2000 2010 2020
Div
ersi
ty
Year
Species Diversity 10 countries Species Diversity Production
Source: FAO, 2019xvii
Temporal trends
InKenya,speciesdiversityinproductionfluctuatesaroundthe10-countryaverage.Aslightdecreaseinspeciesdiversitywasobservedfrom1965to1980.Thisdecreasemaybeduetothefactthatin1970agriculturebegantodeteriorateduetodroughtanddeclininggovernmentsupportforagricultureandruraldevelopment.Duringthe1980s,yieldsofthemainfoodcrops(cereals,pulses,rootsandtubers)startedrecoveringandspeciesdiversityalsoincreasedagain.

References
iWorldBank.(2019).Agriculture,forestry,andfishing,valueadded(%ofGDP).In:TheWorldBank[Online].Availableat:https://data.worldbank.org/indicator/nv.agr.totl.zs
iiFAO.(2019).Kenyaataglance[Online].Availableat:http://www.fao.org/kenya/fao-in-kenya/kenya-at-a-glance/en/
iiiFAO.(2019).TheStateofKenya’sBiodiversityforFoodandAgriculture.Rome.Availableat:http://www.fao.org/3/CA3473EN/ca3473en.pdf
ivAfshin,A.,Sur,P.J.,Fay,K.A.,Cornaby,L.,Ferrara,G.,Salama,J.S.,...Murray,C.J.(2019).Healtheffectsofdietaryrisksin195countries,1990–2017:AsystematicanalysisfortheGlobalBurdenofDiseaseStudy2017.TheLancet.doi:10.1016/s0140-6736(19)30041-8
vConventiononBiologicalDiversity.(2015).KenyaFifthNationalReport.Availableat:https://www.cbd.int/doc/world/ke/ke-nr-05-en.pdf
viIUCN.(2015).RedList.Threatenedspeciesineachcountry.Availableat:http://cmsdocs.s3.amazonaws.com/summarystats/2015_2_Summary_Stats_Page_Documents/2015_2_RL_Stats_Table_5.pdf
viiEuropeanSpaceAgency(2017).EuropeanSpaceAgencyLandCoverCCIProductUserguideversion2.0.TechnicalreportYear2015.Availableat:https://maps.elie.ucl.ac.be/CCI/viewer/download/ESACCI-LC-Ph2-PUGv2_2.0.pdf
viiiNowosad,J.,Stepinski,T.F.,Netzel,P.(2019).Globalassessmentandmappingofchangesinmesoscalelandscapes:1992–2015inScienceDirect,Volume78,pp332-340.Doi:https://doi.org/10.1016/j.jag.2018.09.013
ixBiodiversityforFoodandNutrition.(2019).Website[Online].Availableat:http://www.b4fn.org
xFAO.(2019).TheStateofKenya’sBiodiversityforFoodandAgriculture.Rome.Availableat:http://www.fao.org/3/CA3473EN/ca3473en.pdf
xiFAO.(2019).TheStateofKenya’sBiodiversityforFoodandAgriculture.Rome.Availableat:http://www.fao.org/3/CA3473EN/ca3473en.pdf
xiiGlobalNutritionReport.(2018).KenyaCountrynutritionprofile[Online].Availableat:https://globalnutritionreport.org/nutrition-profiles/africa/eastern-africa/kenya/
xiiiConventiononBiologicalDiversity.(2015).KenyaFifthNationalReport.Availableat:https://www.cbd.int/doc/world/ke/ke-nr-05-en.pdf
xivFAO.(2019).TheStateofKenya’sBiodiversityforFoodandAgriculture.Rome.Availableat:http://www.fao.org/3/CA3473EN/ca3473en.pdf
xvMonfreda,C.,Ramankutty,N.,Foley,J.A.(2008).Farmingtheplanet:2.Geographicdistributionofcropareas,yields,physiologicaltypes,andnetprimaryproductionintheyear2000.In:GlobalBiogeochemicalCycles,Volume22,Issue1.Doi:10.1029/2007GB002947
xviEuropeanSoilDataCenter.(2016)."GlobalSoilBiodiversityMaps"associatedwiththeGlobalSoilBiodiversityAtlas.JointResearchCentreoftheEuropeanCommission.Availableonlineat:https://esdac.jrc.ec.europa.eu/content/global-soil-biodiversity-maps-0
xviiFAO.2019.FoodBalanceSheets.In:FAOSTAT[Online].Availableat:http://www.fao.org/faostat/en/#data/FBS

Nigeria – Country profile
65
Nigeria – Country profile

Agrobiodiversity Index Report 2019 – Risk and Resilience
66
Context
• InNigeria,agricultureoccupiesabout78%ofthetotallandarea(Figure1A)andprovidesabout37%ofemployment.In2018,theagriculturalsectorcontributedtoapproximately21%ofgrossdomesticproduct.i
• Nigeriaistheworld’slargestproducerofcassavaandthelargestimporterofrice.iiSorghum(Sorghum bicolor),cowpeas(Vigna unguiculata),andWestAfricanrice(Oryza sativa)aresomeoftheimportantcropsgrownworldwidethatoriginatefromNigeria.iii
• Around34%ofyoungNigeriachildren(6–23months)consumeaminimumdietdiversity.Amongadults,themortalityrateattributabletoinadequatedietsin2017was169per100,000population.iv
• Biodiversityinforests,savannahwoodlandsandcoastalmangrovessupportsthefoodrequirementsof70%–80%ofbothruralandurbanpopulationsinNigeria.Atthesametime,agriculture,urbanizationandforestgainshavebeenincreasinginthepast30years(Figure1B).
• TheIUCNRedListestimatesthatin2015around333speciesacrosstaxawerethreatenedinthecountryduetoreasonsdirectlyorindirectlyrelatedtoagriculture.vRiskstobiodiversityincludeoverexploitationfueledbyhighpopulationgrowth,poorlanduseplanning,pollutionandhabitatdegradation,partlyduetounsustainableagriculturalpractices.
FIGURE 1 – Major land use (A) and changes in major land use (B)
Land cover − IPCC categories (2015)
Agriculture Bare areas Forest Grassland Ice and snow Shrubland Sparse vegetation Urban Water Wetland
Land cover change 1992−2015
Gain Loss
Agricultural Forest Grassland Shrubland Wetland Urban Water
A B
Source: Adapted from: A) European Space Agency 2017;vi B) Nowosad, et al. 2019.vii

Nigeria – Country profile
67
Agrobiodiversity Index results
• Nigeriascoresmediumforthepresentstatusofagrobiodiversity(Figure2A).Agrobiodiversityingeneticresourcemanagementforfutureuseoptionsaddsmoststronglytothestatusscore,followedbyagrobiodiversityforhealthydietsandforsustainableagriculture.Thistrendindicatesarecognitionoftheroleofagrobiodiversityacrossthethreepillars.
• Theprogressscoreismedium-low(Figure2B).Whileagrobiodiversityforfutureuseoptionsmakesalargecontributiontothestatusscore,actionstosupportthatcontinuedstatusaremostlymissing.
Nonetheless,thecountryexpressestheambitiontoconservebiodiversityandachievesustainableagriculturalproductionintheNationalBiodiversityStrategyandActionPlan2016–2020.Evidenceforactionstosupportgeneticresourcemanagementofagrobiodiversityinthecountryisverylimited.ThereisnoreporteddataintheWorldInformationandEarlyWarningSystem(WIEWS)onPlantGeneticResourcesforFoodandAgricultureaboutNigeria,andpracticesthatfavourin situconservationareobservedonaverysmallscale.
• Comparedtothe10-countryaverage,Nigeriascoresjustbelowaverageinthestatusscoreandjustaboveaverageintheprogressscore.Itsincreasingcommitmentandfocusonhealthandnutritiousfoodcantriggerpublicdemandthathelpsunlockthepotentialofagrobiodiversityusealongthevaluechain,fromgeneticresourcemanagementtoproductionandconsumption.
FIGURE 2 – Overview of Agrobiodiversity Index scores for Nigeria
53%
(A) Status score (B) Progress score
33%
NGA fig. 2
Agrobiodiversity for healthy diets
Agrobiodiversity for sustainable agriculture
Agrobiodiversity for future options
Actions on agrobiodiversity for healthy diets
Actions on agrobiodiversity for sustainable agriculture
Actions on agrobiodiversity for future options
Commitment on agrobiodiversity for healthy diets
Commitment on agrobiodiversity for sustainable agriculture
Commitment on agrobiodiversity for future options
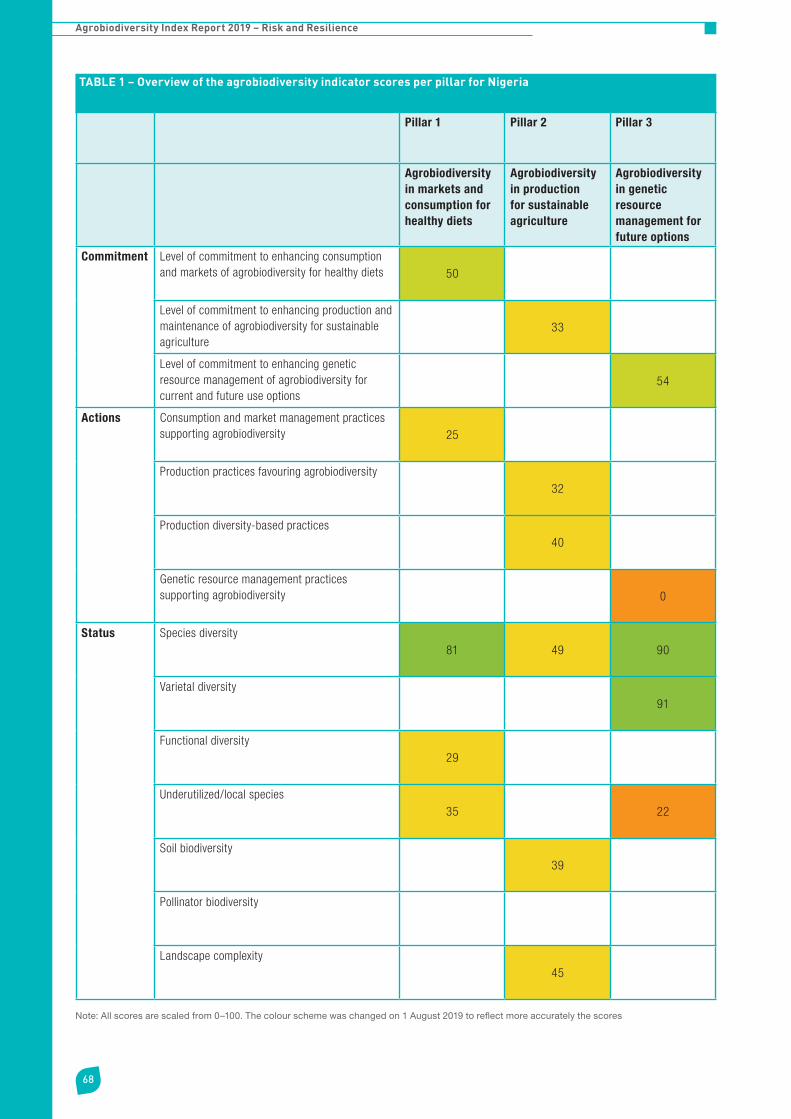
Agrobiodiversity Index Report 2019 – Risk and Resilience
68
TABLE 1 – Overview of the agrobiodiversity indicator scores per pillar for Nigeria
Pillar 1 Pillar 2 Pillar 3
Agrobiodiversity in markets and consumption for healthy diets
Agrobiodiversity in production for sustainable agriculture
Agrobiodiversity in genetic resource management for future options
Commitment Level of commitment to enhancing consumption and markets of agrobiodiversity for healthy diets 50
Level of commitment to enhancing production and maintenance of agrobiodiversity for sustainable agriculture
33
Level of commitment to enhancing genetic resource management of agrobiodiversity for current and future use options
54
Actions Consumption and market management practices supporting agrobiodiversity 25
Production practices favouring agrobiodiversity 32
Production diversity-based practices 40
Genetic resource management practices supporting agrobiodiversity 0
Status Species diversity81 49 90
Varietal diversity 91
Functional diversity29
Underutilized/local species35 22
Soil biodiversity 39
Pollinator biodiversity
Landscape complexity 45
Note: All scores are scaled from 0–100. The colour scheme was changed on 1 August 2019 to reflect more accurately the scores
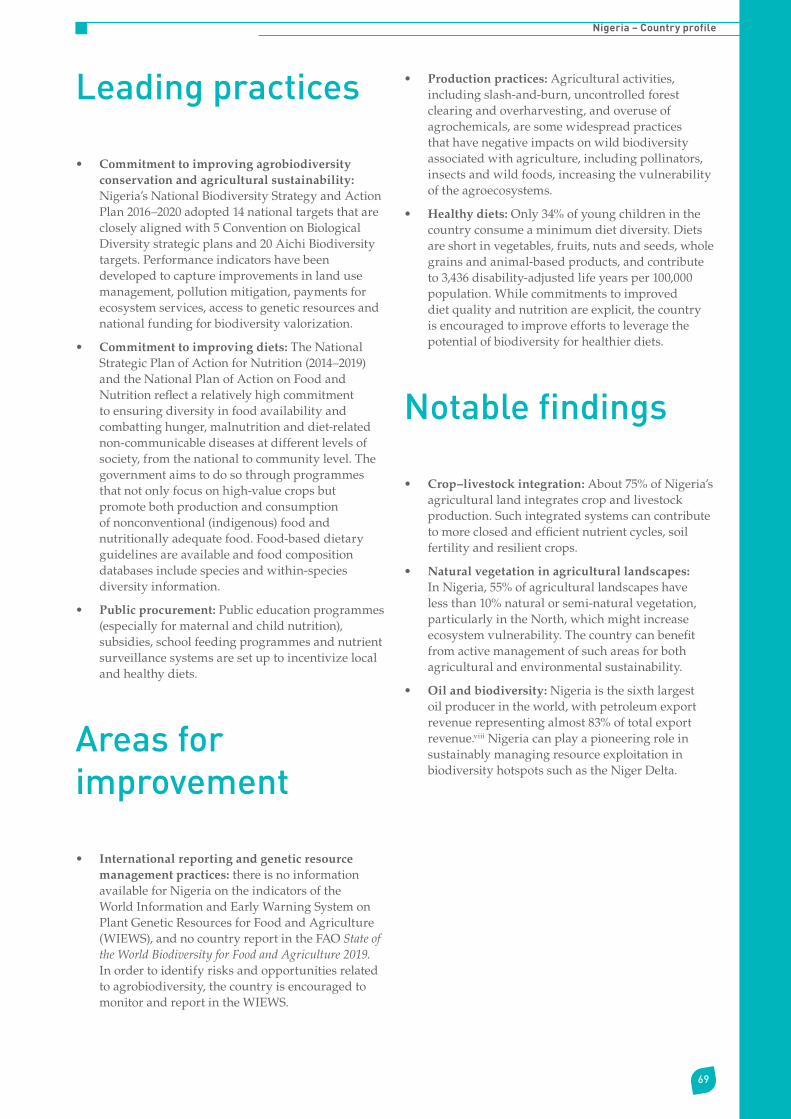
Nigeria – Country profile
69
Leading practices
• Commitmenttoimprovingagrobiodiversityconservationandagriculturalsustainability:Nigeria’sNationalBiodiversityStrategyandActionPlan2016–2020adopted14nationaltargetsthatarecloselyalignedwith5ConventiononBiologicalDiversitystrategicplansand20AichiBiodiversitytargets.Performanceindicatorshavebeendevelopedtocaptureimprovementsinlandusemanagement,pollutionmitigation,paymentsforecosystemservices,accesstogeneticresourcesandnationalfundingforbiodiversityvalorization.
• Commitmenttoimprovingdiets:TheNationalStrategicPlanofActionforNutrition(2014–2019)andtheNationalPlanofActiononFoodandNutritionreflectarelativelyhighcommitmenttoensuringdiversityinfoodavailabilityandcombattinghunger,malnutritionanddiet-relatednon-communicablediseasesatdifferentlevelsofsociety,fromthenationaltocommunitylevel.Thegovernmentaimstodosothroughprogrammesthatnotonlyfocusonhigh-valuecropsbutpromotebothproductionandconsumptionofnonconventional(indigenous)foodandnutritionallyadequatefood.Food-baseddietaryguidelinesareavailableandfoodcompositiondatabasesincludespeciesandwithin-speciesdiversityinformation.
• Publicprocurement:Publiceducationprogrammes(especiallyformaternalandchildnutrition),subsidies,schoolfeedingprogrammesandnutrientsurveillancesystemsaresetuptoincentivizelocalandhealthydiets.
Areas for improvement
• Internationalreportingandgeneticresourcemanagementpractices:thereisnoinformationavailableforNigeriaontheindicatorsoftheWorldInformationandEarlyWarningSystemonPlantGeneticResourcesforFoodandAgriculture(WIEWS),andnocountryreportintheFAOState of the World Biodiversity for Food and Agriculture 2019.Inordertoidentifyrisksandopportunitiesrelatedtoagrobiodiversity,thecountryisencouragedtomonitorandreportintheWIEWS.
• Productionpractices:Agriculturalactivities,includingslash-and-burn,uncontrolledforestclearingandoverharvesting,andoveruseofagrochemicals,aresomewidespreadpracticesthathavenegativeimpactsonwildbiodiversityassociatedwithagriculture,includingpollinators,insectsandwildfoods,increasingthevulnerabilityoftheagroecosystems.
• Healthydiets:Only34%ofyoungchildreninthecountryconsumeaminimumdietdiversity.Dietsareshortinvegetables,fruits,nutsandseeds,wholegrainsandanimal-basedproducts,andcontributeto3,436disability-adjustedlifeyearsper100,000population.Whilecommitmentstoimproveddietqualityandnutritionareexplicit,thecountryisencouragedtoimproveeffortstoleveragethepotentialofbiodiversityforhealthierdiets.
Notable findings
• Crop–livestockintegration:About75%ofNigeria’sagriculturallandintegratescropandlivestockproduction.Suchintegratedsystemscancontributetomoreclosedandefficientnutrientcycles,soilfertilityandresilientcrops.
• Naturalvegetationinagriculturallandscapes:InNigeria,55%ofagriculturallandscapeshavelessthan10%naturalorsemi-naturalvegetation,particularlyintheNorth,whichmightincreaseecosystemvulnerability.Thecountrycanbenefitfromactivemanagementofsuchareasforbothagriculturalandenvironmentalsustainability.
• Oilandbiodiversity:Nigeriaisthesixthlargestoilproducerintheworld,withpetroleumexportrevenuerepresentingalmost83%oftotalexportrevenue.viiiNigeriacanplayapioneeringroleinsustainablymanagingresourceexploitationinbiodiversityhotspotssuchastheNigerDelta.

Agrobiodiversity Index Report 2019 – Risk and Resilience
70
Risk assessment
Risksrelatedtolowagrobiodiversityarequiteequallydistributed,andallofthemappeartobehigh(Figure3).Livelihoodsinruralareasdependonnaturalresourcesincludingagrobiodiversity,butitsunsustainablemanagementandusecontributestoenvironmentaldegradationandriskoflossesduetoclimatechange.Landdegradationandbiodiversitylossreduceintheirturnagriculturalproduction,qualityoffoods,andincomegeneration.
Resilience building
Reversingtheriskassessment,theexistingagrobiodiversityandrelatedactionsandcommitments,helpbuildresiliencetovariousrisks(Figure4).CurrentagrobiodiversitymanagementinNigeriacontributesmostsignificantlytodealingwithrisksrelatedtopestsanddiseases,particularlythroughdiversifiedproductionsystemsandaccesstowithin-speciesdiversity.
FIGURE 3 –Increased risks related to low agrobiodiversity levels in Nigeria
Pes
ts a
nd d
isea
ses
P
overty trap
Biodiversity loss Clim
ate change
Malnutrition Land degradatio
n
Risks related to low agrobiodiversity
Low High
FIGURE 4 – Contributions of Agrobiodiversity Index indicators to resilience building in Nigeria
Reducing risk of malnutrition
Reducing risks related to climate changes
Reducing risk of land degradation
Reducing risks related to pests and diseases
Reducing risk of biodiversity loss
Reducing risk of poverty trap
0 20 40 60 80 100
NIG fig.4Commitment to agrobiodiversity for healthy diets
Commitment to agrobiodiversity for sustainable agriculture
Commitment to agrobiodiversity for future use options
Production practices favouring agrobiodiversity
Production diversity-based practices
Genetic resource management practices supporting agrobiodiversity
Species diversity
Varietal diversity
Functional diversity
Underutilized/local species
Soil biodiversity
Landscape complexity
Pollinator biodiversity
Consumption and market management practices supporting agrobiodiversity
Note: All scores are scaled to a maximum of 100. Colours indicate relative scores of individual agrobiodiversity indicators that contribute to building resilience for that speci�c risk area. No data available for pollinator biodiversity.

Nigeria – Country profile
71
Indicator trends
Spatial trends
InNigeria,45%ofagriculturallandcontainsaminimumof10%ofnaturalorsemi-naturalvegetation(Figure5A).Improvingthemanagementoftherelationshipbetweenagricultureandnaturalvegetationcanincreaseagriculturalandenvironmentalsustainability.
Amedium-highnumberofcropsisharvestedacrossthecountry,withafewareasthatarelessdiverse(Figure5B).Thesoilbiodiversityindex(Figure5C)isaverageacrossthecountrywithhighpotentialintheNigerDeltaregion.
FIGURE 5 – Spatial trends in agrobiodiversity indicators for sustainable agriculture, including agricultural land with >10% natural or semi-natural vegetation (A); number of harvested crops per pixel (B), and soil biodiversity index (C)
Soil biodiversity indexAgricultural landscapes embedding
Agriculture >= 10% natural vegetation < 10% natural vegetation
No. harvested crops per pixel
0 1-5 6-10 11-22 23-44 >= 45
A B C
Soil biodiversity indexHigh
Low
100km
High
Low
Source: Adapted from: A) European Space Agency 2017; B) Monfreda et al. 2008;ix C) European Soil Data Center 2016.x
FIGURE 6 – Temporal trends in species diversity in production in Nigeria (Shannon diversity index)
0.40
0.50
0.60
0.70
0.80
0.90
1.00
1960 1970 1980 1990 2000 2010 2020
Div
ersi
ty
Year
Species Diversity 10 countries Species Diversity Production
Source: FAO, 2019xi
Temporal trends
Speciesdiversityinproductionhasfluctuatedfrom1966to2013and,ingeneral,hasdeclinedovertime(Figure6).Thenumberofspecies(speciesrichness)hasremainedstable.However,somespecies,suchascassavaandmaize,havebecomemoredominantintheoverallproductionandthereforetheequaldistributionofspecies(speciesevenness)hasdeclined.

References
iWorldBank.(2019).Agriculture,forestry,andfishing,valueadded(%ofGDP).In:The World Bank[Online].Availableat:https://data.worldbank.org/indicator/nv.agr.totl.zs
iiFAO.(2019).Nigeriaataglance[Online].Availableat:fromhttp://www.fao.org/nigeria/fao-in-nigeria/nigeria-at-a-glance/en/
iiiConventiononBiologicalDiversity.Nigeria’sFifthNationalReport.Availableat:https://www.cbd.int/doc/world/ng/ng-nr-05-en.pdf
ivUNICEF.(2018).Infantandyoungchildfeedingdatabase[Online].Availableat:https://data.unicef.org/topic/nutrition/infant-and-young-child-feeding/
vIUCN.(2015).RedList.Threatenedspeciesineachcountry.Availableat:http://cmsdocs.s3.amazonaws.com/summarystats/2015_2_Summary_Stats_Page_Documents/2015_2_RL_Stats_Table_5.pdf
viEuropeanSpaceAgency(2017).EuropeanSpaceAgencyLandCoverCCIProductUserguideversion2.0.TechnicalreportYear2015.Availableat:https://maps.elie.ucl.ac.be/CCI/viewer/download/ESACCI-LC-Ph2-PUGv2_2.0.pdf
viiNowosad,J.,Stepinski,T.F.,Netzel,P.(2019).Global assessment and mapping of changes in mesoscale landscapes: 1992–2015inScienceDirect,Volume78,pp332-340.Doi:https://doi.org/10.1016/j.jag.2018.09.013
viiiOrganizationofthePetroleumExportingCountries.(2019).Nigeriafactsandfigures[Online].Availableat:https://www.opec.org/opec_web/en/about_us/167.htm
ixMonfreda,C.,Ramankutty,N.,Foley,J.A.(2008).Farmingtheplanet:2.Geographicdistributionofcropareas,yields,physiologicaltypes,andnetprimaryproductionintheyear2000.In:GlobalBiogeochemicalCycles,Volume22,Issue1.Doi:10.1029/2007GB002947
xEuropeanSoilDataCenter.(2016).“GlobalSoilBiodiversityMaps”associatedwiththeGlobalSoilBiodiversityAtlas.JointResearchCentreoftheEuropeanCommission.Availableonlineat:https://esdac.jrc.ec.europa.eu/content/global-soil-biodiversity-maps-0
xiFAO.(2019).FoodBalanceSheets.In:FAOSTAT[Online].Availableat:http://www.fao.org/faostat/en/#data/FBS

Peru – Country profile

Agrobiodiversity Index Report 2019 – Risk and Resilience
74
FIGURE 1 – Major land use (A) and changes in major land use (B)
Land cover − IPCC categories (2015)
Agriculture Bare areas Forest Grassland Ice and snow Shrubland Sparse vegetation Urban Water Wetland
A B
Source: Adapted from: A) European Space Agency 2017;ii B) Nowosad, et al. 2019.iii
Land cover change 1992−2015
Gain Loss
Agricultural Forest Grassland Shrubland Wetland Urban Water
Context
• InPeru,agricultureoccupies19%oflandarea(Figure1A),provides28%ofemployment,andcontributes7%togrossdomesticproduct.Agriculturalareasaremainlylocatedinthehighlands,andpatcheswithintheAmazon.
• PeruispartoftheSouthAmericanVavilovcentresofplantdomestication,withveryhighdiversityfor62plantsincludingpotatoes,beans,maize,tomatoesandCapsicumpepper.
• Thecountryhasoneofthehighestconcentrationsofbiodiversityintheworld,hostingmorethan2,145speciesoffish(highestintheworld),4,000speciesofbutterflies(highestintheworld),1,847birds(third
intheworld),624amphibians(fourthintheworld),and523mammals(fifthintheworld).
• About78%ofyoungchildren(6–23months)inPeruconsumeaminimumdietdiversity.Amongadults,themortalityrateattributabletoinadequatedietsislowcomparedtoothercountriesat107per100,000population.
• Peru’sagriculturalbiodiversityandecosystemservicesareunderthreatduetolandusechange(Figure1B),habitatlossandoverexploitation.About44%ofplantand8%ofanimalspeciesinthecountryassessedbytheInternationalUnionforConservationofNature(IUCN)arethreatened.DeforestationhashittheAmazonforestparticularlyhard,withanaveragerateof118,000haforestlossperyear.Clearingoflandforagricultureisthemajorcause.i

Peru – Country profile
75
Agrobiodiversity Index results
• Peruscoresmedium-highforstatusofagrobiodiversity(Figure2A).Thelevelofgeneticresourcesforfutureoptionsandagrobiodiversityinmarketsandconsumptionforhealthydietscontributemoststronglytothisscore,whilethecontributionofagrobiodiversityinproductionisrelativelylower.Thisindicatesthatagrobiodiversityishighlyavailableingeneticresourcemanagementandinmarketsandconsumption,butthatitspotentialisstillunderusedinagriculturalproductionsystems.
• Theprogressscoreshowsthatagrobiodiversity-relatedcommitmentsandactionsthatareinplacearemedium-weak(Figure2B).Whilemany
policiesexistandmakenoteofagrobiodiversity,specificstrategiesandtargetstosustainablyuseandconserveitaremostlymissing.Currentactionstostrengthentheuseandconservationofagrobiodiversityarestrongerintermsofgeneticresourcemanagementtosafeguardfutureoptions,butweakerwhenitcomestousingagrobiodiversitysustainablyinagriculture,marketsandconsumptiontoimprovefarmers’livelihoodsandpeople’snutrition.
• Comparedtothe10-countryaveragescores,Peruoutperformsonoverallagrobiodiversitystatus,andscoresaverageoncommitmentsandactionstomanageagrobiodiversityovertime.Thisflagsariskthatagrobiodiversityistakenforgrantedandmightdeclineifnospecificcommitmentsoractionsareputinplace.
FIGURE 2 – Overview of Agrobiodiversity Index scores for Peru
59%
(A) Status score (B) Progress score
32%
PER fig. 2
Agrobiodiversity for healthy diets
Agrobiodiversity for sustainable agriculture
Agrobiodiversity for future options
Actions on agrobiodiversity for healthy diets
Actions on agrobiodiversity for sustainable agriculture
Actions on agrobiodiversity for future options
Commitment on agrobiodiversity for healthy diets
Commitment on agrobiodiversity for sustainable agriculture
Commitment on agrobiodiversity for future options

Agrobiodiversity Index Report 2019 – Risk and Resilience
76
TABLE 1 – Overview of the Agrobiodiversity Indicator scores per pillar for Peru
Pillar 1 Pillar 2 Pillar 3
Agrobiodiversity in markets and consumption for healthy diets
Agrobiodiversity in production for sustainable agriculture
Agrobiodiversity in genetic resource management for future options
Commitment Level of commitment to enhancing consumption and markets of agrobiodiversity for healthy diets 50
Level of commitment to enhancing production and maintenance of agrobiodiversity for sustainable agriculture
38
Level of commitment to enhancing genetic resource management of agrobiodiversity for current and future use options
46
Actions Consumption and market management practices supporting agrobiodiversity 13
Production practices favouring agrobiodiversity 21
Production diversity-based practices 17
Genetic resource management practices supporting agrobiodiversity 29
Status Species diversity86 29 92
Varietal diversity 96
Functional diversity42
Underutilized/local species44 36
Soil biodiversity 41
Pollinator biodiversity
Landscape complexity 68
Note: All scores are scaled from 0–100. The colour scheme was changed on 1 August 2019 to reflect more accurately the scores

Peru – Country profile
77
Leading practices
• Insituconservation:Around67%ofwildusefulplantsinPeruarewellconservedin situ.Thecountryhasestablishedagrobiodiversityhotspotareas,likethePotatoPark,hometoalargediversityofpotatoes,toprotectandconserveitsagrobiodiversityin situ.
• Internationalreportingonagrobiodiversity:Perusystematicallyreportson86%ofindicatorstotheWorldInformationandEarlyWarningSystem(WIEWS)onPlantGeneticResourcesforFoodandAgriculture.Perualsocontributedanin-depthcountryprofiletotheFAOState of the World’s Biodiversity for Food and Agriculture 2019.
• Landsharing:About67%ofPeru’sagriculturallandincludesmorethan10%naturalvegetation,suggestingthatagricultureisintegratedwiththesurroundingenvironmentandprovideshabitatandhabitatconnectivityforbiodiversity.Agroforestryismanagedon27%ofagriculturalland,morethandoublethe10-countryaverage(10.5%).Asagriculturallandisexpanding,itwillbeveryimportanttocarefullymanagetheinteractionbetweenagriculturalandnaturalvegetation.
Areas for improvement
• Explicitstrategiesandtargets:Commitmenttomanagingtherichnessofagrobiodiversityforsustainableagriculture,healthydietsandfutureuseoptionscanbemadeexplicitthroughtheidentificationofdedicatedstrategiesandtargets.
• Sustainableproductionpractices:TheSustainableNitrogenManagementIndex(SNMI)showsthatPeruperformslowonsustainablenitrogenmanagement,includingnitrogenuseefficiency,indicatingariskfornutrientrun-offandenvironmentalpollution.Pesticideuseisalsohighat5kgperha.However,Peruhascommittedtobanningtheuseofhighlytoxicpesticides.Morecarefulmanagementofpesticidesandfertilizerscanreducenegativeeffectsofagricultureonbiodiversity.
• Food-baseddietaryguidelines:DespitePeru’sveryrichculinaryhistory,andhighbiodiversityforfoodandnutrition,locallyadaptedfood-baseddietaryguidelinesarenotyetavailable.Thepotentialofbetween-speciesandwithin-speciesdiversityforhealthydietscanbeexploredinsuchguidelinesandinfoodcompositiontables.
Notable findings
• RelativelyhighscoresacrossallthreeAgrobiodiversityIndexpillars:Peruhashigherstatusandprogressscoresinagrobiodiversityforhealthydiets,forsustainableagricultureandforfutureoptionscomparedtoothercountries.Othercountriesfromthesampleoftenperformhighlyinoneortwoofthepillars.
• Civilsocietyengagement:WhilePerushowsamoderatecommitmenttoachievingdiversifiedandhealthydiets,somepoliciesstandout.LearningfromthedevelopmentprocessoftheNationalStrategyforFoodandNutritionSecurity2013–2021,thecountryhasadoptedamultisectoralapproachtofoodsecurityandnutritionwherebyfoodandnutritionsecurityprogrammesareco-managedbydecentralizedgoverningbodiestogetherwithcivilsociety.
• Usefulwildplants:whilemostcountriesscoreverylowonthein situandex situconservationofusefulwildplants,inPeru67%ofusefulwildplantsareconservedin situand4.7%ex situ.
• Marketsandproduction:Peru’sspeciesdiversityinsupply,production,exportandimporthasgraduallyincreasedovertheyearsbutmorerecentlyithasstagnatedandevendeclined.

Agrobiodiversity Index Report 2019 – Risk and Resilience
78
Risk assessment
Thecountryismodestlyexposedtomultiplerisksrelatedtolowagrobiodiversityorpooractionsandcommitmentrelatedtoitssustainableuseandconservation(Figure3).Contributingtotheriskoflanddegradationistherelativelylowspeciesdiversityperunitoflandareainproductionsystems,thecriticallylowsoilbiodiversityincertainareasofthecountry,andthelimitedactionsinplacethatsupportagrobiodiversityforsustainableagriculture.Forexample,theproportionofagriculturallandunderconservationagricultureororganicagricultureisclosetozero.Togetherwiththetrendsinlandusechangedescribedinthecontextsection,thisexposesPerutoincreasedrisksoflanddegradation.Contributingtotheriskforlossesduetoclimatechangearetherelativelowspeciesdiversityinproductionsystemsandareaswithlowsoilbiodiversity.
Resilience building
Reversingtheriskassessment,theexistingagrobiodiversityandrelatedactionsandcommitmentshelpbuildresiliencetovariousrisks(Figure4).Current
agrobiodiversitymanagementinPerucontributesmostsignificantlytomanagingtherisksofpestsanddiseases,povertytrapandbiodiversityloss.Inparticular,muchofPeru’sagriculturallandcontainsasignificantamountofnaturalorsemi-naturalvegetation,whichplaysacriticalroleasbiodiversityhabitat.
FIGURE 3 – Increased risks related to low agrobiodiversity levels in Peru
Pes
ts a
nd d
isea
ses
P
overty trap
Biodiversity loss Clim
ate change
Malnutrition Land degradatio
n
Risks related to low agrobiodiversity
Low High
FIGURE 4 – Contributions of Agrobiodiversity Index indicators to resilience building in Peru
Reducing risk of malnutrition
Reducing risks related to climate changes
Reducing risk of land degradation
Reducing risks related to pests and diseases
Reducing risk of biodiversity loss
Reducing risk of poverty trap
0 20 40 60 80 100
Commitment to agrobiodiversity for healthy diets
Commitment to agrobiodiversity for sustainable agriculture
Commitment to agrobiodiversity for future use options
Production practices favouring agrobiodiversity
Production diversity-based practices
Genetic resource management practices supporting agrobiodiversity
Species diversity
Varietal diversity
Functional diversity
Underutilized/local species
Soil biodiversity
Landscape complexity
Pollinator biodiversity
Consumption and market management practices supporting agrobiodiversity
Note: All scores are scaled to a maximum of 100. Colours indicate relative scores of individual agrobiodiversity indicators that contribute to building resilience for that speci�c risk area. No data available for pollinator biodiversity.

Peru – Country profile
79
FIGURE 5 – Spatial trends in agrobiodiversity indicators for sustainable agriculture, including agricultural land with > 10% natural or semi-natural vegetation (A); number of harvested crops per pixel (B), and soil biodiversity index (C)
Soil biodiversity indexAgricultural landscapes embedding
Agriculture >= 10% natural vegetation < 10% natural vegetation
No. harvested crops per pixel
0 1-5 6-10 11-22 23-44 >= 45
A B C
Soil biodiversity indexHigh
Low
100km
High
Low
Source: Adapted from: A) European Space Agency 2017; B) Monfreda et al. 2008;iv C) European Soil Data Center 2016.v
Indicator trends
Spatial trends
InPeru,67%ofagriculturallandcontainsaminimumof10%ofnaturalorsemi-naturalvegetation(Figure6A),suggestingthatagricultureisverymuchinterconnectedwiththesurroundingecosystem.Continuedandimprovedmanagementofthisrelationshipbetween
agricultureandnaturalvegetationiscriticalforagriculturalandenvironmentalsustainabilityinthecountry.
Thenumberofcropspeciesharvestedperlandunit(10x10km)ismedium-low(Figure5B).Inseveralregions,nomorethanfivecropsperlandunitareharvestedonanannualbase.Overdependenceonafewcropscanincreaseriskstoenvironmentalandeconomicshocks.Soilbiodiversitypotential(Figure5C)isparticularlyhighintheAmazon,andcriticallylowinthedryareasinthesouthwest.
FIGURE 6 – Temporal trends in species diversity in production in Peru (Shannon diversity index)
0.40
0.50
0.60
0.70
0.80
0.90
1.00
1960 1970 1980 1990 2000 2010 2020
Div
ersi
ty
Year
Species Diversity 10 countries Species Diversity Production
Source: FAO, 2019vi
Temporal trends
Temporaltrendsinspeciesdiversityinproduction(Figure6)illustrateagradualincreaseinspeciesdiversityfrom1965on,reachingabove-averagelevelsin2005.Thisincrease,however,hasleveledoffandslightlydeclinedmorerecently.InparalleltoPeru’sproductiondiversity,speciesdiversityinPeru’sagriculturalexportandimporthasalsoincreasedoverthelast50years.

References
iBIOFIN.(2019).Peru[Online].Availableat:https://www.biodiversityfinance.net/peru
iiEuropeanSpaceAgency.(2017).EuropeanSpaceAgencyLandCoverCCIProductUserguideversion2.0.TechnicalreportYear2015.Availableat:https://maps.elie.ucl.ac.be/CCI/viewer/download/ESACCI-LC-Ph2-PUGv2_2.0.pdf
iiiNowosad,J.,Stepinski,T.F.,Netzel,P.(2019).Global assessment and mapping of changes in mesoscale landscapes: 1992–2015inScienceDirect,Volume78,pp332-340.Doi:https://doi.org/10.1016/j.jag.2018.09.013
ivMonfreda,C.,Ramankutty,N.,Foley,J.A.(2008).Farmingtheplanet:2.Geographicdistributionofcropareas,yields,physiologicaltypes,andnetprimaryproductionintheyear2000.In:GlobalBiogeochemicalCycles,Volume22,Issue1.Doi:10.1029/2007GB002947
vEuropeanSoilDataCenter.(2016).“GlobalSoilBiodiversityMaps”associatedwiththeGlobalSoilBiodiversityAtlas.JointResearchCentreoftheEuropeanCommission.Availableonlineat:https://esdac.jrc.ec.europa.eu/content/global-soil-biodiversity-maps-0
viFAO.(2019).FoodBalanceSheets.In:FAOSTAT[Online].Availableat:http://www.fao.org/faostat/en/#data/FBS
South Africa – Country profile

Agrobiodiversity Index Report 2019 – Risk and Resilience
82
FIGURE 1 – Major land use (A) and changes in major land use (B)
Land cover − IPCC categories (2015)
Agriculture Bare areas Forest Grassland Ice and snow Shrubland Sparse vegetation Urban Water Wetland
A B
Source: Adapted from: A) European Space Agency 2017;iv B) Nowosad, et al. 2019.v
Land cover change 1992−2015
Gain Loss
Agricultural Forest Grassland Shrubland Wetland Urban Water
Context
• SouthAfrica’sagricultureischaracterizedbyadualeconomy,withawell-developedcommercialsectoralongsidepredominantlysubsistencefarmingincommunalareas,whereitremainstheprimarysourceofemployment.i
• About80%ofthetotallandisusedforagriculture,ofwhich13%isarableandsuitableforcommercialcropproduction,whiletherestisusedasrangelandforgrazingcattle,sheepandgoats(Figure1A).ii
• Only40%ofyoungchildren(6–23months)consumeaminimumdietdiversity.iiiAmongadults,themortalityrateattributabletoinadequatedietsis219per100,000population.
• Majorlandusechangesincludeurbanization,agriculturalexpansionandnetdeforestation(despiteafforestationeffortsinotherareas)(Figure1B).
• TheIUCNRedListestimatesthataround603speciesacrosstaxaarethreatenedinthecountryduetovariousreasons,includingthosedirectlyorindirectlyrelatedtoagriculture.

Soth Africa – Country profile
83
Agrobiodiversity Index results
• SouthAfricascoresmediumforthepresentstatusofagrobiodiversity(Figure2A).Agrobiodiversityingeneticresourcemanagementforfutureoptionsaddsmoststronglytothestatusscore,followedbyagrobiodiversityinmarketsandconsumptionforhealthydietsandarelativelylowscoreonagrobiodiversityinproductionsystemsforsustainableagriculture.Thistrendindicatesthatgeneticresourcesarehighlyavailableandcanbefurtherunlockedforsustainableuseinconsumptionandproduction.
• Theprogressscoreismedium-low(Figure2B).Specificstrategiesandtargetstousetheavailableagrobiodiversityforsustainableagriculturearemostlyabsentinthesourcesanalyzed.Onthepositiveside,SouthAfricashowedanexplicitambitiontodiversifydietsinitsRoadmapforNutritioninSouthAfrica(2013−2017).
• Comparedtothe10-countryaverage,SouthAfricascoresjustbelowaverageforstatusscoreandaboveaveragefortheprogressscores.Itsincreasingfocusonandcommitmenttotheroleofagrobiodiversityfornutritioncantriggerdemandthathelpsunlockthepotentialofagrobiodiversityalongthevaluechain,fromgeneticresourcemanagementtoproductionandconsumption.
FIGURE 2 – Overview of Agrobiodiversity Index scores for South Africa
52%
(A) Status score (B) Progress score
37%
SOUTH AF fig. 2
Agrobiodiversity for healthy diets
Agrobiodiversity for sustainable agriculture
Agrobiodiversity for future options
Actions on agrobiodiversity for healthy diets
Actions on agrobiodiversity for sustainable agriculture
Actions on agrobiodiversity for future options
Commitment on agrobiodiversity for healthy diets
Commitment on agrobiodiversity for sustainable agriculture
Commitment on agrobiodiversity for future options
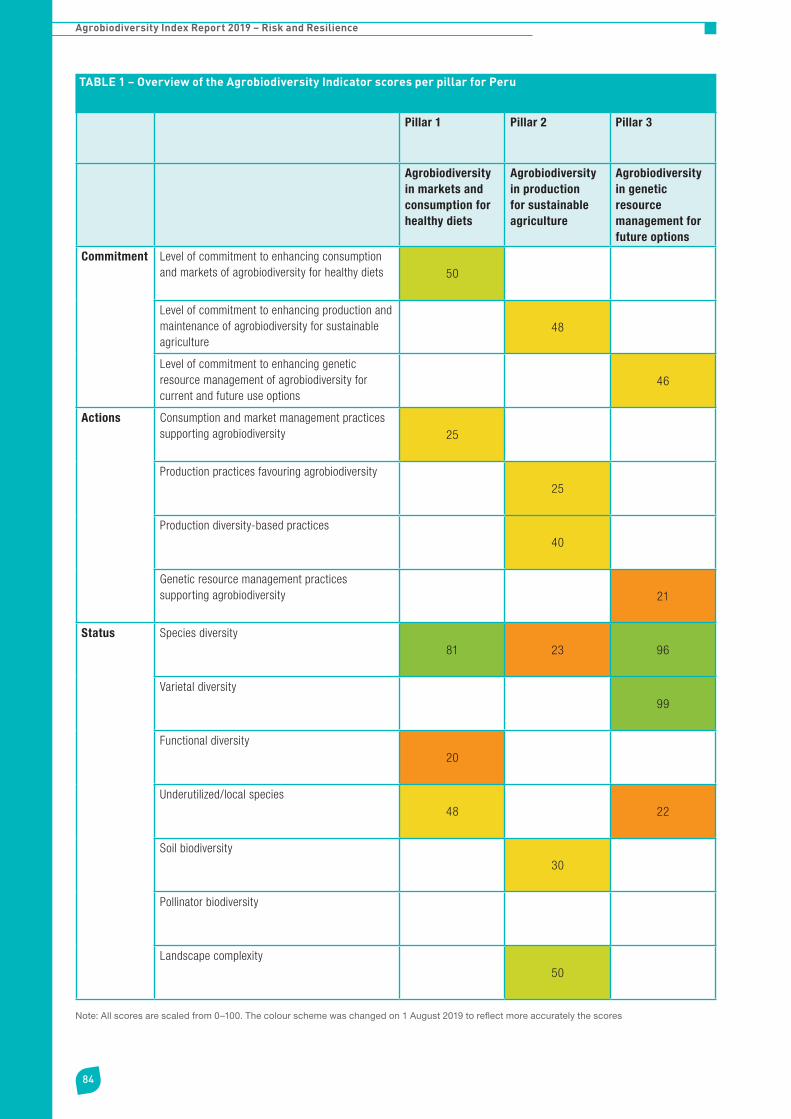
Agrobiodiversity Index Report 2019 – Risk and Resilience
84
TABLE 1 – Overview of the Agrobiodiversity Indicator scores per pillar for Peru
Pillar 1 Pillar 2 Pillar 3
Agrobiodiversity in markets and consumption for healthy diets
Agrobiodiversity in production for sustainable agriculture
Agrobiodiversity in genetic resource management for future options
Commitment Level of commitment to enhancing consumption and markets of agrobiodiversity for healthy diets 50
Level of commitment to enhancing production and maintenance of agrobiodiversity for sustainable agriculture
48
Level of commitment to enhancing genetic resource management of agrobiodiversity for current and future use options
46
Actions Consumption and market management practices supporting agrobiodiversity 25
Production practices favouring agrobiodiversity 25
Production diversity-based practices 40
Genetic resource management practices supporting agrobiodiversity 21
Status Species diversity81 23 96
Varietal diversity 99
Functional diversity20
Underutilized/local species48 22
Soil biodiversity 30
Pollinator biodiversity
Landscape complexity 50
Note: All scores are scaled from 0–100. The colour scheme was changed on 1 August 2019 to reflect more accurately the scores

Soth Africa – Country profile
85
Leading practices
• Landscape-basedinitiatives:SouthAfricareportshostingsevenintegratedlandscapemanagementinitiatives,aimedatconcurrentlyimprovingsustainableproduction,conservation,livelihoodsandgovernance.Researchinthecountryisthemostactiveonthecontinentwhenitcomestoassessingvariousprovisioning,regulating,supportingandculturalecosystemservices.vi
• Subsidiesorpaymentstoincentivizesustainableagriculturalpractices:SouthAfricadeductstheexpendituresincurredbytaxpayerstoconserveormaintainland,basedona5-yearbiodiversitymanagementagreement.
• Internationalreportingonagrobiodiversity:SouthAfricasystematicallyreportson61%ofindicatorstotheWorldInformationandEarlyWarningSystem(WIEWS)onPlantGeneticResourcesforFoodandAgriculture.However,thecountrydidnotcontributeanin-depthcountryprofiletotheFAOState of the World’s Biodiversity in Food and Agriculture 2019.
Areas for improvement
• Biodiversityforfoodandnutrition:SouthAfricastruggleswithalargemalnutritionproblem.Still60%ofchildren(6–23months)inthecountrydonotconsumeaminimumdietdiversity.Therateofchronicmalnutrition(stunting)amongchildren,whichhadbeendeclining,hasincreasedagainduringthelasttenyears,reaching27%.viiAmongadults,65%ofwomenand40%ofmenareoverweight.Consumptionofvegetables,fruits,nutsandseedsisverylow,whilesugar-sweetenedbeveragesareoverconsumed.
• Sustainableproductionpractices:Actionstargetedatavoidingoveruseofchemicalcontrolswhilefosteringandencouragingsustainableproductionpractices−suchasorganicagriculture,agroforestryandconservationagriculture−arestillrareinthecountry.
• Multisectoralcoordination:TheNationalPolicyonFoodandNutritionSecurityrecognizesclimatechange,globalizationandlackofcoordinated
marketinterventionsaskeyelementsforguaranteeingtheprovisionofnutritiousfoodandhealthydiets,especiallyforthepoor.Consideringthat,furthermultisectoralcoordinationandcommitmentsarerecommended.
Notable findings
• Insituandexsituconservation:ThestrategicplanoftheSouthAfricanDepartmentofAgriculture,ForestryandFisheriesproposesspecifictargetsforin situandex situconservationofplantsandanimals.Thisplanalsoensurestheprotectionofindigenousgeneticresourcesforfoodandagriculturemanagement.About41%ofusefulwildplantsareconservedin situ,butonly2%areconservedex situ.
• Crop–livestockintegration:About75%ofSouthAfrica’sagriculturallandintegratescropandlivestockproduction.Suchintegratedsystemscancontributetomoreclosedandefficientnutrientcycles,soilfertilityandcropdiversification.
• Export:SouthAfricanexportsworldwidefoodswhichareextremelyimportantforfoodsecurity,especiallyintheAfricancontinent.ThenumberofreportedspeciesinfoodexportsfromSouthAfricahassteadilyincreasedovertime,from42in1960to71in2013.
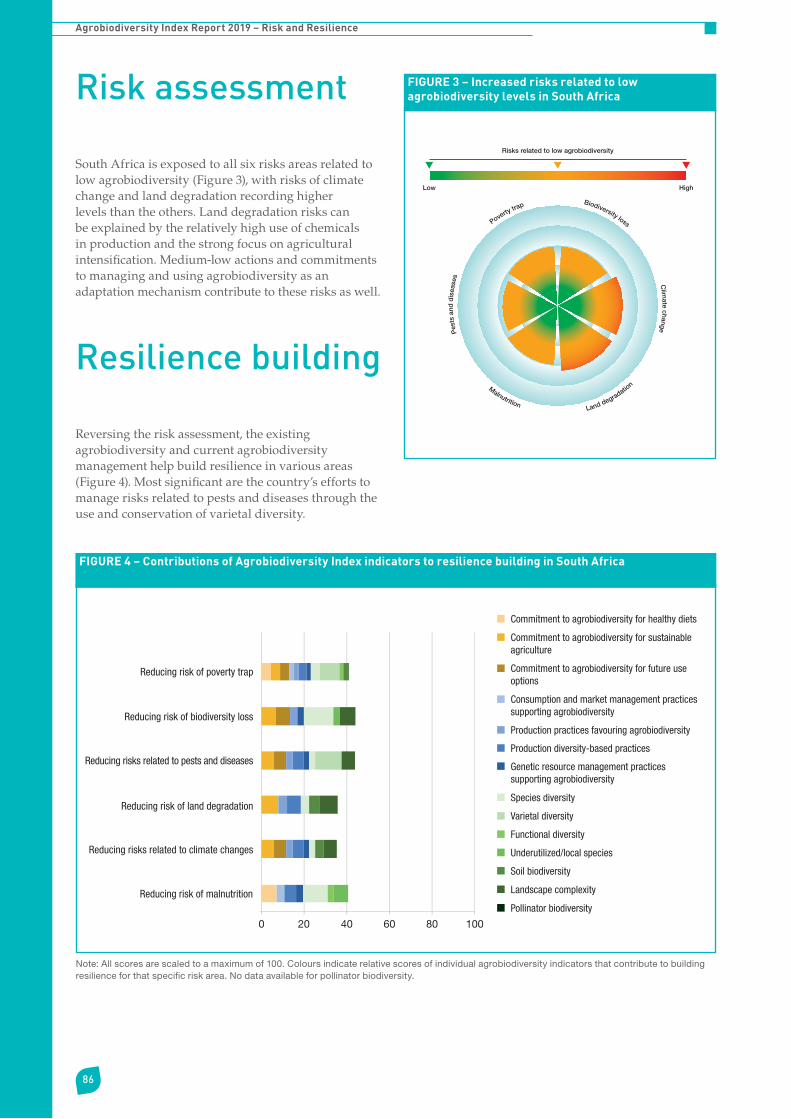
Agrobiodiversity Index Report 2019 – Risk and Resilience
86
Risk assessment
SouthAfricaisexposedtoallsixrisksareasrelatedtolowagrobiodiversity(Figure3),withrisksofclimatechangeandlanddegradationrecordinghigherlevelsthantheothers.Landdegradationriskscanbeexplainedbytherelativelyhighuseofchemicalsinproductionandthestrongfocusonagriculturalintensification.Medium-lowactionsandcommitmentstomanagingandusingagrobiodiversityasanadaptationmechanismcontributetotheserisksaswell.
Resilience building
Reversingtheriskassessment,theexistingagrobiodiversityandcurrentagrobiodiversitymanagementhelpbuildresilienceinvariousareas(Figure4).Mostsignificantarethecountry’seffortstomanagerisksrelatedtopestsanddiseasesthroughtheuseandconservationofvarietaldiversity.
FIGURE 3 – Increased risks related to low agrobiodiversity levels in South Africa
Pes
ts a
nd d
isea
ses
P
overty trap
Biodiversity loss Clim
ate change
Malnutrition Land degradatio
n
Risks related to low agrobiodiversity
Low High
FIGURE 4 – Contributions of Agrobiodiversity Index indicators to resilience building in South Africa
Reducing risk of malnutrition
Reducing risks related to climate changes
Reducing risk of land degradation
Reducing risks related to pests and diseases
Reducing risk of biodiversity loss
Reducing risk of poverty trap
0 20 40 60 80 100
Commitment to agrobiodiversity for healthy diets
Commitment to agrobiodiversity for sustainable agriculture
Commitment to agrobiodiversity for future use options
Production practices favouring agrobiodiversity
Production diversity-based practices
Genetic resource management practices supporting agrobiodiversity
Species diversity
Varietal diversity
Functional diversity
Underutilized/local species
Soil biodiversity
Landscape complexity
Pollinator biodiversity
Consumption and market management practices supporting agrobiodiversity
Note: All scores are scaled to a maximum of 100. Colours indicate relative scores of individual agrobiodiversity indicators that contribute to building resilience for that speci�c risk area. No data available for pollinator biodiversity.

Soth Africa – Country profile
87
FIGURE 5 – Spatial trends in agrobiodiversity indicators for sustainable agriculture, including agricultural land with >10% natural or semi-natural vegetation (A); number of harvested crops per pixel (B), and soil biodiversity index (C)
Soil biodiversity indexAgricultural landscapes embedding
Agriculture >= 10% natural vegetation < 10% natural vegetation
No. harvested crops per pixel
0 1-5 6-10 11-22 23-44 >= 45
A B C
Soil biodiversity indexHigh
Low
100km
High
Low
Source: Adapted from: A) European Space Agency, 2017; B) Monfreda et al., 2008;viii C) European Soil Data Center, 2016.ix
Indicator trends
Spatial trends
InSouthAfrica,around50%ofagriculturallandcontainsaminimumof10%ofnaturalorsemi-naturalvegetation(Figure5A),suggestingthatagricultureisquiteinterconnectedwiththesurroundingecosystem.
Continuedmanagementoftherelationshipbetweenagricultureandnaturalvegetationiscriticalforagriculturalandenvironmentalsustainability.Productionsystemsrangefromlesstomorediversifiedones.Thenumberofcropspeciesharvestedperpixelvariesgreatlyacrossthecountry,withhighervaluesinsomeregions,includingHighveldandLowveld(Figure5B).Thesoilbiodiversityindex(Figure5C)ismedium-lowinthewesternareaswhicharemostlysemi-desertwithlowerrainfall.
FIGURE 6 – Temporal trends in species diversity in production in South Africa (Shannon diversity Index)
0.40
0.50
0.60
0.70
0.80
0.90
1.00
1960 1970 1980 1990 2000 2010 2020
Div
ersi
ty
Year
Species Diversity 10 countries Species Diversity Production
Source: FAO, 2019x
Temporal trends
InSouthAfrica,speciesdiversityinproductionhasfluctuatedovertime,butremainedstableandbelowaverage,from1965to2013(Figure6).Duringtheseyears,SouthAfricahasalsobeenamainexporteroffood,andthenumberofspeciesinthecountry’sexportshasincreasedovertime.In1965,44outof65majorspeciesproducedwerepartlyexported,whilein2013,71outof72majorspeciesproduced,wereexported.Asimilartrendisobservedinthenumberofspeciesbeingimported,whichincreasedfrom42in1965to78majorspeciesin2013.
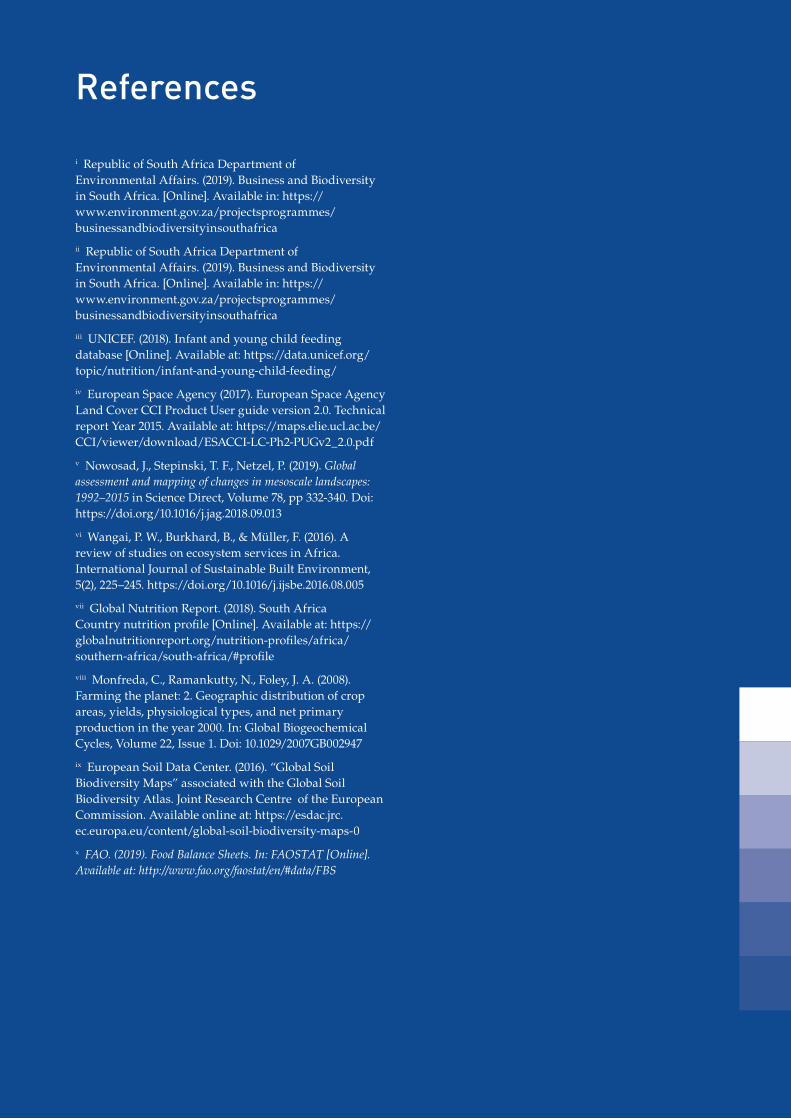
References
iRepublicofSouthAfricaDepartmentofEnvironmentalAffairs.(2019).BusinessandBiodiversityinSouthAfrica.[Online].Availablein:https://www.environment.gov.za/projectsprogrammes/businessandbiodiversityinsouthafrica
iiRepublicofSouthAfricaDepartmentofEnvironmentalAffairs.(2019).BusinessandBiodiversityinSouthAfrica.[Online].Availablein:https://www.environment.gov.za/projectsprogrammes/businessandbiodiversityinsouthafrica
iiiUNICEF.(2018).Infantandyoungchildfeedingdatabase[Online].Availableat:https://data.unicef.org/topic/nutrition/infant-and-young-child-feeding/
ivEuropeanSpaceAgency(2017).EuropeanSpaceAgencyLandCoverCCIProductUserguideversion2.0.TechnicalreportYear2015.Availableat:https://maps.elie.ucl.ac.be/CCI/viewer/download/ESACCI-LC-Ph2-PUGv2_2.0.pdf
vNowosad,J.,Stepinski,T.F.,Netzel,P.(2019).Global assessment and mapping of changes in mesoscale landscapes: 1992–2015inScienceDirect,Volume78,pp332-340.Doi:https://doi.org/10.1016/j.jag.2018.09.013
viWangai,P.W.,Burkhard,B.,&Müller,F.(2016).AreviewofstudiesonecosystemservicesinAfrica.InternationalJournalofSustainableBuiltEnvironment,5(2),225–245.https://doi.org/10.1016/j.ijsbe.2016.08.005
viiGlobalNutritionReport.(2018).SouthAfricaCountrynutritionprofile[Online].Availableat:https://globalnutritionreport.org/nutrition-profiles/africa/southern-africa/south-africa/#profile
viiiMonfreda,C.,Ramankutty,N.,Foley,J.A.(2008).Farmingtheplanet:2.Geographicdistributionofcropareas,yields,physiologicaltypes,andnetprimaryproductionintheyear2000.In:GlobalBiogeochemicalCycles,Volume22,Issue1.Doi:10.1029/2007GB002947
ixEuropeanSoilDataCenter.(2016).“GlobalSoilBiodiversityMaps”associatedwiththeGlobalSoilBiodiversityAtlas.JointResearchCentreoftheEuropeanCommission.Availableonlineat:https://esdac.jrc.ec.europa.eu/content/global-soil-biodiversity-maps-0
xFAO. (2019). Food Balance Sheets. In: FAOSTAT [Online]. Available at: http://www.fao.org/faostat/en/#data/FBS

United States of America – Country profile

Agrobiodiversity Index Report 2019 – Risk and Resilience
90
FIGURE 1 – Major land use (A) and changes in major land use (B)
Land cover − IPCC categories (2015)
Agriculture Bare areas Forest Grassland Ice and snow Shrubland Sparse vegetation Urban Water Wetland
A B
Source: Adapted from: A) European Space Agency 2017;vii B) Nowosad, et al. 2019.viii
Land cover change 1992−2015
Gain Loss
Agricultural Forest Grassland Shrubland Wetland Urban Water
Context
• IntheUSA,agricultureandpastureoccupyabout44%ofthetotallandarea(Figure1A)andprovideabout1.4%ofemployment.In2017,thissectorcontributedtoapproximately1.0%ofgrossdomesticproduct.iTheUSAisamajorproducerofmaizeasfeedgrain,cotton,soybeans,fruit,sugar,vegetablesandnuts.
• Amongadults,themortalityrateattributabletoinadequatedietsis171per100,000population.iiOverallconsumptionoffoodgroupsistoolowforvegetables,fruits,wholegrains,nutsandseeds,andtoohighforprocessedandredmeats,andsugar-sweetenedbeverages.iii
• TheUSAhostsoneofthefourmajornationalgenebanksintheworldattheNationalCenterforGeneticResourcesPreservation,withover580,000cropsamples.TheUSAishometoroughly13%ofnativespeciesidentifiedworldwideandcropwildrelatives,andhasthreebiodiversityhotspots:theCaliforniaFloristicProvince(spanningfromCaliforniatoOregon),theMadreanPine-OakWoodlands(inArizona,NewMexicoandTexas)andtheNorthAmericanCoastalPlain.iv,v
• Majorchangesinlanduseincludeurbanizationandreforestation(Figure1B).
• TheIUCNRedListestimatesthatin2015around1,300speciesacrosstaxawerethreatenedinthecountryduetovariousreasons,includingthosedirectlyorindirectlyrelatedtoagriculture.viOverthepast35years,cropdiversityhasdecreasedconsiderablyduetomanyfactors,includingtheexpansionofcorn,wheat,soybeansanduplandcottonproductionsystems.

USA – Country profile
91
Agrobiodiversity Index results
• TheUSAscoresmediumforthepresentstatusofagrobiodiversity.Agrobiodiversityingeneticresourcemanagementforfutureoptionscontributesmoststronglytothestatusscore,followedbyagrobiodiversityinmarketsandconsumptionforhealthydietsandagrobiodiversityinproductionsystemsforsustainableagriculture.
• Theprogressscoreappearstobelow.Infact,specifictargetswithtime-boundthresholdsfor
conservationorsustainableuseoftheavailableagrobiodiversityaremostlymissinginthesourcesanalyzed.Onthepositiveside,theUSA showsastrongcommitmenttoincreasingthenumberofhealthypeople.Thecountryisalsoputtinginplacestrongactionstodiversifyproduction,throughcrop–livestocksystems,andtoincorporateagrobiodiversityinproductionsystemsforsustainableagriculture.
• Comparedtothe10-countryaverage,theUSAscoresbelowaverageinbothstatusandprogressscores.Thecountry’sincreasingfocusonhealthandnutritiousfoodcantriggerpublicdemandthathelpsunlockthepotentialofagrobiodiversityalongthevaluechain,fromgeneticresourcemanagementtoproductionandconsumption.
FIGURE 2 – Overview of Agrobiodiversity Index scores for the USA
53%
(A) Status score (B) Progress score
28%
USA AF fig. 2
Agrobiodiversity for healthy diets
Agrobiodiversity for sustainable agriculture
Agrobiodiversity for future options
Actions on agrobiodiversity for healthy diets
Actions on agrobiodiversity for sustainable agriculture
Actions on agrobiodiversity for future options
Commitment on agrobiodiversity for healthy diets
Commitment on agrobiodiversity for sustainable agriculture
Commitment on agrobiodiversity for future options

Agrobiodiversity Index Report 2019 – Risk and Resilience
92
TABLE 1 – Overview of the agrobiodiversity indicator scores per pillar for the USA
Pillar 1 Pillar 2 Pillar 3
Agrobiodiversity in markets and consumption for healthy diets
Agrobiodiversity in production for sustainable agriculture
Agrobiodiversity in genetic resource management for future options
Commitment Level of commitment to enhancing consumption and markets of agrobiodiversity for healthy diets 50
Level of commitment to enhancing production and maintenance of agrobiodiversity for sustainable agriculture
29
Level of commitment to enhancing genetic resource management of agrobiodiversity for current and future use options
21
Actions Consumption and market management practices supporting agrobiodiversity 25
Production practices favouring agrobiodiversity 21
Production diversity-based practices 51
Genetic resource management practices supporting agrobiodiversity 8
Status Species diversity86 30 97
Varietal diversity 99
Functional diversity25
Underutilized/local species56 19
Soil biodiversity 26
Pollinator biodiversity
Landscape complexity 43
Note: All scores are scaled from 0–100. The colour scheme was changed on 1 August 2019 to reflect more accurately the scores

USA – Country profile
93
Leading practices
• Exsitu and insitu conservation:TheUSAhostsoneofthefourmajornationalgenebanksintheworldattheNationalCenterforGeneticResourcesPreservation,withabout580,000cropsamples.Thecountryishometoabout13%ofnativespeciesidentifiedworldwide,andtomanycropwildrelatives.Ithoststhreebiodiversityhotspots:theCaliforniaFloristicProvince(spanningfromCaliforniatoOregon),theMadreanPine-OakWoodlands(inArizona,NewMexicoandTexas)andtheNorthAmericanCoastalPlain.
• Crop–livestock combinations in agricultural landscapes:Around89%ofagriculturallandintheUSAintegratescropandlivestockproduction.Suchintegratedsystemscancontributetomoreclosedandefficientnutrientcycles,soilfertility,anddiversifiedandresilientproductionsystem.
• Agrobiodiversity in supply systems for healthy diets:CommitmentstoimprovingdietdiversitycanbeseenfromtheHealthyPeople2020initiative,managedbytheDiseasePreventionandHealthPromotionOfficeattheUnitedStatesDepartmentofHealthandHumanServices.Thisincludesincreasingpublicawareness,accesstoretailoutletssellingawidervarietyoffoods,andpublicprocurementthroughprovisionofnutritiousfoodsinschools.
Areas for improvement
• Agrobiodiversity for more sustainable agriculture:SimplificationandintensificationofagriculturallandscapesintheUSAincreaserisksoflanddegradation,lossesduetoclimatechange,biodiversitylossandruralpoverty.ThemapsinFigure5showthatinmanycasesthenumberofspeciesperlandunitarefiveorlowerinlargeagriculturalareasinthecountry.
• Management of natural vegetation in agricultural landscapes:About43%ofagriculturallandincludesmorethan10%ofnaturalorsemi-naturalvegetation,suggestingthatagricultureisquiteinterconnectedwiththesurroundingecosystem,butthisrelationshipcanbeimproved.Thecountrycouldbenefitfromactivemanagementofsuchareas
toachievebothagriculturalandenvironmentalsustainability.
• Avoiding overuse of fertilizers and pesticides: Chemicalcontrolmechanismsinagriculturearehighlyused.Fivecrops–corn,cotton,fallpotatoes,soybeansandwheat–accountfornearlytwo-thirdsofthevolumeofpesticideapplied.IntheUSA,totalfertilizeruseinagricultureroserapidlyfrom1950to1980,thenstartedlevelingoff.Since1980,nitrogenusehasincreasedatamoremodestratewhilephosphateandpotashusedeclinedslightly.ix
Notable findings
• Insitu conservation of pollinators:TheUSA’sNationalStrategytoPromotetheHealthofHoneyBeesandOtherPollinatorsaimstoimprovepollinatorhabitatandreducestressorsaffectingpollinators.TheConservationStewardshipProgram(CSP)provideslong-termstewardshippaymentstolandownerswhoimplementadvancedconservationsystems.Asof2015,nearly3,000CSPcontractholdershadestablishedpollinatorhabitatsinnon-croppedareasontheirlands.x
• Genetically modified crops:InpartsoftheUSAwheregeneticallymodifiedglyphosate-resistantcropcultivarshavebeenadopted,thishasledtoasimplificationoflandscapesascroprotationhasdeclined.xiOntheotherhand,theUSAreportsthattheuseofgeneticallymodifiedcrops,suchasBtmaize,hasledtoadecreaseintheapplicationofinsecticides,andthattheuseofherbicide-tolerantvarietieshasincreasedlevelsofadoptionofconservationagriculture.xii
• Increased efficiency through technologies:Usingtechnologiessuchasprecisionagricultureisrecognizedasastrongstrategyforreducingunwantednegativeeffectsfromagriculture.TheUSAcanplayapioneeringroleinextendingthepotentialofsuchtechnologiestotransitionfromshallowsustainabilitytodeeperregenerativeagriculture.
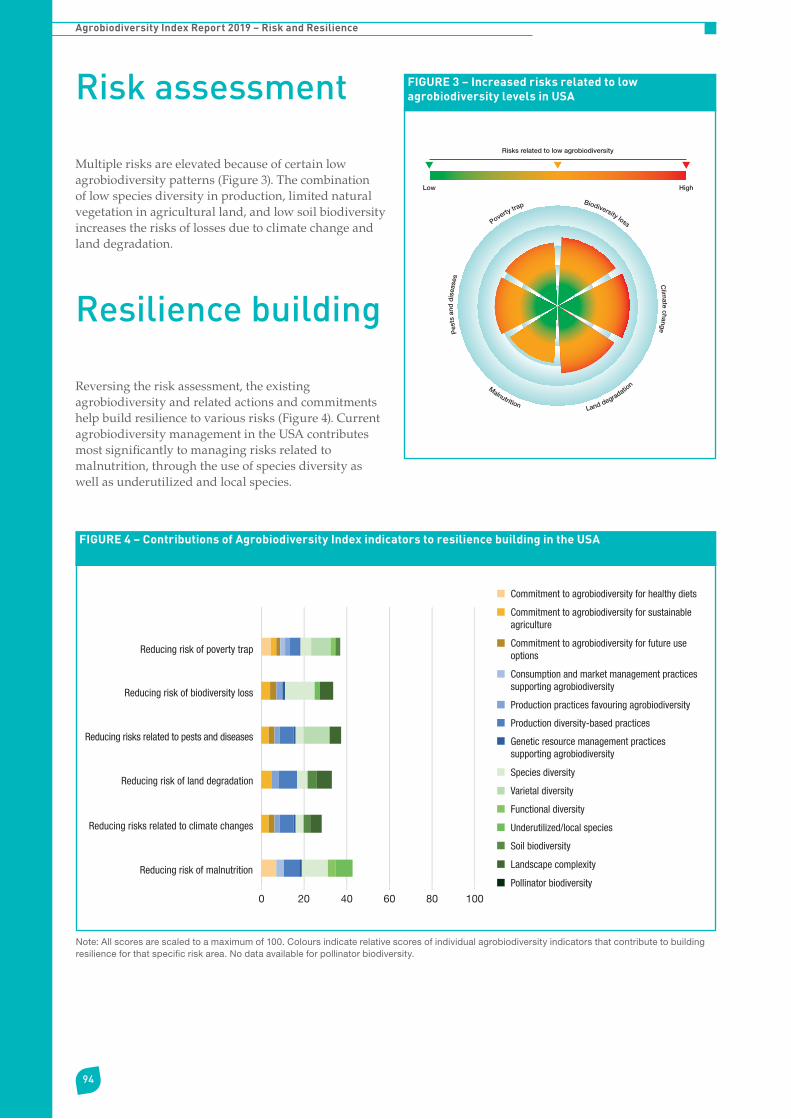
Agrobiodiversity Index Report 2019 – Risk and Resilience
94
Risk assessment
Multiplerisksareelevatedbecauseofcertainlowagrobiodiversitypatterns(Figure3).Thecombinationoflowspeciesdiversityinproduction,limitednaturalvegetationinagriculturalland,andlowsoilbiodiversityincreasestherisksoflossesduetoclimatechangeandlanddegradation.
Resilience building
Reversingtheriskassessment,theexistingagrobiodiversityandrelatedactionsandcommitmentshelpbuildresiliencetovariousrisks(Figure4).CurrentagrobiodiversitymanagementintheUSAcontributesmostsignificantlytomanagingrisksrelatedtomalnutrition,throughtheuseofspeciesdiversityaswellasunderutilizedandlocalspecies.
FIGURE 3 – Increased risks related to low agrobiodiversity levels in USA
Pes
ts a
nd d
isea
ses
P
overty trap
Biodiversity loss Clim
ate change
Malnutrition Land degradatio
n
Risks related to low agrobiodiversity
Low High
FIGURE 4 – Contributions of Agrobiodiversity Index indicators to resilience building in the USA
Reducing risk of malnutrition
Reducing risks related to climate changes
Reducing risk of land degradation
Reducing risks related to pests and diseases
Reducing risk of biodiversity loss
Reducing risk of poverty trap
0 20 40 60 80 100
Commitment to agrobiodiversity for healthy diets
Commitment to agrobiodiversity for sustainable agriculture
Commitment to agrobiodiversity for future use options
Production practices favouring agrobiodiversity
Production diversity-based practices
Genetic resource management practices supporting agrobiodiversity
Species diversity
Varietal diversity
Functional diversity
Underutilized/local species
Soil biodiversity
Landscape complexity
Pollinator biodiversity
Consumption and market management practices supporting agrobiodiversity
Note: All scores are scaled to a maximum of 100. Colours indicate relative scores of individual agrobiodiversity indicators that contribute to building resilience for that speci�c risk area. No data available for pollinator biodiversity.

USA – Country profile
95
FIGURE 5 – Spatial trends in agrobiodiversity indicators for sustainable agriculture, including agricultural land with >10% natural or semi-natural vegetation (A); number of harvested crops per pixel (B), and soil biodiversity index (C)
Soil biodiversity indexAgricultural landscapes embedding
Agriculture >= 10% natural vegetation < 10% natural vegetation
No. harvested crops per pixel
0 1-5 6-10 11-22 23-44 >= 45
A B C
Soil biodiversity indexHigh
Low
100km
High
Low
Source: Adapted from: A) European Space Agency 2017; B) Monfreda et al. 2008;xiii C) European Soil Data Center 2016.xiv
Indicator trends
Spatial trends
IntheUSA,43%ofagriculturallandcontainsaminimumof10%ofnaturalorsemi-naturalvegetation(Figure5A),suggestingthatagricultureisnotwellinterconnectedwithnaturalvegetation.Improvingthe
managementofthisrelationshipbetweenagricultureandnaturalvegetationcancontributetoagriculturalandenvironmentalsustainability.Lownumbersofcropspeciesharvestedperpixelsuggestthatsimplifiedproductionsystemsstronglydominatethecountry,withafewhighervaluesonthelowerWestCoast(Figure5B).Thesoilbiodiversityindex(Figure5C)islowacrossthecountrycomparedtoothercountries,withhighervaluesinsomeareasontheEastCoast.Thisflagsincreasedriskofsoildegradation.
FIGURE 6 – Temporal trends in species diversity in production in the USA (Shannon diversity index)
0.40
0.50
0.60
0.70
0.80
0.90
1.00
1960 1970 1980 1990 2000 2010 2020
Div
ersi
ty
Year
Species Diversity 10 countries Species Diversity Production
Source: FAO, 2019xv
Temporal trends
SpeciesdiversityinUSA’sagriculturalproductionhasbeendecliningbetween1965and2013(Figure6).Thisdeclineismainlyexplainedbythestronglyincreaseddominanceofmaize,intermsofproductionquantityandlandarea,andsecondlysoybeans.Speciesdiversityintotalimportandexporthaveincreasedoverthissameperiod.

References
iWorldBank.(2019).Agriculture,forestry,andfishing,valueadded(%ofGDP).In:The World Bank[Online].Availableat:https://data.worldbank.org/indicator/nv.agr.totl.zs
iiAfshin,Ashkan&JohnSur,Patrick&A.Fay,Kairsten&Cornaby,Leslie&Ferrara,Giannina&SSalama,Joseph&CMullany,Erin&Abate,Kalkidan&Cristiana,Abbafati&Abebe,Zegeye&Afarideh,Mohsen&Aggarwal,Anju&Agrawal,Sutapa&Akinyemiju,Tomi&Alahdab,Fares&Bacha,Umar&FBachman,Victoria&Badali,Hamid&Badawi,Alaa.(2019).Healtheffectsofdietaryrisksin195countries,1990–2017:asystematicanalysisfortheGlobalBurdenofDiseaseStudy2017.TheLancet.393.1958-1972.10.1016/S0140-6736(19)30041-8.Availableat:https://www.thelancet.com/journals/lancet/article/PIIS0140-6736(19)30041-8/fulltext
iiiGlobalNutritionReport.(2018).USACountrynutritionprofile[Online].Availableat:https://globalnutritionreport.org/nutrition-profiles/north-america/northern-america/united-states-america/#profile
ivSteinBA,KutnerLS,andAdamsJS,editors.2000.PreciousHeritage:TheStatusofBiodiversityintheUnitedStates.NewYork:OxfordUniversityPress.416p.
vVincent,H.;Amri,A.;Castañeda-Álvarez,N.P.;Dempewolf,H.;Dulloo,E.;Guarino,L.;Hole,D.;Mba,C.;Toledo,A.;Maxted,N.(2019)Modelingofcropwildrelativespeciesidentifiesareasgloballyforinsituconservation.CommunicationsBiology2,Articlenumber:136.ISSN:2399-3642
viIUCN.(2015).RedList.Threatenedspeciesineachcountry.Availableat:http://cmsdocs.s3.amazonaws.com/summarystats/2015_2_Summary_Stats_Page_Documents/2015_2_RL_Stats_Table_5.pdf
viiEuropeanSpaceAgency(2017).EuropeanSpaceAgencyLandCoverCCIProductUserguideversion2.0.TechnicalreportYear2015.Availableat:https://maps.elie.ucl.ac.be/CCI/viewer/download/ESACCI-LC-Ph2-PUGv2_2.0.pdf
viiiNowosad,J.,Stepinski,T.F.,Netzel,P.(2019).Global assessment and mapping of changes in mesoscale landscapes: 1992–2015inScienceDirect,Volume78,pp332-340.Doi:https://doi.org/10.1016/j.jag.2018.09.013
ixFAO.(2019).TheStateoftheUnitedStatesofAmerica’sBiodiversityforFoodandAgriculture.Rome.Availableat:http://www.fao.org/3/CA3509EN/ca3509en.pdf
xFAO.(2019).TheStateoftheUnitedStatesofAmerica’sBiodiversityforFoodandAgriculture.Rome.Availableat:http://www.fao.org/3/CA3509EN/ca3509en.pdf
xiSchutte,G.,Eckerstorfer,M.,Rastelli,V.,Reichenbecher,W.,Restrepo-Vassalli,S.,Ruohonen-Lehto,M.,Saucy,A.G.W.&Mertens,M.2017.Herbicideresistanceandbiodiversity:agronomicandenvironmentalaspectsofgeneticallymodifiedherbicide-resistantplants.EnvironmentalSciencesEurope,29(1):5
xiiFAO.(2019).TheStateoftheUnitedStatesofAmerica’sBiodiversityforFoodandAgriculture.Rome.Availableat:http://www.fao.org/3/CA3509EN/ca3509en.pdf
xiiiMonfreda,C.,Ramankutty,N.,Foley,J.A.(2008).Farmingtheplanet:2.Geographicdistributionofcropareas,yields,physiologicaltypes,andnetprimaryproductionintheyear2000.In:GlobalBiogeochemicalCycles,Volume22,Issue1.Doi:10.1029/2007GB002947
xivEuropeanSoilDataCenter.(2016).“GlobalSoilBiodiversityMaps”associatedwiththeGlobalSoilBiodiversityAtlas.JointResearchCentreoftheEuropeanCommission.Availableonlineat:https://esdac.jrc.ec.europa.eu/content/global-soil-biodiversity-maps-0
xvFAO. (2019). Food Balance Sheets. In: FAOSTAT [Online]. Available at: http://www.fao.org/faostat/en/#data/FBS

SEC
TIO
N 2
Thought Pieces
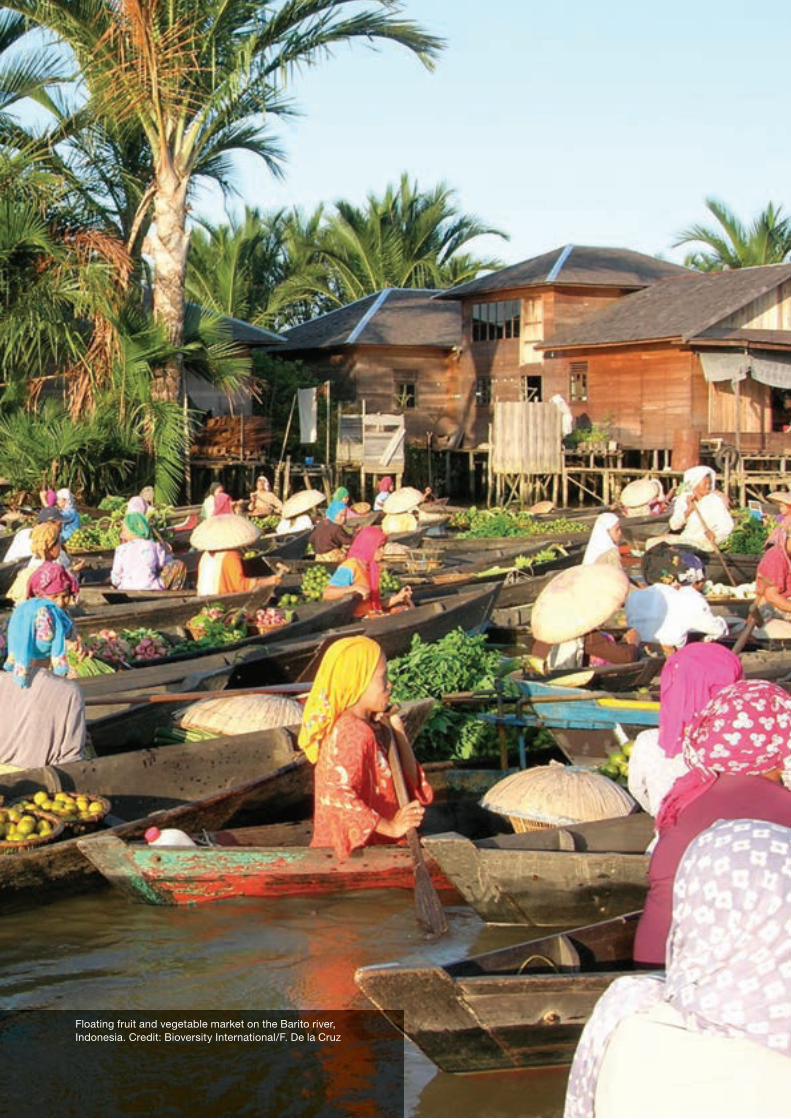
Floating fruit and vegetable market on the Barito river, Indonesia. Credit: Bioversity International/F. De la Cruz

Policies and finance to spur appropriate private-sector engagement in food systems Implications for mainstreaming agrobiodiversity
Greg S. Garrett, Laura Platenkamp, Mduduzi N.N. Mbuya
KEY MESSAGES:
> Industry players – from smallholder farmers to multinational companies – are critical actors in the food system and have a collective role to play in shaping and conserving agrobiodiversity.
> The private sector requires more incentives and meaningful deterrents to shift food systems towards the provision of more biodiverse, sustainable and healthy diets.
> There are public policies as well as private financing mechanisms, which appear to be improving appropriate private-sector production and productivity techniques and outputs. These include fiscal policies and subsidies on the one hand, and blended financing initiatives on the other.
> In addition, a handful of large initiatives led by the private sector are helping to drive change.
> Here we summarize a number of these policies, financing mechanisms and private-sector initiatives, and discuss how each approach could be applied to mainstreaming agrobiodiversity in food systems to reduce the risks of poor nutrition and improve planetary health.

100
Agrobiodiversity Index Report 2019 – Risk and Resilience
Introduction
Agrobiodiversity can increase resilience, soil health and water quality while reducing the need for costly arti�cial inputs such as fertilizers and pesticides in food production systems. Farming systems which are high in agrobiodiversity produce lower greenhouse gas emissions than those with less agrobiodiversity (1). For these reasons, agrobiodiversity can help reduce risks to planetary health. Further, improved agrobiodiversity appears to reduce dietary risks to human health with a growing body of evidence that food biodiversity improves diets and nutrition (2, 3). The 2019 EAT–Lancet Commission Report underscores this, by emphasizing the inextricable links between human health and planetary health considering environmental constraints, healthy diets and population growth trends (4).
Agrobiodiversity can contribute to human nutrition through several pathways including the provision of genetic resources for future adaptation (e.g. bioforti�cation), improving dietary diversity and quality, and enhancing income.
Industry players – from smallholder farmers through to multinational companies – are critical actors in the food system. Because they facilitate the maintenance of environmental and genetic resources and the adoption of supportive agricultural management systems and practices, they have a collective role to play in shaping and conserving agrobiodiversity.
Shifting food systems towards the provision of more biodiverse, sustainable and healthy diets will take time. More appropriate and effective private sector engagement and action are critical towards this outcome. Here we argue that the private sector requires more incentives to use agrobiodiversity, and produce and market the components of healthy diets. It also needs meaningful deterrents to reduce the production and marketing of unhealthy components.
Fortuitously, there are public policies and private �nancing which appear to be improving appropriate private-sector production and productivity techniques and outputs. These include �scal policies and subsidies on the one hand, and innovative �nancing initiatives, which are increasing the production of affordable, nutritious foods, on the other (5). In addition, a handful of large private sector-led initiatives are helping to drive change. Here we summarize a number of these policies, �nancing mechanisms and private-sector initiatives, and discuss how each approach might be applicable to mainstreaming agrobiodiversity in food systems to reduce the risks of poor nutrition and improve planetary health.
Diet-related public policies
Fiscal policies and subsidies
Fiscal policies in food systems can be traced back at least a century to when Finland started taxing sugary foods in 1926 (6). Since 2011, when the UN General Assembly recommended ‘�scal measures’ as one approach to improve diets, momentum has been growing to use these instruments in national health and nutrition plans (7).
Taxation and subsidies can increase the purchase of healthier foods and decrease the purchase of products high in salt, fat or sugar. A 2016 systematic review on the effectiveness of these policies indicated that taxing sugar-sweetened beverages generally increased the price, leading to a subsequent decrease in demand (8). Further, the review found that taxation and subsidies can lead to an increase of purchase of healthier foods and a decrease of purchase of products high in salt, fat or sugar (7).
Today, 39 countries report using �scal policies to improve dietary intake, with more than half of these increasing taxes on unhealthy foods and beverages (Figure 1). Further, these policies generally result in a reduction in net energy. Twenty-three percent of the reporting countries use �scal policies to improve dietary intake by subsidizing common items like breads, cereals, pasta, rice, cereals, yoghurt, cheeses, milk, oils, fresh meat, and fruits and vegetables (7).
FIGURE 1 – Type of fiscal policies influencing foods and beverages (F&B) among 39 countries reporting (7)
100%
Increase tax on unhealthy F&B
54%
80%
60%
40%
20%
0%
15%23%
10%
Reduce tax on healthy F&B
Increase subsidies on healthy F&B
Reduce subsidies on unhealthy F&B

101
Thought Pieces
How could fiscal policies and subsidies be used to support the uptake of biodiverse foods for healthy diverse diets?
It appears that well-designed food-related �scal policies and subsidies can improve diets and help prevent non-communicable diseases. They offer potential to stimulate the production and consumption of more agrobiodiverse food by supporting biodiversity-friendly production methods such as agroforestry systems, permaculture and organic agriculture.
Reducing tax and increasing subsidies on nutrient-dense species and varieties, for instance on fruit and vegetables, and high-nutrient local cereals (e.g. millets, sorghum, quinoa) could be an effective way to nudge consumer behaviour towards healthier diet choices.
It is worth examining potential �scal policies that are bene�cial to public health as well as to agrobiodiversity. In theory, a well-designed, coherent sugar-related tax, for example, could disincentivize the amount and type of sugar produced, leading to lower cultivation of sugar crops which in turn opens space for increased production of other species, reversing the loss of agrobiodiversity associated with sugarcane monocropping (9). Similarly, well-designed edible oil taxes could help mitigate monocropping of palm oil. Palm oil is linked to an increase in cardiovascular disease whilst at the same time the production of palm oil, which has increased greatly over the last decades, has contributed to 8% of global deforestation, mainly in Indonesia and Malaysia (8). Last, the revenues generated from these food taxes could be reinvested to encourage more biodiverse food systems. Examples of this reinvestment of tax revenue include the Healthy
Diné Nation Act by Navajo Nation, which uses revenues generated by taxing unhealthy food products towards projects in farming, greenhouses, vegetable gardens and farmers’ markets, and French Polynesia where revenue was earmarked for health (10).
Micronutrient-specific policies
Bioforti�cation and large-scale industrial food forti�cation have become important interventions to improve nutrition through public–private collaboration in many low- and middle-income countries (LMIC). Public–private partnerships are critical to ensure each intervention reaches its desired public health impact by taking advantage of the government’s respective strengths in regulations and public oversight on the one hand, and deep market penetration and innovations in processing, marketing and communication of the private sector on the other.
Large-scale food forti�cation is one of the best examples in the food and nutrition sector of a scaled and impactful systemic partnership between business and government (11). Food forti�cation policies typically require an entire nation’s staple food processing industry to add speci�c levels of micronutrients. Today, 88 countries mandate the forti�cation of at least one kind of cereal grain (Figure 2) (12). Tens of thousands of small, medium and large food-processing companies add nutrients to foods resulting in signi�cant health impacts and ongoing prevention of hidden hunger (13).
Bioforti�cation (breeding crops to increase their nutrient content) complements both dietary diversity and industrial food forti�cation. It is now supported by
FIGURE 2 – Legislation for the fortification of grains (wheat, maize or rice) (12)
No
Mandatory
Voluntary

102
Agrobiodiversity Index Report 2019 – Risk and Resilience
approximately 30 governments and delivers vitamins and minerals to more than 20 million people in farm households who have limited access to micronutrients (14). Most of these governments have formally integrated bioforti�cation in their nutrition and agriculture policies (14).
How can public policies which improve micronutrient intake be used to improve agrobiodiversity?
Micronutrient de�ciency mitigation policies which encourage bioforti�cation and large-scale food forti�cation of staple crops should start to look at complementing these with policies that encourage increased production and consumption of naturally occurring nutrient-dense local and traditional species and varieties.
Governments can build on these policies to promote local and traditional species and varieties that are known to have naturally occurring high levels of desired micronutrients. These policies can encourage smallholder farmers to grow existing but less-known crop species and varieties that are high in micronutrients. One advantage of this approach would be an increase in the use of traditional crops which are culturally relevant and adapted to local ecologies.
In addition, policymakers could focus on agricultural biodiversity policies that reinforce dietary diversity and better situate bioforti�cation within the larger context of sustainable food-based approaches. Last, policies targeting the food-processing industry to add micronutrients to staple crops at the processing stage can ensure micronutrient awareness campaigns for the general population are well designed and effectively targeted. An explicit focus should be to improve consumers’ knowledge, acceptance and uptake of both traditional and modern sources of micronutrients in the diet with a recognition of diet diversi�cation as the aspirational ideal.
Private financing for more sustainable, nutritious food systems
There are signi�cant opportunities for investing responsibly in the agri-food industry, and this �nancing is key in driving change towards a more sustainable, food-secure future (15). According to the Business and Sustainable Development Commission, business opportunities related to achieving the food-related Sustainable Development Goals could be worth more than US$2 trillion a year by 2030 (16). Low- and middle-income countries represent more than two-thirds of this opportunity (16). This includes up to US$255 billion in meeting the increasing food requirements of people emerging out of extreme poverty, up to US$405 billion in reducing food waste in value chains, and up to US$200 billion in the reformulation of products in order to increase nutritional value.
Take the African continent as a case study of this opportunity. Currently there are over 1 billion people in the African consumer market, and expectations are that this is going to increase to over 2 billion by 2050 (17). The African consumer market comprises over 220 million people between 15 and 25 (18). These individuals are likely to grow up to be more conscious of their health, and therefore of the quality of their food.
Small and medium enterprises (SMEs) create around 80% of Africa’s employment (19). Financing the agri-food industry, especially SMEs, represents a strong opportunity to improve sustainable, nutritious diets if done in a smart and responsible way. However, there are barriers. A study commissioned by the Global Alliance for Improved Nutrition (GAIN) and completed by Dalberg in late 2017, found that for over 300 African SMEs, access to �nance came up as the top barrier to the growth and delivery of nutritious foods (20). In May 2018, GAIN commissioned iGravity Impact Investment to assess the �nancial needs of enterprises working in food value chains in Kenya and Tanzania. Their estimates showed that the total �nancing needs for investments to improve the delivery of nutritious foods from national companies in these two countries alone could be around US$5.7 billion (20). One of the issues holding back this �nancing is that local banks

103
Thought Pieces
often do not have the risk appetite to lend into the agri-food SME sector about which they have little knowledge and which is relatively young and dynamic. Blended �nance and impact investing are relatively recent innovations that can help overcome these barriers.
Blended finance and impact investing
Blended �nance, or the use of public or philanthropic capital to spur private-sector investment in projects aimed at achieving the Sustainable Development Goals, offers a signi�cant opportunity to make diets more sustainable, diverse and nutritious. Blended �nance can help de-risk and unlock the unmet investment needs among agri-food SMEs. Blending less risk-averse �nancing from the public sector as grants, soft loans, mezzanine �nance and guarantees can encourage more nutrition-sensitive private investment to �ow into private-sector food businesses (Box 1).
BOX 1 – Case study. Marketplace for Nutritious Foods
The Marketplace for Nutritious Foods is a platform that focuses on providing highly concessional funds and technical assistance to qualifying small and medium enterprises (SMEs). In turn, this helps stimulate innovation, spurs growth, and helps businesses produce safe and nutritious foods for low-income consumers.
The Global Alliance for Improved Nutrition (GAIN), with support from USAID and the Feed the Future Initiative, designed the programme in 2013. With a mix of public- and private-sector technical and financial assistance, SMEs in, for example, horticulture and aquaculture make their products more available, affordable, desirable and profitable. The platform to date has worked with around 500 such firms to get more servings of nutritious foods (such as beans, fish, peanuts and chicken) into markets in five countries in Africa and Asia, and to make those servings cheaper. Independent evaluations show some achievements. For example, one firm in Kenya has helped to make tilapia fish affordable for 68% of the population (up from 49%) in the region where it is operating (21). Over a period of four years, the grantees of the Marketplace for Nutritious Foods have produced over 34 million servings of low-cost, nutritious foods.
Moving forward there is opportunity for this platform to incentivize the production of traditional crops, tree products, livestock and fish to enhance food biodiversity.
In 2017, there were at least 300 closed blended-�nance transactions with an aggregate deal size of over US$100 billion, doubling in size since 2012 (22). To date, relatively small amounts of blended �nance have been dedicated to the agri-food sector, a little less than 5% (23). However, these investments are increasing year by year (23).
Similarly, impact investing – private investments made with the intention to generate a measurable, bene�cial social or environmental impact alongside a �nancial return – grew to 8,000 deals in 2018 representing US$114 billion in total assets (24). Impact investing in the agri-food sector is set to signi�cantly increase in 2019, although to date it has only represented 6% of total impact investments (24).
How can blended finance and impact investing be used to mainstream agrobiodiversity into sustainable and nutritious food systems?
The growing blended �nance and impact investment space may represent a signi�cant opportunity to leverage public and private �nancing and incentivize agri-food businesses to produce more agricultural biodiversity.
A survey by the Global Impact Investing Network in 2018 found that approximately half of impact investors anticipate growing allocations to food and agriculture in 2019. Blended-�nance transactions in food and agriculture are also increasing rapidly. Because energy and climate already represent one of the largest sectors that attract innovative �nancing deals (e.g. 24% of all blended-�nance transactions are in renewable energy), there is a case which needs to be made to impact investors and blended-�nance practitioners that multifunctional agro-ecological farming systems – particularly those which provide the variability needed to cope with changing climates and extreme weather events – represent a win-win scenario for improving planetary and human health. This can be done by developing a compelling investment thesis and impact metrics that help blended-�nance practitioners and impact investors understand the intended social and �nancial impacts of their investments in agrobiodiversity.

104
Agrobiodiversity Index Report 2019 – Risk and Resilience
Private sector-led initiatives and policies
Today, approximately 100 companies control 25% of the trade of the most signi�cant food commodities on the planet, which in turn in�uence 40%–50% of all food production (25). Some are moving towards more agrobiodiversity in their strategies. One of the largest agricultural commodity traders globally, Cargill, consulted stakeholders in 2017 to formulate its new social and sustainability strategy. Cargill’s 2018 Annual Report reported that it in�uenced agricultural practices to be more sustainable and highlighted ways it invested in biodiversity (26). There are also various partnerships among these large, in�uential companies which are dedicated to improving sustainable and nutritious food systems. For example, the Sustainable Food Policy Alliance is a collaboration among four of the world’s largest food manufacturers launched to �nd solutions for sustainable agricultural systems that innovatively addresses climate change while better informing consumers about their food choices (27).
What is the role of agrobiodiversity in private sector-led initiatives and policies?
Signi�cant gains can be made by the private sector taking initiatives to improve food systems. This not only represents good governance but should contribute to long-term commercial outputs. Biodiversity should increasingly be recognized as a critical business issue.
There does appear to be a positive shift occurring among the private sector away from pure pro�t-driven motives. An extensive global survey conducted amongst CEOs revealed that 87% believe that the UN Sustainable Development Goals provide an opportunity to rethink approaches for sustainable value (28). Biodiversity and ecosystem considerations must be an element of organizations’ sustainability strategies.
The Agrobiodiversity Index, developed by Bioversity International with partners, could help provide guidance to large corporations. It can also drive forward accountability of private-sector commitments to agrobiodiversity and help to recognize companies that are already playing a part to improve their policies and actions related to agrobiodiversity. The Index is already being used to help some large food and agriculture companies make strategic supply chain decisions which can improve agrobiodiversity (1).
Conclusion
This paper has highlighted a handful of effective public policies, innovative �nancing mechanisms and private sector-led initiatives that are helping to facilitate more appropriate private-sector engagement in food systems. It has explored ways that �scal policies and subsidies could be used to support the uptake of biodiverse foods for a healthy diverse diet. It has looked at existing public policies that improve micronutrient intake and how these could be better designed to improve agrobiodiversity. The paper has also explored how momentum in the blended-�nance and impact-investing �elds could help drive new investments in agrobiodiversity. Last, the paper looked at what the role of agrobiodiversity could be in private sector-led initiatives and policies. With further research and targeted efforts, there is considerable scope to expand and adapt policies, �nancing and private sector-led initiatives to improve agrobiodiversity, which in turn can contribute to better nutrition, planetary health and more productive food systems.

105
Thought Pieces
References
1. China R (2018) Mainstreaming Biodiversity into Sustainable Food Systems – We Need to Measure It. IISD SDG Knowledge Hub. http://sdg.iisd.org/commentary/guest-articles/mainstreaming-biodiversity-into-sustainable-food-systems-we-need-to-measure-it/ [Accessed January 14, 2019].
2. Powell B, et al. (2015) Improving diets with wild and cultivated biodiversity from across the landscape. Food Security 7(3):535–554.
3. Berti PR (2015) Relationship between production diversity and dietary diversity depends on how number of foods is counted. Proceedings of the National Academy of Sciences 112(42):E5656 https://doi.org/10.1073/pnas.1517006112.
4. Willett W, et al. (2019) Food in the Anthropocene: the EAT–Lancet Commission on healthy diets from sustainable food systems. The Lancet 393(10170):447–492.
5. Popkin BM, Reardon T (2018) Obesity and the food system transformation in Latin America. Obesity Reviews. doi:10.1111/obr.12694.
6. Thiele S, Roosen J (2018) Obesity, fat taxes and their effects on consumers. Regulating and Managing Food Safety in the EU: A Legal Perspective, eds Bremmers H, Purnhagen K (Springer International Publishing), pp 177–178.
7. WHO (World Health Organization) (2018) Global Nutrition Policy Review 2016-2017 Available at: https://www.who.int/nutrition/topics/global-nutrition-policy-review-2016.pdf.
8. Niebylski ML, Redburn KA, Duhaney T, Campbell NR (2015) Healthy food subsidies and unhealthy food taxation: A systematic review of the evidence. Nutrition. doi:10.1016/j.nut.2014.12.010.
9. Bailey R, Harper DR (2015) Reviewing Interventions for healthy and sustainable diets Research Paper https://www.chathamhouse.org/sites/default/�les/�eld0529HealthySustainableDietsBaileyHarperFinal.pdf [Accessed January 14, 2019].
10. World Cancer Research Fund International (2018) NOURISHING framework – Use economic tools to address food affordability and purchase incentives. doi:10.1016/j.ypmed.2017.07.013.
11. Gradl C (2012) Building a strategic alliance for the forti�cation of oil and other staple foods (SAFO) (World Cancer Research Fund, Cambridge, MA, USA) https://www.wcrf.org/sites/default/�les/building-momentum.pdf.
12. Global Forti�cation Data Exchange | GFDx – Providing actionable food forti�cation data all in one place. https://forti�cationdata.org/ [Accessed January 15, 2019].
13. Osendarp SJM, et al. (2018) Large-scale food forti�cation and bioforti�cation in low- and middle-income countries: a review of programs, trends, challenges, and evidence gaps. Food and Nutrition Bulletin 39(2):315–331.
14. Bouis HE, Saltzman A (2017) Improving nutrition through bioforti�cation: A review of evidence from HarvestPlus, 2003 through 2016. Global Food Security 12:49–58.
15. IFPRI (International Food Policy Research Institute) (2016) 2016 Global Nutrition Report - From Promise to Impact: Ending Malnutrition by 2030 (IFPRI, Washington, DC).
16. Alpha Beta (2016) Valuing the SDG prize in food and agriculture: Unlocking business opportunities to accelerate sustainable and inclusive growth http://s3.amazonaws.com/aws-bsdc/Valuing-SDG-Food-Ag-Prize-Paper.pdf [Accessed January 15, 2019].
17. Hatch G, Becker P, van Zyl M (2011) The dynamic African consumer market: Exploring growth opportunities in sub-Saharan Africa (Accenture).
18. UN Departnment of Economic and Social Affairs Population Division (2015) Population Facts http://www.un.org/en/development/desa/population/publications/pdf/popfacts/PopFacts_2015-1.pdf [Accessed January 15, 2019].
19. de Sousa dos Santos JF (2015) Why SMEs are key to growth in Africa | World Economic Forum. https://www.weforum.org/agenda/2015/08/why-smes-are-key-to-growth-in-africa/ [Accessed January 15, 2019].
20. GAIN (Global Alliance for Improved Nutrition) (2018) Investing in SMEs to improve the consumption of nutritious foods in Africa - Development Finance. https://www.dev�nance.net/industry/investing-smes-improve-consumption-nutritious-foods-africa/ [Accessed January 15, 2019].
21. Haddad L (2018) Reward food companies for improving nutrition. Nature 556(7699):19–22.
22. Convergence (2018) The State of Blended Finance https://downloads.ctfassets.ic86/154577e7f96ed6511ef1048bc79ee978/State_of_Blended_Finance_2018_FINAL.pdf [Accessed January 15, 2019]_Blended_Finance_Insights_Investments_Vehicles_Facilities_report_2016.pdf [Accessed January 15, 2019]
23. World Economic Forum and OECD (2016) Insights from Blended Finance Investment Vehicles and Facilities http://www3.weforum.org/docs/WEF_Blended_Finance_Insights_Investments_Vehicles_Facilities_report_2016.pdf [Accessed January 15, 2019].
24. Mudaliar A, Bass R, Associate S, Dithrich H (2018) Annual Impact Investor Survey 2018 https://thegiin.org/assets/2018_GIIN_Annual_Impact_Investor_Survey_web�le.pdf [Accessed January 15, 2019].
25. WWF Transforming Business | Initiatives | WWF https://www.worldwildlife.org/initiatives/transforming-business [Accessed January 15, 2019].
26. Cargill (2018) 2018 Annual Report https://www.cargill.com/doc/1432124831909/2018-annual-report.pdf [Accessed January 15, 2019].
27. Sustainable Brands https://sustainablebrands.com/ [Accessed January 15, 2019].
28. World Cancer Research Fund International (2018) Building momentum:Lessons on implementing a robust sugar sweetened tax www.wcrf.org/buildingmomentum [Accessed January 14, 2019].

Diversity of beans and legumes. Legumes are nutrient dense and can also be used in integrated farming systems to increase nitrogen in the soil. Credit: Bioversity International/C. Zanzanaini

KEY MESSAGES:
> Crop diversity increases resilience of farm production to climate changes and damage from pests and diseases.
> Science has associated biodiversity with human physical and mental health linked to the composition and diversity of the microbiota in our intestines.
> Dietary diversity is of paramount importance for having a healthy microbiota.
> A diverse diet needs diversity in production systems. So we need to rethink plant breeding from ‘cultivating uniformity’ to ‘cultivating diversity’.
> One way to cultivate diversity quickly and inexpensively is by using a method called evolutionary plant breeding.
Nurturing diversity in our guts and on our farms to reduce health risks and increase food system resilienceSalvatore Ceccarelli
108
Agrobiodiversity Index Report 2019 – Risk and Resilience
Introduction: seed at the heart of global challenges
Climate change, poverty, hunger and malnutrition, water, biodiversity in general and agrobiodiversity in particular are issues that have featured strongly in a number of recent reports and reviews (1–4). These issues are often covered separately even though they are closely interconnected with each other. One major interconnection is seed.
Seed is related to climate change because we need crops better suited to the climate as it changes. Seed is associated with food as most of our food comes directly or indirectly from plants. Through food and child nutrition, seed is linked to poverty (5). Seed is related to water, because about 70% of fresh water is used in agriculture (6), so varieties producing a yield with less water will make more water available for human uses. Seed is associated with malnutrition: the three crops from which we derive about 60% of our plant-based calories and 56% of our plant-based proteins – namely maize, wheat and rice (7, 8) – are far less nutritious than barley (9) or millets and sorghum (10, 11). Millets and sorghum are not only more nutritious, they also need less water than maize, rice and wheat, which use nearly 50% of all the water used for irrigation.
Finally, seed is related to biodiversity in general and to agrobiodiversity in particular. Agrobiodiversity is important for food security (12), for increasing farm income and generating employment, and for reducing exposure to risk (13, 14).
Maintaining or increasing agrobiodiversity reverses the tendency of modern plant breeding towards uniformity (15). The main cause for the dramatic reduction of genetic diversity is breeders selecting predominantly for varieties to be usable under the widest possible conditions. This decline in diversity has increased the vulnerability of crops (16–19) because their genetic uniformity makes them unable to respond to climate changes, especially short-term changes. In addition, uniform crops provide an ideal breeding ground for the rapid emergence of fungicide-resistant variants (19) as shown by the potato late blight epidemic and ensuing famine in 19th century Ireland (20). Crop diversity, by contrast, has been shown to be highly bene�cial in restricting the development of diseases (21–24). For example in China, the use of variety mixtures of rice led to a reduction of rice blast of 94% and increase in yields of 89% compared to monocultures. Farmers were able to cease use of fungicidal treatment of crops within two years. One of the most notable examples of the advantages of mixtures was the expansion of
barley mixtures in the former German Democratic Republic during the years 1984–1991. Expanding the barley mixtures to 360,000ha led to a reduction of the percentage of �elds affected by severe mildew epidemics from 50% to 10% and a threefold reduction of the percentage of �elds sprayed with fungicides (25).
The biodiversity inside us
Science has associated the decrease of biodiversity with the increase of certain diseases in humans, ranging from in�ammatory bowel disease, to ulcerative colitis, cardiovascular disorders, various liver diseases and many types of cancer (26). In turn, the increase in the frequency of in�ammatory diseases has been associated with a decreased ef�ciency of our immune defences (26). Recently, the association has been con�rmed between the microbiota – namely the complex of bacteria, viruses, fungi, yeasts and protozoa that is in our intestinei – and our immune system and with the likelihood of contracting in�ammatory diseases (27).
The average human microbiota weighs around 2kg (about 0.5kg more than the average human brain) and plays a number of important functions, from the synthesis of vitamins and essential amino acids, to the breakdown of what has not been digested in the upper intestinal tract. Some of the products of these activities represent an important energy source for intestinal wall cells and contribute to intestinal immunity.
Some of the most recent research (28) has shown that in melanoma patients who were capable of responding to immune therapy, the microbiotas had a different composition and were more diverse than those of patients who did not respond well. The research concluded that both the composition and the diversity of the microbiota are important in determining anti-tumour immunity. The response of laboratory mice that received a faecal transplant from human patients who had responded to the therapy supported the results. Faecal transplantation involves transferring the microbiota from a healthy patient to a patient with a disease and is becoming a widespread practice for the treatment of diseases that do not respond to antibiotics (28).
The microbiota also appears to be involved in several neuropsychiatric disorders such as depression, schizophrenia, autism, anxiety and stress response (29). This is likely due to the damage that in�ammatory processes cause to myelin, the sheath surrounding the neurons, thus altering the normal transmission of nerve impulses.

109
Thought Pieces
Diet, human health and environmental health
Diet strongly in�uences the microbiota: a change in diet alters its composition in just 24 hours. It takes 48 hours, after changing the diet back again, before the microbiota returns to its initial conditions (30).
Given the important roles of the microbiota on the one hand, and the fact it is so strongly and rapidly in�uenced by diet on the other, it is understandable that there have been many studies on the effect of various diets (Western, omnivorous, Mediterranean, vegetarian, vegan, etc.) (30). Recent results demonstrate that the composition and diversity of gut microbiota are not signi�cantly associated with genetic ancestry, but shaped predominantly by environmental factors (diet and lifestyle) (31). Diet diversity is of paramount importance for having a healthy microbiota (32).
The diet also links environmental and human health. Rising incomes and urbanization are among factors driving a global dietary transition in which traditional diets are replaced by diets higher in re�ned sugars, re�ned fats, oils and meats (33). By 2050 these dietary trends, if unchecked, will be a major contributor to global land clearing and to an estimated 80% increase in global agricultural greenhouse gas emissions from food production (33). Moreover, these dietary shifts are greatly increasing the incidence of type 2 diabetes, coronary heart disease and other chronic non-communicable diseases that lower global life expectancies (33). Diet is now the number-one risk factor for the global burden of disease (34).
A study conducted in Zambia showed that household dietary diversity is positively associated with production diversity, and in turn, production diversity is positively associated with indicators of nutritional status of children aged two to four (35). This effect has been con�rmed by some studies (36) but not by others (37) partly because of dif�culties associating indicators of agricultural diversity with indicators of nutritional status (38).
Diversity and uniformity
So, human health needs a diverse microbiota, a diverse microbiota needs a diverse diet, and a diverse diet needs diversity in production systems. However, global trends and policies do not work in favour of diversity. How can we have a healthily diversi�ed diet if, as mentioned earlier, 60% of our calories come from just three crops, namely wheat, rice and maize (7)? And how do we diversify our food if almost all the food we eat is produced from crop varieties that, to be legally marketed, must be registered as uniform (Box 1)? How can we have a diversi�ed diet if the agriculture that produces our food is based on uniformity?
BOX 1 – Registry of plant varieties
In most countries today, plant varieties need to be registered before they can be released in markets.
Registry of plant varieties was introduced in Europe in the mid-19th century to protect consumers by guaranteeing that purchased seed would be:
• Distinct from other varieties
• Uniform in its essential characteristics
• Stable so that it would not change when multiplied.
The characteristics that are promoted in this system are the opposite of those needed in a sustainable food system. Adaptability not stability is needed in order to adapt to new and changing climate conditions. Variability not uniformity supports yield stability when conditions are unfavourable and changeable.
Between the need to diversify our diet and the uniformity imposed by law on seed and thus on crops there is an obvious contradiction. In addition, there is a further contradiction between uniformity and stability on the one hand and the need to adapt crops to climate change on the other.

110
Agrobiodiversity Index Report 2019 – Risk and Resilience
Cultivating diversity
Most food derives from seeds. Therefore, a primary solution to the health problems af�icting the world today can be sought in the way that seeds are produced. Since seeds are produced by plant breeding, to change things we have to rethink how plant breeding is conducted in order to move from ‘cultivating uniformity’ to ‘cultivating diversity’.
Today, much institutional plant breeding (both private and public sector) has industrial agriculture as its objective. Institutional plant breeding aims to 'cultivate uniformity', complying with the seed laws mentioned earlier, and producing uniform varieties bred to maximize crop yields with the support of fertilizers and pesticides. Once considered the only option to feed the world, the effectiveness of this model of agriculture is being questioned by recent research as being neither resilient nor sustainable (39). The human cost of the current food system is that almost 1 billion people are hungry and almost 2 billion people are eating too much of the wrong food (39, 40) which is arti�cially cheap (41). Evidence suggests that more than 80% of the world’s food in value terms is produced on family farms (42).
One way of ‘cultivating diversity’ quickly and inexpensively is by using a method called evolutionary plant breeding (43, 44) (Box 2). Evolutionary plant breeding consists of cultivating mixtures or populations (Figure 1).
The starting point of evolutionary plant breeding could be a mixture of seeds, obtained by mixing an equal quantity of seed of a number of varieties of the crop in question (Figure 1, left). Alternatively, it could be an evolutionary population made by crossing a number of varieties (Figure 1, right). The ideal evolutionary population would be made up of all possible combinations of varieties. In either case, the choice of how many or which varieties depends on the farmer’s objectives. For example, if disease resistance is one of the problems affecting productivity in the target environments, one or more parents of the evolutionary population or one or more varieties in the mixture should carry the desirable genes of disease resistance. The increasing availability of genetic markers associated with desirable genes is making the handling of evolutionary populations ever easier.
Once a mixture or a population is planted, it is left to evolve as a crop. In other words, it is planted and harvested, using part of the harvest as seed for the next season, or to select the best plants, or both. Thanks to the natural crossings that occur between plants, what was originally a mixture also becomes a population. The only difference is that in this case, we have no control over the crossing and therefore we do not know how the different parents contributed to the population.
Through the joint effects of natural selection and natural crossing, the seed which is harvested is genetically different from the seed that was planted. In other words, the populations (including those derived from an original mixture) evolve continuously. This is why they are called ‘evolutionary’. The farmers therefore have the opportunity to adapt the crops to their soil, their climate and to the particular way in which each of them practises agriculture, including organic farming.
FIGURE 1 – The difference between mixtures and populations: a mixture is obtained by mixing seed of different varieties while a population is obtained by crossing different varieties
Mixture Population

111
Thought Pieces
BOX 2 – Evolutionary plant breeding: a history
The science of evolutionary plant breeding goes back to 1929. Harlan and Martini proposed the composite cross method of plant breeding and synthesized a barley composite cross (known as CC II) by pooling an equal number of F
2
seedsii obtained by 378 crosses between 28 superior barley cultivars representing all the major barley growing areas of the world (45). Composite crosses and mixtures have shown that they are able to evolve towards a higher yield, higher yield stability over time, and a higher level of disease resistance during subsequent generations (43, 46–51).
Evolutionary populations adapt to different geographical areas by ripening earlier in warm locations and later in cold locations (52). They tend to perform better than uniform varieties in years affected by drought (53) and they can combine higher yield and higher yield stability (54–56). A meta-analysis of 91 studies and more than 3,600 observations concluded that cultivar mixtures are a viable strategy to increase yield, yield stability and disease resistance (57).
In a project which introduced evolutionary populations in Iraniii customers reported that the bread made from an evolutionary population of bread wheat was bene�cial to health (58). Experiences in Italy found that an evolutionary population of over 2,000 different types of bread wheat from all over the world brings forth a bread that, besides having an extraordinary smell and taste, is tolerated by people suffering from gluten intolerance. This population has been dubbed the ‘Aleppo mixture’ in recognition of its provenance from Syria. In Iran, shepherds who have used an evolutionary barley population to feed sheep have noted an improvement in milk quality. Recently, pasta produced from a population of durum wheat by three different producers in Italy was unanimously considered by different informal panels of consumers of superior taste to what is considered the best quality pasta.
The rapid adoption of these evolutionary populations, and the reports on the bene�ts of their products, which are receiving constant con�rmation, indicate that the cultivation of evolutionary populations, represents a dynamic way of cultivating crops.
Conclusions
Seed connects climate change, poverty, malnutrition, water and biodiversity – both wild and agricultural. Even the diversity in our guts, fundamental to good physical and mental health, relies on diversity in diets, which in turn relies on diversity in agriculture. This means cultivating diversity rather than cultivating uniformity, the opposite to current industrial agricultural models.
Evolutionary breeding is one way to confer resilience and adaptability through cultivating diversity. The evolutionary populations adapt to local conditions, resist disease and have sensory qualities that consumers appreciate. Very few inputs are needed, which contributes to increasing farmers’ independence from an industrialized and �nancialized agricultural model. Evolutionary breeding increases genetic diversity within crops. For healthy environments, healthy diets and healthy microbiota, diversity is needed across the landscape, with a variety of species, functional types, and land uses fostering resilience and health. Increased diversity in the �eld will support food and diet diversity, which through gut diversity and composition are key to human health and nutrition.

112
Agrobiodiversity Index Report 2019 – Risk and Resilience
Notes
i Sometimes called the microbiome, which actually refers to the genes of the microbiota.
ii In plant breeding every cross is assigned an F (�lial) number: F1 is the �rst generation cross (i.e. between the �rst two original parents). An F2 is the second generation after a cross.
iii This project (‘Using Agricultural Biodiversity and Farmers’ Knowledge to Adapt Crops to Climate Change in Iran’ Grant # 1214 October 2010–September 2014) was supported by the International Fund for Agricultural Development (IFAD).
References
1. IPES-Food (International Panel of Experts on Sustainable Food Systems) (2016) From Uniformity to Diversity: A Paradigm Shift from Industrial Agriculture to Diversi�ed Agroecological Systems (IPES-Food).
2. Development Initiatives (2017) Global Nutrition Report 2017: Nourishing the SDGs. (Development Initiatives, Bristol, UK).
3. CBD (Convention on Biological Diversity), WHO (World Health Organization) (2015) Connecting Global Priorities: Biodiversity and Human Health. A State of Knowledge Review (Geneva).
4. FAO, IFAD, UNICEF, WFP, WHO (2018) The State of Food Security and Nutrition in the World in 2018. Building climate resilience for food security and nutrition.
5. Save the Children (2012) State of the World’s Mothers 2012 (Save the Children)
6. FAO (Food and Agriculture Organization) (2014) Water Withdrawal. http://www.fao.org/nr/water/aquastat/infographics/Withdrawal_eng.pdf [Accessed February 26, 2019].
7. Thrupp L (2000) Linking agricultural biodiversity and food security: the valuable role of agrobiodiversity for sustainable agriculture. International Affairs 76:265–281.
8. FAO (Food and Agriculture Organization) (2013) Il patrimonio genetico mondiale decisivo per la sopravvivenza dell’umanità. http://www.fao.org/news/story/it/item/174345/icode/.
9. Grando S, Gormez Macpherson H eds. (2005) Food Barley: Importance, Uses and Local Knowledge. Proceedings of the International Workshop on Food Barley Improvement, 14-17 January 2002, Hammamet, Tunisia. (ICARDA (International Center for Agricultural Research in the Dry Areas), Aleppo, Syria).
10. Dwivedi S, et al. (2011) Millets: Genetic and genomic resources. Plant Breeding Reviews:247–375.
11. Boncompagni E, et al. (2018) Antinutritional factors in pearl millet grains: Phytate and goitrogens content variability and molecular characterization of genes involved in their pathways. PLoS ONE 13(6):e0198394.
12. Zimmerer K, de Haan S (2017) Agrobiodiversity and a sustainable food future. Nature Plants 3. doi:10.1038/nplants.2017.47.
13. Di Falco S, Chavas J-P (2009) On crop biodiversity, risk exposure, and food security in the highlands of Ethiopia. American Journal of Agricultural Economics 91(3):599–611.
14. Pellegrini L, Tasciotti L (2014) Crop diversi�cation, dietary diversity and agricultural income: Empirical evidence from eight developing countries. Canadian Journal of Development Studies 35(2):211–227.
15. Frison EA, Cherfas J, Hodgkin T (2011) Agricultural biodiversity is essential for a sustainable improvement in food and nutrition security. Sustainability 3(12):238–253.
16. Esquinas-Alcázar J (2005) Protecting crop genetic diversity for food security: political, ethical and technical challenges. Nature Reviews Genetics 6:946–953.
17. Hajjar R, Hodgkin T (2007) The use of wild relatives in crop improvement: A survey of developments over the last 20 years. Euphytica 156:1–13.
18. Keneni G, Bekele E, Imtiaz M, Dagne K (2012) Genetic vulnerability of modern crop cultivars: causes, mechanism and remedies. International Journal of Plant Research 2(3):69–79.
19. Fisher M, Hawkins N, Sanglard D, Gurr S (2018) Worldwide emergence of resistance to antifungal drugs challenges human health and food security. Science 360(6390):739–742.
20. Machida-Hirano R (2015) Diversity of potato genetic resources. Breeding Science 65(1):26–40.
21. Zhu Y, et al. (2000) Genetic diversity and disease control in rice. Nature 406:718.
22. Döring TF, Knapp S, Kovacs G, Murphy K, Wolfe MS (2011) Evolutionary plant breeding in cereals—into a new era. Sustainability 3(10). doi:10.3390/su3101944.
23. Mulumba JW, et al. (2012) A risk-minimizing argument for traditional crop varietal diversity use to reduce pest and disease damage in agricultural ecosystems of Uganda. Agriculture, Ecosystems and Environment 157(July):70–86.
24. Ssekandi W, et al. (2016) The use of common bean (Phaseolus vulgaris) traditional varieties and their mixtures with commercial varieties to manage bean �y (Ophiomyia spp.) infestations in Uganda. Journal of Pest Science 89:45–57.
25. Wolfe MS, et al. (1992) Barley mildew in Europe: population biology and host resistance. Euphytica 63(1):125–139.
26. von Hertzen L, Hanski I, Haahtela T (2011) Natural immunity: Biodiversity loss and in�ammatory diseases
113
Thought Pieces
are two global megatrends that might be related. EMBO reports 12:1089–1093.
27. Khamsi R (2015) A gut feeling about immunity. Nature Medicine 21:674–676.
28. Gopalakrishnan V, et al. (2018) Gut microbiome modulates response to anti-PD-1 immunotherapy in melanoma patients. Science (New York, NY) 359(6371):97–103.
29. Hoban AE, et al. (2016) Regulation of prefrontal cortex myelination by the microbiota. Translational Psychiatry 6:e774.
30. Singh RK, et al. (2017) Influence of diet on the gut microbiome and implications for human health. Journal of Translational Medicine 15(1):73.
31. Rothschild D, et al. (2018) Environment dominates over host genetics in shaping human gut microbiota. Nature 555:210.
32. Heiman ML, Greenway FL (2016) A healthy gastrointestinal microbiome is dependent on dietary diversity. Molecular Metabolism 5(5):317–320.
33. Tilman D, Clark M (2014) Global diets link environmental sustainability and human health. Nature 515:518–522.
34. IFPRI (International Food Policy Research Institute) (2016) 2016 Global Nutrition Report - From Promise to Impact: Ending Malnutrition by 2030 (IFPRI, Washington, DC).
35. Kumar N, Harris J, Rawat R (2015) If they grow it, will they eat and grow? evidence from Zambia on agricultural diversity and child undernutrition. The Journal of Development Studies 51(8):1060–1077.
36. Jones AD (2017) Critical review of the emerging research evidence on agricultural biodiversity, diet diversity, and nutritional status in low- and middle-income countries. Nutrition Reviews. doi:10.1093/nutrit/nux040.
37. Sibhatu KT, Qaim M (2018) Review: Meta-analysis of the association between production diversity, diets, and nutrition in smallholder farm households. Food Policy (April):0–1.
38. Hanley-Cook G, Kennedy G, Lachat C (2019) Reducing risk of poor diet quality through food biodiversity: Five blind spots that make it complicated. Agrobiodiversity Index Report 2019: Risk and Resilience, ed Bailey A (Bioversity International, Rome, Italy).
39. Lucas T, Horton R (2019) The 21st-century great food transformation. The Lancet 393(10170):386–387.
40. KC KB, Dias GM, Veeramani A, Swanton CJ, Fraser D, Steinke D, et al. (2018) When too much isn’t enough: Does current food production meet global nutritional needs? PLoS ONE 13(10): e0205683. https://doi.org/10.1371/journal.pone.0205683.
41. Chappell MJ, et al. (2018) Agroecology as a pathway towards sustainable food systems agroecology (Misereor) https://www.misereor.de/fileadmin/publikationen/agroecology_as_a_pathway_towards_sustainable_food_systems.pdf [Accessed December 3, 2018].
42. FAO (Food and Agriculture Organization) (2014) The state of food and agriculture innovation in family farming (Rome) Available at: http://www.fao.org/3/a-i4040e.pdf [Accessed February 26, 2019].
43. Suneson C (1956) An evolutionary plant breeding method. Agronomy Journal 48:188–191.
44. Ceccarelli S (2009) Evolution, plant breeding and biodiversity. Journal of Agriculture and Environment for International Development 103(1/2):131–145.
45. Harlan H, Martini M (1929) A composite hybrid mixture. Journal of American Society of Agronomy 21:487–490.
46. Suneson C, Wiebe G (1942) Survival of barley and wheat varieties in mixtures. Journal of the Agronomy Society of America 34:1052–1056.
47. Allard R, Hansche P (1964) Some parameters of population variability and their implications in plant breeding. Advances in Agronomy, ed Norman A (Academic Press), pp 281–325.
48. Patel J, Reinbergs E, Mather D, Choo T, Sterling J (1987) Natural selection in a double-haploid mixture and a composite cross of barley. Crop Science 27:474–479.
49. Ibrahim K, Barret J (1991) Evolution of mildew resistance in a hybrid bulk population of barley. Heredity 67:247–256.
50. Soliman K, Allard R (1991) Grain yield of composite cross populations of barley: effects of natural selection. Crop Science 31:705–708.
51. Mundt C (2002) Use of multiline cultivars and cultivar mixtures for disease management. Annual Review Phytopathology 40:381–410.
52. Goldringer I, Prouin C, Rousset M, Galic N, Bonnin I (2006) Rapid differentiation of experimental populations of wheat for heading time in response to local climatic conditions. Annals of Botany 98(4):805–817.
53. Danquah E, Barrett J (2002) Grain yield in composite cross five of barley: effects of natural selection. Journal of Agricultural Science 138:171–176.
54. Raggi L, Ceccarelli S, Negri V (2016) Evolution of a barley composite cross-derived population: an insight gained by molecular markers. The Journal of Agricultural Science 154:23–39.
55. Raggi L, Negri V, Ceccarelli S (2016) Morphological diversity in a barley composite cross derived population evolved under low-input conditions and its relationship with molecular diversity: indications for breeding. The Journal of Agricultural Science 154:943–959.
56. Raggi L, et al. (2017) Evolutionary breeding for sustainable agriculture: Selection and multi-environmental evaluation of barley populations and lines. Field Crops Research 204:76–88.
57. Reiss ER, Drinkwater LE (2018) Cultivar mixtures: a meta-analysis of the effect of intraspecific diversity on crop yield. Ecological Applications 28(1):62–77.
58. Rahmanian M, Salimi M, Razavi K, Haghparast R, Ceccarelli S (2016) Evolutionary populations: Living gene banks in farmers’ fields in Iran. Farming Matters:24–29.

Diverse local food species, Guatemala. Guatemala is a global hotspot for biodiversity. The plants used by local and indigenous people are often wild-collected or semi-domesticated and have not received much research attention to enhance their roles in the livelihoods of Guatemalan people—even if some have much higher nutrition values and higher stress tolerance than more commercial crops. Credit: Bioversity International/R. Robitaille

KEY MESSAGES:
> Food biodiversity is a potential lever to improve Earth system resilience and promote healthier, diverse diets in a win-win scenario.
> However, various blind spots in our current knowledge make this recommendation complicated: the relationship between biodiversity in farms and biodiversity on plates is not straightforward, scientists measuring biodiversity in production systems and measuring diversity in diets do not measure the same things, food biodiversity measurements tend to focus on either the global or very local scale, consumption (dietary intake) of food biodiversity is often overlooked, and diet diversity doesn’t necessarily guarantee diet quality.
> This paper explores these blind spots, and policy and research efforts to address them.
Reducing risk of poor diet quality through food biodiversityFive blind spots that make it complicated
Giles Hanley-Cook, Gina Kennedy, Carl Lachat
116
Agrobiodiversity Index Report 2019 – Risk and Resilience
Diminishing biodiversity and rising malnutrition
Poor diets are one of the greatest risks to adequate nutrition and health. Low-quality diets are responsible for the greatest burden of disease worldwide, affecting countries and population groups at all levels of economic development (1–3). The triple burden of malnutrition – the coexistence of micronutrient de�ciencies, undernutrition, and overweight and obesity – has manifested itself in almost every nation on Earth. The long- and short-term effects of malnutrition hold back sustainable and inclusive global development and convey unacceptable human consequences. The United Nations Decade of Action on Nutrition 2016–2025 and the Sustainable Development Goals (SDG) provide global and national stimuli to address malnutrition and fast-track progress on food and nutrition security (4).
“Eat a variety of foods” or dietary diversity is a widely acknowledged and established public health recommendation to promote a healthy, nutritionally adequate diet (5). Healthy diets should be diverse and combine large amounts of vegetables, fruits, legumes, whole grains, nuts, seeds and unsaturated oils and moderate amounts of seafood and poultry, with low amounts of processed meat, added sugar and salt, re�ned grains and starchy vegetables (3). The recommendations for dietary diversity are based on the premise that consuming a wide variety of nutrient-dense foods will ensure an adequate intake of essential nutrients and in turn will lead to improved diet quality and optimal health outcomes (6). The actual composition of a diverse, balanced and healthy diet varies according to individual needs, locally available foods, dietary customs and cultural contexts. Transitions towards food biodiverse diets, such as the Mediterranean (7), pescatarian and vegetarian diets are projected to signi�cantly decrease diet-related non-communicable disease risks, including coronary heart disease, stroke and type 2 diabetes, worldwide (8–10).
However, rapid socioeconomic, demographic and technological changes coupled with agriculture policies skewed towards a narrow range of staple crops, crop varieties and animal species, are driving human diets and associated agricultural production systems towards more resource-intensive, ultra-processed, energy-dense and nutrient-poor foods (11, 12). This has led to unprecedented shifts in global food systems and dietary patterns. Diet-related diseases and overweight and obesity risks are expected to continue to rise
exponentially, while forms of undernutrition and micronutrient de�ciencies are declining at insuf�cient rates (2, 4, 13, 14).
The global food system transformation is also driving a progressive homogeneity of diets (15). Although plants account for over 80% of human diets worldwide and an estimated 30,000 edible terrestrial plant species are available for consumption, our global food system is made up of only 150–200 commercially available species (16). In excess of half the global food energy need is supplied by four staple crops: rice, potatoes, wheat and maize, and only 30 crops supply an estimated 95% of human food energy need (15, 16). Food biodiversity – the diversity of plants, animals and other organisms that are used for food, both cultivated and from the wild – has the potential to underpin diverse, nutritious diets (17, 18), but global shifts in human diets and food systems are driving biodiversity loss worldwide (15, 19, 20).
Food biodiversity and Earth system resilience
Diets inextricably link human and planetary health. The global food system is the prime driver of low-quality diets and, in parallel, the transgression of several planetary boundaries that de�ne a safe operating space for humanity in a stable Earth system (21, 22). Monoculture cropping systems and intensive livestock production generate substantial environmental costs (23–25). To illustrate, the rearing of livestock for meat, eggs and dairy alone produces 15% of total global greenhouse gas emissions and uses 70% of global agricultural land, including one-third of all arable land (26, 27).
Understanding and using food biodiversity and associated traditional knowledge provides levers of change towards more sustainable food systems in the face of mounting climate pressure on crop yields and on the nutritional content of foods (3). Biodiversity for food and agriculture contributes to Earth system resilience through a number of collective strategies, such as the protection and restoration of ecosystem services, sustainable use of soil and water resources, agroforestry, diversi�cation of farming systems, cultivation practices, and use of neglected and underutilized stress-tolerant crop species (28, 29). Nonetheless, the threat to food biodiversity is occurring at a general rate of species extinction estimated to be 100 to 1,000 times the natural rate (22).

117
Thought Pieces
We need to transition from business as usual to sustainable intensi�cation without compromising the Earth system. One school of thought gaining traction is that agricultural production systems based on food biodiversity, can result in both Earth system resilience and high-quality diets. Global shifts from current uniform, non-diverse diets to more diverse, nutritious and sustainable diets have the potential to avert 10.8–11.6 million premature deaths per year (3) and reduce food-related greenhouse gas emissions by 29%–70% by 2050 (30, 31).
Blind spots in food biodiversity knowledge
It seems simple to recommend that the world should increase its food biodiversity in production systems so that it can improve Earth system resilience and promote healthier diets in a win-win scenario. However, various blind spots in current knowledge make this recommendation more complicated than it appears at �rst sight:
• The relationship between biodiversity on farms and biodiversity on plates is not straightforward (32–34)
• Food biodiversity measurements tend to focus on either the global or very local scale (35)
• Consumption (dietary intake) of food biodiversity is often overlooked (18)
• Scientists measuring biodiversity in production systems and measuring diversity in diets do not measure the same things (36)
• Diet diversity doesn’t necessarily guarantee diet quality (37).
Translating agricultural biodiversity to diverse diets: lost in translation?
The relationship between diverse agricultural production systems and diverse, nutritious and sustainable diets is intricate and mitigated by multiple factors, such as markets (access and availability of nutritious and safe foods), gender relations, control over and access to resources, wealth, cultural values and the existing degree of on-farm diversity (33, 34, 38). Increasing agricultural biodiversity on farm, typically the number of crop species and occasionally livestock species, can contribute to dietary diversity (33, 34, 39) and the consumption of fruit and vegetables, food energy and micronutrients in smallholder subsistence
farming households in low- and middle-income countries (40). However, some studies indicate that, to have nutritionally meaningful impacts on dietary diversity, unrealistically large increases are required in the number of distinct crop or livestock species managed on farm (34).
Researchers identify two main pathways for smallholder farmers to improve diets. The �rst is to increase and consume on-farm diversity, the second is to specialize more in cash crops to earn income to purchase and consume more diversity. Most farmers use a combination of both. For individual smallholder farmers, maintaining agricultural biodiversity can sustain bene�cial ecosystem functions on farm, reduce costs of external inputs, and facilitate access to new market opportunities, increasing and smoothing income so indirectly improving access to more diverse and nutritious diets (33). Conversely, on-farm crop diversi�cation might sacri�ce economic gains from agricultural specialization (41). On the other hand, investing in a narrow range of cash crops might increase income from agriculture production, but might also result in longer-term consequences of land degradation. Another major consideration with the income pathway is that increased income does not translate directly into healthier diet choices, and in order for the increased income to result in better diet, nutrition education and communications efforts must be established (28). Otherwise, the trend observed is increased income spent on food but not necessarily healthier food choices.
Given evidence that both increased income and increased on-farm diversity strategies can be effective in improving diet diversity, albeit via different pathways, there is a need to better understand the trade-offs between diets, income and ecosystem health that will occur within very speci�c contexts, geographies, and within sets of smallholder farmer priorities (38).
Food biodiversity is measured and analyzed at different scales
At global level, increasing the food production of a diversity of vegetables, fruits, legumes, and nuts and seeds is critical for the global population to achieve a sustainable and healthy diet by mid-century (3). However, food is actually chosen and consumed by individuals in households and produced on farms. There is a large gap when moving from global level to farm level or individual analysis and one blind spot is the ‘missing middle’ or the functioning of food systems within different production and market systems (35). These have been described by the High Level Panel of Experts on Nutrition as traditional, mixed and modern food systems that are in�uenced by culture, income levels and consumer needs (convenience, taste, budget, time available) (28).

118
Agrobiodiversity Index Report 2019 – Risk and Resilience
Consumption of food biodiversity is often overlooked
There is a strong and rising demand from global development actors for simple indicators that re�ect at least one aspect of food and nutrition security or diet quality, particularly for vulnerable populations. Therefore, most studies measure dietary diversity as a simple count of distinct foods or food groups consumed over a prespeci�ed recall period (33, 34, 42). These widely disseminated and applied dietary diversity scores are often based on less resource-intensive self-reported dietary assessments methods such as list-based questionnaires or open-ended 24-hour dietary recalls. They re�ect the various food sources of macro- and micronutrients in diets. To give an example, one widely used food-group diversity score is the Minimum Dietary Diversity for Women (MDD-W) (43, 44). It assesses the proportion of women of reproductive age (15–49 years) who consumed in the previous 24 hours at least �ve out of ten prede�ned food groups:
• Grains, white roots and tubers, and plantains
• Pulses (beans, peas and lentils)
• Nuts and seeds
• Dairy
• Meat, poultry and �sh
• Eggs
• Dark green leafy vegetables
• Other vitamin A-rich fruits and vegetables
• Other vegetables
• Other fruits.
The MDD-W has been validated as a proxy for the probability of micronutrient adequacy of women’s diets in low- and middle-income countries (45).
One blind spot important from a biodiversity point of view is that indicators based on food groups do not tell us anything about the species and varieties that diets are made up of. For most food biodiversity, there are substantial variations between species and within species in the content and density of important nutrients and other health-promoting components (46–49). Food-group diversity scores are not designed and are thus inappropriate to assess the hypothesized bene�ts of within food-group biodiversity, such as the biological nutrient variations within species, subspecies, varieties, cultivars and breeds, the evenness of food energy allocation or the dissimilarity in nutritional traits across food groups (37, 50).
A mismatch of agricultural biodiversity and dietary diversity indicators
The assessment and elucidation of linkages between agricultural biodiversity and dietary diversity are hampered by the fact that indicators used to measure on-farm diversity and those used to measure dietary diversity are not aligned. Moreover, within each speci�c domain (i.e. agroecology and nutrition), there are numerous indicators and various methods by which they are collected (51, 52). Dietary and ecological diversity indicators are not designed to assess the multifarious relationships between food biodiversity and diet quality. Research linking food biodiversity, agricultural production diversity and diet quality has applied multiple metrics without validation from a nutritional point of view (33).
The selection and number of food groups indisputably alters the association between agricultural biodiversity and dietary diversity, particularly when the selected food groups do not align with those crop species or crop groups used to de�ne agricultural biodiversity. To illustrate, consider three smallholder farms. The �rst grows only maize, and so has a production diversity (PD) of one. The second farm grows maize and millet (PD = 2) and the third farm grows maize, millet and sorghum (PD = 3). If the individuals on these farms consumed only their subsistence food production (maize; maize and millet; or maize, millet and sorghum) then the individual-level dietary diversity score would be 1 in all cases, as all of the species are from the ‘grains, white roots and tubers, and plantains’ food group. In this simpli�ed scenario there would be no relationship between agricultural biodiversity and dietary diversity (36). Intuitively however, increasing the number of species within the same food group might lead to lower net nutritional bene�ts than when species of distinct food groups are added to the production landscape.
This example illustrates the dif�culty in coming to terms with the relationship between production diversity and food biodiversity for diet diversity. On the one hand, a production diversity score of 3 may mean a more ecologically resilient farm but the unchanged dietary diversity score of 1 in this example will not help meet minimum standards of diversity for a woman of reproductive age. In the real world, this simple example becomes more complex since diets are in�uenced not just by what is grown on farm but consumers’ access to markets, preferences, seasonality of wild and domesticated foods and other signi�cant in�uencing factors that have not been well captured in analytical frameworks to understand the linkages between production and diet diversity.

119
Thought Pieces
Dietary diversity does not guarantee diet quality
Diversity scores assess only one aspect of diet quality (53). Individual-level dietary diversity scores capture one important dimension of diet quality: the consumption of nutrient-dense food groups, such as fruit and vegetables, nuts and seeds and pulses. Nevertheless, individual-level dietary diversity scores do not capture other imperative diet-quality dimensions. To illustrate, food-group based indicators do not provide any information on (Figure 1):
• Richness: number of distinct species per day
• Evenness: distribution of food energy, nutrients or species abundance across food groups
• Disparity: level of (dis)similarity between species (e.g. vitamin A content) or food items (e.g. level of food processing).
The �gure also illustrates a huge blind spot in understanding the processing level of the diversity consumed. We cannot see if the species is consumed fresh, minimally processed or as ultra-processed food. Level of processing is a critical factor to be considered in assessment of overall diet quality based on any given dietary pattern (55–57). In fact recommendations to eat diverse foods, if not accompanied also by recommendations that those foods be predominantly fruits, vegetables, whole grains and seeds, will not lead to healthy diets (58).
Efforts to address the blind spots
Linking diverse diets and agricultural biodiversity through food-based dietary guidelines
There is growing recognition of the central roles of structural, environmental, cultural, social and psychological factors in dietary behaviour (59). To halt global transitions towards low-quality, homogenous diets and redirect human behaviour towards more food-biodiverse and sustainable diets, we need more than just a robust scienti�c evidence base. Clear policy measures are best suited to changing dietary patterns (3, 60). For example, the determination that trans fatty acids could not be classi�ed as ‘Generally recognized as safe’ led to a public-health decision by the US Food and Drug Administration in 2015 to ban them in the food supply system.
A softer policy intervention is nudging the public towards healthy food choices through guidelines. Dietary diversity is advocated in food-based dietary guidelines and in the ‘Healthy Diet’ and ‘A healthy diet sustainably produced’ fact and information sheets from
Distinct species are indicated by their colour. Richness is the absolute number of species in a dietary pattern: in both dietary patterns it is equal to five. Evenness is the equitability of the species abundance distribution across food groups: in dietary pattern A all species are present in equal abundance and so it is perfectly even, while dietary pattern B is very uneven since it is dominated by the green species. Disparity is the level of similarity between species: for example red and pink species are more similar to each other (nutritional traits/attributes) than the red and the black species (Adapted from (54)).
FIGURE 1 – Representation of two dietary patterns where 100 food items are consumed
Dietary patternA
Dietary patternB

120
Agrobiodiversity Index Report 2019 – Risk and Resilience
the World Health Organization. However, most national dietary guidelines do not re�ect the available evidence on nutritious, sustainable and healthy diets, and include no or lenient limits for animal-source foods, particularly meat and dairy (61), despite an opposing evidence base (62, 63).
Guidelines also offer a potential strategy to link sustainable agricultural production to biodiverse diets. A few countries (Brazil, Germany, Qatar, Sweden) have introduced sustainability criteria into their national dietary guidelines (Box 1, (55)). Others (the Nordic countries, Netherlands, France, Estonia and the UK) have issued quasi-of�cial guidelines by government-funded entities. However, whether or not dietary guidelines should include sustainability or biodiversity criteria is ultimately a political decision and as such has been a major issue of discussion in several countries.
Developing indicators that cut across food and farms
One way to explore the link between on-farm biodiversity and dietary diversity is to adopt novel nutritional measures from established diversity sciences describing diversity in ecological and economic systems. One such measure, Dietary Species Richness, counts the number of unique plant and animal species consumed in the previous 24 hours. Dietary Species Richness has been successfully applied as a cross-cutting measure of food biodiversity and micronutrient adequacy of diets in wet and dry seasons in seven rural contexts of low- and middle-income countries (18). Measuring the number of species consumed during dietary assessments provides a unique opportunity to cut across two critical dimensions of sustainable development – human and planetary health – and complements existing metrics of healthy and sustainable diets. Decision-makers often struggle to harmonize environmental and food policy actions so dietary species richness is a valuable metric in this regard, as it integrates food biodiversity, nutrition and health aspects of food systems. Nevertheless, assessing Dietary Species Richness is challenging, it has been estimated that previous studies have misidenti�ed 6%–10% of species (64). Guidelines have recently been prepared to adequately record species during dietary intake assessments (17).
BOX 1 – Extract from Swedish food-based dietary guidelines (55)
• High-fibre vegetables have a lower environmental impact than salad greens. They tend to be grown outside (not in greenhouses). They are also more robust, which reduces waste due to damages during transport.
• Although people should consume more seafood for health, many wild fish stocks are endangered or are harvested unsustainably, while aquaculture also has its problems. People should therefore buy ecolabelled products. Mussels can help reduce marine eutrophication.
• One of the ways to increase physical activity is to use the stairs instead of the lift, and cycle or walk to work, and these behaviours can also reduce the environmental impact.
• Cereals have a relatively small climate impact. Due to the high greenhouse gas emissions associated with rice, other grains and potatoes are a better choice for the environment.
• Rapeseed oil and olive oil generally have a lower environmental impact than palm oil, but the relationship gets inverted when palm oil is produced without deforestation (e.g. in old plantations).
• Dairy products have high environmental impacts since dairy cows produce methane. However, grazing animals can help bring about a “rich agricultural landscape and biodiversity”.
• Drinks made of oats and soya are ecofriendly, chose the ones enriched with vitamins and minerals.
• Reducing meat consumption can benefit both health and the environment. By cutting down on quantity people may be able to afford to buy meat produced more sustainably, with attention paid to the welfare of the animals. Different meat types have different climate impacts: poultry has the smallest impact on climate, followed by pork. On the other hand, free range beef and lamb can also have other positive environmental effects – animal grazing can help maintain diverse agricultural landscapes and support biodiversity.
• Sweets can also have a high environmental impact: a bag of jelly beans actually has as much of a climate footprint as a small portion of pork. These are referred to in the report as an “unnecessary environmental impact”.

121
Thought Pieces
Pointers for research and policy
In an interconnected, multi-stakeholder global food system, balancing the nurturing of human health with environmental stewardship presents numerous policy challenges (14). Despite growing awareness of the bene�ts of agricultural biodiversity for dietary diversity and the bene�ts of diverse diets for human nutrition and health, many barriers and perverse subsidies make it dif�cult to mainstream biodiversity in food production and consumption (65). Food and agricultural policies and research must be reoriented to encourage agricultural biodiversity, nutrition and sustainability, rather than prioritizing the productivity of a narrow-range of monoculture crop and livestock species that adversely affect human and planetary health (3, 66).
Diversi�ed agricultural production systems and diverse diets can be mutually reinforcing. If we want to eat it, we must grow it. Therefore, policy interventions must develop and strengthen markets that promote and encourage traditional, neglected and underutilized crop species, varieties, cultivars and breeds (34, 66, 67). This is a promising strategy to improve the availability, accessibility and affordability of food biodiversity and high-quality diets for all strata of society. Moreover, policy and research reorientation might also include transforming agricultural extension services to encourage a plethora of food biodiversity and foster synergies between scienti�c and local knowledge and biocultural heritage (e.g. participatory plant breeding). Global food industry and gastronomy movements also have the power to shape dietary patterns and champion food biodiversity. For example, the Chefs’ Manifesto of the SDG2 Advocacy Hub is a thematic framework, which outlines how chefs can contribute to the SDGs through simple, practical actions (Box 2).
BOX 2 – The Chefs’ Manifesto eight thematic areas
1. Ingredients grown with respect for the Earth and its oceans
2. Protection of biodiversity and improved animal welfare
3. Investment in livelihoods
4. Value natural resources and reduce waste
5. Celebration of local and seasonal food
6. A focus on plant-based ingredients
7. Education on food safety and healthy diets
8. Nutritious food that is accessible and affordable for all.
For researchers, there is a need to go beyond food-group diversity, and collect food composition and consumption data on wild and cultivated food biodiversity (17). To connect human diets to global food systems, additional research is needed on consumer behaviour and food environments. This includes understanding the sources of food biodiversity (wild, on-farm production, purchased) (18, 33) and the relative contribution of wild and cultivated food biodiversity to both diet quality and sustainability (39). Monitoring the contribution of agricultural biodiversity to global diets facilitates the identi�cation of a multitude of species with the greatest potential to improve nutrition in various local contexts and provides additional granularity to assess the importance of food biodiversity in ensuring diet quality (18, 68). Further research into the multifunctionalities of food biodiversity (e.g. long-term productivity, stability and resilience to shocks) is critical to understand the context-speci�c factors that facilitate or hinder the role of agricultural diversi�cation in positively in�uencing food environments and dietary patterns (35).
To conclude, increasing food biodiversity is vital to reduce malnutrition risks to human health and to increase resilience in a stable Earth system. It will require greater clarity on current blind spots regarding the complex relationship between agricultural biodiversity and food biodiversity. It will also need practices, policies and metrics that both facilitate transitions to diversi�ed sustainable agricultural systems, and raise awareness and stimulate demand for diverse diets.

122
Agrobiodiversity Index Report 2019 – Risk and Resilience
References
1. Gakidou E, et al. (2017) Global, regional, and national comparative risk assessment of 84 behavioural, environmental and occupational, and metabolic risks or clusters of risks, 1990-2016: A systematic analysis for the Global Burden of Disease Study 2016. The Lancet. doi:10.1016/S0140-6736(17)32366-8.
2. Springmann M, Godfray HCJ, Rayner M, Scarborough P (2016) Analysis and valuation of the health and climate change cobene�ts of dietary change. Proceedings of the National Academy of Sciences 113(15):4146–4151.
3. Willett W, et al. (2019) Food in the Anthropocene: the EAT–Lancet Commission on healthy diets from sustainable food systems. The Lancet 6736(18):3–49.
4. FAO, IFAD, UNICEF, WFP, WHO (2018) The State of Food Security and Nutrition in the World in 2018. Building climate resilience for food security and nutrition.
5. Montagnese C, et al. (2015) European food-based dietary guidelines: A comparison and update. Nutrition. doi:10.1016/j.nut.2015.01.002.
6. Ruel MT (2003) Operationalizing dietary diversity: A review of measurement issues and research priorities. Journal of Nutrition 133:3911S-3926S.
7. Estruch R, et al. (2018) Primary prevention of cardiovascular disease with a Mediterranean diet supplemented with extra-virgin olive oil or nuts. New England Journal of Medicine. doi:10.1056/NEJMoa1800389.
8. Reedy J, et al. (2014) Higher diet quality is associated with decreased risk of all-cause, cardiovascular disease, and cancer mortality among older adults. Journal of Nutrition. doi:10.3945/jn.113.189407.
9. Tilman D, Clark M (2014) Global diets link environmental sustainability and human health. Nature 515:518–522.
10. Perignon M, Vieux F, Soler LG, Masset G, Darmon N (2017) Improving diet sustainability through evolution of food choices: Review of epidemiological studies on the environmental impact of diets. Nutrition Reviews. doi:10.1093/nutrit/nuw043.
11. Ranganathan J, et al. (2016) Shifting Diets for a Sustainable Future (World Resources Institute) doi:10.2499/9780896295827_08.
12. Springmann M, et al. (2018) Options for keeping the food system within environmental limits. Nature. doi:10.1038/s41586-018-0594-0.
13. Rockström J, Stordalen GA, Horton R (2016) Acting in the Anthropocene: the EAT–Lancet Commission. The Lancet. doi:10.1016/S0140-6736(16)30681-X.
14. Whitmee S, et al. (2015) Safeguarding human health in the Anthropocene epoch : report of The Rockefeller Foundation – Lancet Commission on planetary health. The Lancet 386(10007):1973–2028.
15. Khoury CK, et al. (2014) Increasing homogeneity in global food supplies and the implications for food security. Proceedings of the National Academy of Sciences 111(11):4001–4006.
16. FAO (Food and Agriculture Organization) (2010) Second Report on the State of the World’s Plant Genetic Resources for Food and Agriculture (FAO, Rome, Italy).
17. FAO (Food and Agriculture Organization), Bioversity International (2017) Guildelines on Assessing Biodiverse Foods in Dietary Intake Surveys (FAO, Rome, Italy)..
18. Lachat C, et al. (2017) Dietary species richness as a measure of food biodiversity and nutritional quality of diets. Proceedings of the National Academy of Sciences. doi:10.1073/pnas.1709194115.
19. Vermeulen S, Campbell B, Ingram J (2012) Climate change and food systems. Annual Review of Environmental Resources 37:195–222.
20. Maxwell SL, Fuller RA, Brooks TM, Watson JEM (2016) Biodiversity: The ravages of guns, nets and bulldozers. Nature 536(7615):143–145.
21. Campbell BM, et al. (2017) Agriculture production as a major driver of the earth system exceeding planetary

123
Thought Pieces
boundaries. Ecology and Society. doi:10.5751/ES-09595-220408.
22. Steffen W, et al. (2015) Supplementary Materials, Planetary boundaries: Guiding human development on a changing planet. Science. doi:10.1126/science.1259855.
23. Auestad N, Fulgoni VL (2015) What current literature tells us about sustainable diets: emerging research linking dietary patterns, environmental sustainability, and economics. Advances in Nutrition: An International Review Journal. doi:10.3945/an.114.005694.
24. Nelson ME, Hamm MW, Hu FB, Abrams SA, Griffin TS (2016) Alignment of healthy dietary patterns and environmental sustainability: a systematic review. Advances in Nutrition: An International Review Journal. doi:10.3945/an.116.012567.
25. Hallström E, Carlsson-Kanyama A, Börjesson P (2015) Environmental impact of dietary change: A systematic review. Journal of Cleaner Production. doi:10.1016/j.jclepro.2014.12.008.
26. Aleksandrowicz L, Green R, Joy EJM, Smith P, Haines A (2016) The impacts of dietary change on greenhouse gas emissions, land use, water use, and health: A systematic review. PLoS ONE. doi:10.1371/journal.pone.0165797.
27. Gerber PJ, Steinfeld H, Henderson B, Mottet A, Opio C, Dijkman J, Falcucci A Tempio G (2013) Tackling Climate Change Through Livestock: A Global Assessment of Emissions and Mitigation Opportunities (FAO, Rome, Italy).
28. HLPE (High Level Panel of Experts on Food Security and Nutrition of the Committee on World Food Security of the FAO) (2017) Nutrition and food systems. A report by the High Level Panel of Experts on Food Security and Nutrition of the Committee on World Food Security (Rome, Italy).
29. FAO (Food and Agriculture Organization) (2019) The State of the World’s Biodiversity for Food and Agriculture eds Belanger J, Pilling D (FAO Commission on Genetic Resources for Food and Agriculture Assessments, Rome, Italy) Available at: http://www.fao.org/3/CA3129EN/CA3129EN.pdf.
30. Payne CL, Scarborough P, Cobiac L (2016) Do low-carbon-emission diets lead to higher nutritional quality and positive health outcomes? A systematic review of the literature. Public Health Nutrition. doi:10.1017/S1368980016000495.
31. Springmann M, et al. (2018) Health and nutritional aspects of sustainable diet strategies and their association with environmental impacts: a global modelling analysis with country-level detail. The Lancet Planetary Health 2(10):e451–e461.
32. Verger EO, Ballard TJ, Dop MC, Martin-Prevel Y (2019) Systematic review of use and interpretation of dietary diversity indicators in nutrition-sensitive agriculture literature. Global Food Security 20:156–169.
33. Jones AD (2017) Critical review of the emerging research evidence on agricultural biodiversity, diet diversity, and nutritional status in low- and middle-income countries. Nutrition Reviews. doi:10.1093/nutrit/nux040.
34. Sibhatu KT, Qaim M (2018) Review: Meta-analysis of the association between production diversity, diets, and nutrition in smallholder farm households. Food Policy (April):0–1.
35. Remans R, DeClerck FAJ, Kennedy G, Fanzo J (2015) Expanding the view on the production and dietary diversity link: Scale, function, and change over time. Proceedings of the National Academy of Sciences. doi:10.1073/pnas.1518531112.
36. Berti PR (2015) Relationship between production diversity and dietary diversity depends on how number of foods is counted. Proceedings of the National Academy of Sciences. doi:10.1073/pnas.1517006112.
37. de Oliveira Otto MC, et al. (2018) Dietary diversity: implications for obesity prevention in adult populations: a science advisory from the American Heart Association. Circulation. doi:10.1161/CIR.0000000000000595.
38. Fanzo JC (2017) Decisive decisions on production compared with market strategies to improve diets in rural Africa. The Journal of Nutrition. doi:10.3945/jn.116.241703.
39. Powell B, et al. (2015) Improving diets with wild and cultivated biodiversity from across the landscape. Food Security 7(3):535–554.
124
Agrobiodiversity Index Report 2019 – Risk and Resilience
40. Jones AD, et al. (2018) Farm-level agricultural biodiversity in the Peruvian Andes is associated with greater odds of women achieving a minimally diverse and micronutrient adequate diet. Journal of Nutrition. doi:10.1093/jn/nxy166.
41. Sibhatu KT, Krishna V V, Qaim M (2015) Production diversity and dietary diversity in smallholder farm households. Proceedings of the National Academy of Sciences 112(34):10657–62.
42. Salehi-Abargouei A, Akbari F, Bellissimo N, Azadbakht L (2015) Dietary diversity score and obesity: a systematic review and meta-analysis of observational studies. European Journal of Clinical Nutrition. doi:10.1038/ejcn.2015.118.
43. FAO, FHI360 (2016) Minimum dietary diversity for women- a guide to measurement (FAO, Rome Italy) doi:10.1016/S0167-6393(00)00055-8.
44. Martin-Prevel Y, et al. (2017) Development of a dichotomous indicator for population-level assessment of dietary diversity in women of reproductive age. Current Developments in Nutrition 1(12):cdn.117.001701.
45. Martin-Prevél Y, et al. (2015) Moving forward on choosing a standard operational indicator of women’s dietary diversity (FAO, Rome, Italy).
46. FAO/INFOODS (2017) FAO/INFOODS Food Composition Database for Biodiversity Version 4.0 - BioFoodComp 4.0. 33.
47. Thilsted SH, et al. (2016) Sustaining healthy diets: The role of capture fisheries and aquaculture for improving nutrition in the post-2015 era. Food Policy 61:126–131.
48. Lutaladio N, Burlingame B, Crews J (2010) Horticulture, biodiversity and nutrition. Journal of Food Composition and Analysis 23(6):481–485.
49. Burlingame B, Mouillé B, Charrondière R (2009) Nutrients, bioactive non-nutrients and anti-nutrients in potatoes. Journal of Food Composition and Analysis 22(6):494–502.
50. Burlingame B, Charrondière R, Mouillé B (2009) Food composition is fundamental to the cross-cutting initiative on biodiversity for food and nutrition. Journal of Food Composition and Analysis 22(5):361–365.
51. Kennedy G, Stoian D, Hunter D, Kikulwe E, Termote C (2017) Food biodiversity for healthy, diverse diets. Mainstreaming Agrobiodiversity in Sustainable Food Systems: Scientific Foundations for an Agrobiodiversity Index, ed Bailey A (Bioversity International, Rome, Italy), pp 23–52.
52. Sibhatu KT, Qaim M (2018) Farm production diversity and dietary quality: linkages and measurement issues. Food Security. doi:10.1007/s12571-017-0762-3.
53. Verger EO, Dop MC, Martin-Prével Y (2017) Not all dietary diversity scores can legitimately be interpreted as proxies of diet quality. Public Health Nutrition. doi:10.1017/S1368980016003402.
54. Daly A, Baetens J, De Baets B (2018) Ecological diversity: measuring the unmeasurable. Mathematics. doi:10.3390/math6070119.
55. Fischer CG, Garnett T (2015) Plates, pyramids, planet: Developments in national health and sustainable dietary guidelines: a state of play assessment (FAO (Food and Agriculture Organization) and FRCN (The Food Climate Research Network at The University of Oxford)).
56. FAO (Food and Agriculture Organization) (2015) Guidelines on the collection of information on food processing through food consumption surveys (FAO, Rome, Italy).
57. Monteiro CA, et al. (2018) The UN Decade of Nutrition, the NOVA food classification and the trouble with ultra-processing. Public Health Nutrition. doi:10.1017/S1368980017000234.
58. De Oliveira Otto MC, Padhye NS, Bertoni AG, Jacobs DR, Mozaffarian D (2015) Everything in moderation - Dietary diversity and quality, central obesity and risk of diabetes. PLoS ONE. doi:10.1371/journal.pone.0141341.
59. Marteau TM, Hollands GJ, Fletcher PC (2012) Changing human behavior to prevent disease: The importance of targeting automatic processes. Science. doi:10.1126/science.1226918.
60. Mozaffarian D (2016) Dietary and policy priorities for cardiovascular disease, diabetes, and obesity. Circulation. doi:10.1161/CIRCULATIONAHA.115.018585.
125
Thought Pieces
61. Ritchie H, Reay DS, Higgins P (2018) The impact of global dietary guidelines on climate change. Global Environmental Change. doi:10.1016/j.gloenvcha.2018.02.005.
62. Bolland MJ, et al. (2015) Calcium intake and risk of fracture: Systematic review. British Medical Journal (Online). doi:10.1136/bmj.h4580.
63. Kim K, et al. (2017) Role of total, red, processed, and white meat consumption in stroke incidence and mortality: A systematic review and meta-analysis of prospective cohort studies. Journal of the American Heart Association. doi:10.1161/JAHA.117.005983.
64. Łuczaj ŁJ (2010) Plant identification credibility in ethnobotany: A closer look at Polish ethnographic studies. Journal of Ethnobiology and Ethnomedicine 6. doi:10.1186/1746-4269-6-36.
65. IPES-Food (International Panel of Experts on Sustainable Food Systems) (2015) The new science of sustainable food systems: overcoming barriers to food systems reform. (IPES-Food) doi:10.1109/ISSCC.2010.5433958.
66. Garrett GS, Platenkamp L, Mbuya MNN (2019) Policies and finance to spur appropriate private-sector engagement in food systems: Implications for mainstreaming agrobiodiversity. Agrobiodiversity Index Report 2019: Risk and Resilience (Bioversity International, Rome, Italy).
67. Cook S (2018) The Spice of Life: the Fundamental Role of Diversity on the Farm and on the Plate (IIED and HIVOS, London and The Hague).
68. Remans R, et al. (2011) Assessing nutritional diversity of cropping systems in African villages. PLoS ONE 6(6). doi:10.1371/journal.pone.0021235.
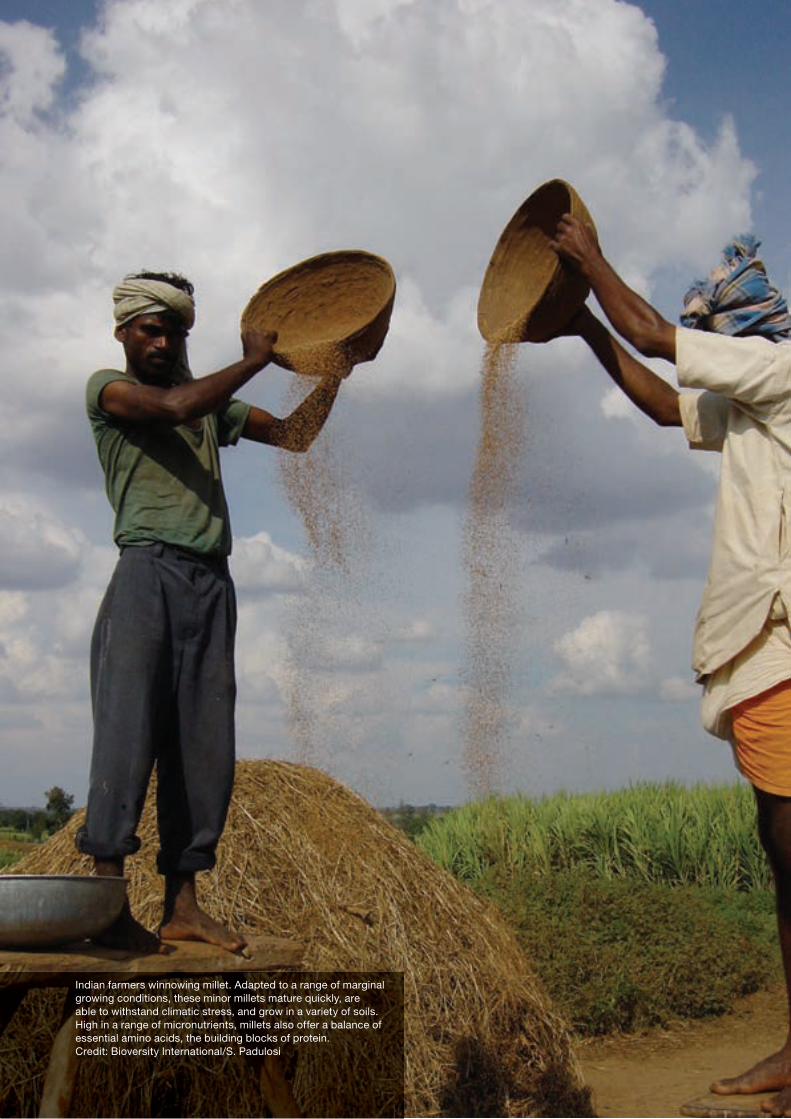
Indian farmers winnowing millet. Adapted to a range of marginal growing conditions, these minor millets mature quickly, are able to withstand climatic stress, and grow in a variety of soils. High in a range of micronutrients, millets also offer a balance of essential amino acids, the building blocks of protein. Credit: Bioversity International/S. Padulosi
KEY MESSAGES:
> Resilient seed systems contribute to greater food availability throughout the year, the production of more nutritious and healthy crops, income generation and a sustainable resource base. These outcomes together contribute to greater resilience of food systems.
> Farmers obtain seeds from diverse sources through different mechanisms. There are many actors involved in producing and distributing seeds, and they face many constraints, from climate change to poor quality seed and inefficient delivery systems.
> Core elements of a comprehensive strategy for resilient seed systems include: smarter ways of addressing climate change, identifying best-bet portfolios, novel and efficient distribution, innovative business models and value chains, empowerment of farmers, and local implementation of international and national policy.
> We illustrate these core elements with examples of success.
Healthy food systems require resilient seed systemsAbishkar Subedi and Ronnie Vernooy

128
Agrobiodiversity Index Report 2019 – Risk and Resilience
Seed actors and their roles
In many countries around the world, farmers obtain seeds from a diversity of seed production sources – these can be local, regional, national or international (1). In any given year, a farming household might use their own saved seed for crops such as bean, �nger millet, (traditional) maize varieties, rice and sorghum; buy groundnut seed at the local market; obtain seed of improved or hybrid maize from national public research institutions through government extension services or international aid distribution programmes; and buy seed of exotic vegetables from national or international commercial companies. The following year, the farming
household might decide to change the mix of crops and their seed sources.
Mechanisms to obtain seeds vary and include monetary and non-monetary transactions. Very often seed transactions are embedded in the fabric of socioeconomic relationships in the community and beyond. Thus, seeds are not only planting material (i.e. physical capital), but social capital as well. Women farmers play key roles in farmer seed systems (2), although they are often overlooked by researchers and development personnel, policies and programmes.
Social actors engaged in producing and distributing seed include:
• Individual farming seed saving households
• Farmer seed networks
• Community-based seed producers (e.g. a community seedbank with a seed-production arm)
Source: Adapted and expanded from (4).
FIGURE 1 – Framework for resilient seed systems for healthy food systems
Socioeconomic drivers Seed systems outcomes
Food systems outcomes
Seed system actors and activities
Environmental drivers
Market Policy, Law, Regulation
Research and Development
Infrastructure and Equipment
Individual farming seed saving households
Farmer seed networks
Local traders Community based seed producers
Local seed businesses enterprises
Government seed operations & programmes
National private seed companies
ClimateAgrobiodiversity Land use and soil fertility
Water
Regional & multinational seed companies
Organisation / Association
Culture
Access
Availability
Use
Quality
Diversity and choices
Responsive to demand
Responsive to shocks
Food and nutrition security
Income
Livelihood
Employment
Wealth
Social and political capital
Human and spiritual capital
Enviromental capital

129
Thought Pieces
• Local traders
• Local seed enterprises (business) catering to local markets in low volumes
• Government seed operations or programmes
• National private seed companies
• Regional and multinational private seed companies (1).
60%−90% of the seeds which smallholder farmers in low-income countries depend on is saved on farm or obtained through local distribution channels, such as exchanges between farmers, intra- and inter-community sharing systems, agrodealers and local markets. Seeds obtained at local markets are often unlabelled, but in many countries play a very important role in the supply system (3). This is particularly important after natural disasters, such as droughts, earthquakes and hurricanes, when farming communities can lose most or all of their stored seeds (3).
Many factors in�uence the operations of seed producers and distributors, whether or not these operations are integrated in one enterprise or organization. They include history, objectives, types of crops and crop varieties, types and levels of investment (science and technology, capital, human resources), scale, size, type and density of seed networks, whether or not intellectual property rights are used and if so what type, and the policy and legal context. Policies and laws regulate who can produce and sell which kind of seed, how quality assurance is organized, and how rewards and support are allocated. Regulatory frameworks vary between countries, though efforts are underway to make them more harmonized. They usually have a signi�cant in�uence on how the seed sector has evolved, how power and in�uence are distributed and in what direction the sector will go. Besides socioeconomic and political factors, environmental factors are also important, including climate change. Figure 1 represents a framework to analyze seed system−food system components and interactions.
Resilient seed systems
Under supportive policy and socioeconomic conditions, a diversity of seed production and distribution practices make up a resilient seed system. A resilient seed system contributes to greater food availability throughout the year, the production of more nutritious and healthy crops, income generation and a sustainable resource base. These outcomes together will contribute to greater resilience of food systems.
Our de�nition of a resilient seed system, based on research and our experience, is one which:
• Relies on the ability of seed system actors to absorb disturbances, regroup or reorganize, and adapt to stresses and changes caused by a perturbation (5)
• Results from multiple seed and knowledge interactions and continuous learning among seed system actors and related institutions (6)
• Is demand driven and responsive to differentiated needs and interests supporting all users and farming systems
• Recognizes, respects and supports the key roles played by women farmers as seed custodians, managers, networkers and entrepreneurs.
Resilient seed systems reduce vulnerability by:
• Ensuring access to seeds in terms of preference, affordable price and availability when needed
• Ensuring availability in terms of production and distribution
• Guaranteeing seed quality in terms of adaptability, safety and longevity (7)
• Guaranteeing seed choice and diversity
• Producing crops which underpin a healthy diet
• Recognizing and respecting seed as social and spiritual capital.
Ultimately, farmers should bene�t from a secure and diversi�ed supply of quality seeds suitable for local conditions and which contribute to healthier diets, more sustainable livelihoods and stronger capacity to adapt to climate change. Useful and timely information should accompany seeds, for example, with regard to the nutritional value of the variety, capacity to withstand drought, and recommended management practices.
Bottlenecks: seed practices under stress
Almost everywhere, local seed practices are under stress (8). Urbanization, agricultural intensi�cation and commoditization and privatization of natural resources are contributing to a decline in collective local seed management. Farmers are substituting local varieties with hybrids that can be easily purchased from agrodealer shops or at local markets. Traditional seed exchange relationships have become weaker in many areas. In some countries, they are becoming

130
Agrobiodiversity Index Report 2019 – Risk and Resilience
criminalized due to new revised seed policies or laws. Recent studies reveal that the legal operating space for farmers and communities to save, produce, exchange and sell seed is being reduced and related farmer practices of sharing and distributing seed, criminalized (9, 10). Only in a few countries, such as Bolivia, Ethiopia, Nepal and Uganda, are farmer-centred seed production and exchange practices obtaining increased recognition and support.
One major challenge farmers face in producing and obtaining seed is poor quality. Quality control of farmer-saved seed is largely based on trust embedded in social relationships, while quality control of seed produced by the other social actors is often subject to external written rules and regulations. How much actual quality control takes place is, however, a moot point. In many rural communities, poor storage practices and facilities affect seed quality. Farmers everywhere complain about the sale of ‘fake’ seeds, for instance grain sold as seed or non-certi�ed, low-quality seed sold as ‘improved’ seed. Fake seeds have direct negative impacts on crop productivity and farmer income.
Another major challenge is that in many countries it is very dif�cult to obtain new varieties of interest to farmers due to poorly developed or badly supported delivery systems. Farmers often do not know about which other crops or crop varieties they could grow on their farm and have no or poor access to new and improved crop diversity.
This obstacle seriously hinders farmers’ efforts to adapt to climate change. Climate change has begun to put additional pressure on farmers’ seed and food production systems and on the multiple functions that they ful�l. Future impacts of climate change are expected to become more pronounced in many parts of the world, forcing farmers to change their practices and causing them to search for information about crops and varieties better adapted to new weather dynamics. Access to quality seeds will become even more important.
Women farmers are often interested in different portfolios of crops and crop varieties, for example, requiring less regular labour inputs, easier to transport, with a longer shelf life and with a high nutrient density. Resilient seed systems should be gender responsive and support women’s agency, and their ability to make decisions about how to successfully manage their farms and gain access to the resources they need including seeds.
Opportunities: pathways to resilience
It is important that farmers continue to maintain crop diversity individually and collectively (for example, in community seedbanks (11)), Resilience at scale requires concerted efforts. Core elements of a comprehensive strategy are (12, 13):
• Smarter ways of addressing climate change
• Identifying best-bet portfolios
• Novel and ef�cient distribution
• Innovative business models and value chains
• Empowerment of farmers
• Local implementation of international and national policy
Smarter ways of addressing climate change
Much faster and cheaper ways of gathering, compiling, analyzing and sharing information about relevant (anticipated) climate changes and climate-induced stresses, for example, through the use of climate analogues (13).
National research teams including government of�cials, public-sector researchers, university professors and non-government researchers from Bhutan, Burkina Faso, Costa Rica, Côte d’Ivoire, Guatemala, Nepal, Rwanda and Uganda have designed new strategies to identify and access germplasm that is better adapted to climate changes.i The teams assessed the changing needs for national and foreign-sourced plant genetic resources for food and agriculture by analyzing past, current and future climate patterns in their national contexts. They have integrated these needs into new research and development strategies of national organizations responsible for the conservation and use of agrobiodiversity and climate change adaptation. As an example, in Burkina Faso, researchers acquired millet accessions better adapted to the changing climate based on an analysis of weather data collected over the last 30 years. They planned experiments, mobilized farmers and are now testing with farmers a number of promising new accessions from inside and outside Burkina Faso for current and future climate changes. In Uganda, a research team obtained bean and millet accessions with good adaptive potential from Kenya and Tanzania for on-station and on-farm testing.

131
Thought Pieces
Identifying best-bet portfolios
More ef�cient ways to identify ‘best-bet’ portfolios of diverse crops and crop varieties that are potentially adapted to changing conditions, can be produced sustainably and satisfy dietary demand.
‘Seeds for Needs’ is an innovative approach which introduces and tests demand-led crop diversity.ii A �rst step in this approach is identifying a range of varieties, sourced from international and national genebanks, breeding programmes, community seedbanks and farmers’ �elds, that could potentially be acceptable and suited to a given agroecological region. Farmers then test these varieties using a crowdsourced, citizen science approach called ‘tricot’ (triadic comparisons of technologies). Farmers receive packages of seeds with three different varieties and rank them as best, middle and worst for different traits. Each package contains a different combination of varieties. Simple formats and digital technologies mean that large numbers of farmers can participate in trials without being supervised. The farmer-generated data are then combined with environmental and socioeconomic data and analyzed using speci�c, novel statistical methods. The tricot approach has demonstrated how different varieties are differentially adapted to different growing conditions across large areas (14). Farmers are now adopting these better adapted varieties. The approach has been adopted by a number of large-scale initiatives in South Asia, East Africa (e.g. the Integrated Seed Sector Development programme in Ethiopia supported by the Dutch government) and Central America.
Novel and efficient distribution
Novel ways to ef�ciently distribute promising materials in suf�cient quantities to large numbers of farmers for evaluation, adoption and adaptation.
Between 2013 and 2017, the genebank of the World Vegetable Center and national partners distributed more than 42,000 seed kits of traditional African vegetables containing more than 183,000 vegetable seed samples to smallholder farmers in Tanzania, Kenya and Uganda. The seed kits contained seed samples of promising accessions and open-pollinated breeding lines of 23 traditional African vegetables, and to a lesser degree tomato, Capsicum pepper and soybean, usually enough to plant in a home garden (15). World Vegetable Center research teams are conducting seed tracer studies to determine by whom and how the seeds are used. The results of these studies will inform planned follow-up activities with farmers and national agricultural organizations to strengthen local seed systems, breeding efforts and seed production.
Innovative business models and value chains
Innovative seed business models and innovative seed value-chain mechanisms to respond to the demand for crops and crop varieties that create work and income generation opportunities, for example, through young seed entrepreneurship.
One of the major bottlenecks limiting farmers’ access to good-quality seed for food crops in Uganda is the shortage of early generation seed (breeder and foundation)iii to produce suf�cient quantities of certi�ed or quality-declared seed to satisfy the needs of farmers. The Integrated Seed Sector Development (ISSD) programme in Ugandaiv aims to increase the income of smallholder farmer households, especially women and youth in those households, and improve their household food and nutrition security. ISSD Uganda is focusing on piloting and scaling out new innovative public–private business models in a commercially sustainable manner. The programme is working with local seed businesses to produce quality seed of locally adapted crops and varieties for local markets. The programme has supported the development of guidelines of Quality Declared Seed (QDS)v for the marketing of seed produced by local seed businesses. To date, more than 260 local seed businesses have been established.
Empowerment of farmers
Empowerment of farmers and their organizations and effective implementation of their rights, to make their voices, needs and interests heard in national and international decision-making processes related to the management of plant genetic resources, seed system development, agricultural production and livelihoods.
The �rst community seedbank in Nepal was established in 1994 in Dalchowki, Lalitpur, with the support of USC Canada–Nepal.vi Currently there are 46 operational community seedbanks supported to varying degrees by national and international non-government organizations and by the government of Nepal. Networking among community seedbanks began about �ve years ago and members of several community seedbanks established an informal national community seedbank association. But in recent years the pace has been slow. In 2018, following the second national community seedbanks workshop in the country, Bioversity International and the leading Nepalese biodiversity research organization, the NGO Local Initiatives for Biodiversity, Research and Development (LI-BIRD), joined forces to strengthen the network, legalize it as an association, build its organizational capacity and develop a strategy and action plan. The government of Nepal has invited the association to formulate a number of policy recommendations that would create a more enabling

132
Agrobiodiversity Index Report 2019 – Risk and Resilience
institutional context for community seedbanks and their roles as key actors in the seed sector. Improved networking aims to address: the lack of coordination and mutual learning among key actors involved, the challenge of sustainability of community seedbanks, and the challenge of mainstreaming community seedbanks in national policy and law.
Local implementation of international and national policy
The effective implementation from community to subregional levels of international agreements and national policies and laws governing access to genetic resources and bene�t sharing, seed production and trade, and intellectual property in ways that support resilient seed systems in practice and not just on paper.
Resilient seed systems require revisions of current seed policies and laws in many countries that hinder, obstruct or criminalize farmer-led initiatives (9, 12). South Africa’s Department of Agriculture, Forestry and Fisheries (DAFF), through the National Plant Genetic Resources Centre (which houses the country’s national genebank) with technical support from Bioversity International, has initiated the implementation of a national strategy to establish and support community seedbanks. The aim is to support local smallholder communities to revive and improve their traditional seed-saving practices, add value to their local seeds (e.g. through seed production and marketing) and strengthen their food security, sustainable agriculture, conservation of agricultural biodiversity and adaptation to climate change. To date three pilot community seedbanks have been established managed by community members (16). The community seedbanks are securing improved access to and availability of diverse, locally adapted crops and varieties, and revaluing related indigenous knowledge and skills in planting management including seed selection, treatment, storage, multiplication and dissemination. They are effective means to implement the country’s national agrobiodiversity conservation policy.
In the coming years, the initiative will establish more new community seedbanks throughout the country supported by the National Plant Genetic Resources Centre. DAFF is using the achievements and lessons learned from the pilot phase to develop policies such as the ‘National plan for conservation and sustainable use for plant genetic resources for food and agriculture’. Its ‘Departmental strategy on conservation and sustainable use of genetic resources for food and agriculture’ proposes active roles for community seedbanks as part of a comprehensive strategy for conservation and sustainable use of plant genetic resources for food and agriculture. Adaptation to climate change is one of the government’s concerns regarding sustainable use. The government’s overall climate change response strategy has been laid out in a 2014 National Climate Change Response Plan White Paper. The White Paper identi�es involving local communities as one of the priorities.
Conclusion
Globally, there are strong voices and movements that demand healthier food systems. Healthy food systems depend on resilient seed systems. Such systems require much stronger support for farmer-based seed efforts along the whole seed value chain, development of best-bet portfolios of crops and crop varieties, innovative seed business models, novel and ef�cient seed distribution mechanisms, empowered farmers, and effective local implementation of global and national policies. Policymakers can use the concrete examples described in this chapter to make changes in seed systems towards resilience.
Notes
i This research was conducted in the context of a project supported by Bioversity International and the CGIAR Research Program on Climate Change, Agriculture and Food Security (CCAFS) (2011–2017).
ii www.bioversityinternational.org/seeds-for-needs/
iii Breeder seed: seed produced, usually in small quantity, by breeders based on own breeding efforts. Foundation seed: the offspring of breeder seed produced by a recognized seed producing unit in the public or private sector, usually in large quantity, for further testing on a large scale.
iv The Integrated Seed Sector Development programme is led by the Wageningen Centre for Development Innovation, Wageningen University and Research, and aims to support the development of a vibrant, pluralistic and market-oriented seed sector. The programme operates in several regions of Uganda, in close collaboration with the National Agricultural Research Organization and various partners.
v QDS, �rst introduced in 1993 by the Food and Agriculture Organization of the UN, are seeds subject to an alternative seed-quality assurance process, particularly designed for countries with limited resources, which is less demanding than full seed-quality control systems, but yet guarantees a satisfactory level of seed quality. For more information: http://www.fao.org/3/a0503e/a0503e00.htm and http://www.fao.org/3/a-i4916e.pdf
vi For the history of the Dalchowki community seedbank: https://www.bioversityinternational.org/�leadmin/user_upload/online_library/publications/pdfs/Community_Seed_banks/24.Nepal_Dalchowki_seedbank.pdf

133
Thought Pieces
References
1. Subedi A, De Boef W (2013) Seed Systems Analysis (SSA). ISSD Technical Notes. Issue No. 2. (Integrated Seed Sector Development Programme (ISSD)). Available at: http://www.issdseed.org/sites/default/�les/resource/issd_technical_note_2_-_seed_systems_analysis.pdf [Accessed December 17, 2018].
2. Abay F (2019) Women are key to resilient food systems as seed keepers in Ethiopia. Agrobiodiversity Index Report: Risk and Resilience, ed Bailey A (Bioversity International, Rome, Italy).
3. McGuire S, Sperling L (2016) Seed systems smallholder farmers use. Food Security 8(1):179–195.
4. van Berkum S, Dengerink J, Ruben R (2018) The Food Systems Approach: Sustainable Solutions for a Suf�cient Supply of Healthy Food (Wageningen University and Research).
5. Cabell JF, Oelofse M (2012) An indicator framework for assessing agroecosystem resilience. Ecology and Society 17(1):18.
6. McGuire S, Sperling L (2013) Making seed systems more resilient to stress. Global Environmental Change 23(3):644–653.
7. Mijatović D, Van Oudenhoven F, Eyzaguirre P, Hodgkin T (2013) The role of agricultural biodiversity in strengthening resilience to climate change: towards an analytical framework. International Journal of Agricultural Sustainability 11(2):95–107.
8. Vernooy R, Bessette G, Rudebjer P, Otieno G (2016) Resource box for resilient seed systems: Handbook. Available at: https://hdl.handle.net/10568/73256 [Accessed December 17, 2018].
9. Herpers S, Vodouhe R, Halewood M, De Jonge B (2017) The support for farmer-led seed systems in African seed laws. Synthesis paper. (ISSD Africa). Available at: http://www.issdseed.org/sites/default/�les/case/synthesis_paper_the_support_for_farmer-led_seed_systems_in_african_seed_laws_issd_africa_twg3.pdf [Accessed December 17, 2018].
10. Vernooy R (2016) Options for national governments to support farmer seed systems. The cases of Kenya, Tanzania and Uganda (Hivos and Bioversity International) Available at: https://www.bioversityinternational.org/�leadmin/user_upload/Options_for_national_Vernooy.pdf.
11. Vernooy R, Sthrestha P, Sthapit B eds. (2015) Community Seed Banks: Origins, Evolution and Prospects (Earthscan Routledge, London, UK).
12. Christinck A, Rattunde F, Kergna A, Mulinge W, Weltzien E (2018) Identifying Options for the Development of Sustainable Seed Systems-Insights from Kenya and Mali. Working Paper 165. (ZEF Center for Development Research University of Bonn). Available at: https://www.zef.de/uploads/tx_zefportal/Publications/ZEF_WP_165.pdf [Accessed December 17, 2018].
13. Frison E, Hodgkin T (2016) Strategic opportunities to strengthen community based approaches to seed
agrobiodiversity: Opportunities report Available at: https://futureoffood.org/report/the-future-of-food-seeds-of-resilience/opportunities-report/.
14. van Etten J, et al. (2019) Crop variety management for climate adaptation supported by citizen science. Proceedings of the National Academy of Sciences 116(10):4194–4199.
15. Stoilova T, van Zonneveld M, Roothaert R, Schreinemachers P Connecting genebanks to farmers in East Africa through the distribution of vegetable seed kits. Plant Genetic Resources: Characterization and Utilization:1–4.
16. Matelele LA, et al. (2018) Sharing diversity: exchanging seeds and experiences of community seed banks in South Africa (Bioversity International, Rome, Italy and Department of Agriculture, Forestry and Fisheries, Pretoria, Republic of South Africa). Available at: https://www.bioversityinternational.org/�leadmin/user_upload/Sharing_Matele_2018.pdf [Accessed March 15, 2019].

Cleaning and drying grains in the Tigray region, Ethiopia. Credit: Chiara Mancini
KEY MESSAGES:
> When making decisions about which crops to plant, farmers consider both how to maximize profits, and to minimize risks. They also have other goals in mind: diversifying crops to improve diets or selecting crop combinations that improve soil health, for example.
> Not only do farmers look at farm level but also at trends in their environment. Which crops are in demand? Which are more vulnerable to disease? Which command higher prices?
> In this paper, we explore options for a typical smallholder farmer making decisions on their farm in the context of different global trends with the aim of optimizing a variety of goals.
> One objective is to see how crop diversity can help the farmer reach their goals even when confronting different disturbances. The second is to quantify possible trade-offs and synergies between different goals, depending on the planting decisions.
Can crop diversity strengthen small-scale farmers’ resilience?Modelling future global biophysical and economic trends to understand individual farmers’ resilience options
Marta Kozicka, Jeroen C.J. Groot, Elisabetta Gotor
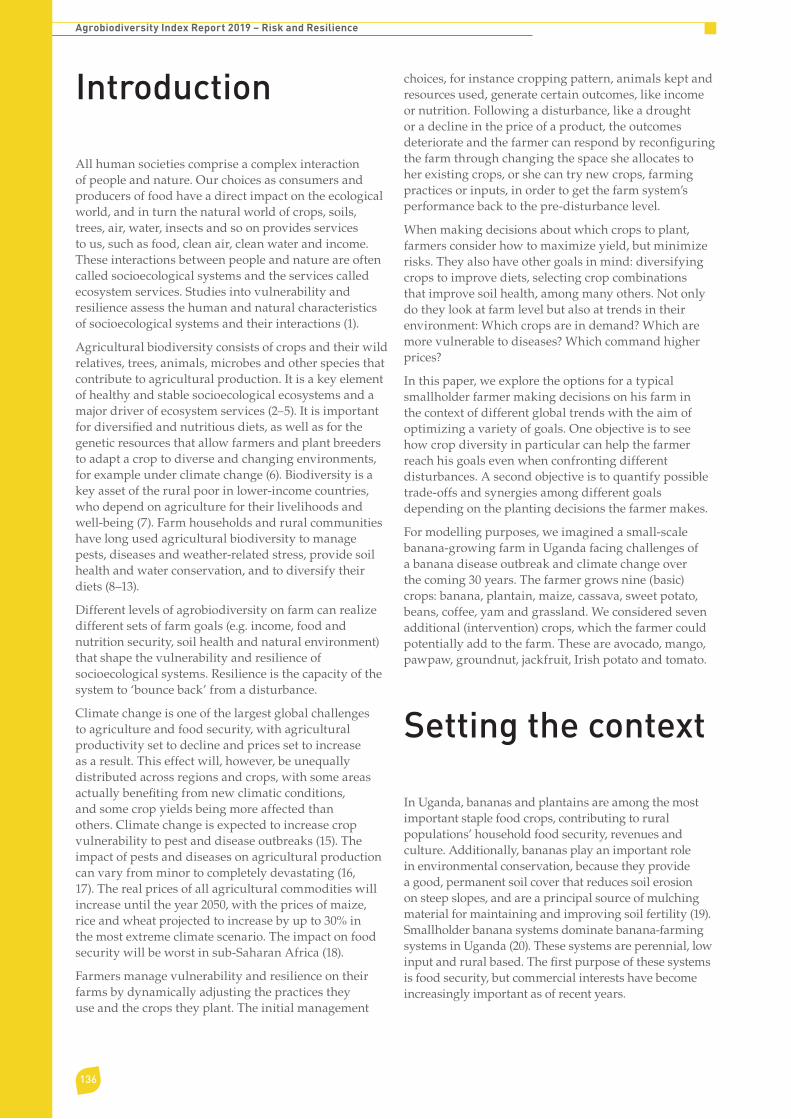
136
Agrobiodiversity Index Report 2019 – Risk and Resilience
Introduction
All human societies comprise a complex interaction of people and nature. Our choices as consumers and producers of food have a direct impact on the ecological world, and in turn the natural world of crops, soils, trees, air, water, insects and so on provides services to us, such as food, clean air, clean water and income. These interactions between people and nature are often called socioecological systems and the services called ecosystem services. Studies into vulnerability and resilience assess the human and natural characteristics of socioecological systems and their interactions (1).
Agricultural biodiversity consists of crops and their wild relatives, trees, animals, microbes and other species that contribute to agricultural production. It is a key element of healthy and stable socioecological ecosystems and a major driver of ecosystem services (2–5). It is important for diversi�ed and nutritious diets, as well as for the genetic resources that allow farmers and plant breeders to adapt a crop to diverse and changing environments, for example under climate change (6). Biodiversity is a key asset of the rural poor in lower-income countries, who depend on agriculture for their livelihoods and well-being (7). Farm households and rural communities have long used agricultural biodiversity to manage pests, diseases and weather-related stress, provide soil health and water conservation, and to diversify their diets (8–13).
Different levels of agrobiodiversity on farm can realize different sets of farm goals (e.g. income, food and nutrition security, soil health and natural environment) that shape the vulnerability and resilience of socioecological systems. Resilience is the capacity of the system to ‘bounce back’ from a disturbance.
Climate change is one of the largest global challenges to agriculture and food security, with agricultural productivity set to decline and prices set to increase as a result. This effect will, however, be unequally distributed across regions and crops, with some areas actually bene�ting from new climatic conditions, and some crop yields being more affected than others. Climate change is expected to increase crop vulnerability to pest and disease outbreaks (15). The impact of pests and diseases on agricultural production can vary from minor to completely devastating (16, 17). The real prices of all agricultural commodities will increase until the year 2050, with the prices of maize, rice and wheat projected to increase by up to 30% in the most extreme climate scenario. The impact on food security will be worst in sub-Saharan Africa (18).
Farmers manage vulnerability and resilience on their farms by dynamically adjusting the practices they use and the crops they plant. The initial management
choices, for instance cropping pattern, animals kept and resources used, generate certain outcomes, like income or nutrition. Following a disturbance, like a drought or a decline in the price of a product, the outcomes deteriorate and the farmer can respond by recon�guring the farm through changing the space she allocates to her existing crops, or she can try new crops, farming practices or inputs, in order to get the farm system’s performance back to the pre-disturbance level.
When making decisions about which crops to plant, farmers consider how to maximize yield, but minimize risks. They also have other goals in mind: diversifying crops to improve diets, selecting crop combinations that improve soil health, among many others. Not only do they look at farm level but also at trends in their environment: Which crops are in demand? Which are more vulnerable to diseases? Which command higher prices?
In this paper, we explore the options for a typical smallholder farmer making decisions on his farm in the context of different global trends with the aim of optimizing a variety of goals. One objective is to see how crop diversity in particular can help the farmer reach his goals even when confronting different disturbances. A second objective is to quantify possible trade-offs and synergies among different goals depending on the planting decisions the farmer makes.
For modelling purposes, we imagined a small-scale banana-growing farm in Uganda facing challenges of a banana disease outbreak and climate change over the coming 30 years. The farmer grows nine (basic) crops: banana, plantain, maize, cassava, sweet potato, beans, coffee, yam and grassland. We considered seven additional (intervention) crops, which the farmer could potentially add to the farm. These are avocado, mango, pawpaw, groundnut, jackfruit, Irish potato and tomato.
Setting the context
In Uganda, bananas and plantains are among the most important staple food crops, contributing to rural populations’ household food security, revenues and culture. Additionally, bananas play an important role in environmental conservation, because they provide a good, permanent soil cover that reduces soil erosion on steep slopes, and are a principal source of mulching material for maintaining and improving soil fertility (19). Smallholder banana systems dominate banana-farming systems in Uganda (20). These systems are perennial, low input and rural based. The �rst purpose of these systems is food security, but commercial interests have become increasingly important as of recent years.
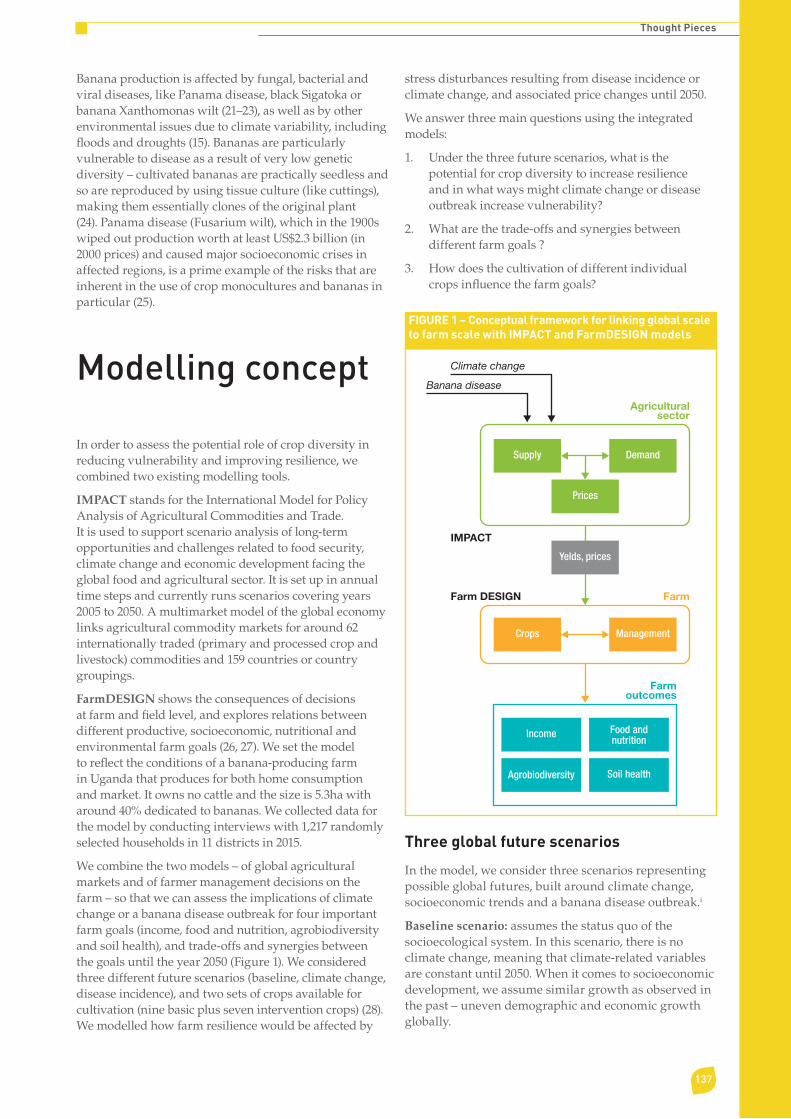
137
Thought Pieces
Banana production is affected by fungal, bacterial and viral diseases, like Panama disease, black Sigatoka or banana Xanthomonas wilt (21–23), as well as by other environmental issues due to climate variability, including �oods and droughts (15). Bananas are particularly vulnerable to disease as a result of very low genetic diversity – cultivated bananas are practically seedless and so are reproduced by using tissue culture (like cuttings), making them essentially clones of the original plant (24). Panama disease (Fusarium wilt), which in the 1900s wiped out production worth at least US$2.3 billion (in 2000 prices) and caused major socioeconomic crises in affected regions, is a prime example of the risks that are inherent in the use of crop monocultures and bananas in particular (25).
Modelling concept
In order to assess the potential role of crop diversity in reducing vulnerability and improving resilience, we combined two existing modelling tools.
IMPACT stands for the International Model for Policy Analysis of Agricultural Commodities and Trade. It is used to support scenario analysis of long-term opportunities and challenges related to food security, climate change and economic development facing the global food and agricultural sector. It is set up in annual time steps and currently runs scenarios covering years 2005 to 2050. A multimarket model of the global economy links agricultural commodity markets for around 62 internationally traded (primary and processed crop and livestock) commodities and 159 countries or country groupings.
FarmDESIGN shows the consequences of decisions at farm and �eld level, and explores relations between different productive, socioeconomic, nutritional and environmental farm goals (26, 27). We set the model to re�ect the conditions of a banana-producing farm in Uganda that produces for both home consumption and market. It owns no cattle and the size is 5.3ha with around 40% dedicated to bananas. We collected data for the model by conducting interviews with 1,217 randomly selected households in 11 districts in 2015.
We combine the two models – of global agricultural markets and of farmer management decisions on the farm – so that we can assess the implications of climate change or a banana disease outbreak for four important farm goals (income, food and nutrition, agrobiodiversity and soil health), and trade-offs and synergies between the goals until the year 2050 (Figure 1). We considered three different future scenarios (baseline, climate change, disease incidence), and two sets of crops available for cultivation (nine basic plus seven intervention crops) (28). We modelled how farm resilience would be affected by
stress disturbances resulting from disease incidence or climate change, and associated price changes until 2050.
We answer three main questions using the integrated models:
1. Under the three future scenarios, what is the potential for crop diversity to increase resilience and in what ways might climate change or disease outbreak increase vulnerability?
2. What are the trade-offs and synergies between different farm goals ?
3. How does the cultivation of different individual crops in�uence the farm goals?
FIGURE 1 – Conceptual framework for linking global scale to farm scale with IMPACT and FarmDESIGN models
Soil health
Food andnutrition
Farmoutcomes
Agriculturalsector
Farm
IMPACT
Climate change
Banana disease
Farm DESIGN
Income
Agrobiodiversity
ManagementCrops
DemandSupply
Prices
Yelds, prices
Three global future scenarios
In the model, we consider three scenarios representing possible global futures, built around climate change, socioeconomic trends and a banana disease outbreak.i
Baseline scenario: assumes the status quo of the socioecological system. In this scenario, there is no climate change, meaning that climate-related variables are constant until 2050. When it comes to socioeconomic development, we assume similar growth as observed in the past – uneven demographic and economic growth globally.

138
Agrobiodiversity Index Report 2019 – Risk and Resilience
Bad climate scenario: assumes severe climate change coupled with high unsustainable socioeconomic growth, producing high greenhouse gas emissions. The other factors are the same as in the baseline scenario.
Banana -50% scenario: assumes a banana disease outbreak that reduces banana and plantain yields annually by 50% in East Africa until 2050. The other factors are the same as in the baseline scenario.
The �rst step is to analyze these three scenarios with the IMPACT model to draw implications for the food sector, in particular crop productivity and food prices. The resulting sets of output levels and prices until 2050 are then introduced into the FarmDESIGN model to assess the consequences of possible farm con�gurations for revenues and allow calculation of trade-offs between various farm goals.
Farm outcomes and goals
We linked possible distributions of the farmland among crops (different farm con�gurations) to four desirable farm outcomes: high and stable income, food and nutrition, agrobiodiversity and soil health. We selected six indicators to measure (some aspects of) these outcomes that we considered to be important in the context of a small farm in Uganda (Table 1). Through modelling with FarmDESIGN we explored trade-offs and synergies between these goals.ii
High and stable income: We chose to maximize revenues from crops, and also to minimize variance of crop revenues because excessive food price volatility has broad negative consequences, primarily affecting poor producers and consumers, by elevating risks of future prices (29, 30). As a result of high volatility, net food producers, especially in low-income countries where financial markets do not function well, may lower their input use and consequently their agricultural output (31–33).
Nutrition security: We chose vitamin A yield as the nutrition security indicator. Vitamin A deficiency is considered one of the most prevalent micronutrient deficiencies worldwide, mainly affecting children in low-income countries (34). In East and Central Africa, the prevalence of vitamin A deficiency significantly exceeds the World Health Organization threshold of 15% (35). Vitamin A deficiency can be addressed through supplementation programmes (administering concentrated doses of vitamin A to at-risk populations), food fortification (adding micronutrients to food), and dietary diversification (adding naturally vitamin A-rich foods to diets). While all of these are valid approaches (36), the first two have generally proven difficult to implement in low-income countries such as Uganda. Dietary diversification is considered to be an intervention strategy that is sustainable without external support and can simultaneously combat multiple micronutrient deficiencies (37).
Crop diversity: We aim to maximize crop diversity on farm, because it is one strategy farmers use to strengthen resilience to climate change and pests. The contribution may arise from the choice of crop (climate- or pest-resistant, for example), the portfolio effect of having different crops which react differently to different disturbances, increasing the chances that not all crops are equally vulnerable, or from synergies between different crops (for example, growing nitrogen-fixing legumes like beans alongside pumpkins).
Soil health: When it comes to soil health, we focus on minimizing soil erosion while maximizing nitrogen balance. Soil erosion affects productivity negatively due to loss of nutrients, and has negative environmental consequences due to pollution of natural waters or adverse effects on air quality due to dust and emissions of gases (38). Soil nutrient depletion is one of the major causes of declining per capita food production in sub-Saharan Africa. Adequate soil management will be required to sustain food security in the light of increasing population densities (39).
TABLE 1 – Farm goals and indicators to measure them used in modelling with FarmDESIGN.
Farm goals Indicators
High and stable income Maximize revenues from crops
Minimize variance of crop revenues
Nutrition security Maximize vitamin A yield
Crop diversity Maximize crop diversity measurement (Shannon index)
Soil health Maximize farm nitrogen balance
Minimize erosion potential
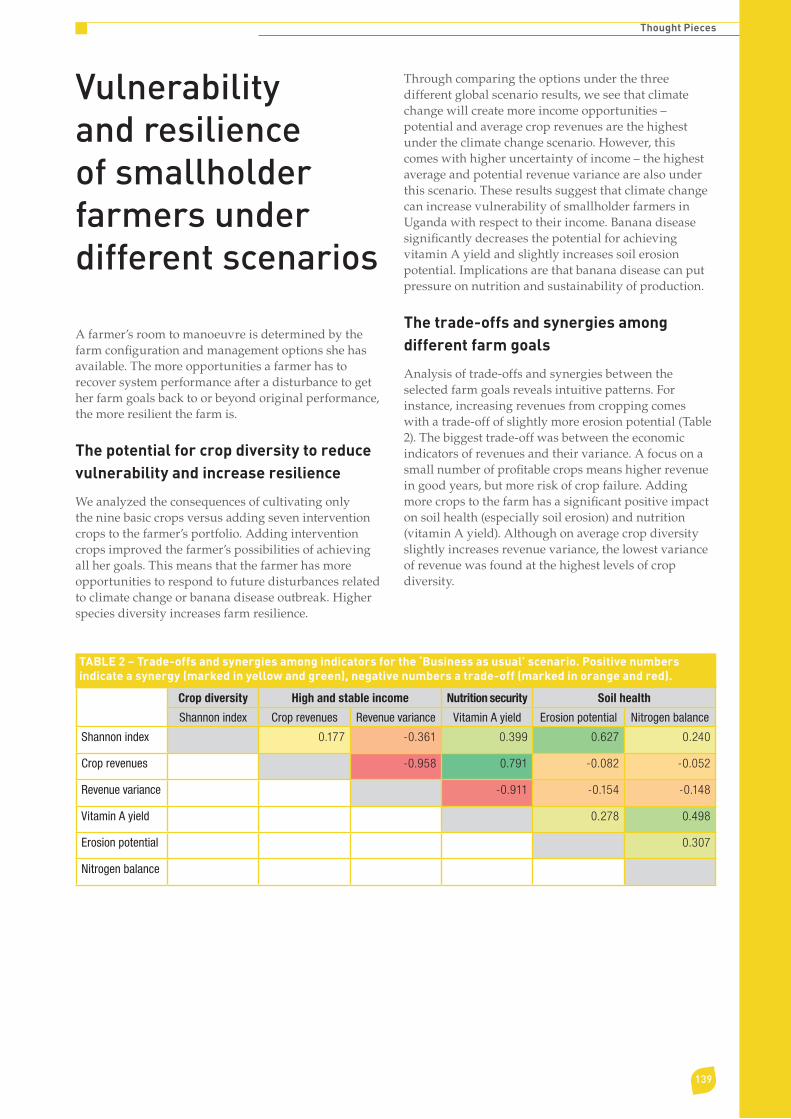
139
Thought Pieces
Vulnerability and resilience of smallholder farmers under different scenarios
A farmer’s room to manoeuvre is determined by the farm con�guration and management options she has available. The more opportunities a farmer has to recover system performance after a disturbance to get her farm goals back to or beyond original performance, the more resilient the farm is.
The potential for crop diversity to reduce vulnerability and increase resilience
We analyzed the consequences of cultivating only the nine basic crops versus adding seven intervention crops to the farmer’s portfolio. Adding intervention crops improved the farmer’s possibilities of achieving all her goals. This means that the farmer has more opportunities to respond to future disturbances related to climate change or banana disease outbreak. Higher species diversity increases farm resilience.
Through comparing the options under the three different global scenario results, we see that climate change will create more income opportunities – potential and average crop revenues are the highest under the climate change scenario. However, this comes with higher uncertainty of income – the highest average and potential revenue variance are also under this scenario. These results suggest that climate change can increase vulnerability of smallholder farmers in Uganda with respect to their income. Banana disease signi�cantly decreases the potential for achieving vitamin A yield and slightly increases soil erosion potential. Implications are that banana disease can put pressure on nutrition and sustainability of production.
The trade-offs and synergies among different farm goals
Analysis of trade-offs and synergies between the selected farm goals reveals intuitive patterns. For instance, increasing revenues from cropping comes with a trade-off of slightly more erosion potential (Table 2). The biggest trade-off was between the economic indicators of revenues and their variance. A focus on a small number of pro�table crops means higher revenue in good years, but more risk of crop failure. Adding more crops to the farm has a signi�cant positive impact on soil health (especially soil erosion) and nutrition (vitamin A yield). Although on average crop diversity slightly increases revenue variance, the lowest variance of revenue was found at the highest levels of crop diversity.
TABLE 2 – Trade-offs and synergies among indicators for the ‘Business as usual’ scenario. Positive numbers indicate a synergy (marked in yellow and green), negative numbers a trade-off (marked in orange and red).
Crop diversity High and stable income Nutrition security Soil health
Shannon index Crop revenues Revenue variance Vitamin A yield Erosion potential Nitrogen balance
Shannon index 0.177 -0.361 0.399 0.627 0.240
Crop revenues -0.958 0.791 -0.082 -0.052
Revenue variance -0.911 -0.154 -0.148
Vitamin A yield 0.278 0.498
Erosion potential 0.307
Nitrogen balance

140
Agrobiodiversity Index Report 2019 – Risk and Resilience
Influence of different crops on the farm goals?
Finally, we analyze how each crop impacts the farm goals (Table 3). Correlations between areas of speci�c crops and the performance indicators can be used to inform farmers about the consequences of their planting choices. The production of yam was strongly correlated with crop revenues, but would also lead to higher erosion potential and variance of revenues, hence more economic and environmental risks for farmers. Tomato cultivation could contribute strongly to vitamin A yield
and the nitrogen balance of the farm, while generating signi�cant but volatile revenues. The worst performing crops from an economic, environmental and nutritional perspective were groundnut, beans and coffee. Introduction of the new, intervention crops (marked in grey), would positively in�uence crop diversity (increase Shannon index).
TABLE 3 – Correlations between the area of different crops and the performance indicators (sorted by declining correlation with crop revenues) for the ‘Business as usual’ scenario.
Crop Crop diversity High and stable income Nutrition security Soil health
Shannon index Crop revenues Revenue variance Vitamin A yield Erosion potential Nitrogen balance
Yam -0.151 0.861 0.684 0.408 0.496 -0.380
Tomato 0.288 0.560 0.717 0.923 -0.302 0.696
Avocado 0.568 0.519 0.605 0.424 -0.348 -0.162
Pawpaw 0.598 0.459 0.629 0.729 -0.517 0.387
Mango 0.585 0.337 0.511 0.639 -0.548 0.449
Jackfruit 0.741 0.134 0.298 0.344 -0.627 0.228
Grassland -0.066 0.102 0.080 0.074 0.085 -0.013
Cassava -0.024 0.025 0.022 0.047 0.115 0.115
Irish potato 0.387 -0.022 0.045 0.075 -0.132 0.115
Maize -0.100 -0.150 -0.295 -0.485 0.484 -0.638
Plantain 0.253 -0.159 -0.009 0.054 -0.683 0.295
Sweet potato -0.027 -0.169 -0.161 -0.109 -0.059 0.031
Sweet bananas 0.639 -0.179 0.029 0.192 -0.739 0.517
Coffee 0.143 -0.309 -0.281 -0.388 -0.540 -0.519
Beans -0.656 -0.487 -0.674 -0.747 0.617 -0.450
Groundnut -0.128 -0.634 -0.571 -0.328 0.207 0.532
The intensity of a colour indicates the strength of correlation between a crop area and a performance indicator. Shades of green are assigned to positive (desirable) impacts and shades of red to negative (disadvantageous) impacts.

141
Thought Pieces
Conclusions: What does this mean for farmers and policymakers?
This study contributes to an important discussion on trade-offs between various objectives related to agricultural production, keeping in mind the complexity of a farm as an agroecological system and the complexity of human needs, going beyond calories and income. We analyze farm-level goals in the light of global challenges to agricultural production of the future. We show that crop diversity can signi�cantly improve resilience to climate change and banana disease of a small farm in Uganda over the next 30 years.
Modelling different scenarios, different crop con�gurations and different goals is important for farmers and policymakers when making decisions to achieve short- and long-term goals in dynamic situations of change. This kind of exercise can be used at a national or regional level by those designing policies to reach multiple goals (nutrition, soil health, revenue etc). It can also be useful for farmers to help design their farms to better meet their complex needs.
The models indicate that increasing crop diversity is generally a good strategy – it leads to more resilience, better soil health, more stable income and better nutrition. However, decision-makers need to be mindful of the trade-offs between different objectives. Increasing the number of cultivated crops will improve most farm-level goals, but will not achieve the highest potential income. On the other hand, growing a small selection of the most pro�table crops maximizes potential revenues, but also increases risk, due to their volatility. Since banana disease and climate change can have a negative impact on nutrition and soil productivity, diversity-maximizing polices supporting these outcomes will be very relevant.
This example of modelling a smallholder banana farm in Uganda is relevant elsewhere. In the framework of Agenda 2030, in which the Sustainable Development Goals are “an indivisible whole” policymakers need solutions which combine economic prosperity, social justice and environmental protection. Integrating models that combine on-farm decision-making with global agricultural market trends is an approach that can be used in low-, middle- and high-income countries to understand how to generate synergies and manage trade-offs so that global goals of crop diversity conservation, nutrition, environmental protection and human nutrition can be considered and managed together. For smallholders and actors working with them, analyses of trade-offs and synergies open spaces for increasing resilience at a farm-household level that link up to strengthen resilience at regional and global levels.
142
Agrobiodiversity Index Report 2019 – Risk and Resilience
Notes
i This methodology is called scenario analysis. It is different from forecasting, which should take into account all important factors that will affect food supply, demand and governance in the future. These factors are very dif�cult or impossible to predict over the next decades. On the contrary, scenario analysis uses information about the current dynamics of the food system to understand how possible future changes of the major drivers, grouped into scenarios, could affect the food system. Scenarios are different, internally consistent narratives about the future (40).
ii Crop revenues were calculated based on the market prices generated in IMPACT. Production costs were not taken into account. Nutrients produced on 1ha of every crop were calculated based on the food composition table for Central and Eastern Uganda (41). Soil erosion was calculated based on the crop cover factor (C-factor) of the Revised Universal Soil Loss Equation (RUSLE). The C-factor links soil loss to land cover and land management and is independent of the environmental conditions (42, 43). Nitrogen balance was calculated based on data on the nitrogen content of farm inputs and crop products using food composition tables of HarvestPlus and USDA (41, 44). The Shannon diversity index (H) was used as an indicator of crop diversity. It quanti�es the ecological diversity and ‘evenness’ of distribution of species in a farm (measured as a farm’s frequency distribution). H = 0 if there is only one species on the farm and H reaches its maximum when each species occupies the same area on the farm. Thus, a monoculture results in a low value for the Shannon index (38).
References
1. Gallopín GC (2006) Linkages between vulnerability, resilience, and adaptive capacity. Global Environmental Change 16(3):293–303.
2. Duncan C, Thompson JR, Pettorelli N (2015) The quest for a mechanistic understanding of biodiversity-ecosystem services relationships. Proceedings Biological Sciences 282(1817):20151348.
3. Hooper DU, et al. (2012) A global synthesis reveals biodiversity loss as a major driver of ecosystem change. Nature 486(7401):105–108.
4. Love B, Spaner D (2007) Agrobiodiversity: its value, measurement, and conservation in the context of sustainable agriculture. Journal of Sustainable Agriculture 31(2):53–82.
5. FAO (Food and Agriculture Organization) (2019) The State of the World’s Biodiversity for Food and Agriculture eds Belanger J, Pilling D (FAO Commission on Genetic Resources for Food and Agriculture Assessments, Rome, Italy) Available at: http://www.fao.org/3/CA3129EN/CA3129EN.pdf.
6. Fowler C, Hodgkin T (2004) Plant genetic resources for food and agriculture: assessing global availability. Annual Review of Environment and Resources 29(1):143–179.
7. Jarvis D, Sthapit B, Sears L (2000) Conserving Agriculture Biodiversity in Situ: A Scienti�c Basis for Sustainable Agriculture (International Plant Genetic Resources Institute, Rome).
8. Di Falco S, Chavas J-P (2009) On crop biodiversity, risk exposure, and food security in the highlands of Ethiopia. American Journal of Agricultural Economics 91(3):599–611.
9. Bellon MR (2004) Conceptualizing interventions to support on-farm genetic resource conservation. World Development 32(1):159–172.
10. Jarvis DI, et al. (2008) A global perspective of the richness and evenness of traditional crop-variety diversity maintained by farming communities. Proceedings of the National Academy of Sciences 105(14):5326–5331.
11. Johns T, Sthapit BR (2004) Biocultural diversity in the sustainability of developing-country food systems. Food and Nutrition Bulletin 25(2):143–155.
12. Bélanger J, Johns T (2008) Biological diversity, dietary diversity, and eye health in developing country populations: establishing the evidence-base. EcoHealth 5(3):244–256.
13. Hajjar R, Jarvis DI, Gemmill-Herren B (2008) The utility of crop genetic diversity in maintaining ecosystem services. Agriculture, Ecosystems & Environment 123(4):261–270.
14. Darnhofer I, Fairweather J, Moller H (2010) Assessing a farm’s sustainability: insights from resilience thinking. International Journal of Agricultural Sustainability 8(3):186–198.
15. Rosenzweig C, Iglesius A, Yang XB, Epstein PR, Chivian E (2001) Climate change and extreme weather events - Implications for food production, plant diseases, and pests. Global Change & Human Health 2(2):90–104.
16. Oerke EC (2006) Crop losses to pests. The Journal of Agricultural Science 144(1):31.
17. Strange RN, Scott PR (2005) Plant Disease: A Threat to global food security. Annual Review of Phytopathology 43(1):83–116.
18. Ignaciuk A, Mason-D’Croz D (2014) Modelling adaptation to climate change in agriculture (Paris) doi:https://doi.org/10.1787/5jxrclljnbxq-en.
19. Kalyebara MR, et al. (2006) Economic importance of the banana bacterial wilt in Uganda. African Crop Science Journal 14(2):93–103.

143
Thought Pieces
20. Kikulwe E, et al. (2018) Does gender matter in effective management of plant disease epidemics? Insights from a survey among rural banana farming households in Uganda. Journal of Development and Agricultural Economics 10(3):87–98.
21. Butler D (2013) Fungus threatens top banana. Nature 504(7479):195.
22. Jesus Júnior WC de, et al. (2008) Worldwide geographical distribution of Black Sigatoka for banana: predictions based on climate change models. Scientia Agricola 65(spe):40–53.
23. Smith JJ, Jones DR, Karamura E, Blomme G, Turyagyenda FL (2008) An analysis of the risk from Xanthomonas campestris pv. musacearum to banana cultivation in Eastern, Central and Southern Africa (Montpellier, France).
24. Ordonez N, et al. (2015) Worse comes to worst: Bananas and Panama Disease—when plant and pathogen clones meet. PLOS Pathogens 11(11):e1005197.
25. Ploetz RC (2005) Panama disease: An old nemesis ACrears its ugly head: Part 1. The beginnings of the banana export trades. Plant Health Progress 6(1):18.
26. Groot JCJ, Cortez-Arriola J, Rossing WAH, Massiotti RDA, Tittonell P (2016) Capturing agroecosystem vulnerability and resilience. Sustainability 8(11):1–12.
27. Groot JCJ, Oomen GJM, Rossing WAH (2012) Multi-objective optimization and design of farming systems. Agricultural Systems 110:63–77.
28. Robinson S, et al. (2015) The international model for policy analysis of agricultural commodities and trade (IMPACT): Model description for version 3. (November). IFPRI Discussion Paper No. 01483. International Food Policy Research Institute.
29. von Braun J, Tadesse G (2012) Global Food Price Volatility and Spikes: An Overview of Costs, Causes, and Solutions ZEF- Discussion Papers on Development Policy No. 161, Center for Development Research, Bonn.
30. Kalkuhl M, Kornher L, Kozicka M, Boulanger P, Torero M (2013) Conceptual Framework on Price Volatility and its Impact on Food and Nutrition Security in the Short Term. FOODSECURE working paper no. 15. The Hague: LEI Wageningen UR
31. Binswanger HP, Rosenzweig MR (1986) Behavioural and material determinants of production relations in agriculture. Journal of Development Studies 22(3):503–539.
32. Donato R, Carraro A (2015) Modelling Acreage, Production and Yield Supply Response to Domestic Price Volatility. 2015 Fourth Congress, June 11-12, 2015, Ancona, Italy.
33. Haile MG, Kalkuhl M, von Braun J (2014) Inter- and intra-seasonal crop acreage response to international food prices and implications of volatility. Agricultural Economics 45:1–18.
34. Wirth J, et al. (2017) Vitamin A supplementation programs and country-level evidence of Vitamin A deficiency. Nutrients 9(3):190.
35. WHO (World Health Organization) (2009) Global prevalence of vitamin A deficiency in populations at risk 1995–2005. WHO Global Database on Vitamin A Deficiency (Geneva, Switzerland).
36. Chakravarty I (2000) Food-based strategies to control Vitamin A deficiency. Food and Nutrition Bulletin 21(2):135–143.
37. Tontisirin K, Nantel G, Bhattacharjee L (2002) Food-based strategies to meet the challenges of micronutrient malnutrition in the developing world. Proceedings of the Nutrition Society 61:243–250.
38. Lal R (1998) Soil erosion impact on agronomic productivity and environment quality. Critical Reviews in Plant Sciences 17(4):319–464.
39. Drechsel P, Gyiele L, Kunze D, Cofie O (2001) Population density, soil nutrient depletion, and economic growth in sub-Saharan Africa. Ecological Economics 38(2):251–258.
40. Wilkinson A, Kupers R The essence of scenarios : learning from the Shell experience. Amsterdam: Amsterdam University Press.
41. Hotz C, Abdelrahman L, Sison C, Moursi M, Loechl C (2012) A Food Composition Table for Central and Eastern Uganda (HarvestPlus, Washington DC and Cali).
42. Renard KG, Foster GR, Weesies GA, et al. (1991) RUSLE Revised universal soil loss equation. Journal of Soil and Water Conservation 46(1):30–33.
43. Renard KG, Foster GR, Weesies GA, Mccool DK, Yoder DC (1997) Predicting Soil Erosion by Water: A Guide to Conservation Planning with the Revised Universal Soil Loss Equation (RUSLE) USDA.
44. USDA. USDA Food Composition Databases. Software developed by the National Agricultural Library v.3.9.5.2_2019-05-07. https://ndb.nal.usda.gov/ndb/

Farmer displays quinoa varieties at a diversity fair, Bolivia. Farmers obtain seeds from diverse sources through different mechanisms. 60%-90% of the seeds on which smallholder farmers in low-income countries depend is saved on farm or obtained through local distribution channels. Credit: Bioversity International/S. Padulosi

KEY MESSAGES:
> China is facing risks of a growing population, deterioration of agricultural lands, poor nutrition and poverty.
> China is one of the centres of diversity for the world’s crops and still maintains high levels of between-species and within-species diversity.
> Crop diversity represents a potential resource, which can be used to promote healthy, diverse diets, income-generation opportunities and low-input agricultural practices.
> Crop diversity is threatened by climate change, expansion of modern agriculture, insufficient exploration of crop collections, and gaps in the Chinese crop genetic resource management system.
> In response, China is taking several measures to reduce risks to its valuable crop diversity, which we outline here.
Crop genetic resources manage risks in China. How to manage risks to crop genetic resources?Xu Liu and Zongwen Zhang
Crop genetic resources manage risks
China is facing risks of a growing population, deterioration of agricultural lands, poor nutrition and
China is one of the centres of diversity for the world’s crops and still maintains high levels of
in China. How to manage risks to crop Crop genetic resources manage risks in China. How to manage risks to crop Crop genetic resources manage risks in China. How to manage risks to crop Crop genetic resources manage risks Crop genetic resources manage risks

146
Agrobiodiversity Index Report 2019 – Risk and Resilience
What risks does China face?
1.3 billion of the world’s 7.7 billion people live in China. With so many people to feed, the country cultivates 120 million hectares of land (twice the size of Ukraine or Madagascar) and in 2016 produced 61.6 million tonnes of food. The population in China is estimated to reach 1.6 billion by 2030, when food demand will be 73.6 million tonnes (1). Current food production needs to increase by 1% every year to meet these food requirements.
For a long time, China attempted to increase crop productivity by increasing inputs and enlarging the area of cultivation. Doing so has inevitably overused natural resources and resulted in deterioration of the land and environment. For example, water used in agriculture accounted for over 60% of total water usage in the country, however, only about 50% was effectively used by crops, while another 50% was lost due to improper irrigating methods and poor diversion canals (2). China applied 59.9 million tonnes of chemical fertilizers in 2016 (3), which was more than 30% of all the fertilizers used worldwide (4). Green development with reduced inputs is becoming an urgent requirement in Chinese agriculture.
Currently, 30.6% of Chinese people over 18 years old are overweight (5, 6). The prevalence of hypertension is 25.2%, and that of diabetes 9.7%. All these rates are on the rise (7). Many of these problems are caused by lack of micronutrients critical for health. To address this growing problem, China issued a National Nutrition Plan in 2017, which proposes to vigorously promote nutritional agricultural products, especially organic, green and pollution-free food, as well as double-protein (soybean and milk) foods. It also promotes good health through diets, including traditional health-preserving foods (8), such as buckwheat and oats which can help improve body functions.
The Chinese government is making concerted efforts to eliminate poverty in the country. However, while the proportion of poor people has plummeted since the 1990s, there were still an estimated 43.4 million poor in 2016, mainly living in marginal rural areas inland and dependent on agriculture for a living (9). Farmers are now being helped to develop special high-quality agricultural products so that they can increase their incomes. The focus of farming production is shifting from increasing productivity to increasing effectiveness. The value chain linking farmers’ production to processing and markets is key to adding more value to agricultural products so that they earn higher incomes.
What role can genetic diversity play in managing these risks?
High levels of genetic diversity in China are potential resources to manage the four risks of growing population, deteriorating environment, poor nutrition, and poverty, and turn them into opportunities:
• Nutrient-dense diverse species and varieties of crops are available which constitute an opportunity to contribute to healthy diets
• Income generation opportunities by using special local crops, varieties or even landscapes to produce organic or ecological products to meet market demand
• Resources for agroecological intensi�cation by adapting a diversity of species, varieties or both to address climate change and increase yields
• Green development with low inputs by using landraces to produce organic or ecological products for sustainable agriculture.
Each of these opportunities requires access and availability of crop genetic diversity and knowledge – scienti�c and traditional – about them and how to use them.
Crop genetic resources in China
China is recognized as one of the centres of origin of many of the world’s crops. Over 10,000 plant species have been used by Chinese people to support their livelihoods in their long history (10). Currently, 3,528 plant species are used in food and agriculture, including 1,356 cultivated species and 2,172 wild species of crops (Table 1) (11). Among these species, about 350 were domesticated in China (12). Grain crops, such as rice, wheat and maize, are the staple food crops in China. There are also numerous minor grain crops such as barley, buckwheat, millets, oat, sorghum and beans.

147
Thought Pieces
Each species contains high levels of within-species diversity too. China conserves these precious genetic resources through a national system with two complementary realms: in situ and ex situ.
In situ conservation refers to conservation in a plant’s natural habitat, be that the wild or a farmer’s �eld, so that the plant continues to evolve. As a centre of diversity, China is home to many naturally occurring populations of relatives of important crops, which may contain traits useful in breeding programmes. Efforts have been made to set up protected sites for many of these (13). By the end of 2017, China had established 206 protected sites in 27 provinces, in which 69 species of crop wild relatives are being conserved.
For ex situ conservation (collecting samples of seeds and safeguarding them in offsite facilities, e.g. in a seedbank), China has conducted two large-scale collecting missions, the �rst in the 1950s and the second in the 1980s. A third national collecting mission is in progress at the moment. The seeds are stored in a network of national and local genebanks.
Through these collecting activities, a total of 481,000 samples of 350 crops have been collected and their basic ‘passport’ information (e.g. origin, species, source) documented (11, 14). About 85% of these are landraces (farmer-bred, ancient varieties).
It is possible that these crops contain useful characteristics to help China reduce the risks associated with a growing population, poor diets, environmental degradation and poverty. For example, naturally occurring resistance to pests and diseases or to conditions such as �ooding, cold or salinity, can stabilize yields under dif�cult conditions and reduce the need for chemical inputs.
Over 62% of the crop samples conserved in China’s genebanks have been evaluated for resistance to pests and diseases, 57% for nutrient content, and 43% for resistance to drought, wet, cold, salinity or a combination of these (15).
Collecting and evaluating crop genetic materials is not the end of the story. If these materials are going to realize their potential in addressing China’s challenges, they need to be used. The main users in China are breeders, who screen samples to �nd potential parents of future varieties. Farmers and companies also use varieties directly in their �elds, public organizations for education and research, and museums as specimens (16). Since 2001, over 245,900 samples have been multiplied and made available through genebanks. They have distributed 273,900 samples to users based in 5,504 units across China (15) and more than 40,000 samples of various crops have been provided to foreign users and international organizations (11).
Risks to crop genetic resources in China
Despite the potential of genetic diversity to help China to address the risks of poor diets, environmental degradation, growing population and rural poverty, this diversity itself is at risk for several reasons:
1. Crops are no longer performing well in their original environments because of climate change
Climate change has resulted in temperature rises, increased evaporation from the earth’s surface, aggravated drought, changing environments and increasing damage by pests and diseases. The average annual surface air temperature in China has increased by 0.79oC in the last 100 years (17). Consequently, climate change has had serious impacts on crop production. For example, a severe frost in the southern area of the Yangtze River in 2008 seriously damaged local crop
TABLE 1 – Number of species of cultivated and wild species used for food and agriculture in China
Categories Cultivated species Crop wild relatives Total
Grain crops 103 311 414
Cash crops 98 454 552
Fruits 149 420 569
Vegetables 222 150 372
Forage and green manure 196 353 549
Others 588 484 1072
Total 1,356 2,172 3,528

148
Agrobiodiversity Index Report 2019 – Risk and Resilience
production, while a drought in the north of Hubei province in April–May 2011 delayed the time for rice transplanting and seeding for other crops, so that yields of these crops were dramatically reduced (18).
Climate changes in some areas are having a positive impact. For example, the northern limit for planting rice, wheat and maize has extended further north due to temperature increases. However, this still requires a change in genetic resource strategy. Early maturing varieties have been replaced by mid or late varieties, which are better adapted to the longer growing period (18).
Climate change may threaten in situ conservation of crop wild relatives through drought, �oods and frosts. During a long drought in Yunnan over the last decade, many crop wild relative populations decreased dramatically (11). For example, there were many sites where wild species of rice (Oryza spp.) could be found in Yunnan Province. After a decade of drought, Oryza ru�pogon sites were reduced from 26 sites to two, O. of�cinalis from 13 to two, and O. meyeriana reduced from 105 sites to 35 (19).
2. The rapid development of modern agriculture is causing loss of crop diversity managed by farmers on farm
In the last 30 years, modern agriculture has developed very fast in China. For major crops such as rice, wheat, maize and soybean, many farmer varieties were replaced by modern ones. The number of varieties used in production has decreased dramatically. With the change of planting patterns and land use, many farmer varieties have disappeared. Some of which had been cultivated for several hundred years no longer exist.
A survey in 79 counties of Hunan Province found that there were 1,366 farmer varieties of rice grown in 1956, which dwindled to 644 by 1981 and only 84 by 2014, accounting for a 90% loss (20) (Figure 1). In addition, hybrid maize is now grown at higher altitudes and latitudes taking over the area planted to farmer varieties and leading to a decrease of minor crops directly managed by farmers (21).
3. Insuf�cient exploration of the values of crop collections is leading to unrealized potential of crop genetic resources
As mentioned above, China has characterized and evaluated important agronomic traits of its genetic resource collection. Many elite resources have been identi�ed and made available to breeders and other users (11). However, compared with the huge size of the collections, efforts to evaluate valuable traits have been insuf�cient, mainly because of a lack of coordination and funds (11). Another reason for underuse of crop genetic resources in collections is that multilocation evaluations are lacking, so we only know how they perform in a limited number of environments. In addition, breeding organizations and enterprises did not actively participate in the evaluation work, and so the putative values of crop germplasm for breeding and production have not been explored and demonstrated.
4. Gaps in China’s crop genetic resource management system mean that crop collections are insecure
With the support of the Ministry of Agriculture and Rural Affairs, China has established a national system of crop genetic resource conservation and research, coordinated by the Chinese Academy of Agricultural Sciences (CAAS) with the participation of relevant provincial academies of agricultural sciences and universities. However, it lacks an effective mechanism for managing and coordinating the system. Although CAAS has strong technical functions in coordination and management, it has no direct administrative relations with many mid-term genebanks and �eld genebanks. Management is largely dependent on projects and lacks a long-term �nancial mechanism. Therefore, the management of these genebanks is constrained by local development plans. For example, in one case a �eld genebank had to be moved due to building a road for local development. These kinds of disruption can lead to the loss of genetic resources.
FIGURE 1 – Farmer rice varieties on farm in Hunan province have decreased dramatically since 1956
0
200
1956 1981Year
400
600
800
1000
1200
1400
1600
2014

149
Thought Pieces
What is China doing to minimize risks to the conservation and use of crop genetic resources?
Recognizing the risks to crop genetic resources, China has been running comprehensive national programmes to improve the conservation and use of crop genetic resources. The programmes were mainly supported by the Ministry of Agriculture and the Ministry of Science and Technology and implemented by the Institute of Crop Sciences of CAAS with participation of organizations who hold mid-term genebanks and �eld genebanks and those maintaining local genebanks at different provinces.
Enhanced in situ conservation and on-farm management to improve the adaptability of crops and varieties no longer performing well in their original environments because of climate change
Strengthened in situ conservation and monitoring for crop wild relatives
Establishment of protected sites in situ has been strengthened for crops originating in China such as soybean, buckwheat and millets. At the same time, efforts have been made to link the conservation of crop wild relatives with sustainable use of these natural resources for livelihoods by reducing farmers’ dependence on the habitat where crop wild relatives grow, and providing alternative pathways out of poverty, including �nancial support for developing livelihoods. One example is that human pressures on the environments of wild rice, wild soybean and wild relatives of wheat were reduced in eight provinces, through improved policy options, infrastructure, �nancial incentives and awareness raising for communities near the sites (13).
Strengthened on-farm management of farmers’ ancient landraces
The Ministry of Agriculture has supported a national programme for screening farmer varieties of different crops to identify varieties with special traits for
developing products. The National Chinese Pear Repository provided the traditional pear varieties, Golden pear and Cuiguan pear to farmers in Enshi in Hubei province, which greatly improved the income of farmers who adopted these local varieties. Development of value chains and business models, including organic, special and nutritional products, for Wuchang rice, Nanfeng orange, and Laiyang pear, succeeded by establishing geographical indication certi�cation. This has made great contributions to farmers’ incomes.
Enhanced exploration and collecting activities to safeguard crop diversity against the continuous loss resulting from modern agricultural practices
The Ministry of Agriculture has been strengthening nationwide comprehensive surveys and systematic collecting of crop genetic resources. The priority is to conduct the current third national survey and collection of crop germplasm resources with a focus on remote areas, mountainous areas and the western part of China. Since 2015, surveys and collecting have been completed in 12 provinces including 830 counties, from which some 31,000 samples of various crop species have been collected, including grain crops, vegetables, fruits and medicinal plants. 85% of these are farmer varieties with elite characteristics (14). For example, 4,800 accessions collected in Guizhou Province were evaluated and 150 accessions were found resistant to various diseases or to have stress resistance, superior quality, early maturing or high-yield potential, which will be valuable for breeding and other research and use (22).
Enhanced research into identification and use of elite planting materials to increase use
To demonstrate the value of crop genetic resources, China is strengthening research capacity for identi�cation of crop genetic resources. For phenotypic characterization (i.e. assessing how different crop varieties perform under different conditions), major traits have been recorded for all the crop samples stored in the national genebank. Evaluation of resistance to pests and diseases as well as abiotic stresses such as drought, wet and cold were conducted on the collections of rice, wheat, maize, soybean, cotton, oilseed and vegetables. Through multilocation trials, more than 10,000 samples of these crops were evaluated to identify elite germplasm for the needs of breeding (14). Catalogues listing all the genetic information of these crops have been produced, and all data are now documented in a National Crop Germplasm Information System for ease of access (11,14).
For genotypic evaluation (i.e. the genetic pro�le of crop varieties), biotechnology has been used in genetic diversity analysis to understand the origins
150
Agrobiodiversity Index Report 2019 – Risk and Resilience
and evolutionary pathways of important crops and to identify useful traits for crop improvement (23). With various molecular markers, genetic diversity was analyzed for rice (24), wheat (25) and maize (26). Cloning has been successfully carried out of 237 genes associated with important agronomic traits of rice, wheat and maize, which provide a pathway for genetic improvement in these crops (11). Twelve thousand genes associated with various agronomic traits have been newly identi�ed in rice by genotyping 3,000 rice samples (27).
Gaps filled in the national management system to deal with the insecurity of existing crop collections
To complete the national legal system and put forward recommended policies for management of crop genetic resources, China has revised its Seed Law, released ‘Regulations on crop germplasm resources’ by the Ministry of Agriculture, and published the ‘National plan for conservation and sustainable use of crop genetic resources’ (28), which are key national legislation and policies for management of crop genetic resources in China. Currently, discussions are underway for development of access and bene�t-sharing polices, and for the possibility of joining the International Treaty of Plant Genetic Resources for Food and Agriculture (29).i
We have strengthened the national network for conservation and use of crop genetic resources involving the national long-term genebank, duplicate genebanks, mid-term genebanks, �eld genebanks and genebanksii located in different provinces (14). Efforts are being made to establish a national centre for conservation and use of crop germplasm resources in a uni�ed management system under the leadership of the Ministry of Agriculture and Rural Affairs.
The national information system for crop germplasm resources for digital and standard information sharing and management of genetic resources has been improved and upgraded. The system is composed of databases of germplasm catalogues, surveys and collecting missions, evaluation traits and images (14).
Conclusion
Addressing risks to crop genetic resources is crucial for their safe conservation and sustainable use, allowing them to continue to contribute to building resilient food and nutrition security and green development. China is rich in crop genetic resources in terms of species diversity and within-species diversity. China has made great efforts to strengthen research and management on acquisition, evaluation and use of
crop genetic resources with strong support from local and national governments. Although crop genetic resources in China are at risk from several threats, including climate change, development of modern agriculture and incomplete management systems, there are opportunities for using them sustainably that the national plans for nutrition and health, green development and poverty elimination present in the country. To manage risks, efforts should be made to comprehensively collect and conserve germplasm throughout the country, deeply evaluate germplasm and actively use the valuable diversity in breeding new varieties and supporting livelihoods, and improve the national policy and management system. In this way genetic diversity will be well placed to contribute to reducing the risks that China faces of a growing population, poor nutrition, poverty and deteriorating agricultural lands.
Notes
i The International Treaty on Plant Genetic Resources for Food and Agriculture, adopted by the 31st Session of the Conference of the Food and Agriculture Organization of the UN on 3 November 2001, aims at:
•Recognizingtheenormouscontributionoffarmerstothe diversity of crops that feed the world
•Establishingaglobalsystemtoprovidefarmers,plantbreeders and scientists with access to plant genetic materials
•Ensuringthatrecipientssharebenefitstheyderivefrom the use of these genetic materials with the countries where they have been originated.
http://www.fao.org/plant-treaty/en/
ii China deploys a network of different kinds of genebanks with different functions:
Long-term genebank – Located in Beijing for conserving crop base collections for long-term under conditions of temperature -18oC and relative humidity≤50%.
Duplicate genebank – Located in Qinghai for conserving duplicates of crop base collections for safety under conditions of temperature -18oC and relative humidity≤50%.
Mid-term genebanks – Located in different institutes of CAAS for conserving crop active collections for distribution under conditions of -4oC to +4oC.
Field genebanks – Located in different organizations throughout the country for conserving living collections of vegetatively propagated and perennial species in the protected �elds.
Provincial genebanks – Located in provincial academies of agricultural sciences for conserving local crop collections of different provinces.
151
Thought Pieces
References
1. Wu S, Li R (2002) Food demand, ensure and countermeasures for China in the next 30 years. Progress in Geography 21(2):121-129.
2. Wang, X, Zhao, L (2008) Agricultural water use ef�ciency and contributory factors in China - SFA Analysis based on the panel data from provinces. Agricultural Economic Issues 3:10-17
3. FAO (Food and Agriculture Organization) (2016) Statistical data on fertilizers used in agriculture. http://www.fao.org/faostat/en/#data/RFN.
4. Hou M, Zhang L, Wang Z, Yang D, Wang L, Xiu W, Zhao J (2017) Estimation of fertilizer usage from main crops in China. Journal of Agriculture Resources and Environment 34(4):360-367.
5. He Y (2014) Epidemic trends obesity and the challenge for public health in China. Chinese Journal of Epidemiology 35(4):345-348.
6. Li X, Jiang Y, Hu N, Li Y, Zhang M, Huang Z, Zhao W (2012) Prevalence and characteristic of overweight and obesity among adults in China, 2010. Chinese Journal of Preventive Medicine 46(8):683-686.
7. Gu J (2016) Explication on status report of nutrition and chronic diseases of Chinese citizen. Acta Nutrimenta Sinica 38(6):525-529.
8. The State Council of People's Republic of China (2017) The National Nutrition Plan (2017-2030) (Beijing), (Administrative Department of The State Council).
9. Liu Y (2017) Working report of State Council on poverty elimination. in The Twenty-Ninth Session of the Twelve NPC Standing Committee, (Beijing).
10. Dong Y, Zheng D (2006) Food Crops Volume. Chinese Crops and their Wild Relatives, eds Dong Y & Liu X (China Agricultural Press, Beijing).
11. Wang S, Li L, Li Y, Lu X, Yang Q, Cao Y, Zhang Z, Gao W, Qiu L, Wan J, Liu X (2011) Status of plant genetic resources for food and agriculture in China. Journal of Plant Genetic Resources 12(1):1-12.
12. Pu M (1981) Study on crops originated in China. Academica Sinica 4:1986-1996.
13. Yang Q, Qin W, Zhang W, Qiao W, Yu S, Guo Q (2013) In-situ conservation practices and future development of wild relatives of crops in China. Journal of Plant Genetic Resources 14(1):1-7.
14. Liu X, Li L, Li Y, Fang W (2018) Crop germplasm resources: advances and trends. Journal of Agriculture 8(1):1-6.
15. Liu X (2015) Scienti�c Report on Biological Genetic Resources of China (Science Press) 2nd Ed p 309.
16. Lu X, Chen X (2008) Status quo of crop germplasm resources conservation and sharing system in China. China Science and Technology Resources Review 40(4):20-25.
17. Tang G, Ren G (2005) Reanalysis of surface air temperature change of the last 100 years over China. Climate and Environmental Research 10(4):791-798.
18. Chen C, Huang H, Guan C, Chen F, Li M (2015) Impact of climate change on crop production and its coping strategy. Climate Change Research Letters 4(1):1-7.
19. Environmental Protection Department of Yunnan Province (May 22, 2017) The First Provincial Red-list of Biological Species Published by Yunnan Province. Yunnan Daily.
20. Yu H, Liu W (July 19, 2018) The valuable local genetic resources will be disappearing if not acting to rescue them. Science and Technology Daily.
21. Jin J (2012) How to revitalize the minor crops in Shanxi. Farming Product Processing 5:57-59.
22. Zheng D, Ruan R, Li X, Chen S, Li X, Xu M, Fang W (2018) Survey of elite agro-germplasm resources in Guizhou Province, P. R. China. Journal of Plant Genetic Resources 19(5):821-829.
23. Li Y, Li Y, Yang Q, Zhang J, Zhang JM, Qiu L, Wang T (2015) Genomics-based crop germplasm research: advances and perspectives. Scientia Agricultura Sinica 48(17):3333-3353.
24. Sun J, Yu T, Tang C, Cao G, Xu F, Han L (2013) Analysis of genetic diversity within populations of rice landraces from Yunnan using microsatellite markers. Chinese Journal of Rice Science 27(1):41-48.
25. Zhang H, Chang C, You G, Zhang X, Yan C, Xiao S, Si H, Lu J, Ma C (2010) Identi�cation of molecular markers associated with seed dormancy in mini core collections of Chinese wheat and landraces. Acta Agronomica Sinica 36(10):1649-1656.
26. Chen W, Li W, Yang Z, Sun S, Wang X, Zhang Z, Duan C (2018) Preliminary identi�cation and genetic diversity analysis of maize germplasm resources for resistance to southern corn rust. Journal of Plant Genetic Resources 19(2):225-231.
27. Wang w, Mauleon R, Hu Z, Chebotarov D, et al. (2018) Genomic variation in 3,010 diverse accessions of Asian cultivated rice. Nature 557:43-49.
28. MOA, NDRC, MOST (2015) National Mid- and Long-term Strategy for Conservation and Sustainable Use of Crop Genetic Resources (2015-2030) (The Ministry of Agriculture, National Development and Reform Committee, Ministry of Science and Technology, Beijing)
29. Zhang X, Wang S (2018) The implementation progress and reform developments on the International Treaty on Plant Genetic Resources for Food and Agriculture. Journal of Plant Genetic Resources 19(6):1019-1029.

Ladybug on cultivated einkorn (Triticum monococcum). Credit: Bioversity International/N. Capozio

KEY MESSAGES:
> Measurements of land productivity are used to assess the relative performance of agricultural systems, to set production targets, to evaluate the impacts of agricultural interventions and to track broader regional and national development trends.
> Although it may sometimes be possible to measure total factor productivity (which seeks to value all inputs and outputs of an agricultural production system), in relatively data-poor smallholder farm systems, simpler measures are widely used as proxies of productivity. The most common of these is crop yield – the amount of crop produced per unit of land (e.g. kg/ha).
> The performance of common practices used by smallholder farmers involving agrobiodiversity – such as intercropping to enhance farm resilience and household nutrition – may unintentionally be mischaracterized by some yield measurement methods.
> It is possible and useful to be more specific about how yield is calculated, including how area is measured, how intercropped crops are or are not counted, and how smallholders themselves are defined.
Measurement choices with consequencesHow we define yield, crop diversity and smallholders can mischaracterize contributions of agrobiodiversity to smallholder livelihoods
C. Leigh Anderson and Travis W. Reynolds
154
Agrobiodiversity Index Report 2019 – Risk and Resilience
Productivity, yield and development in smallholder farm systems
Agricultural development in sub-Saharan Africa has long hinged upon raising the productivity of rural small-scale farmers. Growth in agricultural productivity has been empirically linked to poverty reduction across a range of measures for both staple and export crops (1–9). Many governments and public and private organizations have thus made it a priority to increase smallholder farm productivity, and have invested billions toward this end (10–13).
Despite the prevalence of smallholder agricultural productivity growth as a development goal, reliable productivity measures remain elusive and costly. ‘Total factor productivity’ is one way of valuing all inputs and all outputs of an agricultural production system where adequate data exist. In the relatively data-poor environments typical of many smallholder agricultural systems, however, researchers generally use a simpler measure of land productivity: crop yield (14). Crop yield measures the output of a given crop per unit area (e.g. kilograms of maize per hectare, tonnes of rice per acre). The logic of striving for greater agricultural output per unit of land as a mechanism to catalyze rural growth seems intuitive. So, although individual welfare is often the ultimate goal, yield is often used to track agricultural development, because it is easier than measuring – and pricing – all the outputs and inputs of agriculture, or estimating broader outcomes like changes in poverty or nutrition.
However, even measuring crop yield proves to be surprisingly complex. Simpli�ed progress measures such as crop yield would be less problematic if farms only produced one crop (i.e. market-oriented monocultures), or if farmers were relatively homogenous in their input use (e.g. land, fertilizer, pesticide and management strategies) across contexts. But in practice smallholders regularly plant a diverse portfolio of crops and use a wide range of farm management practices that confound simple yield calculations. To complicate matters further, ‘yield’ and ‘smallholder’ are de�ned in several ways, or used without being clearly de�ned. Since evidence-based policy is based on empirical measurements, this matters. The choice of yield measure and de�nition of smallholder in�uence how crop yield estimates are translated into interpretations of smallholder productivity. If these yield measures differ
systematically across, for example, sub-populations of farmers or crops, they could mischaracterize the role or outcomes of common farming strategies – including the use of agrobiodiversity – in smallholder livelihoods.
In this paper, we outline de�nitions of yield and categorizations of smallholders, as they are commonly used in scienti�c studies and policy papers. Then using the examples of two very different cereal crops – maize and rice – in Ethiopia and Tanzania, we illustrate the consequences of applying different yield and smallholder measurement decisions. The data we use are plot-level data from nationally representative surveys from the World Bank’s Living Standards Measurement Study – Integrated Surveys on Agriculture (LSMS-ISA): the Tanzanian National Panel Survey (TNPS), and the Ethiopian Socioeconomic Surveys (ESS).
Area planted or area harvested? How is plot area measured?
Crop yield can be calculated as a measure of production per harvested area (e.g. kg/ha harvested) or per area cultivated (e.g. kg/ha planted) – with preharvest losses the most common difference between these measures. Preharvest losses can arise from factors largely beyond the control of the farmer, such as catastrophic climate events (�ooding, drought), theft, �re or birds. Or they can be due to factors associated with management, such as input choices or farming practices that increase vulnerability to stresses such as pests, weeds, temperature or rainfall variability. Incomplete harvests – due to, for example, labour constraints – would also lead to different yield estimates depending on whether area harvested or area planted is considered. Yield measures based on area harvested rather than area planted may thus misestimate productivity in contexts where preharvest losses lead to non-harvesting of some area with damaged crops, or in contexts where only the most productive plots are harvested.
In a review of 30 articles published recently over three years in top-rankedi agricultural economics journals, it appears that most researchers with access to household-level data use ‘area planted’ as the denominator in yield calculations. But others, including donors and government agencies, regularly track and report area harvested, or rely on more easily available

155
Thought Pieces
administrative data, such as FAOSTAT, which reports a measure of quantity harvested divided by area harvested (with explicit guidance that area harvested “excludes the area from which, although sown or planted, there was no harvest due to damage, failure, etc.”) (15). Still others do not clearly indicate what the yield denominator is – introducing uncertainty around how preharvest losses are accounted for (or not).
Does this ambiguity matter? The advent of regular detailed household-level survey data with information on both area planted and area harvested allows us to make direct empirical comparisons of yield estimates based on the choice of denominator. As an illustrative example, Figure 1 compares administrative estimates (FAOSTAT) for Tanzania to household survey estimates of pure-stand crop yields according to area planted or area harvested.ii
In this Tanzanian context, we �nd maize and rice yield estimates by area harvested are statistically signi�cantly higher than yield by area planted (conservatively approximating 38% in 2014–2015). For rice, administrative estimates reporting yield by area
harvested (from FAOSTAT) are consistently higher than survey estimates using area harvested. Differences are to be expected given the different methodologies (14, 15, 17), but surprisingly even the trends deviate (partially due to FAOSTAT numbers for intervening years, which are imputed).
We also �nd large differences in preharvest crop area losses across crops: famers report harvesting an area less than the area planted on 26% of maize plots compared to 18% for rice plots. Though the reasons for these area losses vary, we note that in the Tanzanian survey, plots planted with more than one crop were signi�cantly less likely to experience area loss: approximately two-thirds of mixed crop plots do not experience any area loss, whereas two-thirds of monocropped plots do. To the extent that preharvest losses are concentrated among certain crops (e.g. maize versus rice) or among certain management practices (e.g. monocropping versus mixed cropping), there is the potential for the choice of yield metric to mischaracterize the relative productivity of these crops and farm management strategies.
“arhv” denotes estimates of yield by area harvested, and “arpl” denotes yield by area planted. TNPS estimates are means for rural households only. In all estimates, area planted and area harvested on a given plot are constrained to not exceed the plot size, as measured by GPS when available. FAOSTAT yield is the reported harvested production for the total crop area under cultivation. Source: Authors’ estimates (TNPS); FAOSTAT (16)
FIGURE 1 – Comparison of Tanzania crop yield estimates (kg/ha) by area measure and data source
0
500
Maize - TNPS (arhv)
Rice - TNPS (arhv)
Maize - TNPS (arpl)
Rice - TNPS (arpl)
Maize - FAOSTAT (arhv)
Rice - FAOSTAT (arhv)
1000
1500
2000
3000
2500
2007 2008 2009 2010 2011 2012 2013 2014 2015

156
Agrobiodiversity Index Report 2019 – Risk and Resilience
How is crop production measured? Accounting for intercropping in yield calculations
The farm management practices that smallholder farmers commonly use present further challenges for accurately estimating yields. For example, intercropping is a common practice, where farmers produce multiple crops on a given parcel simultaneously or over the course of the growing season(s).
Farmers plant multiple crops on a single plot for many reasons: lowering production risks (if crops are differentially sensitive to climate variation or other stresses), coping with labour constraints, hedging against price movements, meeting their household food preferences, or seeking the productivity bene�ts of certain intercropping arrangements such as nitrogen-�xing legumes (18–21). In Tanzanian survey questions looking at farmer motivations for intercropping, substituting for another crop in the event of failure was the overwhelming reason (> 87%) given for intercropping, across all cereal crops: a strategy for managing risk and resilience.
On mixed plots, accurately estimating yield for any given crop requires either scaling up production estimates to re�ect potential production if the entire plot area were allocated to a single crop, or apportioning the cultivated area among the resident crops on subdivided plots, on intercropped plots, or in cases where seed may have been mixed before planting. However, no consensus exists on how to make these adjustments (14, 15, 17). A recent review of 40 papers in high-ranking agricultural economics journals found that none speci�ed adjustments to the production estimates or crop areas to account for intercropping (22). Three papers speci�ed that they used the entire plot size as the denominator of yield, effectively ignoring the production of intercrops in making yield calculations for any given crop.
Does this ambiguity matter? Again using data from the 2014 Tanzanian survey main season, we �nd 64% of plots cultivated contained more than one crop. Monocropped plots tend to be smaller, so by some calculations roughly three-quarters of the area under crops contain multiple crops. Some crops are very commonly intercropped, like maize (79% mixed crop,
of which 40% of cases are mixed with a legume). This makes the choice of how to allocate plot area among multiple crops highly consequential when generating agricultural statistics.
To determine if these choices have an effect on yield estimates, we look at estimates using four different methods of dealing with intercropped plots. Figure 2 shows a typical 1-hectare plot, with a quarter solely planted to maize and the remaining three-quarters intercropped with sorghum and beans.
• Method 1: the entire plot area is considered the area under each crop
• Method 2: the farmer-reported proportion of the plot cultivated with a given crop (e.g. ¼) is considered the area under that crop, even when it shares the space with other crops
• Method 3: the entire plot area is divided by the number of crops
• Method 4: the estimated proportion of the plot cultivated with a given crop (e.g. ¼) as reported by the farmer is considered the area under that crop for monocropped crops; for land with multiple crops, reported areas are scaled down so that the sum of areas under all crops does not exceed the total plot area.
Area under
Maize Sorghum Beans
Method 1 1ha 1ha 1ha
Method 2 0.25ha 0.75ha 0.75ha
Method 3 0.33ha 0.33ha 0.33ha
Method 4 0.25ha 0.375ha 0.375ha
FIGURE 2 – Example of area calculation methods in the presence of multiple crops (1ha plot)
Using methods 1 and 2, which are unadjusted for intercropping, intercropping is associated with lower maize yield (full results available from (22)). However, using methods 3 and 4, which account for the presence of multiple crops on the same plot, intercropping appears to be bene�cial for yields. Planting maize alongside legumes is associated with yields of about 600kg/ha more than pure-stand maize. This is consistent with research on the yield bene�ts of intercropping maize with legumes (18, 19). Yield measurement choices can then mask positive outcomes associated with farm management strategies incorporating agrobiodiversity, such as intercropping.
Sorghum
Maize
Beans
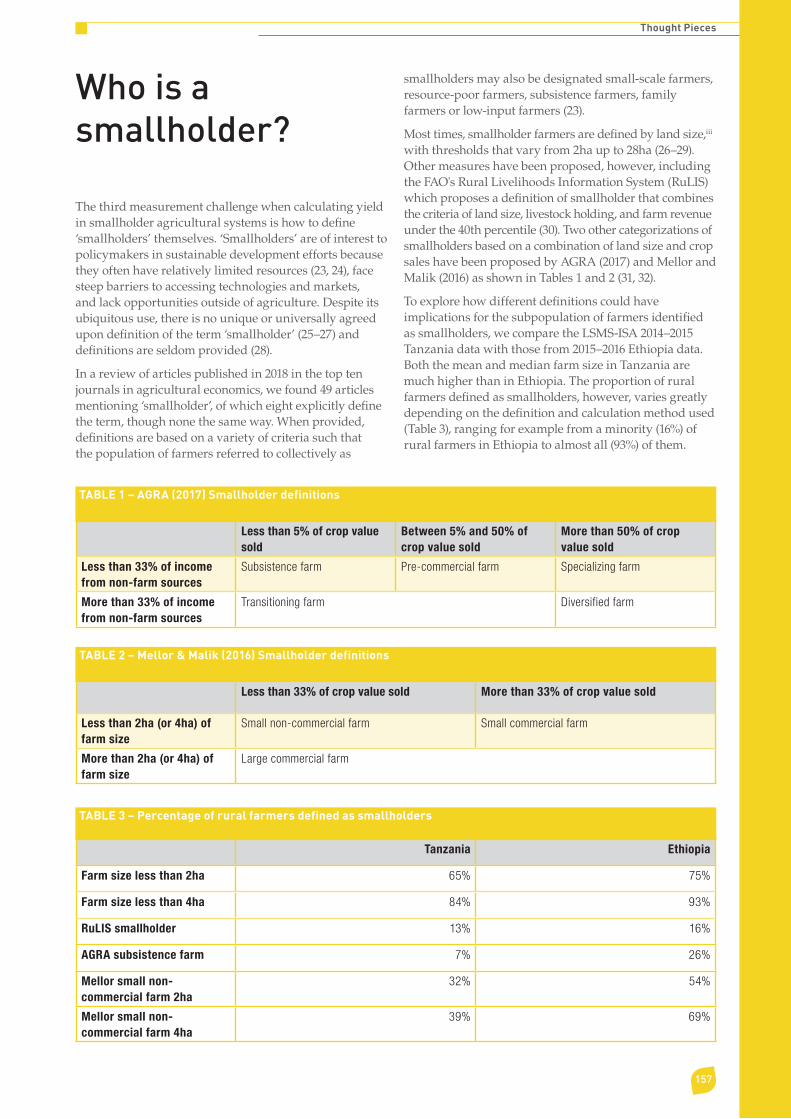
157
Thought Pieces
Who is a smallholder?
The third measurement challenge when calculating yield in smallholder agricultural systems is how to de�ne ‘smallholders’ themselves. ‘Smallholders’ are of interest to policymakers in sustainable development efforts because they often have relatively limited resources (23, 24), face steep barriers to accessing technologies and markets, and lack opportunities outside of agriculture. Despite its ubiquitous use, there is no unique or universally agreed upon de�nition of the term ‘smallholder’ (25–27) and de�nitions are seldom provided (28).
In a review of articles published in 2018 in the top ten journals in agricultural economics, we found 49 articles mentioning ‘smallholder’, of which eight explicitly de�ne the term, though none the same way. When provided, de�nitions are based on a variety of criteria such that the population of farmers referred to collectively as
smallholders may also be designated small-scale farmers, resource-poor farmers, subsistence farmers, family farmers or low-input farmers (23).
Most times, smallholder farmers are de�ned by land size,iii
with thresholds that vary from 2ha up to 28ha (26–29). Other measures have been proposed, however, including the FAO's Rural Livelihoods Information System (RuLIS) which proposes a de�nition of smallholder that combines the criteria of land size, livestock holding, and farm revenue under the 40th percentile (30). Two other categorizations of smallholders based on a combination of land size and crop sales have been proposed by AGRA (2017) and Mellor and Malik (2016) as shown in Tables 1 and 2 (31, 32).
To explore how different de�nitions could have implications for the subpopulation of farmers identi�ed as smallholders, we compare the LSMS-ISA 2014–2015 Tanzania data with those from 2015–2016 Ethiopia data. Both the mean and median farm size in Tanzania are much higher than in Ethiopia. The proportion of rural farmers de�ned as smallholders, however, varies greatly depending on the de�nition and calculation method used (Table 3), ranging for example from a minority (16%) of rural farmers in Ethiopia to almost all (93%) of them.
TABLE 1 – AGRA (2017) Smallholder definitions
TABLE 2 – Mellor & Malik (2016) Smallholder definitions
Less than 5% of crop value sold
Between 5% and 50% of crop value sold
More than 50% of crop value sold
Less than 33% of income from non-farm sources
Subsistence farm Pre-commercial farm Specializing farm
More than 33% of income from non-farm sources
Transitioning farm Diversified farm
Less than 33% of crop value sold More than 33% of crop value sold
Less than 2ha (or 4ha) of farm size
Small non-commercial farm Small commercial farm
More than 2ha (or 4ha) of farm size
Large commercial farm
TABLE 3 – Percentage of rural farmers defined as smallholders
Tanzania Ethiopia
Farm size less than 2ha 65% 75%
Farm size less than 4ha 84% 93%
RuLIS smallholder 13% 16%
AGRA subsistence farm 7% 26%
Mellor small non-commercial farm 2ha
32% 54%
Mellor small non-commercial farm 4ha
39% 69%
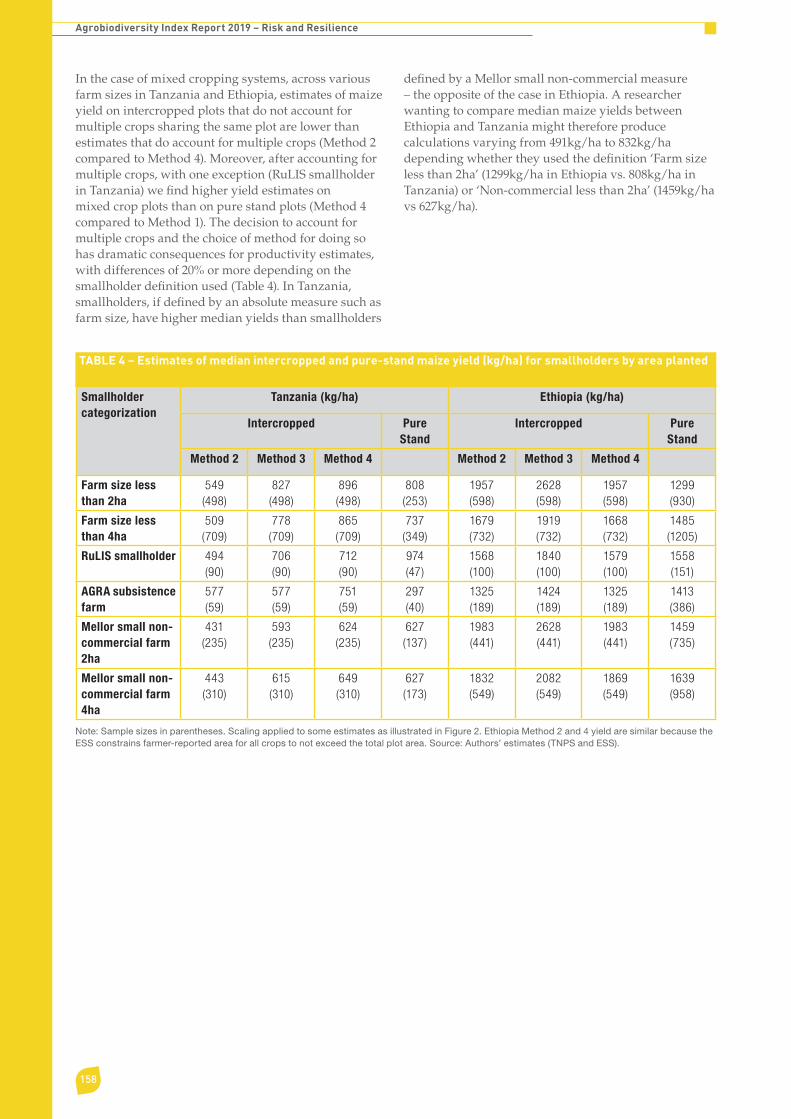
158
Agrobiodiversity Index Report 2019 – Risk and Resilience
TABLE 4 – Estimates of median intercropped and pure-stand maize yield (kg/ha) for smallholders by area planted
Smallholder categorization
Tanzania (kg/ha) Ethiopia (kg/ha)
Intercropped Pure Stand
Intercropped Pure Stand
Method 2 Method 3 Method 4 Method 2 Method 3 Method 4
Farm size less than 2ha
549(498)
827(498)
896(498)
808(253)
1957(598)
2628(598)
1957(598)
1299(930)
Farm size less than 4ha
509(709)
778(709)
865(709)
737(349)
1679(732)
1919(732)
1668(732)
1485(1205)
RuLIS smallholder 494(90)
706(90)
712(90)
974(47)
1568(100)
1840(100)
1579(100)
1558(151)
AGRA subsistence farm
577(59)
577(59)
751(59)
297(40)
1325(189)
1424(189)
1325(189)
1413(386)
Mellor small non-commercial farm 2ha
431(235)
593(235)
624(235)
627(137)
1983(441)
2628(441)
1983(441)
1459(735)
Mellor small non-commercial farm 4ha
443(310)
615(310)
649(310)
627(173)
1832(549)
2082(549)
1869(549)
1639(958)
In the case of mixed cropping systems, across various farm sizes in Tanzania and Ethiopia, estimates of maize yield on intercropped plots that do not account for multiple crops sharing the same plot are lower than estimates that do account for multiple crops (Method 2 compared to Method 4). Moreover, after accounting for multiple crops, with one exception (RuLIS smallholder in Tanzania) we find higher yield estimates on mixed crop plots than on pure stand plots (Method 4 compared to Method 1). The decision to account for multiple crops and the choice of method for doing so has dramatic consequences for productivity estimates, with differences of 20% or more depending on the smallholder definition used (Table 4). In Tanzania, smallholders, if defined by an absolute measure such as farm size, have higher median yields than smallholders
defined by a Mellor small non-commercial measure – the opposite of the case in Ethiopia. A researcher wanting to compare median maize yields between Ethiopia and Tanzania might therefore produce calculations varying from 491kg/ha to 832kg/ha depending whether they used the definition ‘Farm size less than 2ha’ (1299kg/ha in Ethiopia vs. 808kg/ha in Tanzania) or ‘Non-commercial less than 2ha’ (1459kg/ha vs 627kg/ha).
Note: Sample sizes in parentheses. Scaling applied to some estimates as illustrated in Figure 2. Ethiopia Method 2 and 4 yield are similar because the ESS constrains farmer-reported area for all crops to not exceed the total plot area. Source: Authors’ estimates (TNPS and ESS).
159
Thought Pieces
How does this matter for agrobiodiversity for risk and resilience?
Research aimed at reducing yield gaps or evaluating yield improvement, or research on the effects of climate variability and other external shocks necessarily rests on having an accurate record of past and present crop yields (33–36). Poor or imprecise yield estimates can potentially misdirect resources seeking to support smallholder farmer livelihoods or broader economic development efforts.
It might be dif�cult to imagine that strategies aiming to increase crop yields could have negative side effects. But the analyses presented here suggest that the ways in which we measure yield, account for intercropping, and de�ne smallholders are all ways in which we might mischaracterize productivity among small-scale farmers. For example, faulty accounting might give the impression that intercropping is less productive than monocropping, leading to actions and policies that aim to simplify farming systems, which may reduce longer-term resilience. Given that different smallholder farmer typologies are associated with different measures of successful yields, if investments use a particular typology and that subgroup is comprised of relatively more food-secure and productive smallholders, with better commercial prospects, then, in a resource-constrained world, investments to increase the welfare of the least secure and resilient could result in vulnerable farmers losing ‘bene�ciary’ status.
Policymakers, agricultural research stations, or development practitioners may decide to prioritize one crop over the other based on how their relative productivity has been interpreted (37–38). We have found that the choice of yield measure may lead to consistent under- or over-estimates of yield for crops that experience frequent and substantial losses in plot area between planting and harvest. Our results using the 2015/16 Tanzanian survey data suggest that maize emerges as more productive than rice when area is more precisely apportioned. In part because maize is so often grown in cropping systems involving agrobiodiversity (e.g. intercropping with legumes) across a variety of countries and contexts, its actual productivity may be obscured until the space estimated for other crops on the plot is somehow addressed.
If the differences arising from the choice of a yield proxy were equal across all plots, all crops and all farmers, calibrating estimates to better re�ect the outcome of interest would be straightforward. But if the underlying drivers of, for example, preharvest losses – such as land quality and quantity, access to inputs and markets, and exposure to risks – differentially affect certain farmers, then measurement choices could lead to a systematic bias in metrics seeking to improve outcomes among target demographics or across target geographies.
Fortunately, tools and data are improving. But accurately measuring even the most basic of agricultural indicators – yield – exempli�es why, even in an age of remote sensing (also most accurate on monocropped plots), we still need plot- and farm-level microdata. Detailed panel surveys allow us to empirically examine current con�gurations of ‘smallholders’ and commercial transitioning farmers (31, 32) in terms of economic access and resilience to shocks. Other key outcomes in development contexts – including varietal diversity measures, risk preferences and measures of human individuals or human empowerment – also cannot be remotely sensed. Rather, new forms of remotely sensed data might be seen as providing opportunities to empirically assess resilience at landscape scale only when combined with plot- and farm-level microdata on farming practices and farm household characteristics, with measurement choices clearly de�ned.
Acknowledgements
We thank Terry Fletcher and David Coomes for their excellent research assistance and the Bill & Melinda Gates Foundation for supporting the research leading to this paper. The �ndings and conclusions presented here are those of the authors and do not necessarily re�ect the positions or policies of the foundation. Stata.do �les used to conduct the analysis are available at https://github.com/EvansSchoolPolicyAnalysisAndResearch/.

160
Agrobiodiversity Index Report 2019 – Risk and Resilience
Notes
i Based on 2012–2016 average impact factors, per InCites.
ii From TNPS: 2008–2009, 2010–2011, 2012–2013, and 2014–2015.
iii In a review of of�cial de�nitions of small or smallholder farms used by national statistical authorities in 122 countries, GRAIN (2013) �nds that land size is the single criterion used in 58% of the de�nitions (25). It is used in combination with other criteria in 93% of all de�nitions.
References
1. Timmer P (1995) Getting agriculture moving: Do markets provide the right signals? Food Policy 20(5):455-472
2. Datt G, Ravallion M (1998) Farm productivity and rural poverty in India. Journal of Development Studies 34(4):62-85
3. Mellor J (1999) Faster, more equitable growth – The relation between growth in agriculture and poverty reduction. Agricultural Policy Development Project Research Report No. 4 (United States Agency for International Development, Washington, DC)
4. Fan S, Hazell P, Thorat S (1999) Linkages between government spending, growth, and poverty in rural India. Research Report No. 100 (IFPRI, Washington, DC)
5. Irz X, Lin L, Thirtle C, Wiggins S (2001) Agricultural productivity growth and poverty alleviation. Development Policy Review 19(4):449-466.
6. Thirtle C, Irz X, Lin L, McKenzie-Hill V, Wiggins S (2001) Relationship between changes in agricultural productivity and the incidence of poverty in developing countries. Report No. 7946 (Department for International Development, London, UK)
7. Minten B, Barrett C (2008) Agricultural technology, productivity, and poverty in Madagascar. World Development 36(5):797-822
8. Byerlee D, Diao X, Jackson C (2009) Agriculture, rural development, and pro-poor growth: Country experiences in the post-reform era. (World Bank Group, Washington, DC)
9. Pingali PL (2012) Green revolution: Impacts, limits, and the path ahead. Proceedings of the National Academy of Sciences 109(31):12302-12308
10. O'Sullivan M, Banerjee R, Gulati K, Vinez M (2014) Levelling the �eld: Improving opportunities for women farmers in Africa. (World Bank Group, Washington, DC)
11. FAO (Food and Agriculture Organization of the United Nations) (2015) About FAO. Available at http://www.fao.org/about/en/
12. USAID (United States Agency for International Development) (2015) Feed the future. Available at https://www.usaid.gov/what-wedo/agriculture-and-food-security/increasing-food-securitythrough-feed-future.
13. BMGF (Bill & Melinda Gates Foundation) (2014) Agricultural Development Strategy Overview. (BMGF, Seattle WA)
14. FAO (Food and Agriculture Organization of the United Nations) (2017) Methodology for estimation of crop area and crop yield under mixed and continuous cropping. Improving Agricultural & Rural Statistics Global Strategy Technical Report No. GO-21-2017 (The World Bank, FAO, and United Nations, Rome, Italy)
15. FAO (Food and Agriculture Organization of the United Nations) (2017) Description of Production Elements. Available at http://www.fao.org/waicent/faostat/agricult/pr_ele-e.htm
16. Kelly V, Hopkins J, Reardon T, Crawford E (1995) Improving the measurement and analysis of African agricultural productivity: Promoting complementarities between micro and macro data. International Development Paper No. 16. (Michigan State University, East Lansing, MI)
17. Dakora FD, Keya SO (1997) Contribution of legume nitrogen �xation to sustainable agriculture in sub-Saharan Africa. Soil Biology and Biochemistry 29(5-6):809-817
18. Snapp SS, Blackie MJ, Gilbert RA, Bezner-Kerr R, Kanyana-Phiri GY, Kates RW (2010) Biodiversity can support a greener revolution in Africa. Proceedings of the National Academy of Sciences 107(48):20840-20845
19. Fermont A, Benson T (2011) Estimating yield of food crops grown by smallholder farmers. IFPRI Discussion Paper No. 01097 (International Food Policy Research Institute, Washington, DC)
20. Arslan A, McCarthy N, Lipper L, Asfaw S, Cattanei A, Kokwe M (2015) Climate smart agriculture? Assessing the adaptation implications in Zambia. Journal of Agricultural Economics 66(3):753-780
21. Wineman A, Anderson CL, Reynolds, TW, Biscaye, P. (2018) Crop yield measurement on intercropped plots. Evans School Policy Analysis and Research Group (EPAR) Technical Report No. 354
22. Larson DF, Otsuka K, Matsumoto T, and Kilic T (2014) Should African rural development strategies depend on smallholder farms? An exploration of the inverse-productivity hypothesis. Agricultural Economics 45:355–367
23. Dixon J, Tanyeri-Abur A, Wattenbach H (2004) Framework for analyzing impacts of globalization on smallholders. FAO Agricultural Management, Marketing and Finance Occasional Paper. Available at http://www.fao.org/docrep/007/y5784e/y5784e02.htm

161
Thought Pieces
24. Heidhues F, Brüntrup M (2003) Subsistence agriculture in development: its role in processes of structural change. Subsistence Agriculture in Central and Eastern Europe: How to Break the Vicious Circle? eds Abele S, Frohberg K (The Leibniz Institute of Agricultural Development in Transistion Economies, Halle, Germany) pp. 236
25. GRAIN (2014) Hungry for land: Small farmers feed the world with less than a quarter of all farmland. Available at https://www.grain.org/article/entries/4929-hungry-for-land-small-farmers-feed-the-world-with-less-than-a-quarter-of-all-farmland
26. Lowder SK, Skoet J, Raney T (2016) The number, size, and distribution of farms, smallholder farms, and family farms worldwide. World Development 87:16-29
27. Chamberlin J (2008) It's a small world after all: Defining smallholder agriculture in Ghana. IFPRI Discussion Paper No. 00823 (International Food Policy Research Institute, Washington, DC)
28. Aidenvironment (2013) Including Smallholders in Biofuel Certification: Recommendations to Voluntary Sustainability Standards Produced. Available at https://energycenter.epfl.ch/files/content/sites/energy-center/files/projetsBioenergy%20Team/Recommendations%20on%20Smallholder%20Inclusiveness.pdf
29. Khalil CA, Conforti P, Ergin I, Gennari P (2017) Defining Small-Scale Food Producers to Monitor Target 2.3 of the 2030 Agenda for Sustainable Development. FAO Working Paper Series ESS/17-12 (Food and Agriculture Organization of the United Nations, Rome, Italy)
30. AGRA (Alliance for a Green Revolution in Africa) (2017) Africa Agriculture Status Report: The Business of Smallholder Agriculture in Sub-Saharan Africa Issue 5 (Alliance for a Green Revolution in Africa, Nairobi, Kenya)
31. Mellor JW, Malik SJ (2016) The impact of growth in small commercial farm productivity on rural poverty reduction. World Development 91:1-10
32. De Janvry A, Fafchamps M, Sadoulet E (1991) Peasant household behavior with missing markets: Some paradoxes explained. The Economic Journal 101:1400–1417
33. Benin S, Smale M, Pender J, Gebremedhin B, and Ehui S (2004) The economic determinants of cereal crop diversity on farms in the Ethiopian highlands. Agricultural Economics 31:197-208
34. World Bank (2015) Tanzania Mainland Poverty Assessment: Main Report. (Washington, DC)
35. Rowhani P, Lobell D, Linderman M, Ramankutty N (2011) Climate variability and crop production in Tanzania. Agricultural and Forest Meteorology 151(4):449–460
36. GYGA (Global Yield Gap Atlas) (2018) Food security analysis: from local to global. Available at: http://www.yieldgap.org/web/guest/home
37. Perez ND, Rosegrant MW (2015) The impact of investment in agricultural research and development and agricultural productivity. IFPRI Discussion Paper No. 01447 (International Food Policy Research Institute, Washington, D.C.)
38. Maredia MK, Raitzer DA (2010) Estimating overall returns to international agricultural research in Africa through benefit-cost analysis: a ‘best-evidence’ approach. Agricultural Economics 41(1):81–100

Farmer with banana plantlets, Burundi. Bananas are important staple food crops in much of East Africa, contributing to food security, revenues and culture. Bananas provide permanent soil cover that reduces soil erosion on steep slopes, and are a principal source of mulching material for maintaining and improving soil fertility. Credit: Bioversity International/P. Lepoint, courtesy of www.musarama.org
KEY MESSAGES:
> Women’s innovations are at the heart of agricultural development.
> The examples of the diverse roles of women farmers in Tigray, northern Ethiopia, illustrate the roles of women in other rural contexts.
> These women farmers are seed keepers, innovators and knowledge holders.
> Their knowledge and innovations allow them to maintain or increase diversity in the system in order to build in resilience to different disturbances.
Women are key to resilient food systems as seed keepers in EthiopiaFetien Abay
The examples of the diverse roles of women farmers in Tigray, northern Ethiopia, illustrate the roles
Women are key to resilient food systems as seed keepers in EthiopiaWomen are key to resilient food systems Women are key to resilient food systems
Their knowledge and innovations allow them to maintain or increase diversity in the system in order

164
Agrobiodiversity Index Report 2019 – Risk and Resilience
Rural women and natural resource innovations
Women constitute half of the world’s potential innovation pool. The ef�ciency of external investments in agricultural development will depend greatly on the extent to which the planning processes learn from women’s innovations. However, development planning and research tend to overlook their essential local innovations. In fact, some external interventions even pose major risks to women’s livelihoods and their roles in farming systems, for instance by increasing their workloads.
Inclusion of women in development and research practices helps build community resilience in the face of climate change risks. Rural women’s roles and livelihoods are highly dependent on natural resources, which means that they are the �rst to feel the effects of a changing climate. Women are key players in household food security both as managers of livelihood risks and as sources of local knowledge in development planning. Through examples of the diverse roles of women farmers in Tigray, northern Ethiopia, as seed keepers, innovators and knowledge holders, I illustrate roles common to women in many other rural contexts. These roles increase the resilience of rural households, allowing them to bounce back from climate and market shocks.
Knowledge in varietal selection
Income, food security, productivity, consumption habits, cultural identity and medicinal values are some of the factors in�uencing variety selection among farmers. Female and male farmers often have different preferences for characteristics they seek in crops or varieties, re�ecting what they need to ful�l their expected roles. Farming households in Ethiopia commonly adhere to certain social codes of behaviour concerning decision-making about seed use and exchange. These codes de�ne the gender roles and are often expressed through sayings, songs and prayers. One social code about the role of women in seed selection and related decision-making practices is
Don’t farm if you don’t have a wife; don’t accuse if there is no judge.
According to this saying, the wife’s role in seed-related decision-making practices is not a choice but a necessity. This is because women are knowledgeable about seed and are responsible for handling seed including the day-to-day monitoring for seed maintenance at home. Men’s decision-making relating to seed issues is greatly in�uenced by women’s voices in terms of seed selection, saving, renewal or replacement, exchange and site selection for speci�c types of seed. In �eld-level conversations with farmers, they endow seed issues with the same importance as pregnancy and childbirth, because of their role as a basis of food systems. For example, the special role of women related to seed was described by a farmer from Menkere village in Tigray as
No wife, no seed, no life.
Another farmer innovator added, “Women have microscopic eyes” in selecting the best seed for household food production and income security. Women have special skills to determine the viability of teff seed. Women roast selected teff to identify a particular popping or cracking sound during the process. If the teff cracks uniformly and quickly, then it is regarded as the best teff for seed and household food production. These realities generally hold across various crops and especially for crops with special cultural signi�cance.
These practices help farmers diversify genotypes both as a risk diversi�cation strategy and as a way of maintaining versatility of the uses of various varieties – thereby strengthening food system resilience.
Women partnering in breeding and innovations in barley
Another story worth telling is that of ‘Fetina’, a high-quality barley variety released nationally from participatory plant breeding trials.i This variety has a special ‘dehiscent’ character, which means that the thin skins covering each grain are much easier to dehusk than other varieties. This is a great advantage for women, as it reduces the work required when cleaning, grading and processing barley to make ‘kollo’ (roasted barley) or when consuming it in a raw form during harvesting. Dehiscence reduces the time women spend processing the grains and increases their time for other activities that can increase income and food.
In another example, farmers selected from 30,000 samples of durum wheat and barley varieties that they considered as having the highest potential for local adaptation. According to the researchers (2013, personal communication), 17 variants of durum wheat were identi�ed by farmers at Bisheftu Woreda near Addis Ababa. Considering seed colour as a morphological marker, women identi�ed more variants (60%) than did their male counterparts.
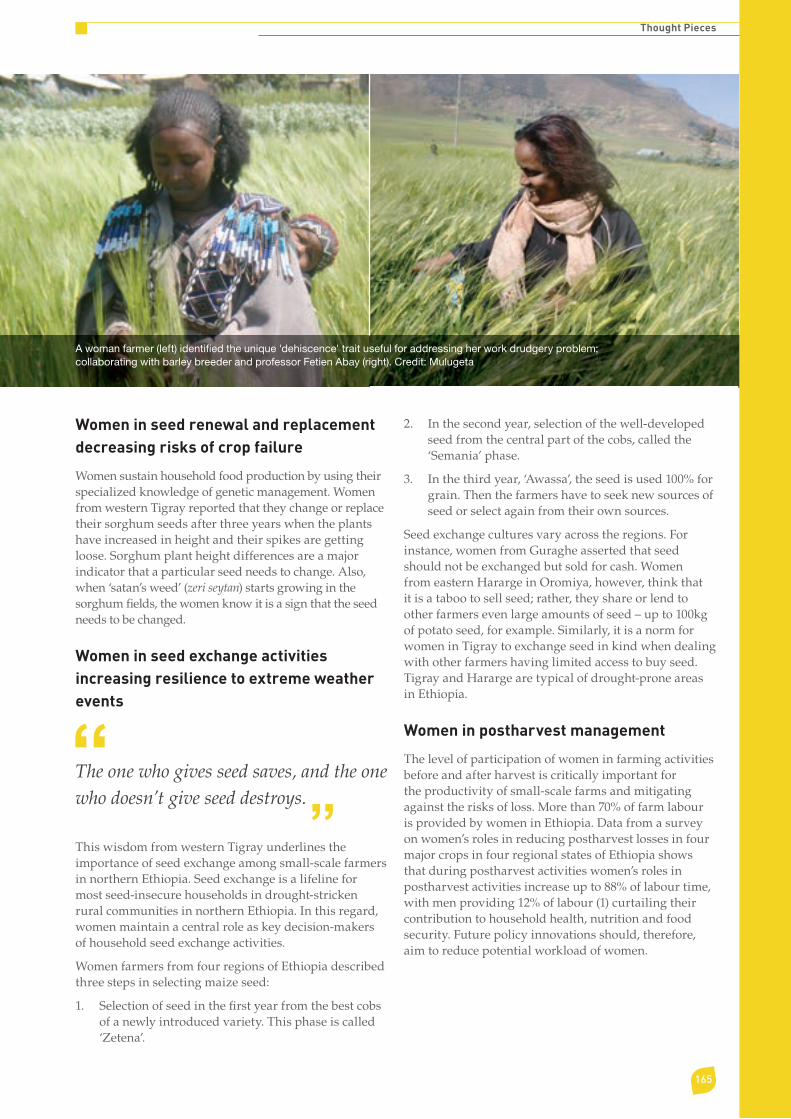
165
Thought Pieces
Women in seed renewal and replacement decreasing risks of crop failure
Women sustain household food production by using their specialized knowledge of genetic management. Women from western Tigray reported that they change or replace their sorghum seeds after three years when the plants have increased in height and their spikes are getting loose. Sorghum plant height differences are a major indicator that a particular seed needs to change. Also, when ‘satan’s weed’ (zeri seytan) starts growing in the sorghum �elds, the women know it is a sign that the seed needs to be changed.
Women in seed exchange activities increasing resilience to extreme weather events
The one who gives seed saves, and the one who doesn’t give seed destroys.
This wisdom from western Tigray underlines the importance of seed exchange among small-scale farmers in northern Ethiopia. Seed exchange is a lifeline for most seed-insecure households in drought-stricken rural communities in northern Ethiopia. In this regard, women maintain a central role as key decision-makers of household seed exchange activities.
Women farmers from four regions of Ethiopia described three steps in selecting maize seed:
1. Selection of seed in the �rst year from the best cobs of a newly introduced variety. This phase is called ‘Zetena’.
2. In the second year, selection of the well-developed seed from the central part of the cobs, called the ‘Semania’ phase.
3. In the third year, ‘Awassa’, the seed is used 100% for grain. Then the farmers have to seek new sources of seed or select again from their own sources.
Seed exchange cultures vary across the regions. For instance, women from Guraghe asserted that seed should not be exchanged but sold for cash. Women from eastern Hararge in Oromiya, however, think that it is a taboo to sell seed; rather, they share or lend to other farmers even large amounts of seed – up to 100kg of potato seed, for example. Similarly, it is a norm for women in Tigray to exchange seed in kind when dealing with other farmers having limited access to buy seed. Tigray and Hararge are typical of drought-prone areas in Ethiopia.
Women in postharvest management
The level of participation of women in farming activities before and after harvest is critically important for the productivity of small-scale farms and mitigating against the risks of loss. More than 70% of farm labour is provided by women in Ethiopia. Data from a survey on women’s roles in reducing postharvest losses in four major crops in four regional states of Ethiopia shows that during postharvest activities women’s roles in postharvest activities increase up to 88% of labour time, with men providing 12% of labour (1) curtailing their contribution to household health, nutrition and food security. Future policy innovations should, therefore, aim to reduce potential workload of women.
A woman farmer (left) identi�ed the unique 'dehiscence' trait useful for addressing her work drudgery problem; collaborating with barley breeder and professor Fetien Abay (right). Credit: Mulugeta

166
Agrobiodiversity Index Report 2019 – Risk and Resilience
Women in postharvest loss reduction
For cash crops like chickpea and sesame in Ethiopia, postharvest losses are estimated to average between 10% and 30%, depending on the crop type, but at times, they can even be as high as 40%. In some cases, postharvest losses for sorghum and maize have been especially high, at 15% and 30% respectively. These losses exacerbate the food insecurity of small-scale farm households. Women are mainly responsible for postharvest processing, and employ local knowledge that helps reduce the postharvest losses. Women have developed various innovations to reduce postharvest grain losses (1) including:
• Mixing seeds of other crops with teff: i) simply mixing the seeds together with teff seed and storing them; or ii) placing teff at the bottom and top of the storage and putting other seeds in between. Teff is attacked by storage pests less than other grains. Teff is such a �ne grain that it limits oxygen movement in the storage, thus reducing the survival chances of storage insect pests, such as weevils.
• Smoking storage facilities with chili pepper: women apply pepper powder or burn the chilies and blow the smoke through the storage material with the intention that pests will not be comfortable because of the hot property of red peppers.
• Use of pumpkin: higher temperatures favour storage pests. Women place pumpkin with the crops for its cooling effect. Pumpkin lowers the in-storage temperature creating a less favourable environment for hatching storage pests.
• Use of Areki, a strong alcohol prepared by women from various crops. Women believe the high alcohol content of Areki disturbs the life cycle of storage pests, thus minimizing potential damage to stored grains. The women use Areki to wash the grain and storage recipients.
Women and innovations in food enterprises
Cereal-based local food businesses are growing in Ethiopia in the context of varying food-system governance structures. These businesses are dominated by women, whose innovations have largely sustained mass production of various seed technologies. Moreover, women have been able to maintain local crop variety diversity despite a decrease in size of land holdings (<0.5ha in Tigray). Government policy has given little attention to local food value chains, which have therefore received limited external support. The imminent threats posed by climate change plus market pressures may have forced farmers to abandon some of their biodiversity and potentially community adaptive capacity. However, diversity will be the key to climate change adaptation.
Legumes, fenugreek and barley are the most common and highly nutritious and healthy crops used by northern Ethiopian women in food innovation. Most local food businesses are small scale and family based. In Tigray, a project supported �ve women’s food producer cooperatives to upgrade the local food value chain.ii Cereal-based local food businesses are appealing to consumer groups that are conscious of health and nutrition issues. Research supported by this project (2) veri�ed good injera (Ethiopian pancake) obtained from mixed cereals (teff, barley and sorghum). This implies consumers could bene�t from the use of injera made from these different cereal �our blends due to their enhanced nutritional content besides the economic advantage afforded by lower prices compared to teff.
Greater diversity through innovation in rice use
Tselemti Research Centre introduced rice to rural communities in Tselemti Woreda in Western Tigray. The rice performed well in terms of production. The newly introduced rice varieties produced up to 7 tonnes/ha compared to 0.7 tonnes/ha of sorghum landraces.
However, farmers did not know how to dehusk and use the rice, and initially complained, “Why did you bring this crop to us? We cannot satisfy our hunger with this big heap.” In the midst of frustration over the future of rice, local women came to the rescue. They devised new ways of using rice to make injera and local beer. These women had not received any prior training in the processing and use of rice.
Their innovation led to a wider acceptance of rice and new seed technologies. Rice has now become the main food security and cash crop for the lowland communities of Tselemti Woreda. Rice is produced regularly in the main season adding to the nutritional diversity of local communities. The introduction of rice also enabled crop rotation with chickpea in waterlogged areas. This contributed to maintaining and increasing agricultural biodiversity. The rice-based food and beer innovations helped create new consumption patterns and market demand, and encouraged wider cultivation and multiplication of rice seed. This example shows no crop can survive without being consumed and it will only be consumed if women know how to prepare it. In this case, despite its high productivity, at �rst the community did not want it. Thanks to the role of women in popularizing the new crop, they increased their household genetic diversity.

167
Thought Pieces
Conclusion
The cases above generally re�ect on women’s roles in creating seed access and downstream businesses thereby promoting seed technologies for increased household income and food security while maintaining household crop diversity in a changing climate.
Women’s roles in managing risk and supporting resilient livelihoods through their knowledge and innovations in seed systems have been well documented in Ethiopia. Seed selection, crop management, postharvest processing, seed management, breeding and innovations in food production are all steps along the chain from farm to fork in which the management of genetic diversity has a key role to play in reducing risks to food security and livelihoods and increasing resilience to disturbances. Risks to livelihoods are crop failure because of climate changes, decreased food security because of postharvest losses, and less than optimal yields due to poor crop management and inappropriate selection of planting materials. In Ethiopia, women’s knowledge and innovations allow them to maintain or increase diversity in the system in order to build in resilience to different disturbances.
Acknowledgements
I would like to acknowledge the support of NUFU (Norwegian seed safety and food science projects), IDRC project support, Integrated Seed System Development (ISSD) project and the collaboration of Kansas State University/ USAID-funded Feed the Future Innovation for the Reduction of Post-Harvest Loss—Ethiopia.
Notes
i Participatory plant breeding is “the process by which farmers are routinely involved in a plant breeding programme with opportunities to make decisions throughout.” (3)
ii Project: Upgrading Women's Food Product Value Chains in Northern Ethiopia, supported by International Development Research Centre (IDRC): Grant 106956
References
1. Petros S, Abay F, Desta G, O’Brien C (2018) Women farmers’ (dis)empowerment compared to men farmers in Ethiopia. World Medical & Health Policy 10(3):220–245.
2. Abraha A, Abay F (2017) Effect of different cereal blends on the quality of Injera a staple food in the highlands of Ethiopia. Momona Ethiopian Journal of Science 9(2):232.
3. Halewood M, Deupmann P, Sthapit BR, Vernooy R, Ceccarelli S (2007) Participatory plant breeding to promote Farmers’ Rights (Rome, Italy) Available at: https://www.bioversityinternational.org/�leadmin/_migrated/uploads/tx_news/Participatory_plant_breeding_to_promote_Farmers__Rights_1254.pdf [Accessed October 26, 2016].
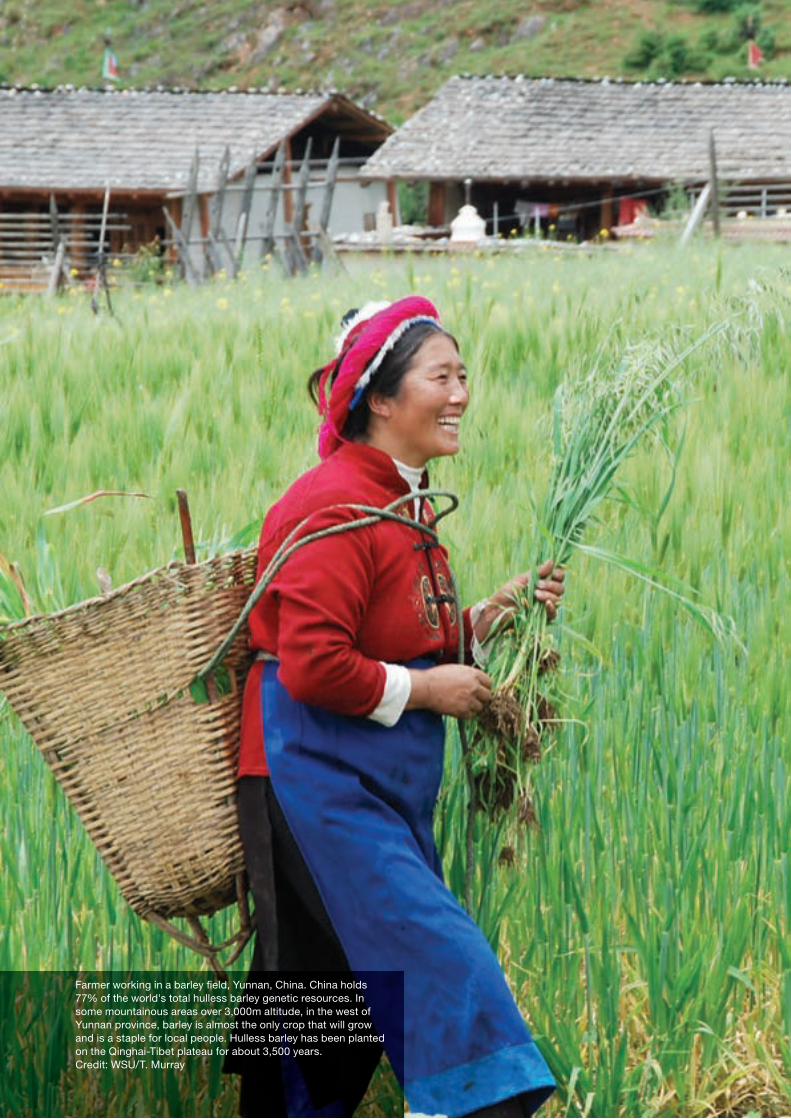
Farmer working in a barley �eld, Yunnan, China. China holds 77% of the world's total hulless barley genetic resources. In some mountainous areas over 3,000m altitude, in the west of Yunnan province, barley is almost the only crop that will grow and is a staple for local people. Hulless barley has been planted on the Qinghai-Tibet plateau for about 3,500 years. Credit: WSU/T. Murray


www.bioversityinternational.org/abd-index/
www.agrobiodiversityindex.org
ISBN: 978-92-9255-125-4
The Alliance of Bioversity International and the International Center for Tropical Agriculture (CIAT) delivers research-based solutions that harness agricultural biodiversity and sustainably transform food systems to improve people’s lives.
Bioversity International and CIAT are CGIAR Research Centres.